3.2. Qualitative and Quantitative Simulations of Cytosolic Calcium Signals Induced by Penta-N-acetylchitopentaose Oligosaccharides
It was intended to establish a mathematical model in order to simulate the Ca
signature measured in elicitor-treated cell cultures. Special emphasis was put on the simulation of the asymmetric shape of the “on”-
versus “off”-kinetics. Additionally, the simulation should show the adequate intensity of the Ca
response, influenced by the corresponding stimulus activation. To this end, our modified version of the Li and Rinzel model underwent various simulations with different sets of parameters to find matching values that could reproduce a consistent simulation result for a Ch5-induced Ca
response in a plant system. In comparison to the parameter-set of the original Li and Rinzel model, the following parameters were observed to be most sensitive: the IP
permeability (p
), the dissociation constant, d
, and the time scale parameter,
a, both involved in the Ca
inactivation of the channels, the dissociation constant, d
(Ca
activation of the channels), and the total Ca
concentration, C
. C
was calculated by C
= [C
− C
]/c
. The constant, c
, is defined by the ER/cytosol volume ratio in the Li and Rinzel model. In order to achieve the appropriate store size in plants, we used the vacuole/cytosol volume ratio of 0.1 [
14]. All utilized parameters are listed in
Table 1.
Figure 2.
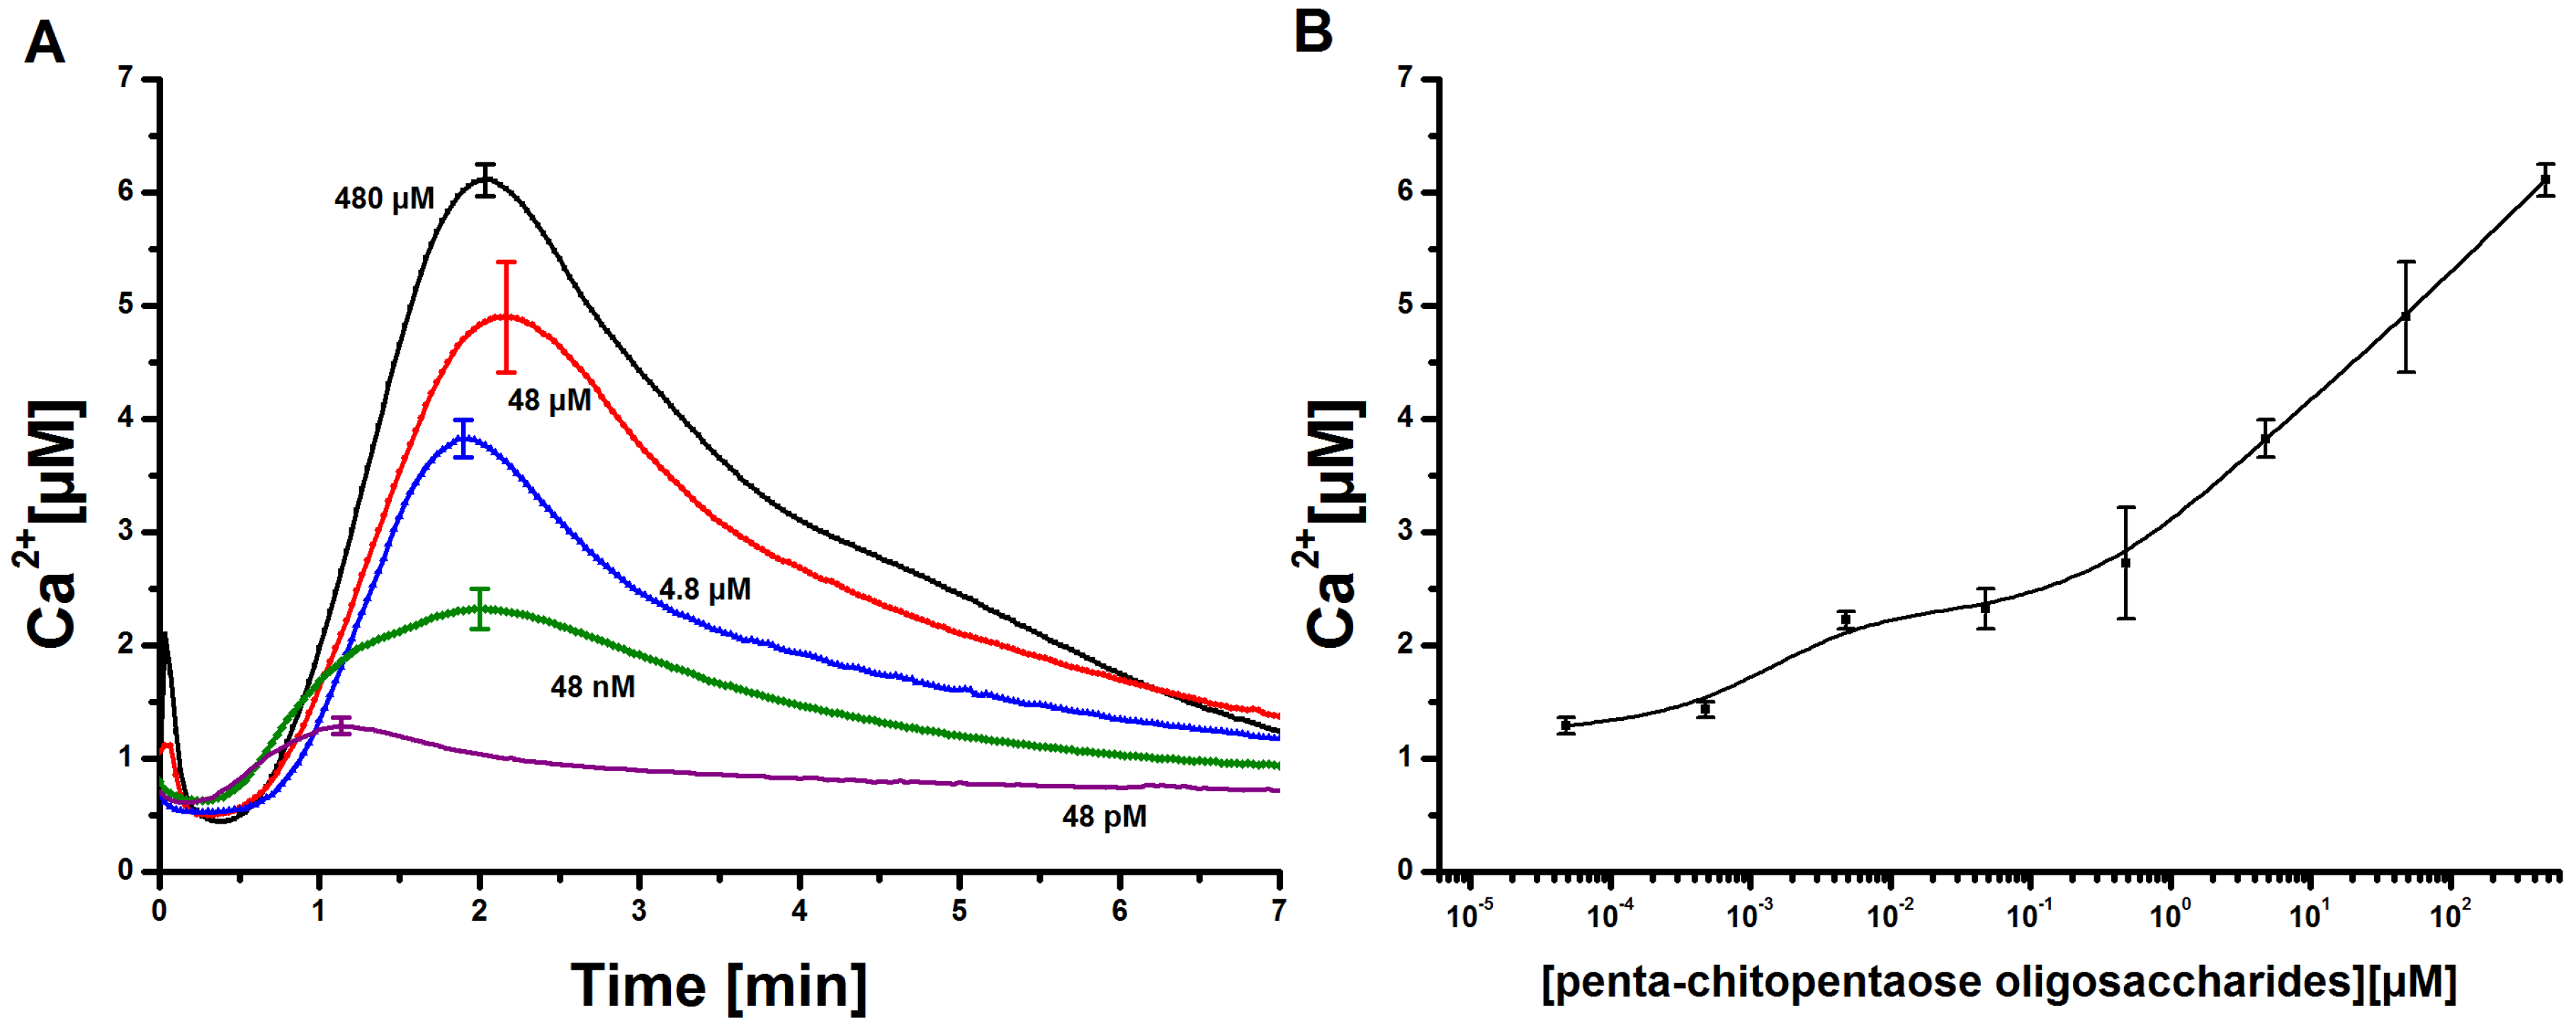
Measurement and quantification of cytosolic Ca concentrations in tobacco cell cultures upon elicitation with N-acetylchitopentaose oligosaccharides. (A) Dose-dependent Ca kinetics for the acetylchitopentaose oligosaccharides (Ch5) elicitor measured in tobacco plant cell cultures. The elicitor concentration was chosen in the range of 48 pM to 480 µM. Each cytosolic Ca curve has a delay time of 50 s and a faster increase than decrease. Three replicates of every single concentration were taken. The cytosolic Ca curves shown constitute the calculated mean of the three replicates. Error bars indicate standard deviation. (B) Dose-response diagram of the measured Ch5-induced Ca transients. The maxima of cytosolic Ca responses are recorded for each concentration. The resulting curve shows a clear rise; higher elicitor concentrations lead to stronger Ca responses. Error bars indicate standard deviation.
Figure 2.
Measurement and quantification of cytosolic Ca concentrations in tobacco cell cultures upon elicitation with N-acetylchitopentaose oligosaccharides. (A) Dose-dependent Ca kinetics for the acetylchitopentaose oligosaccharides (Ch5) elicitor measured in tobacco plant cell cultures. The elicitor concentration was chosen in the range of 48 pM to 480 µM. Each cytosolic Ca curve has a delay time of 50 s and a faster increase than decrease. Three replicates of every single concentration were taken. The cytosolic Ca curves shown constitute the calculated mean of the three replicates. Error bars indicate standard deviation. (B) Dose-response diagram of the measured Ch5-induced Ca transients. The maxima of cytosolic Ca responses are recorded for each concentration. The resulting curve shows a clear rise; higher elicitor concentrations lead to stronger Ca responses. Error bars indicate standard deviation.
The parameters, p
and C
, turned out to be essential for achieving a cytosolic Ca
concentration of 6 µM. Both parameters had to be increased to get appropriate Ca
responses in the plant system compared to the observed Ca
oscillations in pituitary gonadotrophs [
16]. The modified parameters,
a and d
, were important to trigger a single Ca
response, due to their influence on the channel kinetics of the IP
receptor channels in the membrane of the ER in analogy to the gating processes in the membrane of an internal store in a plant cell. Their decrease slows down the two gating processes involved in the Ca
interaction. The parameter, d
, played an important role regarding the refractory behavior of the measured Ca
transients and will be discussed later on. In summary, simulations using the parameters given in
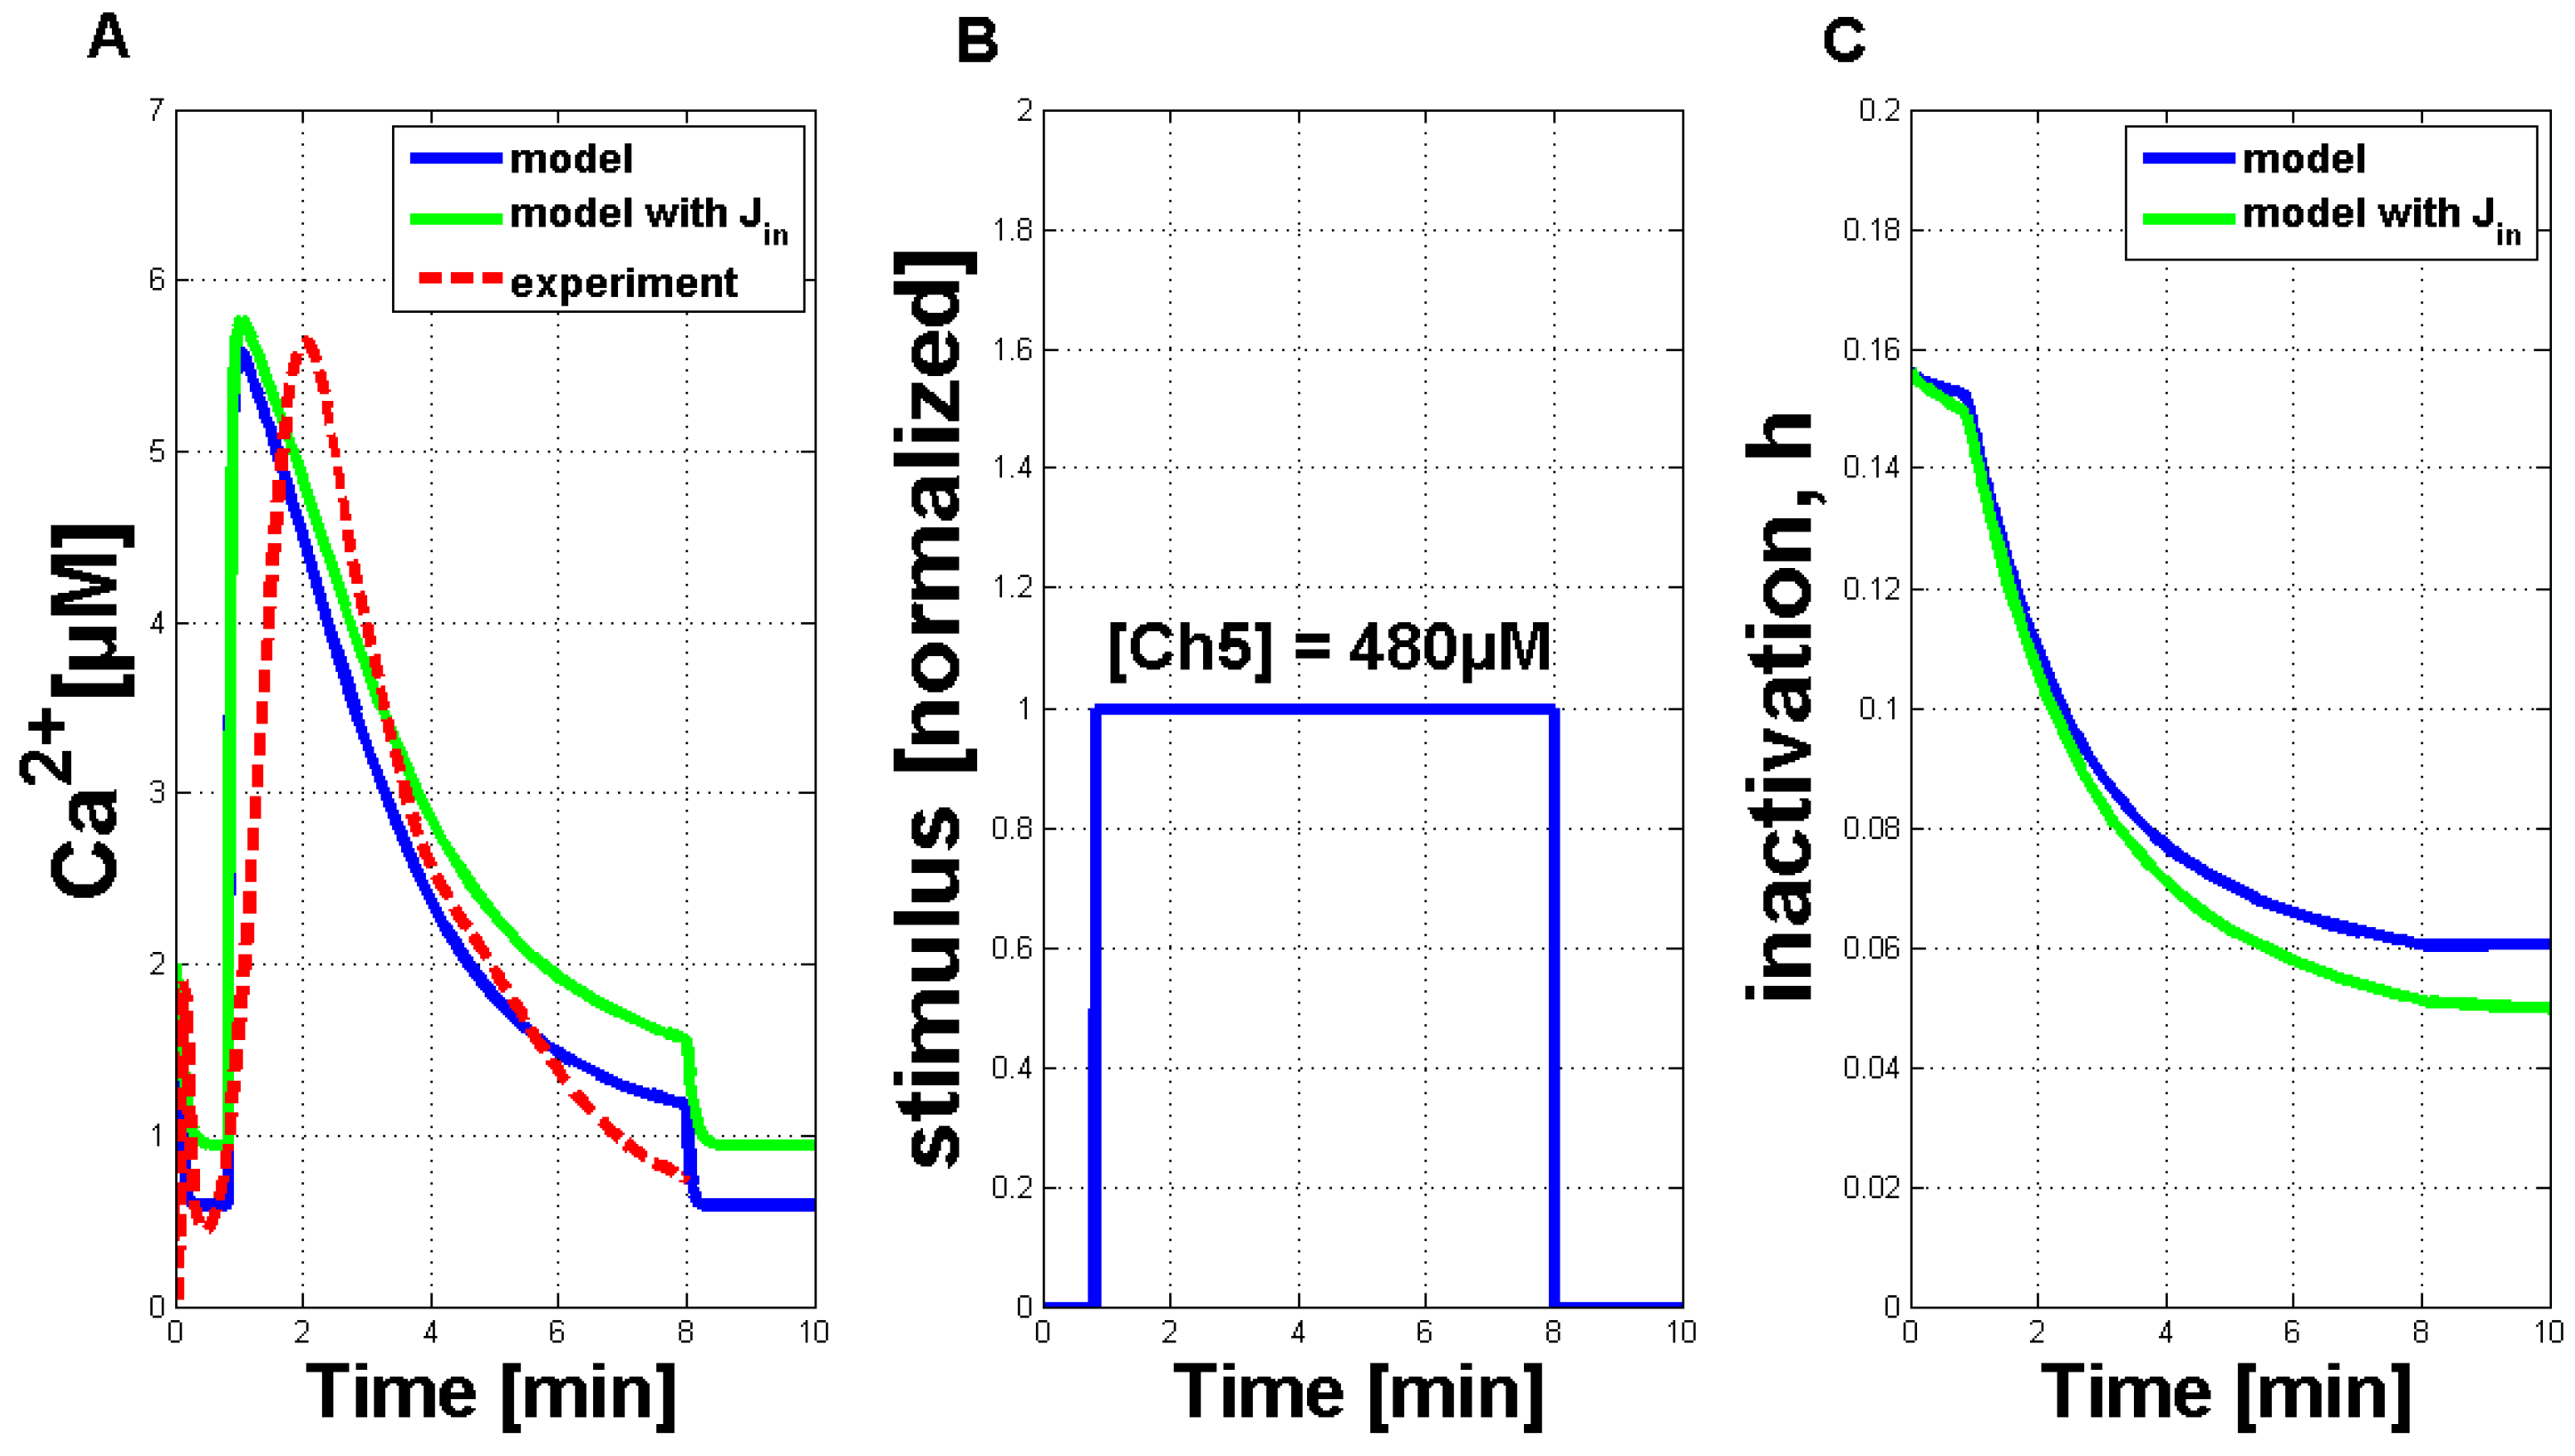
Table 1 resulted in a qualitative and quantitative output very comparable to the measurements in plant cell cultures. An exemplary simulation result for a Ch5 concentration of 480 µM (solid blue curve) is shown in
Figure 3A. It is compared favorably to a single measured Ca
signature (dashed red curve). Both curves showed the typical asymmetric structure of the Ca
response, the simulation curve’s increase was a little bit stronger. Additionally, a second simulation result (solid green line), including the external influx of Ca
ions (defined as J
) is shown in this figure. In comparison to the simulation result without the J
flux, the general behavior is not strongly influenced. In plant cells, the elicitor detection triggers a primary influx of Ca
ions from outside the cell. This can also be included in the model by introducing a dependency of the J
flux. If J
is then chosen as zero, the other Ca
fluxes will not be triggered. For further analysis, the dependency of J
was not considered, as the Ca
simulations with and without the J
flux do not considerably differ.
Figure 3B shows the IP
stimulus for the simulated activation of the Ca
release (see
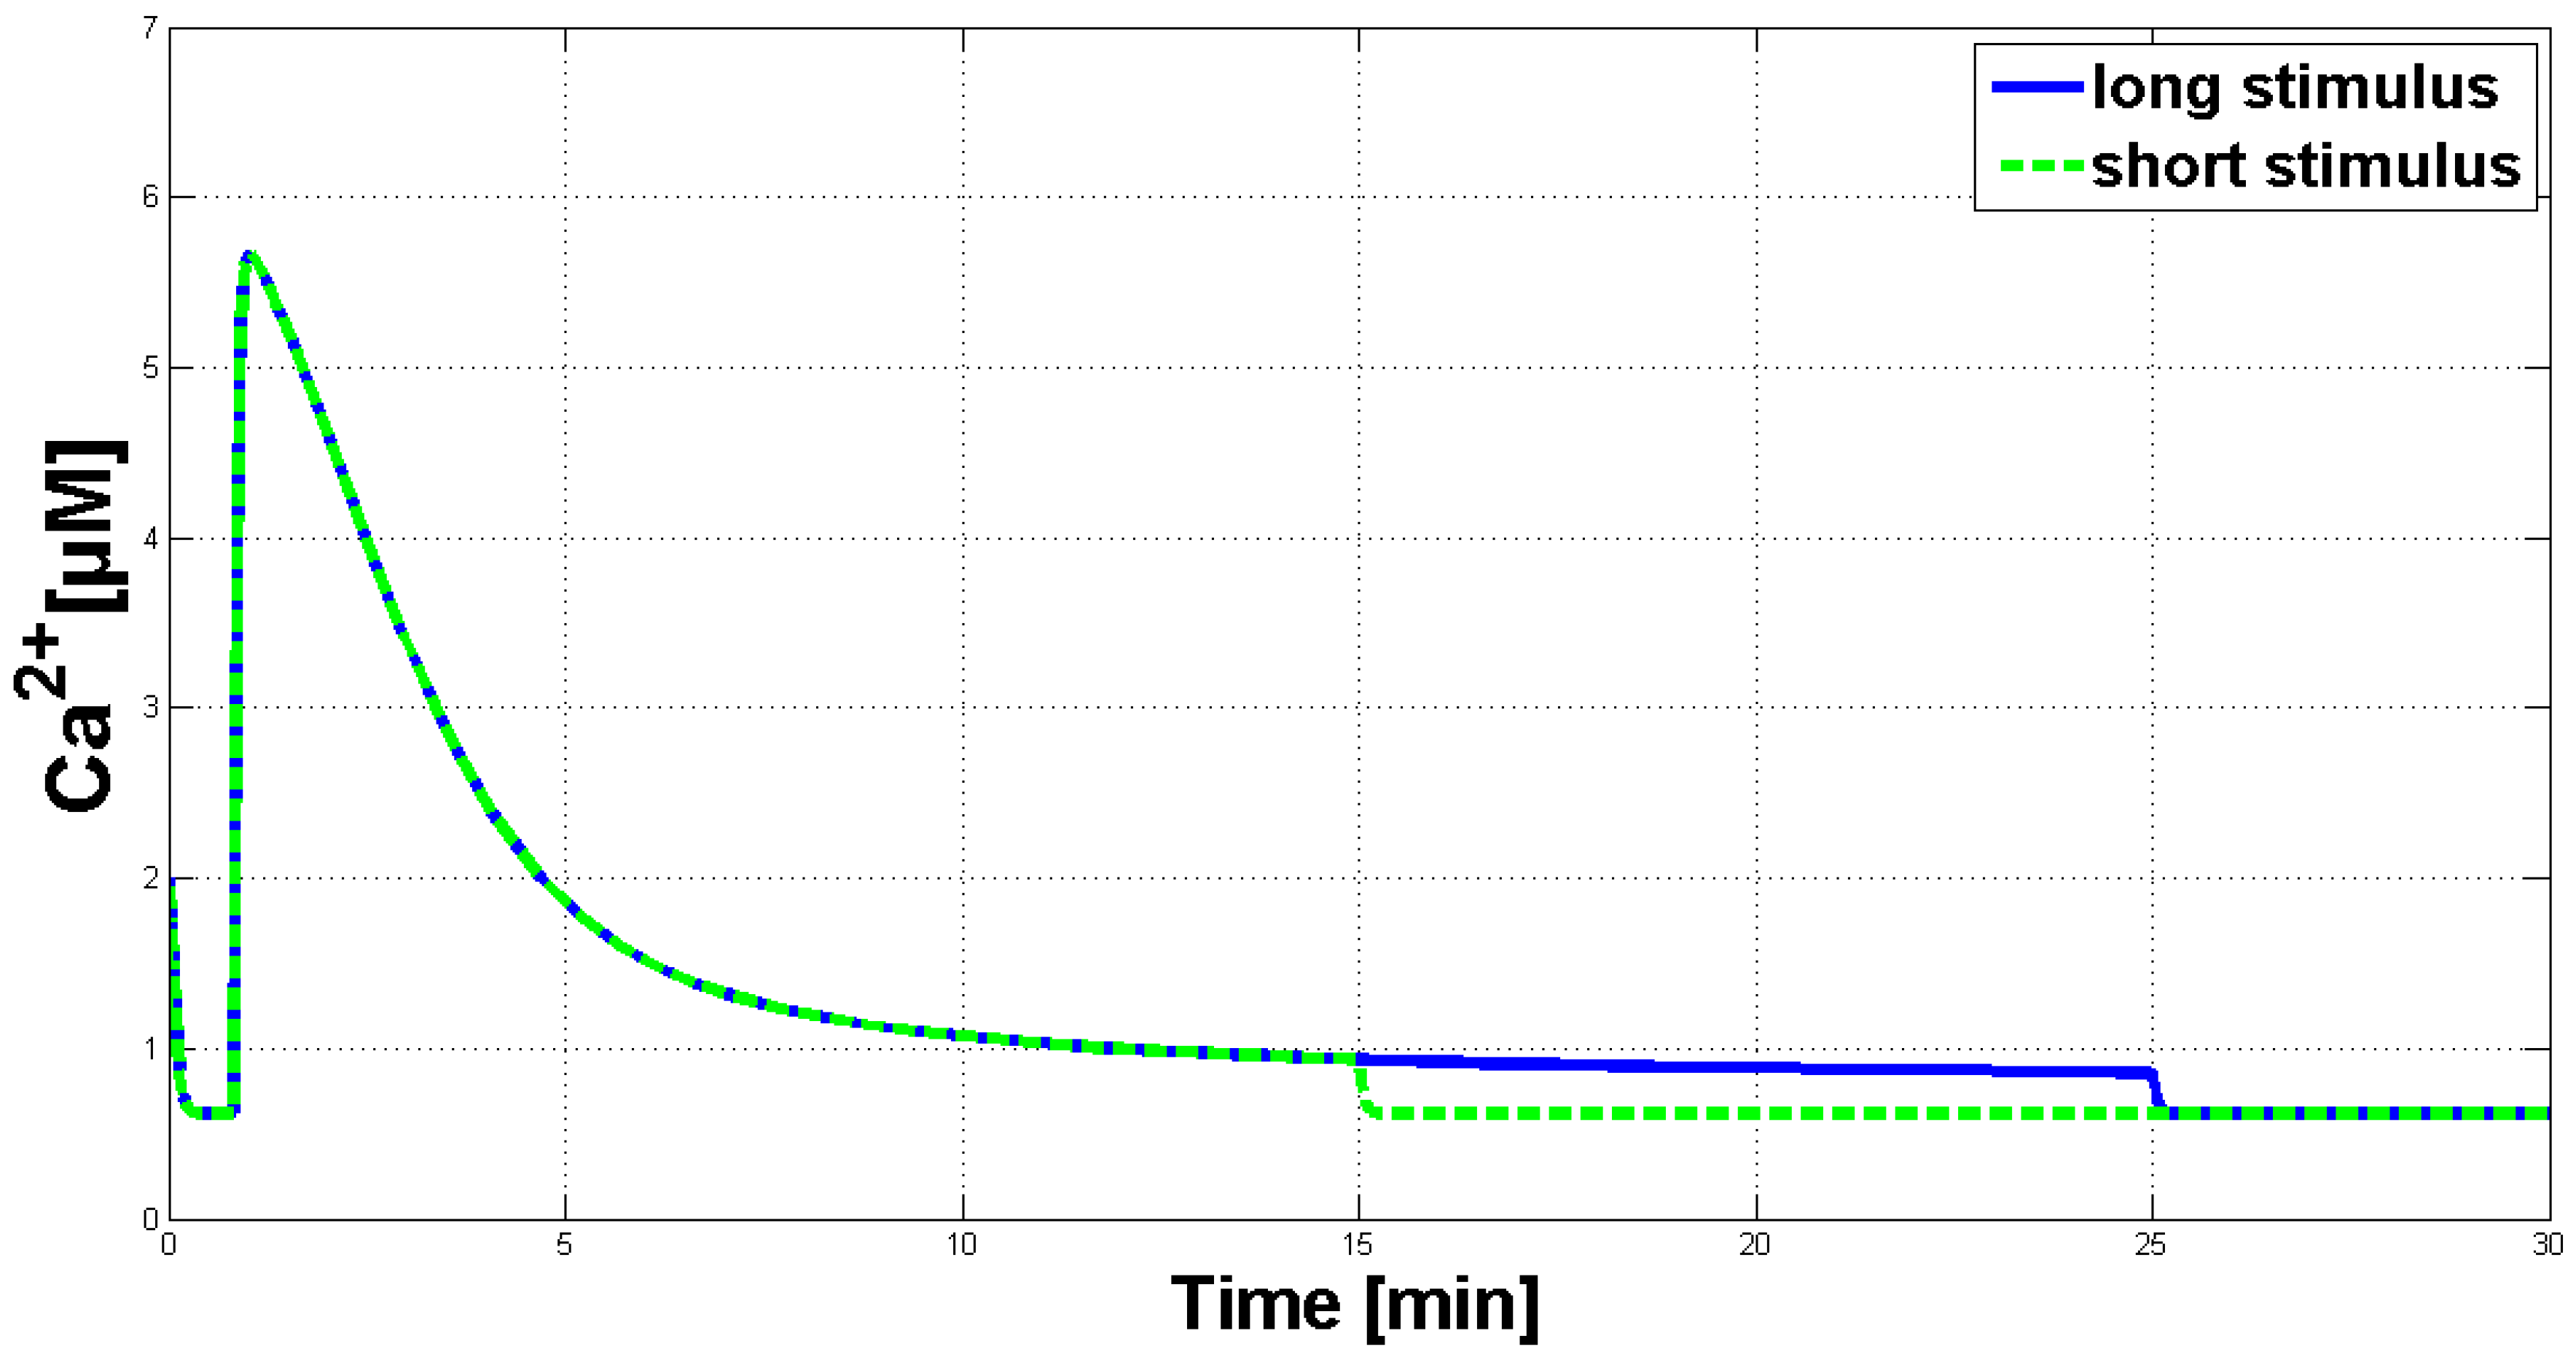
Figure 3A) with a time period of seven minutes. The length of the simulated Ca
response can be varied according to stimulus length (see
Figure A2 in the
Appendix). In addition,
Figure 3C shows the inactivation process of the channels in the membrane of the internal store in the plant cell (in analogy to the IP
- and Ca
-activated channels in the membrane of the ER).
Table 1.
List of parameters for the Li and Rinzel model (left), the adapted parameters for the Ca simulations in a plant system induced by Ch5 (middle) and the used values for the simulations in arbitrary units (right).
Table 1.
List of parameters for the Li and Rinzel model (left), the adapted parameters for the Ca simulations in a plant system induced by Ch5 (middle) and the used values for the simulations in arbitrary units (right).
| L-RParameter (Unit) | Adapted parameter | Value |
|---|
| → p (s) | p | 140 |
| → p (s) | p | 0.05 |
| → (µMs) | | 0.5 |
| (µM) | | 0.4 |
| (µM) | | 0.1 |
| (µM) | | 0.02 |
| (µM) | | 0.04 |
| a (s) | a | 0.001 |
| (µM) | | stimulus |
| (µM) | | 7.5 |
| | 0.1 |
| (µMs) | | 0.1 |
| Initial (µM) | | 2 |
| Initial h | | 0.1562 |
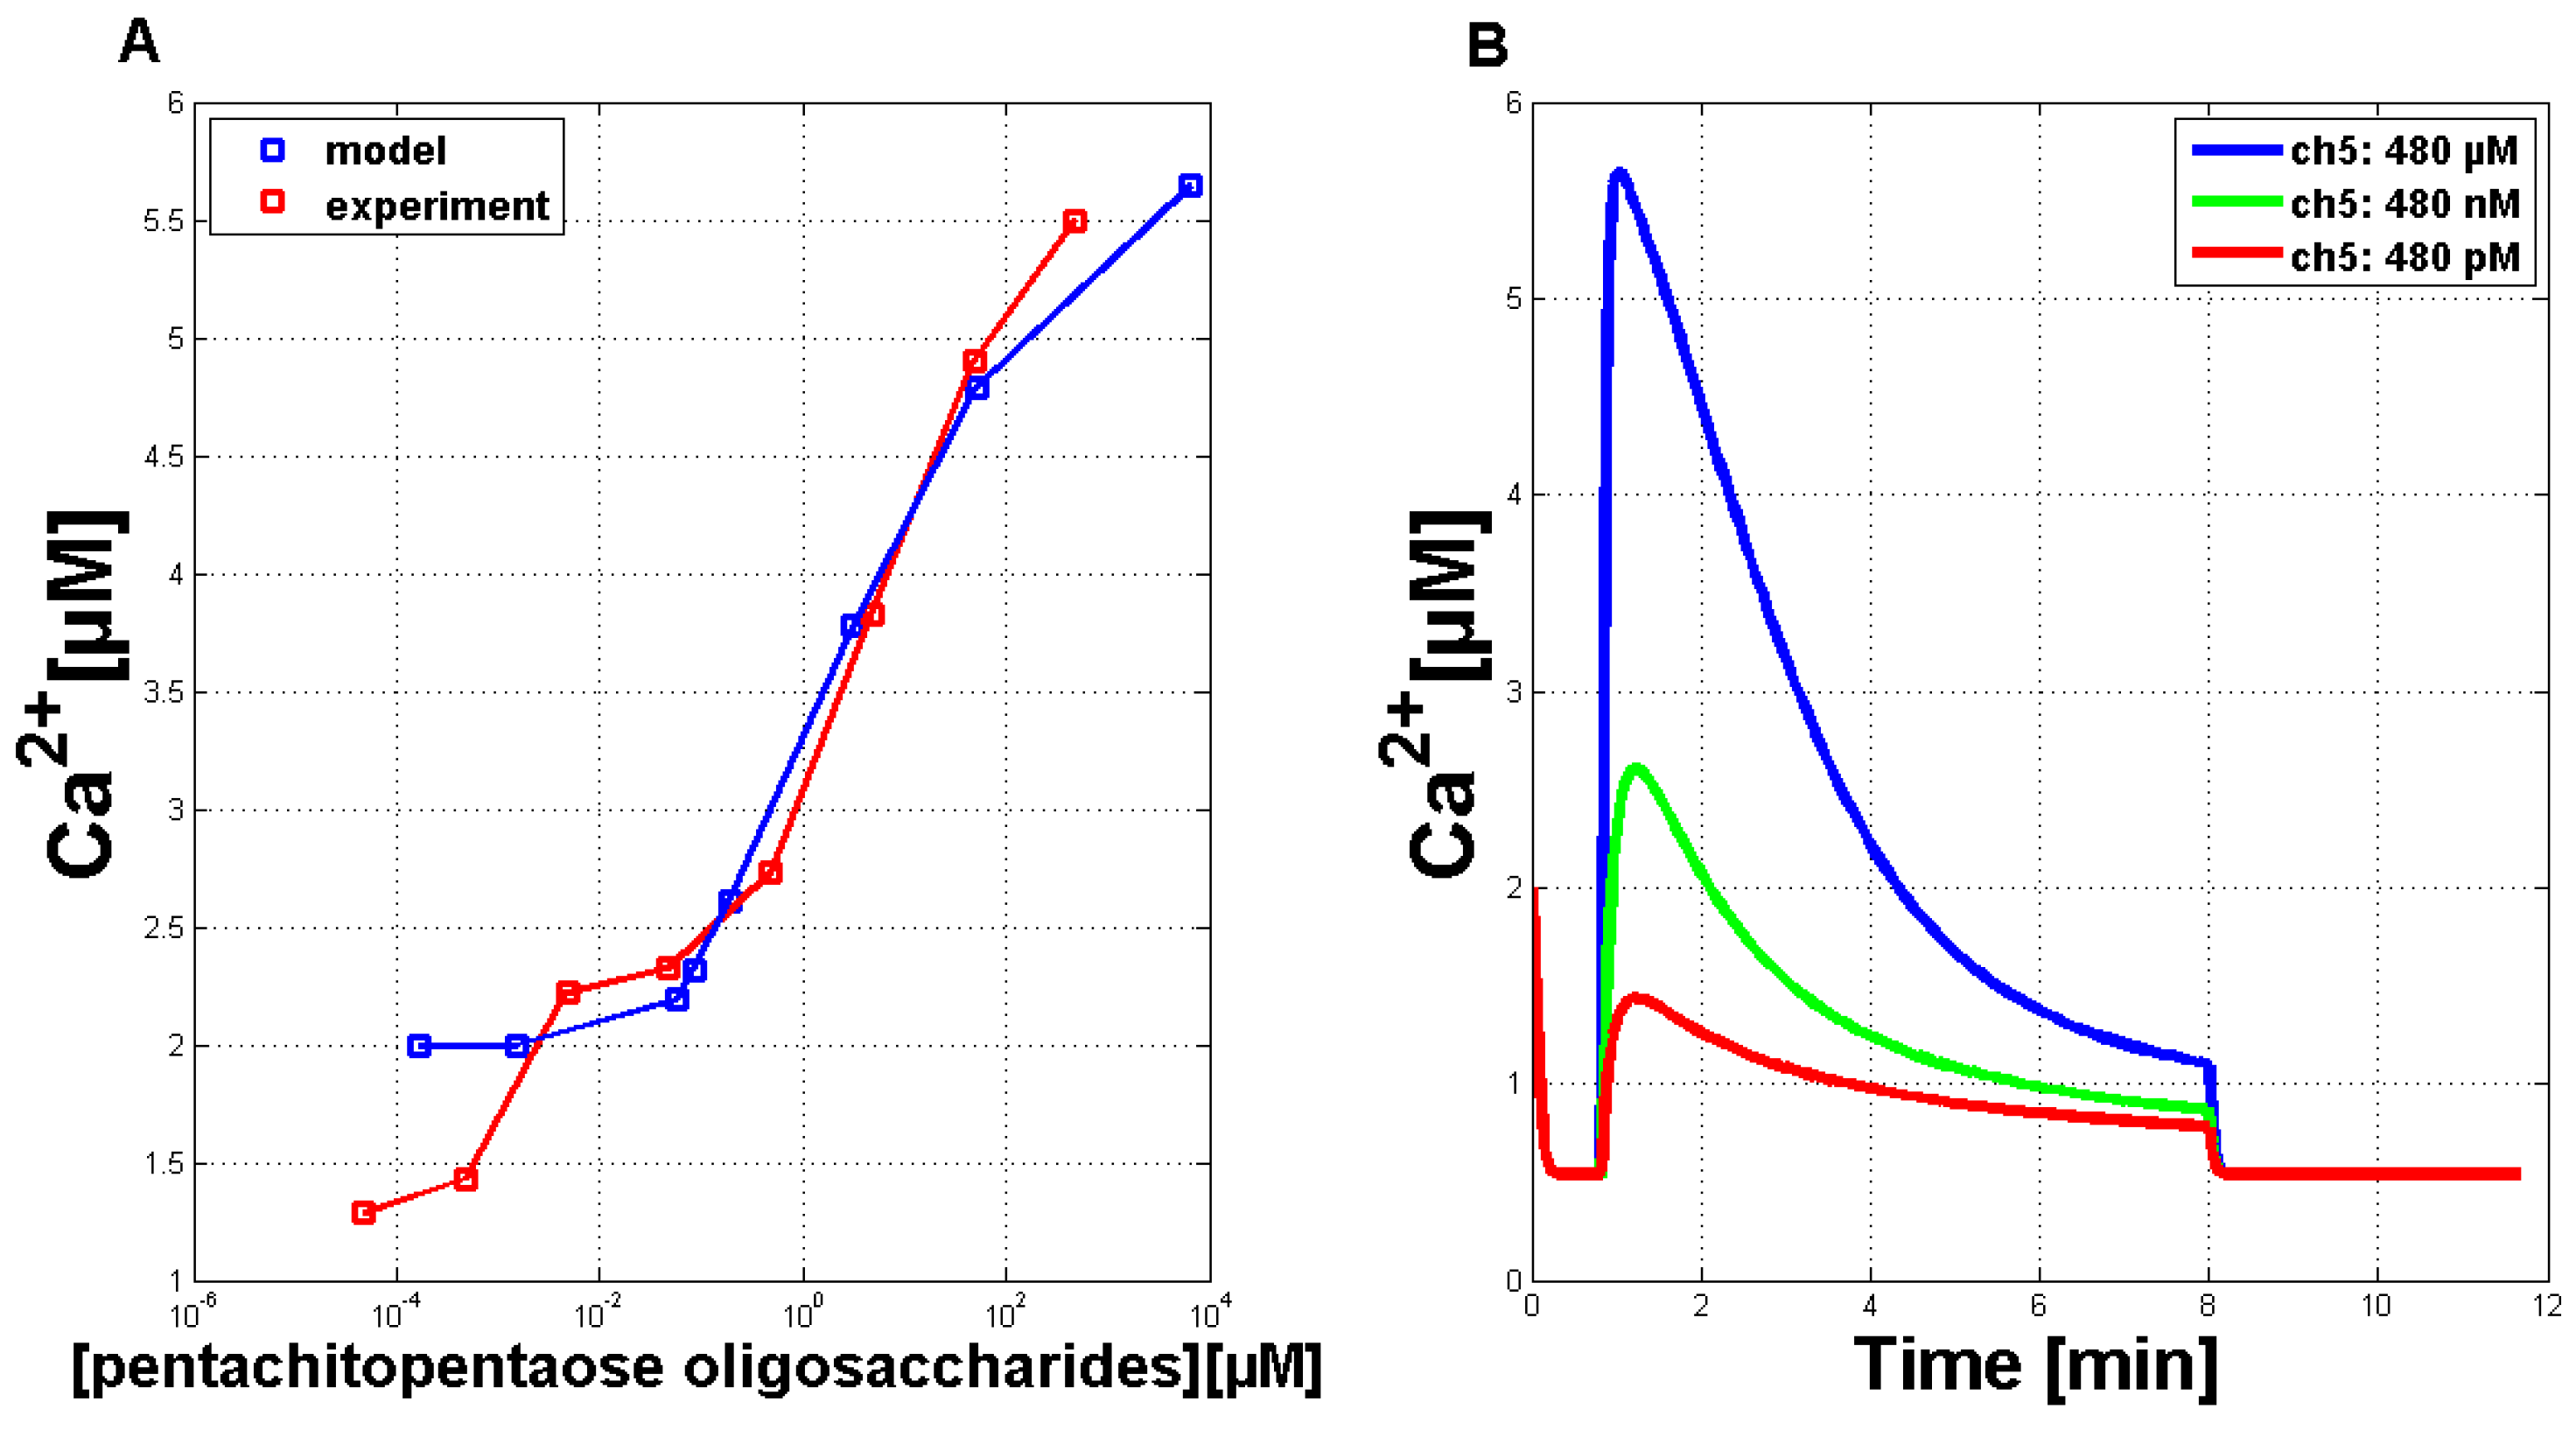
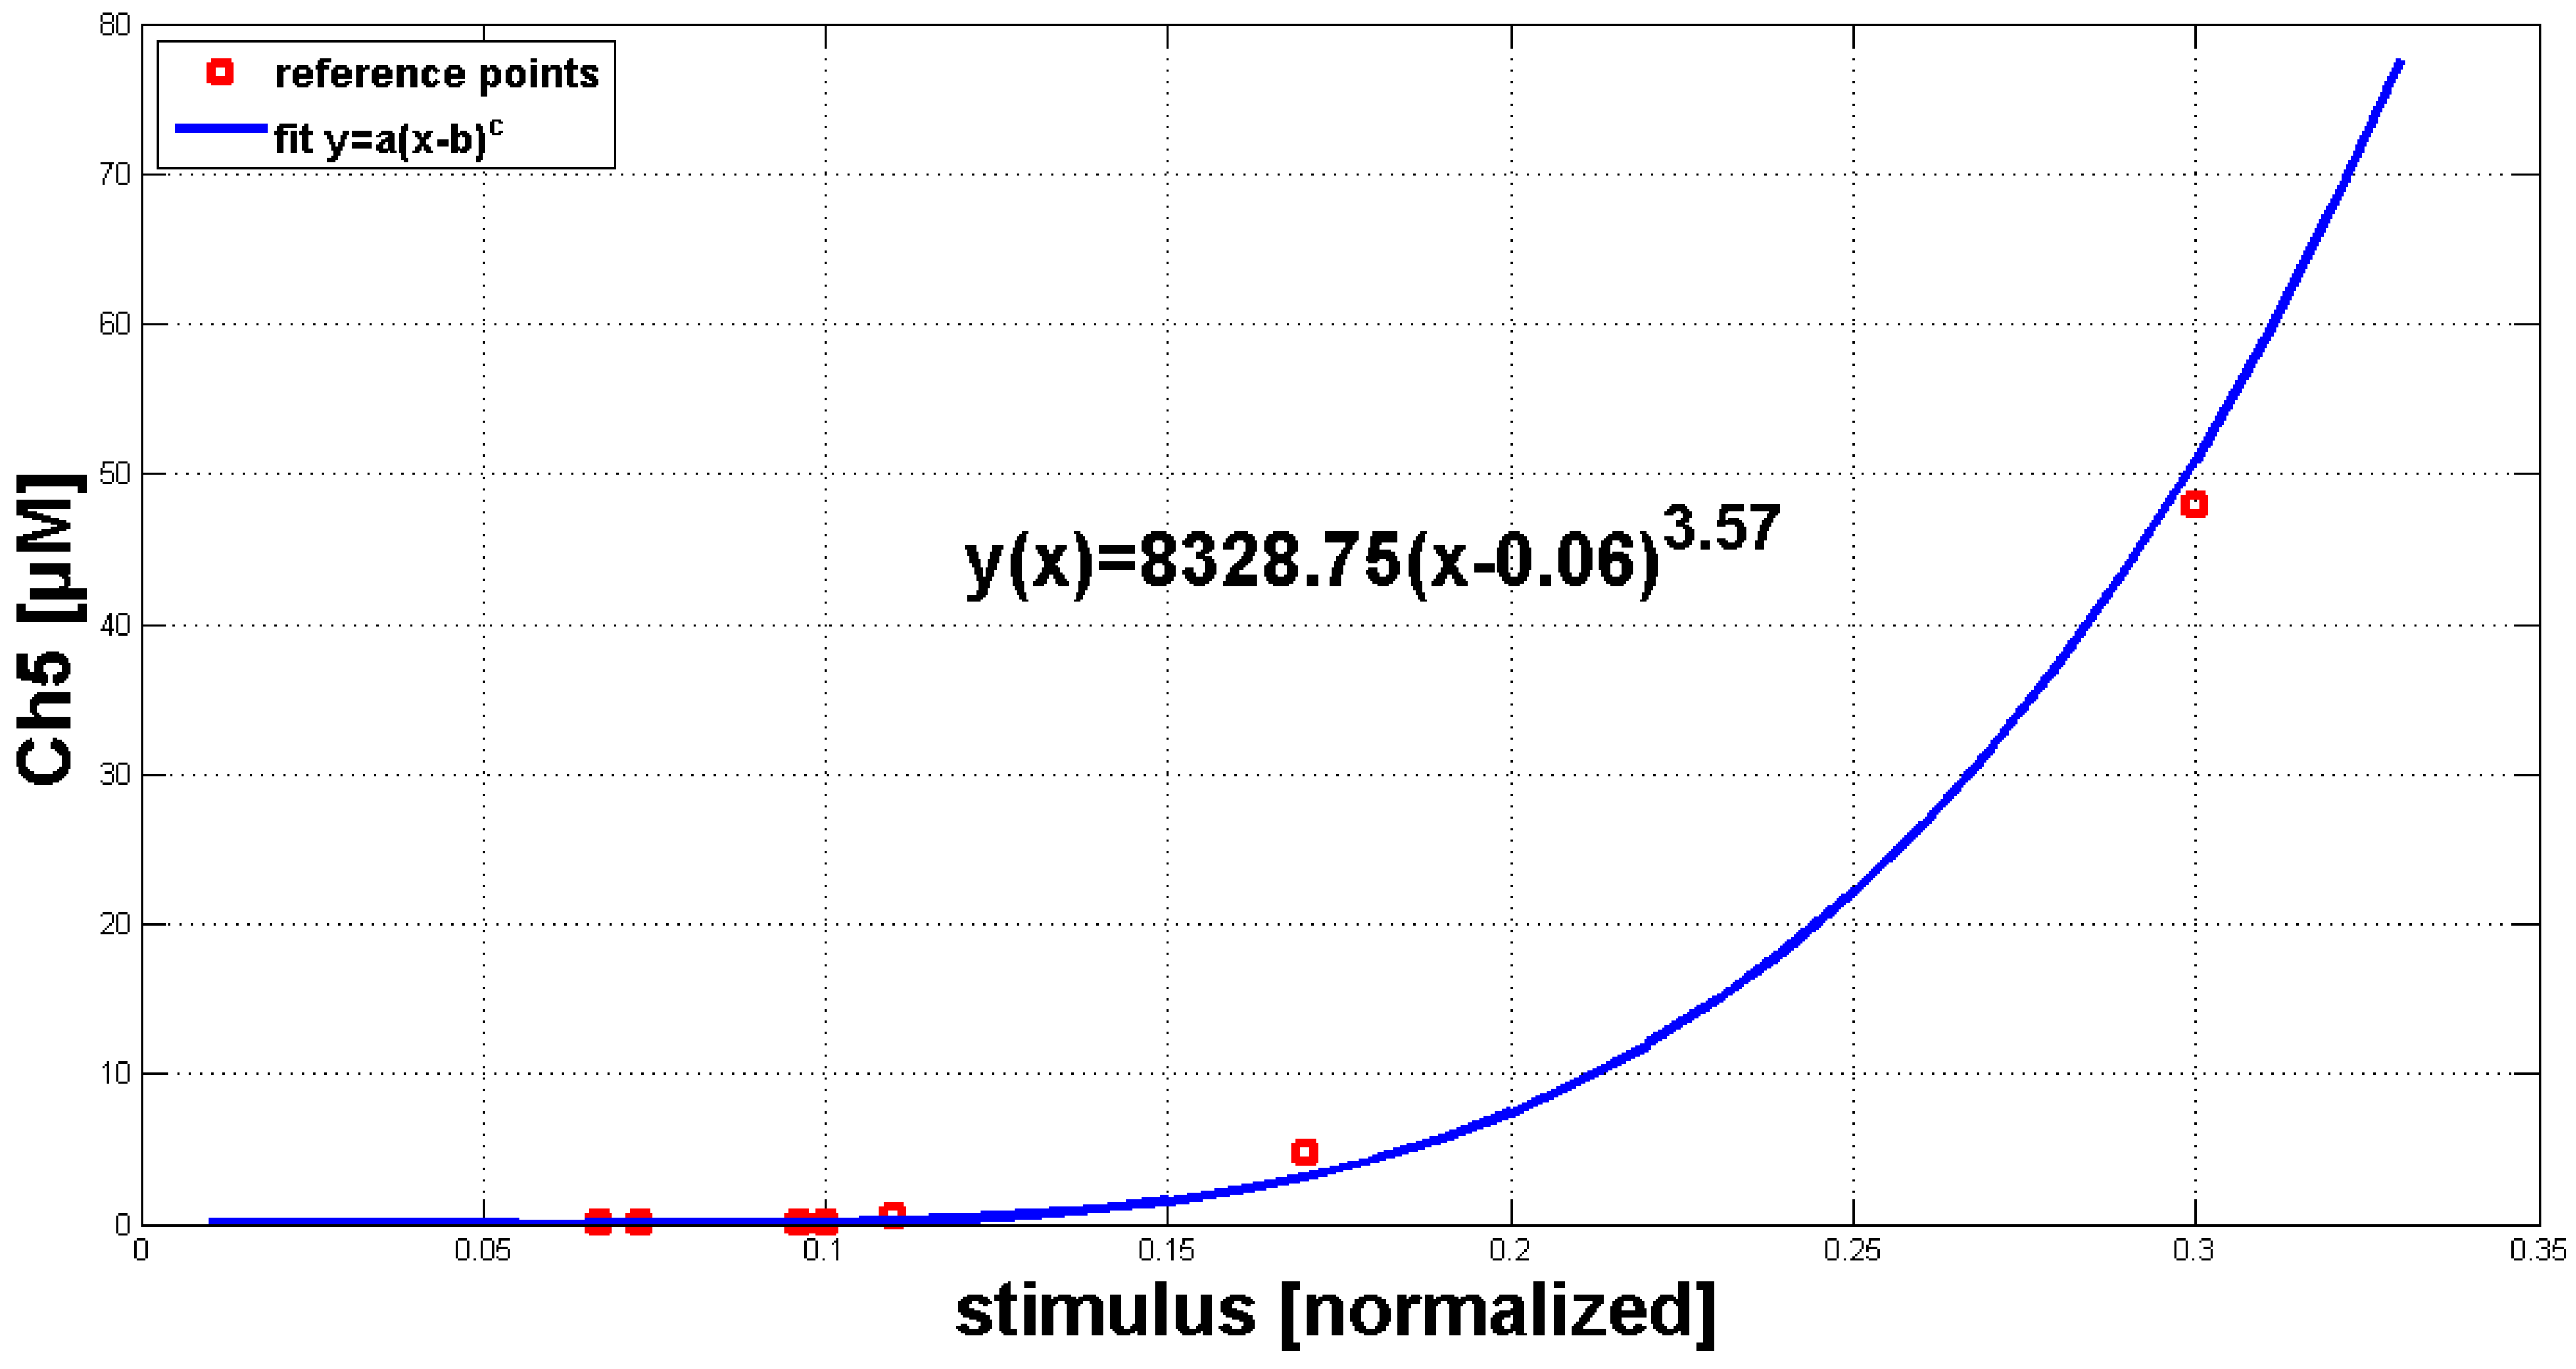
In the next step, the model’s dose-response behavior was tested to quantitatively adjust the simulation results. The stimulus used was a normalized function with values between zero and one. With the help of a transfer function (y(x) = 8328.75(x − 0.06)
), these values can be converted into the Ch5 concentration as used in the experiments. The maximal concentration of every single Ch5 stimulus is set in relation to the peak of the corresponding Ca
answer (
Figure 4A, blue line). A theoretical curve similar to the experimental dose-response behavior (
Figure 4A, red line) could be achieved.
Figure 4B exemplarily shows three Ca
simulations treated with reduced stimulus activation. These reduced answers were among those used for the calculation of the dose-response curve given in
Figure 4A.
Figure 3.
Qualitative comparison of measured Ca
transients and simulations of Ca
transients with the adapted Li and Rinzel model. (
A) Comparison of measured cytosolic Ca
concentration in tobacco plant cells treated with 480 µM of Ch5 (dashed red line) and simulation with modified values for adapted parameters (solid blue curve), as listed in
Table 1 (without the J
flux). A second simulation (solid green line) is shown under the same circumstances, additionally containing a constant influx, J
, through the plasma membrane. (
B) IP
stimulus used for the activation of the system. The value of one of the normalized input corresponds to a Ch5 concentration of 480 µM. (
C) The inactivation process of the channels in the membrane of the internal store in the plant cell (in analogy to the IP
- and Ca
-activated channels in the membrane of the ER in the Li and Rinzel model).
Figure 4.
Quantitative comparison of measured Ca transients and simulations of Ca transients with the adapted Li and Rinzel model. (A) Comparison of experimental (red curve) and simulated (blue curve) dose-response relationship for the Ch5 elicitor. (B) Simulations of single Ca curves in answer to treatment with reduced stimulus activation, in analogy to the reduced Ch5 concentrations as used in the experiments.
3.3. Analysis of Calcium Transients Induced by Penta-N-acetylchitopentaose Oligosaccharides at Two Different Consecutive Time Points
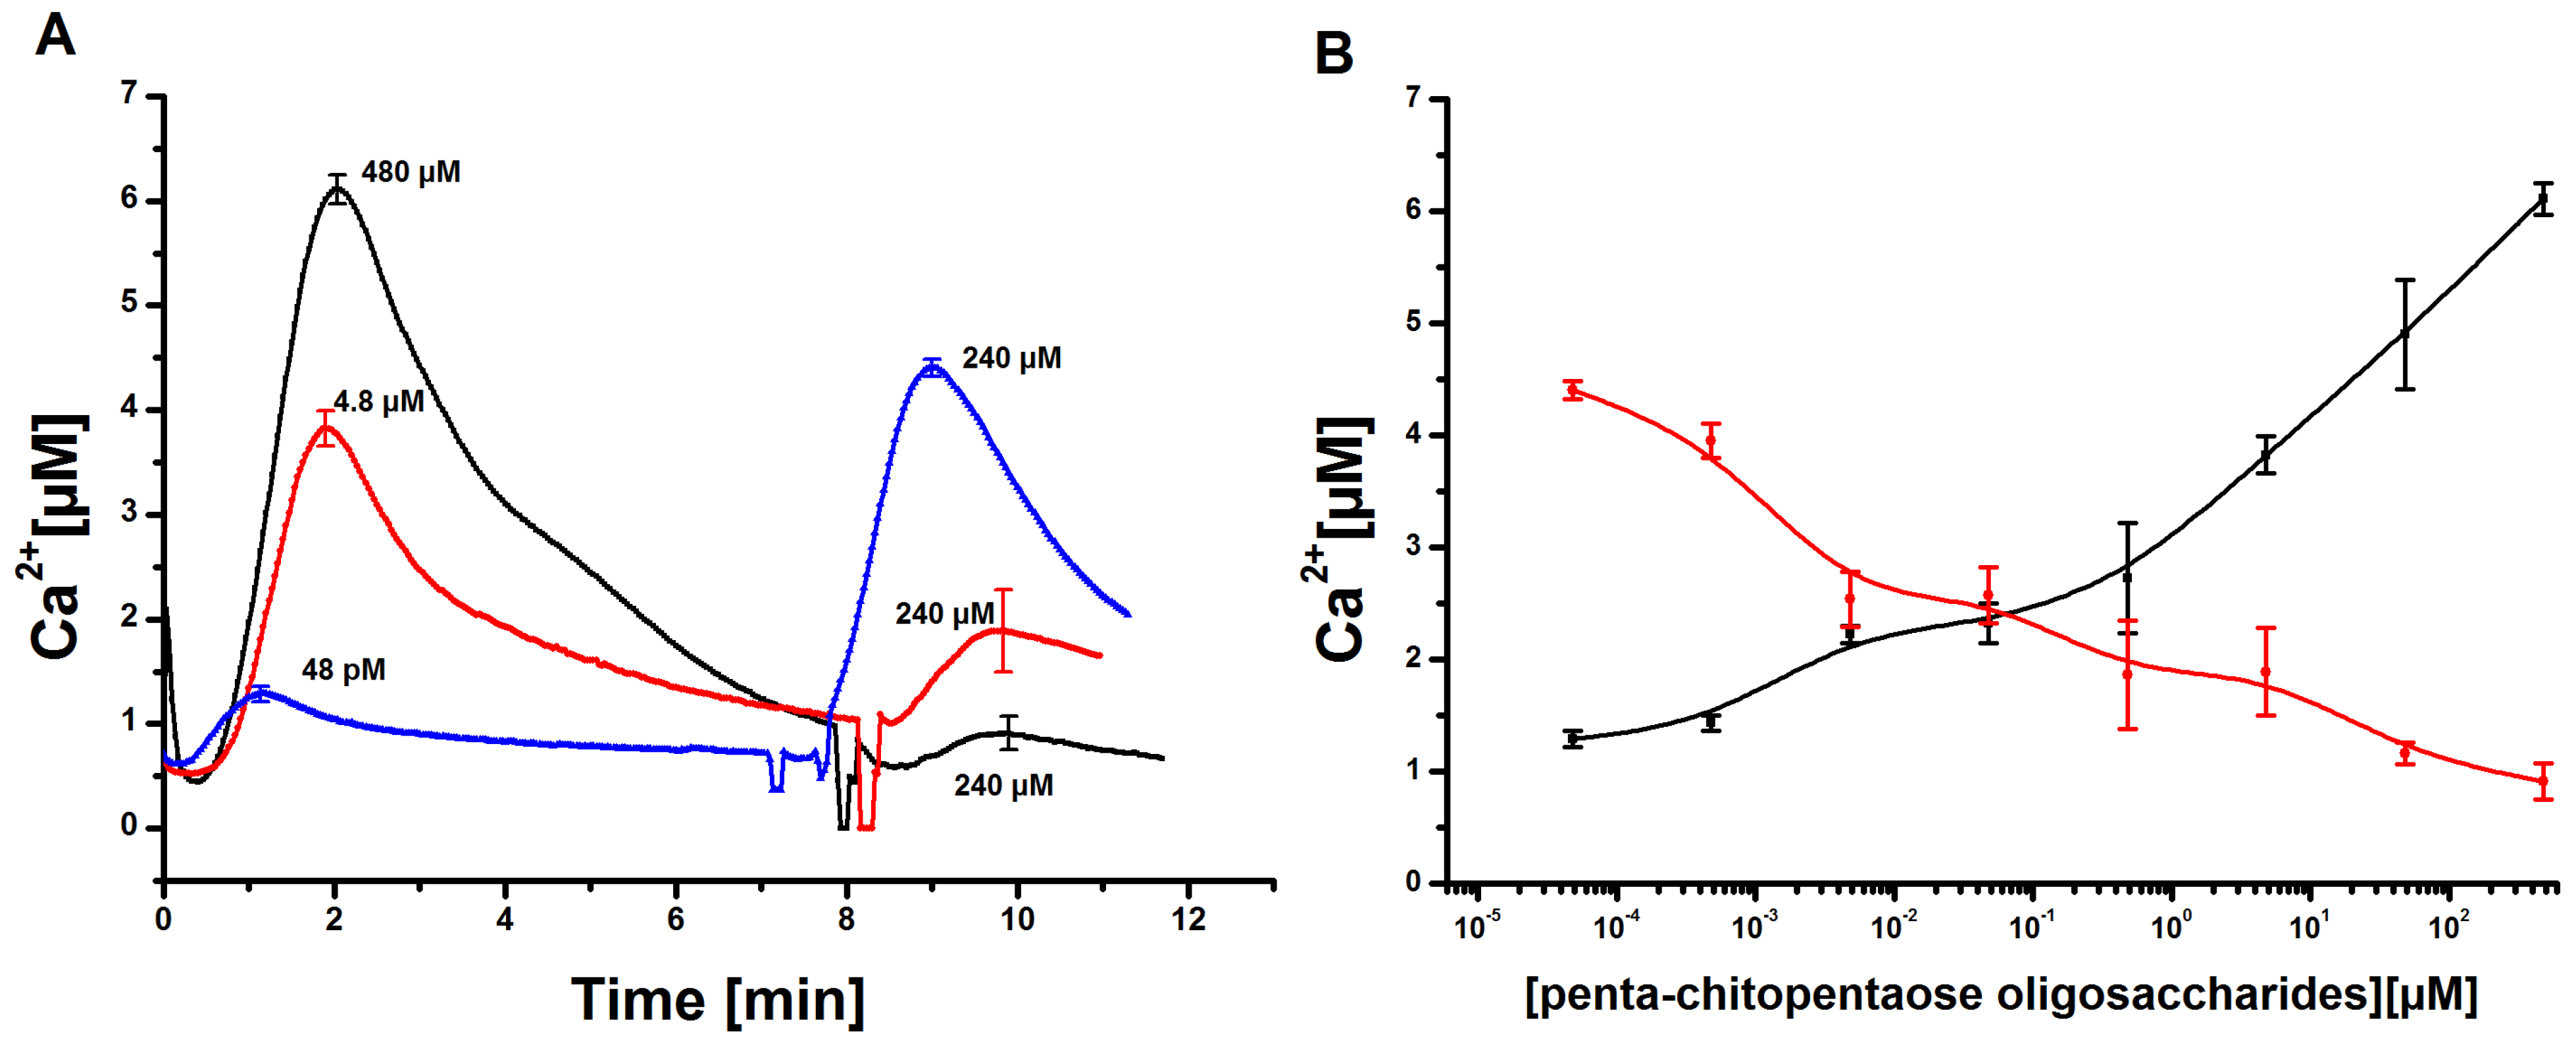
Tobacco cell cultures were stimulated with different concentrations of Ch5 as described before. After about 7 min, the Ca
signal almost reached its initial value recorded before stimulation. At this time point, a second elicitation of the already stimulated cell cultures was applied. The second Ch5 concentration was constantly kept at 240 µM. The Ca
responses recorded
in vivo showed the following behavior. In the case of two consecutive strong stimuli of 480 µM and 240 µM of Ch5, the second Ca
response was nearly completely suppressed, like already described in published experiments [
12,
34]. The tobacco cell cultures showed a refractory behavior,
i.e., the system was unable to respond to the same stimulus until a certain time had elapsed. In the next experiments, the first Ch5 concentration was gradually reduced, while keeping the second Ch5 concentration constant at 240 µM. With the aid of this approach, it was possible to observe that the first Ca
response decreased, while the second Ca
response increased. A diagram of the corresponding dose-response relationship shows this in more detail (
Figure 5B). Interestingly, the curves show a different behavior. The dose-response curve of the second elicitation shows a moderate decrease, while the dose-response curve covering the first elicitation shows the typical distinct rise.
Figure 5.
Measurement of cytosolic Ca concentrations in tobacco cell cultures upon elicitation with chitopentaose oligosaccharides at two time points. (A) Tobacco cell cultures were elicited with 480 µM, 4.8 µM and 48 pM of Ch5. Approximately 7 min later, a second elicitation with a Ch5 stimulus of 240 µM was carried out. The Ca transients induced by the first and second elicitation were recorded. Error bars indicate standard deviation. (B) Dose-response diagram of the first and second response of Ch5 treated Ca signals, shown exemplarily in (A). The Ch5 concentration of the first elicitation was reduced (black curve), while the second Ch5 elicitation was constantly held at 240 µM (red curve). Ca answers are always set in relation to the stimulus level of the first stimulation. Error bars indicate standard deviation.
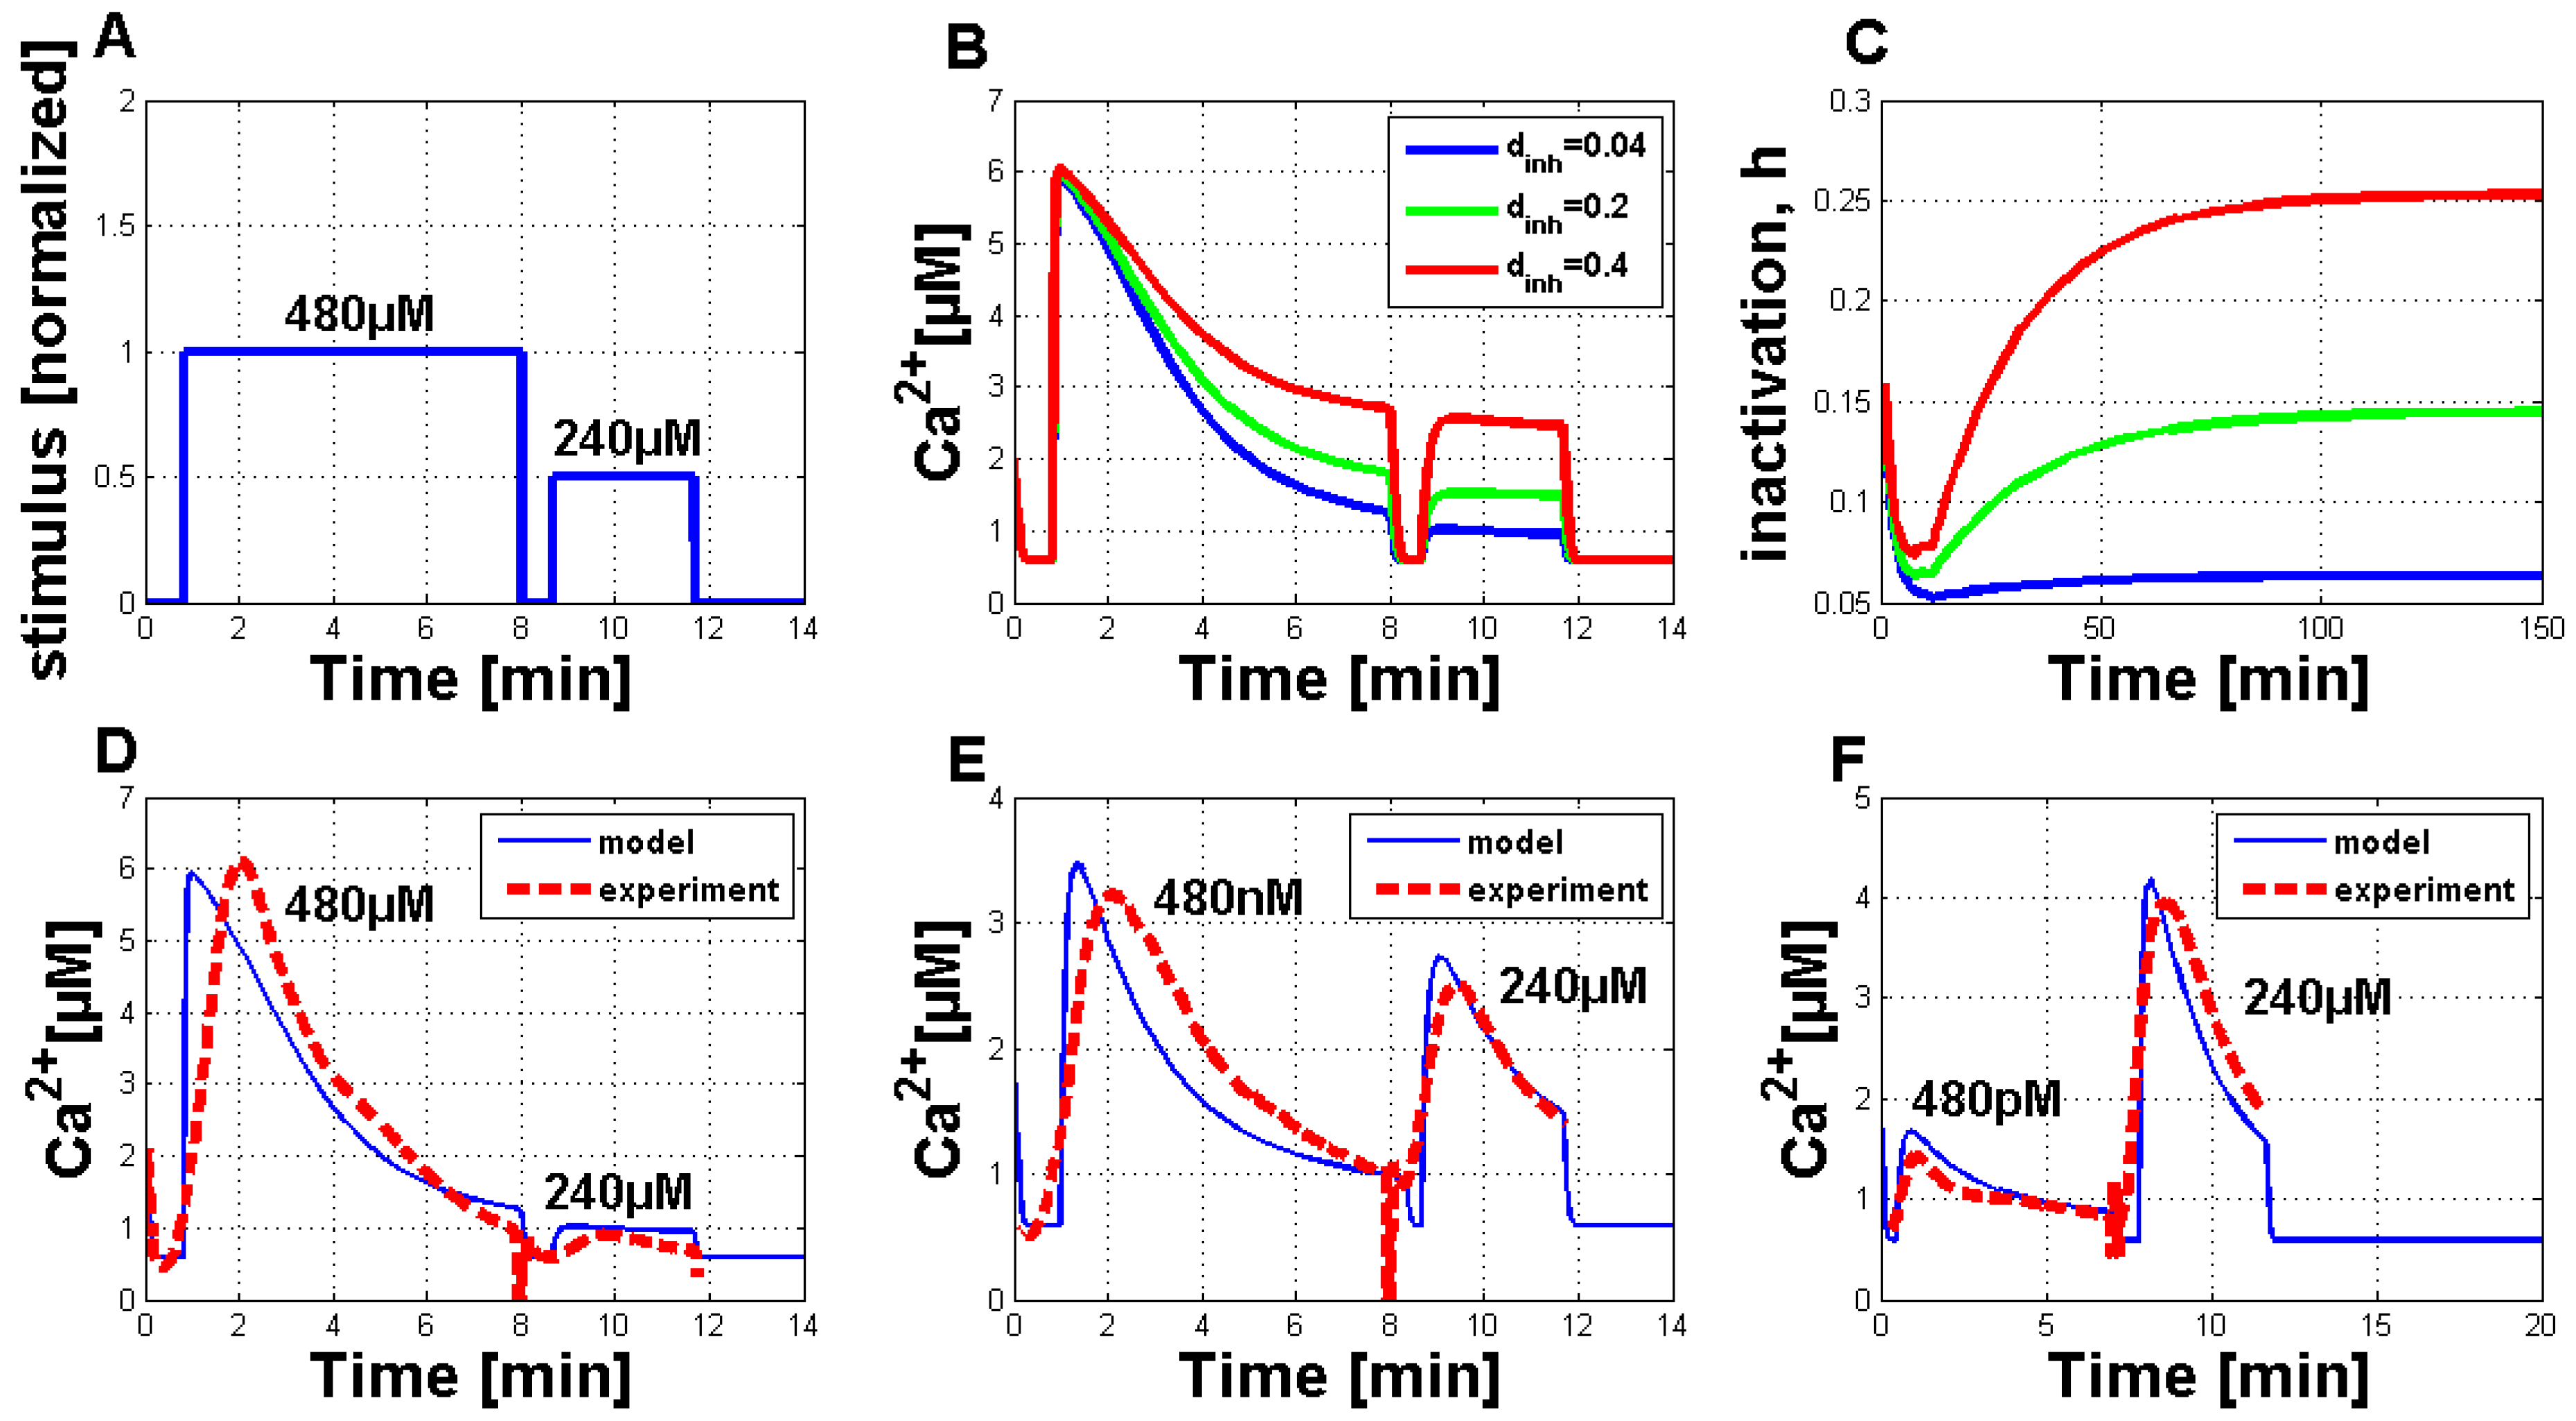
Thereafter the analysis of Ca
simulations with a modified IP
stimulus was started. This IP
stimulus permitted activation of the system at two consecutive time points, in analogy to the experimental setup. This stimulus could be transferred into the corresponding Ch5 concentration of the experiments by using a transfer function, like mentioned before. With the help of a suitable parameter set, it was possible to simulate two consecutive Ch5-induced Ca
responses, with the second stimulus directly applied after the end of the first reaction (
Figure 6B–F). Before a direct comparison between the experimental observations and the model simulations was possible, a detailed analysis of the Ca
simulations, in addition to the simulations for the inactivation process of the channels in the inner compartments of the plant cell, was necessary (
Figure 6B,C). For this analysis, Ca
simulations with different values for the d
parameter were performed (see
Figure 6B). It turned out that the d
parameter is very sensitive. Increasing its value provokes the second stimulated Ca
response, such that it is not suppressed anymore. The corresponding inactivation processes are shown in
Figure 6C. With the help of the d
parameter sensitivity, it was also possible to find an agreement of experimental and simulated Ca
signatures (
Figure 6D–F).
Figure 6D shows the comparison between the experimental and simulated Ca
response elicited at two time points with 480 µM and 240 µM. Furthermore, for the simulated Ca
signatures, the second signal is nearly completely suppressed.
Figure 6E,F show the simulation results for the elicitation pairs 480 nM–240 µM (
Figure 6E) and 480 pM–240 µM (
Figure 6F) in comparison to the experimental data. For all simulations, the parameter set-up was chosen as listed in
Table 1, except
= 200 and J
= 0. The parameter, d
, was always set to 0.04.
The aequorin-transformed tobacco suspension cultures reacted to the stimulation by
N-acetylchitopentaose as already described for soybean cells [
9,
12]. In comparison to temperature-induced Ca
signals [
14], a characteristic lag-phase of about 50 s was observed. Obviously, the measured Ca
signal is preceded by other signal transduction events, such as protein phosphorylation, other ion fluxes and probably by the activation of phospholipase C [
4]. Since the precise structure of the plant signal transduction network triggered by pathogen derived elicitors is not known so far, a reduced model to simulate Ca
transients was established. This reduced model is based on the Li and Rinzel model for agonist-induced Ca
release in pituitary gonadotrophs [
16]. An analogy between the cytosolic Ca
release from internal compartments in plant and animal cells was assumed. The Li and Rinzel model [
16] considers a Ca
release of the ER via IP
, thereby resulting in Ca
activation processes leading to cytosolic Ca
transients. In the plant cell, we mainly regard the vacuole as the inner Ca
compartment. The involvement of inositol phosphates, which are responsible for the cytosolic Ca
release after elicitor recognition, is confirmed [
24]. Nevertheless, IP
receptor genes in plants remain to be identified. A physiological role of IP
, or even IP
in guard cells, could be shown
in vivo [
31].
After the adaptation of the Li and Rinzel model [
16], different simulation results were analyzed in detail. Ch5-induced Ca
simulations were achieved with modified values for the adopted parameters to make reasonable comparisons with the experiments possible. The simulated Ca
curve strongly resembled the experimental Ca
signature. The values for the identified parameter-set were not determined
in vivo, and they are given in arbitrary units. It is a difficult task to identity ligand-gated channels in the vacuolar membrane of plants. A putative two-pore Ca
channel, TPC1, in the vacuolar membrane of
Arabidopsis thaliana has been postulated to be involved in abiotic or biotic stress responses, but it could not be affirmed [
35].
Figure 6.
Simulation of Ca
signatures with the adapted Li and Rinzel model and qualitative comparison to experimental Ca
signatures, focusing on the stimulation at two different time points. (
A) Normalized IP
stimulus function for the activation of the simulations in
Figure 6B–D. The first elicitation was set to one as a normalized value, and the second elicitation was set to 0.5, related to stimulations with 480 µM and 240 µM of Ch5, respectively. In
Figure 6E,F, the stimulus strength was changed. In
Figure 6E, the first elicitation was set to 0.11 (corresponding to 480 nM) and in
Figure 6F, to 0.06 (480 pM), while the second elicitation remained constant at 0.5 (240 µM). (
B) Three different Ca
simulations of the adapted Li and Rinzel model, activated by the same stimulus function as shown in
Figure 6A. Only the parameter variation of d
provoked different simulation results. The values of the other parameters were set as listed in
Table 1, except
= 200 and J
= 0. (
C) The corresponding inactivation processes for the Ca
simulations in
Figure 6B are shown. The parameter set-up was the same as for the simulations in
Figure 6B. The time interval of 2.5 h was chosen for a better illustration of process evolution. (
D) + (
E) + (
F) Comparison of experimental (dashed red curve) and simulated (solid blue curve) Ca
signatures upon elicitation with two consecutive Ch5 stimuli (6D: 480 µM and 240 µM, 6E: 480 nM and 240 µM and 6F: 480 pM and 240 µM).
![Plants 02 00750 g006]()
Thereafter, the analysis of quantitative simulation results in comparison to the experiments in vivo was started. With the normalized IP stimulus function, the treatment of varying Ch5 concentrations in the experiments was reproduced, and a typical dose-response behavior could be shown. In the simulations, a transfer function converted the normalized values for the IP stimulus into the Ch5 concentrations used in the experiments. The transfer function expresses the early events before cytosolic Ca increase, covering elicitor recognition and the generation of inositol phosphates.
Further on, we focused on the refractory behavior of Ca
signals induced by repeated stimulation with Ch5. The repeated stimulation of the same cell culture resulted in significantly reduced Ca
transients in response to the second elicitation. To exclude the possibility of osmotic effects, the concentration of the first elicitation was gradually reduced. Most interestingly, the dose-response curves for the first and second elicitation did not sum up to the same value. In other words, a low first elicitation has an over proportional negative effect on the outcome of the second one. Since this outcome is specific for the particular elicitor, the inhibitory effect must target the receptor. A cooperative effect between the receptors or specific modifications of receptor clusters could be a possible explanation [
36]. The refractory behavior was integrated into the model by the variable, h, describing the inactivation process of the channels in the membrane of the inner plant Ca
compartments. Reasonable simulation results were achieved for a parameter-set with a d
parameter of 0.04. A general parameter sensitivity was identified for this parameter. It could be shown that there is a general dependency between the curve shape of h and the corresponding Ca
simulation. In the case of a flat curve shape, a second stimulation for the corresponding Ca
simulation was not possible. Only if h was allowed to increase, the second stimulation resulted in a second Ca
signal.
In general, there are different model approaches for certain plant cell functions. Four major modeling tools to describe different processes in plant cells are exemplarily summarized by Liu
et al. [
37], including differential equations, Boolean networks, network inference and reconstruction and flux balance analysis. The adapted Li and Rinzel model is based on a differential equation approach for Ca
transporters, applied to plant cells. Other plant models based on differential equations, including Ca
transporters, were developed, e.g., for the generation of action potentials in vascular plants for the cytosolic pool [
13], based on the plasmalemma electrical process model by Gradmann [
38]. A further differential equation approach for Ca
signals, which are triggered by temperature decrease and the exchange of cytosolic and vacuolar pools, was established by Liu and coworkers [
14]. They developed a compartment model for ion and growth dynamics in the tip and shank combined in a pollen tube [
39]. The major four ion fluxes (Ca
, K
, H
and Cl
) are part of the balance equations for the cytosolic and vacuolar pools. The description includes the calcium-induced calcium release (CICR) for the Ca
channels in the vacuolar membrane, a buffering component for Ca
and H
ions within the cytosol and the influence of the temperature on the ATP/ADP ratio and the H
concentration. The values of the parameters are unknown for the different simulations. Anyhow, it was possible to simulate all four ion fluxes and to compare experimental Ca
data with the Ca
simulations, based on only assumed parameters. Good results were achieved for a rapid temperature decrease.
In summary it can be said that Ca
transients induced by mechanical stress [
40], temperature or elicitors show some similarities with respect to their shape and absolute concentration of calcium in the cytoplasm. Nevertheless, we can assume that there are marked differences in the underlying signal transduction network, as indicated by the delayed Ca
transient that is characteristic for the elicitor perception. For this reason, it could be beneficial to establish different modeling approaches, based on differential equations, as well as other modeling tools, to compare their application to different scenarios. Within this work, a successful adaptation of the Li and Rinzel model to elicitor-induced Ca
was carried out. The adapted parameter-set could reproduce Ca
simulations, especially focusing on the curve’s shape, dose-response behavior and the activation with two consecutive stimuli.


