
Parameters for Fabricating Nano-Au Colloids through the Electric Spark Discharge Method with Micro-Electrical Discharge Machining


Abstract
:
1. Introduction
2. Results
2.1. Nano-Au Colloid Preparation
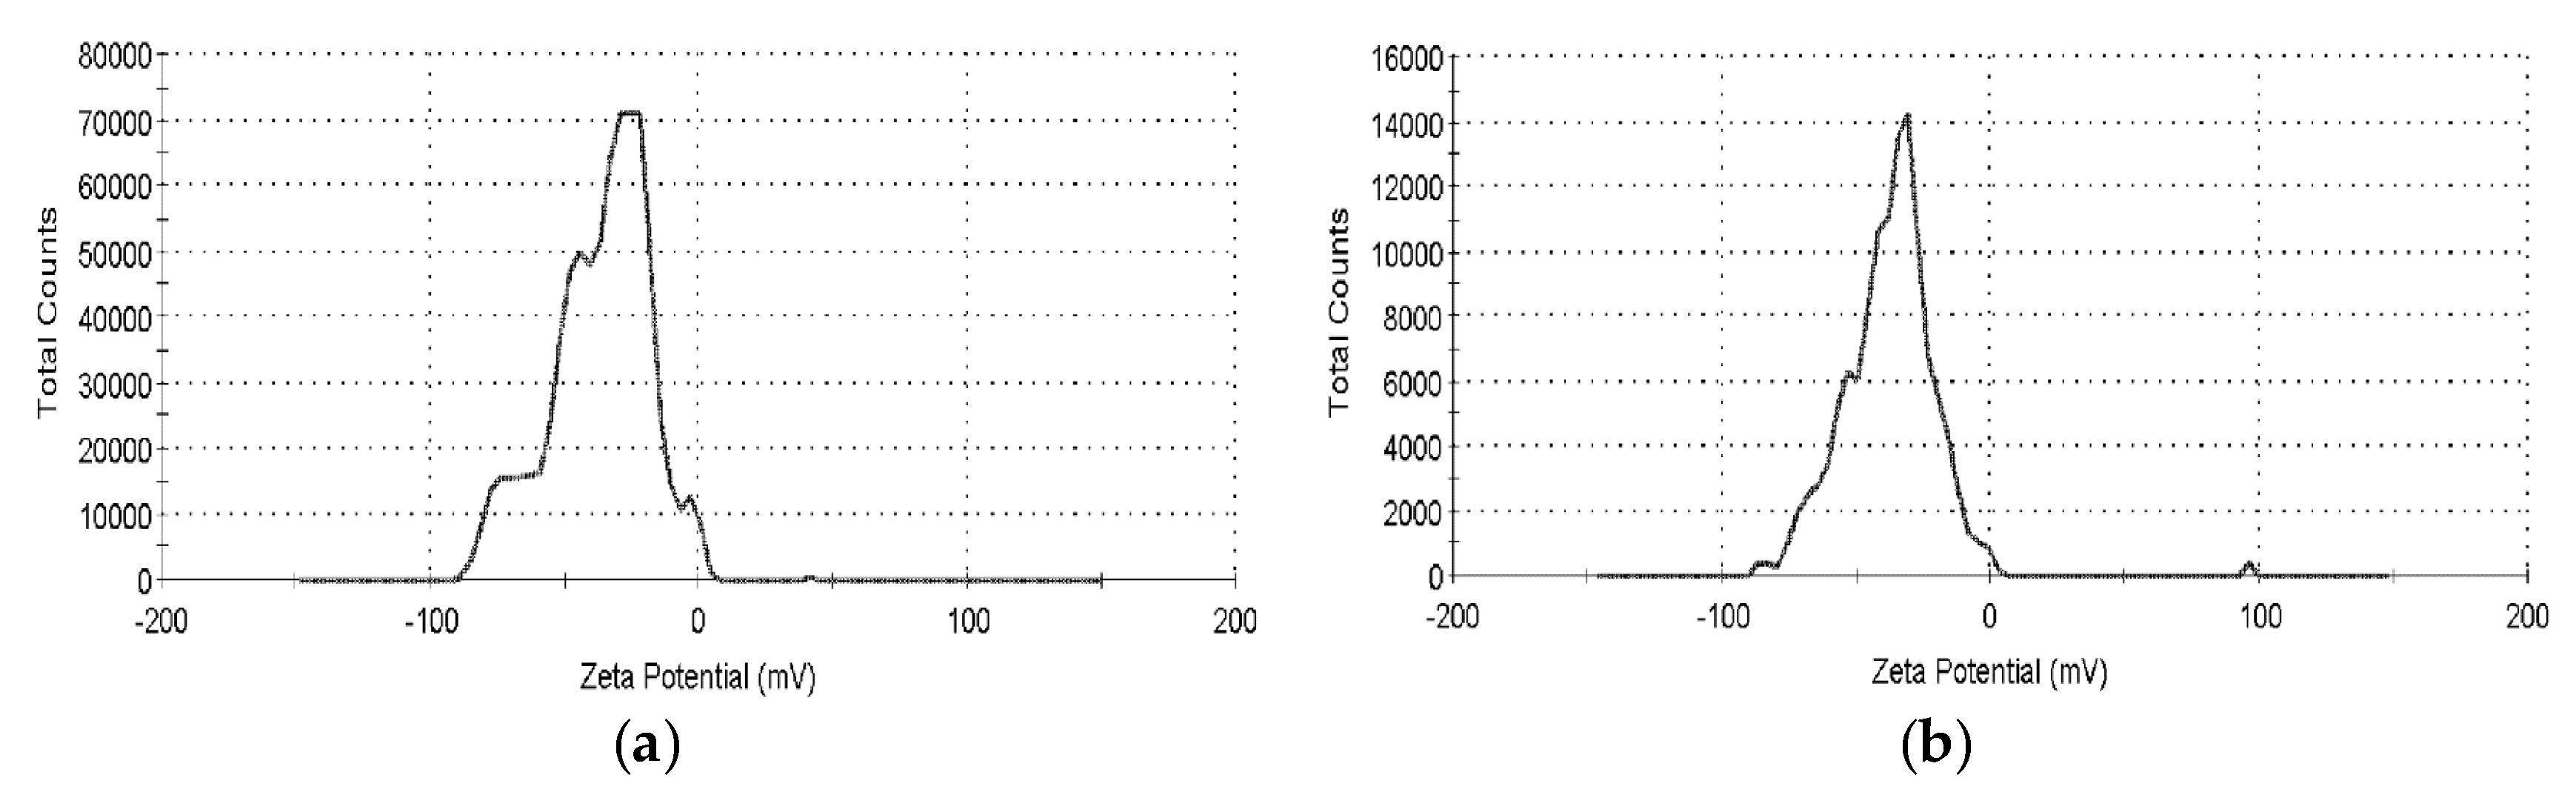
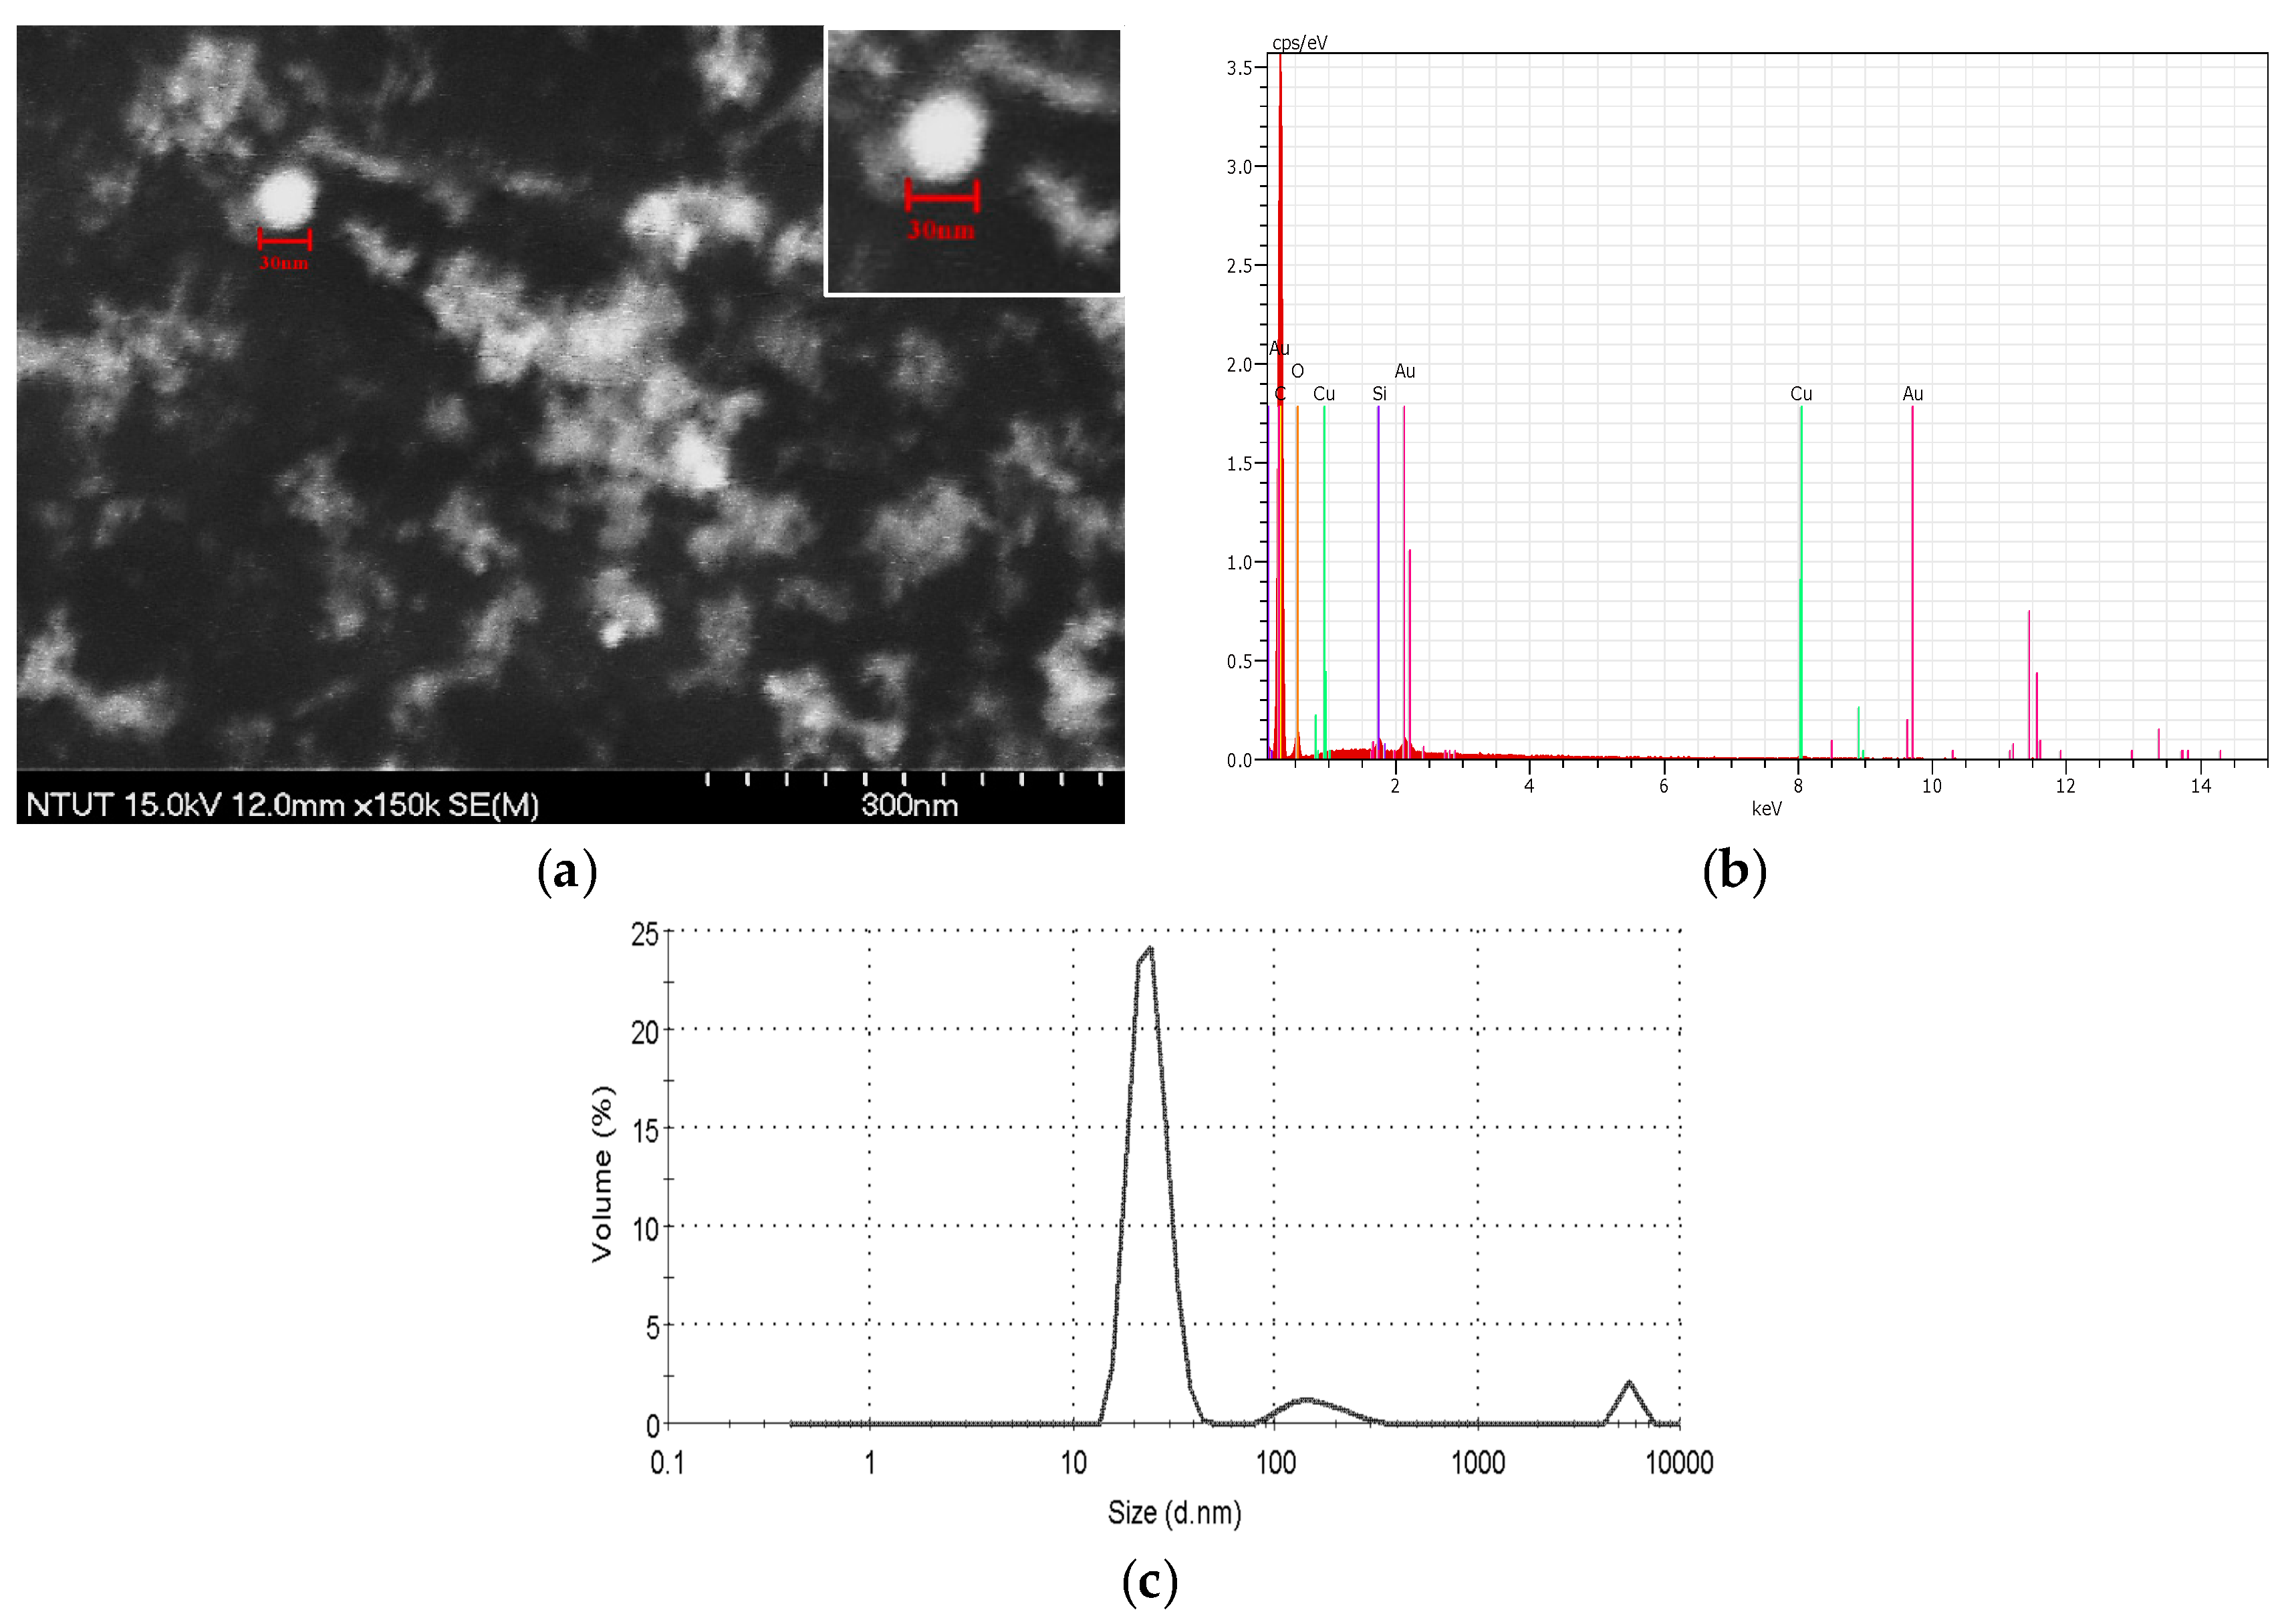
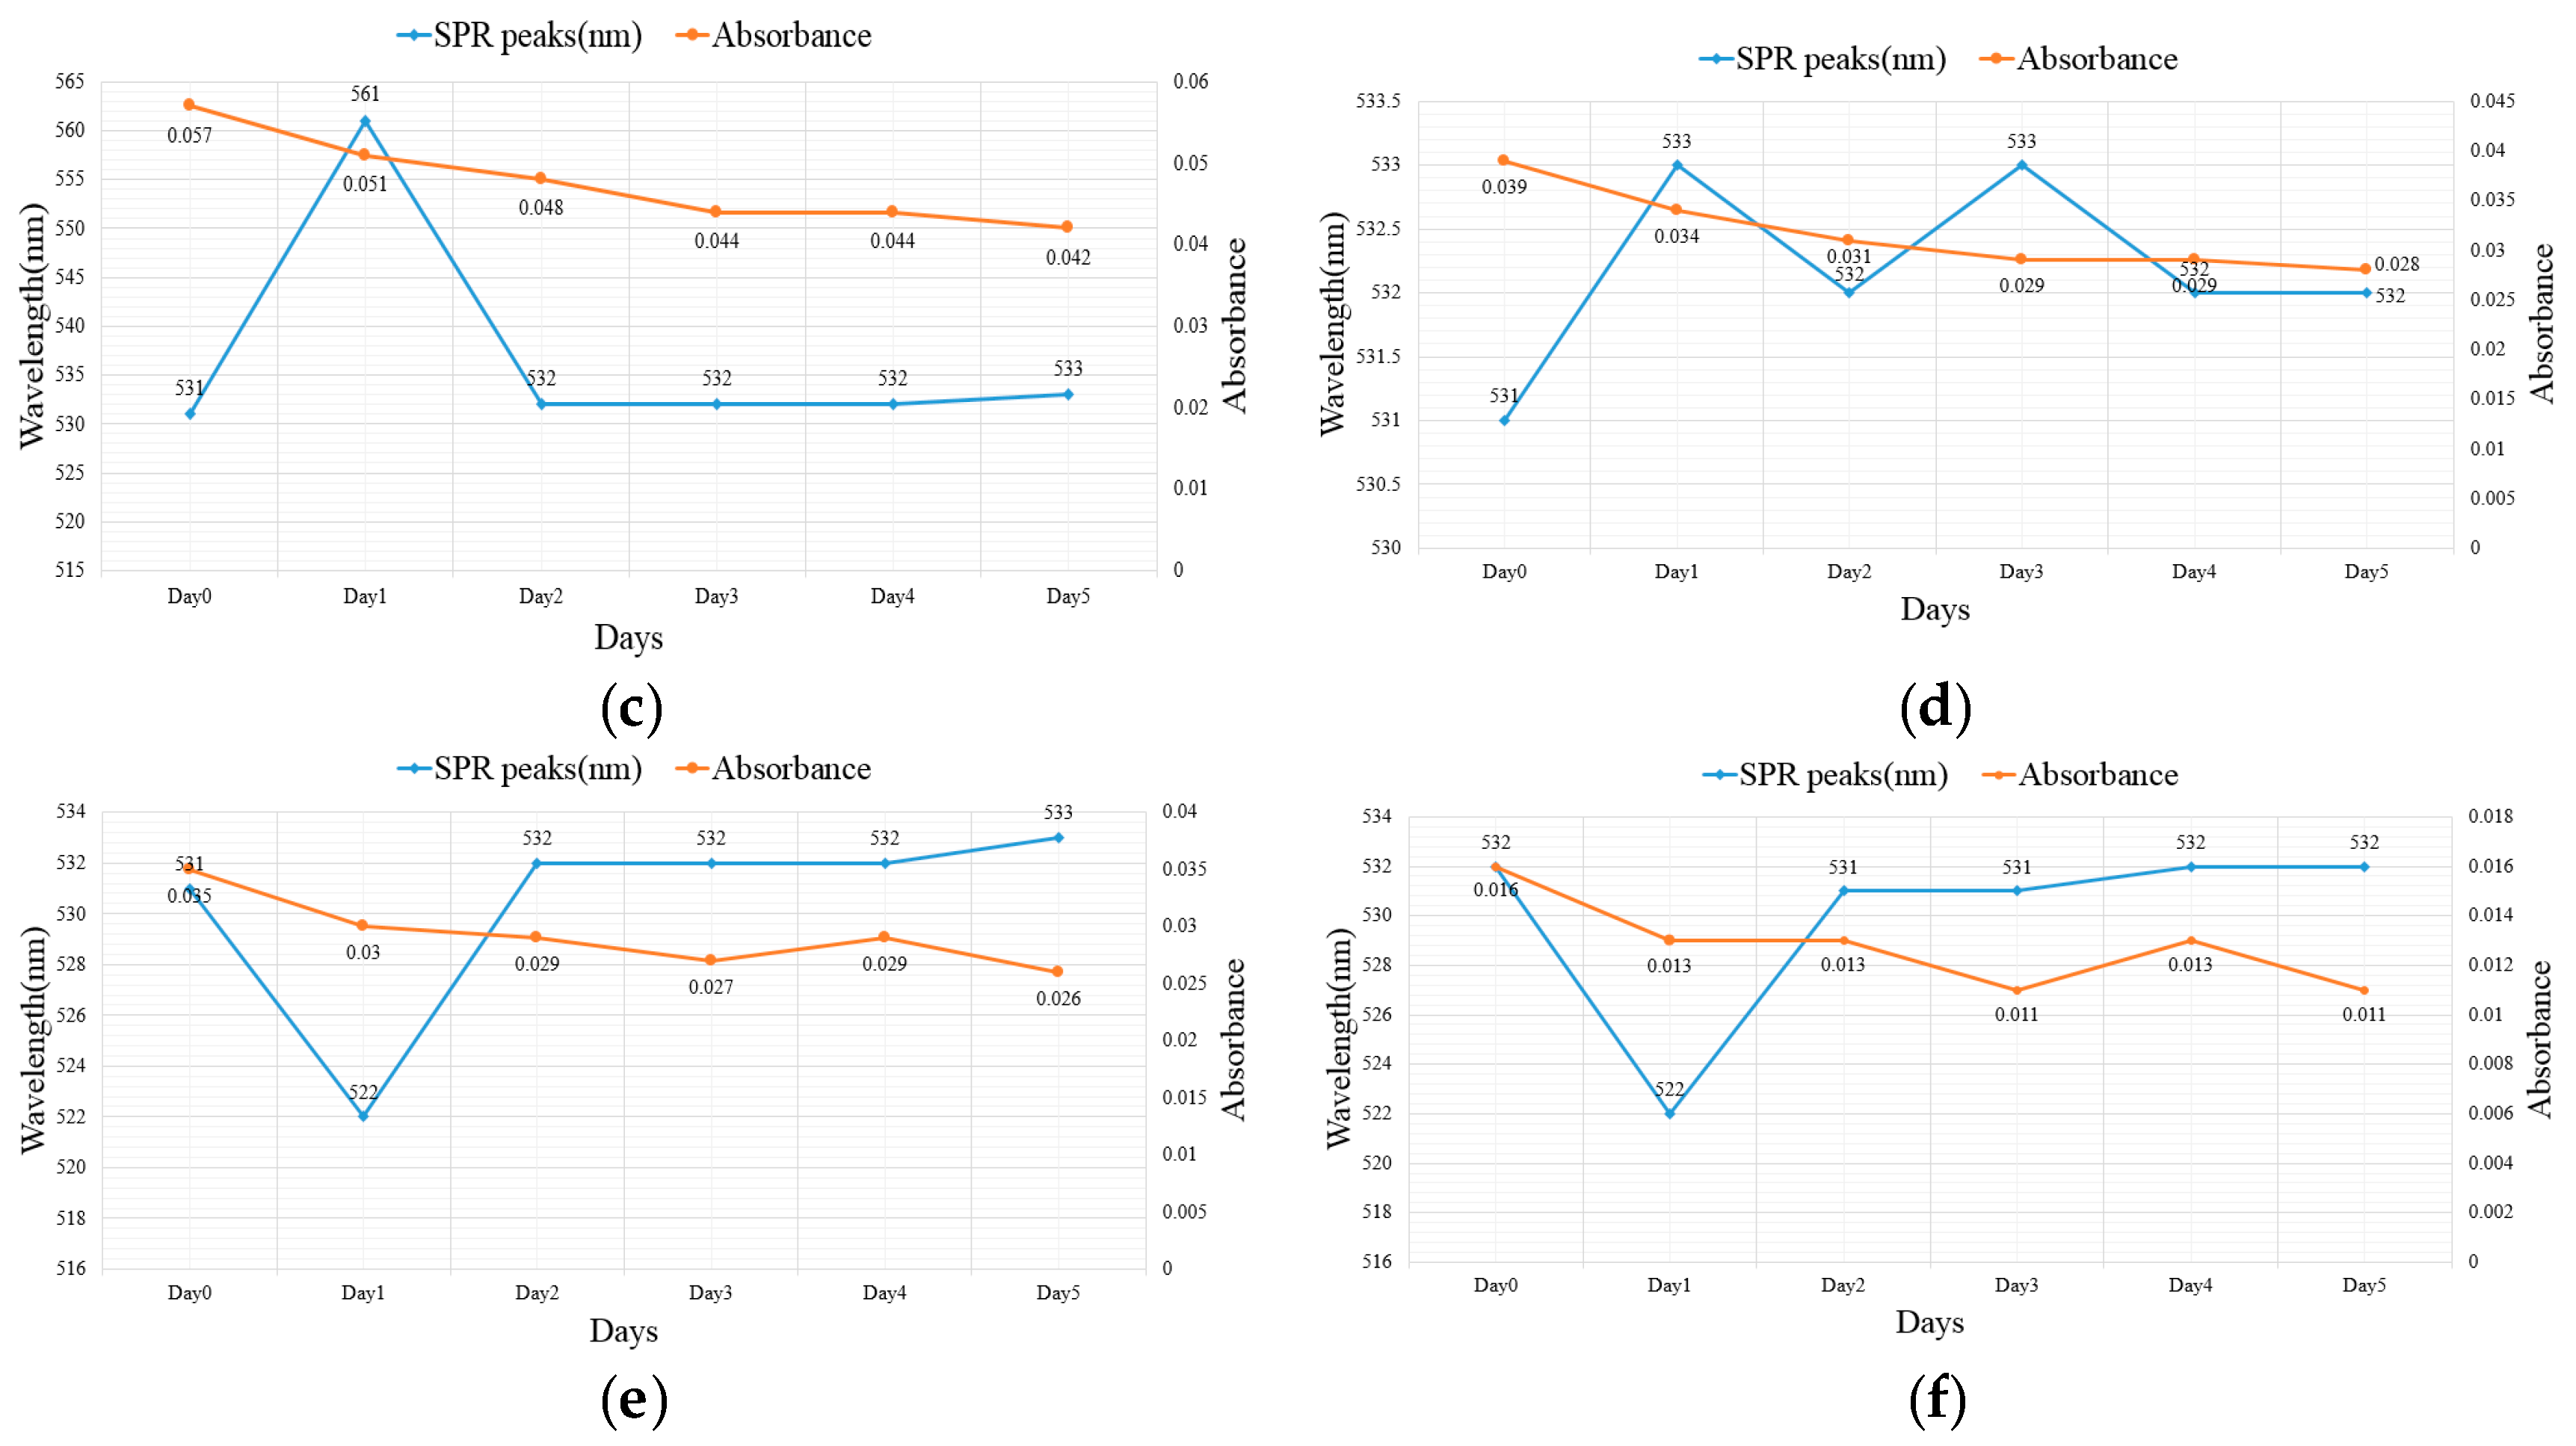
2.2. Suspension Analysis of Nano-Au Colloids Fabricated through m-EDM
3. Discussion
4. Materials and Methods
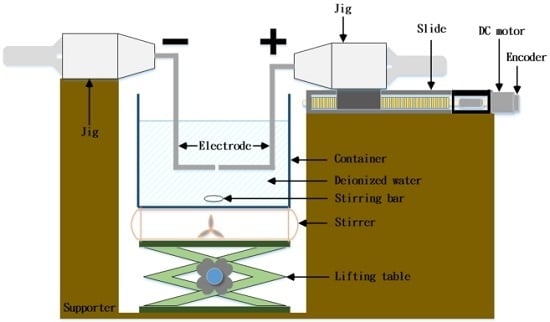
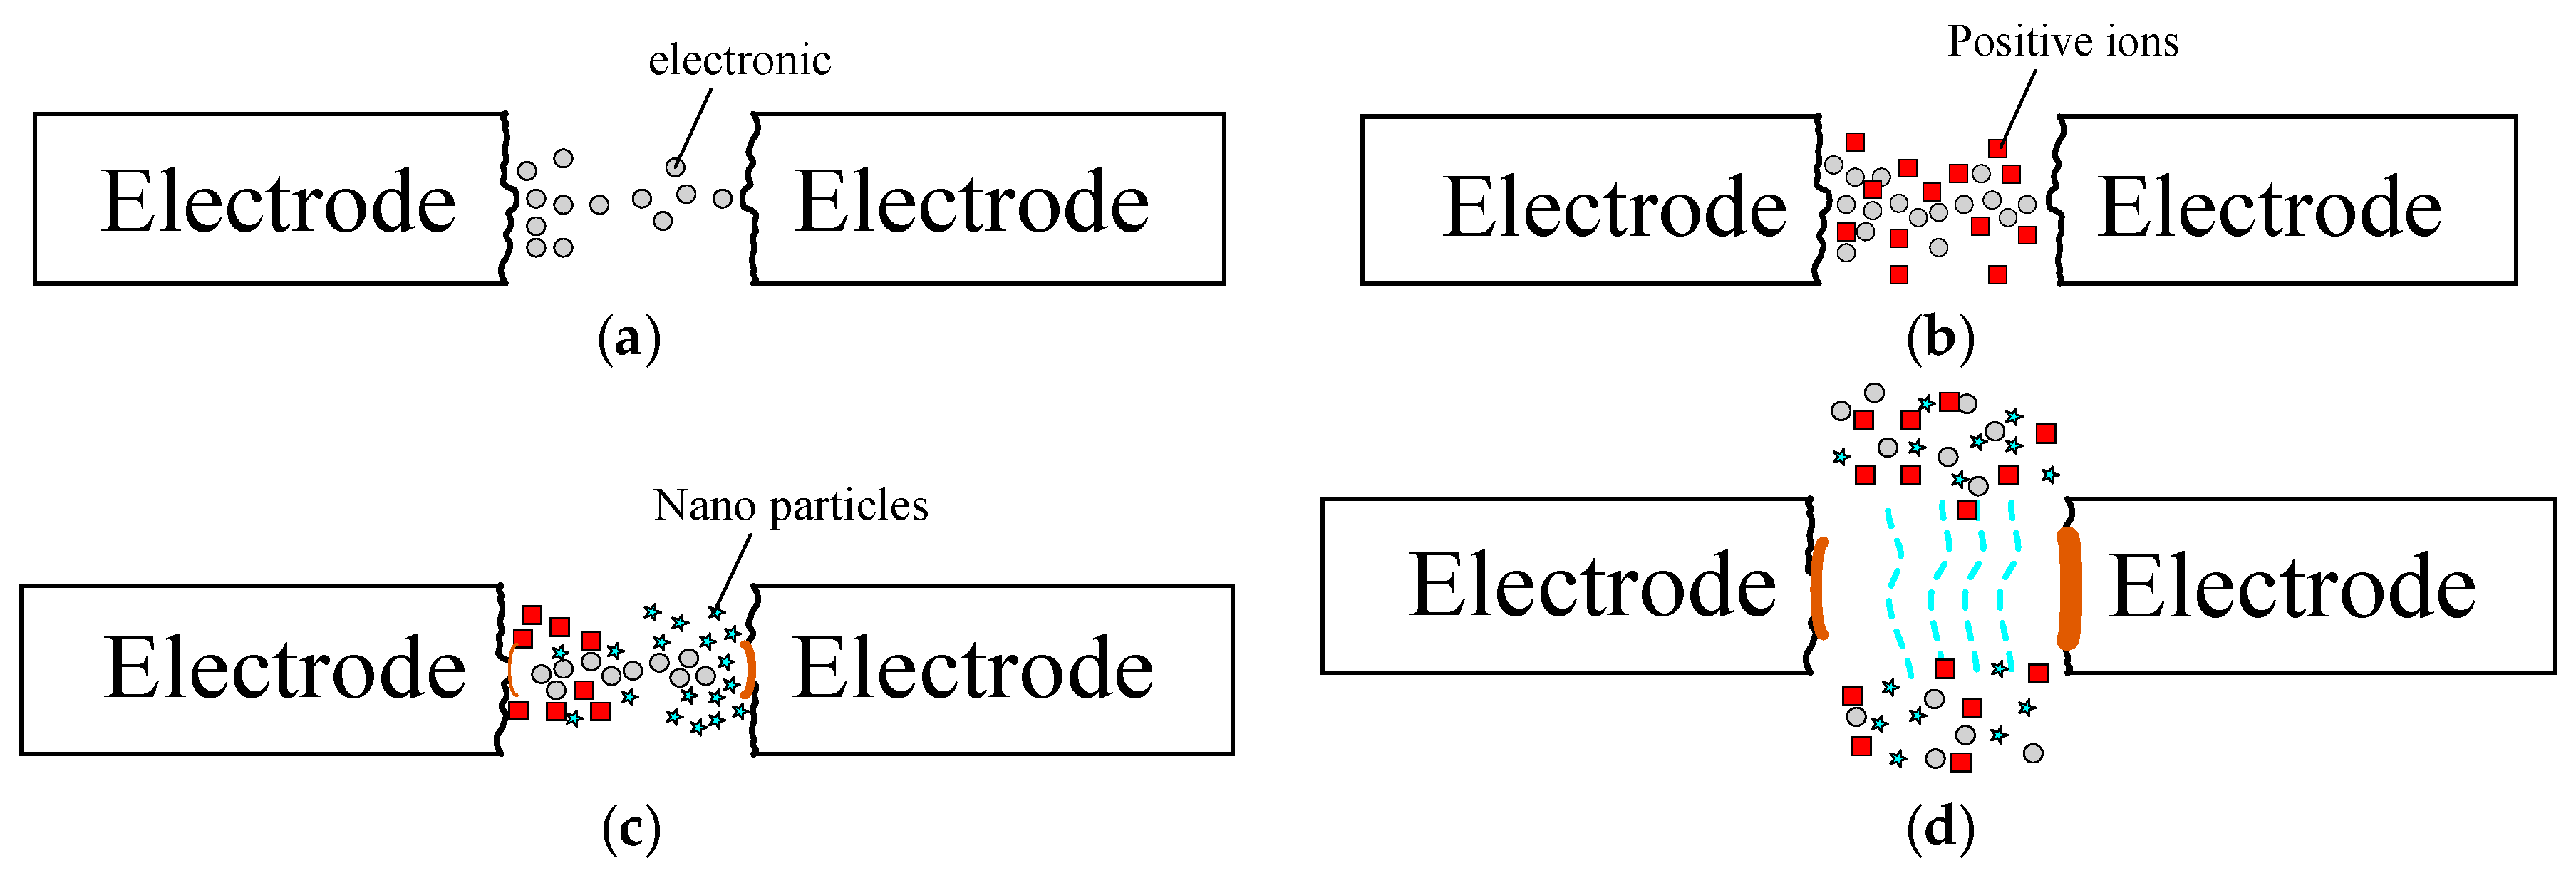
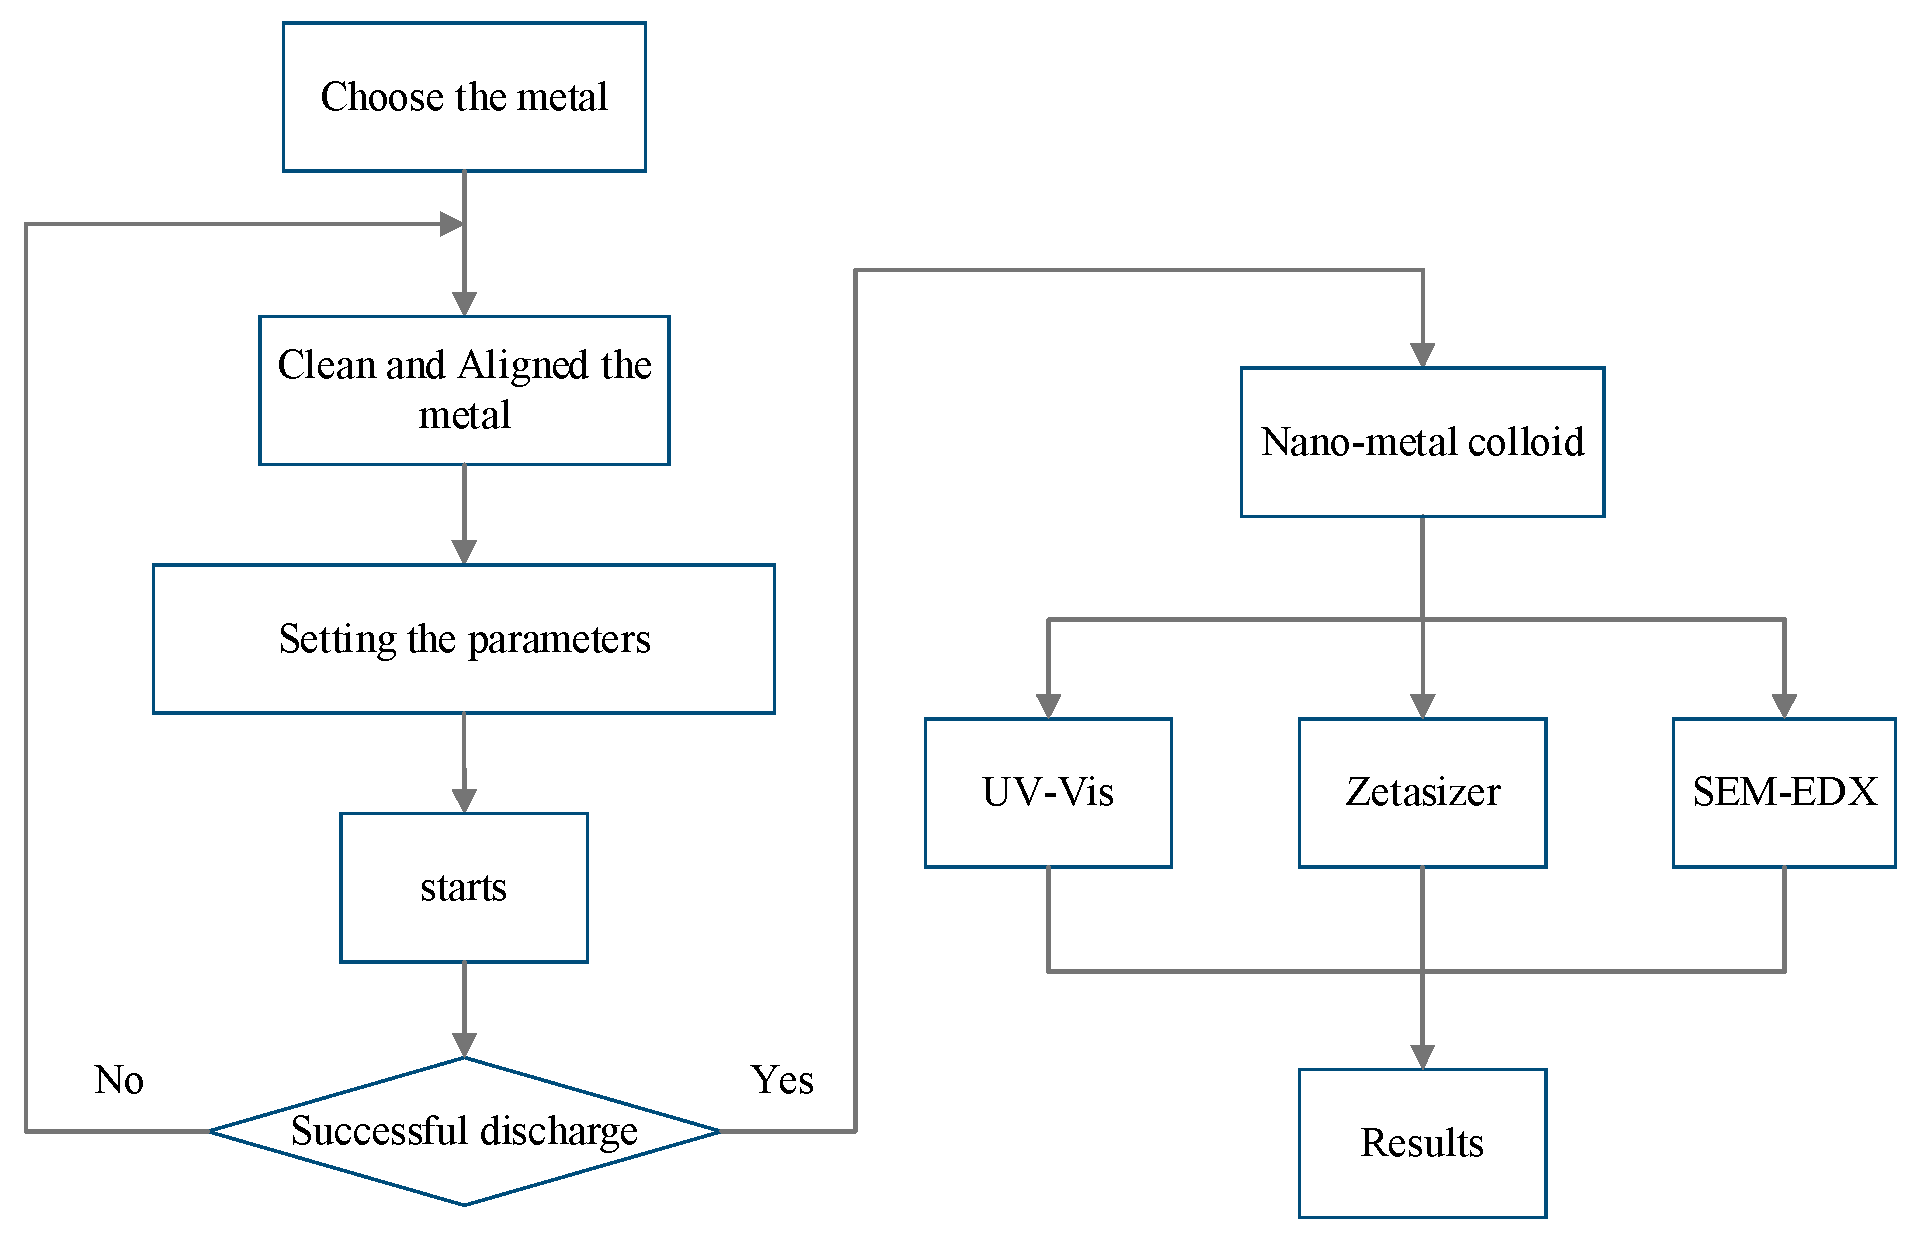
4.1. Fabricating Nano-Au Colloids through the Electric Spark Discharge Method (ESDM)
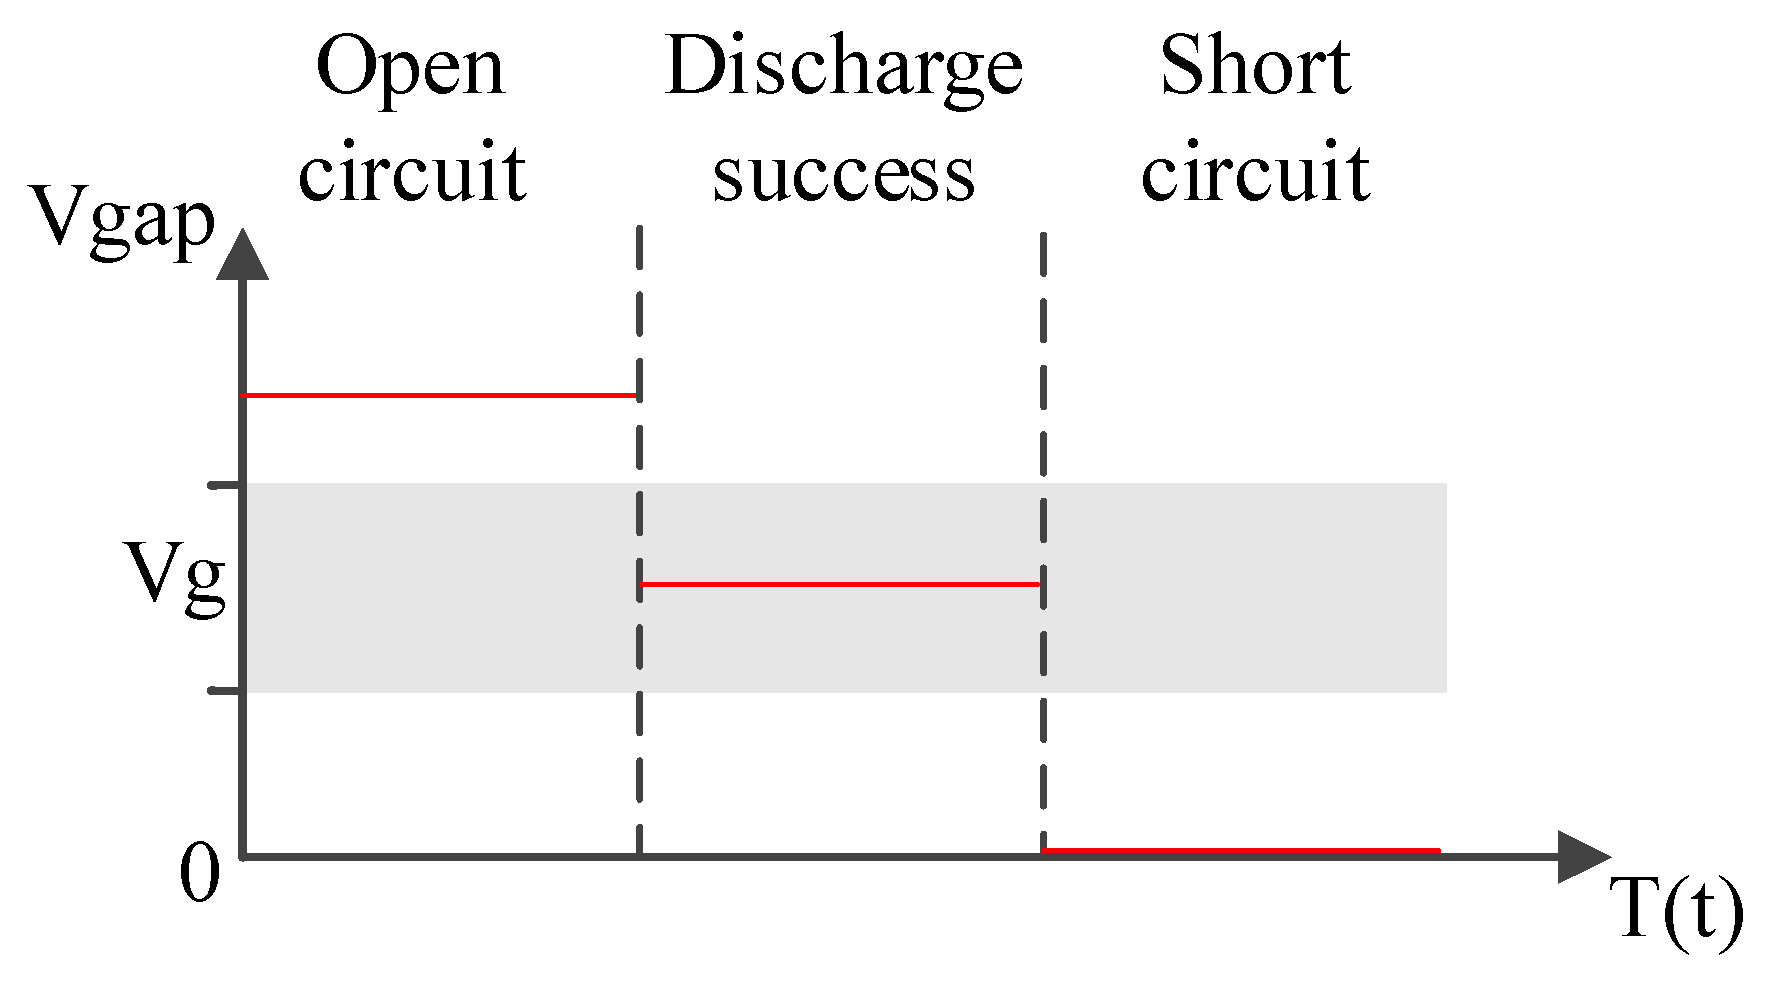
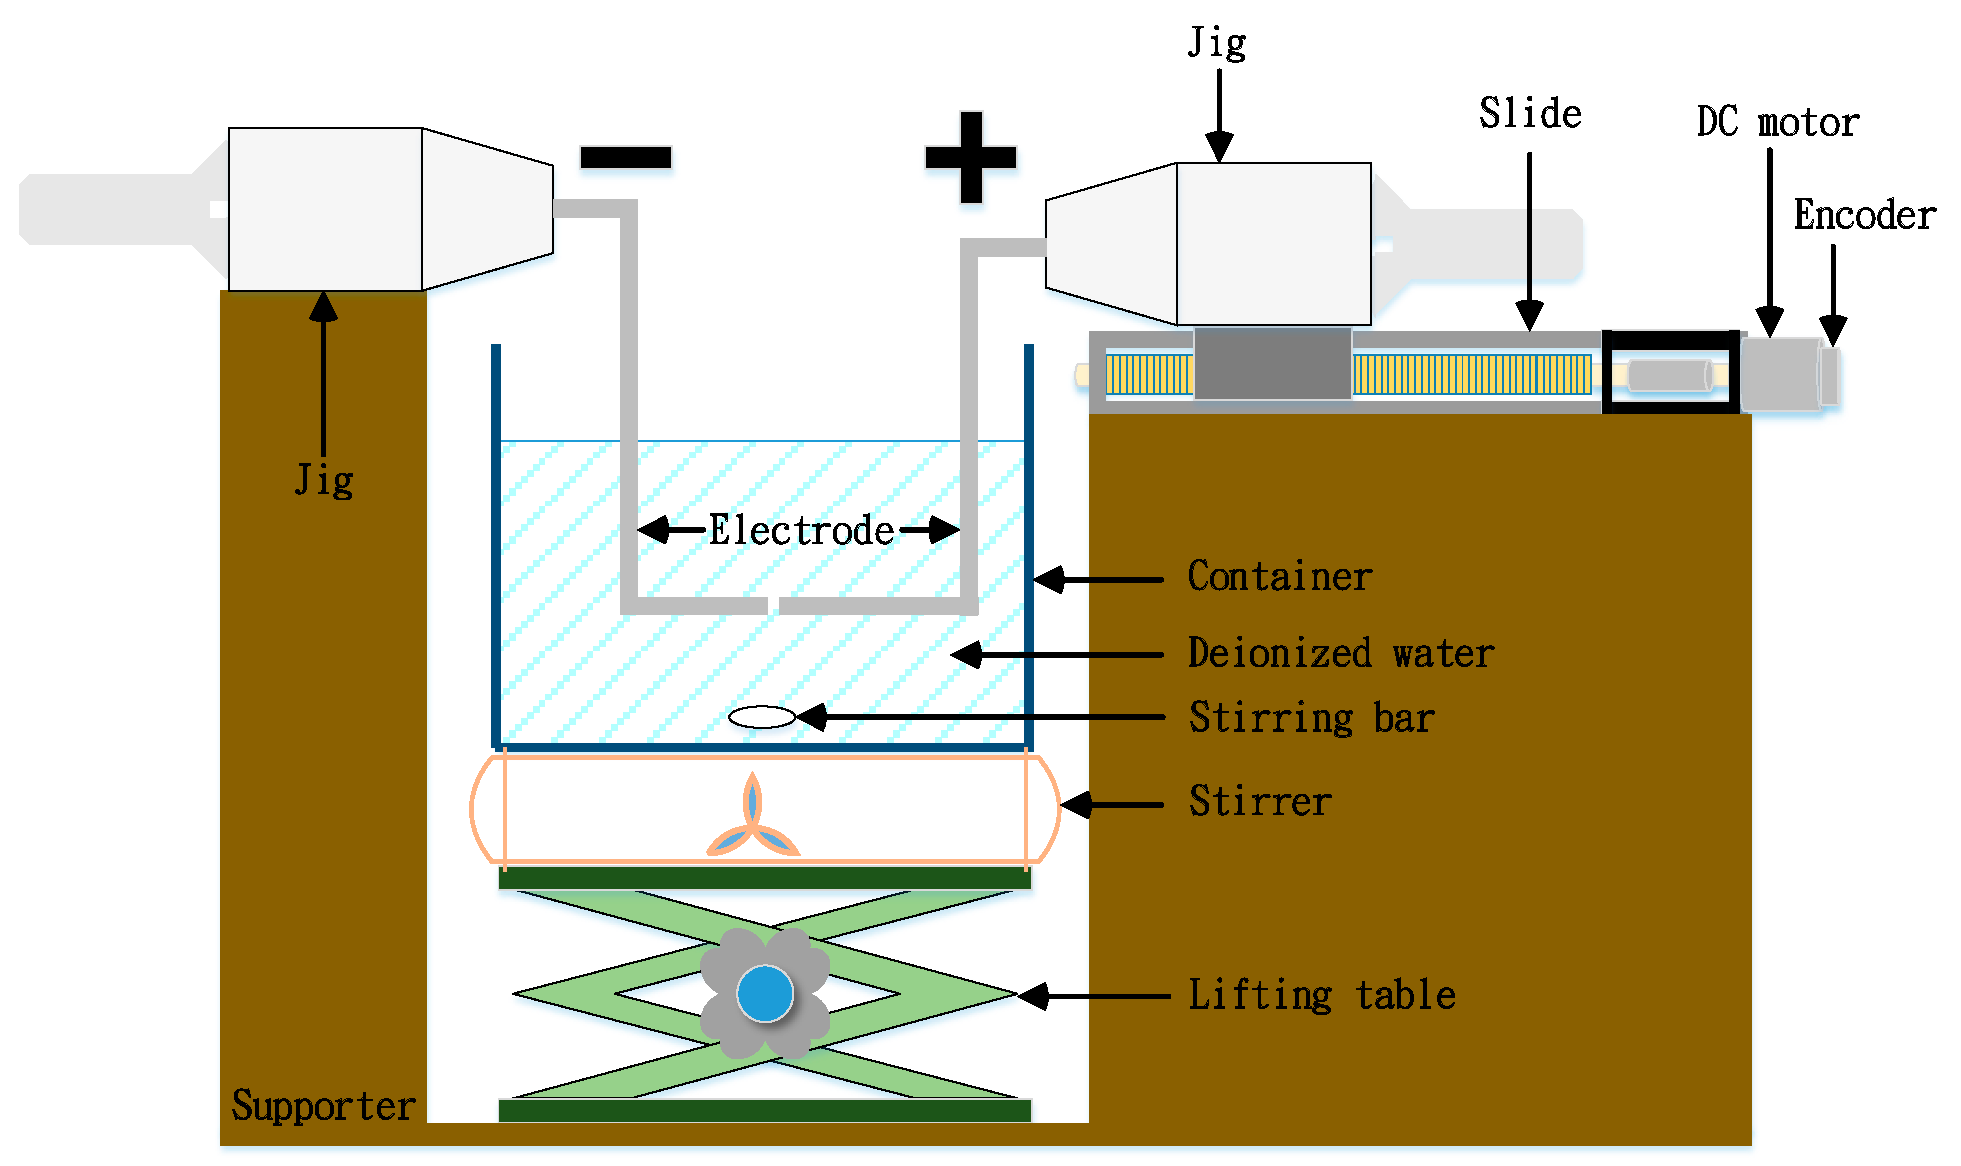
4.2. Micro-Electrical Discharge Machine
4.3. Properties of Nano-Au Colloids
5. Conclusions
Supplementary Materials
Supplementary File 1Acknowledgments
Author Contributions
Conflicts of Interest
References
- Begum, N.A.; Mondal, S.; Basu, S.; Laskar, R.A.; Mandal, D. Biogenic synthesis of Au and Ag nanoparticles using aqueous solutions of Black Tea leaf extracts. Colloids Surf. B Biointerfaces 2009, 71, 113–118. [Google Scholar] [CrossRef] [PubMed]
- Coowar, F.A.; Vitins, G.; Mepsted, G.O.; Waring, S.C.; Horsfall, J.A. Electrochemical oxidation of borohydride at nano-gold-based electrodes: Application in direct borohydride fuel cells. J. Power Sources 2008, 175, 317–324. [Google Scholar] [CrossRef]
- Fritzsche, W.; Taton, T.A. Metal nanoparticles as labels for heterogeneous, chip-based DNA detection. Nanotechnology 2003, 14, R63–R73. [Google Scholar] [CrossRef] [PubMed]
- Kamiar, A.; Ghotalou, R.; Valizadeh, H. Preparation, physicochemical characterization and performance evaluation of gold nanoparticles in radiotherapy. Adv. Pharm. Bull. 2013, 3, 425–428. [Google Scholar] [PubMed]
- Ray, P.C.; Yu, H.; Fu, P.P. Toxicity and environmental risks of nanomaterials: Challenges and future needs. J. Environ. Sci. Health Part C 2009, 27, 1–35. [Google Scholar] [CrossRef] [PubMed]
- Nowack, B.; Bucheli, T.D. Occurrence, behavior and effects of nanoparticles in the environment. Environ. Pollut. 2007, 150, 5–22. [Google Scholar] [CrossRef] [PubMed]
- Tseng, K.-H.; Liao, C.-Y.; Huang, J.-C.; Tien, D.-C.; Tsung, T.-T. Characterization of gold nanoparticles in organic or inorganic medium (ethanol/water) fabricated by spark discharge method. Mater. Lett. 2008, 62, 3341–3344. [Google Scholar] [CrossRef]
- Lung, J.-K.; Huang, J.-C.; Tien, D.-C.; Liao, C.-Y.; Tseng, K.-H.; Tsung, T.-T.; Kao, W.-S.; Tsaic, T.-H.; Jwo, C.-S.; Lin, H.-M.; et al. Preparation of gold nanoparticles by arc discharge in water. J. Alloys Compd. 2007, 434, 655–658. [Google Scholar] [CrossRef]
- Tien, D.-C.; Liao, C.-Y.; Huang, J.-C.; Tseng, K.-H.; Lung, J.-K.; Tsung, T.-T.; Kao, W.-S.; Tsai, T.-H.; Cheng, T.-W.; Yu, B.-S.; et al. Novel technique for preparing a nano-silver water suspension by the arc-discharge method. Rev. Adv. Mater. Sci. 2008, 18, 750–756. [Google Scholar]
- Son, S.; Lim, H.; Kumar, A.S.; Rahman, M. Influences of pulsed power condition on the machining properties in micro EDM. J. Mater. Process. Technol. 2007, 190, 73–76. [Google Scholar] [CrossRef]
- Chen, D.C.; Jhang, J.J.; Guo, M.W. Application of Taguchi design method to optimize the electrical discharge machining. J. Achiev. Mater. Manuf. Eng. 2013, 57, 76–82. [Google Scholar]
- Tseng, K.-H.; Huang, J.-C. Pulsed spark-discharge assisted synthesis of colloidal gold nanoparticles in ethanol. J. Nanopart. Res. 2011, 13, 2963–2972. [Google Scholar] [CrossRef]
- Liao, C.-Y.; Tseng, K.-H.; Lin, H.-S. Preparation of metallic aluminum compound particles by submerged arc discharge method in aqueous media. Metall. Mater. Trans. B 2013, 44, 91–97. [Google Scholar] [CrossRef]
- Gostimirovic, M.; Kovac, P.; Sekulic, M.; Skoric, B. Influence of discharge energy on machining characteristics in EDM. J. Mech. Sci. Technol. 2012, 26, 173–179. [Google Scholar] [CrossRef]
- Tseng, K.-H.; Chang, C.-Y.; Chung, M.-Y.; Tang, Y.-L. Bacteriostatic Substrate by Conductivity Method and Electric Spark Discharge Method Combined with Electrospinning for Silver Dressing. Int. J. Polym. Sci. 2016, 2016, 1–10. [Google Scholar] [CrossRef]
- Scholl, J.A.; García-Etxarri, A.; Koh, A.L.; Dionne, J.A. Observation of quantum tunneling between two plasmonic nanoparticles. Nano Lett. 2013, 13, 564–569. [Google Scholar] [CrossRef] [PubMed]
- Tseng, K.-H.; Chiu, J.-L.; Lee, H.-L.; Kao, Y.-S.; Tien, D.-C. Spark parameter monitoring feedback system for preparation of nanosilver colloid in EDM. Mater. Manuf. Process. 2016, 31, 186–193. [Google Scholar] [CrossRef]
- Rajurkar, K.P.; Wei, B.; Kozak, J.; McGeough, J.A. Modelling and monitoring interelectrode gap in pulse electrochemical machining. CIRP Ann. Manuf. Technol. 1995, 44, 177–180. [Google Scholar] [CrossRef]
- Sönnichsen, C.; Reinhard, B.M.; Liphardt, J.; Alivisatos, A.P. A molecular ruler based on plasmon coupling of single gold and silver nanoparticles. Nat. Biotechnol. 2005, 23, 741–745. [Google Scholar] [CrossRef] [PubMed]
- Peng, X.-F.; Yu, X.-L.; Xia, L.-F.; Zhong, X. Influence factors on suspension stability of nanofluids. J. Zhejiang Univ. Eng. Sci. 2007, 41, 577–580. [Google Scholar]
- Jailani, S.; Franks, G.V.; Healy, T.W. ζ potential of nanoparticle suspensions: Effect of electrolyte concentration, particle size, and volume fraction. J. Am. Ceram. Soc. 2008, 91, 1141–1147. [Google Scholar] [CrossRef]
- Jiang, J.; Oberdörster, G.; Biswas, P. Characterization of size, surface charge, and agglomeration state of nanoparticle dispersions for toxicological studies. J. Nanopart. Res. 2009, 11, 77–89. [Google Scholar] [CrossRef]


| Temperature | Deionized Water | Electrode | Discharge Time | Voltage | Current |
| 25 °C | DW | Au | 1 min | 100 V | Approx. 6.5 A |
| Atmospheric pressure | Volume of the beaker | Purity of the electrode | Diameter of the electrode (positive/negative) | On–off duration of pulse discharge (TON–TOFF) | PID parameters |
| 1 atm | 100 mL | 99.99% | 1/1 mm | 10–10 µs | Kp = 0.21 Ki = 0.25 Kd = 0.015 |
| 20–20 µs | |||||
| 30–30 µs | |||||
| 40–40 µs | |||||
| 50–50 µs | |||||
| 100–100 µs |
| Days | Day 0 | Day 5 | ||
|---|---|---|---|---|
| TON–TOFF | SPR Peaks (nm) | Absorbance | SPR Peaks (nm) | Absorbance |
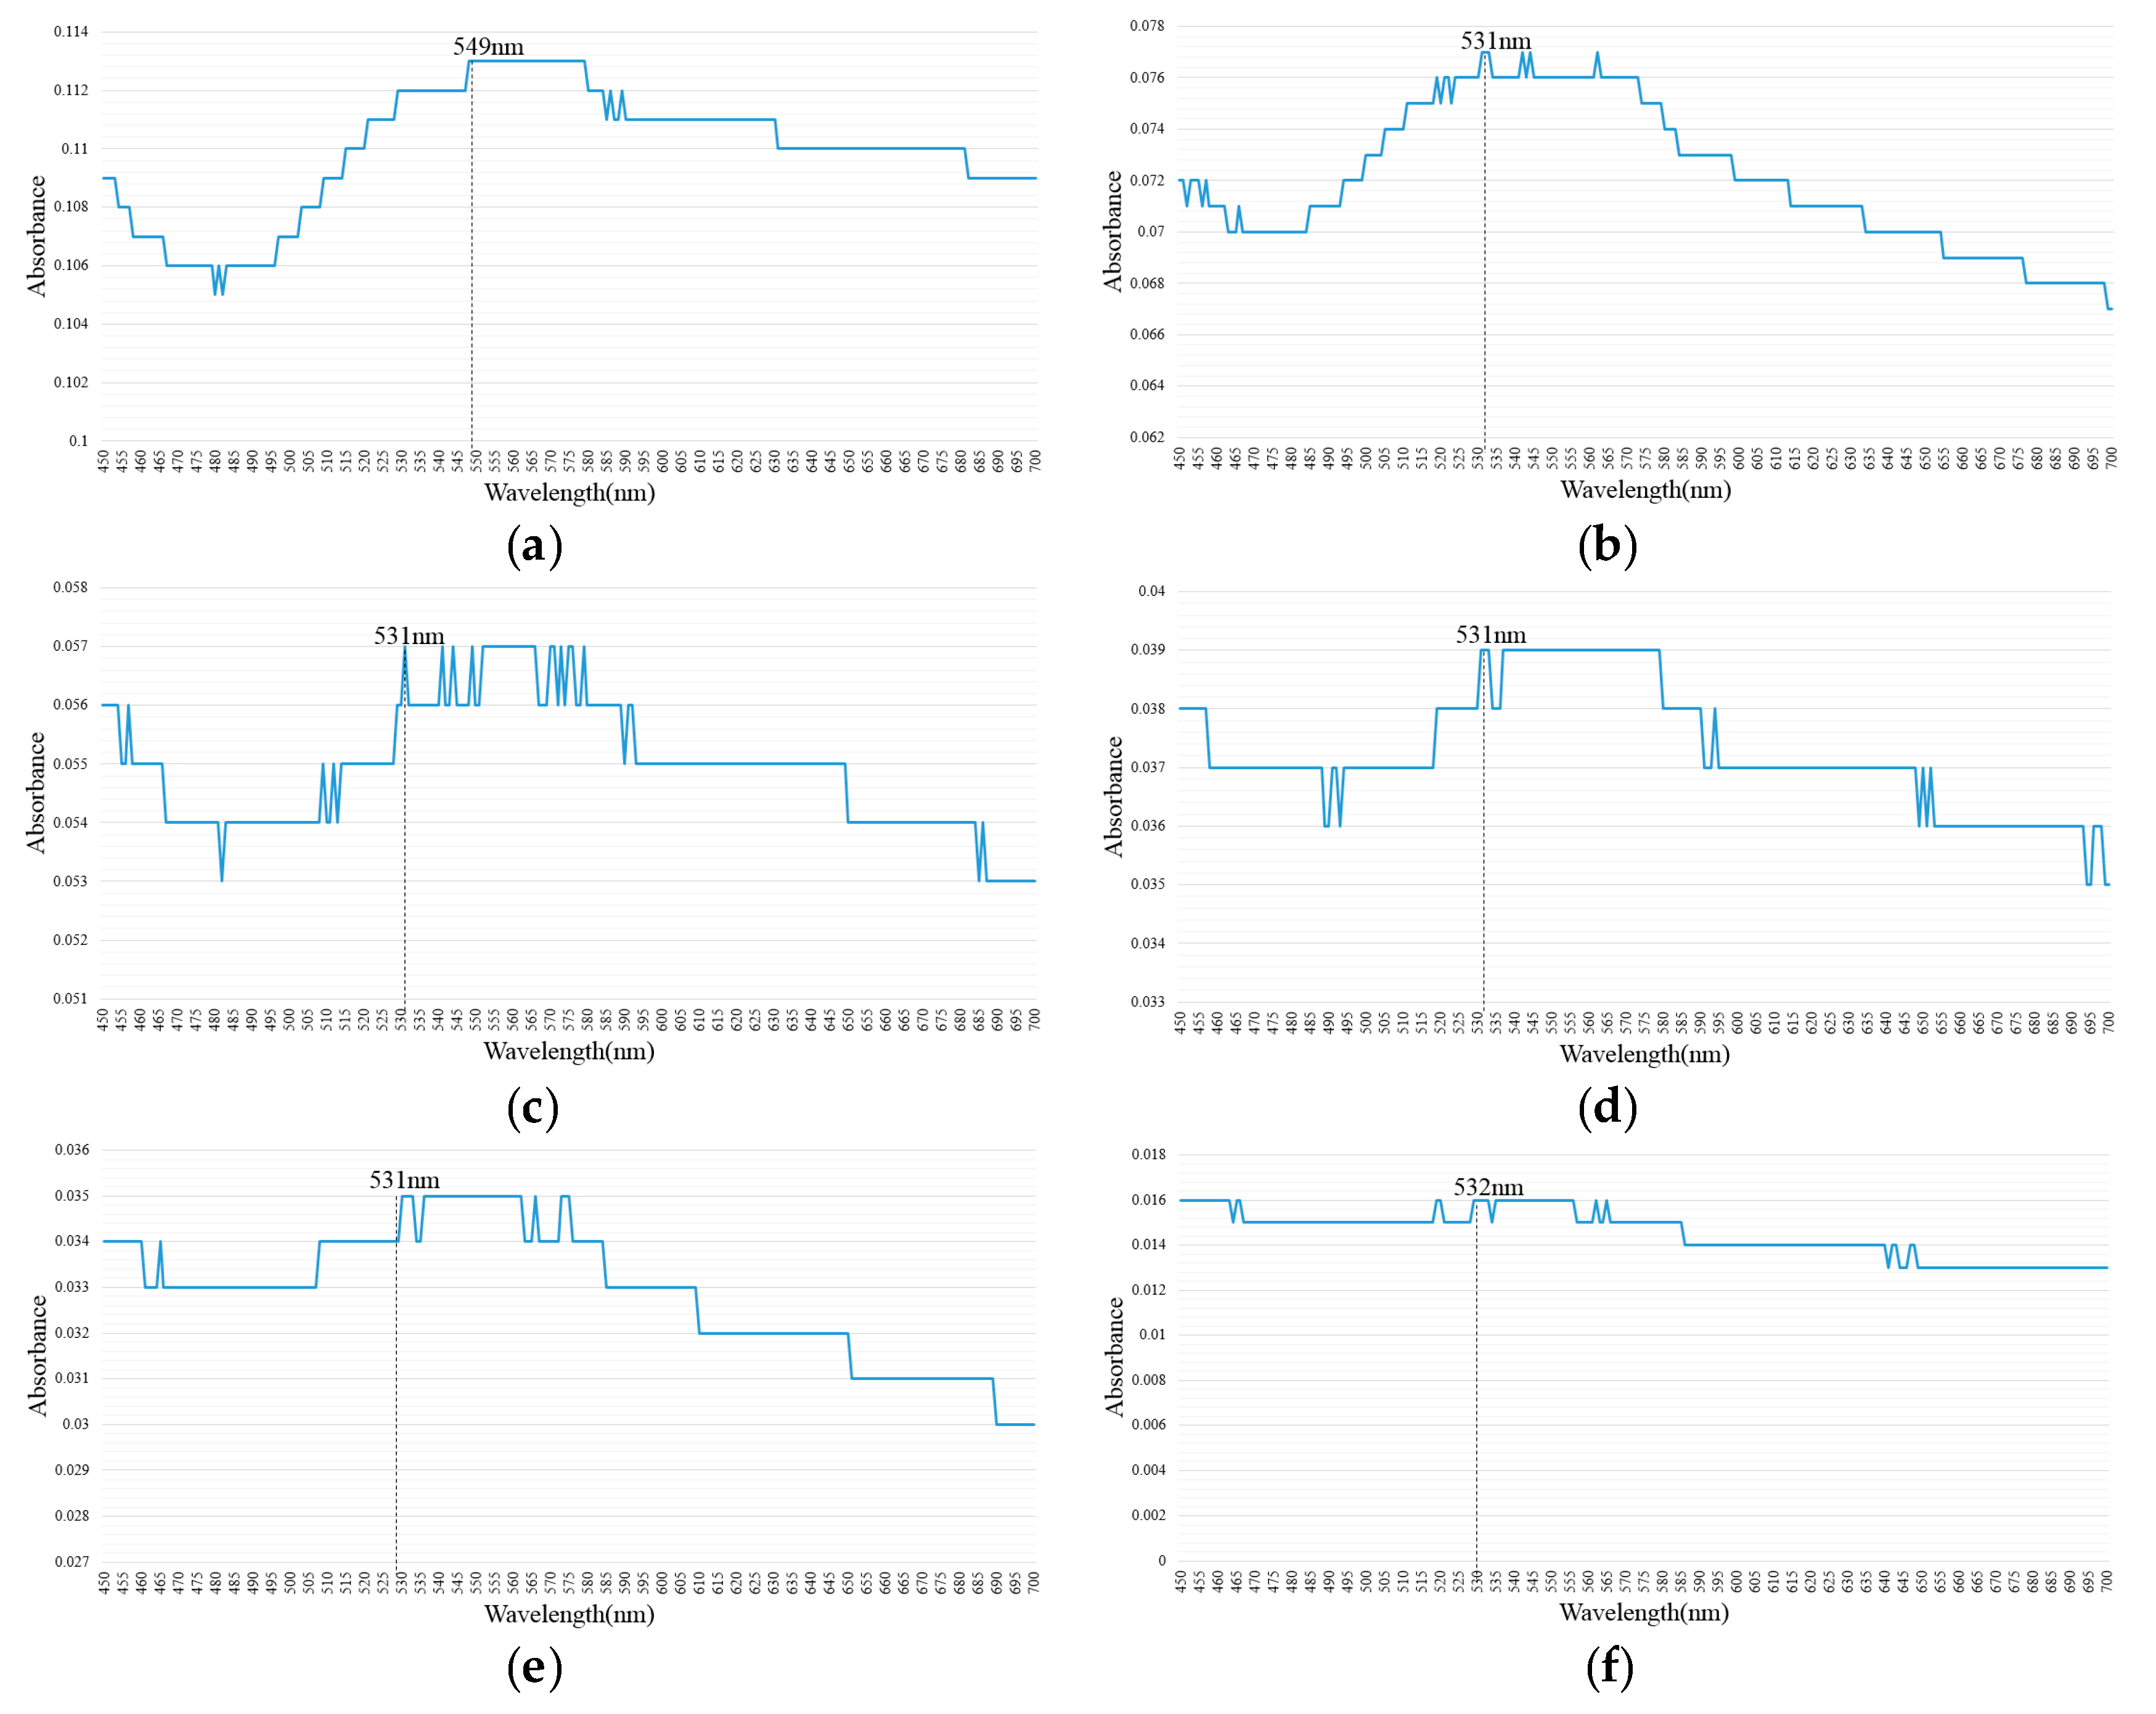
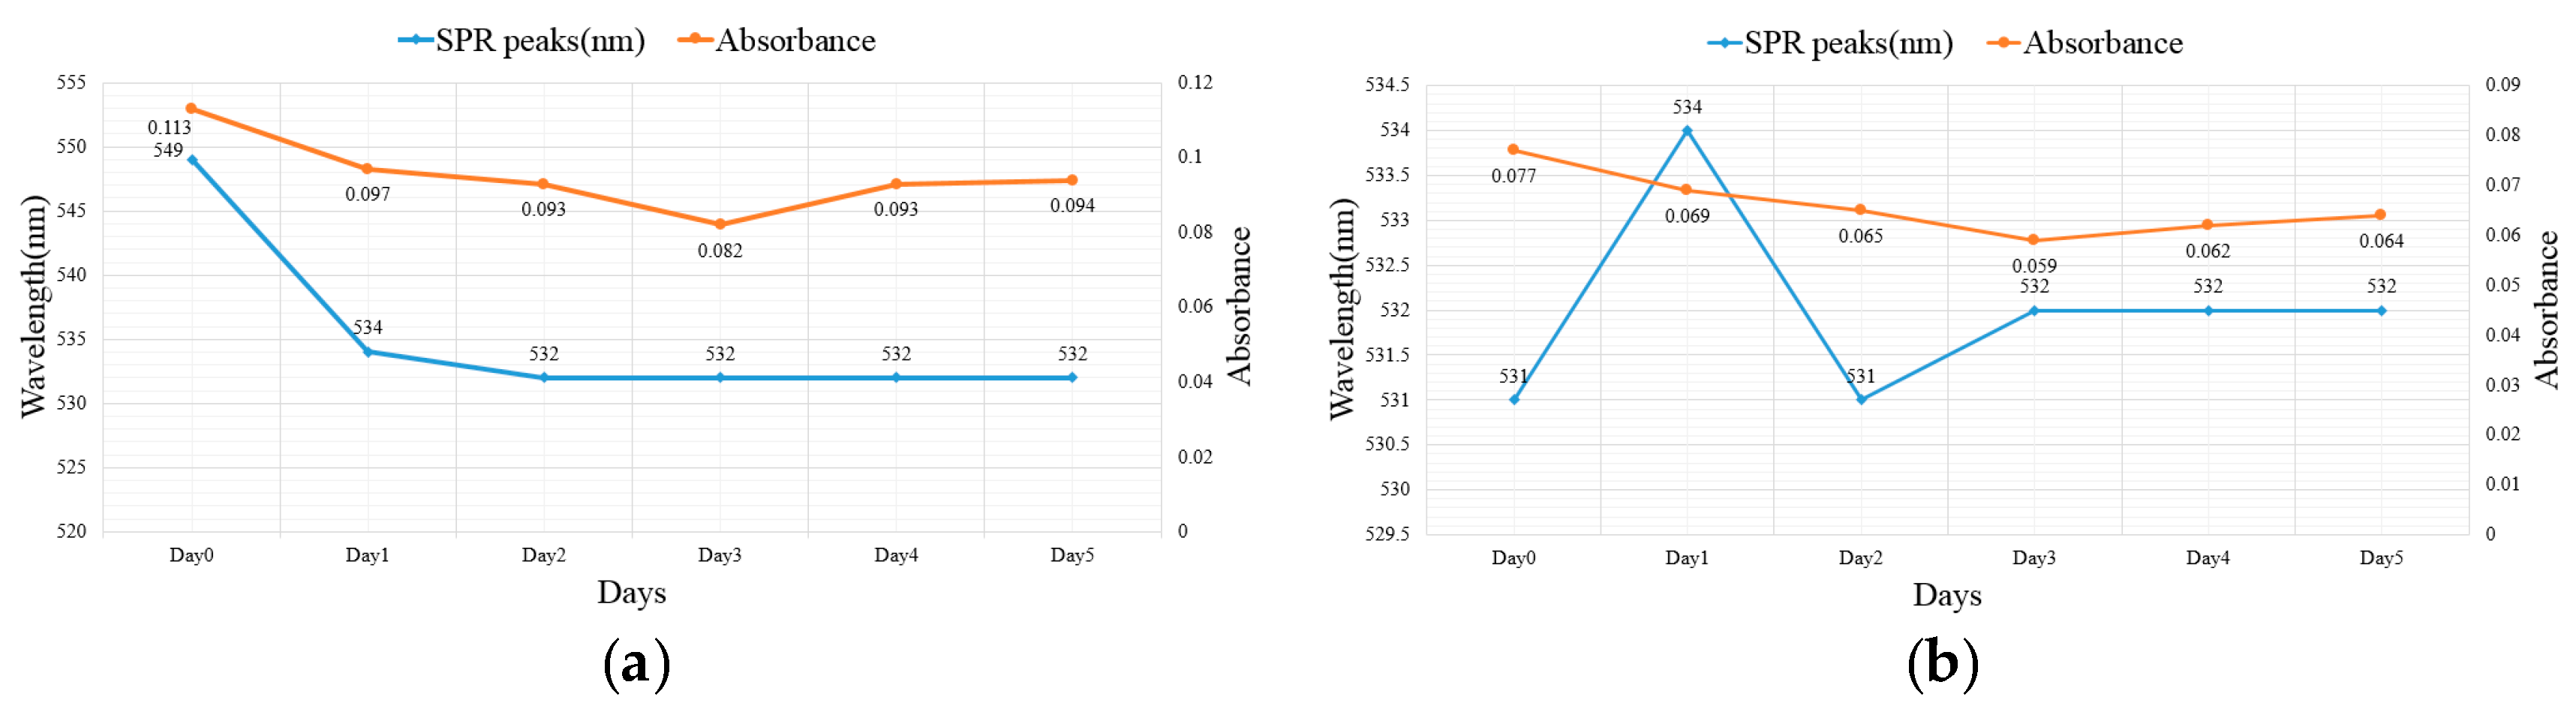
| 10–10 µs | 549 | 0.113 | 532 | 0.094 |
| 20–20 µs | 531 | 0.077 | 532 | 0.064 |
| 30–30 µs | 531 | 0.057 | 533 | 0.042 |
| 40–40 µs | 531 | 0.039 | 532 | 0.028 |
| 50–50 µs | 531 | 0.035 | 533 | 0.026 |
| 100–100 µs | 532 | 0.016 | 532 | 0.011 |
© 2017 by the authors. Licensee MDPI, Basel, Switzerland. This article is an open access article distributed under the terms and conditions of the Creative Commons Attribution (CC BY) license (http://creativecommons.org/licenses/by/4.0/).
Share and Cite
Tseng, K.-H.; Chung, M.-Y.; Chang, C.-Y. Parameters for Fabricating Nano-Au Colloids through the Electric Spark Discharge Method with Micro-Electrical Discharge Machining. Nanomaterials 2017, 7, 133. https://doi.org/10.3390/nano7060133
Tseng K-H, Chung M-Y, Chang C-Y. Parameters for Fabricating Nano-Au Colloids through the Electric Spark Discharge Method with Micro-Electrical Discharge Machining. Nanomaterials. 2017; 7(6):133. https://doi.org/10.3390/nano7060133
Chicago/Turabian StyleTseng, Kuo-Hsiung, Meng-Yun Chung, and Chaur-Yang Chang. 2017. "Parameters for Fabricating Nano-Au Colloids through the Electric Spark Discharge Method with Micro-Electrical Discharge Machining" Nanomaterials 7, no. 6: 133. https://doi.org/10.3390/nano7060133