
Impact of the Precursor on the Physicochemical Properties and Photoactivity of TiO2 Nanoparticles Produced in Supercritical CO2

Abstract
:1. Introduction
2. Methodology
2.1. Chemicals
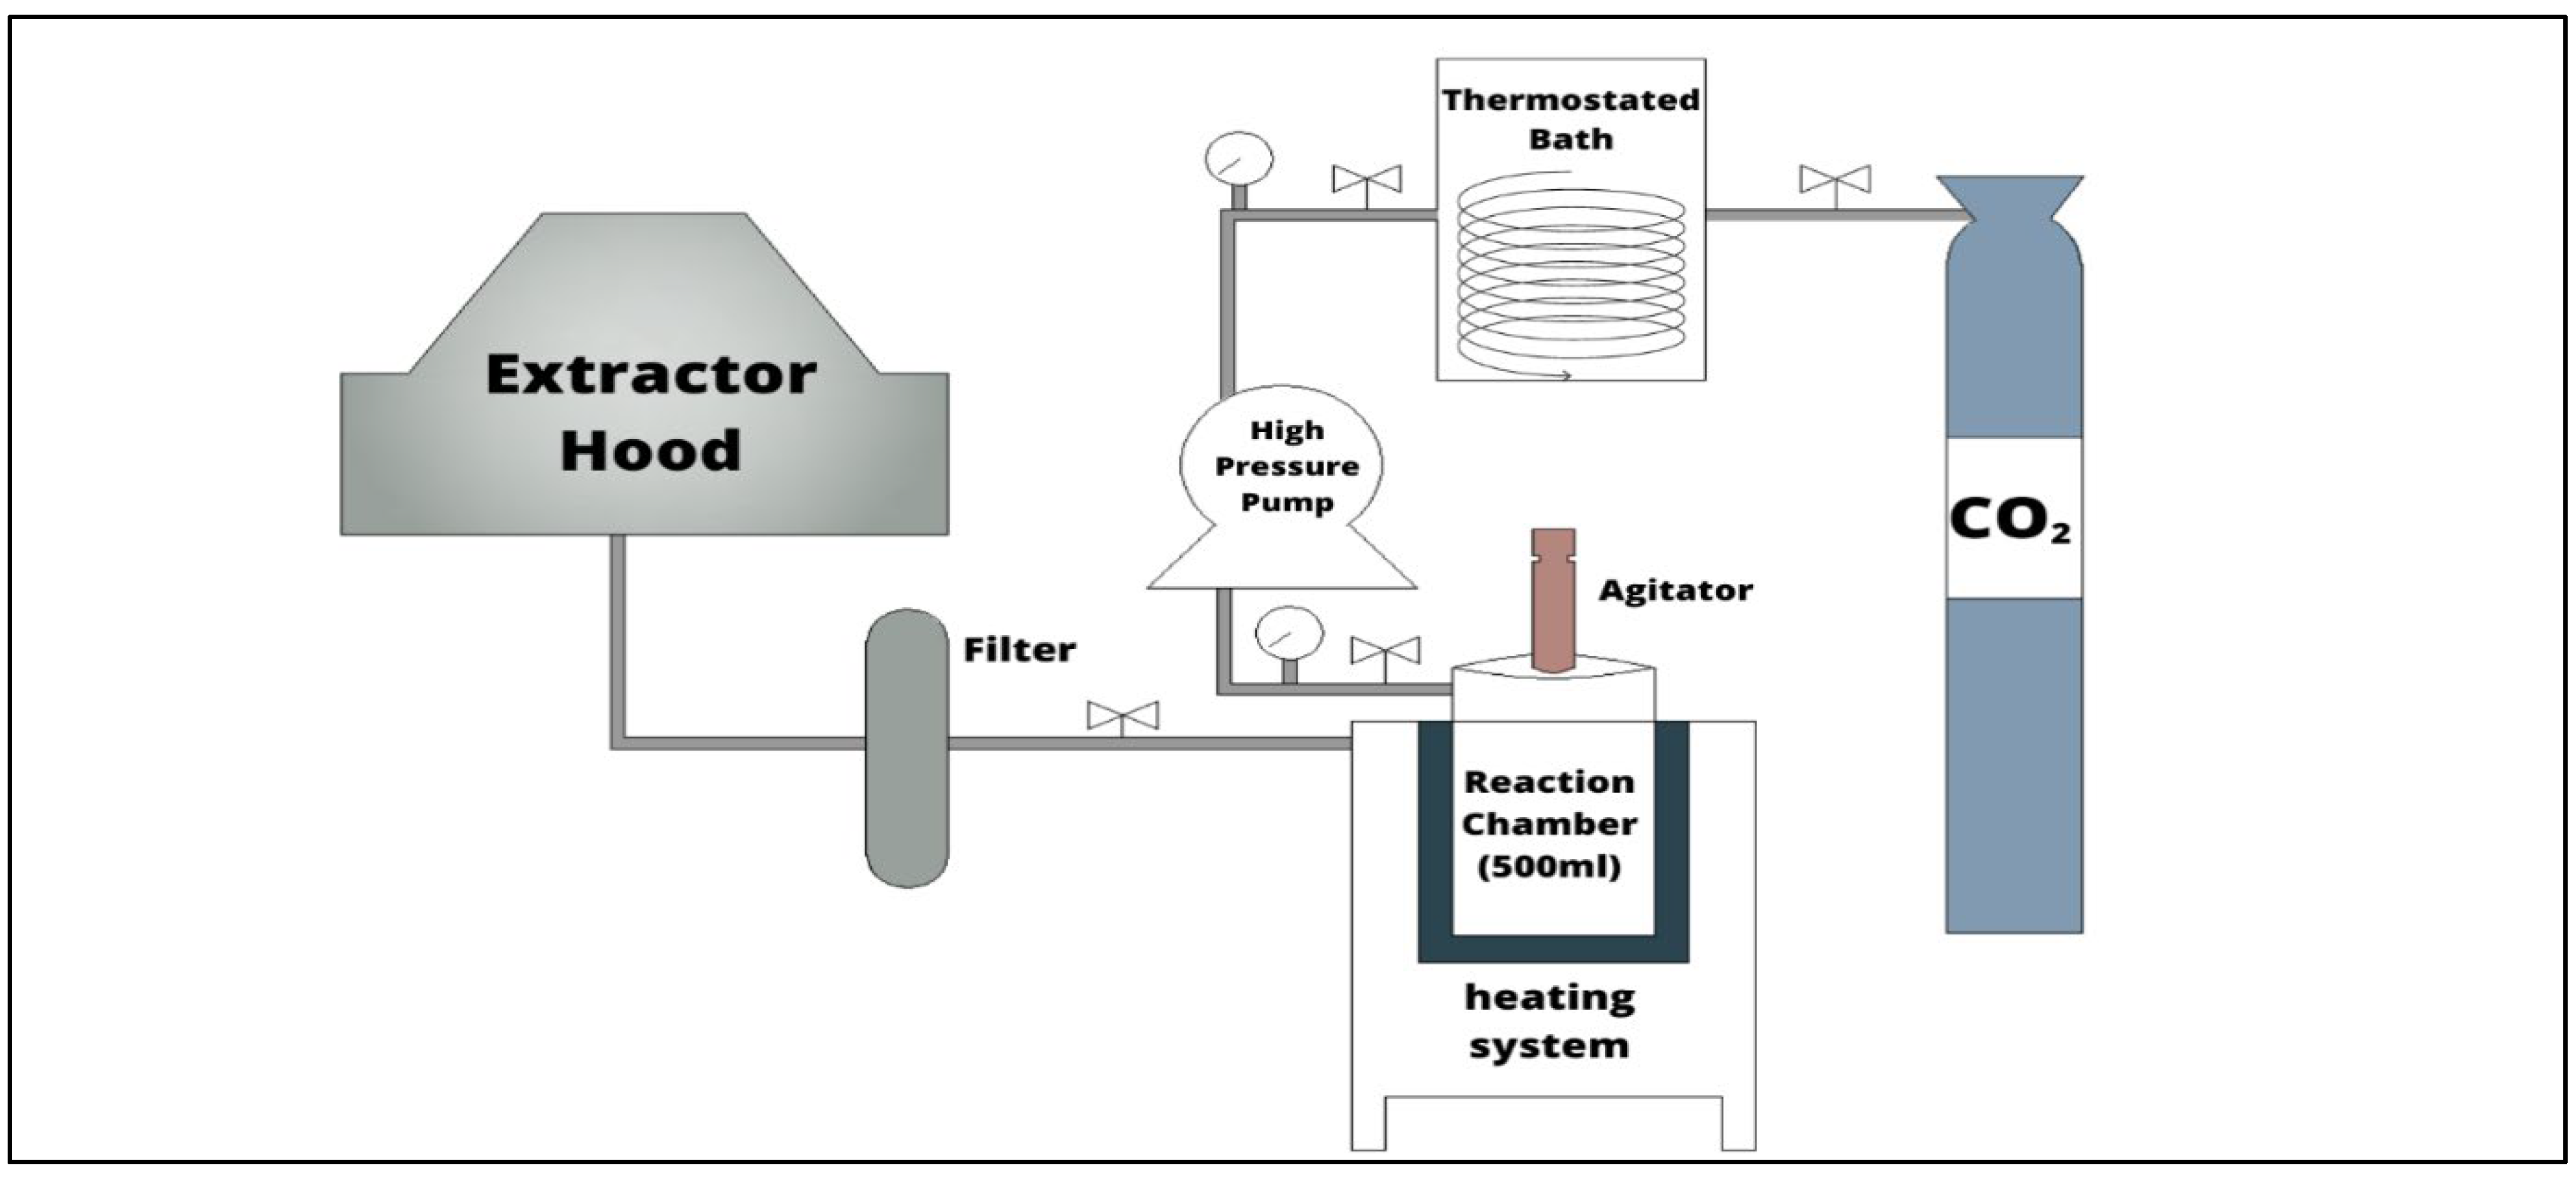
2.2. TiO2 Synthesis
2.3. TiO2 Characterization
2.4. Photocatalytic Reaction Test
3. Results
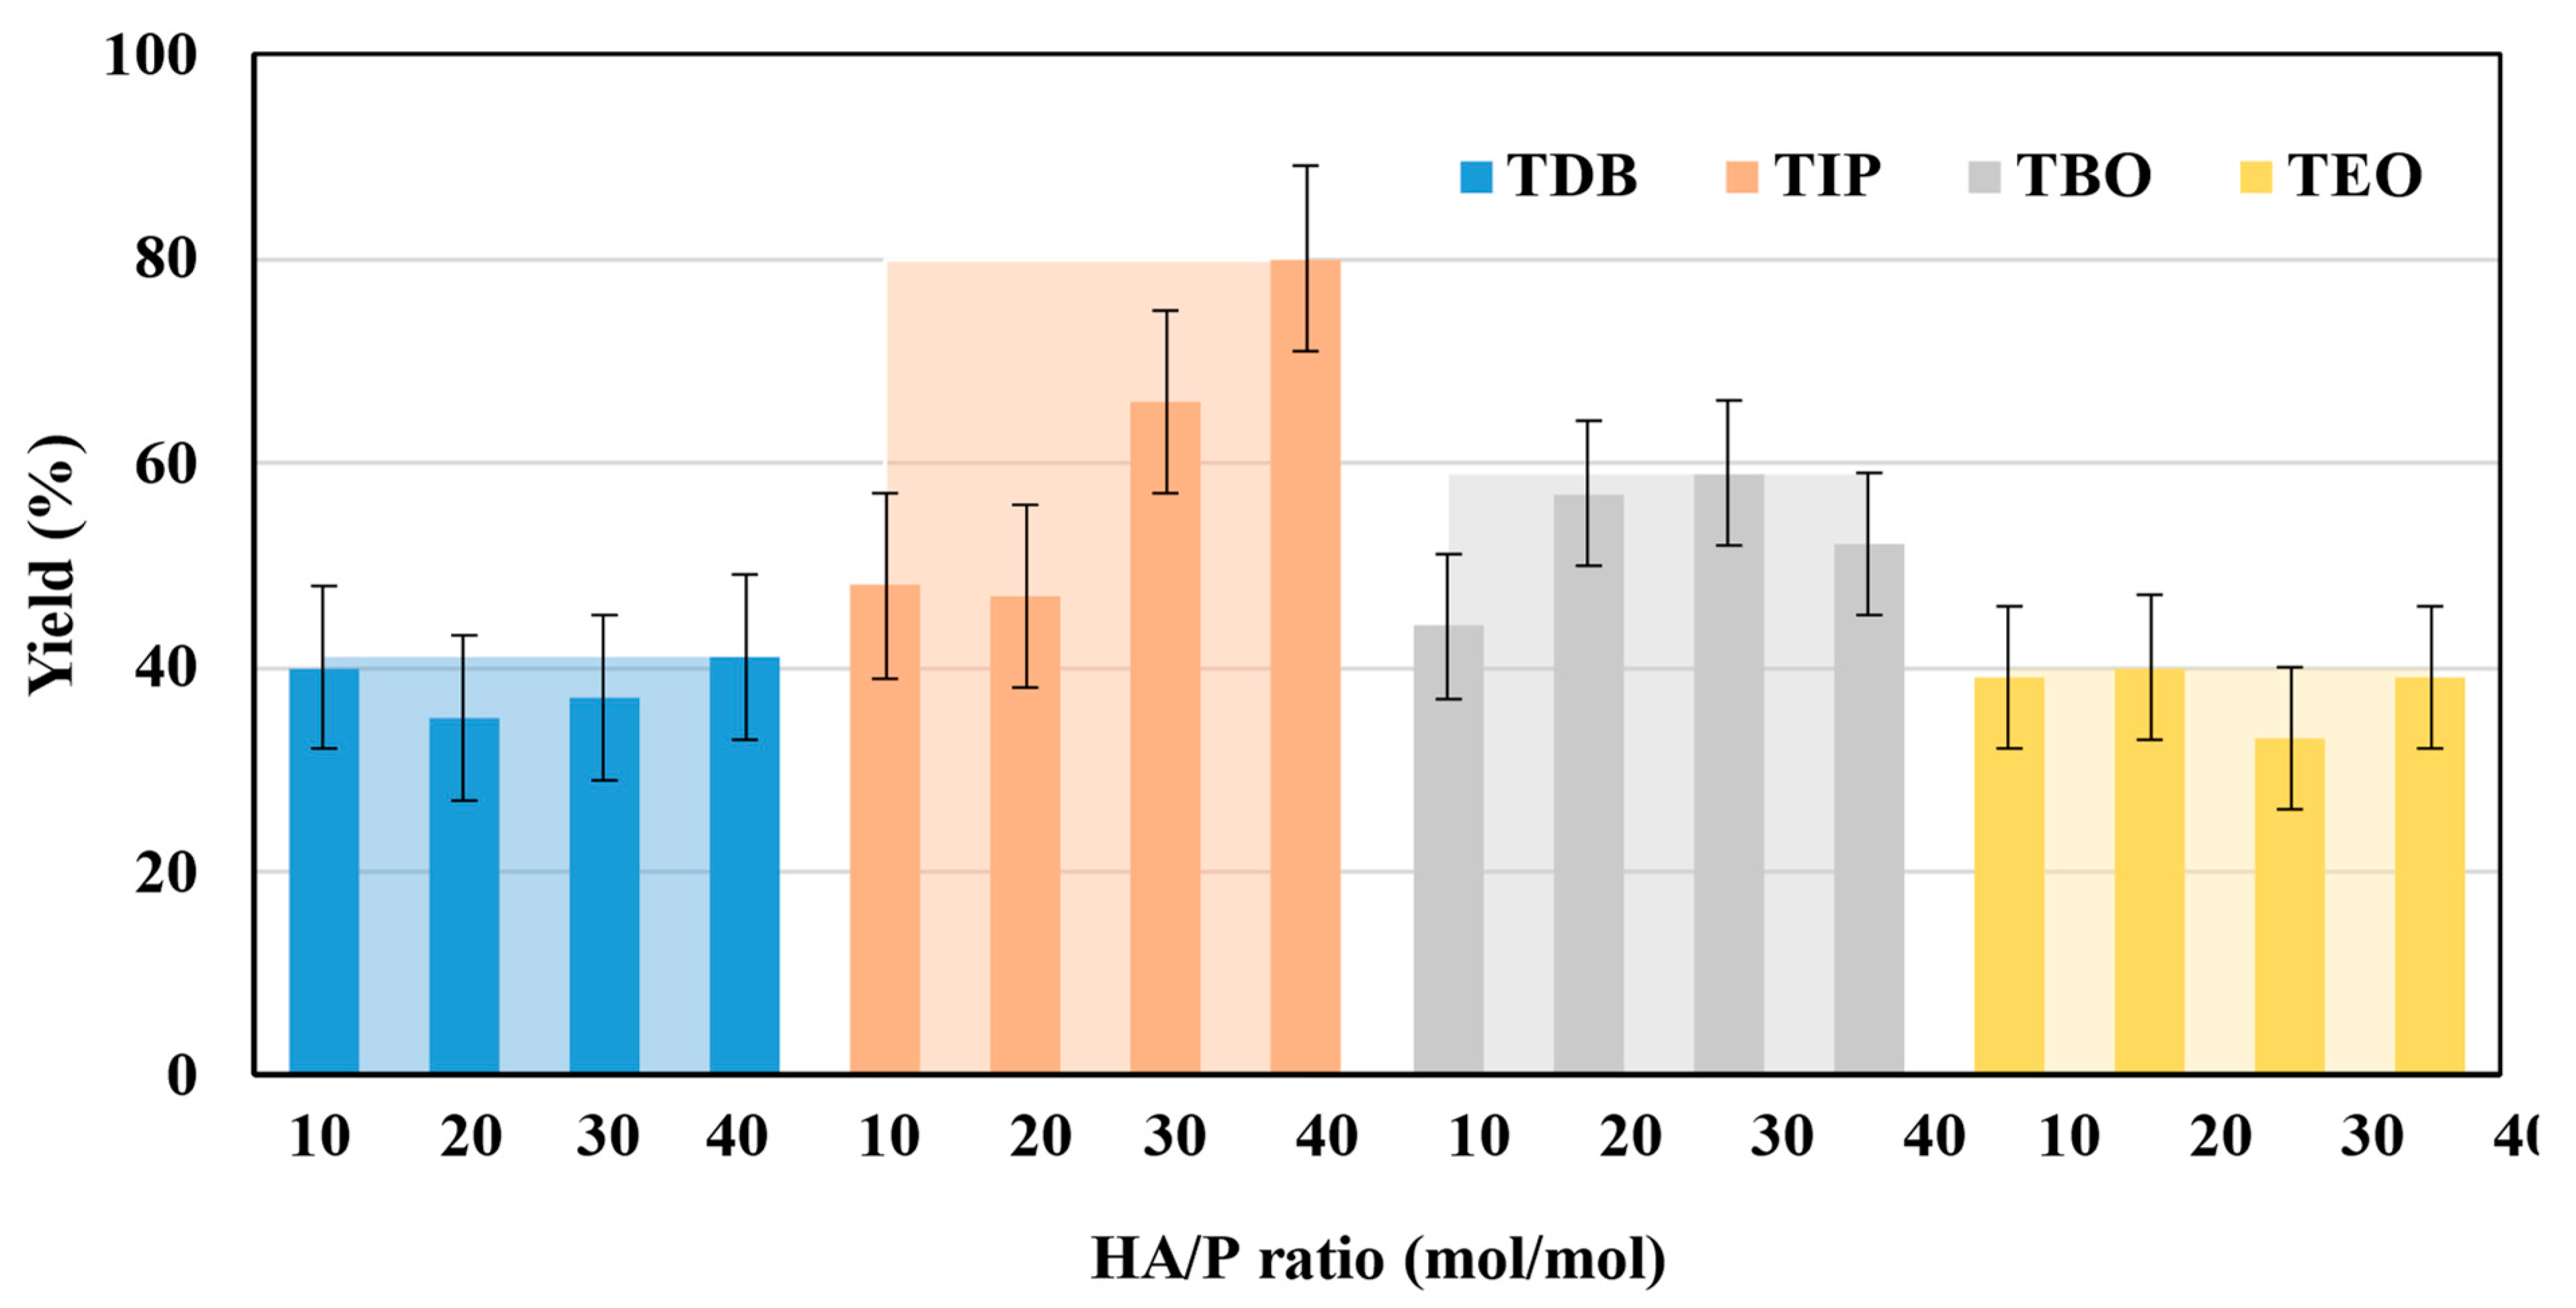
3.1. Synthesis Yield
3.2. TiO2 Physicochemical Characteristics
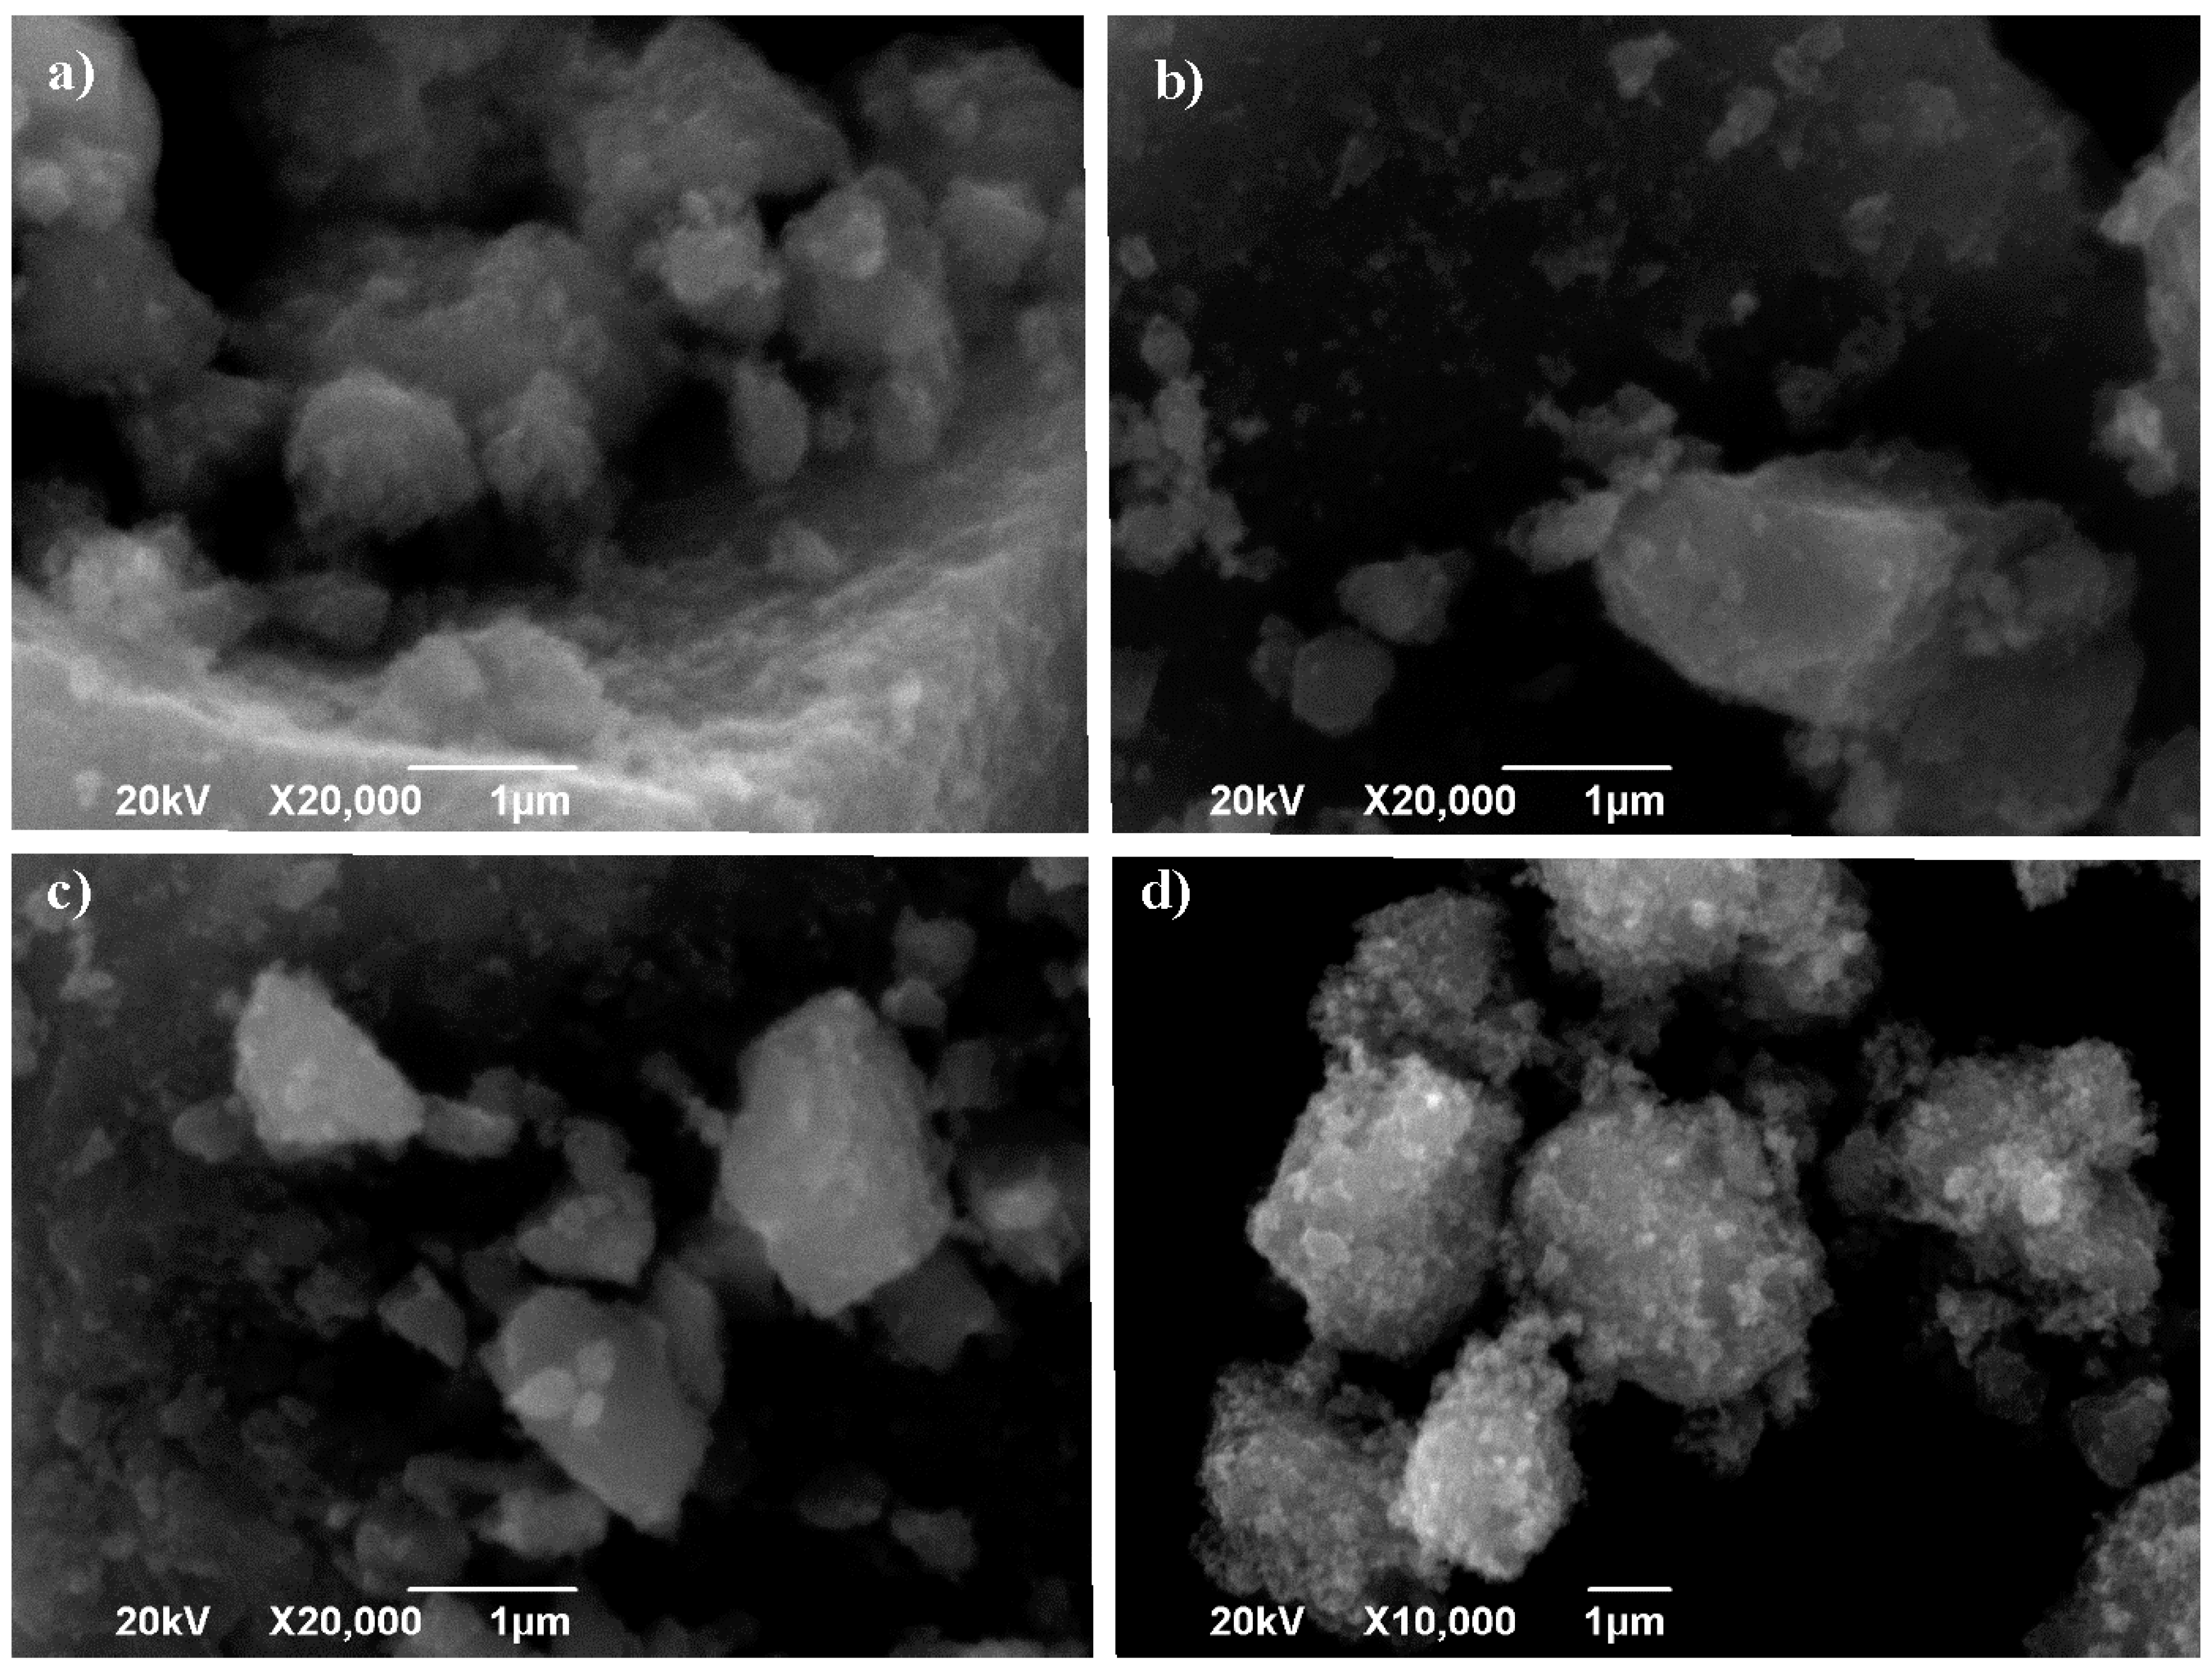
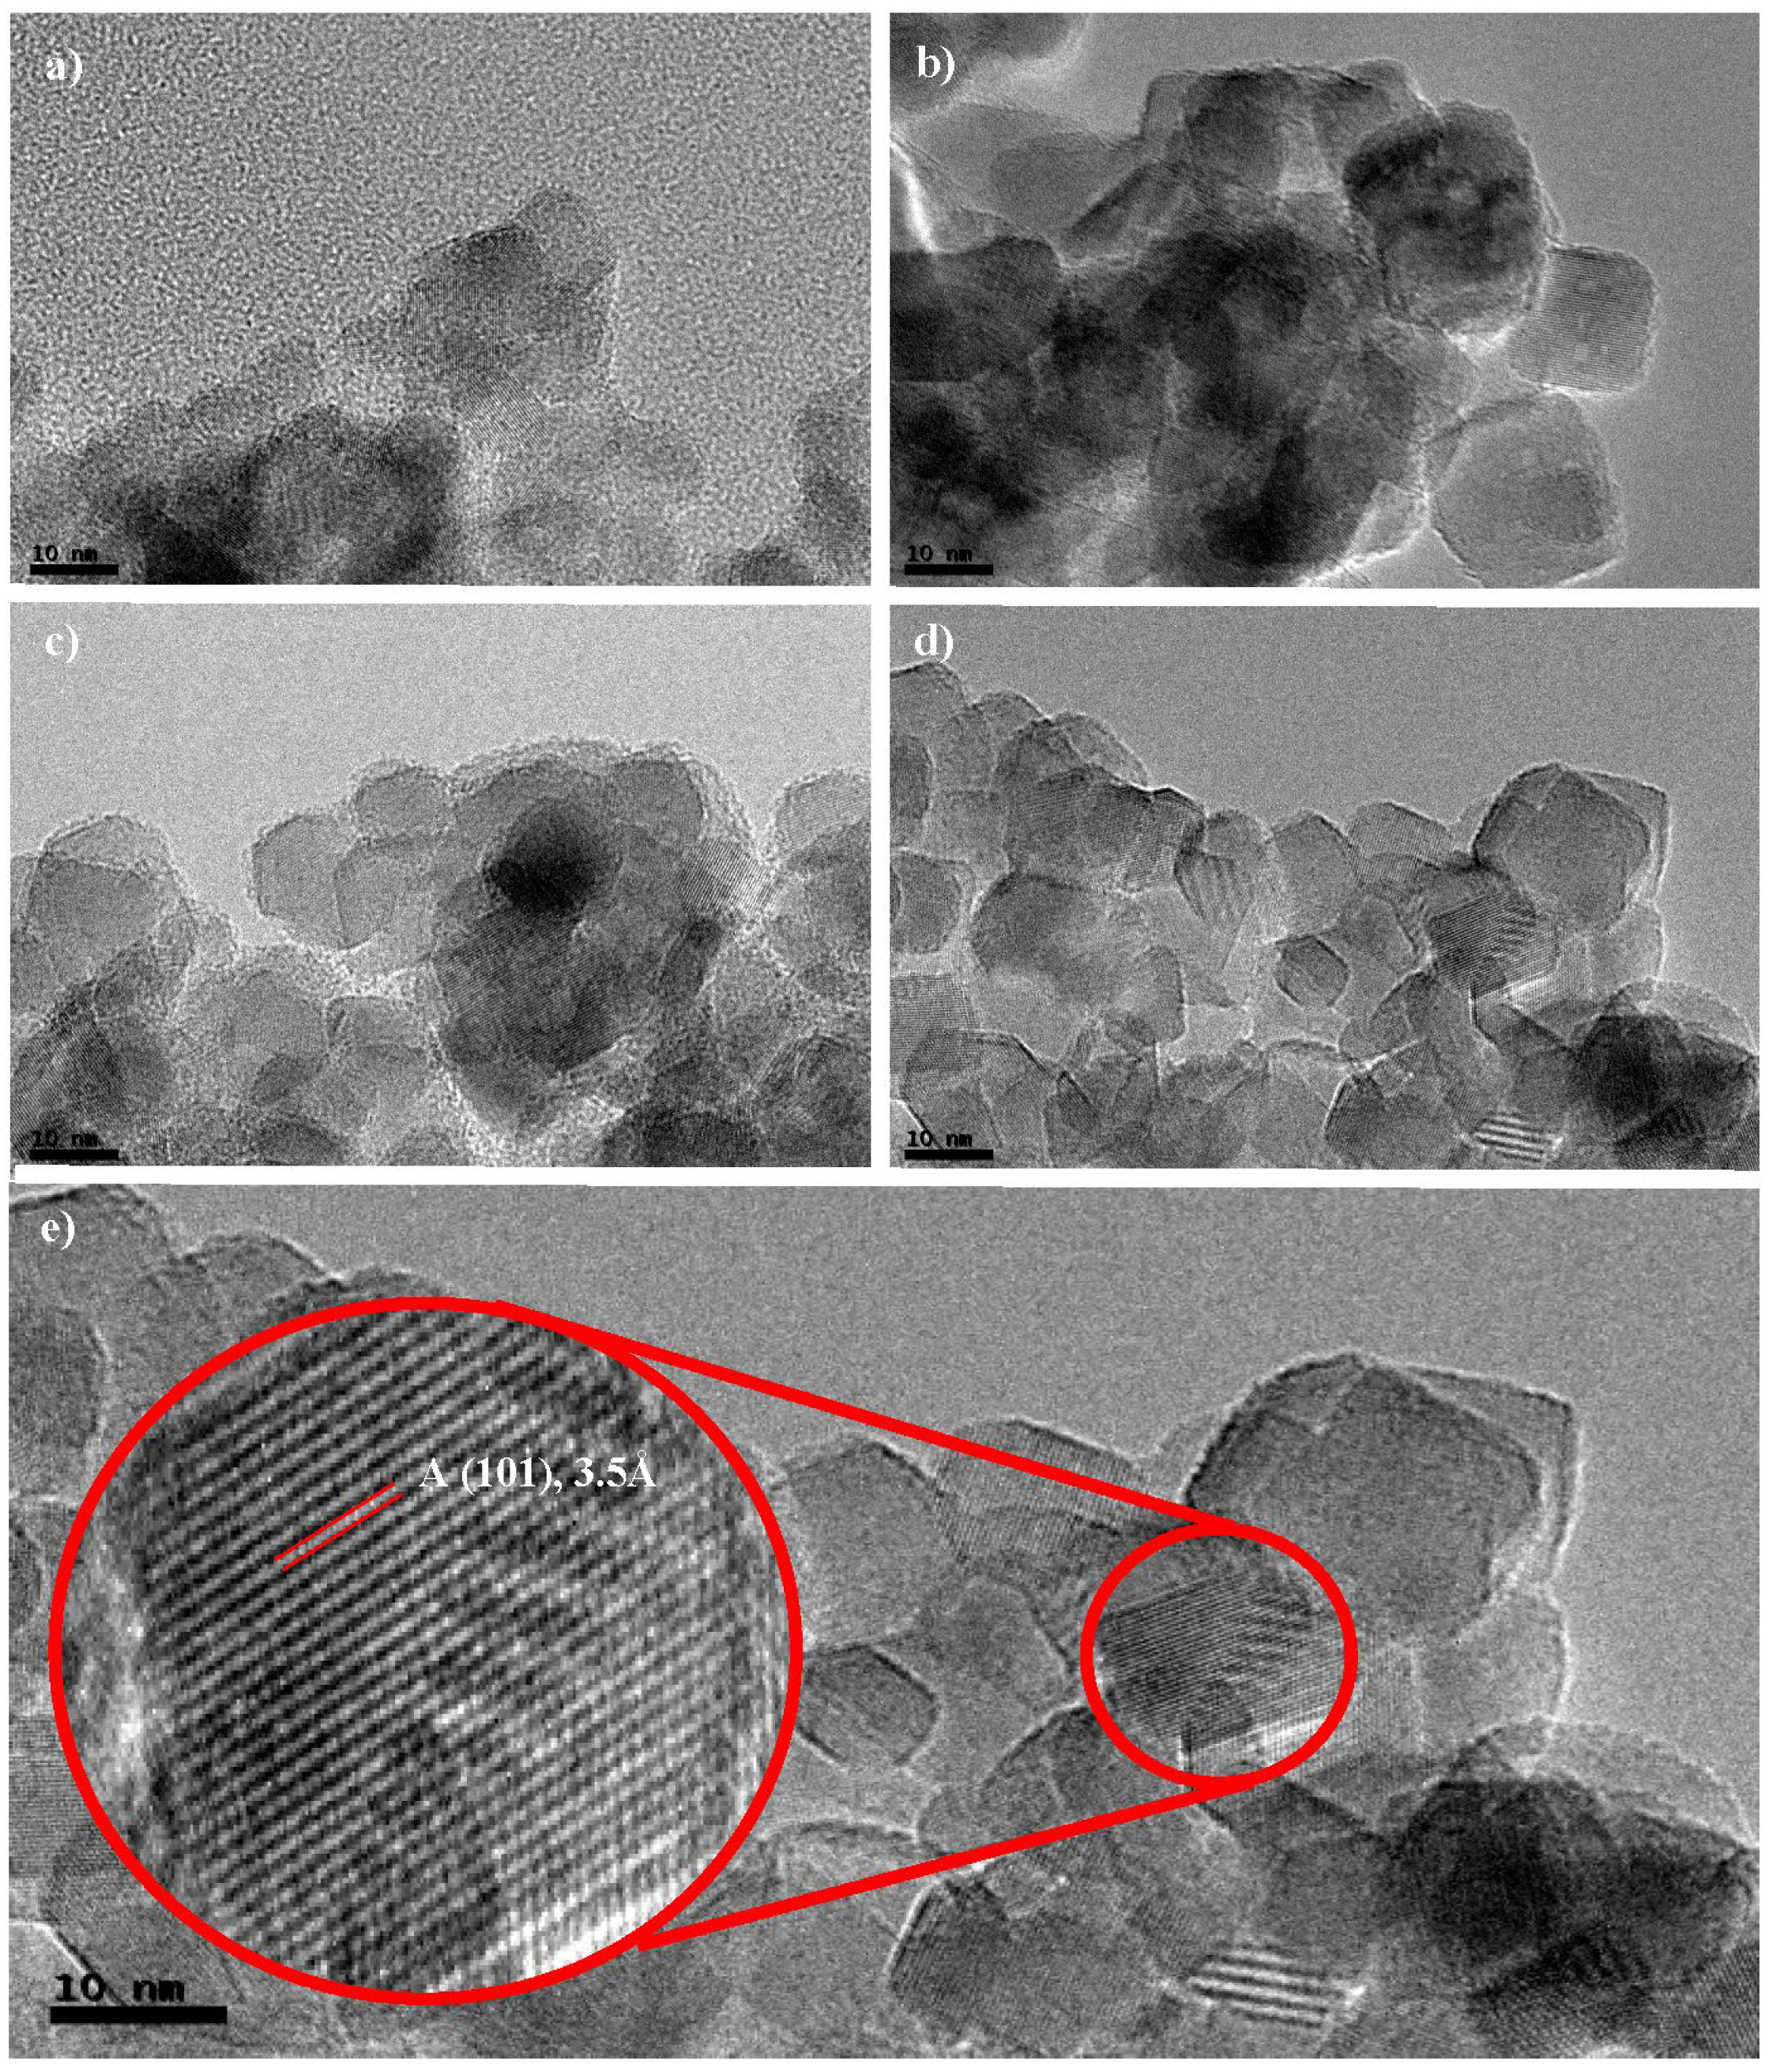
3.2.1. SEM/TEM
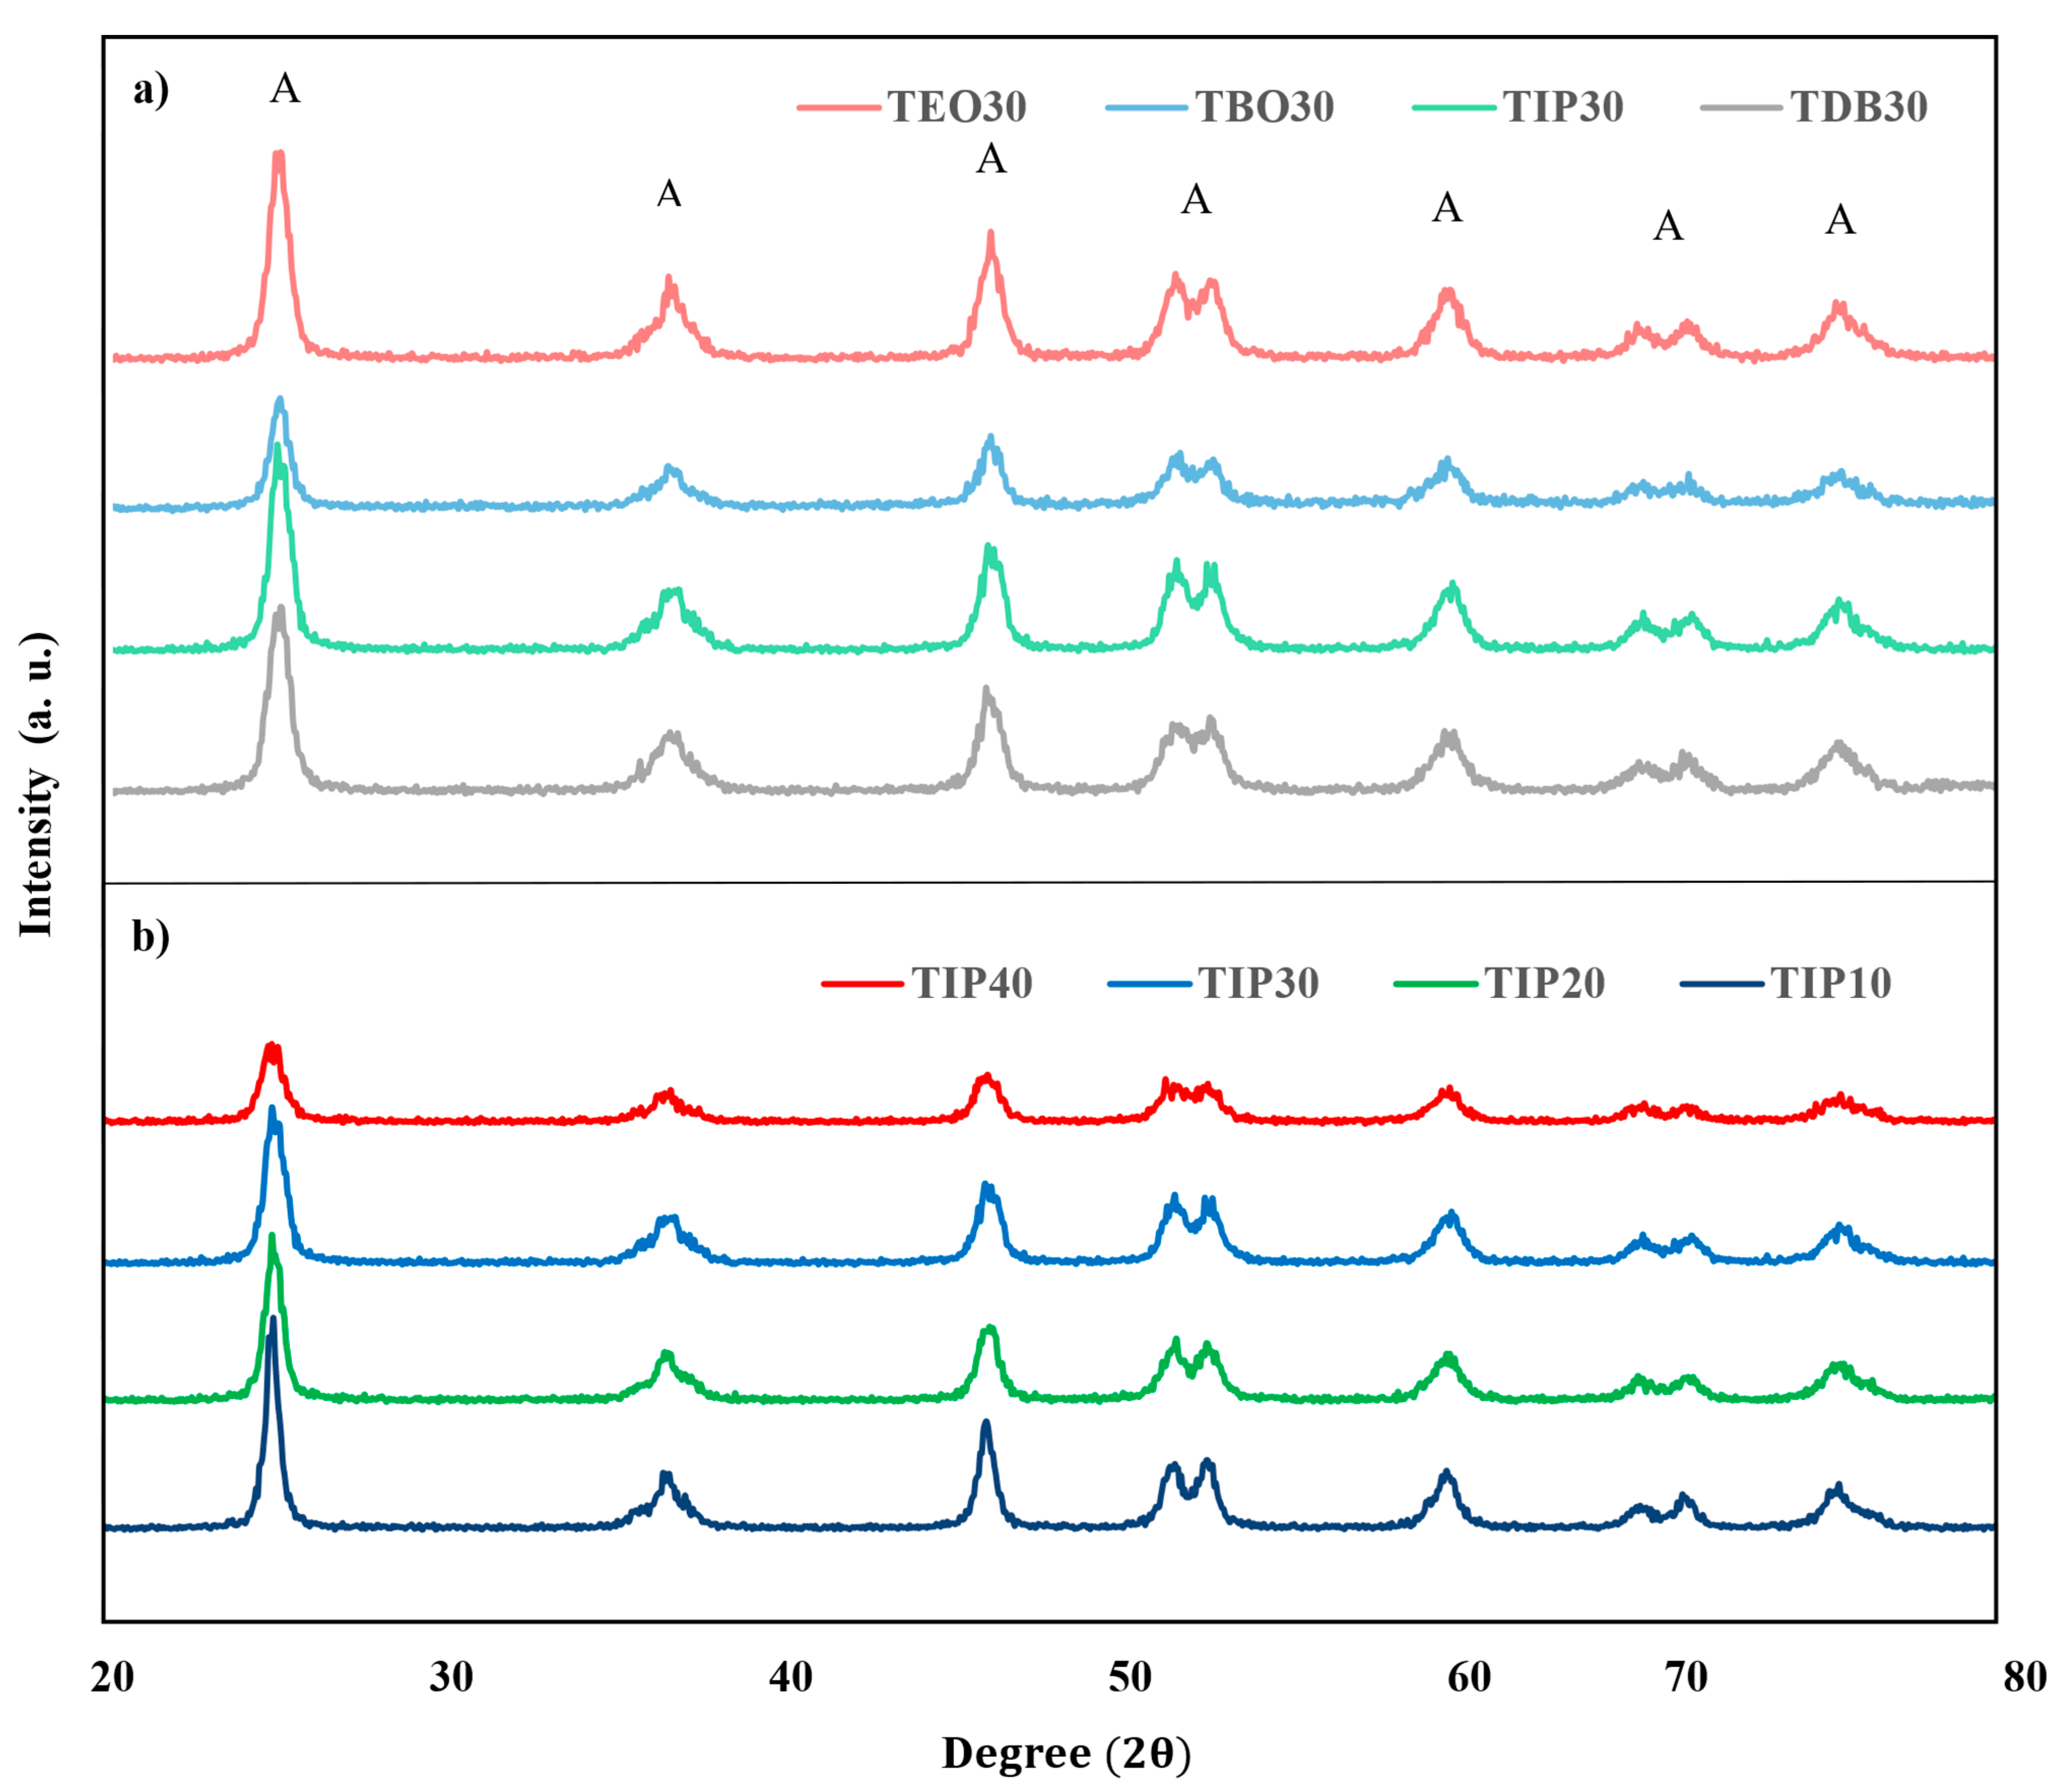
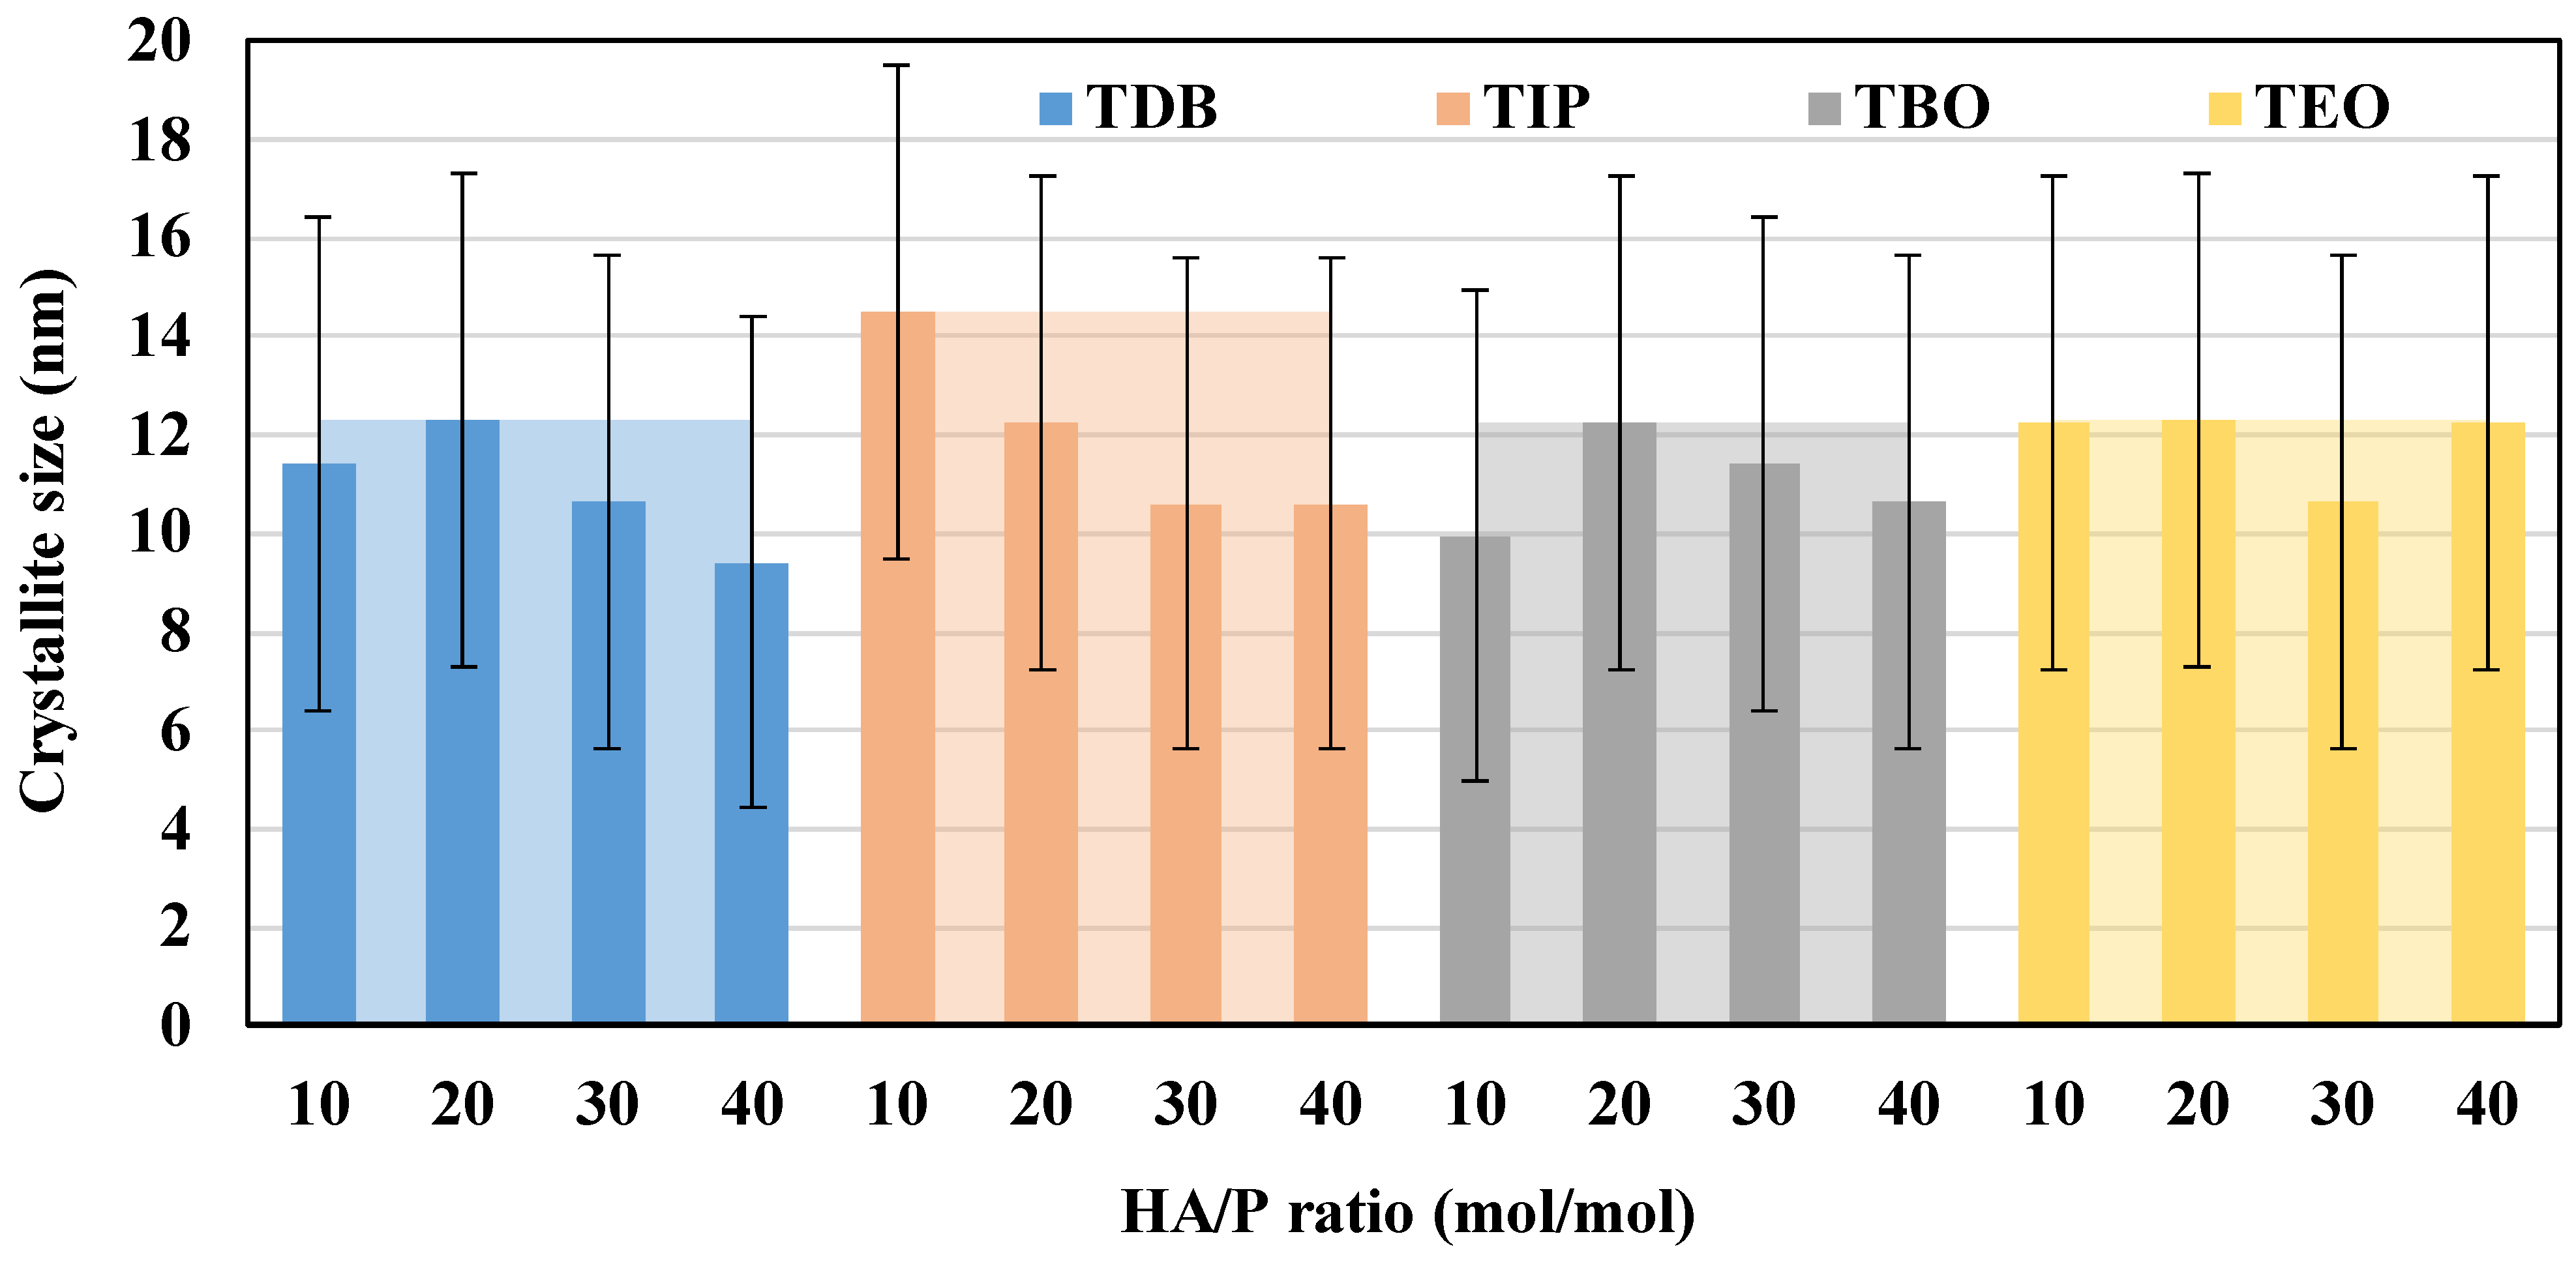
3.2.2. XRD
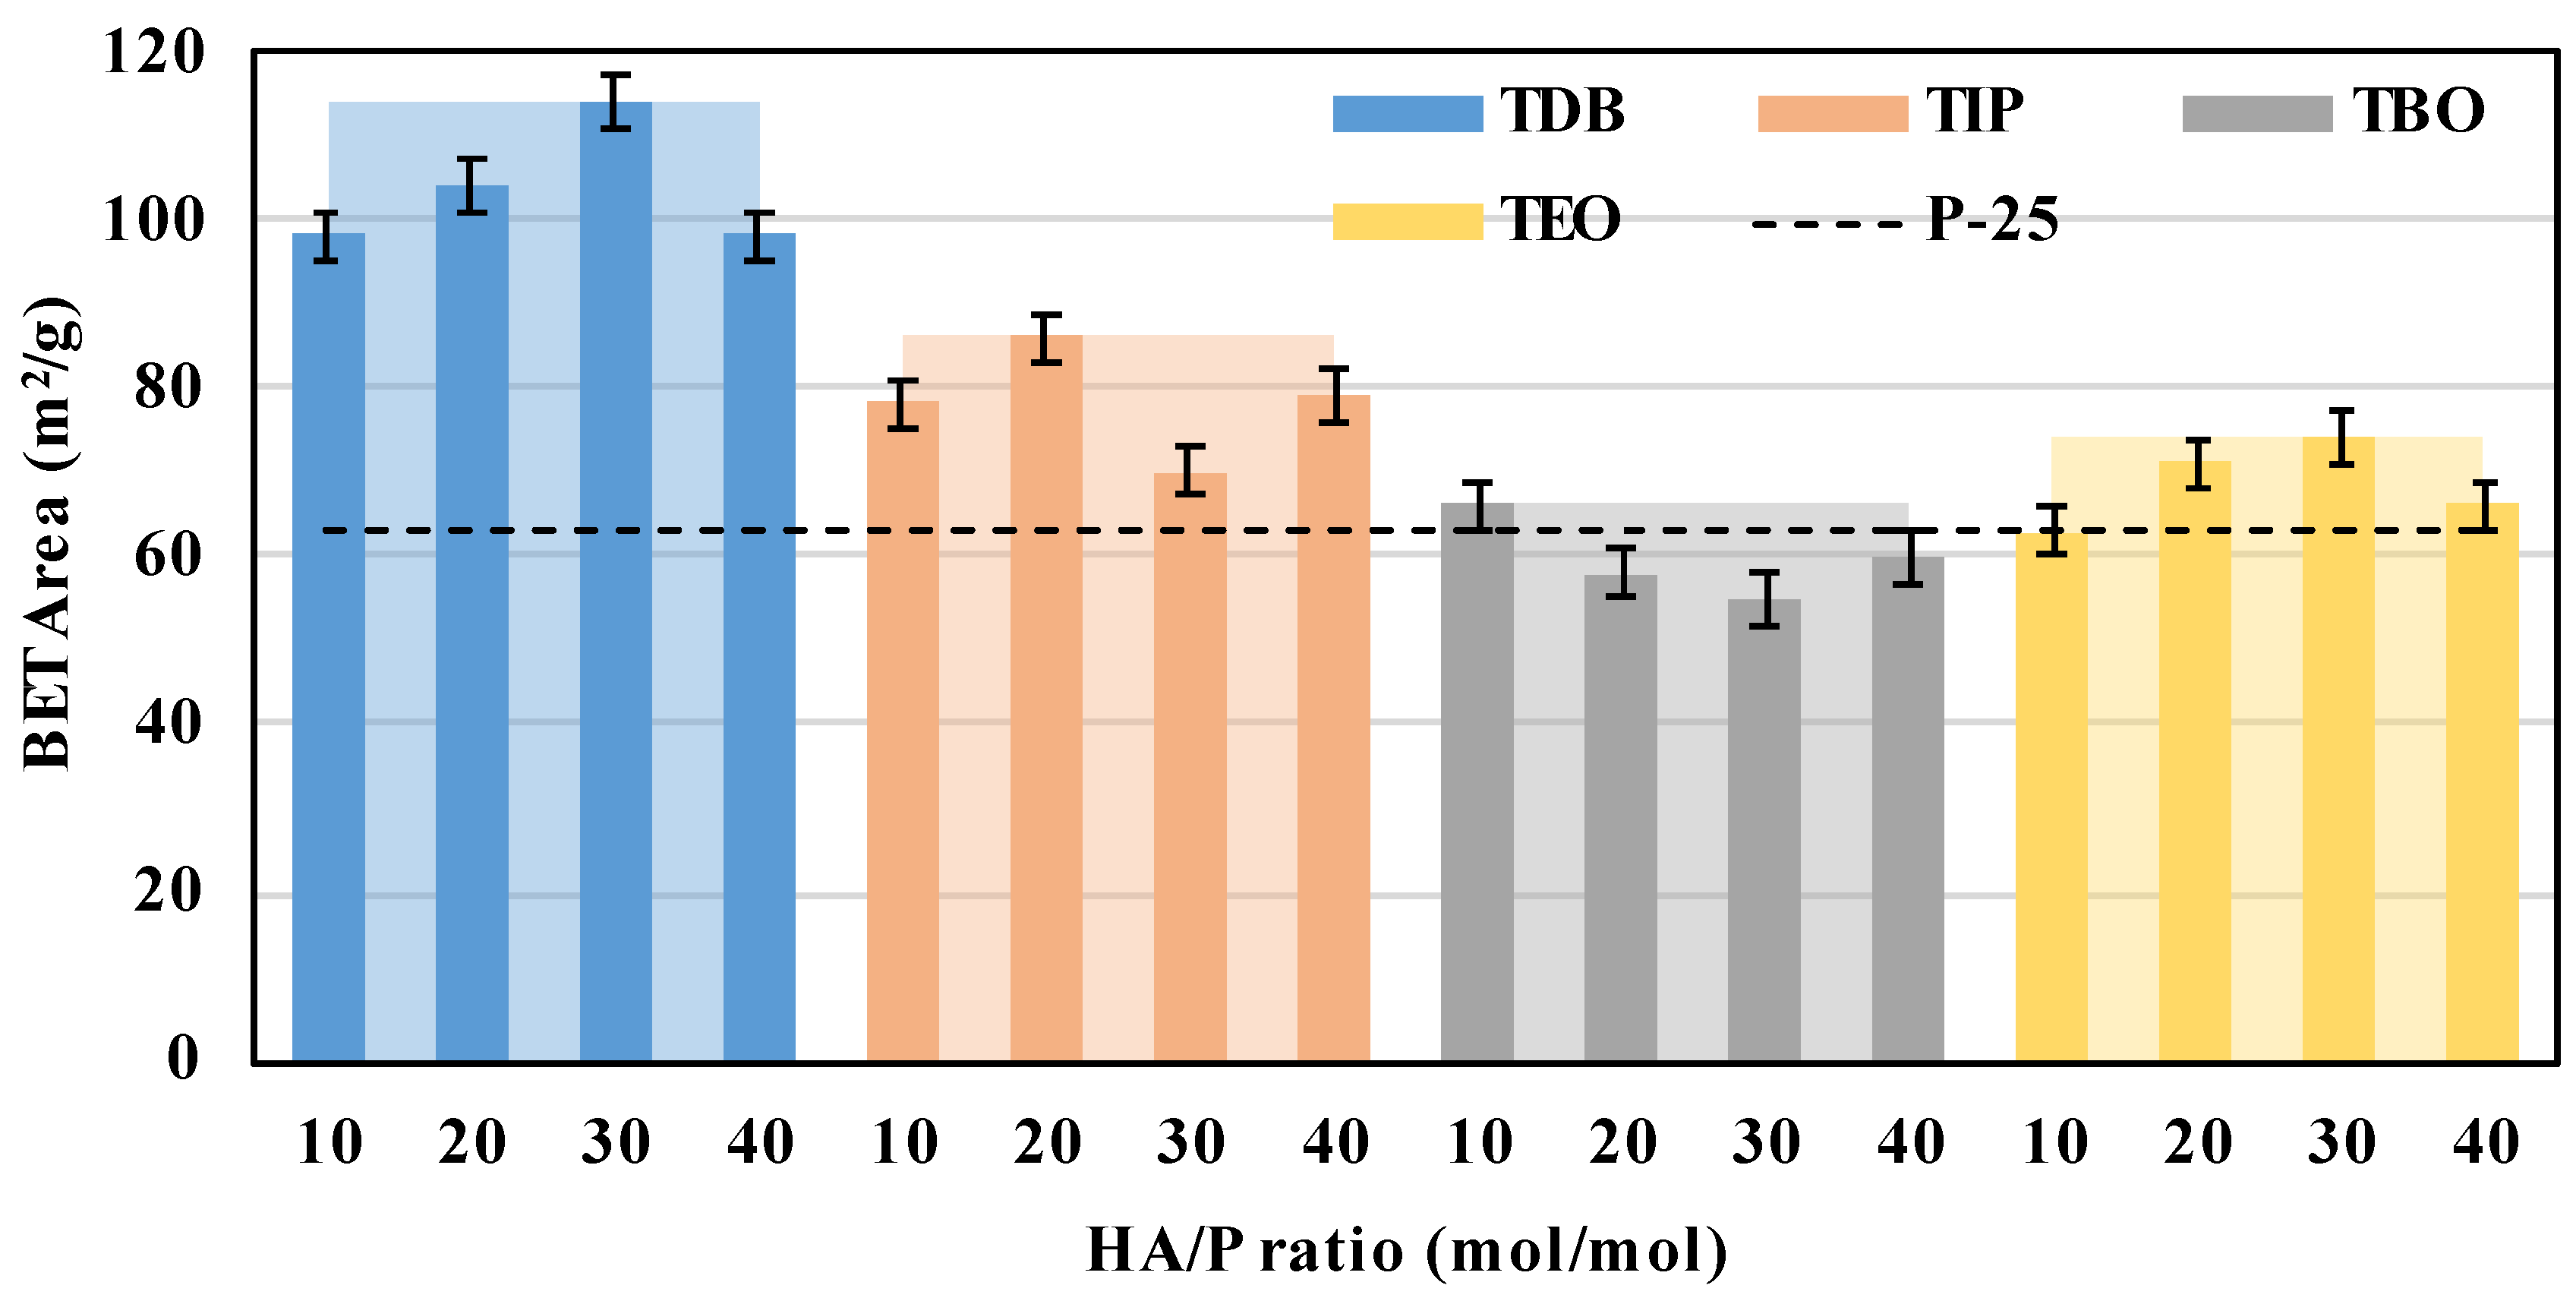
3.2.3. BET
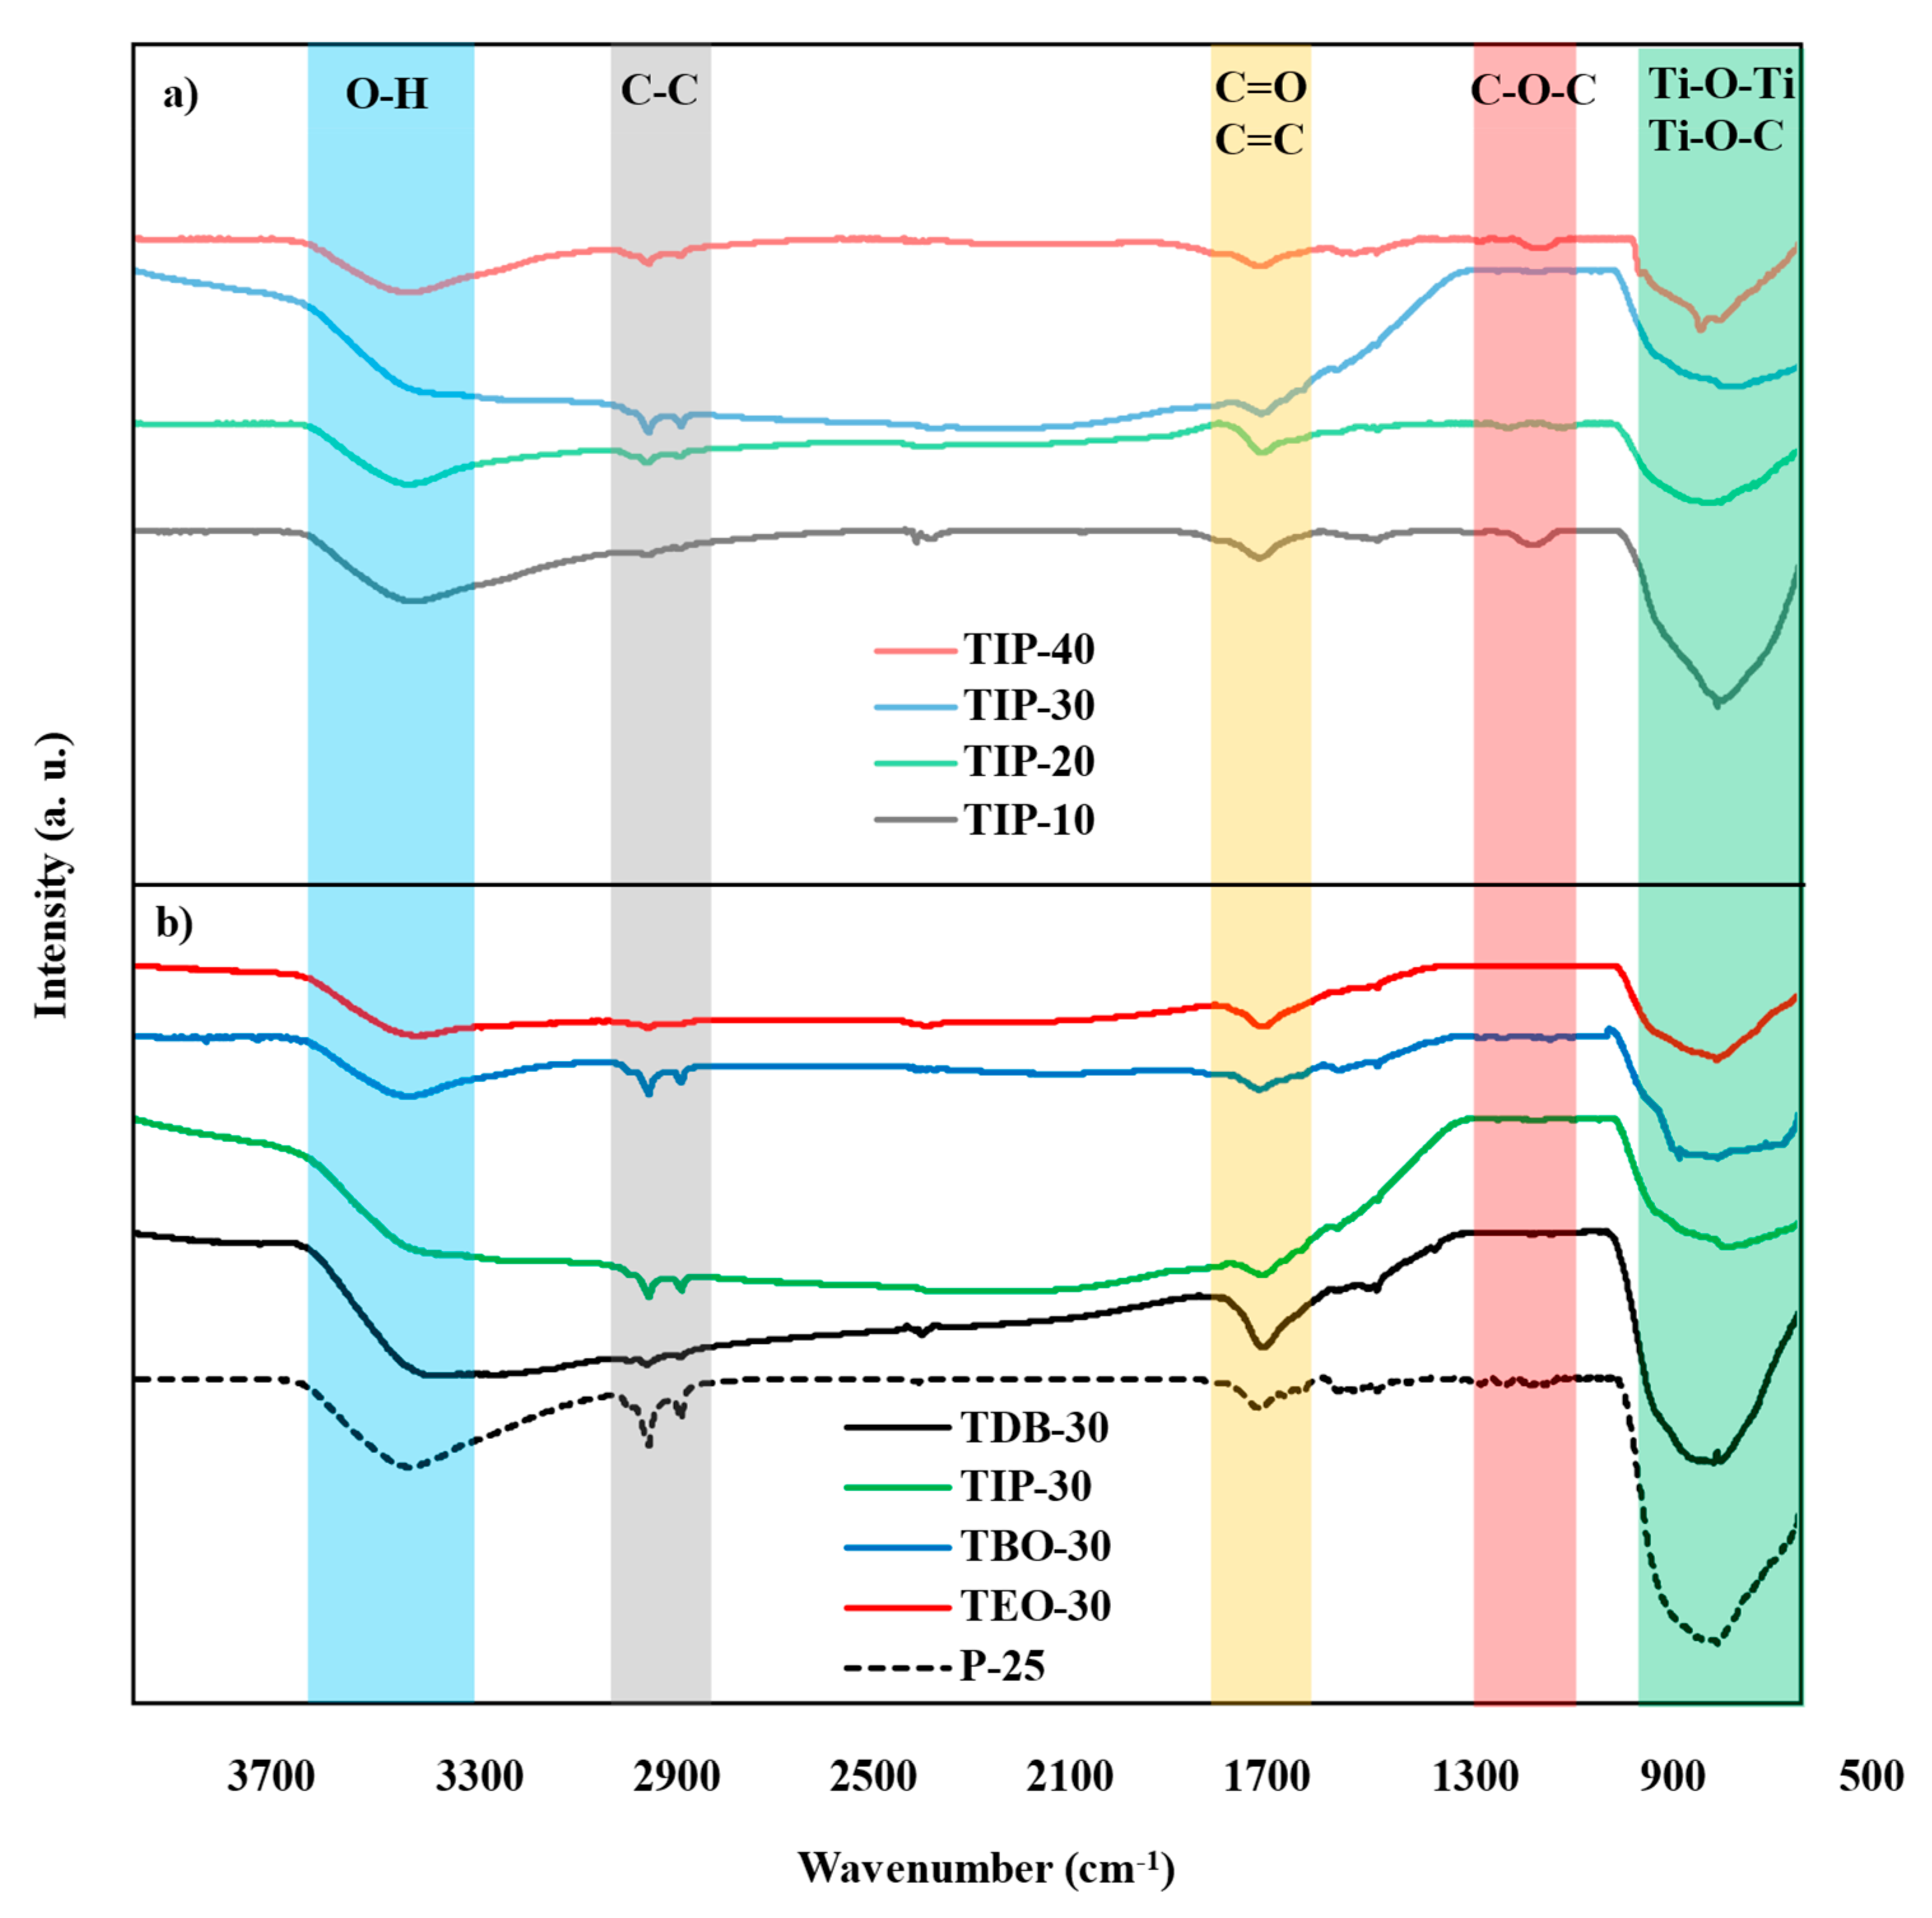
3.2.4. FT-IR
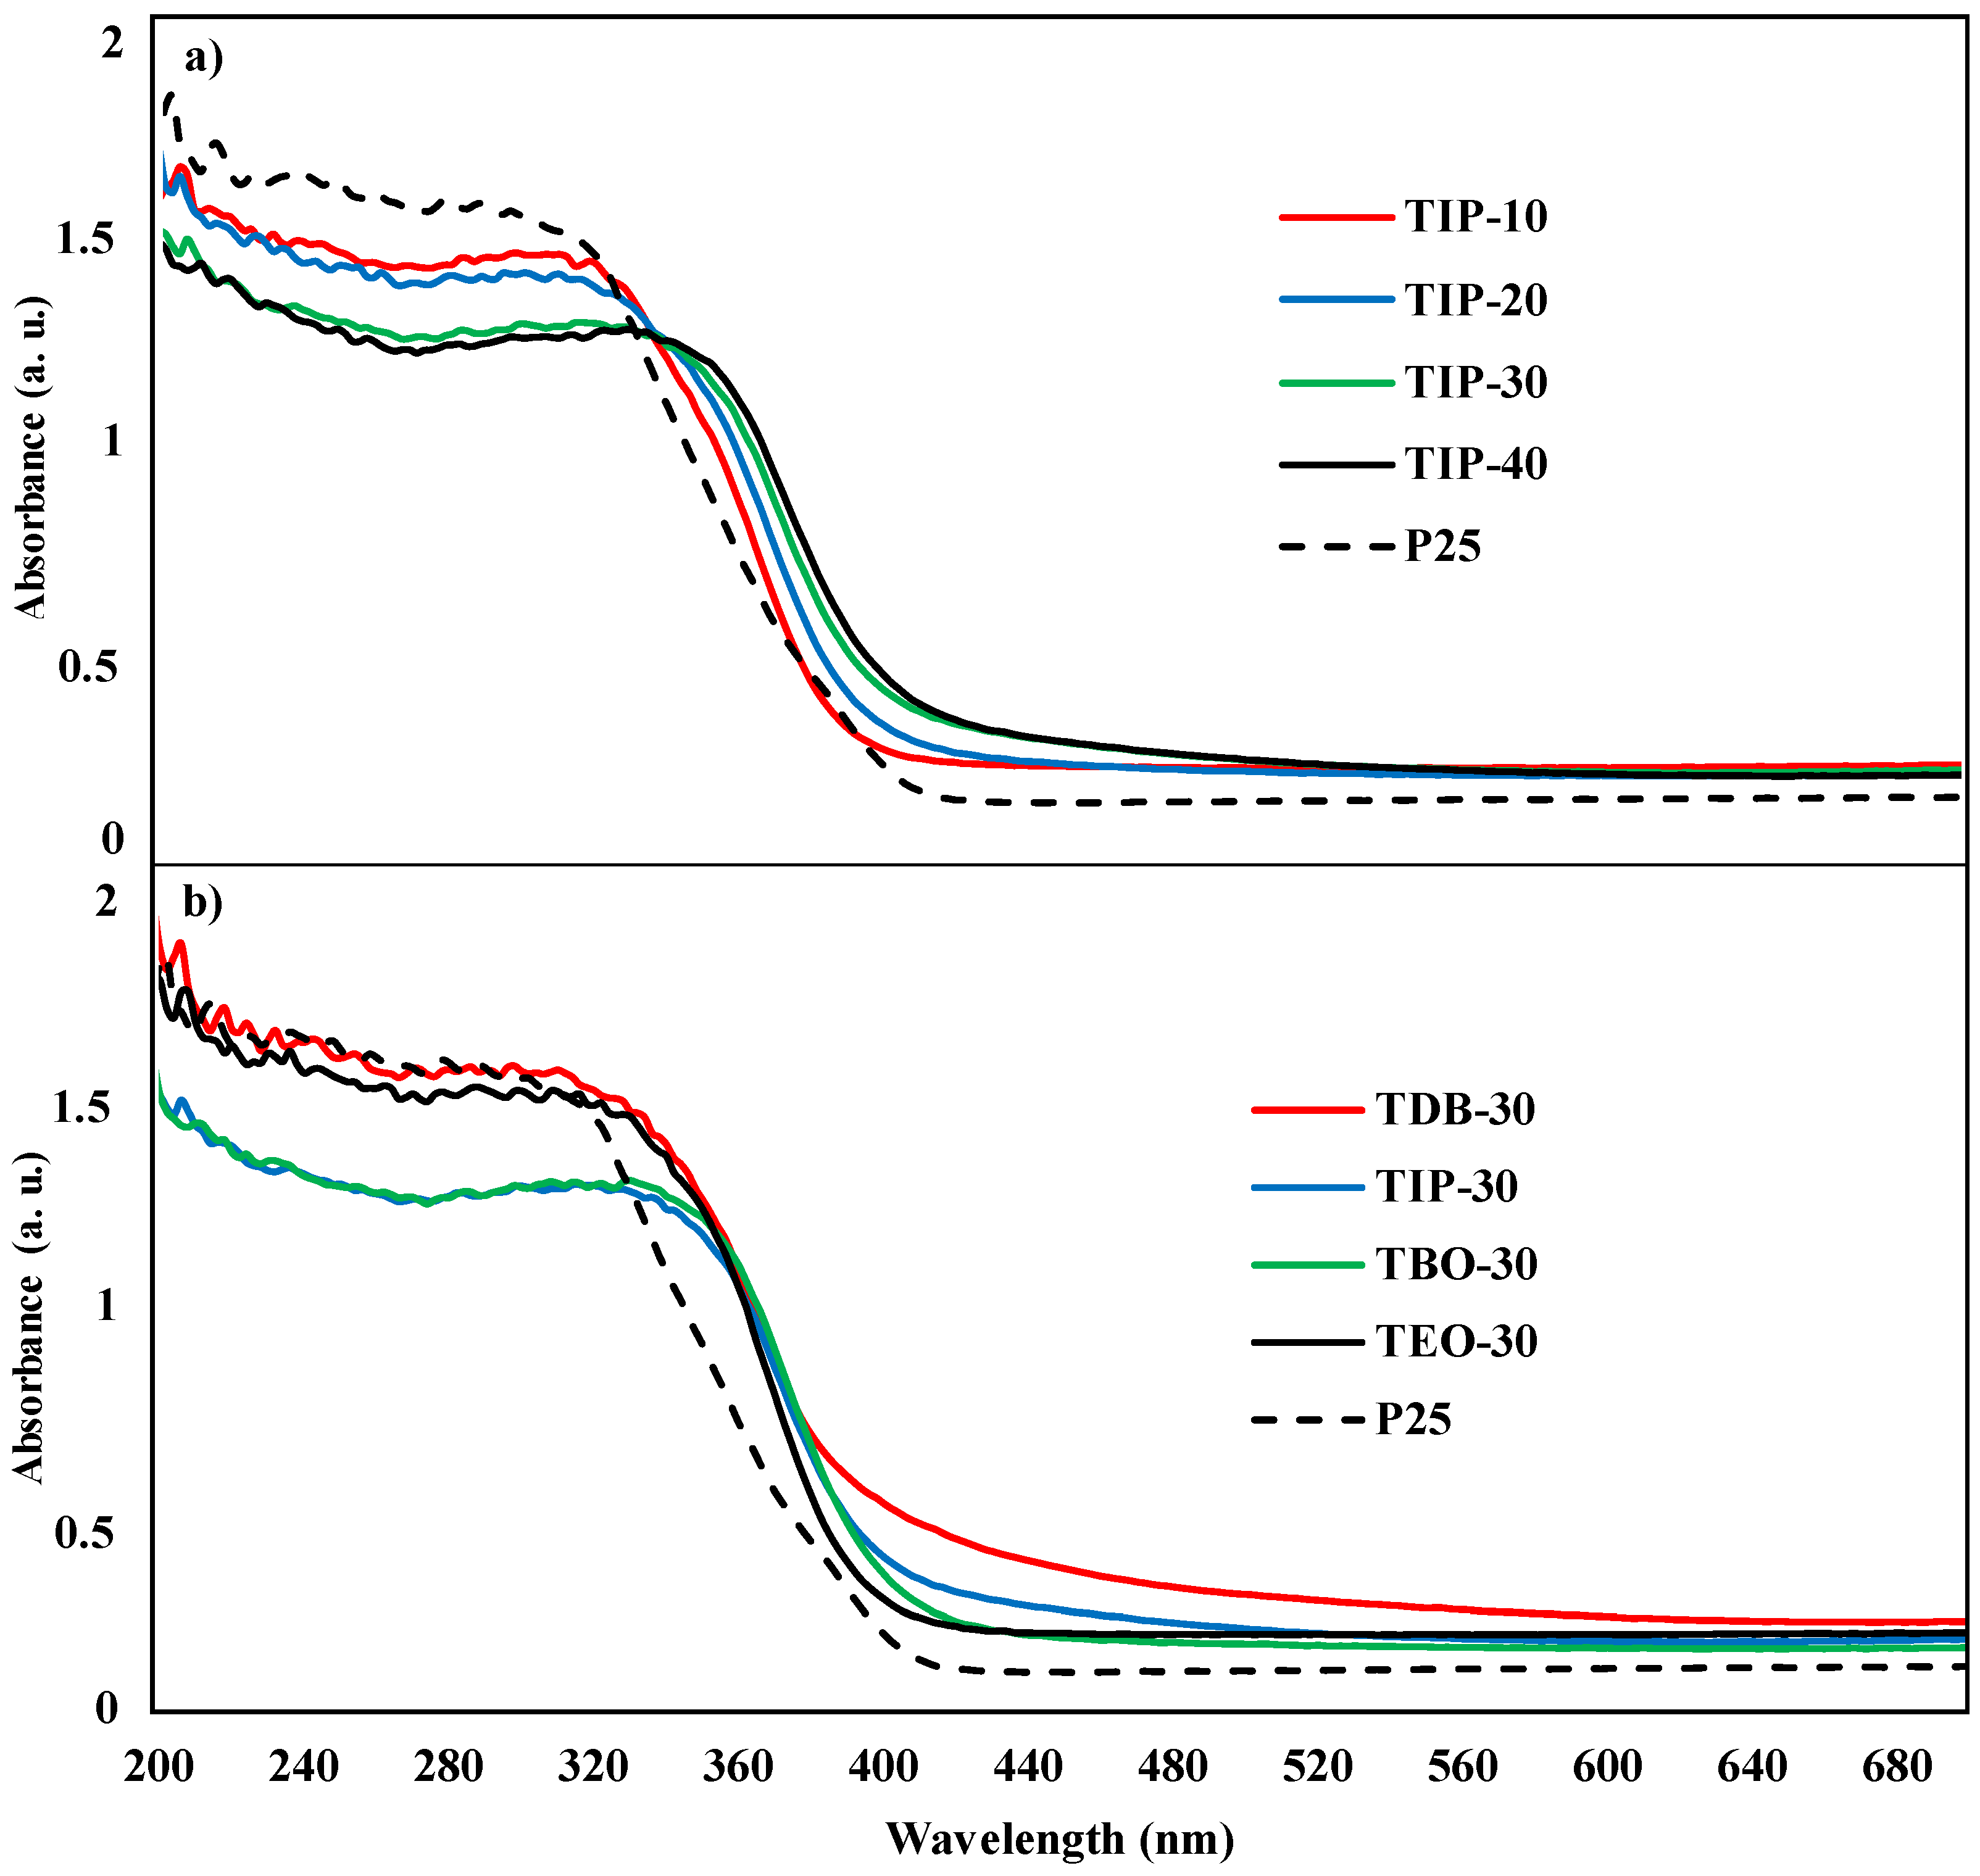
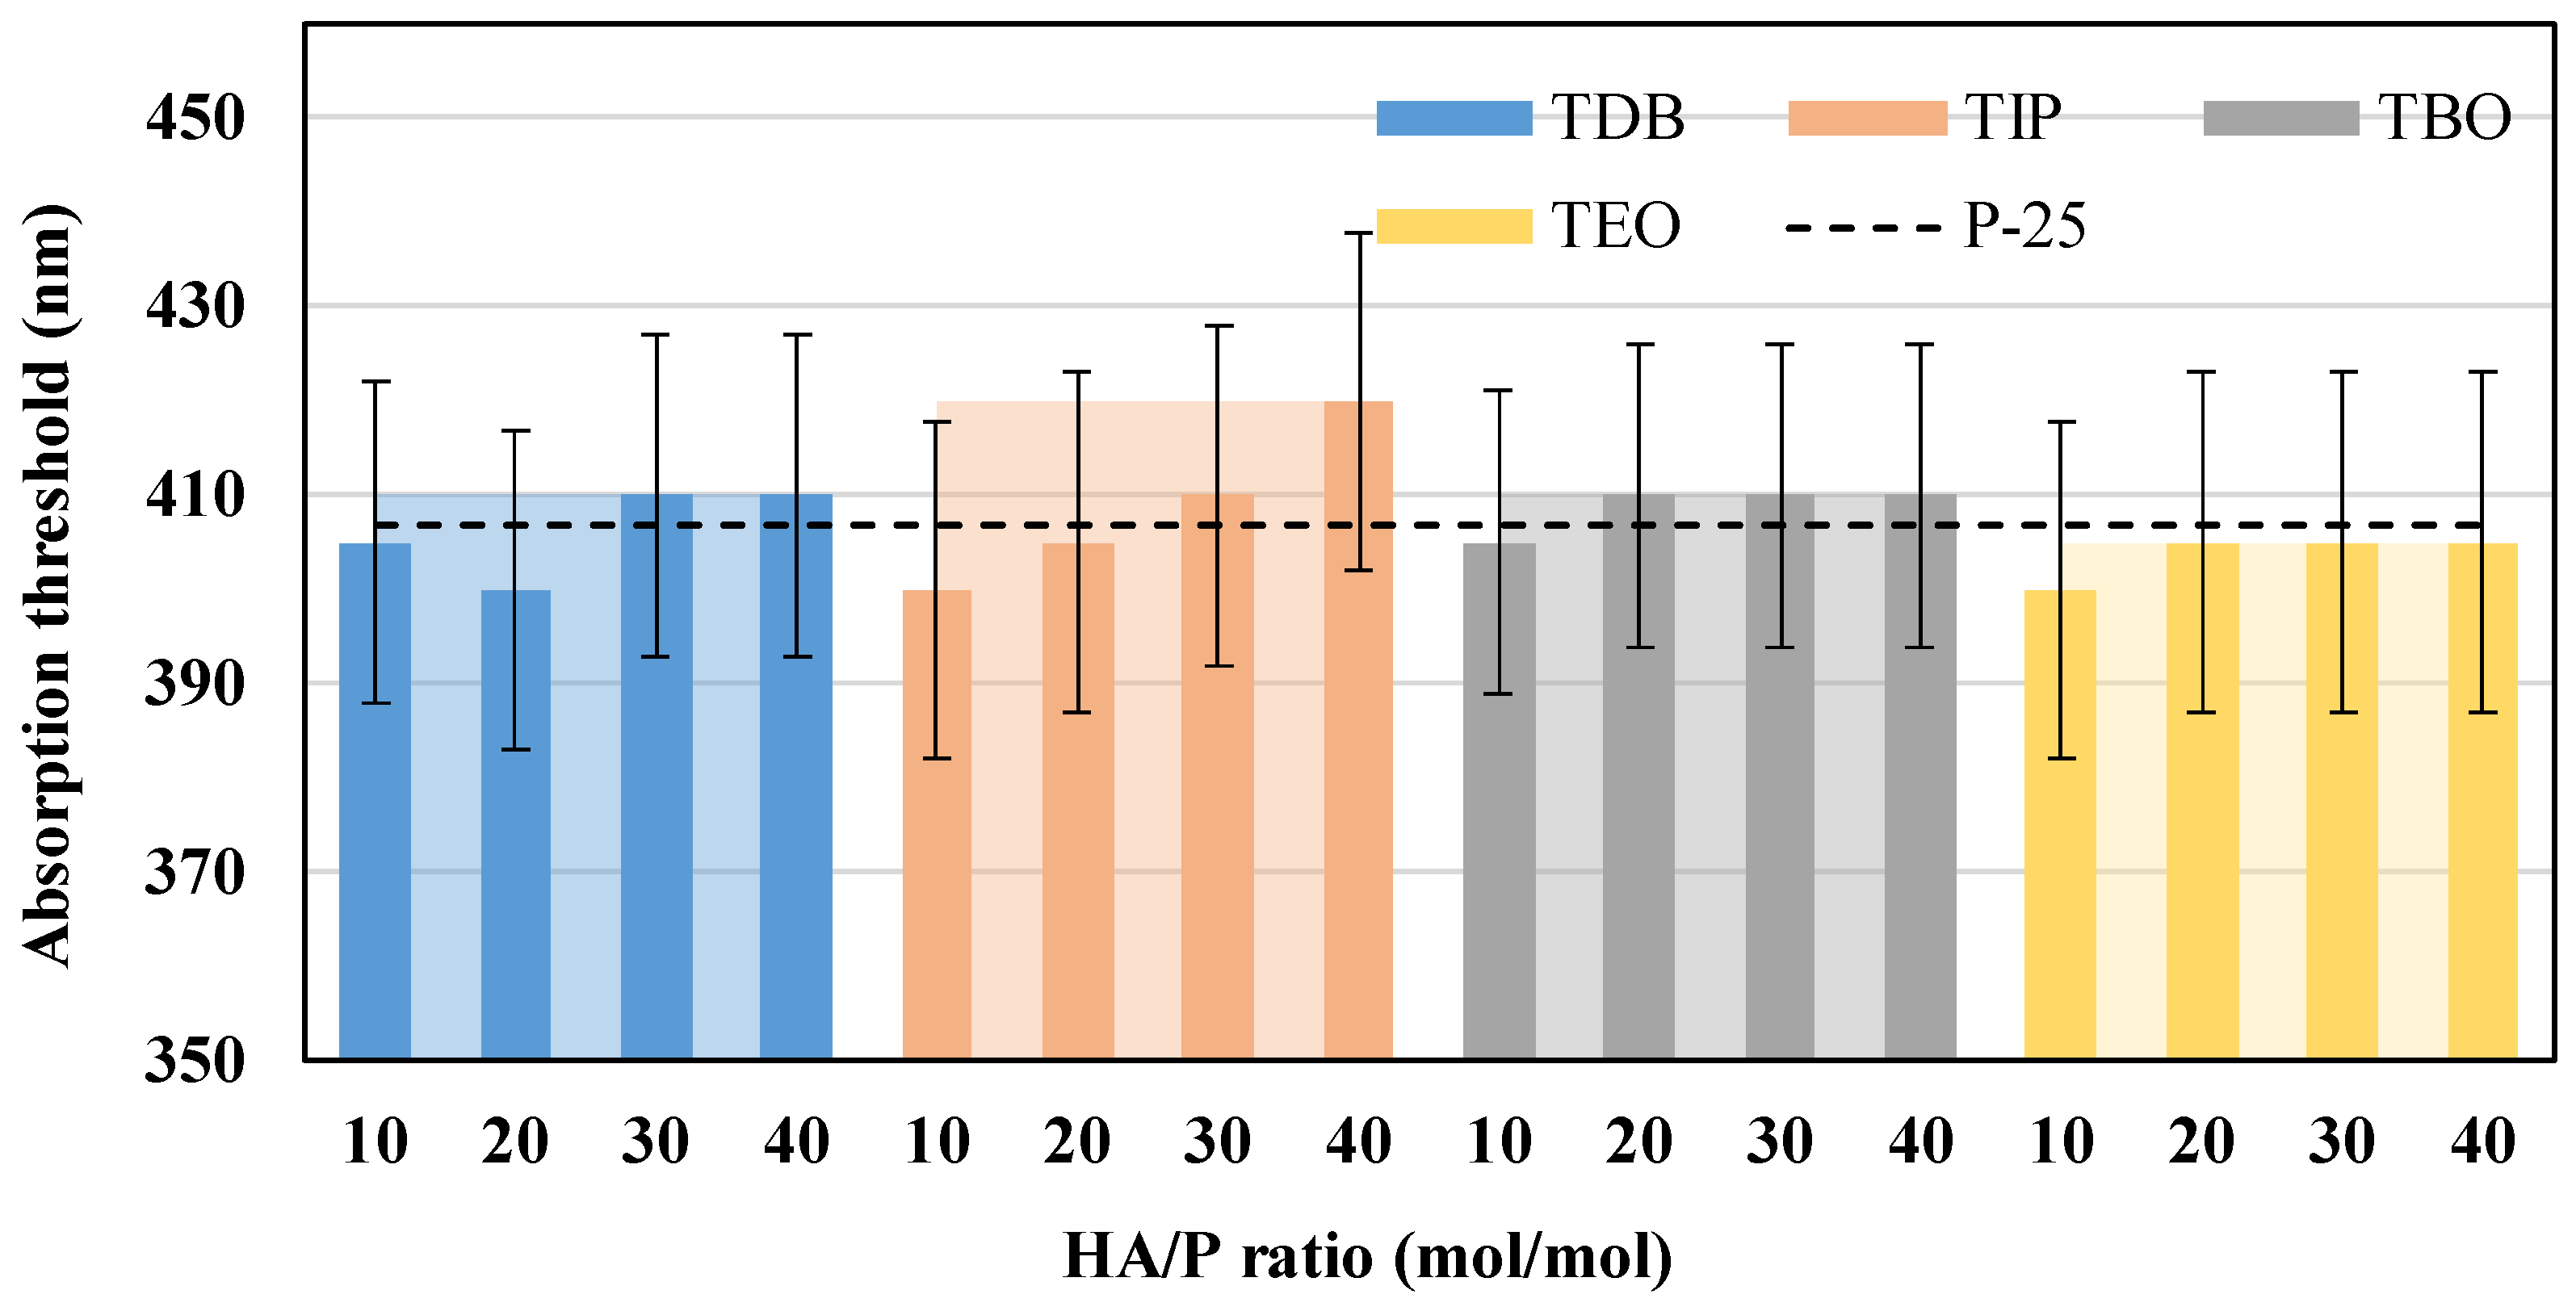
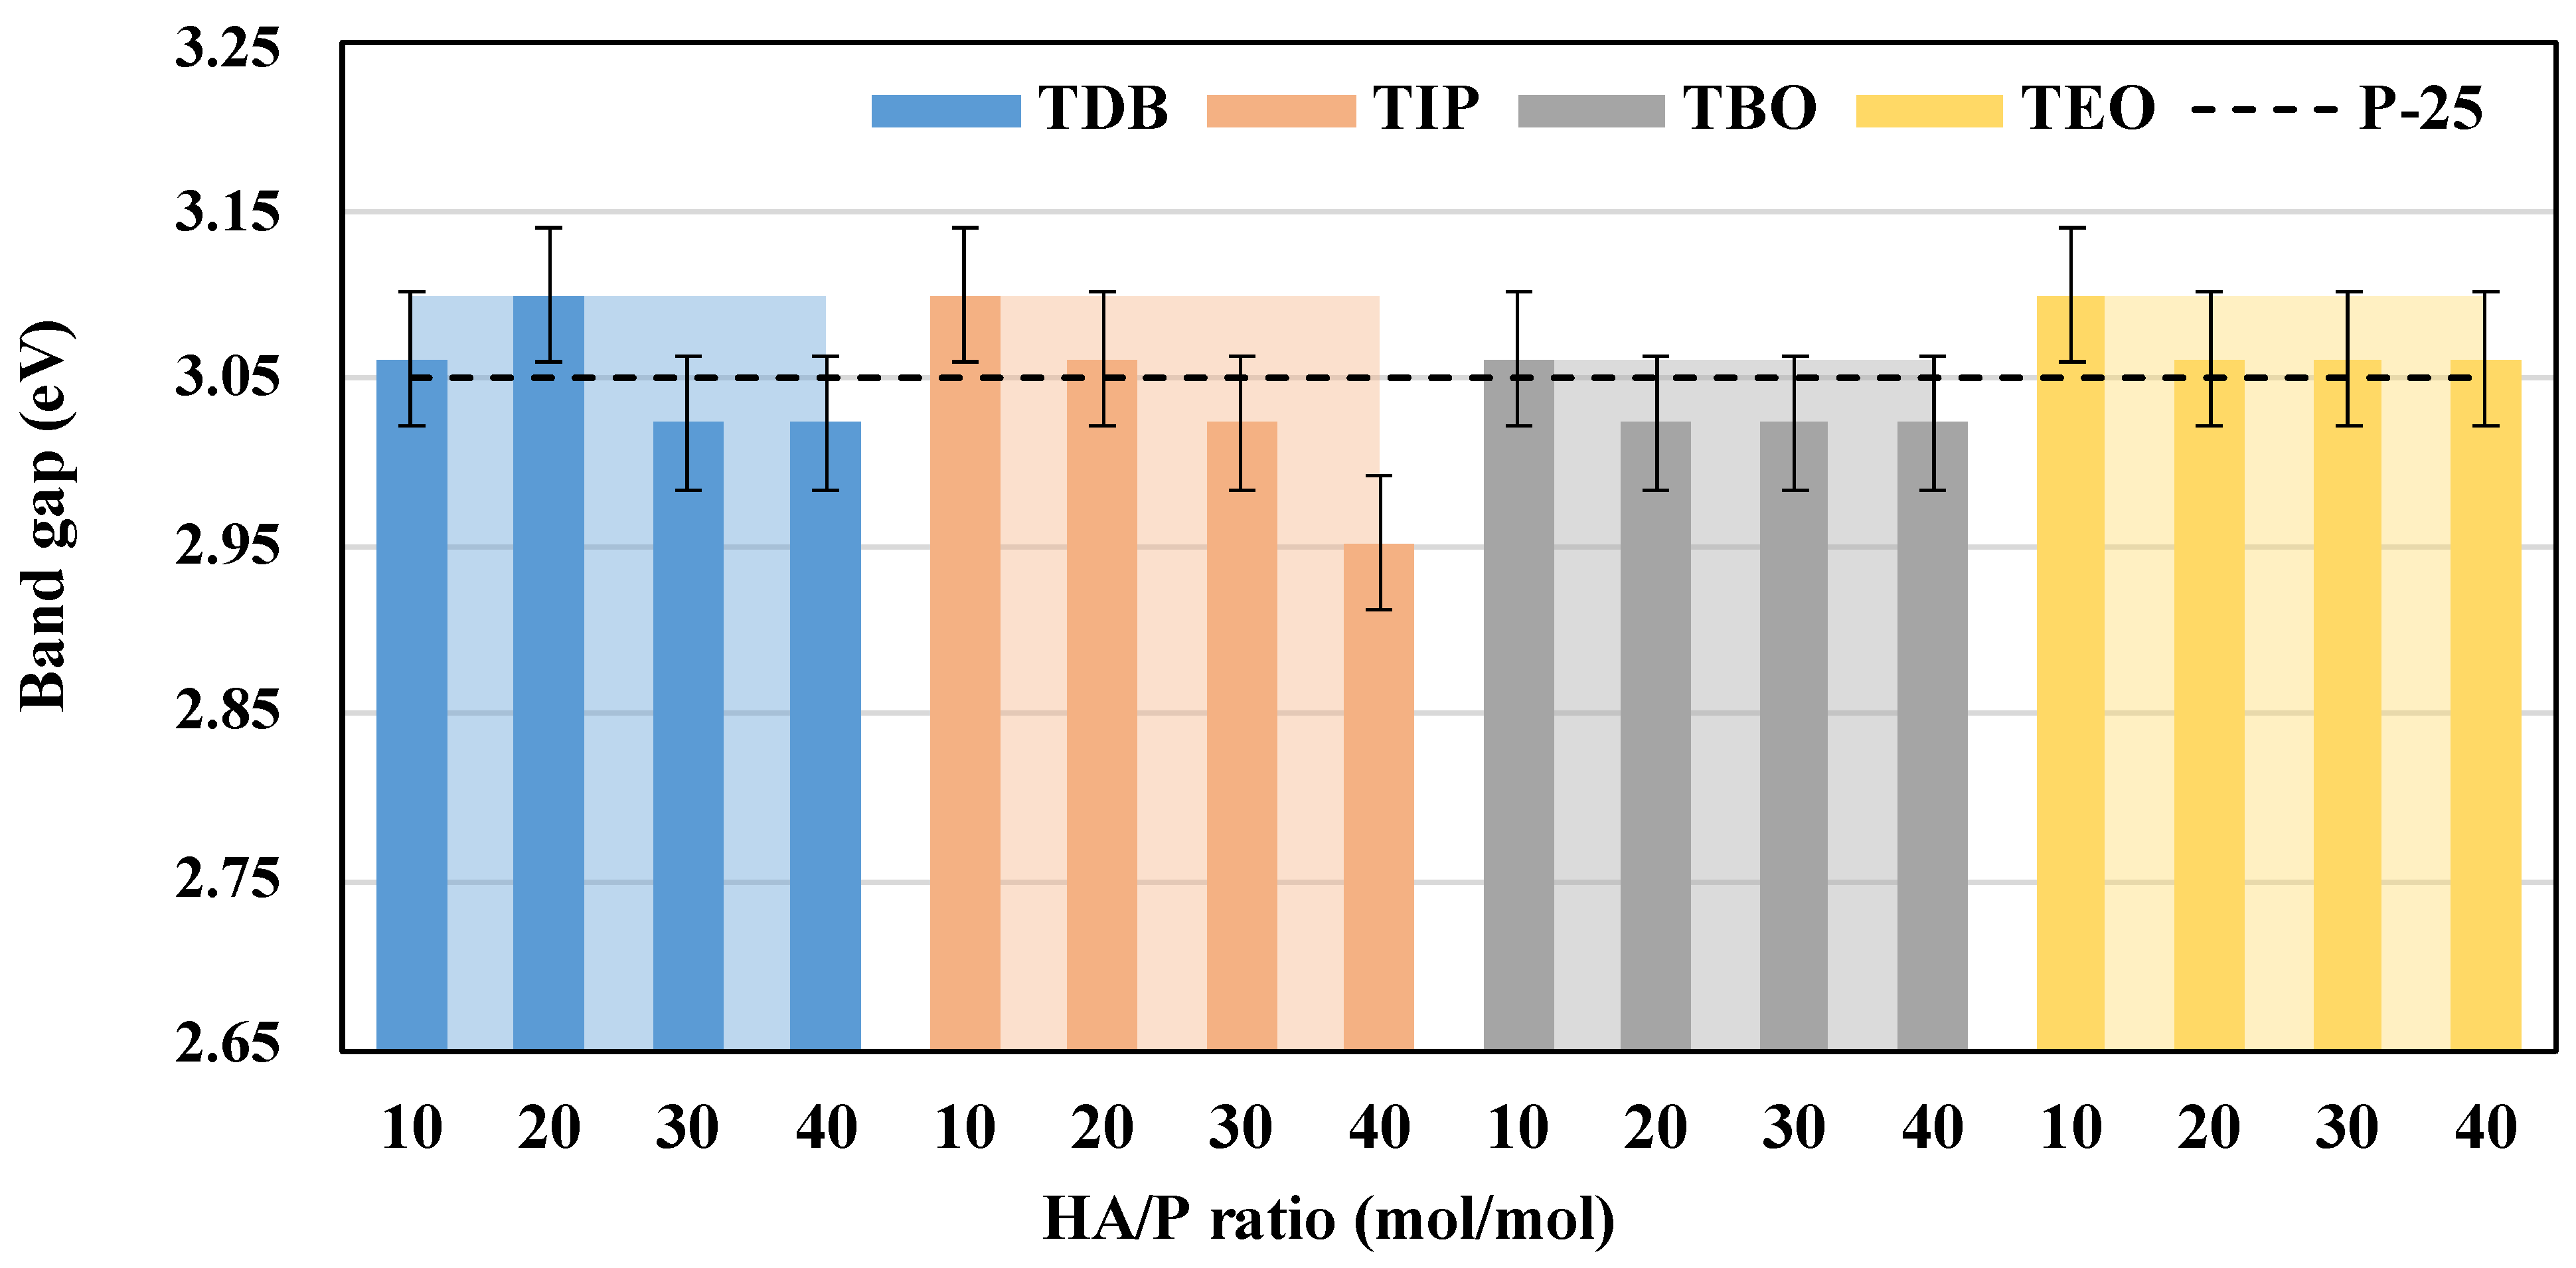
3.2.5. UV-vis DRS
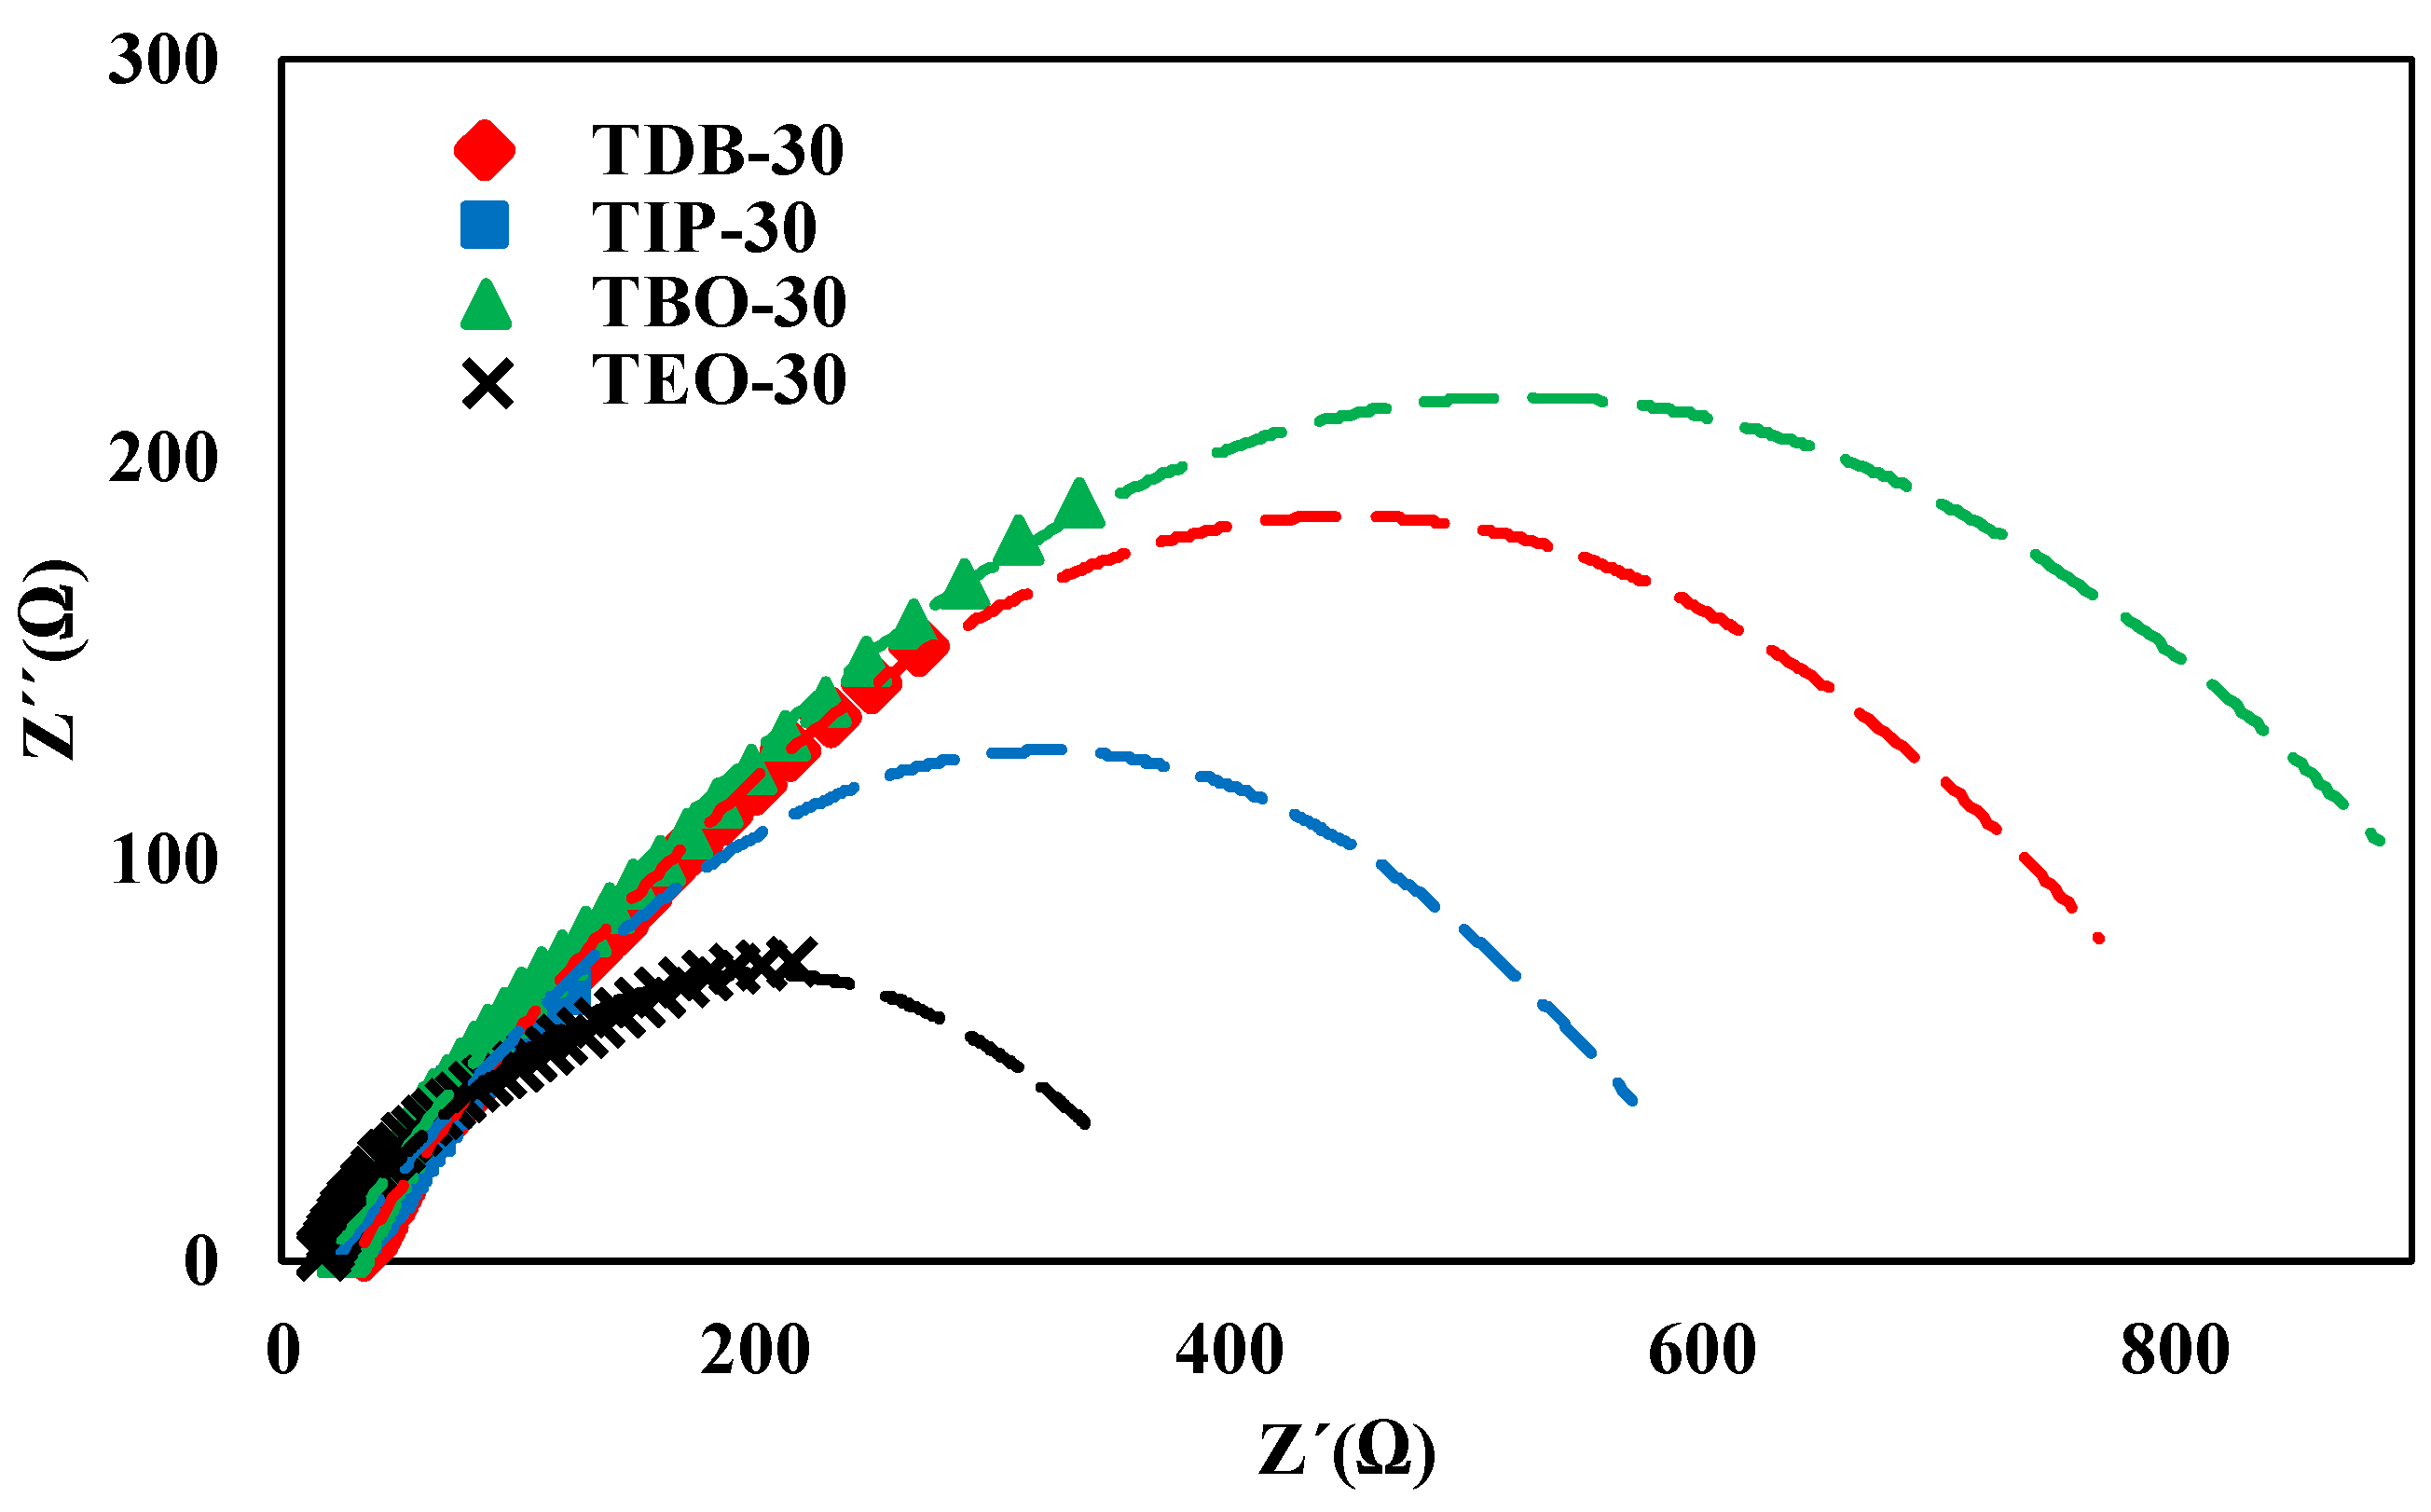
3.2.6. EIS
3.2.7. Summary of Physicochemical Properties
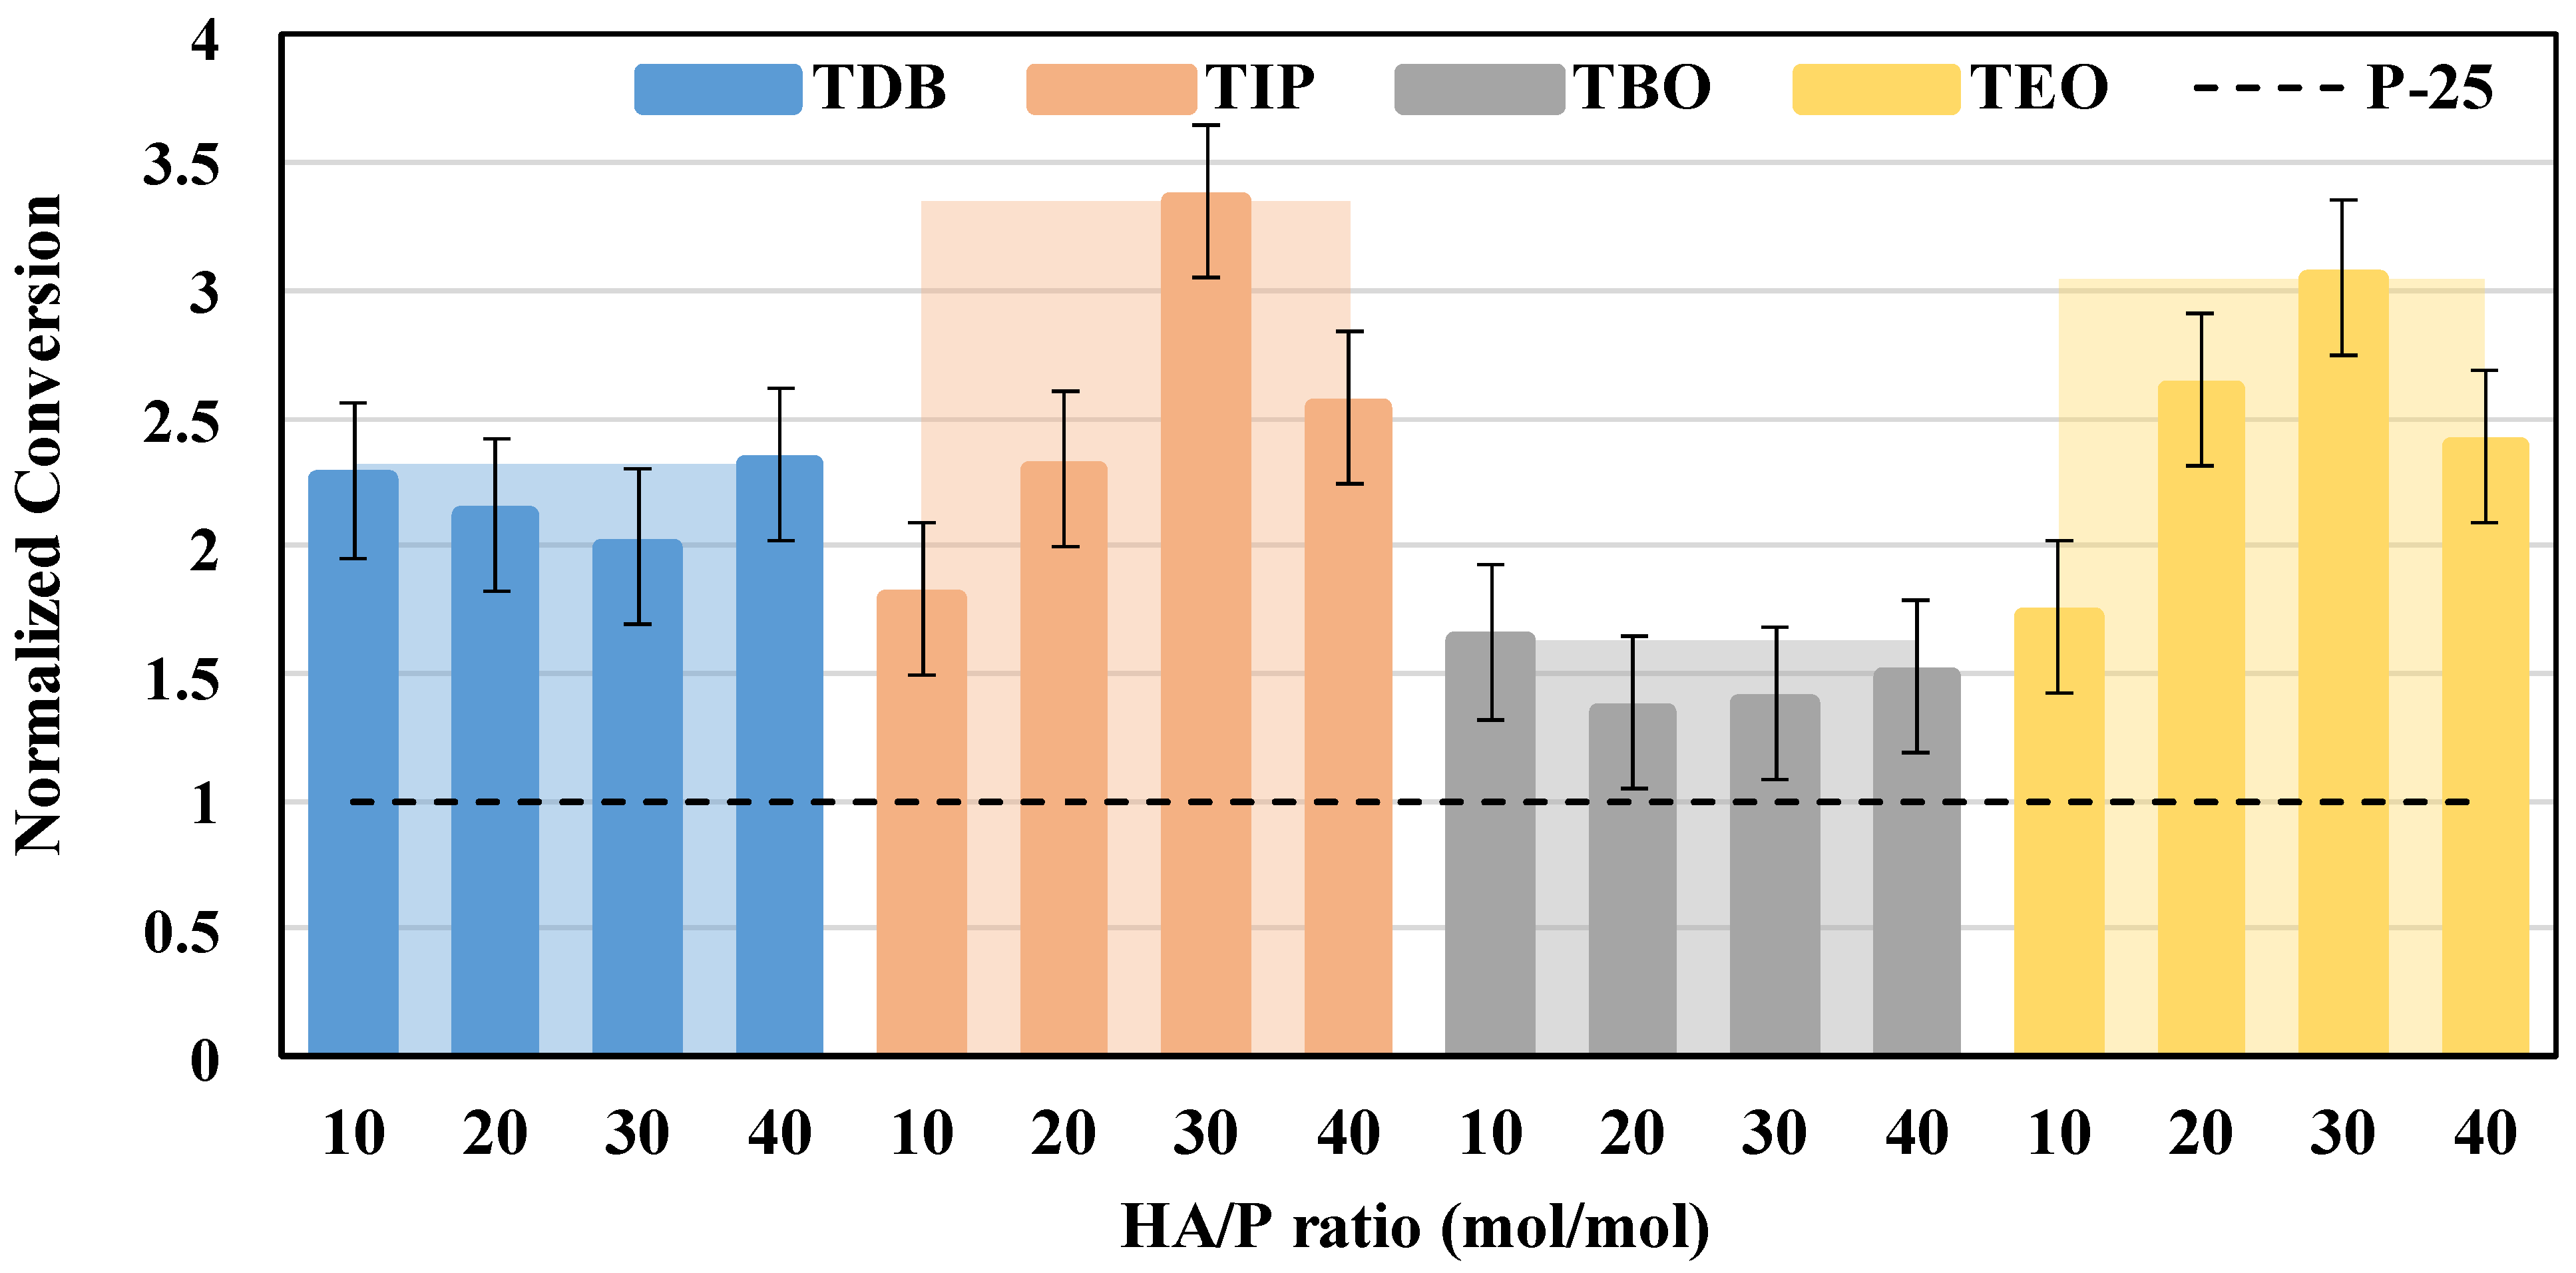
3.3. Photocatalytic Activity
4. Conclusions
Supplementary Materials
Author Contributions
Funding
Data Availability Statement
Conflicts of Interest
References
- Flor, M.P.; Camarillo, R.; Martínez, F.; Jiménez, C.; Quiles, R.; Rincón, J. Synthesis and characterization of TiO2/CNT/Pd: An effective sunlight photocatalyst for neonicotinoids degradation. J. Environ. Chem. Eng. 2021, 9, 106278. [Google Scholar] [CrossRef]
- Rodríguez, V.; Camarillo, R.; Martínez, F.; Jiménez, C.; Rincón, J. CO2 photocatalytic reduction with CNT/TiO2 based nanocomposites prepared by high-pressure technology. J. Supercrit. Fluids 2020, 163, 104876. [Google Scholar] [CrossRef]
- Nakata, K.; Fujishima, A. TiO2 photocatalysis: Design and applications. J. Photochem. Photobiol. C Photochem. Rev. 2012, 13, 169–189. [Google Scholar] [CrossRef]
- Anucha, C.B.; Altin, I.; Bacaksiz, E.; Stathopoulos, V.N. Titanium dioxide (TiO2)-based photocatalyst materials activity enhancement for contaminants of emerging concern (CECs) degradation: In the light of modification strategies. Chem. Eng. J. Adv. 2022, 10, 100262. [Google Scholar] [CrossRef]
- Haruna, A.; Chong, F.K.; Ho, Y.C.; Aljunid Merican, Z.M. Preparation and modification methods of defective titanium dioxide-based nanoparticles for photocatalytic wastewater treatment a comprehensive review. Environ. Sci. Pollut. Res. 2022, 29, 70706–70745. [Google Scholar] [CrossRef]
- Aguilar, T.; Carrillo-Berdugo, I.; Gómez, V.R.; Gallardo, J.J.; Martínez-Merino, P.; Piñero, J.C.; Alcántara, R.; Fernández-Lorenzo, C.; Navas, J. A Solvothermal Synthesis of TiO2 Nanoparticles in a Non-Polar Medium to Prepare Highly Stable Nanofluids with Improved Thermal Properties. Nanomaterials 2018, 8, 816. [Google Scholar] [CrossRef] [PubMed] [Green Version]
- Su, W.; Zhang, H.; Xing, Y.; Li, X.; Wang, J.; Cai, C. A Bibliometric Analysis and Review of Supercritical Fluids for the Synthesis of Nanomaterials. Nanomaterial 2021, 11, 336. [Google Scholar] [CrossRef]
- Xu, Y.; Musumeci, V.; Aymonier, C. Chemistry in supercritical fluids for the synthesis of metal nanomaterials. React. Chem. Eng. 2019, 9, 2144–2150. [Google Scholar] [CrossRef]
- Flor, M.P.; Camarillo, R.; Martínez, F.; Jiménez, C.; Quiles, R. Synthesis and characterization of bimetallic TiO2/CNT/Pd-Cu for efficient remediation of endocrine disruptors under solar light. J. Environ. Chem. Eng. 2022, 10, 107245. [Google Scholar] [CrossRef]
- Andrade, O.R.; Rodriguez, V.; Camarillo, R.; Martinez, F.; Jiménez, C.; Rincón, J. Photocatalytic Reduction of CO2 with N-Doped TiO2-Based Photocatalysts Obtained in One-Pot Supercritical Synthesis. Nanomaterials 2022, 12, 1793. [Google Scholar] [CrossRef]
- Rodríguez, V.; Camarillo, R.; Martínez, F.; Jiménez, C.; Rincón, J. High-pressure synthesis of rGO/TiO2 and rGO/TiO2/Cu catalysts for efficient CO2 reduction under solar light. J. Supercrit. Fluids 2021, 174, 105265. [Google Scholar] [CrossRef]
- Camarillo, R.; Rizaldos, D.; Jiménez, C.; Martínez, F.; Rincón, J. Enhancing the photocatalytic reduction of CO2 with undoped and Cu-doped TiO2 nanofibers synthesized in supercritical medium. J. Supercrit. Fluids 2019, 147, 70–80. [Google Scholar] [CrossRef]
- Camarillo, R.; Tostón, S.; Martínez, F.; Jiménez, C.; Rincón, J. Improving the photo-reduction of CO2 to fuels with catalysts synthesized under high pressure: Cu/TiO2. J. Chem. Technol. Biotechnol. 2018, 93, 1237–1248. [Google Scholar] [CrossRef]
- Alonso, E.; Montequi, I.; Cocero, M.J. Effect of synthesis conditions on photocatalytic activity of TiO2 powders synthesized in supercritical CO2. J. Supercrit. Fluids 2009, 49, 233–238. [Google Scholar] [CrossRef]
- Alonso, E.; Montequi, I.; Lucas, S.; Cocero, M.J. Synthesis of titanium oxide particles in supercritical CO2: Effect of operational variables in the characteristics of the final product. J. Supercrit. Fluids 2007, 39, 453–461. [Google Scholar] [CrossRef]
- Reverchon, E.; Caputo, G.; Correra, S.; Cesti, P. Synthesis of titanium hydroxide nanoparticles in supercritical carbon dioxide on the pilot scale. J. Supercrit. Fluids 2003, 26, 253–261. [Google Scholar] [CrossRef]
- Camarillo, R.; Rincón, J. Photocatalytic Discoloration of Dyes: Relation between Effect of Operating Parameters and Dye Structure. Chem. Eng. Technol. 2011, 34, 1675–1684. [Google Scholar] [CrossRef]
- Almquist, C.; Biswas, P. Role of Synthesis Method and Particle Size of Nanostructured TiO2 on Its Photoactivity. J. Catal. 2002, 212, 145–156. [Google Scholar] [CrossRef]
- Kinoshita, M.; Kamizato, T.; Shimoyama, Y. Effect of precursor structure on mixed-crystal phase titanium oxide synthesized by sol-gel reaction in supercritical carbon dioxide. J. Supercrit. Fluids 2018, 138, 193–199. [Google Scholar] [CrossRef]
- Kinoshita, M.; Shimoyama, Y. Photocatalytic activity of mixed-phase titanium oxide synthesized by supercritical sol-gel reaction. J. Supercrit. Fluids 2018, 138, 29–35. [Google Scholar] [CrossRef]
- Camarillo, R.; Tostón, S.; Martínez, F.; Jiménez, C.; Rincón, J. Enhancing the photocatalytic reduction of CO2 through engineering of catalysts with high pressure technology: Pd/TiO2 photocatalysts. J. Supercrit. Fluids 2017, 123, 18–27. [Google Scholar] [CrossRef]
- Albetran, H.; O´Comor, B.H.; Low, I.M. Activation energies for phase transformations in electrospun titania nanofibers: Comparing the influence of argon and air atmospheres. Appl. Phys. A Mater. Sci. Process. 2016, 122, 367. [Google Scholar] [CrossRef]
- Tostón, S.; Camarillo, R.; Martínez, F.; Jiménez, C.; Rincón, J. Supercritical synthesis of platinum-modified titanium dioxide for solar fuel production from carbon dioxide. Chin. J. Catal. 2017, 38, 636–650. [Google Scholar] [CrossRef]
- Yordanov, S.I.; Bachvarova-Nedelcheva, A.D.; Iordanova, R.S. Influence of ethylene glycol on the hydrolysis-condensation behavior of Ti(IV) butoxide. Bulg. Chem. Commun. 2017, 49, 256–270. [Google Scholar]
- Kolen, Y.V.; Churagulov, B.R.; Kunst, M.; Mazerolles, L.; Colbeau-Justin, C. Photocatalytic properties of titania powders prepared by hydrothermal method. Appl. Catal. B Environ. 2004, 54, 51–58. [Google Scholar] [CrossRef]
- Cargnello, M.; Gordon, T.R.; Murray, C.B. Solution-Phase Synthesis of Titanium Dioxide Nanoparticles and Nanocrystals. Chem. Rev. 2014, 114, 9319–9345. [Google Scholar] [CrossRef]
- Camarillo, R.; Tostón, S.; Martinez, F.; Jiménez, C.; Rincón, J. Preparation of TiO2-based catalysts with supercritical fluid technology: Characterization and photocatalytic activity in CO2 reduction. J. Chem. Technol. Biotechnol. 2017, 92, 1710–1720. [Google Scholar] [CrossRef]
- Chelbi, S.; Djouadi, D.; Chelouche, A.; Hammiche, L.; Touam, T.; Doghmane, A. Effects of Ti-precursor concentration and annealing temperature on structural and morphological properties of TiO2 synthesized in supercritical ethanol. SN Appl. Sci. 2020, 2, 872. [Google Scholar] [CrossRef] [Green Version]
- Chelbi, S.; Djouadi, D.; Chelouche, A.; Touam, T. Structural and morpholological properties of titanium dioxide-based sol-derived materials synthesized in different supercritical organic solvents. J. Sol-Gel Sci. Technol. 2020, 93, 527–534. [Google Scholar] [CrossRef]
- Nkele, A.C.; Chime, U.K.; Asogwa, L.; Nwabya, A.C.; Nwankwo, U.; Ukoba, K.; Jen, T.C.; Maaza, M.; Ezema, F.I. A study on titanium dioxide nanoparticles synthesized from titanium isopropoxide under SILAR-induced gel method: Transition from anatase to rutile structure. Inorg. Chem. Commun. 2020, 112, 107705. [Google Scholar] [CrossRef]
- He, J.; Du, Y.E.; Bai, Y.; An, J.; Cai, X.; Chen, Y.; Wang, P.; Yang, X.; Feng, Q. Facile Formation of Anatase/Rutile TiO2 Nanocomposites with Enhanced Photocatalytic Activity. Molecules 2019, 24, 2996. [Google Scholar] [CrossRef] [PubMed] [Green Version]
- Vafaei, S.; Splingaire, L.; Schnupf, U.; Hisae, K.; Hasegawa, D.; Sugiura, T.; Manseki, K. Low temperature synthesis of anatase TiO2 nanocrystals using an organic-inorganic gel precursor. Powder Technol. 2020, 368, 237–244. [Google Scholar] [CrossRef]
- Zhang, X.; Lui, C.; Wang, M.; Sun, X.; Sun, X.Y.; Qian, N.X.; Rao, R.; Ma, Y.Q. Improved photocatalytic performance of anatase TiO2 synthesized through ethanol supercritical drying technique. Appl. Organomet. Chem. 2019, 33, e5230. [Google Scholar] [CrossRef]
- Xue, X.; Ji, W.; Mao, Z.; Mao, H.; Wang, Y.; Wang, X.; Ruan, W.; Zhao, B.; Lombardi, J.R. Raman Investigation of Nanosized TiO2: Effect of Crystallite Size and Quantum Confinement. J. Phys. Chem. C 2012, 116, 8792–8797. [Google Scholar] [CrossRef]
- Castro, A.L.; Nunes, M.R.; Carvalho, A.P.; Costa, F.M.; Florencio, M.H. Synthesis of anatase TiO2 nanoparticles with high temperature stability and photocatalytic activity. Solid State Sci. 2008, 10, 602–606. [Google Scholar] [CrossRef]
- Hanaor, D.A.; Sorrell, C.C. Review of the anatase to rutile phase transformation. J. Mater. Sci. 2011, 46, 855–874. [Google Scholar] [CrossRef] [Green Version]
- Bargougui, R.; Bouazizi, N.; Ammar, S.; Azzouz, A. Molybdenum-Loaded Anatase TiO2 Nanoparticles with Enhanced Optoelectronics Properties. J. Electron. Mater. 2016, 46, 85–91. [Google Scholar] [CrossRef]
- Henderson, M.A. A surface science perspective on TiO2 photocatalysis. Surf. Sci. Rep. 2011, 66, 185–297. [Google Scholar] [CrossRef]
- Chen, X.; Kuo, D.H.; Lu, D.; Hou, D.; Kuo, Y.R. Synthesis and photocatalytic activity of mesoporous TiO2 nanoparticle using biological renewable resource of un-modified lignin as a template. Microporous Mesoporous Mater. 2016, 223, 145–151. [Google Scholar] [CrossRef]
- Zhang, D. Enhancement of the Photocatalytic Activity of Modified TiO2 Nanoparticles with Zn2+. Correlation between Structure and Properties. Russ. J. Phys. Chem. 2012, 86, 489–494. [Google Scholar] [CrossRef]
- Pathinti, R.S.; Gollapelli, B.; Jakka, S.K.; Vallamkondu, J. Green synthesized TiO2 nanoparticles dispersed cholesteric liquid crystal systems for enhanced optical and dielectric properties. J. Mol. Liq. 2021, 33, 116877. [Google Scholar] [CrossRef]
- Vembu, S.; Vijayakumar, S.; Nilavukkarasi, M.; Vidhya, E.; Punitha, V.N. Phytosynthesis of TiO2 nanoparticles in diverse applications: What is the exact mechanism of action? Sens. Int. 2022, 3, 100161. [Google Scholar] [CrossRef]
- Shehzad, N.; Tahir, M.; Johari, K.; Murugesan, T.; Hussain, M. A critical review on TiO2 based photocatalytic CO2 reduction system: Strategies to improve efficiency. J. CO2 Util. 2018, 26, 98–122. [Google Scholar] [CrossRef]
- Singh, S.; Maurya, I.C.; Tiwari, A.; Srivastava, P.; Bahadur, L. Green synthesis of TiO2 nanoparticles using Citrus limon juice extract as a bio-capping agent for enhanced performance of dye-sensitized solar cells. Surf. Interfaces 2022, 28, 101652. [Google Scholar] [CrossRef]
- Hidalgo, M.C.; Aguilar, M.; Maicu, M.; Navío, J.A.; Colón, G. Hydrothermal preparation of highly photoactive TiO2 nanoparticles. Catal. Today 2007, 129, 50–58. [Google Scholar] [CrossRef]
- Li, Y.; Sun, X.; Li, H.; Wang, S.; Wei, Y. Preparation of anatase TiO2 nanoparticles with high thermal stability and specific surface area by alcohothermal method. Powder Technol. 2009, 194, 149–152. [Google Scholar] [CrossRef]
- Bessekhouad, Y.; Robert, D.; Weber, J.V. Synthesis of photocatalytic TiO2 nanoparticles: Optimization of the preparation conditions. J. Photochem. Photobiol. A Chem. 2003, 157, 47–53. [Google Scholar] [CrossRef]
- Shabani, A.; Nabiyouni, G.; Ghanbari, D. Preparation and photocatalytic study of CoFe2O4/TiO2/Au nanocomposites and their applications in organic pollutant degradation and modeling by an artificial neural network (ANN). J. Mater. Sci. Mater. Electron. 2022, 33, 9885–9904. [Google Scholar] [CrossRef]
- Divyasri, Y.V.; Reddy, N.L.; Lee, K.; Sakar, M.; Rao, V.N.; Venkatramu, V.; Shankar, M.V.; Reddy, N.C. Optimization of N doping in TiO2 nanotubes for the enhanced solar light mediated photocatalytic H2 production and dye degradation. Environ. Pollut. 2021, 269, 116170. [Google Scholar] [CrossRef]
- Aravind, M.; Amalanathan, M.; Michael, M.S. Synthesis of TiO2 nanoparticles by chemical and green synthesis methods and their multifaceted properties. Appl. Sci. 2021, 3, 709. [Google Scholar] [CrossRef]
- Seck, E.J.; Doña-Rodríguez, J.M.; Pulido, E.; Fernández-Rodríguez, C.; González-Díaz, O.M.; Portillo-Carrizo, D.; Pérez-Peña, J. Comparative study of nanocrystalline titanium dioxide obtained through sol–gel and sol–gel–hydrothermal synthesis. J. Colloid Interface Sci. 2013, 400, 31–40. [Google Scholar] [CrossRef] [PubMed]
- Tang, B.; Chen, H.; Peng, H.; Wang, Z.; Huang, W. Graphene Modified TiO2 Composite Photocatalysts: Mechanism, Progress and Perspective. Nanomaterials 2018, 8, 105. [Google Scholar] [CrossRef] [PubMed] [Green Version]
- Usubharatana, P.; McMartin, D.; Veawab, A.; Tontiwachwuthikul, P. Photocatalytic Process for CO2 Emission Reduction from Industrial Flue Gas Streams. Ind. Eng. Chem. Res. 2006, 45, 2558–2568. [Google Scholar] [CrossRef]
- Behnajady, M.A.; Eskandarloo, H. Silver and copper co-impregnated onto TiO2-P25 nanoparticles and its photocatalytic activity. Chem. Eng. J. 2013, 228, 1207–1213. [Google Scholar] [CrossRef]
- Zhao, Y.; Li, C.; Liu, X.; Gu, F.; Jiang, H.; Shao, W.; Zhang, L.; He, Y. Synthesis and optical properties of TiO2 nanoparticle. Mater. Lett. 2007, 61, 79–83. [Google Scholar] [CrossRef]
- Siddabattuni, S.; Akella, S.H.; Gangula, A.; Patnaik, S. Impedance spectroscopy studies of surface engineered TiO2 nanoparticles using slurry technique. Bull. Mater. Sci. 2015, 39, 1399–1405. [Google Scholar] [CrossRef] [Green Version]
- Hamdani, K.; Belhousse, S.; Tighilt, F.Z.; Lasmi, K.; Chaumont, D.; Sam, S. Impedance investigation of TiO2 nanotubes/nanoparticles-based dye-sensitized solar cells. J. Mater. Res. 2022, 37, 500–508. [Google Scholar] [CrossRef]
- Baram, N.; Ein-Eli, Y. Electrochemical Impedance Spectroscopy of Porous TiO2 for Photocatalytic Applications. J. Phys. Chem. C 2010, 114, 9781–9790. [Google Scholar] [CrossRef]
- Realpe, J.A.; Núñez, D.D.; Acevedo, M.M. Impedance Analysis of TiO2 Nanoparticles Prepared by Green Chemical Mechanism. Contemp. Eng. Sci. 2018, 11, 737–744. [Google Scholar] [CrossRef]
- Talian, S.D.; Moskon, J.; Dominiko, R.; Gaberscek, M. Reactivity and Diffusivity of Li Polysulfides: A Fundamental Study Using Impedance Spectroscopy. ACS Appl. Mater. Interfaces 2017, 9, 29760–29770. [Google Scholar] [CrossRef]
- Zhang, Y.; Wang, D.; Wang, Q.; Zheng, W. One-step synthesized CuS and MWCNTs composite as a highly efficient counter electrode for quantum dot sensitized solar cells. Mater. Des. 2018, 160, 870–875. [Google Scholar] [CrossRef]
- Zhang, H.; Lv, X.; Li, Y.; Wang, Y.; Li, J. P25-Graphene Composite as a High Performance Photocatalyst. ACS Nano 2010, 4, 380–386. [Google Scholar] [CrossRef] [PubMed]
- Leng, W.H.; Zhang, Z.; Zhang, J.Q.; Cao, C.N. Investigation of the Kinetics of a TiO2 Photoelectrocatalytic Reaction Involving Charge Transfer and Recombination through Surface States by Electrochemical Impedance Spectroscopy. J. Phys. Chem. B 2005, 109, 15008–15023. [Google Scholar] [CrossRef] [PubMed]


| Precursor | E/P (moL/moL) | Catalyst |
|---|---|---|
| Titanium diisopropoxide bis(acetylacetonate) | 10 | TDB-10 |
| 20 | TDB-20 | |
| 30 | TDB-30 | |
| 40 | TDB-40 | |
| Titanium isopropoxide | 10 | TIP-10 |
| 20 | TIP-20 | |
| 30 | TIP-30 | |
| 40 | TIP-40 | |
| Titanium tetrabutoxide | 10 | TBO-10 |
| 20 | TBO-20 | |
| 30 | TBO-30 | |
| 40 | TBO-40 | |
| Titanium ethylhexoxide | 10 | TEO-10 |
| 20 | TEO-20 | |
| 30 | TEO-30 | |
| 40 | TEO-40 |
| Precursor and Linear Formula | Chemical Structure | Hydrolysis Reaction 1 |
|---|---|---|
| TDB Ti(OC3H7)2(C5H7O2)2 |  | Ti(OC3H7)2(C5H7O2)2 + 2H2O → TiO2↓ + 2C3H7OH + 2C5H7OOH |
| TIP Ti(OC3H7)4 |  | Ti(OC3H7)4 +2H2O → TiO2↓ + 4C3H7OH |
| TBO Ti[OC(CH3)3]4 |  | Ti[OC(CH3)3]4 + 2H2O → TiO2↓ + 4C(CH3)3OH |
| TEO Ti[OCH2CH(C2H5)(CH2)3CH3]4 |  | Ti[OCH2CH(C2H5)(CH2)3CH3]4 + 2H2O → TiO2↓ + 4CH3(CH2)3(C2H5)CHCH2OH |
| Catalyst | Rs (Ω) | Rct (Ω) |
|---|---|---|
| TDB-30 | 28.52 | 884.16 |
| TIP-30 | 22.57 | 607.93 |
| TBO-30 | 18.44 | 1069.87 |
| TEO-30 | 11.85 | 378.70 |
| Catalyst Code | Yield (%) | Crystallite Size (nm) | BET Area (m2/g) | Absorption Threshold (nm) | Band Gap (eV) |
|---|---|---|---|---|---|
| TDB-10 | 40 ± 8 | 11 ± 4 | 98 ± 3 | 405 ± 20 | 3.06 ± 0.04 |
| TDB-20 | 35 ± 8 | 12 ± 5 | 104 ± 3 | 400 ± 20 | 3.09 ± 0.04 |
| TDB-30 | 37 ± 8 | 11 ± 4 | 114 ± 3 | 410 ± 18 | 3.02 ± 0.04 |
| TDB-40 | 41 ± 9 | 9 ± 3 | 98 ± 3 | 410 ± 18 | 3.02 ± 0.04 |
| TIP10 | 48 ± 9 | 14 ± 6 | 78 ± 3 | 400 ± 20 | 3.09 ± 0.06 |
| TIP-20 | 47 ± 7 | 12 ± 5 | 86 ± 3 | 405 ± 20 | 3.06 ± 0.06 |
| TIP-30 | 66 ± 7 | 11 ± 4 | 70 ± 3 | 410 ± 20 | 3.02 ± 0.06 |
| TIP-40 | 80 ± 10 | 11 ± 4 | 79 ± 3 | 420 ± 20 | 2.95 ± 0.06 |
| TBO-10 | 44 ± 7 | 10 ± 4 | 66 ± 3 | 405 ± 20 | 3.06 ± 0.06 |
| TBO-20 | 57 ± 6 | 12 ± 5 | 58 ± 3 | 410 ± 18 | 3.02 ± 0.04 |
| TBO-30 | 59 ± 7 | 11 ± 4 | 55 ± 3 | 410 ± 18 | 3.02 ± 0.04 |
| TBO-40 | 52 ± 7 | 11 ± 4 | 60 ± 3 | 410 ± 18 | 3.02 ± 0.04 |
| TEO-10 | 39 ± 6 | 12 ± 5 | 63 ± 3 | 400 ± 20 | 3.09 ± 0.06 |
| TEO-20 | 40 ± 6 | 12 ± 5 | 71 ± 3 | 405 ± 20 | 3.06 ± 0.06 |
| TEO-30 | 33 ± 9 | 11 ± 4 | 74 ± 3 | 405 ± 20 | 3.06 ± 0.06 |
| TEO-40 | 39 ± 7 | 12 ± 5 | 66 ± 3 | 405 ± 18 | 3.06 ± 0.04 |
Disclaimer/Publisher’s Note: The statements, opinions and data contained in all publications are solely those of the individual author(s) and contributor(s) and not of MDPI and/or the editor(s). MDPI and/or the editor(s) disclaim responsibility for any injury to people or property resulting from any ideas, methods, instructions or products referred to in the content. |
© 2023 by the authors. Licensee MDPI, Basel, Switzerland. This article is an open access article distributed under the terms and conditions of the Creative Commons Attribution (CC BY) license (https://creativecommons.org/licenses/by/4.0/).
Share and Cite
Andrade, Ó.R.; Camarillo, R.; Martínez, F.; Jiménez, C.; Rincón, J. Impact of the Precursor on the Physicochemical Properties and Photoactivity of TiO2 Nanoparticles Produced in Supercritical CO2. Nanomaterials 2023, 13, 2328. https://doi.org/10.3390/nano13162328
Andrade ÓR, Camarillo R, Martínez F, Jiménez C, Rincón J. Impact of the Precursor on the Physicochemical Properties and Photoactivity of TiO2 Nanoparticles Produced in Supercritical CO2. Nanomaterials. 2023; 13(16):2328. https://doi.org/10.3390/nano13162328
Chicago/Turabian StyleAndrade, Óscar Ramiro, Rafael Camarillo, Fabiola Martínez, Carlos Jiménez, and Jesusa Rincón. 2023. "Impact of the Precursor on the Physicochemical Properties and Photoactivity of TiO2 Nanoparticles Produced in Supercritical CO2" Nanomaterials 13, no. 16: 2328. https://doi.org/10.3390/nano13162328