Article

The Role of Bioenergy in Enhancing Energy, Food and Ecosystem Sustainability Based on Societal Perceptions and Preferences in Asia

by
Lilibeth A. Acosta
1,6,*,
Damasa B. Magcale-Macandog
2,
K. S. Kavi Kumar
3,
Xuefeng Cui
4,
Elena A. Eugenio
2,5,
Paula Beatrice M. Macandog
2,
Arnold R. Salvacion
6 and
Jemimah Mae A. Eugenio
7
1
Potsdam Institute for Climate Impact Research (PIK), Telegraphenberg, 14473 Potsdam, Germany
2
Institute of Biological Sciences, College of Arts and Sciences, University of the Philippines Los Banos (UPLB), Philippines
3
Madras School of Economics, Gandhi Mandapam Road, Chennai 600 025, India
4
School of System Science, Beijing Normal University, No. 19 Xinjiekouwai Street, Beijing 100875, China
5
School of Environmental Science and Management, University of the Philippines Los Banos (UPLB), Philippines
6
Department of Community and Environmental Resource Planning, College of Human Ecology, UPLB, Philippines
7
Institute of Mathematical Sciences and Physics, UPLB, Philippines
*
Author to whom correspondence should be addressed.
Agriculture 2016, 6(2), 19; https://doi.org/10.3390/agriculture6020019
Submission received: 6 April 2016 / Revised: 11 April 2016 / Accepted: 18 April 2016 / Published: 25 April 2016
(This article belongs to the Special Issue Sustainable Agriculture)

Abstract

:
This paper discussed the analysis of the survey on sustainability of bioenergy conducted in the Philippines, India and China. It acquired general perceptions of the people by asking them (a) specific questions about their level of familiarity with bioenergy; (b) relationship of their work to bioenergy; and (c) their opinion on contribution of various feedstock on the economy and impact of bioenergy production on food security. In addition to these questions, we estimated preference weights of various feedstock based on the conjoint choices on bioenergy’s contribution to social stability, social welfare and ecological balance. The estimates revealed significant trade-offs not only among these three dimensions of sustainability but also the relative importance of energy security, food security and ecosystem capacity to other economic, social and environmental objectives. The types of first generation feedstock that are currently used for biofuel production in the respective countries and those that offer alternative household use are perceived as important to the economy and preferred bioenergy feedstock. Based on the results of the study, the preferred role of bioenergy for sustainable development reflects the social and economic concerns in the respective Asian countries, e.g., energy security in China, food security in India, and ecosystem degradation in the Philippines.

1. Introduction

Bioenergy refers to energy from biomass. Based on the nature of utility, biomass can be categorized info raw biomass (e.g., wood) that is used for heating and cooking; and processed biomass (e.g., bioethanol, biodiesel) that are used to generate energy for transport, industry and household purposes. This paper focuses on processed biomass (known as biofuels) and feedstock used for producing biofuels. We used the term bioenergy here to refer to both feedstock and biofuels. We consider two types of bioenergy feedstock, the first generation covering mostly food crops and non-food ligneous biomass (e.g., jatropha) and second generation covering biomass wastes/residues and ligneous plants (e.g., trees, shrubs). Policies promoting bioenergy have been actively pursued in both developed and developing countries but often with different focal objectives. These include climate change mitigation, rural development, energy security, trade and economic growth, etc. Regardless of the objectives, these policies contributed to unprecedented increase in biofuel production. The global production of bioethanol almost tripled from 20 to 50 billion liters and biodiesel increased from 0.8 to almost 4 billion liters from 2001 to 2007 [1]. It further increased to 94 and 30 billion liters of bioethanol and biodiesel, respectively, in 2014 [2].
Energy security, either due to short-term volatility of fossil fuel prices or long-term uncertainty of fossil fuel supply, is one of the most often cited policy objectives for bioenergy development. Tilman et al. [3] argue that if biofuels are chosen wisely, they can be produced in significant amount so as to replace a fair share of fossil fuels. The idea of reducing dependence on foreign sources of energy through local bioenergy production has thus increased the political popularity of biofuels ([4,5,6]), particularly in developed (e.g., US, EU) and emerging economies (e.g., Brazil), resulting in generous government targets for substituting biofuels for fossil fuels in the transport sector. Many other countries were quick to follow and introduced biofuel blending targets: 13 in American region, 12 in Asia-Pacific region, 11 in Africa and the Indian Ocean, and 2 in Non-EU countries in Europe [7]. Countries with little land endowments and high costs of biomass production will not reach their substitution goals without bioenergy trade ([8,9,10]). The promising prospects for bioenergy trade have thus contributed to the fast expansion of land cultivated to bioenergy feedstock not only in developed but also in developing and least developing countries where technologies to process biofuels do not exist.
However, the global expansion of bioenergy has undesirable impacts on food security. The Food and Agriculture Organization (FAO) defines food security based on four dimensions, access, availability, stability and utilization [11]. The controversies on the impacts of bioenergy production on food accessibility, availability and stability made food security as one of the most urgent contemporary public issues. The conversion of agricultural crops and lands from food to bioenergy production has been claimed to contribute to short supply and consequently, high prices of major food commodities [12]. This apparent conflict between biofuel and food production as well as increased food prices have been described as “food versus fuel debate” ([13,14,15,16,17]). Bioenergy affects food accessibility (particularly by the urban poor) through an increase in food prices and also food availability through a decrease in food production. Increase in food prices however may also offer opportunities for farmers through higher income, helping rural areas where 70 percent of the world’s poor are living [18]. Only the first generation “food-crop” bioenergy feedstock is often considered to cause a direct competition with food production so that further development of advanced biofuels from inedible plants is encouraged ([19,20]). However, the use of such non-food crops (e.g., jatropha) also compete with food on land and water use, thus ultimately causing a decline in resources available for food production. Therefore, in the longer perspective, bioenergy production will not only affect the access to and availability of food but also stability of its production.
In addition to land and water competition between fuel and food production, the widespread bioenergy production is causing degradation of the ecosystem. Agriculture activities now require 70 percent of total global water usage and with increased biofuel production it could go up to 90 percent (e.g., [21,22,23]). The use of pesticides and fertilizer to increase land productivity will also cause more water pollution. The dramatic increase in first generation bioenergy production in recent years was achieved through conversion of forests into monoculture soybean, sugarcane, corn, or palm oil plantations. For example, 85 percent of forest destruction in Southeast Asia, particularly in Malaysia and Indonesia during the period 1985–2000 was due to expansion of palm oil plantations ([24,25,26]). Because forests play an important role in storing carbon that is otherwise emitted into the atmosphere, the climate mitigation objective of bioenergy has been negated through large scale deforestations. Moreover, the massive conversion of land into production of bioenergy crops is threatening biodiversity because plantations like oil palm support much fewer species than forests and other tree crops ([27,28]). Referring to previous studies, Hurford and Harou [29] explain that because many of the world’s rural poor rely on ecosystem services provided by environmental resources, their vulnerability increases with the degradation of these resources.
Energy security, food security and ecosystem capacity are very much interlinked, thus, together they present an enormous challenge to the economic, social and ecological sustainability of bioenergy production. However, there are other equally important societal challenges confronting the use of biomass for energy, which often entails some degree of trading off. These trade-offs may undermine energy, food and ecosystem sustainability. Understanding the form of trade-offs can help avoid the selection of “extreme” management policies which can result from considering smaller numbers of objectives, and thus ignoring real system complexity [29]. Moreover, understanding the conflicts due to these trade-offs is particularly important for understanding welfare impacts, coping mechanisms, and environmental feedback effects at the local level [30]. Analysis of trade-offs thus helps to inform about the need for not only a redirection in government policy but also a change in societal behavior. This paper focuses on analyzing societal behavior, specifically the perceptions and preferences of the survey respondents’ towards promotion of sustainable bioenergy feedstock. The paper aims to determine public perceptions on sustainability of first generation “food-crop” bioenergy and how they influence the preferences for alternative feedstock (i.e., non-food ligneous biomass and second generation bioenergy) and the underlying sustainability trade-offs. Moreover, it aims to determine how important are energy security, food security and ecosystem capacity vis-à-vis other economic, social and environmental goals in choosing most preferred bioenergy feedstock. There are few studies that have investigated perceptions and preferences on sustainability of alternative bioenergy feedstock (e.g., [31,32,33,34]) (While the study of Aguilar and W. Thompson [31] showed that grasses are the most preferred feedstocks in Columbia, Missouri, this is not the case in the case study regions in the Philippines, India and China. However, similar to the study of Jensen et al. [32], awareness influences the preferences for feedstock including grasses. Both studies refer only to case studies in one country), and none of them have dealt with its cross-country comparative analysis. This paper contributes to this research gap.
The trade-offs analysis is based on a choice-based conjoint analysis of survey data collected in the Philippines, India and China, where there is an increasing pressure on governments to increase bioenergy feedstock production to meet policy targets. Moreover, the issues of energy security, food security and ecosystem capacity are all important issues in these countries, albeit at varying level. China is confronted by enormous energy security challenges because its economic growth depends on sustainable energy supply and it is now world’s largest consumer of primary energy [35], surpassing the United States in terms of energy demand in 2010 [36]. China, followed by India, is the world’s largest importer of coal. India is the fourth world’s largest consumer of primary energy but is expected to surpass China in coal imports by 2020 [35]. Food security also presents a major problem in both countries because they alone are accountable for 42 percent of hungry population in the world [37]. Poverty remains the most important cause of food insecurity in Asia, and more than 50 and 20 percent of the poorest live in India and China, respectively [38]. However, poverty in China has declined significantly, contributing largely to 48.6 percentage reduction in poverty in Eastern Asia between 1990 and 2010 [11]. India is expected to have more people than China by 2025 [39], and would remain to have the largest poor and hungry population in Asia. In the Philippines, food security is affected by increasing frequency and intensity of typhoons, which devastations are causing more people to live in poverty. The impact of Typhoon Haiyan, one of the strongest that hit the Philippines in 2013, on food security in the poorer regions may persist for years [40]. However, typhoon disasters are not only caused by climatic extremes, but widespread degradation of ecosystem services particularly in the mountainous and coastal areas [41]. In China and India, the main environmental problems are the scarcity of groundwater and pollution of fresh water. India accounts for over a quarter of global groundwater extraction because 85 percent of drinking water and 60–65 percent of irrigation are dependent on groundwater resources [39].
The paper has the following structure: section 2 provides an overview on the bioenergy policies in the three Asian countries, section 3 discusses the methods and materials used in the analysis; section 4 presents and discusses the results; and section 5 provides conclusions.

2. Bioenergy Policy in Asia

Although global biofuel production has significantly increased in recent years, the volume of production in Asia and its neighboring Pacific countries remain small in comparison to countries in Europe and America [2]. Taking into account, however, the available productive resources and development policies for bioenergy, Asia is expected to increase its share in global bioenergy production. Table 1 shows the significant increase in bioethanol and biodiesel production in the last decade and the types of feedstock used in major producing countries in Asia. China and India were the fourth and fifth largest producers, respectively, of global bioethanol after the USA (54 billion liters), Brazil (26 billion liters) and Europe (5 billion liters) in 2014 (Table 1). At the same time, however, China and the Philippines have become major global importers of bioethanol. The case of the Philippines is interesting because it is the only country in the world that mainly uses coconut oil (more superior to palm oil in terms of impacts on climate, i.e., clean air, and ecosystem, i.e., agro-forest system) as feedstock for biodiesel production. Various policies are implemented in Asia to respond not only to international call for climate mitigation but also to the growing world demand for biofuels. The following discussion highlights that there is an increasing pressure to expand feedstock production and ensure domestic supply to meet the blending targets in China, India and the Philippines. Although there was a significant increase in biofuel production in these countries, the pressure continues as a consequence of government policies to promote domestic bioenergy sector.

2.1. Philippines

The Philippine Biofuels Act was signed as a law in January 2007, mandating the government agencies like the Department of Energy, Department of Environment and Natural Resources, Bureau of Products Standards, and Department of Science and Technology to promote the bioenergy sector. Moreover, a number of objectives had been formulated under the National Biofuels Feedstock Program of the Department of Agriculture including the production of sufficient amount of feedstock to meet the demand for biofuels, augmentation of farmers’ income, generation of rural employment, and development of idle and marginal lands. The Program’s incentives and promotion include government financing, credit facilitation services from selected local banks, tax incentives (exemption from value-added taxes for raw materials or feedstock like coconut, sugarcane, jatropha, cassava, and sweet sorghum), market development services, social amelioration, manpower development, seminars, conferences and workshops, tri-media information and web access [42].
The Philippine Biofuels Act followed multi-stage strategy to promote local production and consumption of biofuels:
Within three months from the effectivity of the Act, a minimum of one percent biodiesel was required to be blended into all diesel engine fuels sold in the member economy;
Within two years from the effectivity of the Act, the feasibility of mandating a minimum of two percent blend of biodiesel was assessed taking into account considerations including but not limited to domestic supply and availability of locally-sourced biodiesel component;
Within two years from the effectivity of the Act, at least five percent bioethanol was to comprise the annual total volume of gasoline fuel sold and distributed by all oil companies in the country;
Within four years from the effectivity of the Act, the feasibility of mandating a minimum of 10 percent blend of bioethanol into all gasoline fuel distributed and sold by all oil companies was also assessed; and
According to National Biofuels Plan 2013–2030, the blending requirements for both biodiesel and bioethanol are to be increased to 20 percent by 2030.
The Act envisions that all biofuels are to be blended with domestically-sources liquid fuels. The imports of biodiesel are prohibited. However, due to lack of bioethanol in the domestic market, the government is permitting oil companies to import bioethanol to meet the blending targets. The bioethanol imports were as high as 339 million liters in 2014, but are expected to decline to 251 million liters in 2016 due to increase in domestic ethanol production [43]. Biomass for bioenergy production is exempted from value added tax and biofuel companies with 60 percent local ownership are provided financial assistance [44]. Whilst there were no reported obstacles during the transition to a higher biodiesel blend due to adequate local supply [45], the bioethanol situation was less stable. To comply with the bioethanol mandates, local companies continue to import bioethanol due to supply scarcity, price volatility and lack of competitiveness. In 2014, the Philippines had still one of the lowest domestic bioethanol production of 110 million liters (Table 1). Despite concerns about the impacts of importing bioethanol on local production, the government continue to approve further imports which correspond to about 70% of the total volume required to meet the blending targets [46].

2.2. India

India’s biofuel policy regime is influenced broadly by energy security issues, environmental concerns, wasteland utilization, and enhance rural livelihood options. The launching of National Mission on Biodiesel in 2003 and announcement of biofuel purchase policy in 2006 provided the initial push to develop the local biofuel industry. The former identified jatropha as the most suitable inedible feedstock for biodiesel [47]. The National Policy on Biofuels adopted in 2009 envisaged to strengthen India’s energy security by encouraging use of renewable energy resources to supplement transport fuels. The policy aims to replace 20 percent of transport petrol and diesel fuels with biofuels (both bioethanol and biodiesel) by the end of 2017 [48]. Moreover, the policy emphasized use of degraded and waste lands not suitable for agriculture to raise bioenergy feedstock to avoid food versus fuel dilemma. More importantly, however, given the limited scope for increasing arable land, meeting the blending targets in 2017 will only be possible by using lands under extreme marginal conditions [49]. In addition to setting-up of a National Biofuel Fund for providing financial incentives, subsidies and grants for new and second generation bioenergy feedstock included, the policy also advocated establishing minimum support price mechanism to ensure fair price for bioenergy feedstock growers. There is also a basic model for jatropha cultivation that are supported by both public-private and private initiatives in India. In either case the cultivation is done in contract farming mode with the farmer leasing out his/her land for jatropha cultivation (since the cultivation requires 3–4 years to provide yields) and subsequently selling the jatropha seeds to the contracted company. The farmer is assured a fixed annual income till the crop starts giving yield. Oil extraction is done at one of oil extraction units (over 10 units exist in India) and supplied to either national or international market.
The feasibility analysis of meeting blending targets outlined in the National Biofuel Policy raises important issues regarding land availability in case of biodiesel production, and the need for identifying alternative feedstock in case of bioethanol production. While Singhal and Sengupta [59] show that about 37.38 million hectares of wasteland suitable for jatropha cultivation is available in India. However, a significant number of the rural population is dependent on miscellaneous tree growth on these so-called wastelands for their food and livelihood. In addition, the overall area under food grains has remained static in India over past decade or so. In such context use of wasteland for fuel purposes remains debatable. This acquires further importance in the context of South Asian Enigma of stagnant per-capita food consumption (compared to North Africa and West Asia) despite impressive growth registered in terms of per-capita income. In case of ethanol blending, achieving a 10 percent blending will be difficult due to the demand for alcohol from the potable and chemical sector, which is growing at 3–4 percent per annum, and the highest available alcohol from molasses set at 2.3 billion liters [60]. However, the government increased the blending targets from 5 to 10 percent in 2015 [61]. According to Basavaraj et al. [60], meeting the 10 percent blending would require using 10.5 million hectares of productive land and producing 736.5 million tons of sugarcane, which are twice as the current area and volume of production. Considering the problem of water scarcity in India, the water requirement (i.e., 20,000–30,000 m3) for producing per hectare of sugarcane will limit the potential for expanding production [60]. Moreover, the lack of technological inputs and infrastructures are considered the major hurdles for implementing such intervention. Increasing the area under sugarcane will be at the cost of diverting land from other staple food crops [62]. Finally, achieving only 1.37 per cent blending of ethanol in 2014 due to competition of feedstock use for liquor and chemical industry [63], the policy target of 20% ethanol blending is unlikely to be realized in 2017.

2.3. China

China has shifted from being a net energy exporter to being an importer since the late 1990s and is becoming one of the largest importers in the world in recent years [64]. Due to increasing energy pressure and energy security concerns, the search for alternative sources of energy has become a top policy priority of the Government of China [1,64]. Bioenergy is part of the country’s long run strategic energy plan and included in the Five Year Plan since 1995 ([65,66]). While there are currently no national blend mandates for biofuels, six provinces have already adopted the 10 percent ethanol (E10) blending regulation and seven other are in pilot testing stage in 2015 [65]. The E10 was first introduced in the provinces of Henan and Heilongjiang in 2003 [64]. The government announced the standard for Biodiesel Fuel Blend (B5) or 5 percent biodiesel blending in 2010, which is currently under pilot testing in gas stations in Hainan province [67]. Biofuel industry depends largely on ethanol production from grain products, but slowly expanding to cover other crops like cassava, sweet sorghum and sweet potatoes. China has become the third world largest bioethanol producer due to the combined effects of favorable feedstock production and strong policy support. The huge corn surplus was used for the Ethanol Promotion Program in 2002, followed by the upscaling of Pilot Testing Program on Bioethanol Gasoline for Automobiles from state to national level in 2004 [68]. The major policy support for the implementation of the pilot testing program include (1) waiving 5% consumption tax on all bioethanols under the E10 program for all bioethanol plants; (2) annual refund of value-added tax (normally 17%) on bioethanol production; (3) subsidizing grains reserved in national stocks that are not suitable for human consumption to be used as feedstock by all bioethanol plants; (4) annual subsidy for the gap between marketing revenues and production costs plus a reasonable profit that the firm could have obtained from an alternative investment; and (5) ensuring markets for the bioethanol produced by state-owned plants (i.e., under pilot program) and excluding competition from private plants [64].
In contrast to bioethanol, many biodiesel refineries operate below production capacity due to not only limited feedstock supply but also inadequate policy incentives [69]. There were about 10 biodiesel plants in China in 2007, producing about 0.2 million tons per year and using mainly industrial waste oil and waste cooking oil as feedstock [70]. Biodiesel production picked up only in 2008, after the adoption of Renewable Energy Law in 2005 and formulation of the Middle and Long Term Development Plan of Renewable Energy in 2007. The former is aiming to make investment among others in biomass power plants, transfer technology from biomass to liquid fuel, demonstration and industrialization project for jatropha, etc. [71], while the latter is targeting to produce 2 and 10 million tons per annum of biodiesel and bioethanol, respectively, by 2020 ([64,72]). The policies supporting the biofuels sector based on the renewable energy law and plan are similar to the pilot testing program, with only few revisions including flexible subsidy for loss due to oil price changes and new subsidy for developing new production base of feedstock [64]. Production of biodiesel has reached one million tons and that of bioethanol about 2.5 million tons in 2015 [65]. The future policy direction in China is to promote cellulosic and algae based biofuels to achieve the 2020 targets. Initial steps to achieving this have been put in place in 2013 by introducing higher subsidies for cellulosic ethanol production and phasing out subsidies for conventional grain-based biofuels [65].

3. Methods and Materials

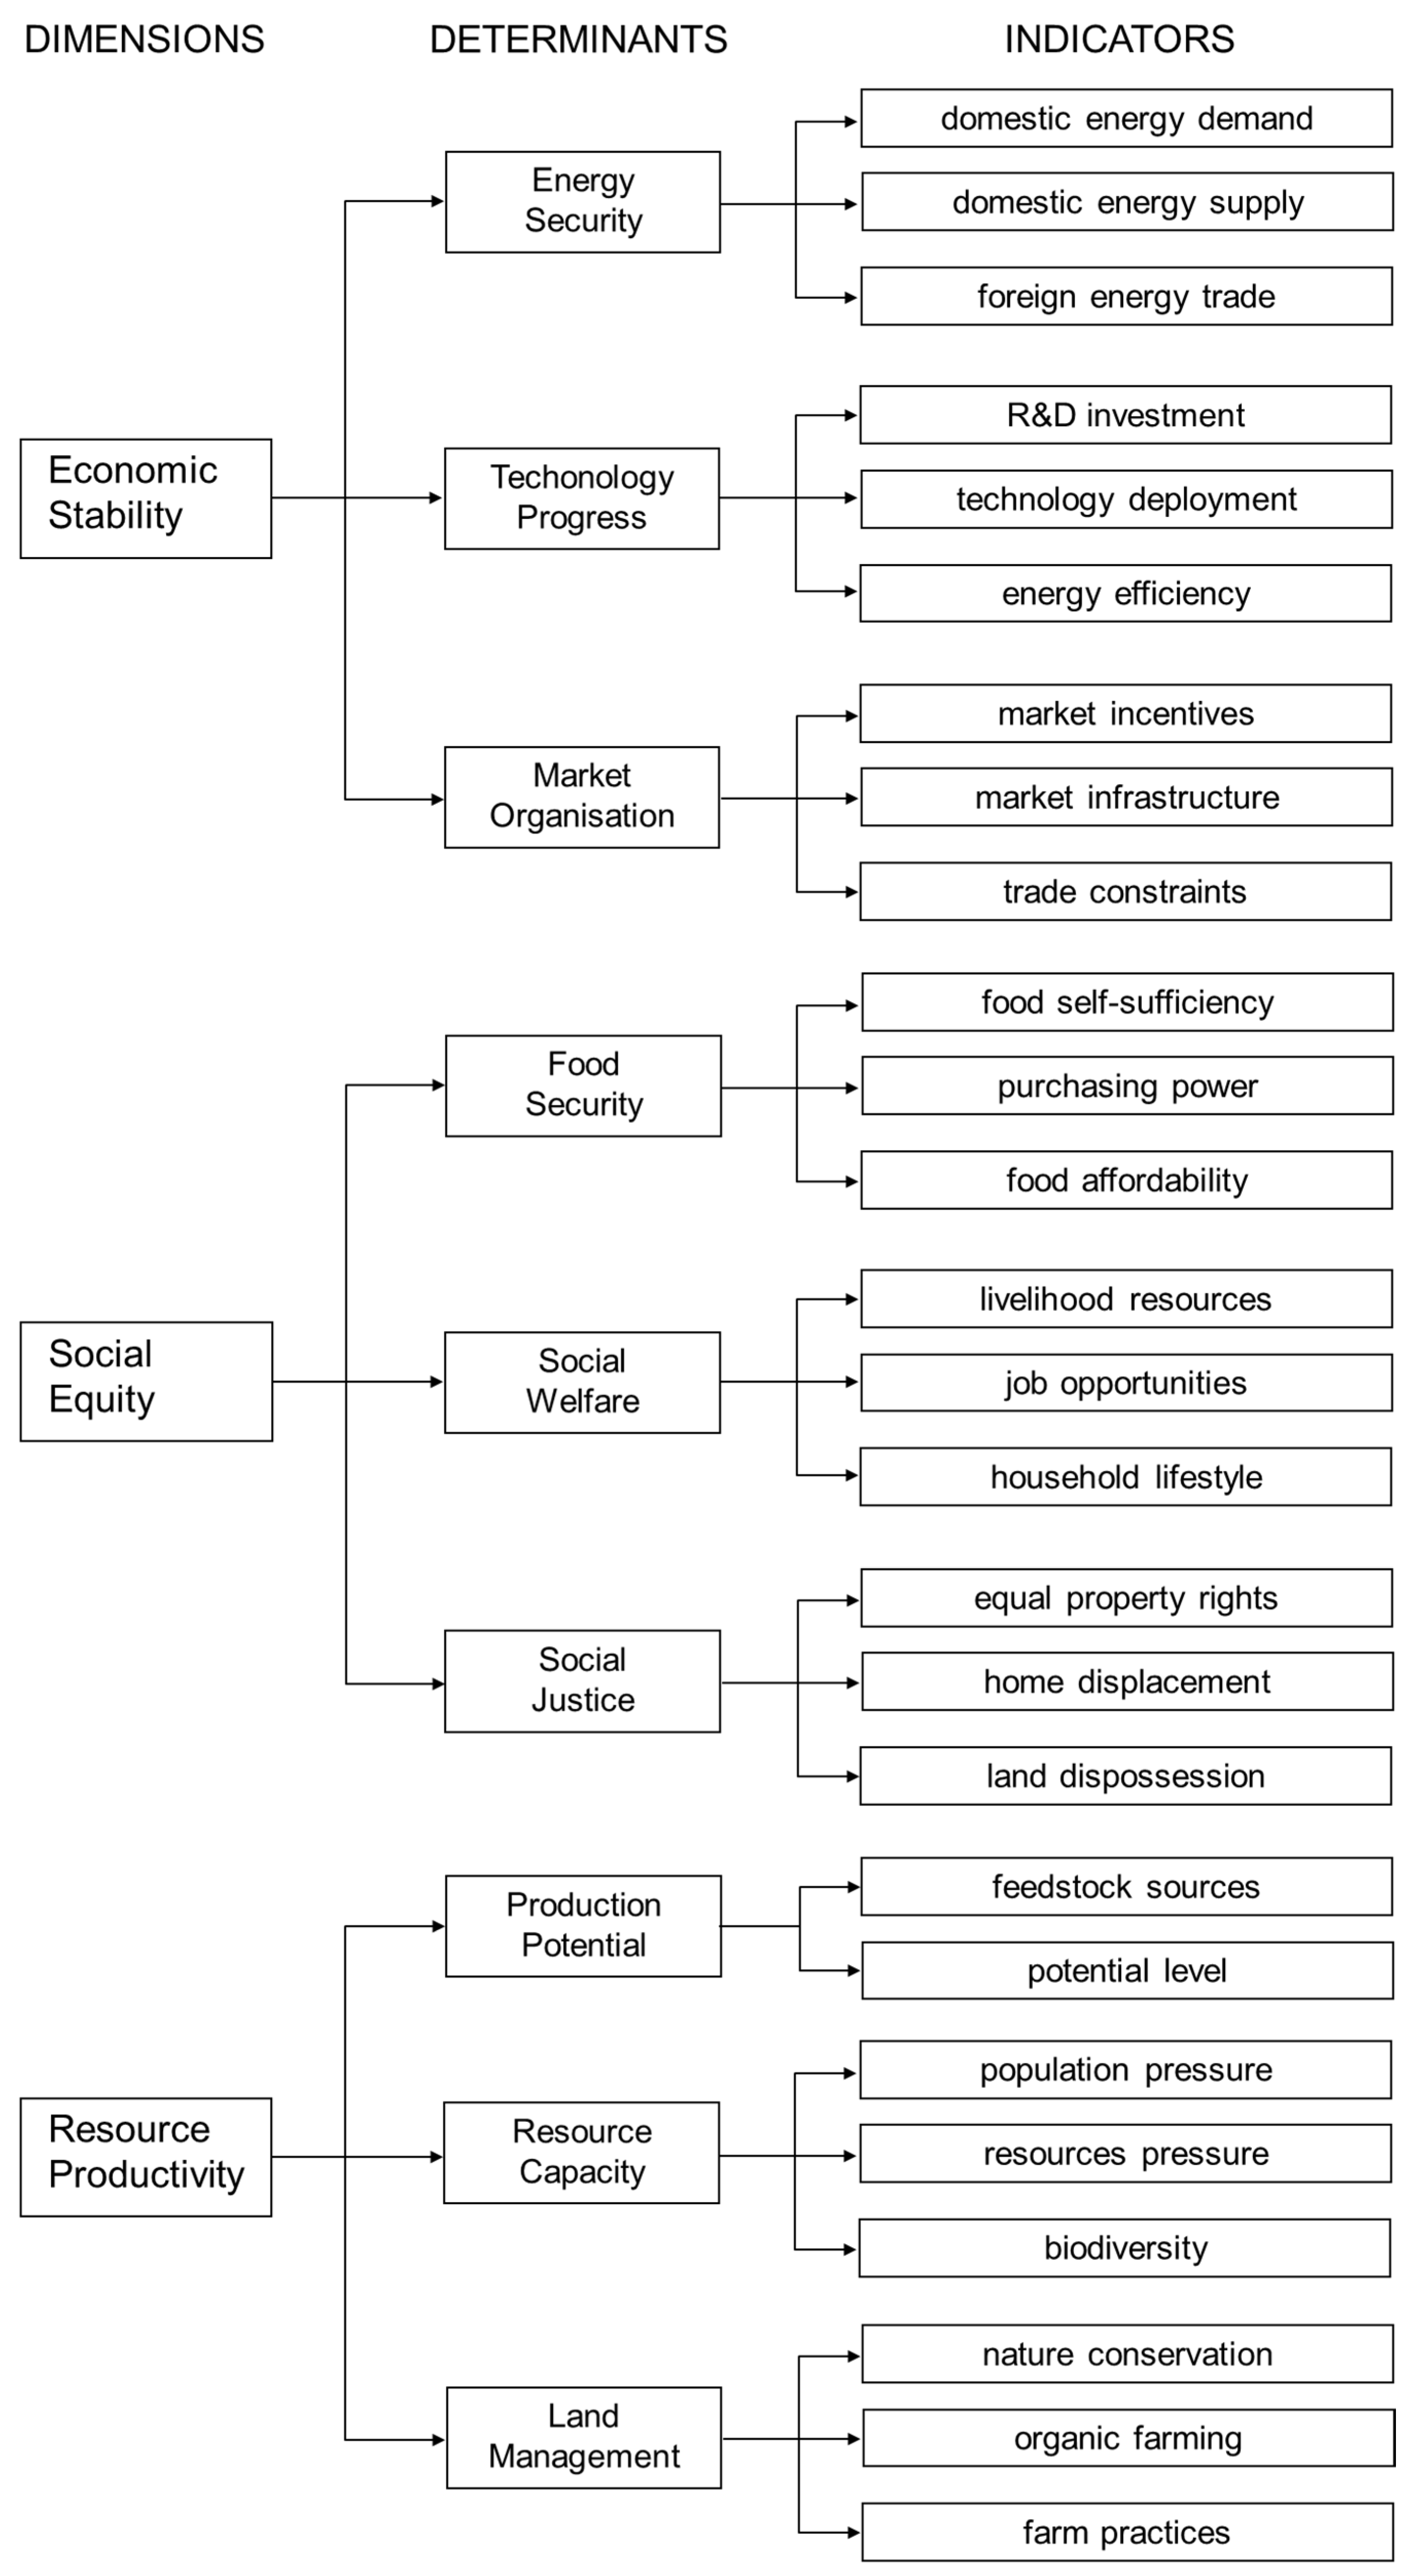
3.1. Conjoint Analysis and Framework

We applied choice-based conjoint (CBC) analysis to estimate the preferences on alternative bioenergy feedstocks. The respondents’ choices are based on a set of attributes and their respective levels. The attribute levels define the choice tasks in the survey questionnaire and are thus core elements in the CBC analysis. Figure 1 presents the Sustainability Trade-offs and Pathways (STRAP) framework ([34,73]), which guided the selection of attributes and attribute levels. The STRAP approach takes into account the conceptual interconnections and interdependencies between the determinants and their underlying indicators of economic, social and ecological sustainability. Energy security, technology progress, and market organization are the determinants for economic stability; food security, social welfare, and social justice for social equity; and production potential, ecosystem capacity, and land management for ecological balance. These determinants represent the attributes and the indicators for these sustainability determinants represent the attribute levels in the survey design. A detailed discussion on the relevance of these determinants for bioenergy sustainability is available elsewhere ([34,73]). The conjoint attributes and sustainability determinants have the same meaning and these terms will be both used throughout the paper.
Following from Figure 1, Table 2 describes the attributes and the attribute levels that were used for designing the CBC survey questionnaire. Each attribute level is further defined according to its desirability for the society, which aims to make the respondents decide on trading-off between more and less desirable levels of the indicators. Each attribute has a total of 6 levels – 3 desirable and 3 undesirable attribute levels. The possible combinations of the different attribute levels make up the different options in a choice task. Table 3 presents three examples of a choice task, each task representing different options for the three sustainability dimensions – economic stability, social equity and ecological balance. The respondents were asked to choose only one among three options in each choice task. The options are linked to a given type of biomass (or feedstock), which can either be first generation or second generation bioenergy crops. The feedstock attribute levels were used as reference for each option so that the respondents can explicitly link their choice decisions to the types of biomass. This then reduces the problem of abstraction that is common in sustainability assessments. Only three options per task and five tasks per sustainability dimension were presented to make it easier and faster for the respondents to make their choices. Too many options and tasks could result in a decrease in survey completion rate, or confuse the respondents and make them respond superficially. The small number of options and tasks was however offset by increasing the number of questionnaire versions, which helped to improve the design efficiency (i.e., increase sample size). To ensure efficient CBC design prior to the survey, we conducted statistical tests to identify the appropriate number of versions for the given number of options and tasks. We used 50 versions of the questionnaire, each having different set of options per tasks.
The objective of the choice-based conjoint analysis is to estimate part-worths or utilities, which measure the relative desirability or worth of an attribute level ([74,75]), i.e., the higher the utility, the more desirable is the attribute level. The respondents’ choices were analyzed using the CBC module, specifically the Hierarchical Bayes (HB) method of the Sawtooth Software (http://sawtoothsoftware.com/). The CBC/HB tool can capture preferences of individuals (i.e., respondent level) and groups of individuals (i.e., segment level) [76]:
Y i = X i β i + ε i
β i = Θ z i + δ i
where in the first equation, Yi is a vector of the responses from the choice tasks, Xi is a matrix of the attribute levels, βi is the p-dimensional vector of regression coefficients representing the utilities, and εi is a p-dimensional vector of random error terms. In the second equation, Θ is a p by q matrix of regression coefficients (i.e., utilities), zi is a q-dimensional vector of covariates and δi is a p-dimensional vector of random error terms. The CBC model is called hierarchical because it models respondents’ preferences as a function of a lower- or individual-level (within-respondents) model and an upper-level (pooled across respondents) model [77]. According to Lenk et al. [78], hierarchical Bayes analysis creates the opportunity to recover both the individual-level part-worths and heterogeneity in part-worths, even when the number of responses per respondent is less than the number of parameters per respondent. This makes the model in Equations (1) and (2) very useful in cases of small respondent population, where i = 1 ….n number of respondents. Equation (1) reflects the individual-level model and assumes that the respondent chooses options according to the sum of utilities. Equation (2) is an upper-level model that describes the heterogeneity in the individual utilities across the population of respondents. The heterogeneity is captured in covariates describing the respondent attributes. According to Orme and Howell [77], the most useful covariates bring exogenous information (outside the information already available in the choice tasks) to the model to improve the utility estimates. In this paper, we introduce a-priori segmentation where two segments, i.e., agriculture (AGRI) and non-agriculture (NON-AGRI) professions, were used as covariates in the model.
The utilities generated from the CBC/HB tool for individual respondents were further analyzed using the Sawtooth Software Market Research Tools (SMRT). The SMRT uses logit analysis to provide an indication of the statistical significance of the attributes. Moreover, it computes the coinjoint “importances” (or preference weights), which characterize the relative importance of each attribute. From the segmented conjoint utilities Θ generated from the CBC/HB segment-level utility data (i.e., Equation (2)), the preferences weights (ω) of the various attributes (R) were computed as follows:
ω i j = ( R i j / i = 1 n R j ) * 100
R i j = Θ i j max Θ i j min
where i refers to attribute levels and j refers to the segments. The weights measure the relative importance of the different attributes to each other. The t-ratios from logit analysis need careful interpretation because the conjoint utilities in each attribute are zero centered. The likelihood that one of the levels will have a utility around zero is high, which does not necessarily mean that this attribute level has no impact on respondents’ choices [79].

3.2. Survey Administration

The Sawtooth Software was used not only to analyze the responses of the respondents (i.e., compute utilities and preference weights), but also to construct the choice tasks and prepare the conjoint questionnaire using its SSIWeb module. We used complete enumeration as a random tasks generation method and traditional full profile design. We aimed to cover respondents from five groups of professions including public agency, private company, academic, farm and others not belonging to any of the other professions (e.g., retired, unemployed, housewives). The web-platform of the software was used to conduct the survey through the internet. Online survey enables to reach different groups of respondents in different parts of the country with minimum expenses. However, online survey is more difficult to conduct because people are not very interested or do not have much time to complete the survey. The web link to the survey was sent to the respondents per e-mail. We adopted purposive and snowball (or chain referral) sampling techniques. Purposive sampling technique was used to ensure that respondents in different groups are represented in the survey. This was done by contacting heads of institutions and those with personal contacts to respondents to send invitations to complete the survey. The purposive sampling technique have helped to increase response rate of the online surveys in the Philippines and China. The snowball sampling technique was used to increase the number of respondents, particularly if the target respondents were not available to complete the survey. The latter were requested to forward our e-mail to colleagues, friends or relatives, who belong to similar profession and would be willing to complete the survey.
For respondents who did not have access to internet, we converted the same survey into CAPI (Computer Aided Personal Interview) module, which refers to data collection using a laptop or a personal computer not connected to the internet. CAPI survey enabled us to reach respondents from the farms who are important producers of bioenergy feedstock and who mostly do not have access to internet. However, because CAPI survey entails large budget, only specific case study areas were selected to interview the farmers. In case of India where response rate to online survey was relatively low despite repeated reminders, CAPI survey was also conducted to collect information from respondents in other professions (i.e., government officials and employees, academic and research professionals, private company managers and workers, etc.). The respondents were contacted and after securing their consent, the CAPI survey was presented to the respondents and filled by the enumerators using their laptops. This approach limited the possibility of securing responses from people with significant geographical diversity.
In China, the respondents for the CAPI survey were randomly selected by knocking on the door. Most of them have little knowledge of computer, so the answers to the questions were typed by the enumerators. In the Philippines, official permission to conduct survey was first obtained from the municipal and village officers, who then helped in identifying and contacting respondents. The survey questionnaire consists of the same set of questions and identical set of attributes and levels in the conjoint choices in the Philippines, India and China in order to facilitate cross-country comparative analysis. The survey was pre-tested in the Philippines using the CAPI module, which enabled the enumerators to collect suggestions on how to improve the questionnaire. While the conjoint choices were well understood by the respondents in the Philippines and China, some respondents in India expressed reservations about the contradictory nature of choices inherent in the survey methodology adopted in the study. These in turn would highlight the need for interpreting the survey responses in India with caution. The numbers of qualified survey are 250 in the Philippines, 160 in India and 168 in China.

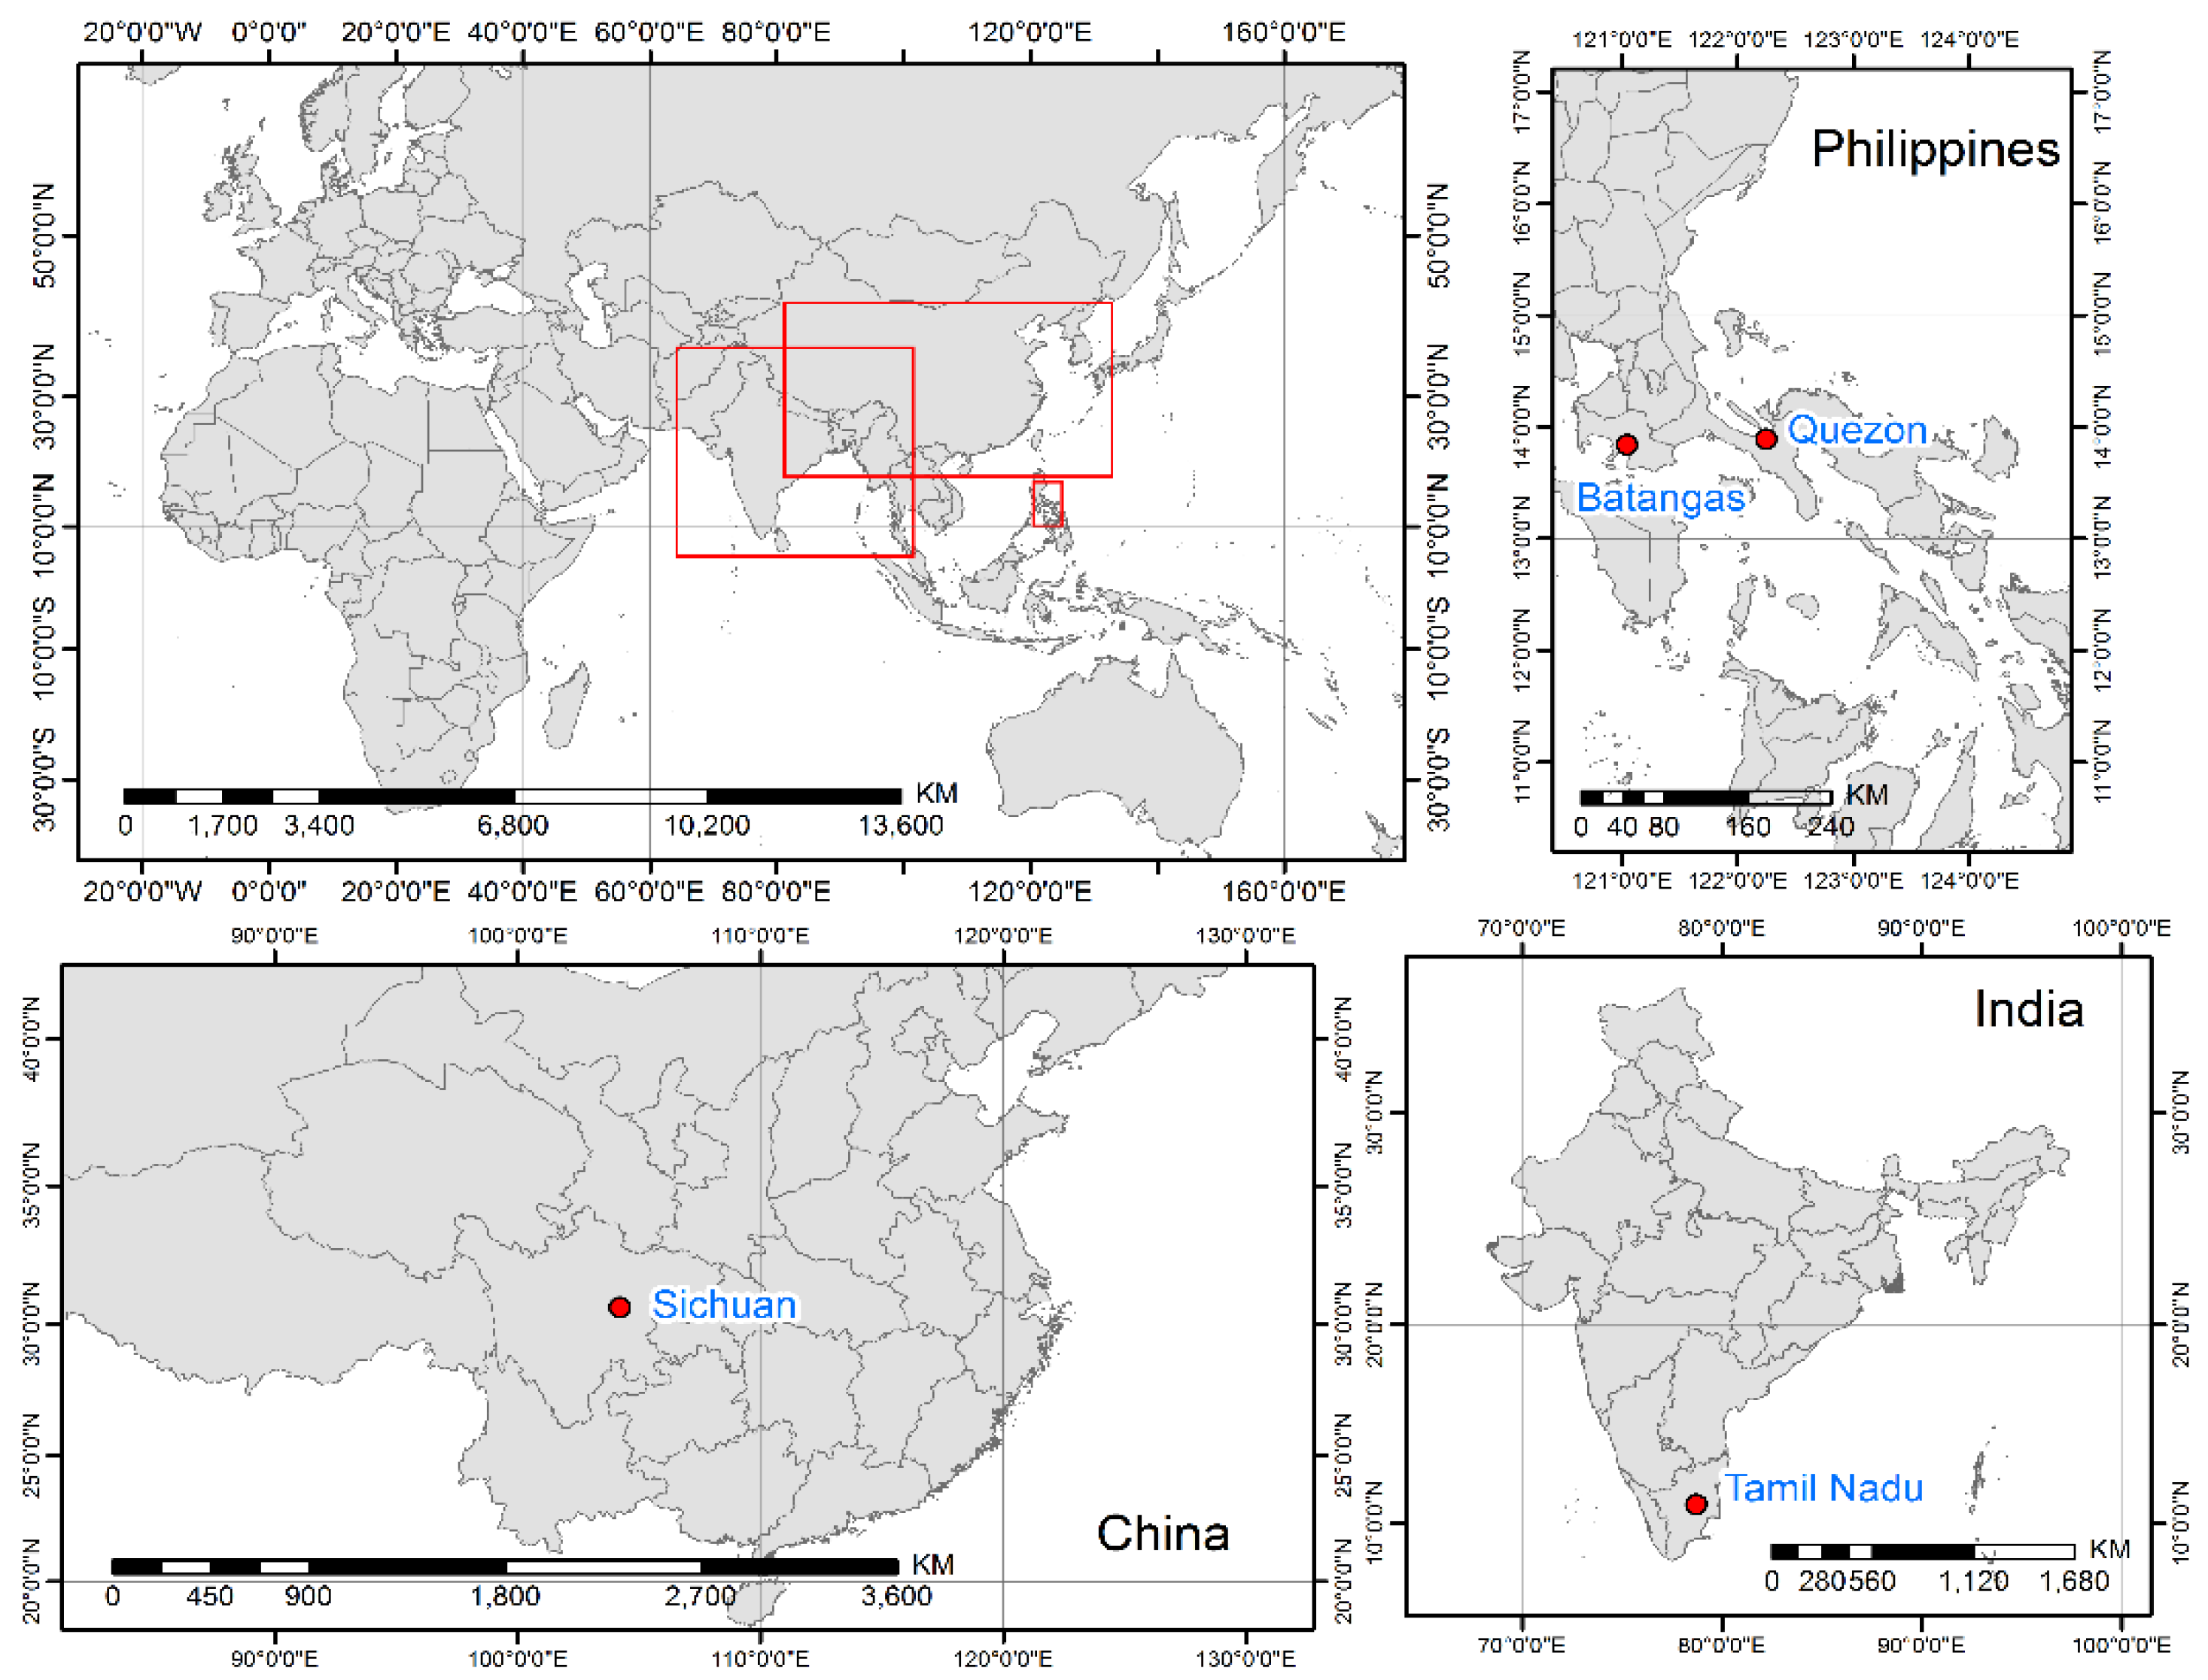
3.3. Case study Areas for the CAPI Survey with Farmers

In the Philippines, the farmer respondents were located in the provinces of Batangas and Quezon (Figure 2), which are main producers of sugarcane and coconut in the Calabarzon region. Calabarzon has a total land area of 1,664,403 hectares, which comprise 5% of the Philippine Archipelago and the most populated region of the country with a population of 12,609,803 [80]. Rice and corn are the most dominant crops, but the region is the country’s fourth and fifth largest producer of sugarcane and coconut, respectively. The four climate types are represented in this region. Batangas is a first class province located on the southwestern part of Luzon with a total land area of 316,581 hectares and have a population of 2,377,395 [81]. Batangas is a combination of plains and mountains, where the world's smallest volcano, Mt. Taal, with an elevation of 600 meters, is located. The municipality of Nasugbu in Batangas is the home of the plantation of Central Azucarera Don Pedro, the Philippines' largest producer of sugar and other sugarcane products. Batangas is an adjacent city to Metro Manila where four biofuel processing plants with a total capacity of over 200 million liters per year are located. In Quezon, the survey focused in the municipality of Infanta, which is a first class municipality in the province of Quezon with a total land area of 34,276 hectares and a population of 648,181. Half of the population earn their living through primary and secondary types of livelihood. There are three biofuel processing plants in Quezon with total capacity of 140 million liters per year.
In India, the CAPI survey with the farming community was carried out among farmers cultivating jatropha in Tamil Nadu (Figure 2). Tamil Nadu (Southern India) is one of the earliest states to have promoted biofuel promotion in India. The state started promotion of jatropha cultivation way back in 2002, ahead of the launch of National Biofuel Mission in 2003. The state also established a Center of Excellence in Biofuels at the Tamil Nadu Agricultural University (TNAU) in Coimbatore to promote research and dissemination. The state was the third largest cultivator of jatropha in India in 2008 with more than 20,000 ha cultivated under this crop. Over the period 2007–2012, the Tamil Nadu government aimed to bring 100,000 ha under jatropha cultivation, with the government selling the seedlings to farmers with a 50 percent subsidy. The government aimed to promote jatropha cultivation mainly through contract farming with Agriculture Department serving as the nodal agency in charge of implementing the program and TNAU developing the seed technology and administering the seedling subsidy. The government support was also provided in the form of subsidized buy-back of seed and free seedlings; credit from agricultural co-operative banks to reduce the financial investment risk to farmers, and standardized technical assistance to the farmers. The basic model for jatropha cultivation has been similar across both public-private and private initiatives.
In China, the Qu County in the province of Sichuan was chosen as the case study to do offline survey with local farmers (Figure 2). Inside Sichuan province large developmental gaps exist between eastern and western regions, where its physical features express to a considerable extent the province’s economic and social disparities [82]: Although several very poor regions lie in the Sichuan Basin’s north-east, especially the areas along the Daba Mountains, most other regions of the basin are more prosperous and economically advanced than Sichuan’s western mountain region, the main domicile of the province’s minority nationalities. Moreover, the Sichuan Basin--known as “heaven’s storehouse” in China because of its subtropical climate, fertile ground, plentiful water resources, and several waves of migration over the centuries–is one of China’s most abundant and productive agricultural areas [82]. The county is located at southwest of Dazhou City in Sichuan. Qu County occupies about 2000 km2 including more than 60 villages with 1.48 million residents. It is an important county in Sichuan with its agricultural products, e.g., woven bamboo wares, yellow daylily. However, Qu county is still a least developing area in China. A lot of residents turn to big cities like Beijing or Shanghai for a better income. The survey site is taken in the village Wujing (in Chinese it means five wells) at the east of Qu County. In recent years, a number of biogas pools have been constructed in Wujing, which uses feces or crop residues to provide electricity or cooking fuel. However, the efficiency of these pools needs further improvement for higher benefit.

4. Results

4.1. Demographic Profile of Respondents

The main demographic characteristics of the respondents like age, education, gender, domicile and place of work vary in the Philippines, India and China (Table 4). The majority of the respondents in the Philippines and China are young with age less than 30 years, particularly among those in NON-AGRI profession who account for more than 70 percent of the respondents in this segment. In India, about half of the respondents are between 41 and 50 years of age. The level of education in the Philippines and India are relatively high for most respondents, with more than half having completed university degree particularly those in NON-AGRI profession. China has largest number of AGRI respondents who have reached only grade school. The gender distribution of respondents is relatively balanced in the Philippines and China, but not in India where respondents are male dominated. Across all three countries, respondents who are engaged in AGRI profession are largely domiciled in farm/agriculture areas and those in NON-AGRI profession are mainly living in urban and suburban areas. The good representation of respondents from various fields including public, private, academic, and farm was evident because the location of work of the respondents has the highest diversity among the five demographic characteristics. In the Philippines, while a large number of the AGRI respondents are working either in the farm or in public offices, the NON-AGRI respondents are mainly working in private companies, non-government organizations and others (altogether 71 percent). In India, while the respondents in AGRI profession are relatively well distributed among public, private, and farm, those in NON-AGRI are dominated by private and non-government institutions (53 percent). In China, the respondents with AGRI profession are mainly farmers (56 percent) and academics (38 percent). The respondents from the academe also largely represent the NON-AGRI profession (68 percent).

4.2. Knowledge and Perceptions on Sustainable Bioenergy

In India, the level of awareness about bioenergy is surprisingly high with both AGRI and NON-AGRI respondents indicating familiarity with the term bioenergy and more than 90 percent finding their work linked to bioenergy (Table 5). This may be ascribed to the limited geographical diversity of respondents and survey procedure of contacting, and thus informing, them about the purpose of the survey ahead of time. After India, the respondents in the Philippines show high familiarity on bioenergy issues although only few of them are engaged in bioenergy related work. However, it should be emphasized that although the farmers who were surveyed are producing sugarcane and coconut– the major biofuel feedstock in the Philippines, they think that their work are not related to bioenergy production. In China, familiarity with bioenergy is only high among respondents with NON-AGRI profession because of their high level of education. Only very few respondents in both professional segments think that their work is related to bioenergy.
Across all three Asian countries, majority of the respondents have the opinion that bioenergy is good for the economy (Table 5). However, the opinion on the effects of bioenergy on food security generally diverged. About half of the Philippine respondents from both AGRI and NON-AGRI professions think that bioenergy has negative effects on food security. The main sources of information of respondents in both professional segments are the academe and media. In India, while half of the AGRI respondents have the opinion that bioenergy affects food security, only a quarter of the NON-AGRI respondents think the same. This implies that NON-AGRI respondents in this country who have high level of education and living in urban areas are either less informed or less affected, and thus less concerned, about the conflicting issues between bioenergy production and food security. The main sources of information of respondents with NON-AGRI profession are the academe and business partners. Media does not play a significant role among NON-AGRI respondents in India. In China, there is a reverse pattern of opinion. About half of the NON-AGRI respondents think that bioenergy affects food security, and only less than a quarter of the AGRI respondents think the same. The latter group of respondents in China are characterized by very low education and mainly living and working in the farm. Moreover, while academe is the main source of information for NON-AGRI respondents, family still plays a more significant role among AGRI respondents.
Table 6 presents the perceptions of the respondents on the contribution of various energy sources and biomass feedstock to economic growth in their countries. In the Philippines, bioenergy and other renewable energy are considered by respondents with AGRI and NON-AGRI professions to have high potential to contribute to economic growth. Moreover, almost half of the NON-AGRI respondents also consider combined (i.e., mix energy) sources to have very high economic contribution. This could be attributed to the tradition of using various sources of energy in the Philippines [34]. Among the first generation bioenergy feedstock, oil-rich crops are generally perceived as most suitable feedstock, with majority of the Philippines respondents indicating high to very high level of contribution to economic growth. This reflects the popularity of coconut oil as main feedstock for biodiesel production in the country. All three types of second generation bioenergy feedstock are considered to have high level of economic contribution, although a slightly larger number of respondents have this opinion for farm and forest residues. In India, fossil fuels are perceived by largest number of NON-AGRI respondents (60 percent) to have high level and by largest number of AGRI respondents (49 percent) to have very high level of economic contribution. First generation bioenergy feedstock only from sugar-rich crops are considered to have high level of contribution to the economy, which reflects the popular use of molasses sugar for bioethanol production in India. Starch-rich and oil-rich crops are perceived to only have low or medium level of economic importance. Many of the AGRI respondents (33 percent) do not even know if these bioenergy crops can have economic contribution in India. As compared to first generation, second generation bioenergy feedstock is generally perceived to be more economically useful, except for perennial grasses. Between farm/forest residues and fast growing trees, respondents in both professional segments consider the latter relatively more important for economic growth. Like in India, respondents in China consider fossil fuel to be the most important source of energy to promote economic growth, with 61 percent of AGRI respondents indicating high level and 53 percent of NON-AGRI respondents indicating very high level of economic contribution. China is the world’s largest coal producer and, although it is diversifying its energy sources to comply with clean air standards, still depends a lot on this fossil fuel for its energy supply. The AGRI respondents consider both sugar- and starch-rich crops to have high level of economic contribution, while the NON-AGRI respondents consider all three first generation bioenergy feedstock to be useful for the economy. Like in the Philippines, the respondents consider all types of second generation bioenergy feedstock to be important for economic growth in China, with the exception of the perennial grasses which many AGRI respondents perceived to have less level of importance than other second generation feedstock.

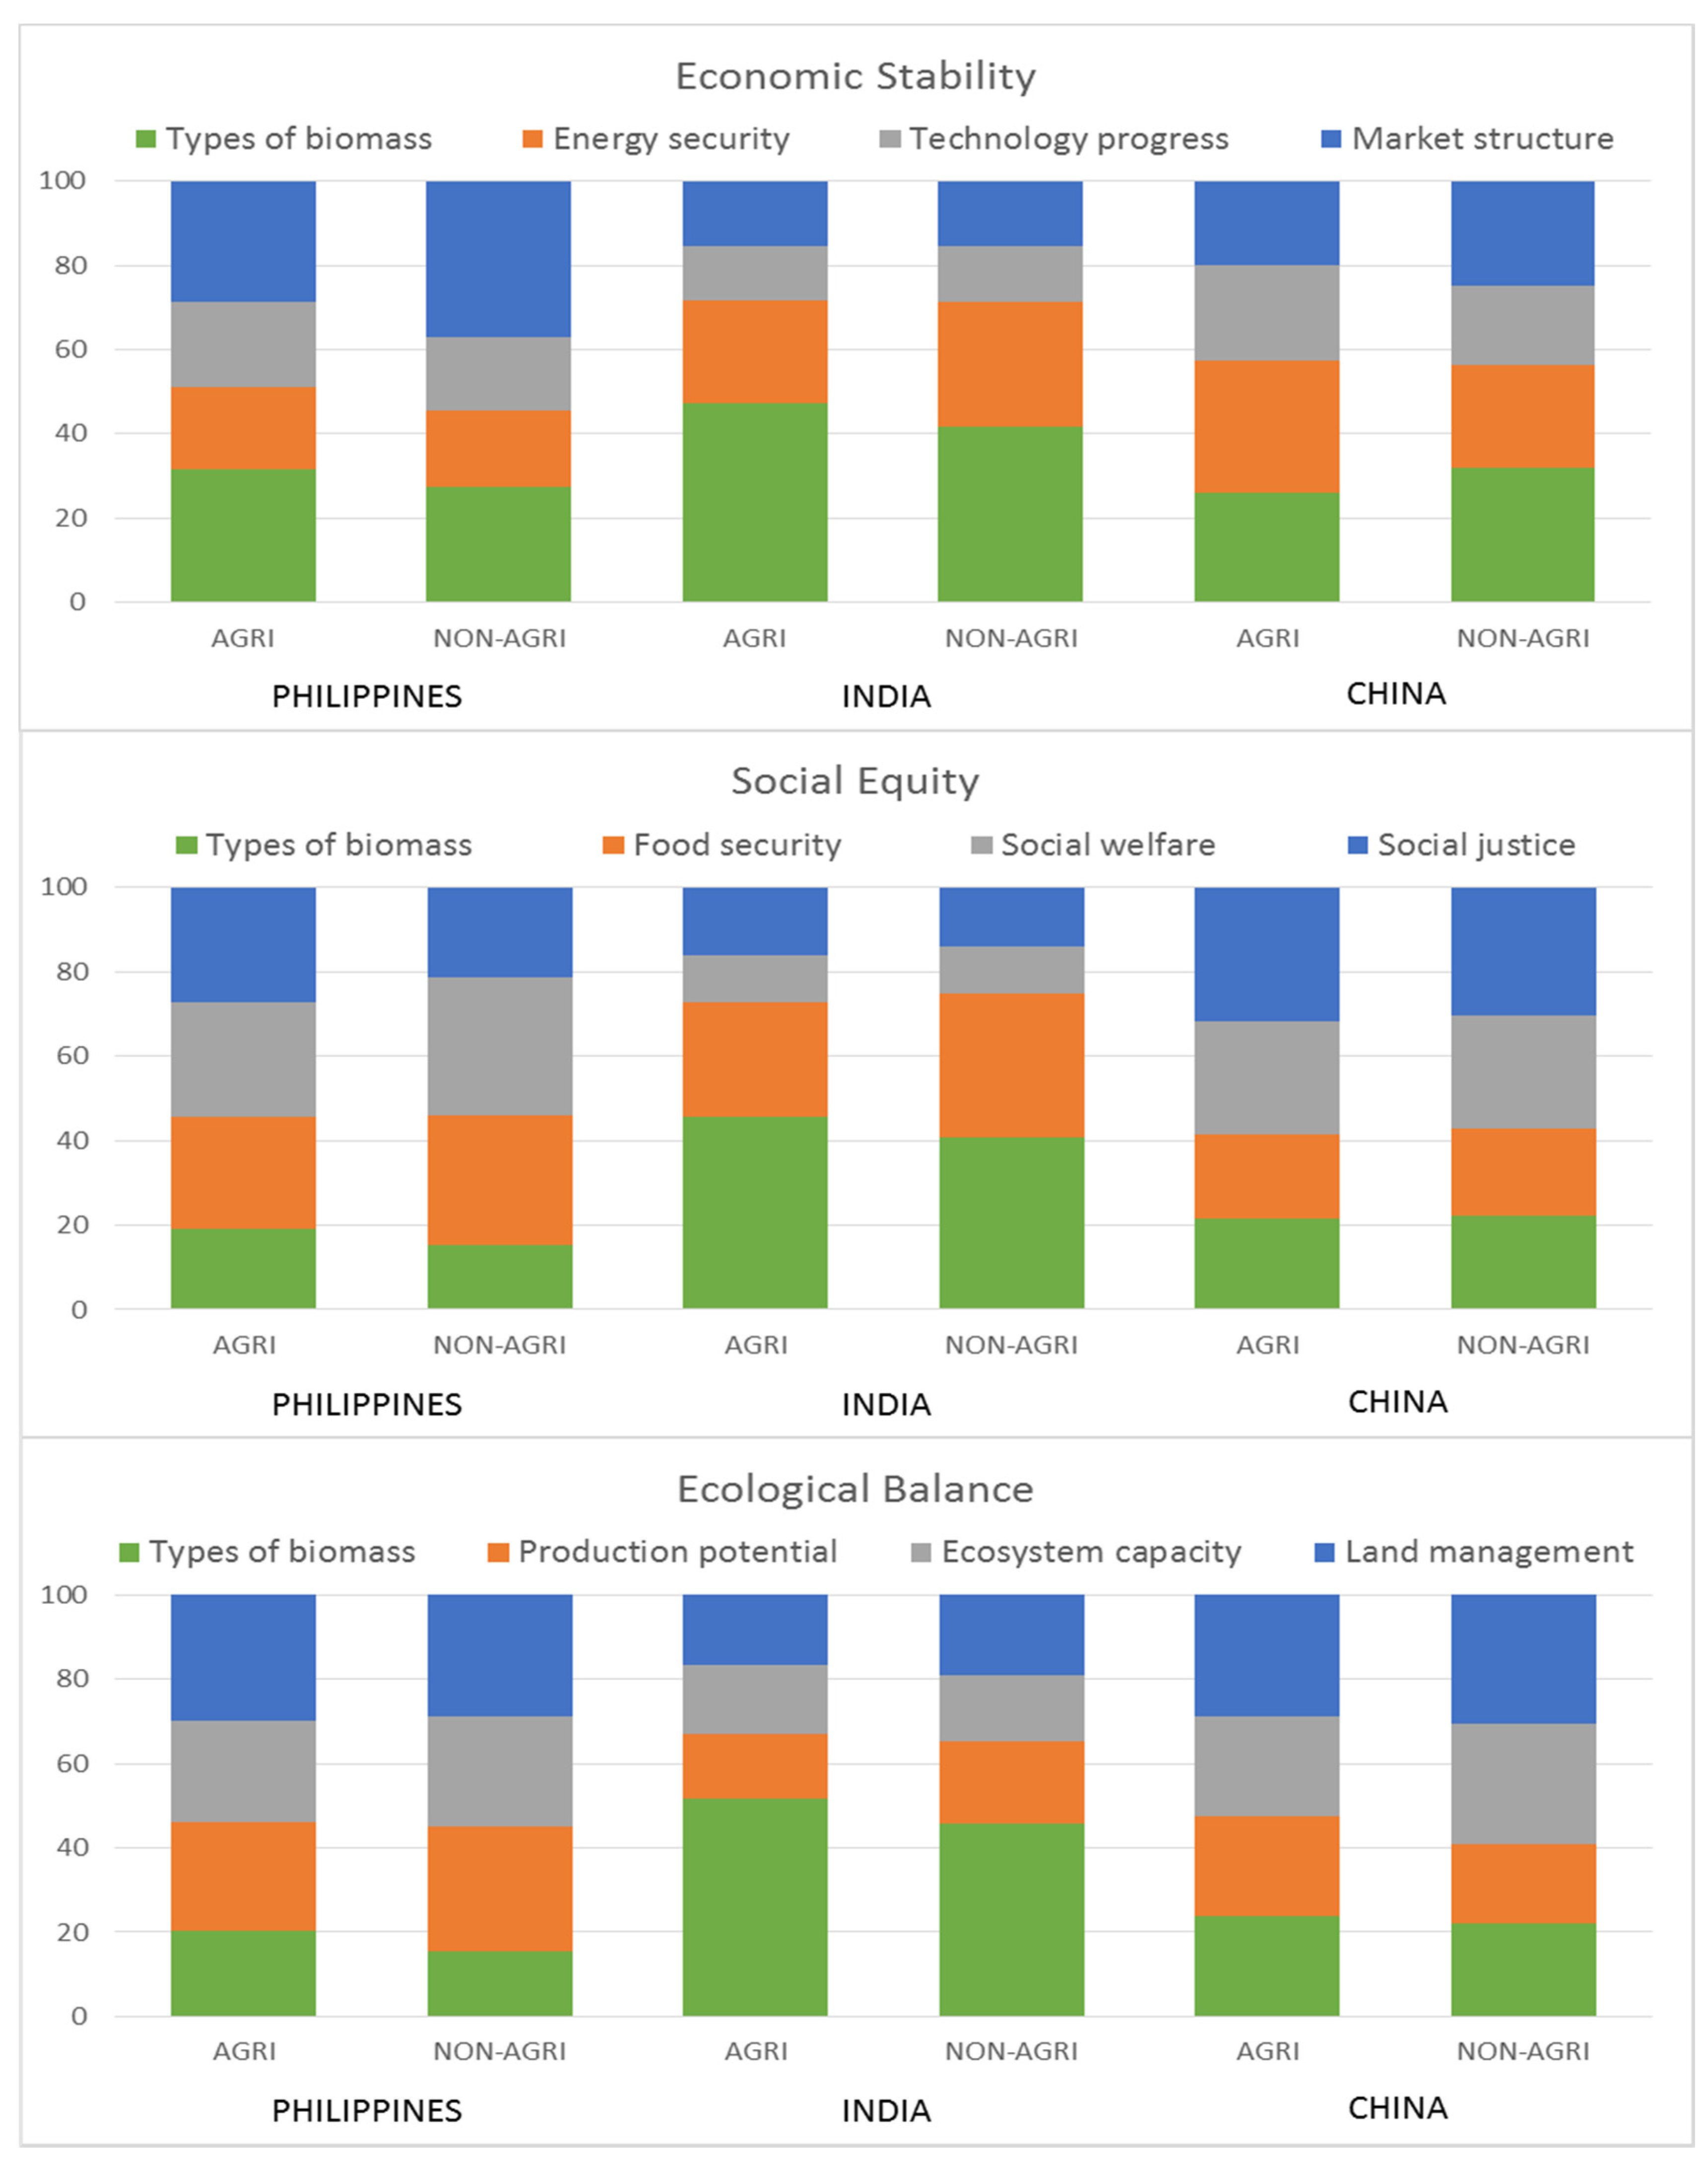
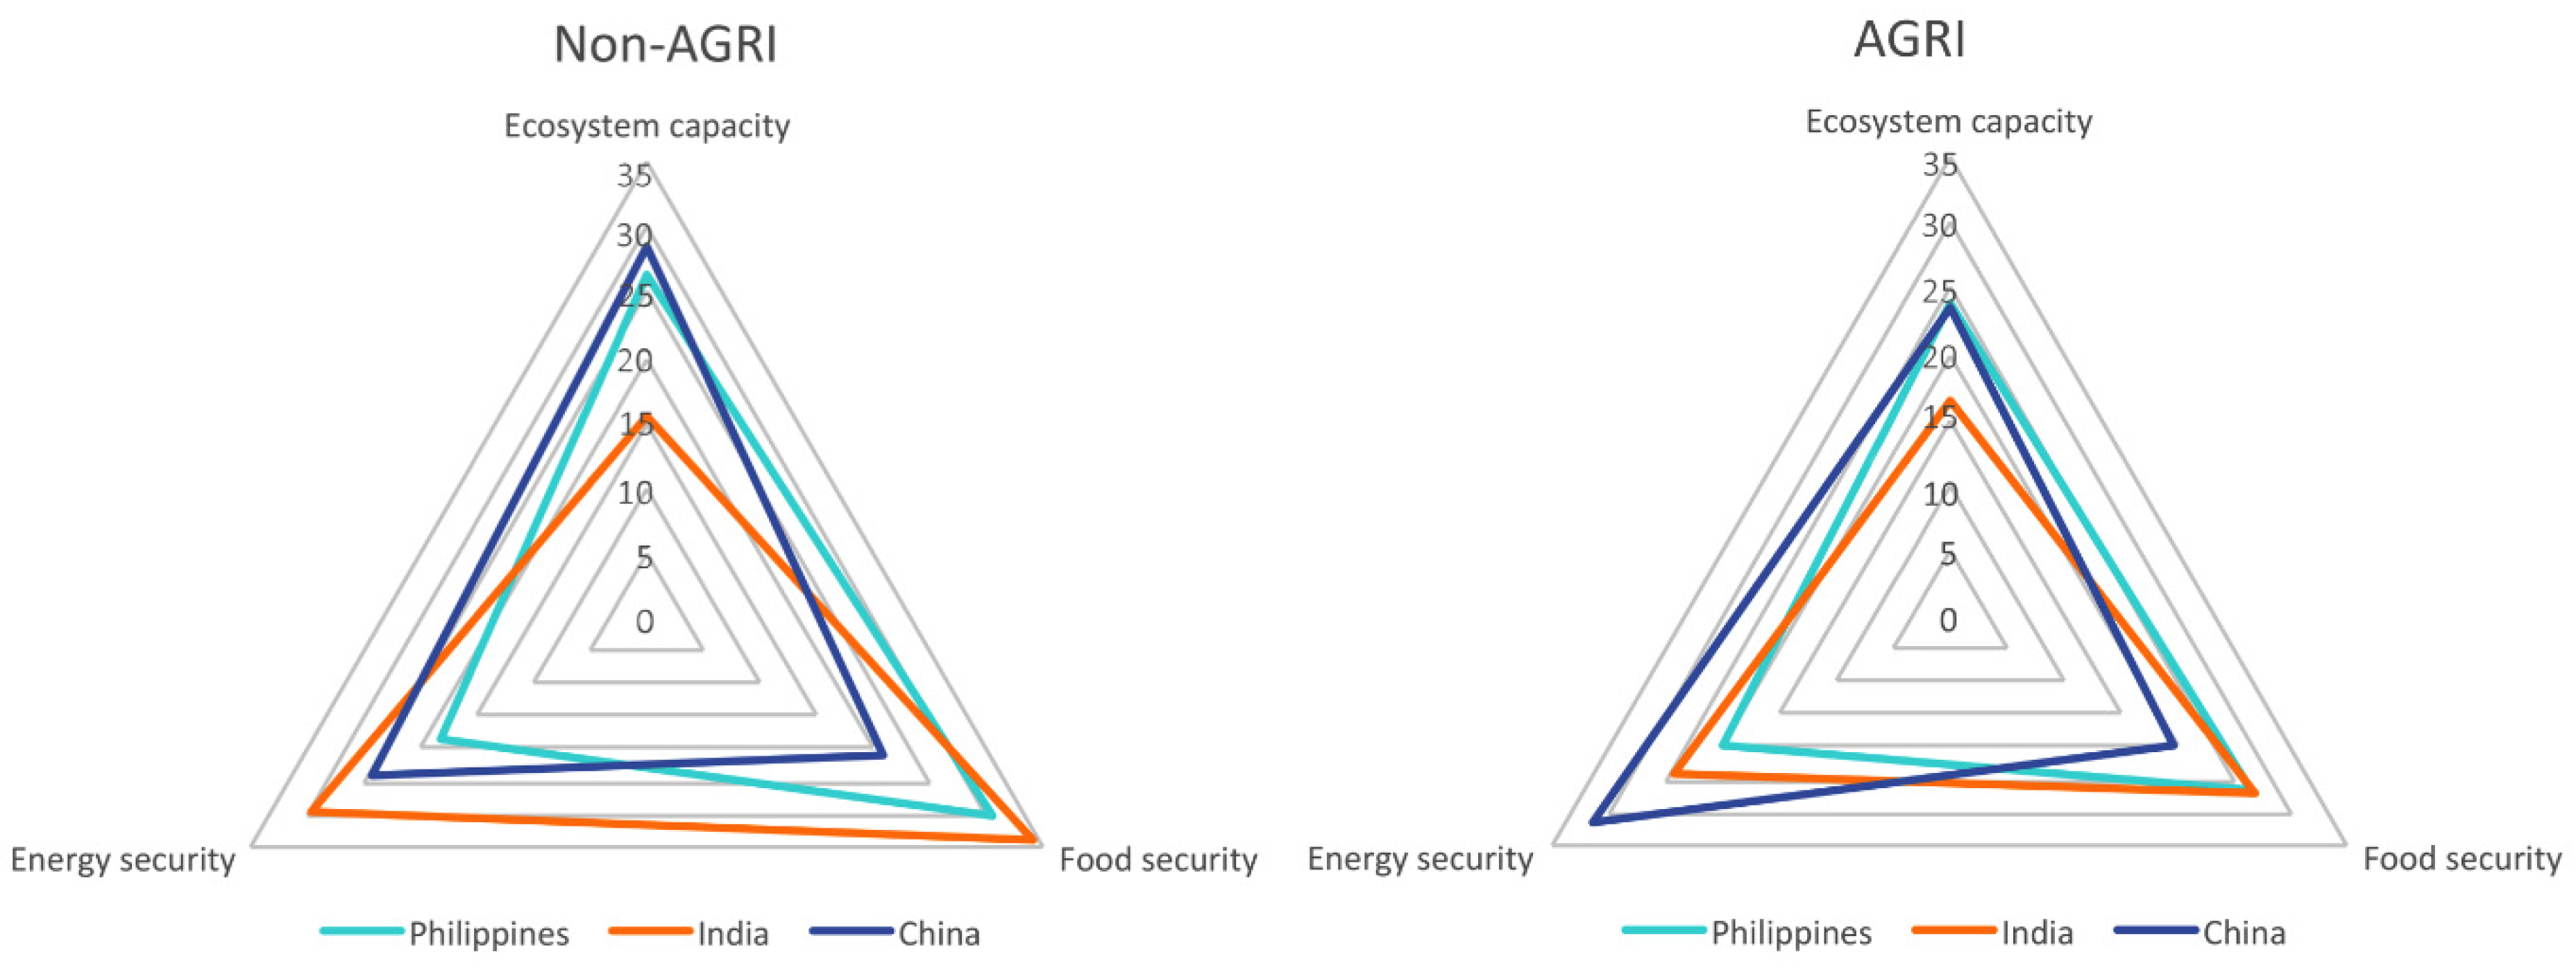
4.3. Preferences on Sustainable Bioenergy

Figure 3 presents the preference weights generated from choice-based conjoint analysis for the different sustainability determinants (i.e., conjoint attributes). For all three dimensions of bioenergy (i.e., economic stability, social equity and ecological balance), the types of biomass turned out to be most important factor for sustainable development in India, with preference weights of more than 40 percent. We emphasized in Section 3.2 to consider the conjoint results for India with care due to lack of geographical diversity of and lack of enthusiasm on choice-based conjoint part of the survey among respondents. Contrary to the general perception on sugar-rich crops, which was considered important feedstock for the economic growth in India, the logit results in Table 7 reveals that this feedstock has negative preference estimates. However, the other first generation starch-rich and oil-rich crops have also negative preferences and thus conform to the general perceptions of the respondents in India (Table 6). Similarly, farm/forest residues and fast-growing trees have generally positive preferences not only for economic but also for social and ecological dimensions of sustainability. These also conform to the respondents’ perceptions on the contribution of various bioenergy feedstock in India (Table 5). Unlike in India, the types of biomass are not the most important factors affecting the preferences of respondents in the Philippines and China (Figure 3). Table 7 shows that only few of the first and second generation bioenergy feedstock have statistically significant preference estimates in these two countries. Contrary to the general perceptions in the Philippines (Table 6), oil-rich crops turned out not to have significant preferences except for ecological balance, but only among NON-AGRI respondents. Sugar-rich and starch rich crops have negative preferences for promoting ecological balance among the AGRI respondents. Corresponding to the general perceptions, the preference estimates for farm and forest residues are high and statistically significant for the Philippines, albeit only for economic stability. Perennial grasses received negative preferences for economic stability and ecological balance from both professional segments. In China, while the conjoint preferences for the second generation bioenergy feedstock conform more or less to the general perceptions, this is not the case for the first generation.
In terms of economic stability, energy security is considered a key factor for bioenergy development in India and China (Figure 3). Market structure like incentives, infrastructure and trade are more relevant factors for enhancing sustainable bioenergy in the Philippines. In terms of social equity, there is high preference for taking into account food security in bioenergy development in India. However, this is not the case for the other countries – social welfare and social injustice are highly preferred in the Philippines and China, respectively. These results reveal the general socio-economic condition in these countries: (a) decrease food supply in India due to large land conversion for bioenergy by private investors, (b) lack of better livelihood from bioenergy in the Philippines because farmers continue to be only raw material (feedstock) producer, and (c) people displacement in China due to land conversion not only for bioenergy but also industrial purposes. In terms of ecological balance, production potential, ecosystem capacity and land management generally received equal preferences by the respondents in each country, except for the NON-AGRI respondents in China who have less preference for production potential.
We took the values of preference weights for energy security, food security and ecosystem capacity from Figure 3 and present them in a radar diagram in Figure 4. The latter Figure allows comparison of the levels of importance between these three sustainability indicators and across three countries. There is an obvious disparity in the relative importance of these sustainability variables across the three Asian countries and between the two professional segments. In the Philippines, food security and ecosystem capacity are most important factors for both AGRI and NON-AGRI respondents as far as promoting sustainable bioenergy is concerned. Awareness on the environmental degradation on vulnerability to floods and landslides is increasing in the Philippines [41], which could explain the high preference for ecosystem capacity. Although the Philippines has one of the highest energy prices in Asia, it has hydropower and geothermal plants, which serve as very good alternative renewable energy sources ; which can explain why energy security is not as highly preferred goal for bioenergy in this country.
In India, NON-AGRI respondents has the highest preference for food security which makes them more concerned about the issue when compared not only to AGRI respondents in this country but also to respondents in the other two Asian countries. However, these revealed preferences should be interpreted with caution because they turned out to be contrary to the general perceptions on the effects of bioenergy on food security among NON-AGRI respondents (Table 5). Again, the inconsistency between the general perceptions and the revealed preferences may be attributed to the lack of enthusiasm and thus lack of careful consideration of conjoint choices in India. Next to food security, energy security is an important concern for respondents (Figure 4), in particular those with NON-AGRI profession who live mainly in urban and suburban areas (Table 4). The preference for ecosystem capacity is lowest in India.
In China, the AGRI respondents consider energy security and NON-AGRI respondents consider ecosystem capacity as most important sustainability factors for bioenergy development. The latter may be explained by their concern for environmental problems like air pollution in Chinese cities. These results also suggest that the preferences for sustaining energy security, food security and ecosystem capacity are influenced by the socio-economic circumstances and requirements of the people. For these reasons, there would always be trade-offs among various sustainability objectives, although they are closely interlinked with each other.

5. Summary and Conclusions

This paper discussed the bioenergy policies and analyzed the survey on sustainability of bioenergy conducted in the Philippines, India and China. The survey acquired general perceptions of the people working in various fields (i.e., government offices, private companies/organizations, academic institutions, and farms) by asking them specific questions about their: (a) level of familiarity with bioenergy; (b) relationship of their work to bioenergy; and (c) their opinion on contribution of various feedstock on the economy and impact of bioenergy production on food security. In addition to these questions, we estimated preference weights of various feedstock based on the conjoint choices on bioenergy’s contribution to social stability, social equity and ecological balance. The estimates revealed significant trade-offs among these three dimensions of sustainability, which affects the relative importance between energy security, food security and ecosystem capacity.
Familiarity is relatively high among the respondents (except for those in agriculture in China), but they consider their work not related to bioenergy production (including sugarcane and coconut producers in the Philippines). Although this is not the case for India, we emphasized that the survey results should be considered with care because of (a) lack of geographical diversity of respondents and (b) the procedure for conducting survey in order to increase response rate in this country. Nonetheless, there is significant conformity on the general perceptions and revealed preferences on bioenergy in India. A significant number of respondents perceived bioenergy as good for the economy, although many of them think that it affects food security. Like in many countries, bioenergy has been actively pursued by governments in the Philippines, India and China, with policies that support and provide incentives for the production and processing of bioethanol and biodiesel. These policies may have provided general perceptions in the society about the economic benefits from bioenergy. Moreover, unlike in many countries in Africa, food security was not a severe problem in Asia [38]. However, the debate over fuel and food conflicts has been well discussed in the media, internet and academe, which are among the main sources of information of the respondents in the three Asian countries.
The types of first generation feedstock that are currently used for the production of biofuels in the respective countries are perceived as important for sustainable bioenergy development. Again, this may be the influence of information from policy, media, and research and extension. The latter include, for example, the public-private model for jatropha cultivation in India. The survey results further showed that crops, which are not widely used and do not offer alternative household use (e.g., perennial grasses), are not perceived as important and not preferred bioenergy feedstock. In the Philippines, for example, offers from private companies in Compostela Valley Province in Mindanao to inter-crop coconut plantations with perennial grasses have not been well accepted by the farmers because it will limit their access to useful by-products (e.g., firewood, medicinal plants, etc.) of coconut and other crops on the farms.
With very few exceptions, the general perceptions obtained from responses to survey questions and revealed preferences estimated from conjoint choices of alternative feedstock conform to each other. The preferred role of bioenergy for sustainable development reflects the social and economic concerns in the respective Asian countries, e.g., energy security in China, food security in India, and ecosystem degradation in the Philippines. This implies that the society expects that bioenergy development could contribute to solving these socio-economic problems. Overall, there is also significant awareness on the effects of bioenergy on ecological balance not only in the Philippines but also in other two Asian countries as revealed by the preferences on the determinants such as ecosystem capacity and land management. The comparison of conjoint preferences between energy security, food security and ecosystem capacity also revealed trade-offs that are largely linked to major sustainability concerns in the respective Asian countries. The high preference for energy security as in the case of China may thus overshadow other sustainability issue such as ecosystem degradation. Thus, policy should carefully weigh the impacts of bioenergy development on sustainability aspects that are closely interlinked (e.g., energy-food-ecosystem nexus) because if the society favor one or two sustainability aspects then it needs to pay high cost for another aspect.
There are some limitations in this study that researchers should consider when conducting choice-based conjoint analysis. A web-based survey, while offering a wider geographical coverage at lesser costs, is more difficult to implement because respondents usually do not respond to survey invitations, unless the respondent know the person who is sending the invitation. This was the case for India where the survey respondents have not been very enthusiastic in the topic given the low level of policy interest on the biofuels compared to other renewable energy sources like wind and solar. As a result, it is not easy to ensure the representativeness of respondents for each category, in case of this study the respondents’ professions. The use of qualitative values like high and low may be interpreted differently by respondents, affecting their choices of attribute levels.

Supplementary Files

Supplementary File 1

Acknowledgments

The authors would like to thank all respondents who participated in the survey in the Philippines, India and China. The funding for the survey was provided by the Asia-Pacific Network for Global Change Research (APN) through the Integrated sustainability assessment of bioenergy potentials in Asia: An application of a hybrid approach on trade-offs and pathways (PIC-STRAP) Project.

Author Contributions

Lilibeth A. Acosta is the scientific coordinator and Damasa B. Magcale-Macandog is the project leader of the PIC-STRAP; Lilibeth A. Acosta wrote the paper with contributions from Kavi Kumar (section 2.2) and Xuefeng Cui (section 2.3); Lilibeth A. Acosta analyzed the data with support from Elena A. Eugenio and Jemimah Mae A. Eugenio; Lilibeth A. Acosta prepared the survey questionnaire and pre-tested by Damasa B. Magcale-Macandog, Paula Beatrice M. Macandog and Elena A. Eugenio; All authors participated in the conduct of online and field survey under the coordination of Elena A. Eugenio; Elena A. Eugenio, Paula Beatrice M. Macandog and Jemimah Mae A. Eugenio encoded the survey data; Arnold R. Salvacion and Jemimah Mae A. Eugenio prepared the figures.

Conflicts of Interest

The authors declare no conflict of interest.

References

  1. Bindraban, P.S.; Bulte, E.H.; Conijn, S.G. Can large-scale biofuels production be sustainable by 2020? Agric. Syst. 2009, 101, 197–199. [Google Scholar] [CrossRef]
  2. REN21. Renewables 2015 Global Status Report; REN21 Secretariat: Paris, France, 2015. [Google Scholar]
  3. Tilman, D.; Socolow, R.; Foley, J.A.; Hill, J.; Larson, E.; Lynd, L.; Pacala, S.; Reilly, J.; Searchinger, T.; Somerville, C.; Williams, R. Beneficial Biofuels: The Food, Energy, and Environment Trilemma. Science 2009, 325, 270–271. [Google Scholar] [CrossRef] [PubMed]
  4. Doornbosch, R.; Steenblik, R. Biofuels: Is the Cure Worse than the Disease; OECD: Paris, France, 2007. [Google Scholar]
  5. Eickhout, B.; van den Born, G.J.; Notenboom, J.; van Oorschot, M.; Ros, J.P.M.; van Vuuren, D.P.; Westhoek, H.J. Local and Global Consequences of the EU Renewable Directive for Biofuels; Netherlands Environmental Assessment Agency: Bilthoven, The Netherlands, 2008. [Google Scholar]
  6. Jumbe, C.B.L.; Msiska, F.B.M.; Madjera, M. Biofuels development in Sub-Saharan Africa: Are the policies conducive? Energy Policy 2009, 37, 4980–4986. [Google Scholar] [CrossRef]
  7. Lane, J. Biofuels Mandates Around the World: 2015. 2014. Available online: http://www.biofuelsdigest.com/bdigest/2014/12/31/biofuels-mandates-around-the-world-2015/ (accessed on 30 April 2015).
  8. Kaditi, E.A. Bio-energy policies in a global context. J. Clean. Prod. 2009, 17, S4–S8. [Google Scholar] [CrossRef]
  9. Hansson, J.; Berndes, G. Future bioenergy trade in the EU: Modelling trading options from a cost-effectiveness perspective. J. Clean. Prod. 2009, 17, S27–S36. [Google Scholar] [CrossRef]
  10. Zah, R.; Ruddy, T.F. International trade in biofuels: An introduction to the special issue. J. Clean. Prod. 2009, 17, S1–S3. [Google Scholar] [CrossRef]
  11. FAO. Regional Overview of Food Insecurity Asia and the Pacific, Towards A Food Secure Asia and the Pacific; FAO: Bangkok, Thailand, 2015. [Google Scholar]
  12. Clancy, J.S. Are biofuels pro-poor? Assessing the evidence. Eur. J. Dev. Res. 2008, 20, 416–431. [Google Scholar] [CrossRef]
  13. Headey, D.; Fan, S. Anatomy of a crisis : The causes and consequences of surging food prices. Agric. Econ. 2008, 39, 375–391. [Google Scholar] [CrossRef]
  14. Rosegrant, M. Biofuels and Grain Prices: Impacts and Policy; International Food Policy Research Institute: Washington, DC, USA, 2008. [Google Scholar]
  15. Ciaian, P.; Kancs, D. Food, energy and environment: Is bioenergy the missing link? Food Policy 2011, 36, 571–580. [Google Scholar] [CrossRef]
  16. Ciaian, P.; Kancs, D. Interdependencies in the energy–bioenergy–food price systems: A cointegration analysis. Resour. Energy Econ. 2011, 33, 326–348. [Google Scholar] [CrossRef]
  17. Kuchler, M.; Linnér, B. Challenging the food vs. fuel dilemma: Genealogical analysis of the biofuel discourse pursued by international organizations. Food Policy 2012, 37, 581–588. [Google Scholar] [CrossRef]
  18. IFAD. Rural Poverty Report 2011—New realities, new challenges: New opportunities for tomorrow’s generation; IFAD: Rome, Italy, 2010. [Google Scholar]
  19. Karp, A.; Richter, G.M. Botany Meeting the challenge of food and energy security. J. Exp. Bot. 2011, 62, 3263–3271. [Google Scholar] [CrossRef] [PubMed]
  20. WorldWatchInstitute. Biofuels for Transportation Global Potential and Implications For Sustainable Agriculture and Energy in the 21st Century; WorldWatchInstitute: Washington, DC, USA, 2006. [Google Scholar]
  21. UNEP, Oeke-Institut, IEA. The Bioenergy and Water Nexus; UNEP: Paris, France, 2011. [Google Scholar]
  22. WWAP. The United Nations World Water Development Report 4: Managing Water under Uncertainty and Risk; UNESCO: Paris, France, 2012. [Google Scholar]
  23. Coelho, S.T. Land and Water: Linkages to Bioenergy. In Global Energy Assessment Toward a Sustainable Future; GEA-Writing-Team, Ed.; Cambridge University Press: Cambridge, UK, 2012; pp. 1459–1526. [Google Scholar]
  24. Wakker, E. Greasy Palms—The Social and Ecological Impacts of Large-scale Oil Palm Plantation Development in Southeast Asia; Friends of the Earth: London, UK, 2005. [Google Scholar]
  25. Sheil, D.; Casson, A.; Meijaard, E.; van Noordwijk, M.; Gaskell, J.; Sunderland-Groves, J.; Wertz, K.; Kanninen, M. The Impacts and Opportunities of Oil Palm in Southeast Asia—What Do We Know and What Do We Need to Know? Center for International Forestry Research (CIFOR): Bogor, Indonesia, 2009. [Google Scholar]
  26. Wilcove, D.S.; Giam, X.; Edwards, D.P.; Fisher, B.; Koh, L.P. Navjot’s nightmare revisited: Logging, agriculture, and biodiversity in Southeast Asia. Trends Ecol. Evol. 2013, 28, 531–540. [Google Scholar] [CrossRef] [PubMed]
  27. Fitzherbert, E.B.; Struebig, M.J.; Morel, A.; Danielsen, F.; Brühl, C.A.; Donald, P.F.; Phalan, B. How will oil palm expansion affect biodiversity? Trends Ecol. Evol. 2008, 23, 538–545. [Google Scholar] [CrossRef] [PubMed]
  28. Brühl, C.A.; Eltz, T. Fuelling the biodiversity crisis: Species loss of ground-dwelling forest ants in oil palm plantations in Sabah, Malaysia (Borneo). Biodivers. Conserv. 2009, 19, 519–529. [Google Scholar] [CrossRef]
  29. Hurford, A.P.; Harou, J.J. Balancing ecosystem services with energy and food security—Assessing trade-offs from reservoir operation and irrigation investments in Kenya’s Tana Basin. Hydrol. Earth Syst. Sci. 2014, 18, 3259–3277. [Google Scholar] [CrossRef]
  30. Karlberg, L.; Hoff, H.; Andersson, K.; Binnington, T.; Flores-lópez, F.; Gebrehiwot, S.G.; Johnson, O.; Osbeck, M.; Young, C. Tackling Complexity: Understanding the Food-Energy-Environment Nexus in Ethiopia’s Lake Tana Sub-basin. Water Altern. 2015, 8, 710–734. [Google Scholar]
  31. Aguilar, F.X.; Thompson, W. Charging into the Blend Wall: Conjoint Analysis of Consumer Willingness to Pay for Ethanol Blend Fuels. In Proceedings of the Agricultural and Applied Economics Association, 2010 Annual Meeting, Denver, CO, USA, 25–27 July 2010.
  32. Jensen, K.L.; Clark, C.D.; English, B.C.; Menard, R.J.; Skahan, D.K.; Marra, A.C. Willingness to pay for E85 from corn, switchgrass, and wood residues. Energy Econ. 2010, 32, 1253–1262. [Google Scholar] [CrossRef]
  33. Acosta, L.A.; Enano, N.H.; Magcale-Macandog, D.B.; Engay, K.G.; Herrera, M.N.Q.; Nicopior, O.B.S.; Sumilang, M.I.V.; Eugenio, J.M.A.; Lucht, W. How sustainable is bioenergy production in the Philippines? A conjoint analysis of knowledge and opinions of people with different typologies. Appl. Energy 2013, 102, 241–253. [Google Scholar] [CrossRef]
  34. Acosta, L.A.; Eugenio, E.A.; Enano, N.H.; Beatrice, P.; Macandog, M.; Mae, J.; Eugenio, A.; Lopez, M.A.; Salvacion, A.R.; Lucht, W. Sustainability trade-offs in bioenergy development in the Philippines: An application of conjoint analysis. Biomass Bioenergy 2014, 64, 20–41. [Google Scholar] [CrossRef]
  35. Cronshaw, I.; Grafton, Q. Reflections on Energy Security in the Asia Pacific. Asia Pacific Policy Stud. 2013, 1, 127–143. [Google Scholar] [CrossRef]
  36. Intriligator, M.D. Energy Security in the Asia-Pacific Region. Contemp. Econ. Policy 2014, 33, 221–227. [Google Scholar] [CrossRef]
  37. Asia-Society and IRRI. Never an Empty Bowl: Sustaining Food Security in Asia; Asia Society and International Rice Research Institute: Manila, Philippines, 2010. [Google Scholar]
  38. ADB. Food Security in Asia and the Pacific; Asian Development Bank (ADB): Manila, Philippines, 2013; p. 131. [Google Scholar]
  39. CISS. Food Security in Asia—A Report for Policymakers; CISS: Sydney, Australia, 2013. [Google Scholar]
  40. EIU. Food Security in Focus: Asia & Pacific 2014; EIU: London, UK, 2014. [Google Scholar]
  41. Acosta, L.A.; Eugenio, E.A.; Macandog, P.B.M.; Magcale-Macandog, D.B.; Lin, E.K.; Abucay, E.R.; Cura, A.L.; Primavera, M.G. Loss and damage from typhoon-induced floods and landslides in the Philippines: Community Perceptions on climate impacts and adaptation options. Int. J. Glob. Warm. 2016, 9, 33–65. [Google Scholar] [CrossRef]
  42. Republic-of-the-Philippines. Republic Act No. 9367—An Act to Direct the Use of Biofuels; Republic of the Philippines: Manila, Philippines, 2006.
  43. USDA. Philippines Biofuels Annual Philippine Biofuels Situation and Outlook; United States Department of Agriculture (USDA): Washington, DC, USA, 2016.
  44. Zhou, A.; Thomson, E. The development of biofuels in Asia. Appl. Energy 2009, 86, S11–S20. [Google Scholar] [CrossRef]
  45. Corpuz, P.G. Philippines BIOFUELS ANNUAL—Philippine Bio-fuel Industry Outlook; USDA: Washington, DC, USA, 2009.
  46. Pacini, H.; Sanches-Pereira, A.; Durleva, M.; Kane, M.; Bhutani, A. The State of the Market: Regulatory, Trade and Development Perspectives; UNCTAD: Geneva, Switzerland, 2013. [Google Scholar]
  47. USDA. India Biofuels Annual; United States Department of Agriculture (USDA): Washington, DC, USA, 2014; p. 21.
  48. USDA. India Biofuels Annual 2012; USDA: Washington, DC, USA, 2012.
  49. Chaliganti, R.; Müller, U. Policy Discourses and Environmental Rationalities Underpinning India’s Biofuel Programme. Environ. Policy Gov. 2016, 28, 16–28. [Google Scholar] [CrossRef]
  50. Flach, B.; Bendz, K.; Lieberz, S. EU-28 Biofuels Annual EU Biofuels Annual 2014; USDA: Washington, DC, USA, 2014.
  51. Barros, S. Brazil Biofuels Annual; USDA: Washington, DC, USA, 2014.
  52. Slette, J.; Aradhey, A. India Biofuels Annual; USDA: Washington, DC, USA, 2014.
  53. Corpuz, P. Philippines Biofuels Annual Philippine Biofuels Situation and Outlook; USDA: Washington, DC, USA, 2014.
  54. Wahab, A.G. Malaysia Biofuels Annual; USDA: Washington, DC, USA, 2014.
  55. Wright, R.T.; Wiyono, I.E. Indonesia Biofuels Annual; USDA: Washington, DC, USA, 2014.
  56. Anderson-Sprecher, A.; Junyang, J. China Peoples Republic of Biofuels Annual - China’s 2014 Fuel Ethanol Production is Forecast to Increase Six Percent; USDA: Washington, DC, USA, 2014.
  57. Preechajarn, S.; Prasertsri, P. Thailand Biofuels Annual; USDA: Washington, DC, USA, 2014.
  58. U.S. Bioenergy Statistics. Available online: http://www.ers.usda.gov/topics/farm-economy/bioenergy/biofuel-feedstock-coproduct-market-data.aspx (accessed on 3 May 2015).
  59. Singhal, R.; Sengupta, R. Energy Security and Biodiesel. Econ. Polit. Wkly. 2012, 47, 66–73. [Google Scholar]
  60. Basavaraj, G.; Rao, P.P.; Basu, K.; Reddy, C.R.; Kumar, A.A.; Rao, P.S.; Reddy, B.V.S. Assessing viability of bio-ethanol production from sweet sorghum in India. Energy Policy 2013, 56, 501–508. [Google Scholar] [CrossRef] [Green Version]
  61. Reuters. India Doubles Ethanol Blending Target to Help Sugar Mills; The Economic Times: New Delhi, India, 2015. [Google Scholar]
  62. Raju, S.S.; Parappurathu, S.; Chand, R.; Joshi, P.K.; Kumar, P.; Msangi, S. Potential, Policy and Emerging; Policy Paper 27; National Centre for Agricultural Economics and Policy Research: New Delhi, India, 2012. [Google Scholar]
  63. Bandyopadhyay, K.R. Biofuel Promotion in India for Transport: Exploring the Grey Areas; The Energy and Resources Institute (TERI): New Delhi, India, 2015; p. 12. [Google Scholar]
  64. Qiu, H.; Huang, J.; Yang, J.; Rozelle, S.; Zhang, Y.; Zhang, Y.; Zhang, Y. Bioethanol development in China and the potential impacts on its agricultural economy. Appl. Energy 2010, 87, 76–83. [Google Scholar] [CrossRef]
  65. USDA. China—Peoples Republic of Biofuels Annual 2015; USDA: Washington, DC, USA, 2015; p. 14.
  66. Xu, J.; Yuan, Z. An overview of biomass energy policy in China 2015. Available online: http://www.besustainablemagazine.com/cms2/overview-of-biomass-energy-policy-in-china/ (accessed on 30 March 2016).
  67. USDA. China-Peoples Republic of, Biofuels Annual; USDA: Washington, DC, USA, 2013; p. 12.
  68. Sorda, G.; Banse, M.; Kemfert, C. An overview of biofuel policies across the world. Energy Policy 2010, 38, 6977–6988. [Google Scholar] [CrossRef]
  69. Fuqiang, T. Biofuel Development in China and Its Potential Impacts; International Commission on Irrigation and Drainage (ICID): New Delhi, India, 2014; p. 9. [Google Scholar]
  70. Huang, J.; Qiu, H.; Yang, J.; Zhang, Y.; Zhang, Y.; Zhang, Y. People’s Republic of China: Status and Potential for the Development of Biofuels and Rural Renewable Energy; Asian Development Bank (ADB): Manila, Philippines, 2009; p. 43. [Google Scholar]
  71. Lo, K. A critical review of China’s rapidly developing renewable energy and energy efficiency policies. Renew. Sustain. Energy Rev. 2014, 29, 508–516. [Google Scholar] [CrossRef]
  72. Koizumi, T. Biofuel and food security in China and Japan. Renew. Sustain. Energy Rev. 2013, 21, 102–109. [Google Scholar] [CrossRef]
  73. Acosta-Michlik, L.; Lucht, W.; Bondeau, A.; Beringer, T. Integrated assessment of sustainability trade-offs and pathways for global bioenergy production: Framing a novel hybrid approach. Renew. Sustain. Energy Rev. 2011, 15, 2791–2809. [Google Scholar] [CrossRef]
  74. Orme, B. SSI Web v7.0—Software for Web Interviewing and Conjoint Analysis; Sawtooth Software, Inc.: Sequim, WA, USA, 2010. [Google Scholar]
  75. Orme, B. The Sawtooth Software Market Simulator (A Supplement to the CBC v2.6 Manual); Sawtooth Software, Inc.: Sequim, WA, USA, 2006. [Google Scholar]
  76. Orme, B. CBC/HB v5—Software for Hierarchical Bayes Estimation for CBC Data; Sawtooth Software, Inc.: Sequim, WA, USA, 2009. [Google Scholar]
  77. Orme, B.; Howell, J. Sawtooth Software Application of Covariates Within Sawtooth Software’s Theory and Practical Example; Sawtooth Software, Inc.: Sequim, WA, USA, 2009. [Google Scholar]
  78. Lenk, P.J.; DeSarbo, W.S.; Green, P.E.; Young, M.R. Hierarchical Bayes conjoint analysis recovery of partworth heterogeneity from reduced experimental designs. Mark. Sci. 1996, 15, 173–191. [Google Scholar] [CrossRef]
  79. Orme, B. How to interpret the t-ratio? Sawtooth Software Forum, 2013. Available online: https://sawtoothsoftware.com/forum/4708/how-to-interpret-the-t-ratio (accessed on 30 March 2016).
  80. BAS. Regional Profile: CALABARZON, CountrySTAT Philippines, 2015. Available online: http://countrystat.bas.gov.ph/?cont=16&r=4 (accessed on 15 April 2015).
  81. NSO. The 2010 Census of Population and Housing Reveals the Philippine Population at 92.34 Million, Population and Housing, 2012. Available online: http://web0.psa.gov.ph/content/2010-census-population-and-housing-reveals-philippine-population-9234-million (accessed on 12 April 2015).
  82. McNally, C.A. Sichuan: Driving Capitalist Development Westward. China Q. 2004, 178, 426–447. [Google Scholar] [CrossRef]
Figure 1. Sustainability Trade-offs and Pathways (STRAP) framework (adapted from Acosta et al. [34]).
Agriculture 06 00019 g001
Figure 2. Location of the case study sites for the CAPI surveys in China, India and the Philippines.
Agriculture 06 00019 g002
Figure 3. Levels of importance for the different conjoint attributes of bioenergy sustainability. Note: The types of biomass are included as attribute levels in the choice-based conjoint analysis. The preference weights (i.e., levels of importance) of the attributes including the types of biomass sum up to 100, which make it possible to compare values of attributes across three sustainability issues (i.e., economic stability, social equity and ecological balance). However, the cross-comparison is not a measure of “trade-offs” because choices of attribute levels are independently made for each sustainability issue.
Agriculture 06 00019 g003
Figure 4. Level of importance of energy security, food security and ecosystem capacity, by country. Note: The values were based on the preference weights (i.e., levels of importance) from Figure 4. The scale in the radar diagram thus corresponds to the preference weights, which values are between 0 and 100.
Agriculture 06 00019 g004
Table 1. Overview of liquid biofuel production (million liters) in Asian countries, USA, Brazil and Europe during 2006–2014.
CountryBioethanolBiodiesel
Feedstock2006 *20102014Feedstock2006 **20102014
ASIA
ChinaCorn, Wheat, Cassava164721792787Waste vegetable oil2735681133
IndiaMolasses189815222036Jatropha, Pongamia-90130
IndonesiaMolasses, Cassava163175220Palm oil657403650
ThailandMolasses, Cassava1354511100Palm oil, Waste cooking oil26601200
PhilippinesSugarcane010110Coconut oil0124112
MalaysiaNone---Palm oil43594424
OTHERS
USA ***Corn, Wheat18,51250,39954,347Soybean oil, Vegetable oil94913024699
BrazilSugarcane, Corn 27,14027,96525,605Soybean oil, Cotton seed oil160823863500
EuropeWheat, Corn, Sugar beet281642685250Rapeseed oil, Palm oil, UCO955010,71010,890
Notes: * Data for Brazil, Europe are for 2008; ** Data for Malaysia is for 2007, for USA 2008, for Brazil 2009; *** Converted from US gallons to liters. The table refers to total production but include the major sources of feedstock. Sources: [50,51,52,53,54,55,56,57], For USA, downloaded from [58].
Table 2. Economic, social and ecological sustainability attribute levels.
Attribute LevelsMore DesirableLess Desirable
Economic Stability
A. Energy security
1. Domestic energy demandLow High
2. Domestic energy supplyHigh Low
3. Foreign energy tradeLow importHigh export
B. Technology progress
1. R&D investmentHigh Low
2. Technology deploymentHigh Low
3. Energy efficiencyHigh Low
C. Market organization
1. Market incentivesHigh Low
2. Market infrastructureGood Poor
3. Trade constraints Low High
Social equity
A. Food security
1. Food self-sufficiencyIncrease Decrease
2. Purchasing powerIncrease Decrease
3. Affordability of foodIncrease Decrease
B. Social welfare
1. Livelihood sourcesIncrease Decrease
2. Job opportunitiesIncrease Decrease
3. Household lifestyleImprove Worsen
C. Social justice
1. Equal property rightsSupport Hinder
2. Home displacementPrevent Cause
3. Land dispossessionPrevent Cause
Ecological balance
Production potential
1. Potential levelVery highLow
HighVery low
ModerateNo potential
2. Feedstock sources *Crop/forest residuesStarch-rich crops
Fast-growing treesSugar-rich crops
Perennial grassesOil-rich crops
Resource capacity
1. Effects of population pressureProduction potential unaffectedProduction potential affected
2. Pressure on natural resourcesPut less pressurePut more pressure
3. Effects landscape and species diversityImprove diversityDestroy diversity
Land management
1. Effects on nature conservationSupport Conflict
2. Compatibility with organic farmingCompatible Incompatible
3. Availability of good farming practicesAvailable Not available
Note: A–C refer to the conjoint attributes, 1–3 refer to the attribute levels; * Following the sustainability concept for bioenergy, first generation (i.e., food) crops are less desirable than second generation (non-food) crops as sources of feedstock for bioenergy production (adapted from Acosta et al. [34]).
Table 3. Example of choice tasks in the questionnaire for the choice-based conjoint analysis.
Determinants
(Attributes)
Indicators (Attribute levels) for Specific Type of Biomass
Sugar-rich CropsOil CropsFast-growing Trees
Economic Stability
A. Energy securityLow domestic energy demandHigh domestic energy demandLow domestic energy supply
B. Technology progressHigh R&D investmentLow R&D investmentHigh technology deployment
C. Market organizationHigh market incentivesLow market incentivesGood market infrastructure
Choose one option:
Social Equity
A. Food securityIncrease food self-sufficiencyIncrease purchasing powerIncrease affordability of food
B. Social welfareIncrease livelihood sourcesIncrease job opportunitiesImprove household lifestyle
C. Social justiceHinder equal property rightsCause home displacementCause land dispossession
Choose one option:
Ecological Balance
A. Ecosystem capacityPotential affected by population pressurePut more pressure on natural resourcesImprove landscape and species diversity
B. Production potentialVery high potentialModerate potentialVery low potential
C. Land managementSupport nature conservationCompatible with organic farmingAvailable good farming practices
Choose one option:
Table 4. Demographic characteristics of the respondents, in percent and by country.
Demographic CharacteristicsPhilippinesIndiaChina
AGRINon-AGRIAGRINon-AGRIAGRINon-AGRI
(n = 150)(n = 100)(n = 90)(n = 70)(n = 52)(n = 116)
Age
 Less than 3040.0073.007.782.9042.3171.55
 Between 31and 4016.008.0014.4434.787.6925.86
 Between 41and 508.674.0050.0047.8336.541.72
 Between 51 and 6020.0010.0018.8913.049.620.86
 Between 61 and 7011.335.005.561.453.850.00
 Greater than 714.000.003.330.000.000.00
Education
 Grade school12.004.0020.001.4555.770.00
 Secondary school21.338.0013.330.000.001.72
 Undergraduate 28.0043.0028.8920.299.6245.69
 Graduate 35.3341.0026.6749.2834.6250.00
 Technical, etc. 0.670.007.7828.990.000.86
 Others2.674.003.330.000.001.72
Gender
 Male52.0045.0092.2291.3063.4662.93
 Female48.0055.007.788.7036.5437.07
Domicile
 Urban area/city20.6736.0031.1156.5226.9262.07
 Suburban/close to city18.0026.0015.5633.333.8514.66
 Industrial/commercial1.334.000.002.900.000.86
 mountain/forest11.333.002.221.451.924.31
 farm/agriculture43.3323.0051.115.8063.4612.07
 River/coastal5.333.000.000.001.921.72
 Others0.005.000.000.001.924.31
Place of work
 Public agency28.0016.0024.447.143.855.17
 Private/NGO8.0037.0022.2252.860.0014.66
 Field/Farm35.330.0037.780.0055.770.00
 Academe/research17.3313.0013.3337.1438.4668.10
 Others11.3334.002.222.861.9212.07
Note: The values for each column in each demographic characteristic sum up to 100 percent. For example, 40.00 percent of the 150 respondents from the Philippines working in the field of AGRI (agriculture, forest and environment) are less than 30 years old.
Table 5. Knowledge and sources of information on bioenergy, by country.
Knowledge/
Information Sources
PhilippinesIndiaChina
AGRINon-AGRIAGRINon-AGRIAGRINon-AGRI
(n = 150)(n = 100)(n = 90)(n = 70)(n = 52)(n = 116)
Knowledge of Bioenergy
 Familiar with the term bioenergy74.087.0100.0100.036.563.8
 Work is related to bioenergy28.46.195.694.37.711.2
 Bioenergy affects food security62.442.050.021.415.450.9
 Bioenergy is good for the country94.795.098.9100.098.192.2
Sources of information
 Media59.372.052.221.419.230.2
 Internet40.751.027.838.621.242.2
 Family26.723.08.95.750.013.8
 Colleagues 49.334.015.622.91.99.5
 Neighbors16.712.08.95.71.94.3
 Public officials51.351.030.017.111.510.3
 Academe/Science76.785.036.758.632.762.9
 Business partners22.722.018.945.77.711.2
 Others11.67.125.620.01.92.6
Note: The values are percent of the total respondents in each work category. For the opinion on bioenergy, the respondents were asked to answer “yes” or “no”. The values presented in the table are only the percent of respondents who answered “yes”. For the sources of information, the respondents were asked to rate each source in terms of their importance – not important, least important, relatively important, and most important. The values presented in the table are only the percent of respondents who chose “most important”.
Table 6. Perceptions on the contribution of different energy sources and types of biomass feedstock to economic growth, by country.
Energy SourcesTypes of EnergyAGRINON-AGRI
LowMediumHighVery HighDo not KnowLowMediumHighVery HighDo not Know
Philippines
All sourcesFossil8.727.337.324.72.010.018.039.028.05.0
Bioenergy2.718.047.330.02.04.014.043.035.04.0
Other Renewables3.320.049.323.34.04.015.049.025.07.0
Combined4.012.738.037.38.01.010.034.047.08.0
First generationSugar-rich crops10.724.740.720.04.04.021.050.023.02.0
Starch-rich crops8.028.040.719.34.03.020.046.030.01.0
Oil-rich crops8.716.742.030.72.03.010.048.037.02.0
Second generationfarm/forest residues10.717.344.722.74.77.019.047.023.04.0
fast-growing trees12.024.036.024.04.06.024.036.030.04.0
perennial grasses12.727.340.714.74.75.036.033.017.09.0
India
All sourcesFossil5.64.440.048.91.11.44.360.034.30.0
Bioenergy2.221.142.220.014.45.735.747.18.62.9
Other Renewables1.126.740.015.616.77.162.921.45.72.9
Combined1.13.334.444.416.72.95.747.138.65.7
First generationSugar-rich crops17.831.121.18.921.112.954.327.11.44.3
Starch-rich crops32.228.93.32.233.352.937.11.41.47.1
Oil-rich crops57.84.43.31.133.380.08.62.92.95.7
Second generationfarm/forest residues11.132.216.75.634.45.745.738.65.74.3
fast-growing trees7.826.743.318.93.35.747.142.92.91.4
perennial grasses52.27.82.24.433.377.111.42.92.95.7
China
All sourcesFossil0.013.561.523.11.93.415.526.752.61.7
Bioenergy3.867.315.49.63.87.830.228.419.813.8
Other Renewables19.246.219.29.65.83.428.439.710.318.1
Combined9.651.917.39.611.56.919.030.218.125.9
First generationSugar-rich crops3.838.550.01.95.86.927.639.712.912.9
Starch-rich crops3.844.240.49.61.94.318.140.526.710.3
Oil-rich crops5.865.419.23.85.86.018.148.317.210.3
Second generationfarm/forest residues5.840.444.25.83.87.825.042.216.48.6
fast-growing trees5.844.242.35.81.97.823.351.78.68.6
perennial grasses7.767.317.33.83.87.831.031.912.117.2
Note: The respondents were asked to rate the potential contribution of different energy sources to economic growth. Each row sums up to 100 percent so that the numbers represent the proportion of respondents in each island with the given response. For example, 26.80 percent of all respondents in Luzon think that fossil fuel has very high potential for promoting economic growth in the Philippines.
Table 7. Logit estimates for utilities of the different types of biomass, by country.
Attribute LevelsPhilippinesIndiaChina
Estimate
(Xs)
t-ratioEstimate
(Xs)
t-ratioEstimate
(Xs)
t-ratio
Economic Stabilityy
AGRI
Sugar-rich crops−0.12−1.081.04 ***7.04−0.21−1.11
Starch-rich crops−0.08−0.70−0.65 ***−3.51−0.11−0.58
Oil crops−0.02−0.19−0.84 ***−4.260.010.07
Agri/Forest residues0.38 ***3.640.59 ***3.870.27 *1.57
Fast-growing trees0.20 **1.881.39 ***8.970.080.43
Perennial grasses−0.35 ***−3.06−1.54 ***−6.19−0.04−0.23
Non-AGRI
Sugar-rich crops−0.01−0.100.46 ***2.81−0.10−0.80
Starch-rich crops−0.06−0.42−0.64 ***−3.08−0.06−0.45
Oil crops−0.16−1.12−0.60 ***−3.09−0.15−1.22
Agri/Forest residues0.48 ***3.650.93 ***5.650.37 ***3.18
Fast-growing trees0.161.190.56 ***3.390.21 **1.75
Perennial grasses−0.41 ***−2.78−0.71 ***−3.52−0.26 **−2.03
Social equity
AGRI
Sugar-rich crops−0.25−2.051.06 ***7.020.060.30
Starch-rich crops0.030.26−0.87 ***−4.51−0.04−0.24
Oil crops0.00−0.01−0.71 ***−3.78−0.22−1.11
Agri/Forest residues0.131.110.43 ***2.850.27 *1.50
Fast-growing trees0.17 *1.491.26 ***7.98−0.09−0.50
Perennial grasses−0.08−0.68−1.17 ***−5.450.030.18
Non-AGRI
Sugar-rich crops0.020.110.150.85−0.15−1.2
Starch-rich crops−0.19−1.18−0.71 ***−3.530.060.48
Oil crops0.32 **2.07−0.47 ***−2.52−0.28 **−2.11
Agri/Forest residues0.010.061.08 ***6.180.29 ***2.43
Fast-growing trees0.000.010.80 ***4.840.21 *1.74
Perennial grasses−0.16−1.01−0.85 ***−3.99−0.13−1.02
Ecological Balance
AGRI
Sugar-rich crops−0.19*−1.541.09 ***7.330.090.50
Starch-rich crops−0.18 *−1.48−0.57 ***−3.120.010.05
Oil crops0.141.26−0.87 ***−4.54−0.20−1.05
Agri/Forest residues0.141.240.52 ***3.470.26*1.48
Fast-growing trees0.40 ***3.431.33 ***8.500.221.22
Perennial grasses−0.32 ***−2.58−1.50 ***−6.33−0.38 **−1.92
Non-AGRI
Sugar-rich crops−0.06−0.380.43 ***2.58−0.23 **−1.73
Starch-rich crops−0.07−0.49−0.95 ***−4.130.00−0.03
Oil crops0.22 *1.56−0.49 ***−2.49−0.20 *−1.50
Agri/Forest residues−0.09−0.601.30 ***7.710.21 **1.79
Fast-growing trees0.26 **1.680.88 ***5.250.28 ***2.34
Perennial grasses−0.26 **−1.69−1.17 ***−4.81−0.06−0.51
Number of respondents250160168
Note: Mean estimates with standard errors in parentheses. Asterisks indicate coefficients significantly different from zero at α = 0.01 (***), α = 0.05 (**), and α = 0.10 (*), respectively. The utilities are measures of preferences where (1) utilities with positive values are preferred over those with negative values, and (2) for positive utilities, the larger the utility values the higher the preference level. The signs and values of the utilities together thus measure the respondents’ willingness to trade-off less desirable attribute level for more desirable one. Logits estimates for other attribute levels are presented in Supplementary Material.

