Article

Unlocking the Energy Potential of Manure—An Assessment of the Biogas Production Potential at the Farm Level in Germany

by
Mattes Scheftelowitz
1,*,† and
Daniela Thrän
1,2,†
1
Deutsches Biomasseforschungszentrum gGmbH, Leipzig 04347, Germany
2
Department Bioenergy, Helmholtz Centre for Environmental Research GmbH, Leipzig 04347, Germany
*
Author to whom correspondence should be addressed.
These authors contributed equally to this work.
Agriculture 2016, 6(2), 20; https://doi.org/10.3390/agriculture6020020
Submission received: 16 October 2015 / Revised: 25 March 2016 / Accepted: 13 April 2016 / Published: 26 April 2016
(This article belongs to the Special Issue Animal Waste Management)

Abstract

:
Residues from animal husbandry are one of the major greenhouse gas (GHG) emission sources in agriculture. The production of biogas from agricultural residues can reduce GHG emissions through an improved handling of the material streams such as manure storage. Additionally, biogas can substitute fossil energy carriers in the provision of heat, power, and transport fuels. The aim of this work is to estimate the manure potential for biogas production in Germany under the consideration of the farm size of livestock production. In Germany, cattle and pig farming is of major relevance with more than 130,000 farms throughout the country. To unlock the biogas potential of manure, the low energy density of manure, depending on the dry matter content, needs to be considered, meaning that biogas installations need to be built close to the manure production on the farm site. This not only results in a high number of biogas plants, but also due to the wide range of farm sizes in Germany, a huge number of very small biogas plants. Small biogas installations have higher specific investment costs. Together with the relatively low methane yields from manure, costs for power generation would be very high. Co-substrates with higher methane yield can lower the costs for biogas. Thus, the use of a co-substrate could help to use small manure potentials. Biogas plants with the necessary minimum size of 50 kWel installed power could be established at farms representing 12% of all cattle and 16.5% of all pigs respectively in Germany. Using excrement from pigs, farms representing 16.5% of the total amount of pigs could establish a biogas plant. The use of manure in combination with energy crops can increase the size of biogas plants on a farm site significantly. At cattle farms, the share would increase to 31.1% with 40% co-substrate and to 40.8% with 60% co-substrate. At pig farms, the share would increase to 36% if co-substrates were used.

Graphical Abstract

1. Introduction

The reduction of greenhouse gas (GHG) emissions from anthropogenic activities is one of the major challenges for society in terms of sustainable development on a global level [1]. In 2012, the consumption of fossil fuels for energy provision was responsible for three quarters of worldwide GHG emissions, and 83% of GHG emissions in Germany [2,3]. Agriculture and animal husbandry is another main emitter [4,5]. The use of excrements from animal husbandry for biogas production can reduce GHG emissions [6]. To achieve the envisaged reduction target of GHG emissions of 80% by 2050, a transition of the energy system towards a greater use of renewable energy is one central element [7]. Activities to introduce energy production from renewables have been initiated in many countries. In Germany, a target has been set to cover 40%–45% of the overall power demand with renewables by 2025 [8].
However, GHG reductions in Germany are not only an issue for the energy sector but also one for the agricultural sector. In 2011, agriculture accounted for 7.7% of the total greenhouse gas emissions in Germany [3]. With nearly 9 million tons of CO2-equivalents per year, more than 10% of the GHG emissions from German agriculture were caused by manure storage. Liquid manure and droppings contain a high percentage of biomass, which is usually re-used as a fertilizer. The storage is necessary because of the continuous production of excrement from livestock farming and its discontinuous re-use as a farm fertilizer, which is restricted to certain times of the year. Manure storage facilities are often realized in open silos and the stored manure off-gases equate to amounts of methane, which causes 1% of the overall German GHG emissions [9]. By using manure in biogas plants, these emissions can be significantly reduced. The conversion of manure to biogas mainly includes the degradation of organic carbon to methane. There is no competition with regard to the potential use as a fertilizer, since the digestate can also be spread over the field, and the nutrients are even more available to plants.
Biogas potential from liquid manure and/or litter for energetic utilization in Germany is 139 million t per year corresponding to a total biogas yield of 4 billion m3/yr [10]. Assumptions about the overall biogas potential in Germany take into account that not all excrement can be used for biogas generation, for example, in the case of pasture management or small quantities of livestock. The production of biogas from those agricultural residues reduces GHG emissions from manure storage. Biogas can substitute fossil energy carrier and has a technical fuel potential of approximately 90 PJ/yr. The largest share of this potential is from cattle droppings with around 60%, followed by pigs accounting for around 30 PJ/yr. Liquid manure from chicken contributes to this potential with 3 PJ/yr [10]. The economical potential of the listed manure is not considered due to its many influencing factors.
Supported by political instruments over the last decade, 7800 biogas plants have been built, which are currently producing 18% of the renewable power in Germany from different feedstock. The most widely used substrates are maize silage, whole crop silage, and manure and dung. [11]. Even though, the use of manure has been put forward for biogas production by the Renewable Energy Sources Act [12], less than half of its potential is used [13]. To unlock the remaining biogas potential of manure, additional obstacles need to be considered. Due to the high water content of manure, the methane yield is comparably low. The range of dry matter content varies from 0.9% to 23%, depending on livestock and husbandry [14,15]. Therefore, biogas plants using manure need to be operated close to the farm site. This means that the size of the livestock production at each individual farm will determine the size of the biogas plant. Considering the higher specific investment efforts for smaller installations (economies of scale), the size of the livestock production significantly influences investment and is an important factor for unlocking the energy potential of manure.
The aim of this work is to estimate the distribution of the overall potential for the biogas provision of manure. For this calculation, the size of livestock production on farm sites in Germany is considered. Considering the wide range of farm sizes, the demand of the biogas plants will also differ in size. Assuming a “minimum biogas plant size” for an economically feasible biogas production, how the biogas potential related to manure only, and the potential that can be tapped into from the co-fermentation of manure and energy crops can be used, is discussed.
Three scenarios were analyzed: the potential biogas plant size (1) without using co-substrates, (2) with 40% of maize, and (3) 60% of maize as co-substrate. The three scenarios were chosen by political circumstances. Biogas plants that were constructed after 2012 were allowed to use a maximum of 60% maize by the amendment of the Renewable Energy Sources Act of 2012 [12]. Since the amendment in 2014, no extra remuneration was provided for the use of renewable raw material such as maize [16] (scenario 0% co-substrate). For the amendment of the Renewable Energy Sources Act in 2016, it is expected that a maximum of 50% maize as co-substrate is allowed [17] (scenario 40% of maize).

2. Methodology and Data

To calculate the biogas production potential of manure at the farm level, we (1) identified and classified the most relevant animal husbandry systems for Germany in terms of their manure/dung quality, (2) calculated the farm-specific manure production for the classified systems with its related biogas potential, (3) assumed the investment costs for the different plant capacities for typical biogas plant concepts for manure, and (4) conducted different feedstock scenarios taking into account a threshold value of the minimum capacity of the biogas plants. Since the remuneration is determined by the Renewable Energy Sources Act, biogas plants cannot produce any expensive electricity. The threshold value is therefore defined as the minimum size of biogas plants economical feasible with the remuneration by the Renewable Energy Sources Act [18].

2.1. Identifying Relevant Livestock Systems

To evaluate the biogas potential of excrement from animal husbandry for Germany, the livestock species cattle, and pigs were considered.
Sheep, goats, and horses are mostly kept free-range, meaning that excrement cannot be collected. Since 2009, the cage production of poultry is no longer allowed in Germany, except for those farms with cage production, which were built before 2009 [19]. For the above types of animal husbandry, it is difficult to collect the excrement in a usable form for the purposes of energy production. Therefore, the livestock species of sheep, goats, horses, and poultry are not considered in this potential analysis.
Based on the survey results among biogas plant operators, conducted by the Germany Biomass Research Center, the most important feedstock could be determined. With 62% cattle, slurry is the most widely used form of manure for energy production, followed by pig slurry with a share of 14%. All other types of manure have minor shares and are therefore less important for biogas production [20].
The annual amount of manure or dung depends on the type of animal husbandry. The main types can be divided into straw-bedded animal husbandry and animal husbandry on slatted floors. The straw-bedded animal husbandry in loose housing stables mainly produces dung, based on straw, manure, and urine. The liquid phase (slurry) has a very low dry matter content [14]. Therefore it has also a low energy density [12,21]. Meanwhile, the range of liquid manure from cattle varies from 4% to 13% and, from pigs, from 1.5%–12% dry matter content. Slurry has just 2% maximum dry matter content (see Table 1). Therefore, it is irrelevant for biogas production and not considered in the following calculations.
In barns with slatted floors, manure, and urine drop down into a pit below the floor where the liquid manure is collected.

2.2. Data on Livestock

Data on livestock breeding is published by the federal statistical office for Germany. The data comes from the agricultural census in 2010. The statistics provide livestock species, farm size categories in terms of the number of animals per farm, and types of husbandry (i.e., manure or dung producing). Seven farm size classes are considered for the different livestock breeding systems [25]. For our calculations, we use the average farm size and neglect the variation within the size classes. For the different breeding systems, we also consider: data for cattle, which is differentiated into dairy cattle and all other cattle, and data for pigs, with piglets and all other pigs.
For cattle classed under other types of husbandry other than tethering of cattle and loose housing stables, it is assumed that these cattle are kept free-range, and they are not considered for the potential calculation.
For pigs classed under other types of husbandry, it is assumed that the main type of excrement is dung, as free-range husbandry for pigs is uncommon.

2.3. Data on Manure and Dung

Data on the annual quantity of manure and dung is provided by the Association for Technology and Structures in Agriculture (KTBL). KTBL provides the parameters of costs, time, and amounts for all the relevant parts of agriculture including different types of livestock and forms of livestock farming.
The annual quantity is given in m3/yr per animal (see Table 2). By providing data per animal, different production cycles for different livestock species are taken into account. The amount of excrement is differentiated into manure and dung, depending on the form of livestock farming on slatted floors or in loose housing stables.
As the statistics are not differentiated into younger pigs and fattened pigs, an average of 1.1 m3 of liquid manure per year and animal on slatted floors and 0.85 m3 of dung on solid floors is assumed [26,27].
For cattle, it is assumed that the breeding types “tethering of cattle on slatted floors” and “loose housing stables with slatted floors” produce the same amount of manure.

2.4. Data for Methane Yields

Potential methane yields from manure compared to usual biogas substrates are shown in Table 3 in m3 of methane per ton of fresh matter of substrate. The values given are an average. In fact, in reality the values have a broader bandwidth for the methane yield, depending on the dry matter content, the water content, the composition of substrates, and other factors. Data on methane yields for the different types of biogas substrates are given in the annex of the Ordinance on the Generation of Electricity from Biomass [28]. Due to the lack of opportunity to determine the methane yield for each substrate, biogas plant operators in Germany are obliged to use the values provided to receive the remuneration for electricity production.

2.5. Biogas Potential Calculation

The amount of installable electrical power from a biogas (combined heat and power) plant (chp) was calculated for each type of livestock, farm class, and husbandry system.
In addition, two different scenarios were calculated with 40% and 60% of maize silage in relation to the amount of produced dung or manure.
The possible installable rated power in kWel per livestock is calculated based on Pn, the net calorific value of methane, an average electrical efficiency of 37%, and 8760 full load hours. The conversion factor for MJ to kWh is 0.277 (see all parameters in Table 4).
First, the average biogas potential per farm site was calculated by dividing the number of animals per farm class and husbandry system. Then, it is multiplied with the manure or dung per animal place and with the density of the excrements. This is then multiplied with the specific methane yield of the substrate, which is multiplied with net calorific value, a conversion factor, and the average of electrical efficiency of small combined heat and power plants. (1) In the next step, the amount of manure or dung and its methane potential was calculated divided by the maximum full load hours per year and divided by the number of animal placesFor the scenarios with co-substrate, the calculation was complemented with calculations for the co-substrate depending on the mass of excrement produced per livestock, the number of animals, the farm class, and the husbandry system (2).
The potential for the installable electrical power of manure or dung for biogas per farm class is obtained as:
kW POT ( C f ,   H U S ) = i = 1 n n AP ( C f , H U S ) i = 1 n n FARM   ( C f ,   H U S ) * m EAP * ρ i * m MY * N C V * f c * η el F L H * 100 i = 1 n n AP .
The potential for the installable electrical power of manure or dung and the co-substrate for biogas per farm class are obtained as:
kW POT ( C f ,   H U S ) = i = 1 n n AP ( C f , H U S ) i = 1 n n FARM   ( C f ,   H U S ) * m EAP * ρ i * m MY * N C V * f c * η el * p COSUB ( m EAP ) * m MY * N C V * f c * η el F L H * 100 i = 1 n n AP .

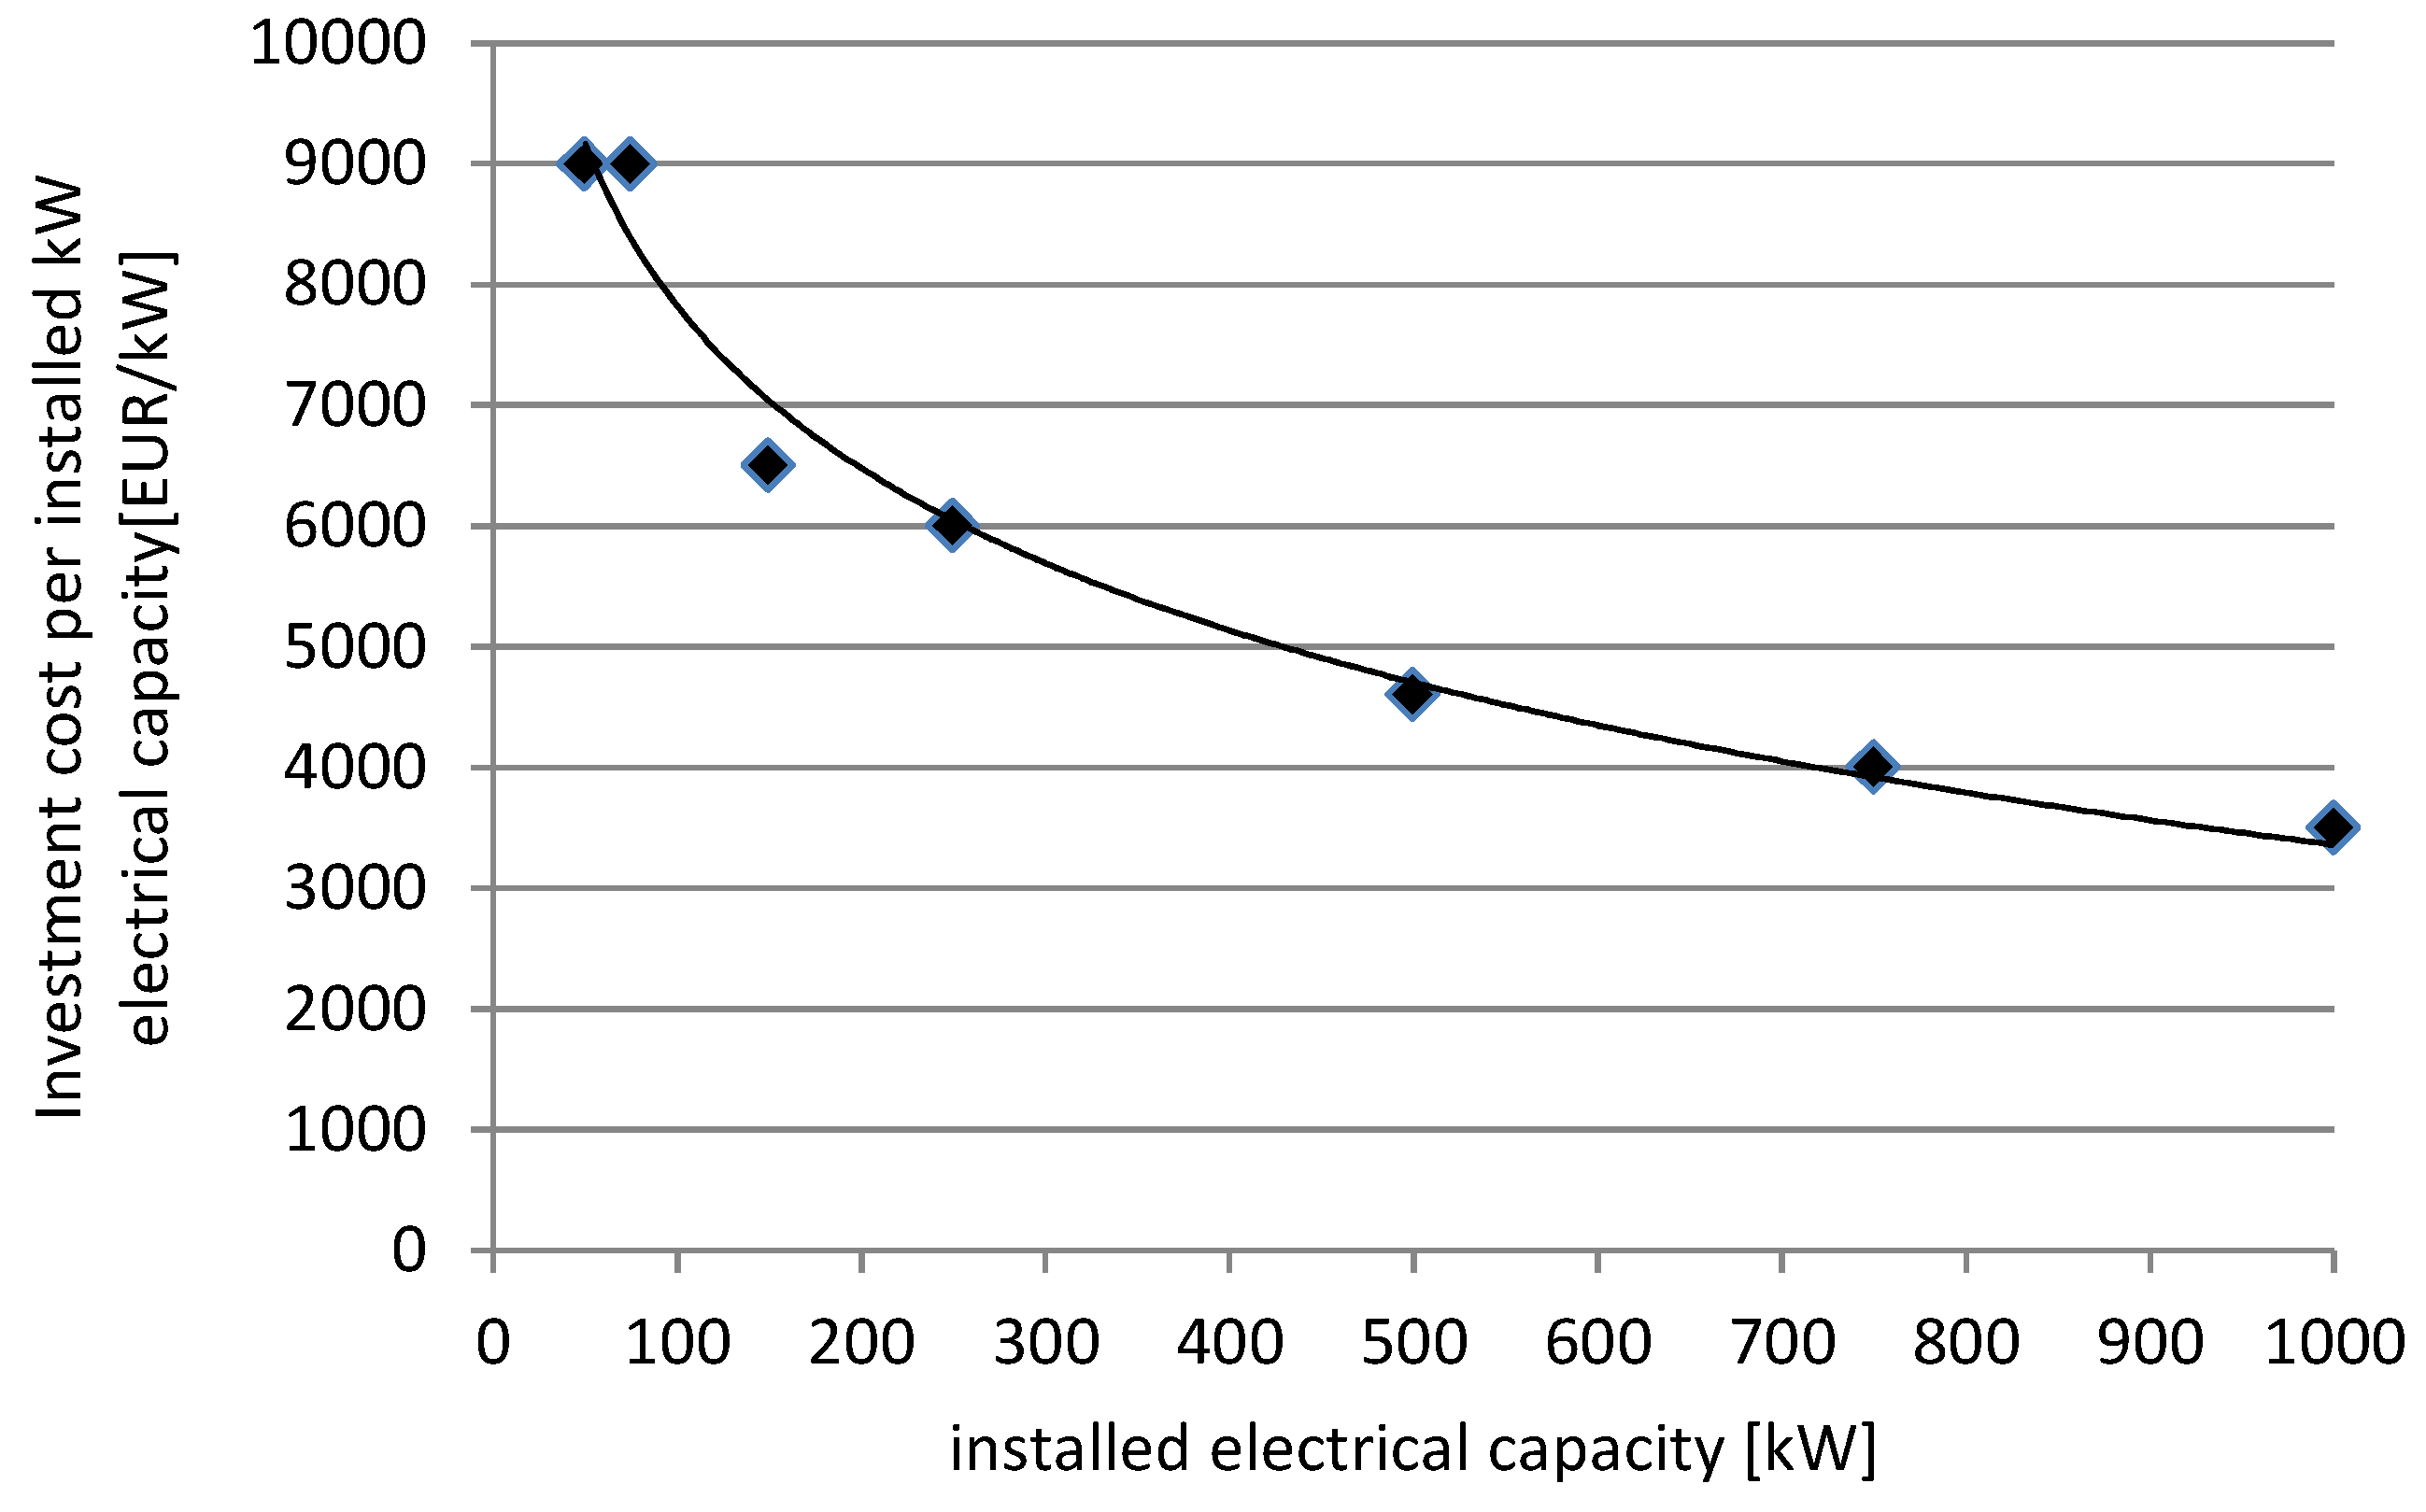
2.6. Assumed Investment Costs for Biogas Concepts

Biogas plants operated by agricultural feedstock, including manure, other residues, and energy crops typically consist of a fermentation reactor, a gas storage unit, and the energy provision step and peripheral equipment. The main process technology applied is the continuous stirred tank reactor system. The substrate is usually fed into the digesters by means of pumps (for liquid substrates), feeding systems for solid matter (e.g., energy crops), or mixing tanks. The insulated digesters that are mainly operated at mesophilic temperatures have rubber domes for gas collection. Due to German regulations, the retention times are more than 100 days in most cases, with the resulting overall organic loading rates being respectively low. Gas cleaning (i.e., desulphurization) and safety installations (i.e., excess gas burners) are required in addition. The gas produced is collected in rubber domes (one and two layer systems) on top of the digesters and converted on site at the biogas plant into power, fed into the grid, the produced heat is used to supply some heat demand close to the plant [30]. The capacity of a biogas plant is typically given as “installed capacity of the power provision unit (kWel).” In sum, there is a reasonable technical effort behind the conversion of manure into energy so that economies of scale are a relevant issue for the feasibility of biogas concepts for manure processing. Past experiences from Germany have placed average investment costs of 3500 EUR/kW for a 1000 kWel biogas plant and up to 9000 EUR/kWel for a 50–75 kWel biogas plant [18,31]. The degression of costs as a function of the installed electrical capacity is shown in Figure 1. This cost function led to the assumption that biogas plants at farm scale should not fall below a minimum capacity of 50 kWel.

2.7. Considering Different Scenarios

The relatively small potential of manure can be supplemented with other renewable raw materials such as maize silage. By using additional substrates for the fermentation process, the required capacity for biogas plants at a farm site can change dramatically. We calculated mixed biogas systems using manure and so-called co-substrates in three scenarios: without co-substrate, with 40%, and with 60% maize silage as a co-substrate.

3. Results and Discussion

The biogas potential is distributed over more than 100,000 farms with very different livestock sizes for cattle and pigs:
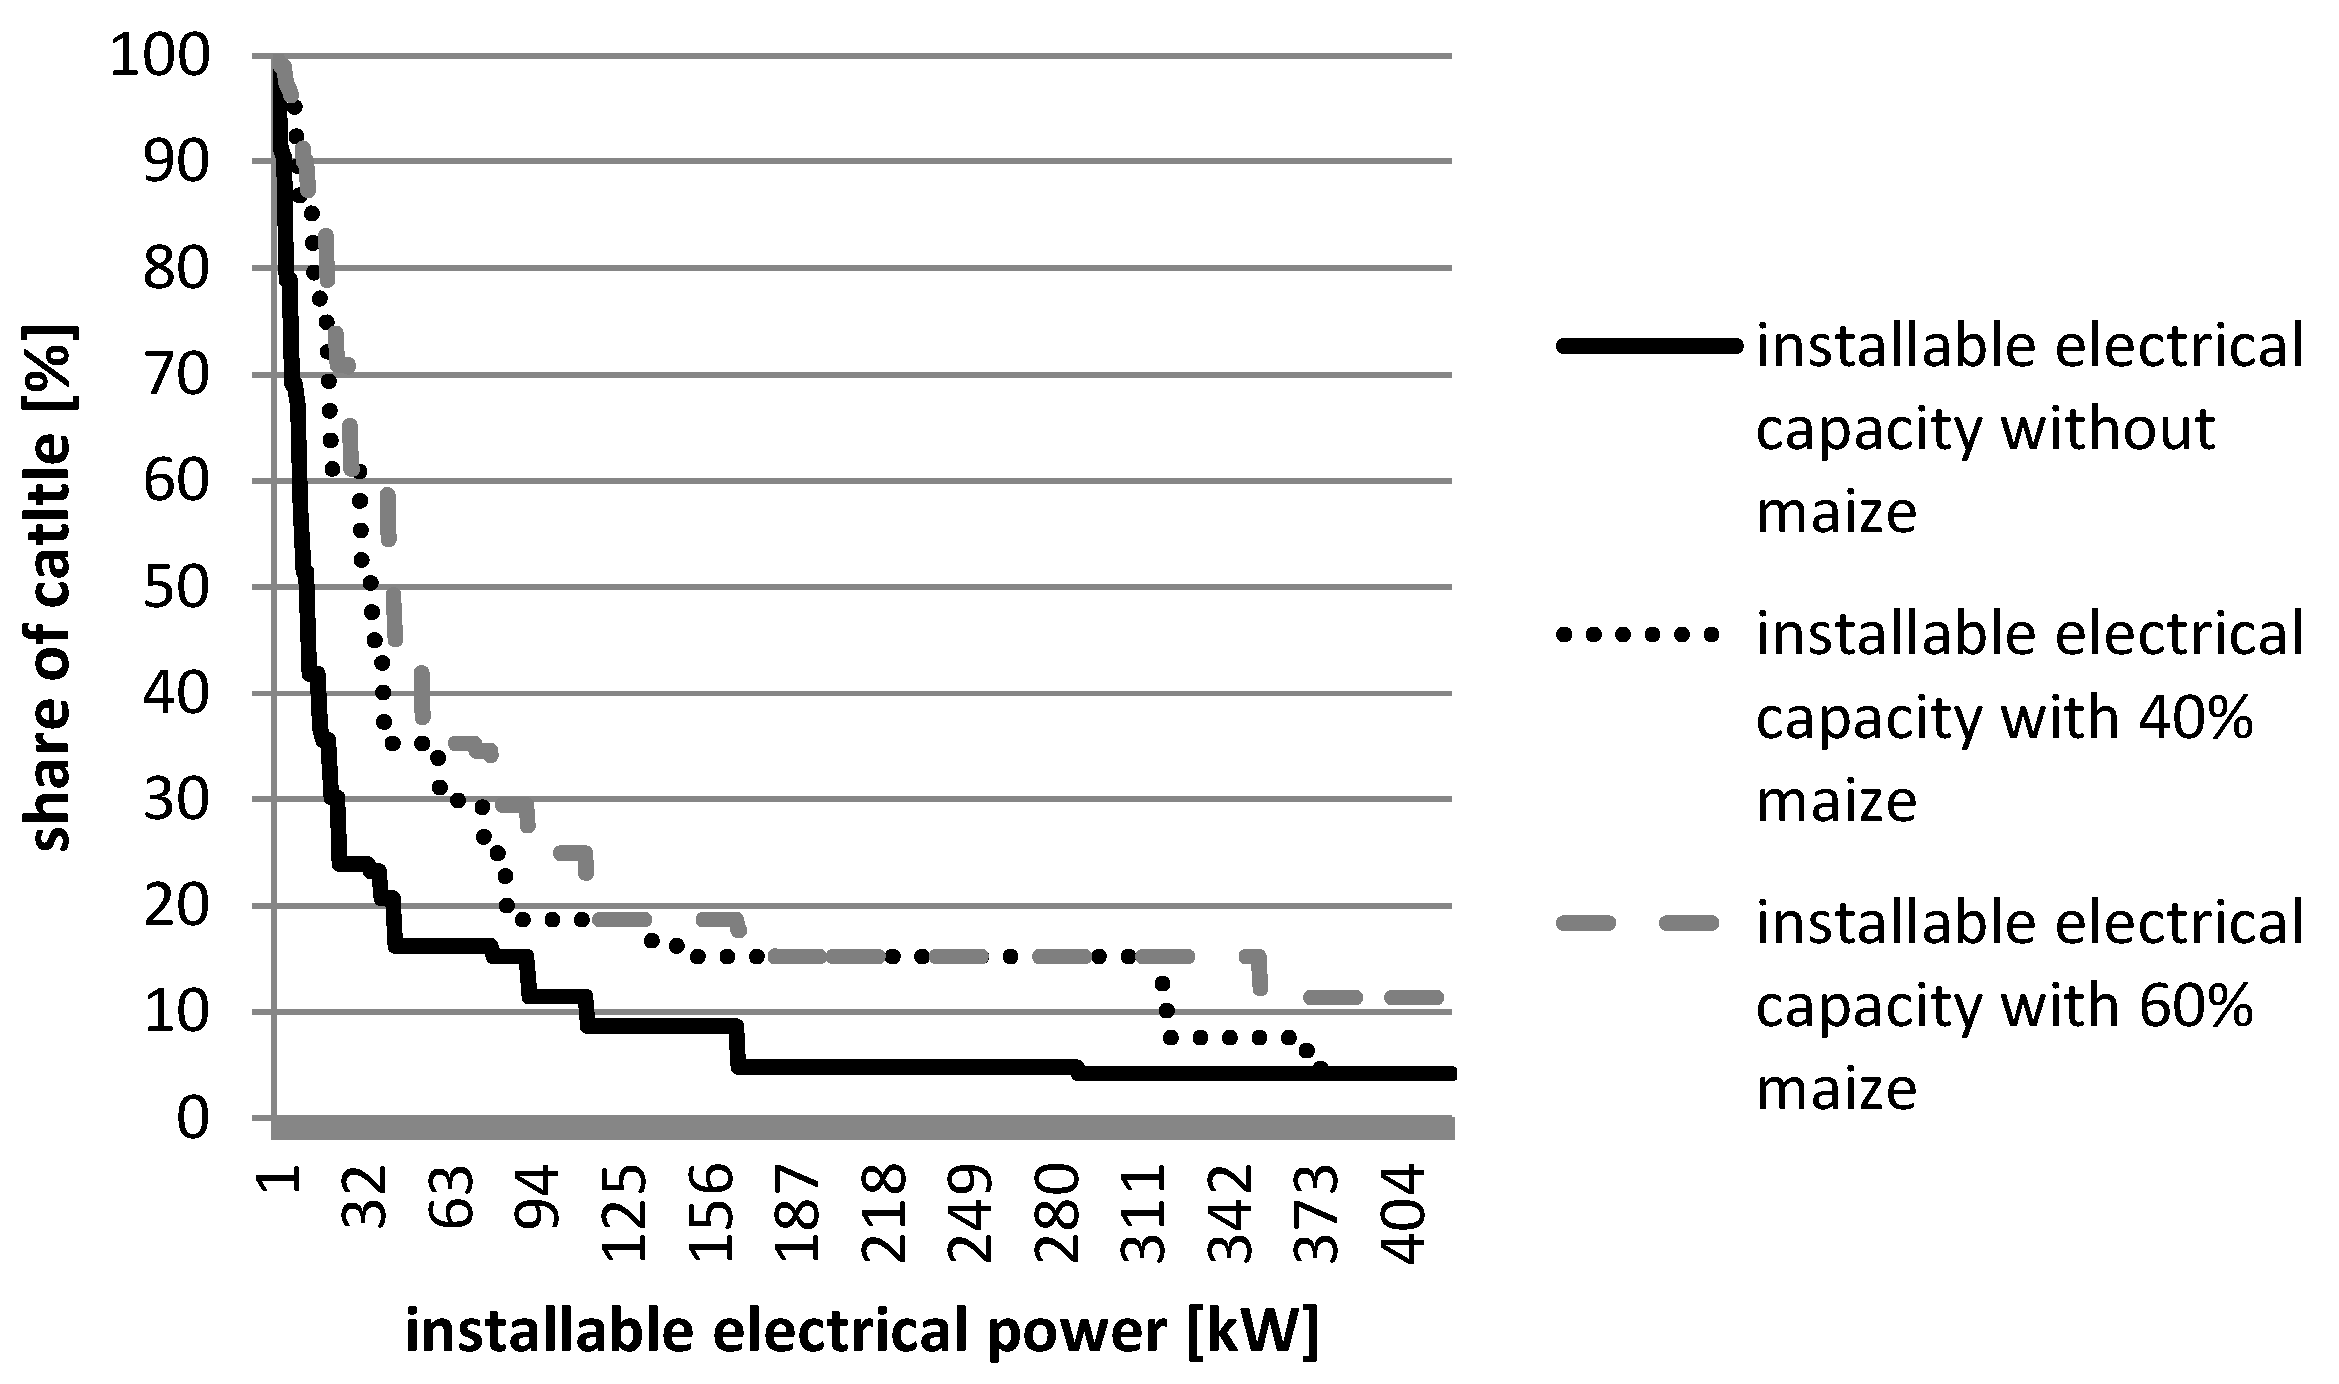
  • For the evaluation of biogas potential in farms with cattle, 95.8% of the livestock was considered. The remaining 4.2% do not have any biogas potential due to their type of livestock breeding without collectable excrement. Around 130,000 farms in total breed cattle in Germany with a total number of 12.37 million cattle. The number of cattle per farm ranges from 1 to 9 individuals to more than 500 cows per farm. The largest share of cattle is bred on medium- to small-sized farms with 200 to 499 cows per farm. Large farms with more than 500 cows, representing 2% of all farms with cattle have a share of 17% of the total number of cattle [25].
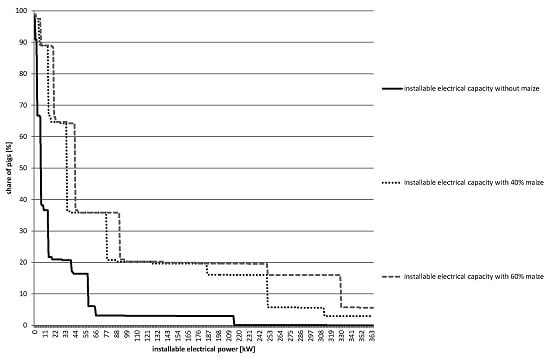
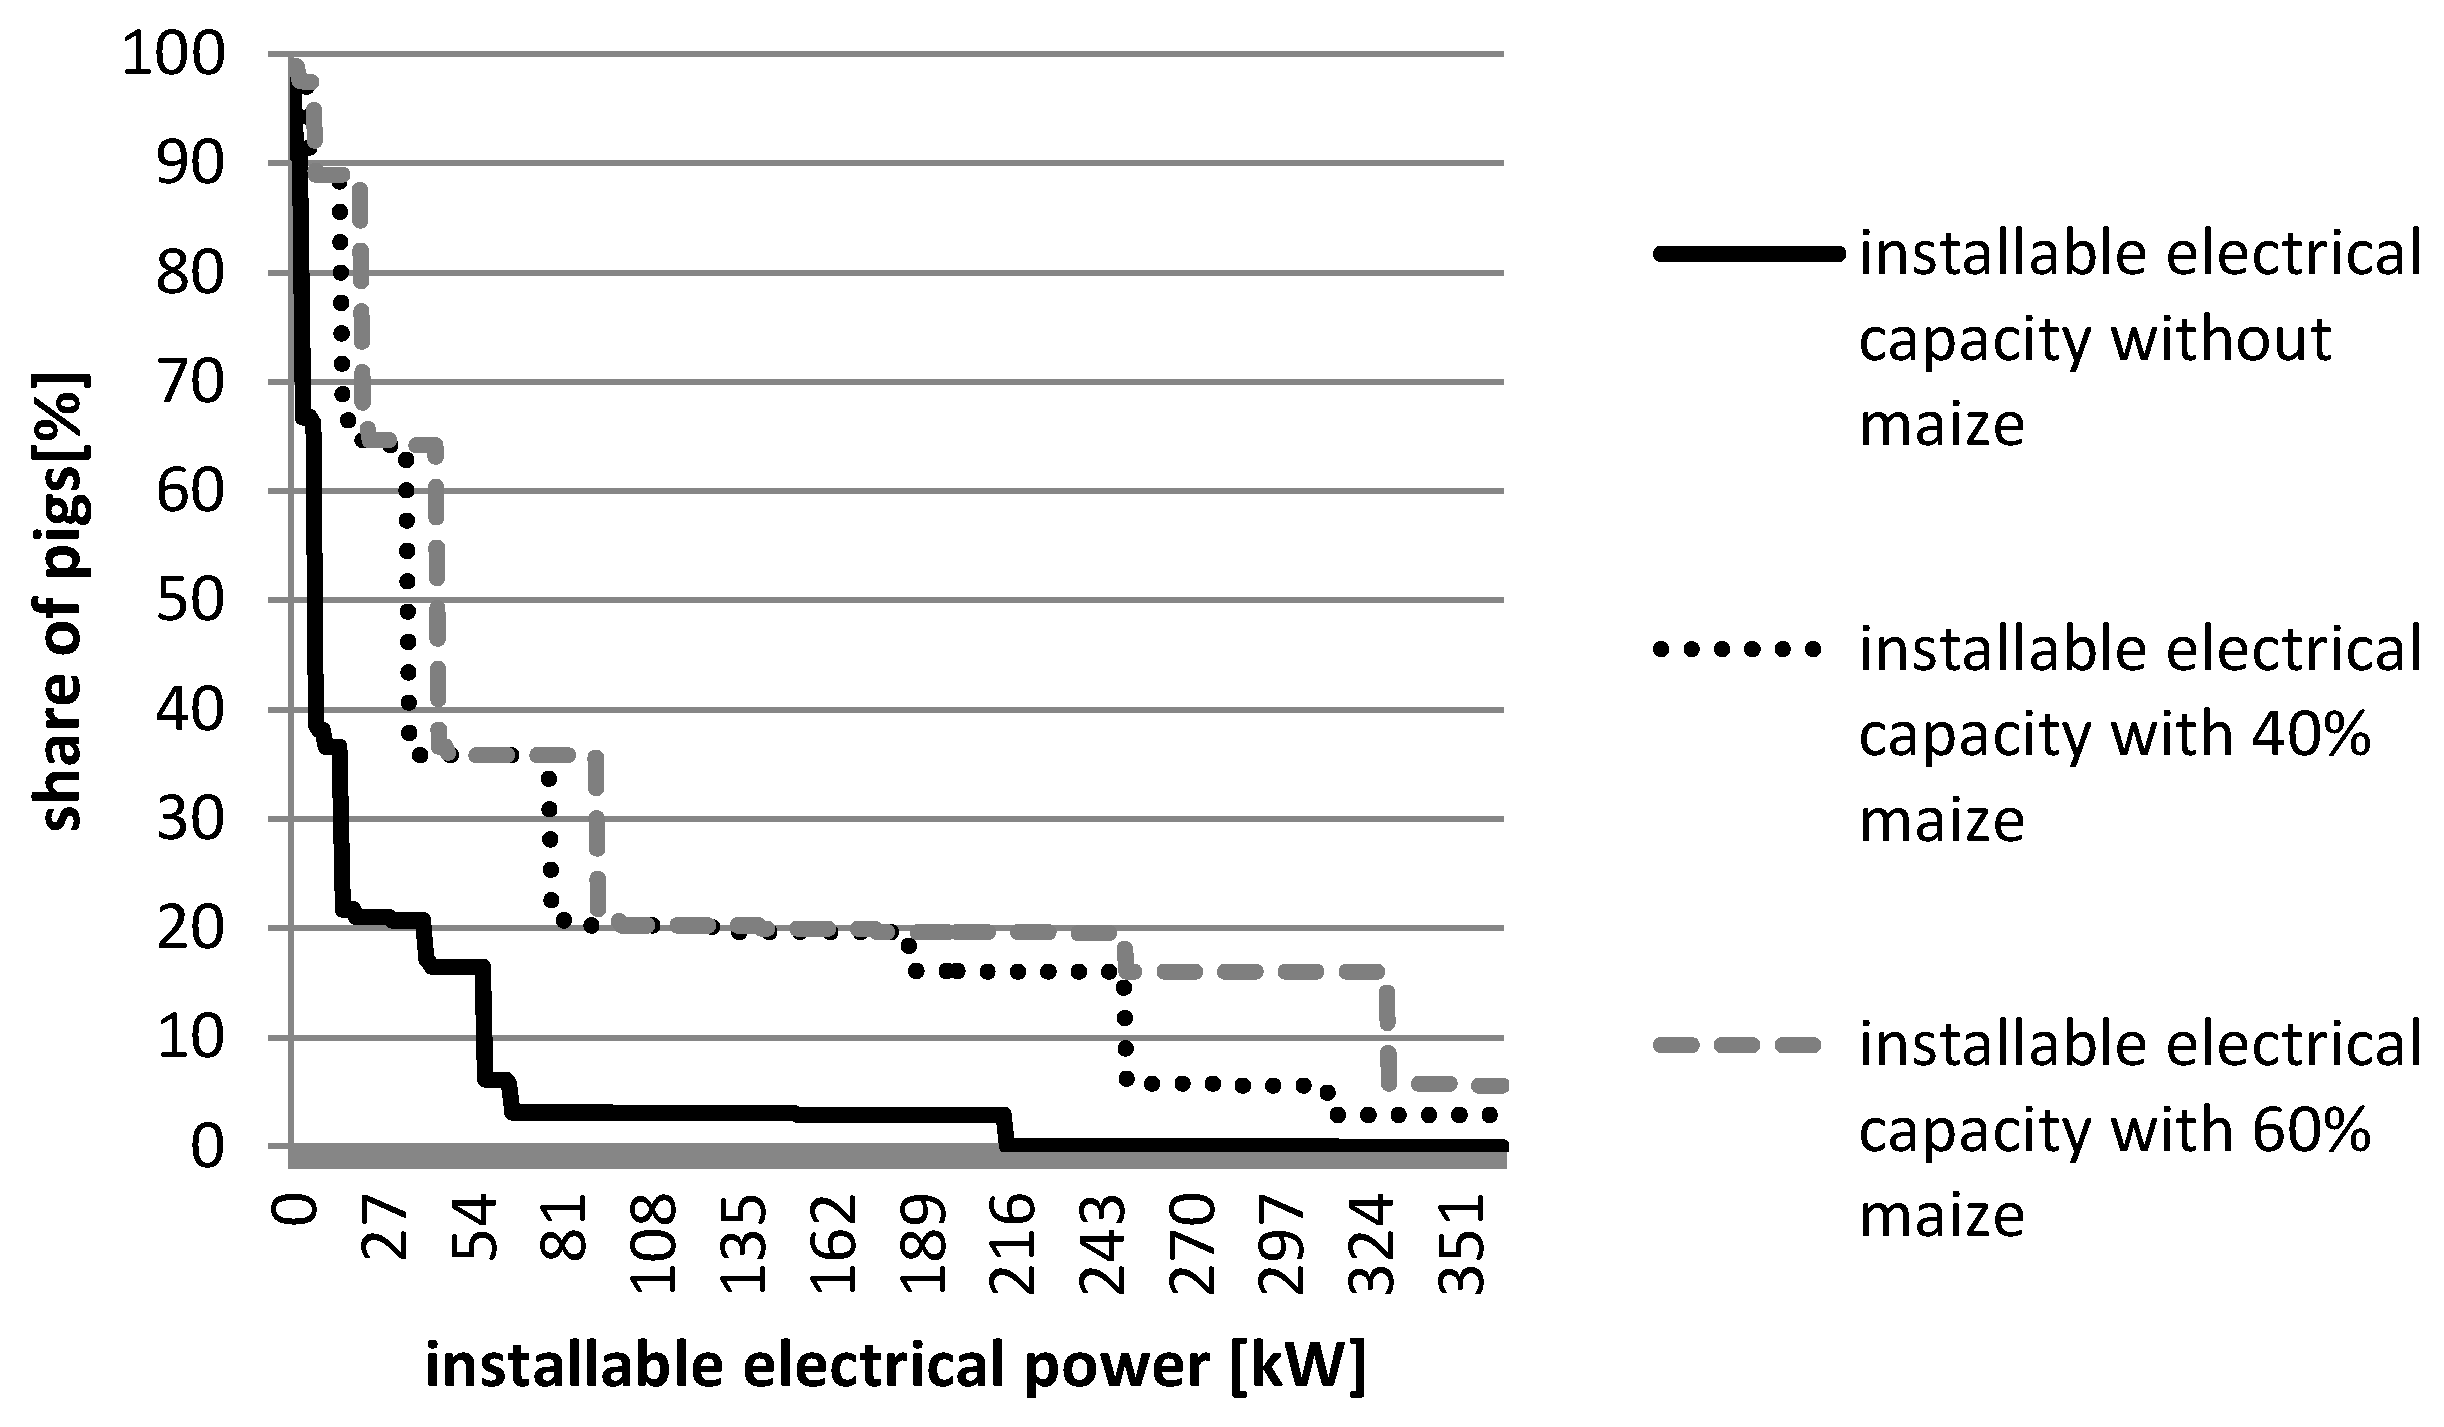
  • For the evaluation of the manure and dung potential from pigs, 100% of the livestock were considered. Pigs are bred on 68,000 farms in Germany, totaling 28.7 million pigs. The range of farm sizes varies from small farms with up to 49 pigs to farms with more than 5,000 pigs. The majority of pigs are reared on farms with 1000 to 1999 pigs. Similar to the cattle farms, the largest pig farms have, in relation to the number of pigs that they breed, a relatively large share of the pig population, accounting for 16% [25].
The calculation of the related biogas plant capacity for different farm classes is given in Table 5. It indicates the average biogas capacity for the class while discarding the farm size distribution within the classes. Nevertheless, the information provides robust results about the required biogas size categories. The results range from 1 to 400 kWel. The distribution is given in Figure 2 for cattle and in Figure 3 for pigs. The figures show the total amount of cattle and pigs as percentage and the installable electrical capacity.
Based on cattle manure, 7.2% of the livestock could provide feedstock for more than 100 kWel for biogas production alone, whereas additional farms with 4.8% of the livestock could install between 75 and 100 kWel. A biogas power plant with at least 50 kWel could be installed at farms with 12% of all cattle with manure and dung only. With the use of 40% maize silage, the share increases to 31.1%. If 60% maize silage is used, the share of livestock increases to 40.8% (see Figure 2).
For 3.1% of the livestock of pigs, a biogas power plant with at least 100 kWel could be installed, by using only manure or dung as a substrate.
Assuming an installed electrical capacity with a minimum of 50 kWel, farms with 16.5% of the pig livestock could install a biogas plant. With an increasing share of maize silage as a co-substrate, the share of the livestock would increase to 35.9% (40%–60% maize silage).

4. Conclusions

The biogas production potential of manure is significant with 90 PJ/yr but spread over a large number of farms. By contrast, the individual potential at the farm site is comparably low in many cases. Our calculations clearly indicate that the farm size is the limiting factor for manure or dung processing to biogas. Due to the fact that manure has a very high percentage of water and therefore cannot be transported, biogas facilities for manure processing are always comparably small units that are individually located on farm sites. They are characterized by comparably high investment costs, which bring, however, a double-saving GHG effect as a result of (1) avoided emissions from manure storage and (2) avoided emissions through bioenergy provision as a substitute for fossil fuels. However, if we assume small and cost-intensive plants based on the available technology down to an installed capacity of 50 kWel, we see a clear limitation due to farm structure, meaning that only a small proportion of the potential can be tapped into, equating to around 12% of the manure potential for cattle and 16.5% of the manure potential for pigs. To unlock the remaining potential, different strategies have to be taken into consideration.
The co-fermentation of manure and dung with energy crops, for example, can reduce this limitation and release more manure for biogas production. This option was investigated here and showed a considerable effect: With co-fermentation (40%–60% maize silage), the share of excrement, which can be converted into biogas in plants with a capacity of more than 50 kW increases to 31% or to 41% of cattle, respectively. For pigs, it also more than doubles with 36% of pigs. Even if this increase is rather impressive, there is still a huge amount of biomass that cannot be tapped into by this kind of co-fermentation.
Additional strategies could include management or technical adaptations, i.e., a co-operation of farms could also increase the manure availability at a single plant (the potential of this measure strongly depends on local conditions; therefore, an assessment of the overall effect of this option cannot be carried out with the approach that we developed). In the long term, technology adaptations could be an option, for example by additionally pretreating the manure to convert it into an intermediate with a higher energy density, making transportation more feasible.
Our calculations clearly show a need for action to reduce the GHG emissions from livestock farming in Germany and the need to think about different strategies to unlock the potential of efficiently producing biogas of manure.

Author Contributions

Both authors contributed equally to the paper.

Conflicts of Interest

The authors declare no conflict of interest.

References

  1. IPCC. Climate Change 2014 Synthesis Report Summary for Policymakers; IPCC: Geneva, Switzerland, 2014. [Google Scholar]
  2. WRI. Climate Analysis Indicators Tool (CAIT) (version 9.0); World Resources Institute: Washington, DC, USA, 2012. [Google Scholar]
  3. UBA. Berichterstattung Unter Der Klimarahmenkonvention Der Vereinten Nationen Und Dem Kyoto-Protokoll 2013 Nationaler Inventarbericht Zum Deutschen Treibhausgasinventar 1990–2011; Umweltbundesamt: Dessau-Roßlau, Germany, 2013. [Google Scholar]
  4. Freibauer, A. Biogenic Greenhouse Gas Emissions from Agriculture in Europe-Quantificatio and Mitigation; Universität Hohenheim: Hohenheim, Germany, 2002. [Google Scholar]
  5. Monteny, G.J.; Bannink, A.; Chadwick, D. Greenhouse Gas Abatement Strategies for Animal Husbandry. Mitig. Greenh. Gas Emiss. Livest. Product. 2016, 112, 163–170. [Google Scholar] [CrossRef]
  6. Dämmgen, U.; Webb, J. The development of the EMEP/CORINAIR guidebook with respect to the emissions of different nitrogen and carbon species from animal production. Mitig. Greenh. Gas Emiss. Livest. Product. 2006, 112, 241–248. [Google Scholar] [CrossRef]
  7. Grübler, A.; Ishitani, H.; Johansson, T.; Marland, G.; Moreira, J.R.; Rogner, H.-H. B: Energy Primer. IPCC—Intergovernmental Panel on Climate Change. Available online: http://www.ipcc-wg2.gov/publications/SAR/SAR_Chapter%20B.pdf (accessed on 11 July 2014).
  8. Bundesregierung. Bundesregierung Erneuerbare Energien-Ein Neues Zeitalter Hat Begonnen. Available online: http://www.bundesregierung.de/Webs/Breg/DE/Themen/Energiewende/EnergieErzeugen/ErneuerbareEnergien-Zeitalter/_node.html;jsessionid=BEFF78D3A8ED2D8ECC35E6B4A09DE74E.s4t1#doc516106bodyText2 (accessed on 22 July 2015).
  9. Haenel, H.D.; Rösemann, C.; Dämmgen, U.; Poddey, E.; Freibauer, A.; Wulf, S.; Eurich-Menden, B.; Döhler, H.; Schreiner, C. Calculations of Gaseous and Particulate Emissions from German Agriculture 1990–2012; Johann Heinrich von Thünen-Institut: Braunschweig, Germany, 2014. [Google Scholar]
  10. Seyfert, U.; Bunzel, K.; Thrän, D.; Mauky, E.; Fritsche, B.; Schreiber, A.; Liebetrau, J.; Schmidt, T.; Ulbricht, T.; Lenz, V. DBFZ Report Nr. 8; Deutsches Biomasseforschungszentrum gemeinnützige GmbH: Leipzig, Germany, 2011. [Google Scholar]
  11. Scheftelowitz, M.; Thrän, D.; Hennig, C.; Krautz, A.; Lenz, V.; Liebetrau, J.; Daniel-Gromke, J.; Denysenko, V.; Hilebrand, K.; Naumann, K.; et al. Entwicklung Der Förderung Der Stromerzeugung Aus Biomasse Im Rahmen Des EEG; DBFZ Report Nr. 21; Nelles, M., Ed.; DBFZ Deutsches Biomasseforschungszentrum gemeinnützige GmbH: Leipzig, Germany, 2014. [Google Scholar]
  12. Federal Government of Germany 2012a. Act on Granting Priority to Renewable Energy Sources (Renewable Energy Sources Act-EEG). Federal Law Gazette on 4 August 2011 (BGBl. I, P. 1634 et Seq.). Vol. Federal Law Gazette on 4 August 2011 (BGBl. I, p. 1634 et seq.). Available online: http://www.bmu.de/english/renewable_energy/doc/47883.php (accessed on 23 July 2015).
  13. Thrän, D.; Krautz, A.; Scheftelowitz, M.; Lenz, V.; Liebetrau, J.; Daniel-Gromke, J.; Zeymer, M.; Nelles, M. Auswirkungen Der Gegenwärtig Diskutierten Novellierungs-Vorschläge Für Das EEG-2014. In Biogas 2014: 7. Innovationskongress; Tagungsband; 22–23 Mai 2014 Im Zentrum Für Umweltkommunikation Der Deutschen Bundesstiftung Umwelt (DBU) Osnabrück; 11–22; Profair Consult: Hildesheim, Germany, 2014. [Google Scholar]
  14. Kaltschmitt, M.; Hartmann, H.; Hofbauer, H. Energie Aus Biomasse: Grundlagen, Techniken Und Verfahren. 2; Corrected Aufl. 2009. 2., korr. Nachdruck 2009; Springer: Heidelberg, Germany, 2009. [Google Scholar]
  15. LKVBB. Untersuchung von Gülle-Notwendig Für Den Fachgerechten Einsatz Als Dünger Oder Als Substrat in Biogasanlagen. Landeskontrollverband Brandenburg e.V. Available online: http://www.lkvbb.de/hauptinf-Dateien/Guelle%20mit%20Tabellen.pdf (accessed on 13 January 2016).
  16. BMWi. Gesetz Für Den Ausbau Erneuerbarer Energien (Erneuerbare-Energien-Gesetz-EEG 2014); Bundesministerium für Wirtschaft und Energie: Berlin, Germany, 2014. [Google Scholar]
  17. BMWi. Referentenentwurf Des BMWi (IIIB2) Entwurf Eines Gesetzes Zur Einführung von Ausschreibungen Für Strom Aus Erneuerbaren Energien Und Zu Weiteren Änderungen Des Rechts Der Erneuerbaren Energien; Bundesministerium für Wirtschaft und Energie: Berlin, Germany, 2016. [Google Scholar]
  18. Dederer, M. Betriebswirtschaftliche Bewertung Kleiner Biogasanlagen; ALB Tagung: Hohenheim, Germany, 2012. [Google Scholar]
  19. TierSchNutztV. Verordnung Zum Schutz Landwirtschaftlicher Nutztiere Und Anderer Zur Erzeugung Tierischer Produkte Gehaltener Tiere Bei Ihrer Haltung (Tierschutz-Nutztierhaltungsverordnung—TierSchNutztV); Bundesministerium für Ernährung und Landwirtschaft: Bonn, Germany, 2014. [Google Scholar]
  20. Scheftelowitz, M.; Rensberg, N.; Denysenko, V.; Daniel-Gromke, J.; Stinner, W.; Hillebrand, K.; Naumann, K.; Peetz, D.; Henning, C. Stromerzeugung Aus Biomasse (Vorhaben IIa) Zwischenbericht Mai 2015; Deutsches Biomasseforschungszentrum gemeinnützige GmbH: Leipzig, Germany, 2015. [Google Scholar]
  21. Shen, X.L.; Huang, G.Q.; Yang, Z.L.; Han, L.J. Compositional characteristics and energy potential of Chinese animal manure by type and as a whole. Appl. Energy 2015, 160, 108–119. [Google Scholar] [CrossRef]
  22. Schultheiss, U.; Döhler, H.; Bach, M. Festmistaußenlagerung 1. überarbeitete Auflage; Kuratorium für Technik und Bauwesen in der Landwirtschaft KTBL: Darmstadt, Germany, 2011. [Google Scholar]
  23. Reinhold, G. Masse-Und Trockensubstanzbilanz in Landwirtschaftlichen Biogasanlagen-Langfassung Der Veröffentlichung Reinhold, G.: Genau Bilanzieren in Neue Landwirtschaft Heft 12/2005, S. 68 Bis 72; Thüringer Landesanstalt für Landwirtschaft TLL: Jena, Germany, 2015. [Google Scholar]
  24. Albert, E.; Förster, F.; Ernst, H. Wirksamkeit Organischer Dünger—Berechnung Der Pflanzenbaulichen Wirksamkeit Der Nährstoffe Organischer Dünger; Freistaat Sachsen, Sächsische Landesanstalt für Landwirtschaft: Dresden, Germany, 2007. [Google Scholar]
  25. BMEL. Statistisches Jahrbuch über Ernährung Landwirtschaft Und Forsten 2014; Bundesministerium für Ernährung und Landwirtschaft: Bonn, Germany, 2015; Volume 58. [Google Scholar]
  26. Achilles, W.; Brenndörfer, M.; Döhler, H.; Eckel, H.; Eurich-Menden, B.; Frisch, J.; Fritzsche, S.; Froeba, N.; Fuebbeker, A.; Funk, M.; et al. Betriebsplanung Landwirtschaft 2004/2005. KTBL-Datensammlung: Daten für die Betriebsplanung in der Landwirtschaft; Landwirtschaftsvlg Münster: Münster, Germany, 2004. [Google Scholar]
  27. Frisch, J.; Fritzsche, S.; Fröba, N.; Funk, M.; Gaio, Ch.; Grimm, E.; Grube, J.; Hartmann, S.; Hartmann, W.; Klocpfer, F.; et al. Betriebsplanung Landwirtschaft 2012/2013 KTBL Datensammlung; Kuratorium für Technik und Bauwesen in der Landwirtschaft KTBL: Darmstadt, Germany, 2012; Volume 23. [Google Scholar]
  28. BMU. Ordinance on the Generation of Electricity from Biomasse (Biomasse Ordinance—BiomasseV) Consolidated Version of the Ordinance in the Version Applicable as of 1 January 2012; BMU: Berlin, Germany, 2012. [Google Scholar]
  29. ASUE. BHKW-Kenndaten 2011; ASUE Arbeitsgemeinschaft für Sparsamen und Umweltfreundlichen Energieverbrauch e.V.: Berlin, Germany, 2011. [Google Scholar]
  30. Thrän, D.; Liebetrau, J.; Daniel-Gromke, J.; Jacobi, F. Smart Bioenergy. Technologies and Concepts for a More Flexible Bioenergy Provision in Future Energy Systems; Thrän, D., Ed.; Springer-Verlag: Heidelberg, Germany, 2015. [Google Scholar]
  31. FNR e.V. Faustzahlen Biogas. Available online: http://biogas.fnr.de/daten-und-fakten/faustzahlen/ (accessed on 16 September 2015).
Figure 1. Degression of costs as a function of the installed electrical capacity, based on FNR e.V. and Dederer [18,31].
Agriculture 06 00020 g001
Figure 2. Installable electrical power from biogas at cattle farms depending on the number of cattle and the percentage of co-substrate.
Agriculture 06 00020 g002
Figure 3. Installable electrical power from biogas at pig farms depending on the number of pigs and the percentage of co-substrate.
Agriculture 06 00020 g003
Table 1. Range of dry matter content in different types of excrements [15,22,23,24].
Type of ExcrementDry Matter Content in%
Dung cattle25
Manure cattle4–13
Slurry cattle2
Dung pigs23–25
Manure pigs1.5–12
Slurry pigs0.9–2
Table 2. Potential of dung and manure depending on livestock species and the type of livestock breeding [26,27].
Livestock and Form of Livestock FarmingDung/Manure Per Animal in m3/yr
Cattle, slatted floors11.76/manure
Cattle, loose housing stable8.3/dung
Dairy cattle, slatted floors18/manure
Dairy cattle, loose housing stable14.4/dung
Pig (with piglets)2.15/dung
Pig (with piglets)5/manure
Pig (pup)0.3/dung
Pig (pup)0.6/manure
Pig (fattened pig)1.4/dung
Pig (fattened pig)1.5/manure
Table 3. Methane yields from different substrates [28].
SubstrateMethane Yield in m3/tFM
Cattle dung53
Cattle manure17
Pig dung45
Pig manure12
Whole crop silage (rye)103
Maize silage106
Table 4. Parameters for calculating the potential electrical capacity from biogas.
ParameterDescriptionParameterization and Data Source
kWPOTPotential of electrical capacity (kW)Potential of maximum installable electrical power
CfFarm classSection 2.1.
HUSHusbandry systemSection 2.1.
nAPNumber of animal placesSection 2.1.
EAPExcrement per animal place (in m3/place per year)Manure or dung per animal place depending on livestock and type of animal husbandry [27]
my ρiMethane yield (in m3/tFM·per year)Methane yield per t of fresh mass depending on livestock and type of manure, Section 2.4
NCVNet calorific value of methane36 MJ/m3
fcConversion factorConversion factor for MJ to kWh (0.2777777)
ηelElectrical efficiencyFor chp up to 500 kW of installed power, an average electrical efficiency of 37% is assumed [29]
FLHFull load hours8760 h/a, max. for y
ρiDung/manure densityDung density depending on livestock: cattle 0.8 t/m3 [22], pigs 0.91 t/m3, manure density 1 t/m3 [23]
COSUBCo-substrateMaize silage
pCOSUBShare of Co-substrate (in %)Depending on the scenario, 40% or 60% of Co-substrate maize silage, depending on the mass of manure or dung
Table 5. Overview of farm types with the total number animal places, the percentage of livestock, and the farm-specific biogas potential.
Farm Type Main Form of Excrement Produced Farm Size (Total Number of Animal Places)Percentage of Total Livestock (Cattle or Pigs) (%) for Manure Production Farm-Specific Manure Production (m3/yr)Farm-Specific Biogas Production (m3/a Methane) Farm-Specific Biogas Plant Capacity (kWel) (Manure and Dung Only)
Pigs with pigletsmanure1–490.00%15618750.8
Pigs with pigletsmanure50–990.00%58069602.9
Pigs with pigletsmanure100–3990.49%110713,2805.6
Pigs with pigletsmanure400–9990.30%553866,45028.1
Pigs with pigletsmanure1000–19993.52%786394,35439.9
Pigs with pigletsmanure2000–49992.66%12,897154,76065.4
Pigs with pigletsmanuremore than 50002.91%41,965503,580212.7
Pigsmanure1–490.28%12.51500.1
Pigsmanure50–990.73%73.68830.4
Pigsmanure100–3996.67%224.326911.1
Pigsmanure400–99922.22%683.081953.5
Pigsmanure1000–199927.61%1408.116,8987.1
Pigsmanure2000–499914.86%2886.534,63714.6
Pigsmanuremore than 500010.31%10,359.7124,31652.5
Pigs with pigletsdung1–490.04%6127511.2
Pigs with pigletsdung50–990.04%22710,2134.3
Pigs with pigletsdung100–3990.45%43319,4878.2
Pigs with pigletsdung400–9990.48%216797,50741.2
Pigs with pigletsdung1000–19990.36%3077138,45358.5
Pigs with pigletsdung2000–49990.07%5046227,09195.9
Pigs with pigletsdungmore than 50000.05%16,421738,941312.1
Pigs dung1–490.83%94130.2
Pigs dung50–990.65%5424401.0
Pigs dung100–3991.81%16574353.1
Pigs dung400–9991.58%50322,6409.6
Pigs dung1000–19990.72%103746,68019.7
Pigs dung2000–49990.25%212695,68640.4
Pigs dungmore than 50000.12%7632343,422145.1
Dairy cattlemanure1 to 90.1%9516130.7
Dairy cattlemanure10 to 190.8%20534931.5
Dairy cattlemanure20 to 496.5%56896484.1
Dairy cattlemanure50 to 999.6%1206.920,5178.7
Dairy cattlemanure100 to 1995.1%2313.039,32116.6
Dairy cattlemanure200 to 4992.5%5267.689,55037.8
Dairy cattlemanure500 and more 2.8%14,376.0244,392103.2
Cattle manure1 to 90.1%64.010880.5
Cattle manure10 to 190.6%162.327591.2
Cattle manure20 to 494.7%374.363622.7
Cattle manure50 to 999.8%803.713,6635.8
Cattle manure100 to 1999.7%1561.726,54911.2
Cattle manure200 to 4996.3%3292.4 55,97123.6
Cattle manure500 and more 3.8%12,695.9215,83091.2
Dairy cattledung1 to 90.3%60.7 32181.4
Dairy cattledung10 to 190.8%164.487123.7
Dairy cattledung20 to 491.9%363.219,2518.1
Dairy cattledung50 to 991.1%772.440,93717.3
Dairy cattledung100 to 1990.7%1480.378,45733.1
Dairy cattledung200 to 4991.0%3371.3178,67975.5
Dairy cattledung500 and more 0.6%9200.6487,634206.0
Cattle dung1 to 90.5%36.119150.8
Cattle dung10 to 191.6%91.648562.1
Cattle dung20 to 495.0%211.311,2004.7
Cattle dung50 to 996.0%453.824,05110.2
Cattle dung100 to 1995.4%881.846,73519.7
Cattle dung200 to 4994.5%1859.098,52541.6
Cattle dung500 and more 3.9%7168.4379,927160.5

