Article

Integration of Epidemiological Evidence in a Decision Support Model for the Control of Campylobacter in Poultry Production

1
National Food Institute, Division of Epidemiology and Microbial Genomics, Technical University of Denmark, Mørkhøj Bygade 19, 2860 Mørkhøj, Denmark
2
HUGIN EXPERT A/S, Gasværksvej 5, DK-9000 Aalborg, Denmark
3
Department of Computer Science, Aalborg University, Selma Lagerlöfs Vej 300, DK-9220 Aalborg, Denmark
*
Author to whom correspondence should be addressed.
Agriculture 2013, 3(3), 516-535; https://doi.org/10.3390/agriculture3030516
Submission received: 1 July 2013 / Revised: 7 August 2013 / Accepted: 28 August 2013 / Published: 3 September 2013
(This article belongs to the Special Issue Food Safety Management and Poultry Production)

Abstract

:
The control of human Campylobacteriosis is a priority in public health agendas all over the world. Poultry is considered a significant risk factor for human infections with Campylobacter and risk assessment models indicate that the successful implementation of Campylobacter control strategies in poultry will translate on a reduction of human Campylobacteriosis cases. Efficient control strategies implemented during primary production will reduce the risk of Campylobacter introduction in chicken houses and/or decrease Campylobacter concentration in infected chickens and their products. Consequently, poultry producers need to make difficult decisions under conditions of uncertainty regarding the implementation of Campylobacter control strategies. This manuscript presents the development of probabilistic graphical models to support decision making in order to control Campylobacter in poultry. The decision support systems are constructed as probabilistic graphical models (PGMs) which integrate knowledge and use Bayesian methods to deal with uncertainty. This paper presents a specific model designed to integrate epidemiological knowledge from the United Kingdom (UK model) in order to assist poultry managers in specific decisions related to vaccination of commercial broilers for the control of Campylobacter. Epidemiological considerations and other crucial aspects including challenges associated with the quantitative part of the models are discussed in this manuscript. The outcome of the PGMs will depend on the qualitative and quantitative data included in the models. Results from the UK model and sensitivity analyses indicated that the financial variables (cost/reward functions) and the effectiveness of the control strategies considered in the UK model were driving the results. In fact, there were no or only small financial gains when using a hypothetical vaccine B (able to decrease Campylobacter numbers from two to six logs in 20% of the chickens with a cost of 0.025 £/chicken) and reward system 1 (based on similar gross profits in relation to Campylobacter levels) under the specific assumptions considered in the UK model. In contrast, significant reductions in expected Campylobacter numbers and substantial associated expected financial gains were obtained from this model when considering the reward system 2 (based on quite different gross profits in relation to Campylobacter levels) and the use of a hypothetical cost-effective vaccine C (able to reduce the level of Campylobacter from two to six logs in 90% of the chickens with a cost of 0.03 £/chicken). The flexibility of probabilistic graphical models allows for the inclusion of more than one Campylobacter vaccination strategy and more than one reward system and consequently, diverse potential solutions for the control of Campylobacter may be considered. Cost-effective Campylobacter control strategies that can significantly reduce the probability of Campylobacter introduction into a flock and/or the numbers of Campylobacter in already infected chickens, and translate to an attractive cost-reward balance will be preferred by poultry producers.

1. Introduction

Human infections with Campylobacter are considered an important public health problem all over the world and poultry has been identified as one of the most significant sources for human Campylobacteriosis [1,2,3,4,5,6,7,8,9,10]. Campylobacter can break through biosecurity barriers and enter poultry houses, colonizing the chicken intestine and quickly multiplying in the intestinal mucosa. However, Campylobacter does not induce health or welfare problems in chickens [11]. After introduction, Campylobacter spreads fast within broiler flocks and almost all birds in the same house will be infected within one week [12]. Broilers might carry high numbers of Campylobacter in some cases exceeding 107 colony forming units per gram (CFU/g) of caecal content [13] and sometimes up to 1010 CFU/g of faeces [14,15,16]. Campylobacter present in the intestinal tract of chickens going for slaughter might contaminate the slaughtering and food processing environment and the food products representing a public health risk for the consumers. Campylobacter seems to be highly infectious and humans may develop clinical disease with the ingestion of a Campylobacter dose as low as 500 CFU [17,18]. Furthermore, humans can be infected from poultry by pathways other than poultry products and therefore increased public health benefits can be associated with the implementation of effective controls against Campylobacter in primary poultry production. Vaccination of chickens against Campylobacter has been proposed as a promising Campylobacter control measure [19]. A previous risk assessment study has shown that a reduction of two logs on the numbers of Campylobacter in chickens can translate in a reduction of human cases by 30 times [20]. Consequently, decreasing the numbers of Campylobacter in chickens at the farm level seems crucial to prevent Campylobacter contamination of chicken products, which in turn will reduce the risk of human infections with Campylobacter. In the last few years, research studies have focused on the reduction of the probability of Campylobacter introduction in broiler flocks [3,21,22,23,24] but recently some studies have focused on the development of vaccination and other control strategies with the aim to reduce the concentration of Campylobacter in the intestines of already infected chickens [25,26,27,28,29].
Poultry producers need to make important decisions and sometimes expensive investments to control Campylobacter. Incentives to differentiate the payment to poultry producers are implemented in some countries in order to improve the safety of poultry products regarding Campylobacter. For instance, in Denmark, when the microbiological test identifies a flock as Campylobacter negative a few days before slaughter, the producer gets an extra payment (around 2%) while in Norway and Sweden the payment is reduced by about 4% for flocks that test positive for Campylobacter [30]. In this way, poultry producers need to make decisions under conditions of uncertainty mainly related to the possibility of the flock being infected with Campylobacter. Furthermore, there is always uncertainty around existing knowledge and the generalization of results from specific studies further increase the uncertainty surrounding the knowledge decisions are based on. Mathematical models can be used to simulate the effectiveness and economic impact of diverse control measures. The decision support systems presented in this manuscript are constructed as probabilistic graphical models (PGMs) which integrate knowledge in one representation and use a Bayesian approach to handle uncertainty. Due to the inclusion of uncertain variables in the models (with diverse “states” or alternatives) and the use of probability distributions, using a Bayesian inference seems logic when making decisions under conditions of uncertainty and in situations that require statistical inference [31]. The integration of prior evidence (prior probabilities) can be used to infer the probabilities of other variables (or states) that are not known (posterior probabilities) using a Bayesian approach.
This manuscript describes the development of decision support models for poultry producers, focusing on the integration of qualitative and quantitative epidemiological data related to the effect of different management factors, in order to select optimal decisions regarding the cost-efficient controls that could be implemented to reduce Campylobacter concentration in chickens at farm level. The development is exemplified by a model designed using data from the United Kingdom (UK) to assist decision-making related to the control of Campylobacter in chicken farms using vaccination strategies. Human Campylobacteriosis represents an important problem in the UK causing significant morbidity and socio-economic costs [32,33]. The number of reported human Campylobacteriosis cases in 2009 was 57,772 in England and Wales, however, it has been estimated that the burden of human infection in 2009 could be closer to 400,000 [34]. An overall Campylobacter spp. prevalence of 79.2% in UK broilers going for slaughter was obtained in a stratified randomized survey conducted during 2007–2009, including data from the EU baseline survey of 2008 [35].

2. Materials and Methods

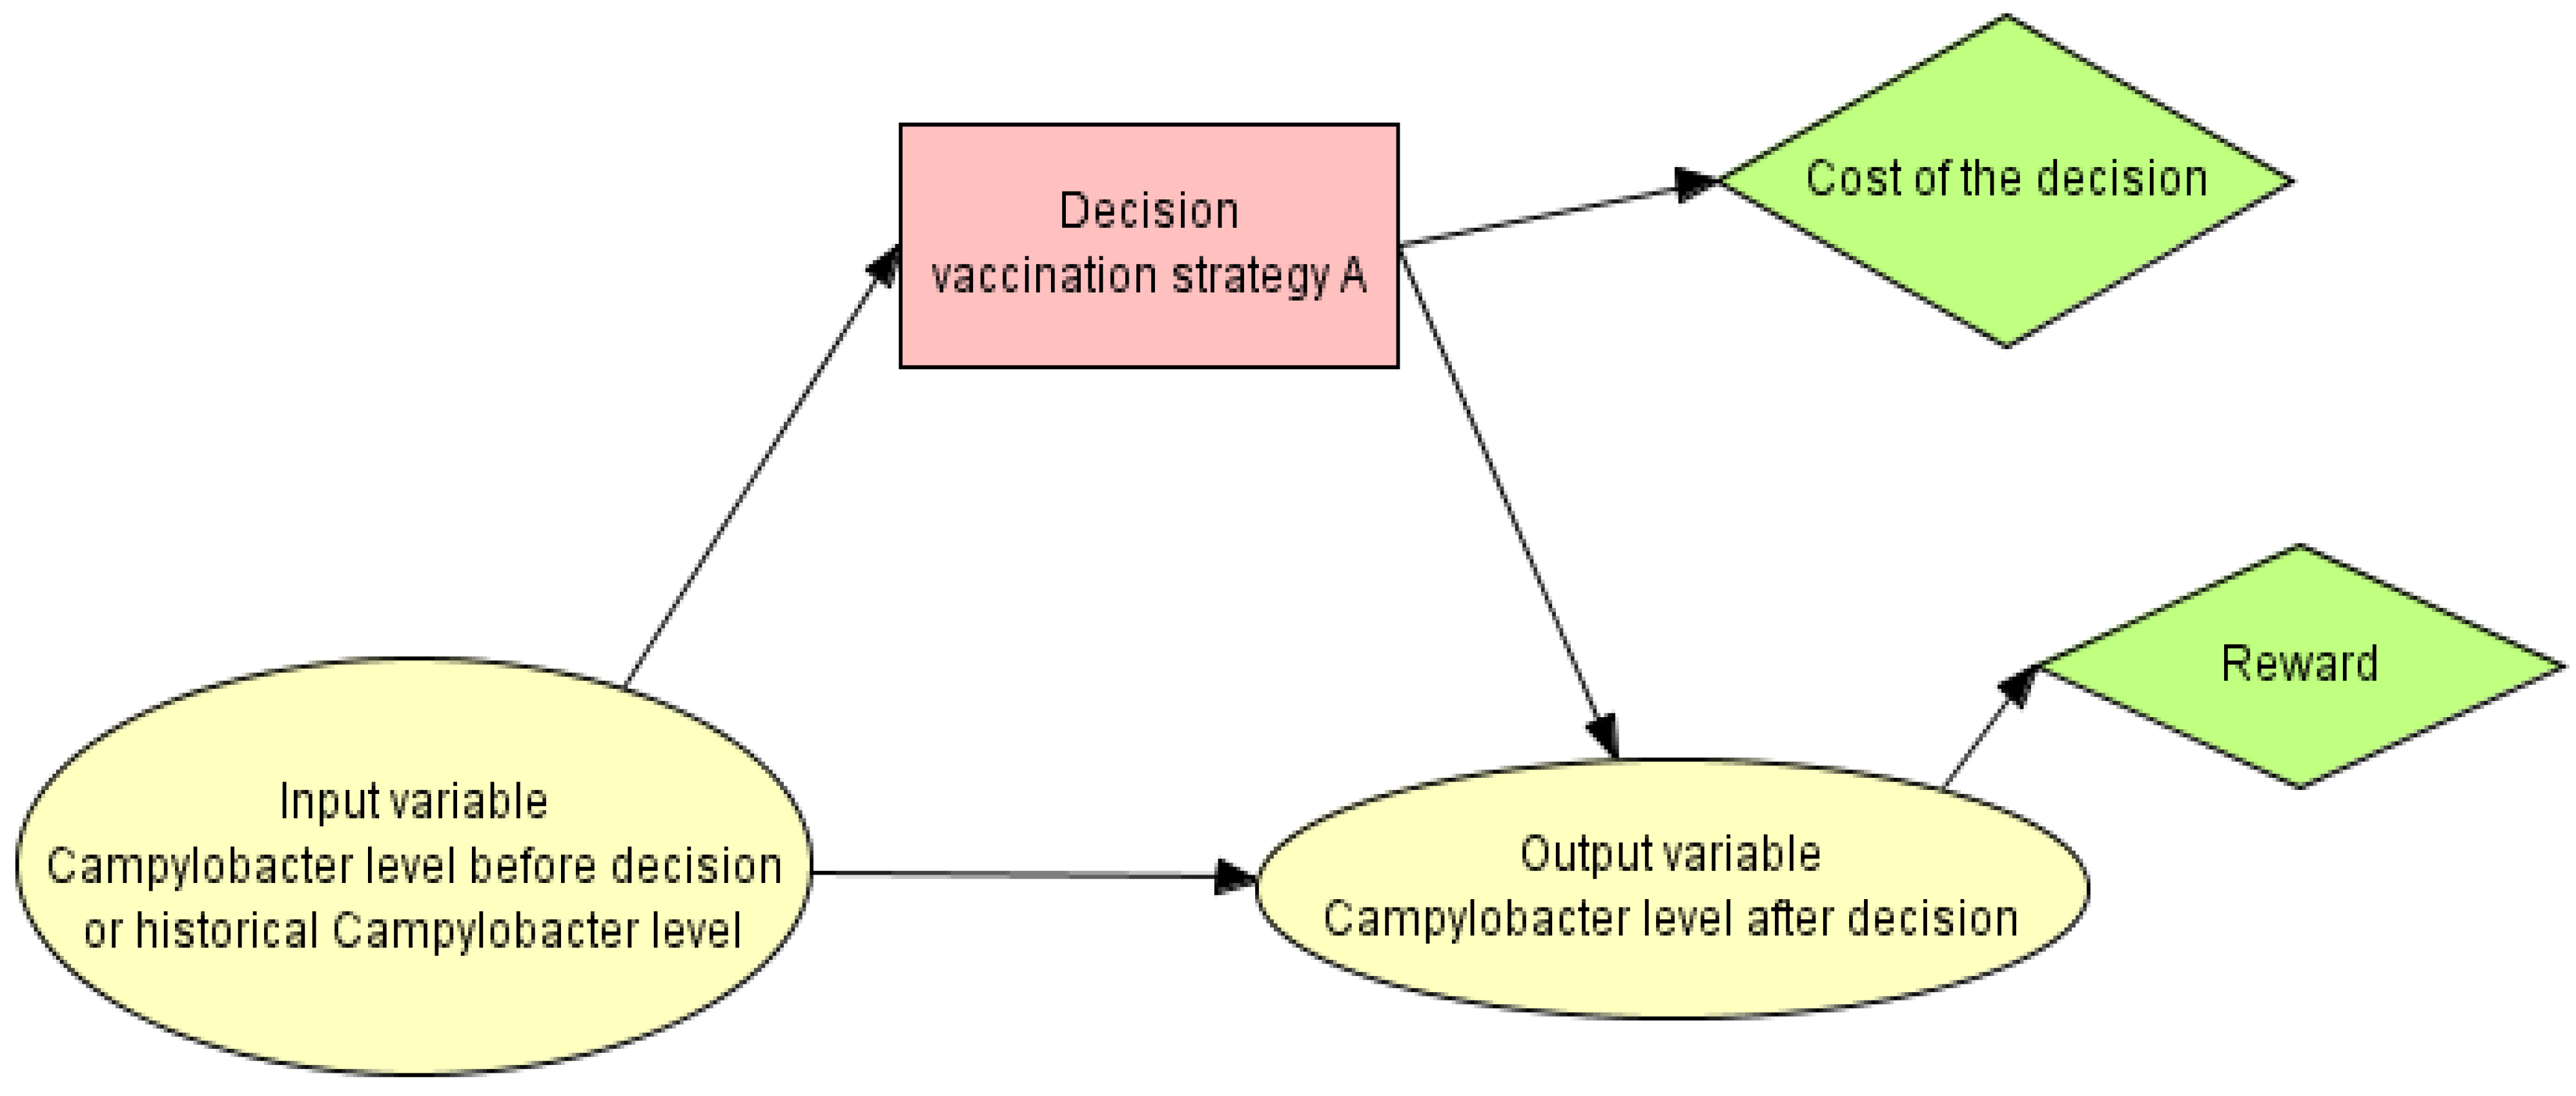
2.1. Probabilistic Graphical Models (PGMs)

Poultry producers need to make important decisions related to the implementation of interventions against Campylobacter in poultry flocks before they know for sure if the flock will be challenged or infected with Campylobacter. Probabilistic graphical models (PGMs) may assist poultry producers in these crucial decisions made under conditions of uncertainty. The probabilistic graphical models presented in this manuscript have been designed using the HUGIN tool which is a commercial off-the-shelf software package created for the construction and deployment of probabilistic graphical models. A very simple example of a PGM with just one input variable (that could be however the result of the interaction of many variables) is presented in Figure 1.
In Figure 1, the probabilistic dependence relationships between a set of variables are illustrated using a probabilistic graphical model (formed by a set of variables) which has two components; a qualitative and a quantitative part. The qualitative part is represented by a directed acyclic graph (DAG) which includes diverse “nodes” such as variables, decision nodes and utility functions as well as arcs representing relationships between them. A decision node (a rectangle in Figure 1) defines decision alternatives at a specific point in time, a chance node (an oval) represents a random variable and a utility node (a diamond in Figure 1) represents a reward or cost function. Arcs directed into a decision node define the information that is known by the decision maker at the time that the decision needs to be done. Each node includes a set of states or alternatives and the arcs represent the relationships between variables. The strength of the relationships between the entities included in the models can be defined using conditional probability distributions [36]. Variables, decision nodes and utility functions need to be carefully selected in order to obtain reliable outcomes.
Figure 1. A simple probabilistic graphical model (PGM) to assist in a decision related to vaccination of poultry against Campylobacter.
Agriculture 03 00516 g001
Crucial challenges that might be encountered when developing the quantitative part of the models may be related to the following:
(1) A selected random variable such as “biosecurity” could be influenced by many other factors or variables and for that reason it may be difficult to select one defined probability distribution to represent the group of factors. Furthermore, some of these factors may well be protective instead of risk factors based on particular epidemiological studies. In fact, results related to the same factor can be contradictory in different studies (e.g., pest control has been found to be a risk factor instead of a protective factor [5]). The presence of potential confounders could explain some epidemiological findings making the analysis and the models more complex.
(2) Epidemiological studies are conducted in different areas of the world, diverse conditions, farming systems, sample sizes, sampling protocols, etc. Consequently, it seems challenging to design a general PGM that could be applied in all circumstances to support decision-making for Campylobacter vaccination of poultry. In fact, the quantitative part of the model should be based on one “standardized measure of risk”; however, epidemiological studies use different measurements or parameters to represent the concept of “increased or decreased risk” due to the factor/s considered in every case. Even when the parameter used is the same (e.g., Odds Ratio) the quantitative values can be very different between epidemiological studies. The statistical combination of results from two or more studies can be referred to as meta-analysis and needs to be produced with care [37].
(3) Although many epidemiological studies use the Odds Ratio as a measurement of risk attributable to the factor considered, this mathematical expression cannot be used in the PGMs as such. It is necessary to transform the Odds Ratio value to a fixed probability value or a specific distribution of potential values to be included in the quantitative part of the Bayesian models. The selection and in some cases the combination of different odds ratios or probabilities for their use in PGMs need to be carefully performed. Moreover, the use of sensitivity analysis has been recommended [38].
After careful design of the qualitative and the quantitative part of the models, the outcome of the models will include potential decisions related to Campylobacter control strategies that can be considered and selected for implementation. The solution of an influence diagram is a strategy consisting of a policy for each decision, for example, the use of vaccination strategy A (Figure 1). The strategy is determined using the principle of maximizing expected utility based on selecting a decision that will offer the decision maker the greatest expected reward. In this example, vaccination strategy A is able to reduce the expected numbers of Campylobacter in infected chickens. The results from the model will include posterior probability distributions (under the identified strategy) related to expected Campylobacter numbers in the flock (in logs) before and after the implementation of the decision/s and the expected cost-reward balance associated with each decision/s (Table 1).
Table 1. Hypothetical results from a PGM with one decision related to the use of Vaccination strategy A against Campylobacter in broilers.
No vaccination Posterior probabilities related to expected Campylobacter levels:Vaccination strategy A Posterior probabilities related to expected Campylobacter levels:
0–2 logs (7%)0–2 logs (52%)
2–4 logs (20%)2–4 logs (18%)
4–6 logs (23%)4–6 logs (12%)
6–8 logs (24%)6–8 logs (10%)
8–10 logs (26%)8–10 logs (8%)
Expected cost-reward balance: Expected cost-reward balance:
+0.36 euros/chicken +0.44 euros/chicken
Expected cost-reward balance (gross profit) for an average flock with 20,000 chickens: 7200 eurosExpected cost-reward balance (gross profit) for an average flock with 20,000 chickens: 8800 euros
The model presented in Figure 1 is an influence diagram [39] constructed around the decision on vaccination against Campylobacter but other control strategies could be considered in the models. The flexibility of this methodology allows the user to consider different costs depending on the diverse strategies used to control Campylobacter. Similarly, several reward strategies can be accounted for in the models. In the presented model, the reward is based on the level of Campylobacter (logs) around slaughter time.
In the model presented in Figure 1, the decision node is based on performing vaccination against Campylobacter in broilers at two weeks of age. Campylobacter is not usually detected in birds younger than two weeks [40,41]. It has been suggested that this “two weeks window” could be strategically used to introduce vaccination programs [42]. Therefore, the decision about vaccination in poultry needs to be made usually before Campylobacter is introduced into the flock, and there is uncertainty regarding the introduction of Campylobacter into the flock that needs to be taken into account in the decision-making process. For this reason, historical farm data related to previous Campylobacter status could be accounted for in the models.

2.2. Case Study Model

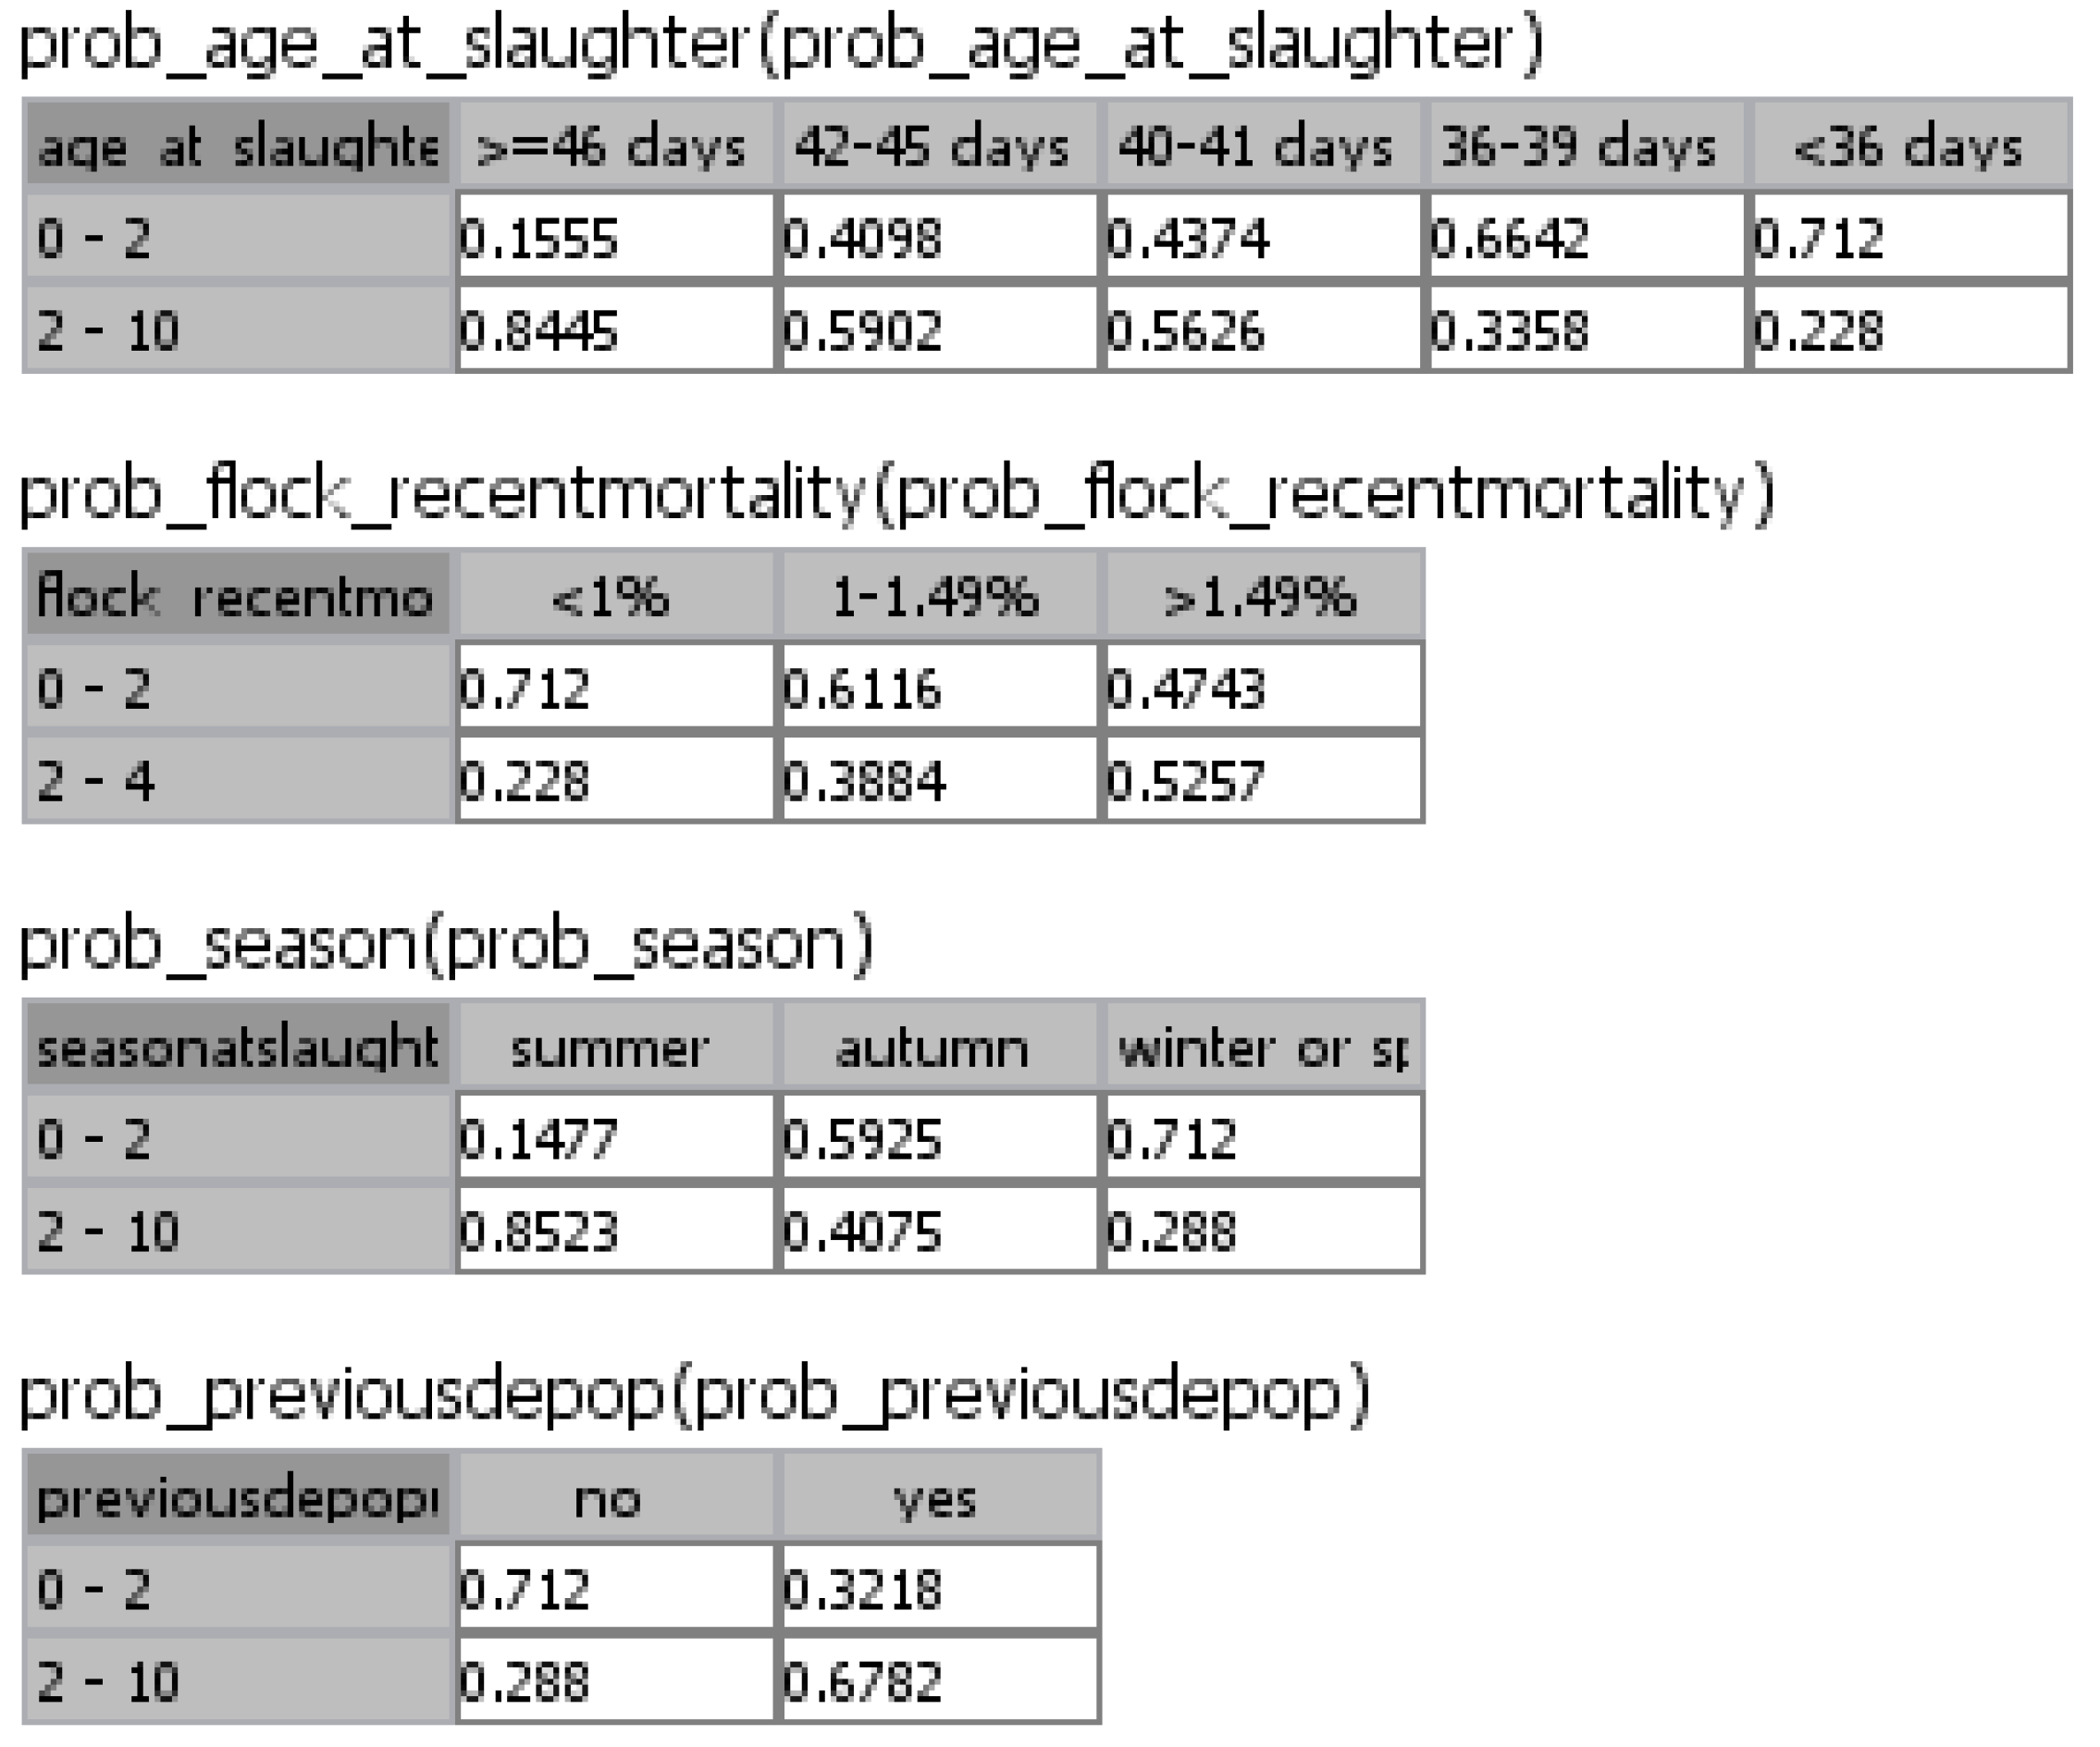
2.2.1. Current Knowledge Related to Poultry Management Factors

Here, we present a decision model we have developed based on the results from an observational study on risk factors that could be associated with Campylobacter in broilers in the UK [35]. These authors conducted epidemiological studies based on 29 risk factors that could be potentially associated with Campylobacter status in broilers. The following risk factors were found significantly associated with Campylobacter positive flocks in the study: previous depopulation practices, higher recent flock mortality, increasing age at slaughter and slaughter in the summer months. We have included these risk factors for the presence of Campylobacter in UK broilers at slaughter in a probabilistic graphical model. The quantitative part (probabilities of events or states of the variables) of the PGM (Table 2) was obtained by a mathematical transformation of odds ratio values presented in the study from the UK [35]. Additionally, probabilities related to Campylobacter introduction in the flock due to the presence of risk factors are conditional to a “baseline level” of Campylobacter (lowest level of Campylobacter in broilers close to slaughter time found in the literature). In these models, the “baseline Campylobacter flock prevalence” in the UK considered was 28.8% based on data from a study conducted by the Food Standards Agency [43].
The formula applied to calculate probabilities of the diverse states of risk factors (P(s)) based on the baseline Campylobacter flock prevalence (bp) and odds ratios (ORs) was:
Agriculture 03 00516 i001
Table 2. Significant risk factors, frequency of occurrence [35] and associated probability of Campylobacter introduction in UK broiler flocks.
Risk factor and frequency of occurrenceOdds Ratio (95% CI)Probability of a Campylobacter positive flock * due to the presence of specific risk factors
Season
Summer (26.32%)14.27 (7.83–26.02)0.85
Autumn (25.38%)1.70 (1.21–2.37)0.41
Spring or winter a (48.3%)1
Age of broilers
≥46 days (19.59%)13.43 (7.40–24.35)0.85
42–45 days (15.67%)3.56 (2.39–5.29)0.59
40–41 days (18.57%)3.18 (1.42–7.12)0.57
36–39 days (21.98%)1.25 (0.86–1.81)0.34
<36 days a (24.19%)1
Flock recent mortality
>1.49% (32.22%)2.74 (1.18–6.40)0.53
1.00%–1.49% (29.35%)1.57 (1.12–2.21)0.39
<1.00% a (38.43%)1
Previous partial depopulation
Yes (64.94%)5.21 (2.89–9.38)0.68
No a (35.06%)1
a Reference category (mathematical models); * Based on a baseline level of Campylobacter of 28.8% [44].

2.2.2. Cost-Reward Function

Accurate cost-benefit analyses of potential control measures against a particular disease play a crucial role in the implementation of successful disease control programs. A cost-reward function was included in this model in order to assess the financial consequences of every decision that the farmer might consider to control Campylobacter in chickens. Financial data related to the UK poultry industry was obtained from a farm business survey from 2009/2010 [44]. There is no commercial Campylobacter vaccine at present and thus a commercial Campylobacter vaccine price is not available. The cost of a hypothetical vaccine against Campylobacter in broilers could be considered to be between 2 and 6 Euro cents based on prices of other vaccines used in poultry production [45]. The vaccine effectiveness or vaccine impact was also hypothetical in these models. We decided to consider a hypothetical vaccine B against Campylobacter in broilers able to decrease Campylobacter numbers from two to six logs in 20% of the broilers and less than two logs in 80% of the chickens with a cost of 0.025 £/chicken (UK). The reward system has been designed based on the reported average gross profit of 0.36 £/per chicken for UK farmers in 2010 [44]. Based on this hypothetical reward system (Table 3), farmers producing chickens with numbers of Campylobacter lower than four logs will get higher gross profits (+20% extra with respect to other Campylobacter levels) while farmers delivering chickens carrying high numbers of Campylobacter (more than six logs) will get lower gross profits (−20% between Campylobacter levels). It was assumed that an average broiler chicken from a positive flock in the UK will carry Campylobacter in a concentration of 4–6 log CFU/g or mL of sample (from the digestive tract).
Table 3. Reward system 1 considered in the model.
Campylobacter numbers (logs)0–22–44–66–88–10
Gross profit (£/chicken)0.520.430.360.290.23

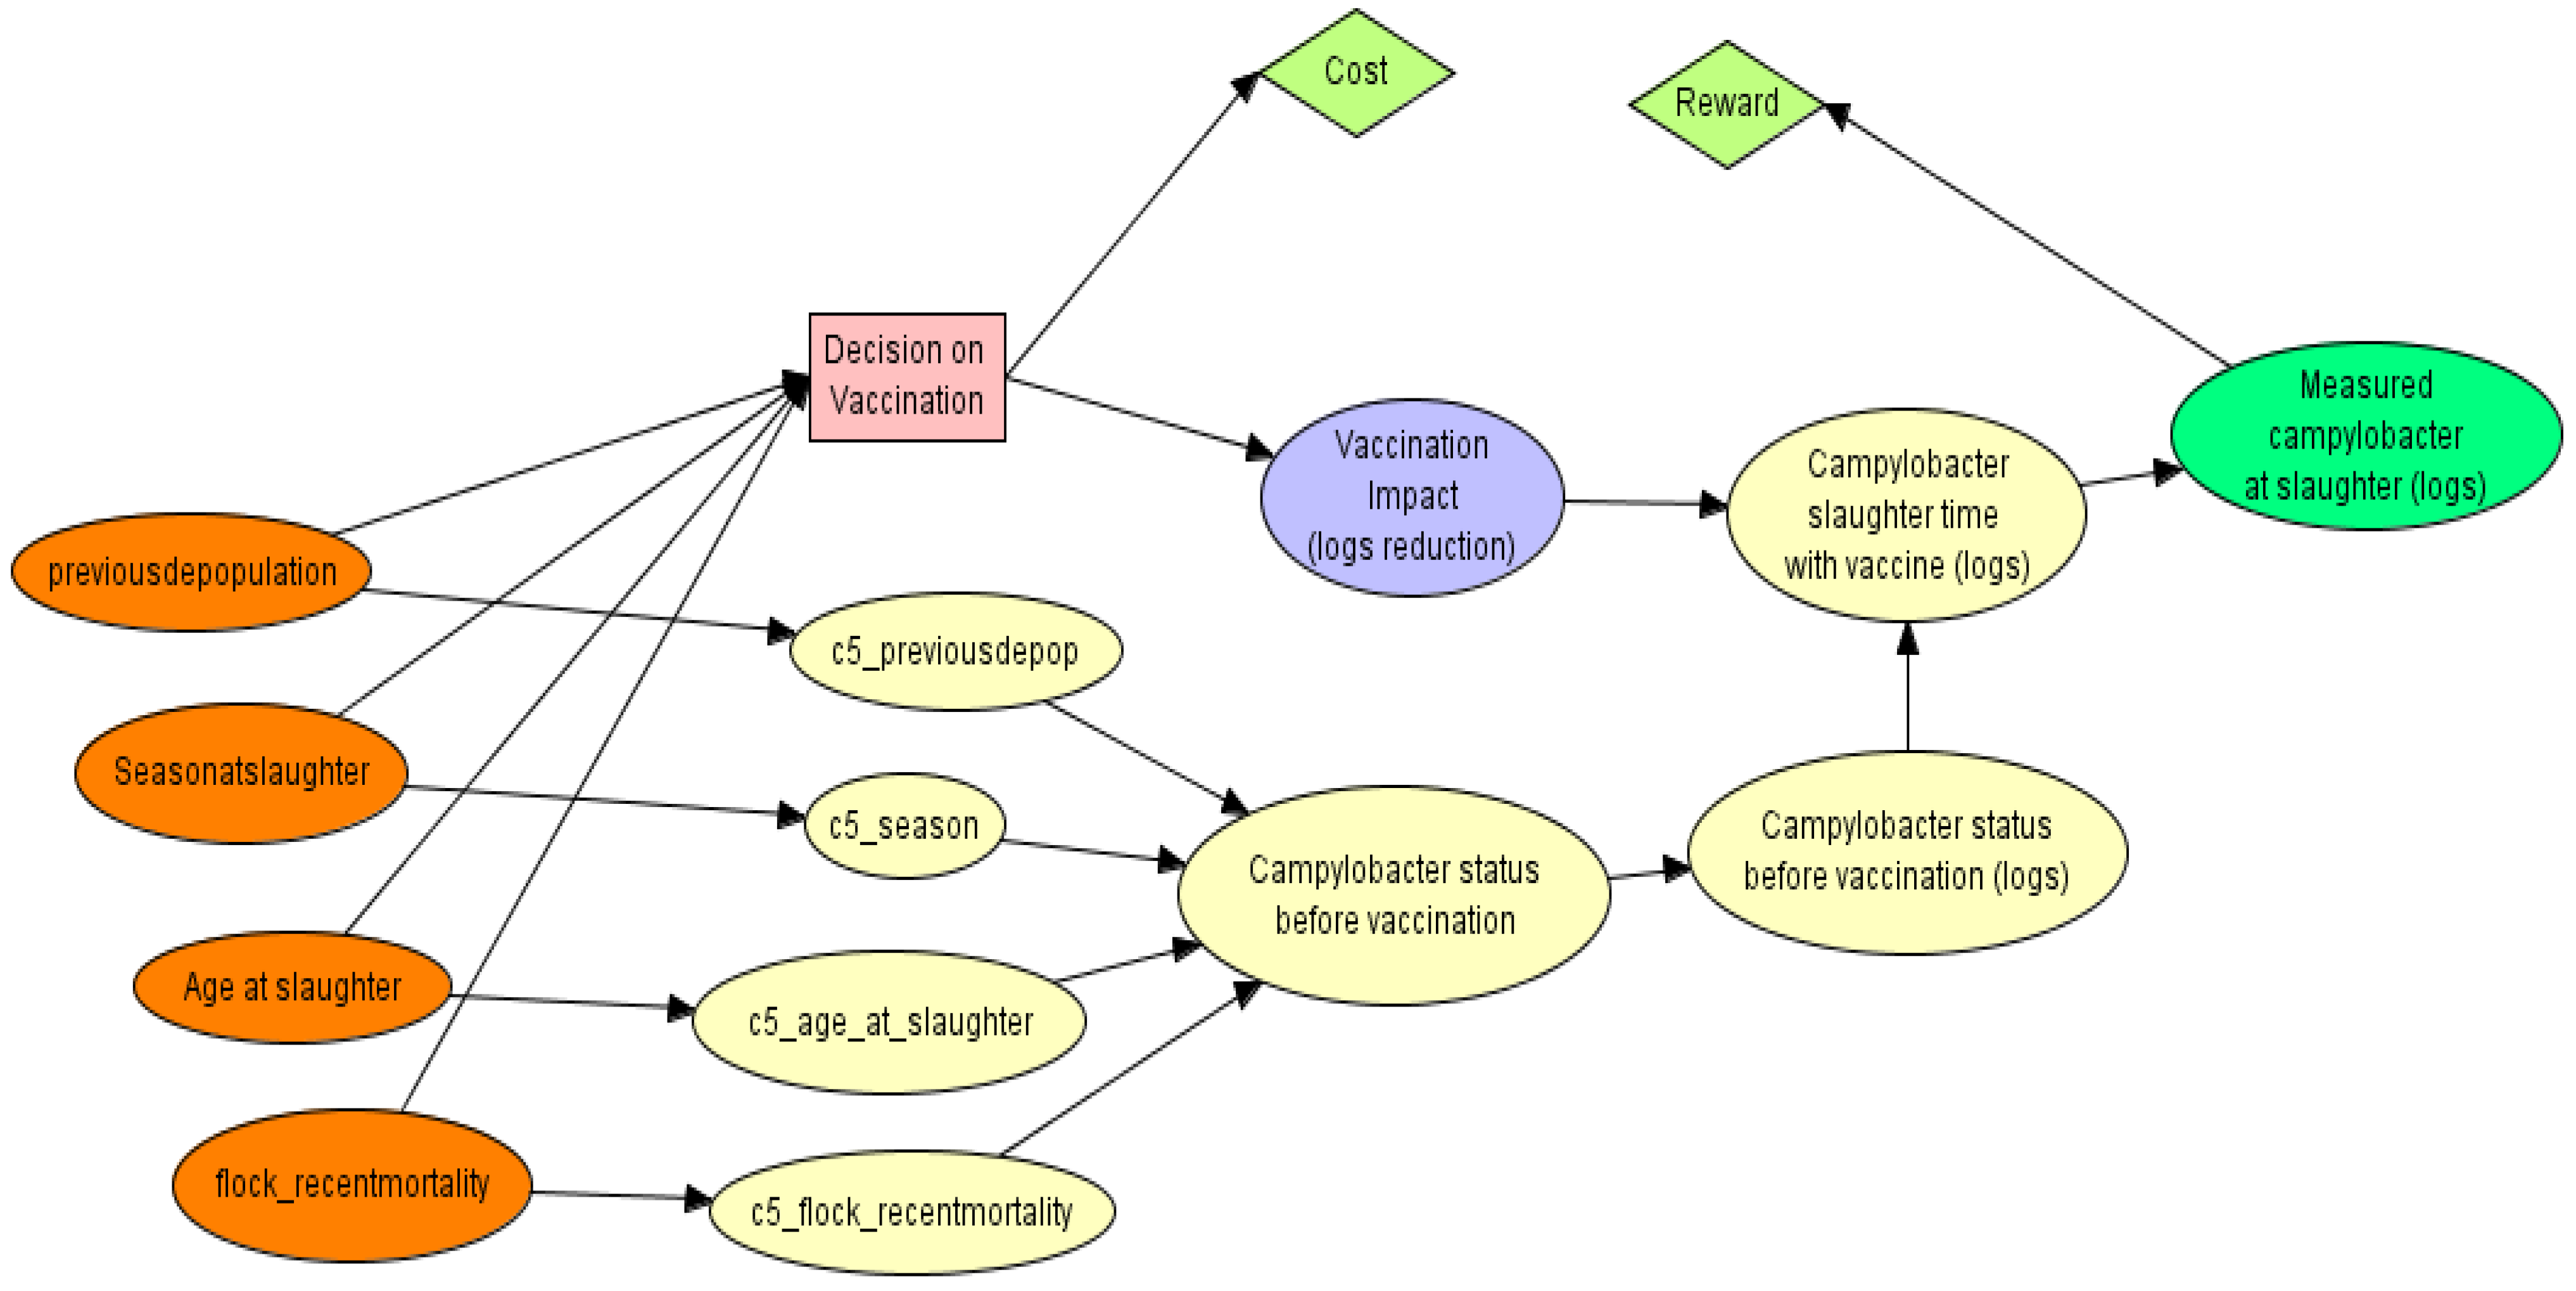
2.2.3. Designing the PGM

The model we present in this case study (Figure 2) was designed based on the following assumptions:
(1) The contributions from different risk factors to the level of Campylobacter are independent.
(2) It is considered that the detection level of Campylobacter is 2 logs CFU/g or mL of sample and the maximum colonization level is 10 logs CFU/g or mL of sample. This means that a Campylobacter level of 0–2 logs will give a negative result while a positive result includes Campylobacter numbers from 2 to 10 logs. In this model, we use intervals for bacterial concentration with two log widths (e.g., 0–2 logs, 2–4 logs, 4–6 logs, 6–8 logs and 8–10 logs).
(3) Vaccination impact is based on log-reduction of the numbers of Campylobacter in chickens and therefore the numbers of Campylobacter in broilers going for slaughter will be lower after vaccination.
(4) The “measured Campylobacter numbers at slaughter” will depend on the “true numbers” and the microbiological quantitative methods used. In these models, we assume a nearly-perfect quantitative method so the obtained Campylobacter numbers in the lab are closer to the numbers in reality.
Epidemiological studies provide insight regarding the risk of Campylobacter introduction attributable to particular risk factors in specified conditions. However, there seems to be lack of data regarding the numbers of Campylobacter carried by broilers throughout the farming period in relation to particular risk factors. In the models presented here, the vaccination impact and the cost-reward functions are based on a log-scale because the objective is to develop a control strategy (e.g. vaccination strategy) able to reduce the numbers of Campylobacter in commercial broilers. In order to obtain reliable results from the model, data must be on the same scale. Data related to the effect of risk factors on the Campylobacter status of the flock are based on positive (2–10 logs)/negative (0–2 logs) results and they need to be translated to the expected distribution of probabilities related to Campylobacter levels in the flock (Figure 3). The nodes “Campylobacter status before vaccination” and “Campylobacter status before vaccination (logs)” in this model specify the transformation from positive/negative to the diverse Campylobacter levels (in logs) scale (Figure 3). A flat distribution is used in this case to transform a general Campylobacter probability (e.g., 92.36%) into a distribution of equal probabilities for different levels of Campylobacter as illustrated in Figure 3.
Figure 2. The model Commercial Broilers Vaccination (ComBVacUK) based on epidemiological and financial data from the UK.
Agriculture 03 00516 g002
Figure 3. Illustration of the part of the model showing the Campylobacter status before vaccination in positive/negative format (0–2 logs is considered negative and 2–10 logs translates on a positive result) and in logs format (distribution of the different levels of Campylobacter in logs).
Agriculture 03 00516 g003
The quantitative part of the models encodes the mathematical expressions and probability distributions associated with the different states of the chance variables and utility functions associated with the utility nodes as defined by the structure of the influence diagram. For example, the following mathematical expression: “max (prob_season, prob_previousdepop, prob_flock_recentmortality, prob_age_at_slaughter)” is introduced in the variable “Campylobacter status before vaccination” to calculate the posterior conditional probabilities based on probability distributions from the parent variables (Figure 4). There are probability tables for each variable which include probabilities for every state of the variables. These tables will contain the prior probability distributions for variables without parents in the model and the conditional probability distributions for variables with parents. Figure 4 illustrates probability tables for the variables: prob_season, prob_previousdepop, prob_flock_recentmortality and prob_age_at_slaughter in the Commercial Broilers Vaccination (ComBVacUK) model.
Figure 4. Probability tables for the variables: prob_season, prob_previousdepop, prob_flock_recentmortality and prob_age_at_slaughter.
Agriculture 03 00516 g004
The prior probability distributions should integrate knowledge obtained from sources such as empirical observations, epidemiological data and experts in order to obtain reliable outcomes from the decision support models. Bayesian inference and probability theory set the basis for the quantitative outputs of the models. Decision support models can be updated with new evidence, knowledge or information.

2.2.4. Sensitivity Analyses

The aim of performing sensitivity analyses is to determine the sensitivity of the vaccination decision under different evidence scenarios with respect to single parameters of the models. In this particular case, two very different reward systems and a hypothetical vaccine C were included in the models. Reward system 2 was based on an extra payment for chickens testing Campylobacter negative of 2.5 times the normal price while reward system 3 was based on the existing reward systems in Denmark which is based on an extra payment of about 2% for flocks testing negative for Campylobacter and in Norway and Sweden where the payment is reduced by about 4% for flocks that are tested positive for Campylobacter (personal communication). A cost-efficient hypothetical vaccine C able to reduce 2–6 logs the level of Campylobacter in 90% of the chickens was considered with a cost of 0.03 £/chicken.

3. Results

3.1. Results from the Model Commercial Broilers Vaccination UK Model (ComBVacUK)

The results from the model can be visualized by selecting diverse combinations of “nodes states” and obtaining the output in terms of the expected distribution of probabilities related to Campylobacter levels and expected cost-reward balance in every case. A high number of potential combinations or scenarios can be considered and therefore it is up to the user to select the relevant combination of present factors. In Table 4, we have described three combinations in order to illustrate the potential outputs of the model.
Table 4. Scenarios considered in the model; risk factors and their frequency of occurrence in every scenario.
Best-case scenario Worst-case scenario“Most likely” scenario (based on study data [35])
Spring or winter (100%)Summer (100%)Season
Summer (26.32%)
Autumn (25.38%)
Spring or winter a (48.3%)
Age of broilersAge of broilersAge of broilers
≤36 days (100%)≥46 days (100%)≥46 days (19.59%)
42–45 days (15.67%)
40–41 days (18.57%)
36–39 days (21.98%)
<36 days a (24.19%)
Flock recent mortalityFlock recent mortalityFlock recent mortality
<1.00% (100%)>1.49% (100%)>1.49% (32.22%)
1.00%–1.49% (29.35%)
<1.00% a (38.43%)
Previous partial depopulationPrevious partial depopulationPrevious partial depopulation
No (100%)Yes (100%)Yes (64.94%)
No a (35.06%)
a Reference category (mathematical models).
Results from the models (based on prior probabilities shown in Table 4) are included in Table 5 where expected posterior probabilities and expected cost-reward financial balances are presented.
Results from the model indicate that the financial results are relatively insensitive to choices in this case. There are no or only small financial gains when using vaccine B and reward system 1 under the specific assumptions considered in the model. Actually, in the best-case scenario the farmer will not gain financially when using vaccine B although the posterior probabilities related to expected high numbers of Campylobacter in the flock will be reduced. On the contrary, in the worst-case scenario the best option will be to use vaccine B because it produces the maximum cost-reward balance (0.34 £/chicken) and a reduction on the probabilities related to expected high numbers of Campylobacter in the flock. Similarly, results obtained when considering the “most-likely” scenario based on study data [35] indicate that the best option will be to use vaccine B.
Table 5. Results based on the model Commercial Broilers Vaccination (ComBVacUK) using reward system1 (Table 3) and a hypothetical Campylobacter vaccine B.
Scenarios
Best-case scenarioWorst-case scenario“Most likely” scenario (based on study data from the UK [35])
Posterior probabilities related to expected Campylobacter levels when implementing no additional protective measure0–2 logs (25.70%)0–2 logs (0.35%)0–2 logs (7.27%)
2–4 logs (18.58%)2–4 logs (24.91%)2–4 logs (23.18%)
4–6 logs (18.58%)4–6 logs (24.91%)4–6 logs (23.18%)
6–8 logs (18.58%)6–8 logs (24.91%)6–8 logs (23.18%)
8–10 logs (18.58%)8–10 logs (24.91%)8–10 logs (23.18%)
Cost-reward balance: 0.38 £/chickenCost-reward balance: 0.33 £/chickenCost-reward balance: 0.34 £/chicken
Flock with 50,000 chickens = 19,000 £Flock with 50,000 chickens = 16,500 £Flock with 50,000 chickens = 17,000 £
Posterior probabilities related to expected Campylobacter levels after the implementation of a decision (Vaccine B)Vaccine BVaccine BVaccine B
0–2 logs (35%)0–2 logs (12.82%)0–2 logs (18.87%)
2–4 logs (18.59%)2–4 logs (24.94%)2–4 logs (23.21%)
4–6 logs (17.67%)4–6 logs (23.70%)4–6 logs (22.05%)
6–8 logs (15.81%)6–8 logs (21.21%)6–8 logs (19.74%)
8–10 logs (12.93%)8–10 logs (17.34%)8–10 logs (16.14%)
Expected cost-reward balance: 0.38 £/chickenExpected cost-reward balance: 0.34 £/chickenExpected cost-reward balance: 0.35 £/chicken
Flock with 50,000 chickens = 19,000 £Flock with 50,000 chickens = 17,000 £Flock with 50,000 chickens = 17,500 £

3.2. Results from the Sensitivity Analyses

Sensitivity analyses performed indicated that the factors that influenced the results to a greater extent were the financial variables (cost/reward functions) and the effectiveness of the control strategy, e.g. vaccination impact. On the other hand, the results showed that the financial differences between diverse strategies were very small mainly due to the narrow differences between the levels of the reward system. The results indicated that when applying the reward system 2 (a system with higher differences between gross benefits obtained by farmers delivering chickens Campylobacter negative or with low Campylobacter numbers), the best solution in terms of maximum expected benefit would be using the vaccine C in all case-scenarios. Significant reductions in expected Campylobacter levels and substantial associated expected financial gains were obtained from this model when considering the reward system 2 and the use of vaccine C; for example, in the most-likely scenario, the expected benefit increased from 0.34 £/chicken to 0.69 £/chicken (translated to a flock with 50,000 chickens, from 17,000 £ to 34,500 £). However, when implementing reward system 3 (closer to real reward systems currently employed in several countries) the best solution in financial terms will be “not vaccinating” even though the use of vaccine C could potentially reduce the expected posterior probabilities related to high numbers of Campylobacter in the flock significantly. In fact, the use of a hypothetical vaccine C in the most-likely scenario could reduce the probability of Campylobacter introduction into the flock from around 93% to approximately 46%.

4. Discussion

Poultry producers need to make important, complex decisions and related investments for the sustainability of their businesses. Increased consumer concerns related to food safety put pressure on food producers to implement food safety assurance systems. In particular, poultry producers should implement effective controls against Campylobacter in poultry to increase food safety and to reduce the burden of human Campylobacteriosis.
Different PGMs can be developed to assist in decision-making regarding Campylobacter vaccination of poultry and/or other Campylobacter control strategies. The graphical nature and decomposition into variables and relationships of PGMs make it possible to create a common generic model to assess diverse strategies for the control of Campylobacter in poultry. Nevertheless, it seems challenging to design a general model (qualitative and quantitative) that could be applied to all situations, poultry farming conditions and geographical areas. Furthermore, the conditions, selection of factors or variables, different parts of the models, and quantitative data need to be clearly specified to add value and perspective to the decision support system designed in every case. Tailor-made properly developed PGMs will help poultry managers make important decisions in order to solve complex problems such as the control of Campylobacter. PGMs can be extended and/or modified to adapt to different real circumstances. For example, the time of slaughter might vary depending on the final product. In addition, the assumption about independence between factors gives flexibility to include supplementary factors or new knowledge in the model.
Microbiological methods for the detection and quantification of Campylobacter can be used to assess the Campylobacter status of birds. However, it seems important to distinguish between the true numbers of Campylobacter in birds and the detected or measured numbers. There are several microbiological techniques available for the detection and enumeration of Campylobacter spp. from different sample matrices. However, some techniques are still under development and the detection limit of most methodologies seems to be 100 CFU/g or mL (depending on sample type and sample preparation). Therefore, a negative result might actually indicate very low numbers of Campylobacter (1–100 CFU/g or mL). Moreover, microbiological sampling and processing methods will not be perfect and in reality, the sampling procedures and microbiological techniques will affect the estimates of the true numbers of Campylobacter in chickens and in poultry flocks. In this model, we assumed a nearly-perfect quantitative method but other tests and/or other uncertainties related to microbiological sampling could be considered in the models. Similarly, diverse sources of contamination of broiler flocks could be included. Sources of Campylobacter contamination might be implicit in some risk factors (e.g., biosecurity). In this model, the presence of flies (a potential source of Campylobacter contamination) could be a confounder with the risk factor “season: summer”. Nevertheless, other potential Campylobacter sources could be considered, increasing the complexity of the models.
In the UK, human Campylobacteriosis represents an important public health problem [32,33]. Estimates of Campylobacter prevalence in UK poultry flocks can be found in the literature, e.g., 75% in the EU baseline survey carried out in 2008 [46] and 79.2% in the considered study from the UK [35] which are average prevalence values obtained from sampling a number of poultry flocks for human consumption. The introduction of Campylobacter in the food processing environment poses a risk for the contamination of food products; in fact, in the EU baseline survey carried out in 2008, 86% of the UK poultry carcasses tested were found positive for Campylobacter. It seems crucial to reduce the number of Campylobacter positive flocks and the numbers of Campylobacter in chickens and their products. The control of Campylobacter in poultry could translate to a decrease in the incidence of human Campylobacteriosis cases in the UK.
The results from the model presented here indicated that the posterior probability of introduction of Campylobacter into the UK poultry flock in the most likely scenario before vaccination was 92.36% based on the assumptions and data specified in this manuscript. The posterior probability of Campylobacter introduction into the flock decreased significantly by the use of a hypothetical vaccine B (to approximately 81%) and even more when using a much more effective hypothetical vaccine C (to approximately 46%). The results indicated that the public health impact of the control strategies will depend on the effectiveness of the controls. However, the assessment of the effectiveness of diverse control strategies might prove challenging in some cases, e.g., the assessment of vaccine effectiveness [29]. In any case, decreasing the probability of Campylobacter introduction into poultry flocks is highly desirable. The EU baseline survey carried out in 2008 identified a trend in countries with higher prevalence of Campylobacter positive poultry flocks to produce poultry carcasses with high numbers of Campylobacter due to Campylobacter in the intestines of infected chickens contaminating the food processing environment and the poultry products [46]. In fact, high numbers of Campylobacter in the cecum of chickens for slaughter can correlate with high numbers of Campylobacter on chicken carcasses [47]. Campylobacter control strategies that can significantly reduce the probability of Campylobacter introduction into a flock and/or the numbers of Campylobacter in already infected chickens should be implemented from a public health perspective. On the other hand, poultry producers will usually make strategic decisions based on financial gains and therefore a reward system that can translate to an attractive cost-reward balance will be a good incentive for poultry producers to implement Campylobacter control strategies. In actual fact, the financial results obtained from the model when using the reward system 1 and a hypothetical Campylobacter vaccine B indicated that the expected financial gains might be too small to justify the use of vaccine B in this case. Nevertheless, this type of information might prove very valuable and it is likely that producers will find this decision-making tool more beneficial at times when the consequences from implementing alternative decisions for the control of Campylobacter are not very clear. In contrast, when considering the reward system 2 and the use of vaccine C, significant reductions in expected Campylobacter levels and substantial expected financial gains were obtained. Sensitivity analyses can be used to test diverse hypothetical vaccines and reward systems in order to compare them and their combinations.
The aim of the sensitivity analyses was to determine the sensitivity of the vaccination decision under different evidence scenarios with respect to single parameters of the models but we did not perform sensitivity analyses on the probabilistic quantification of the model. The cost-reward functions are crucial drivers for the selection of the optimal decision which is determined based on the principle of maximum benefit (cost-reward balance). It is important to bear in mind that in the model the cost function relates only to the cost of the control measure and does not include any other additional costs such as those related to microbiological testing.
Financial data considered in the models should be as accurate as possible (e.g., cost of a specific Campylobacter control). The reward system might not be in place in most parts of the world, therefore it should be hypothesized and tailor-made based on the gross profit/per chicken for farmers in specific areas and/or production systems (e.g., organic farmers might obtain a higher gross profit/chicken than farmers producing commercial broilers). The reward system currently used in Denmark is based on an extra payment of about 2% for flocks testing negative for Campylobacter while in Norway and Sweden the payment is reduced by about 4% for flocks that test positive for Campylobacter (personal communication). The results from the model presented here indicate that it might be useful for the reward system to be based on an increased extra payment for flocks testing negative for Campylobacter in order to justify financially the use of a commercial vaccine against Campylobacter. However, financial gain will depend on the effectiveness of the vaccine (and/or other control strategies) and the costs associated with the controls. A cost-efficient vaccine against Campylobacter in chickens is not commercially available at present. We considered that the market price of a cost-effective vaccine against Campylobacter in chickens should be less than 10% of the gross profit per chicken to be competitive. Nonetheless, the market price could be higher depending on the effectiveness of the vaccine and the reward system.
There are many potential strategies for the control of Campylobacter in poultry that could be included in the models but the complexity of the models will increase significantly. Campylobacter vaccination strategies have been considered in the models presented in this paper but the authors are working on different models where three Campylobacter control strategies (and their combinations) are included. Consequently, the selection of Campylobacter control strategies in poultry will become more and more complex due to the increased number of possibilities, and poultry producers may benefit from the use of decision support models. The flexibility of PGMs allows for the inclusion of more than one hypothetical Campylobacter vaccine and other control measures and more than one reward system. The users might then obtain a range of potential solutions for the control of Campylobacter in poultry. The most profitable solutions will be more attractive for poultry farmers, although they might not be feasible in the real world. On the other hand, some producers may be inclined to implement food safety controls (even when there is little financial reward involved) if the controls improve the image of their brands and/or the producers feel pressure from consumers and/or governments.
From a public health perspective, results from the model in terms of expected reductions in the numbers of Campylobacter in chickens after the implementation of controls could be translated into the expected decrease in human Campylobacteriosis cases and expected reductions in associated health care costs using mathematical models. However, at present, a risk assessment model to estimate the number of human cases based on the occurrence of Campylobacter in chickens sent for slaughter does not seem to be available. Information related to public health benefits that could be obtained from the implementation of cost-effective Campylobacter controls in poultry will prove very useful, for example, when considering future reward systems.
PGMs represent knowledge and probabilistic conditional relationships in structured models designed to represent real situations where uncertainty plays an important role. The integration of information, knowledge and technology is crucial to discover new/better solutions to complex problems [48,49] and may aid poultry farmers to make optimal decisions on the implementation of controls against Campylobacter. In addition, engagement of different stakeholders in the PGMs’ development process is highly desirable. The use of sophisticated and complex computing interfaces, mathematical expressions and probability distributions needs to be reconciled with a simple and efficient tool that can be used by different stakeholders [50,51]. Considerations regarding the epidemiological and microbiological factors to be included in the models together with important challenges for the development of the quantitative part of the models have been presented in this manuscript.

5. Conclusions

Poultry producers should implement cost-effective Campylobacter control strategies in order to protect public health and to reduce the burden of human Campylobacteriosis. Decision support tools such as probabilistic graphical models (PGMs) will aid poultry producers to select cost-effective Campylobacter control strategies. The cost-reward functions and the effectiveness of the control strategies integrated in the models are crucial drivers for the selection of optimal decision/s. The public health impact of the control strategies depends on the effectiveness of the controls. The model’s optimal decision in every case is determined based on the principle of maximum benefit (cost-reward balance). Poultry producers will be able to choose from a range of potential solutions for the control of Campylobacter in poultry. Some decisions might be ideal from a public health perspective but may be costly for producers. The flexibility of PGMs allows for the consideration of diverse real-life circumstances, the integration of new knowledge, the inclusion of more than one Campylobacter control measures and more than one reward system. Nonetheless, the selection of epidemiological evidence, qualitative and quantitative data needs to be clearly specified to add value and perspective to the decision support system designed in every case.

Acknowledgments

This work was supported by The Danish Council for Strategic Research project CamVac (contract 09-067131).

Conflicts of Interest

The author declares that there are no conflicts of interest.

References

  1. Pebody, R.G.; Ryan, M.J.; Wall, P.G. Outbreaks of Campylobacter infection: Rare events for a common pathogen. Commun. Dis. Rep. CDR Rev. 1997, 7, 33–37. [Google Scholar]
  2. Neimann, J.; Engberg, J.; Molbak, K.; Wegener, H.C. A case-control study of risk factors for sporadic Campylobacter infections in Denmark. Epidemiol. Infect. 2003, 130, 353–366. [Google Scholar]
  3. Bouwknegt, M.; van de Giessen, A.W.; Dam-Deisz, W.D.; Havelaar, A.H.; Nagelkerke, N.J.; Henken, A.M. Risk factors for the presence of Campylobacter spp. in Dutch broiler flocks. Prev. Vet. Med. 2004, 62, 35–49. [Google Scholar] [CrossRef]
  4. Wingstrand, A.; Neimann, J.; Engberg, J.; Nielsen, E.M.; Gerner-Smidt, P.; Wegener, H.C.; Mølbak, K. Fresh chicken as main risk factor for Campylobacteriosis, Denmark. Emerg. Infect. Dis. 2006, 12, 280–285. [Google Scholar] [CrossRef]
  5. Arsenault, J.; Letellier, A.; Quessy, S.; Normand, V.; Boulianne, M. Prevalence and risk factors for Salmonella spp. and Campylobacter spp. caecal colonization in broiler chicken and turkey flocks slaughtered in Quebec, Canada. Prev. Vet. Med. 2007, 81, 250–264. [Google Scholar] [CrossRef]
  6. Wilson, D.J.; Gabriel, E.; Leatherbarrow, A.J.; Cheesbrough, J.; Gee, S.; Bolton, E.; Fox, A.; Fearnhead, P.; Hart, C.A.; Diggle, P.J. Tracing the source of Campylobacteriosis. PLoS. Genet. 2008, 4, e1000203. [Google Scholar] [CrossRef]
  7. Sheppard, S.K.; Dallas, J.F.; Strachan, N.J.; MacRae, M.; McCarthy, N.D.; Wilson, D.J.; Gormley, F.J.; Falush, D.; Ogden, I.D.; Maiden, M.C.; et al. Campylobacter genotyping to determine the source of human infection. Clin. Infect. Dis. 2009, 48, 1072–1078. [Google Scholar] [CrossRef]
  8. Sears, A.; Baker, M.G.; Wilson, N.; Marshall, J.; Muellner, P.; Campbell, D.M.; Lake, R.J.; French, N.P. Marked Campylobacteriosis decline after interventions aimed at poultry, New Zealand. Emerg. Infect. Dis. 2011, 17, 1007–1015. [Google Scholar] [CrossRef]
  9. Ansari-Lari, M.; Hosseinzadeh, S.; Shekarforoush, S.S.; Abdollahi, M.; Berizi, E. Prevalence and risk factors associated with Campylobacter infections in broiler flocks in Shiraz, southern Iran. Int. J. Food. Microbiol. 2011, 144, 475–479. [Google Scholar] [CrossRef]
  10. Reich, F.; Atanassova, V.; Haunhorst, E.; Klein, G. The effects of Campylobacter numbers in caeca on the contamination of broiler carcasses with Campylobacter. Int. J. Food. Microbiol. 2008, 127, 116–120. [Google Scholar] [CrossRef]
  11. Van Deun, K.; Pasmans, F.; Ducatelle, R.; Flahou, B.; Vissenberg, K.; Martel, A.; van den Broeck, W.; van Immerseel, F.; Haesebrouck, F. Colonization strategy of Campylobacter jejuni results in persistent infection of the chicken gut. Vet. Microbiol. 2008, 130, 285–297. [Google Scholar] [CrossRef]
  12. Jacobs-Reitsma, W. Aspects of epidemiology of Campylobacter in poultry. Vet. Q. 1997, 19, 113–117. [Google Scholar] [CrossRef]
  13. Rosenquist, H.; Sommer, H.; Nielsen, N.; Christensen, B. The effect of slaughter operations on the contamination of chicken carcasses with thermotolerant Campylobacter. Int. J. Food. Microbiol. 2006, 108, 226–232. [Google Scholar] [CrossRef]
  14. Stas, T.; Jordan, F.T.W.; Woldehiwet, Z. Experimental infection of chickens with Campylobacter jejuni: Strains differ in their capacity to colonize the intestine. Avian Pathol. 1999, 28, 61–64. [Google Scholar] [CrossRef]
  15. Sahin, O.; Morishita, T.; Zhang, Q. Campylobacter colonization in poultry: Sources of infection and modes of transmission. Animal Health Res. Rev. 2002, 3, 95–105. [Google Scholar] [CrossRef]
  16. Lütticken, D.; Segers, R.; Visser, N. Veterinary vaccines for public health and prevention of viral and bacterial zoonotic diseases. Rev. Sci. Tech. 2007, 26, 165–177. [Google Scholar]
  17. Black, R.E.; Levine, M.M.; Clements, M.L.; Hughes, T.P.; Blaser, M.J. Experimental Campylobacter jejuni infection in humans. J. Infect Dis. 1988, 157, 472–479. [Google Scholar] [CrossRef]
  18. Janssen, R.; Krogfelt, K.A.; Cawthraw, S.A.; van Pelt, W.; Wagenaar, J.A.; Owen, R.J. Host-pathogen interactions in Campylobacter infections: The host perspective. Clin. Microbiol. Rev. 2008, 21, 505–518. [Google Scholar] [CrossRef]
  19. The CamVac Project. Campylobacter Vaccination of Poultry. 2012. Available online: http://www.camvac.dk/ (accessed on 21 September 2012).
  20. Rosenquist, H.; Nielsen, N.L.; Sommer, H.M.; Nørrung, B.; Christensen, B. Quantitative risk assessment of human Campylobacteriosis associated with thermophilic Campylobacter species in chickens. Int. J. Food. Microbiol. 2003, 83, 87–103. [Google Scholar] [CrossRef]
  21. Van de Giessen, A.W.; Tilburg, J.J.H.C.; Ritmeester, W.S.; van der Plas, J. Reduction of Campylobacter infections in broiler flocks by application of hygiene measures. Epidemiol. Infect. 1998, 121, 57–66. [Google Scholar] [CrossRef]
  22. Evans, S.J.; Sayers, A.R. A longitudinal study of Campylobacter infection of broiler flocks in Great Britain. Prev. Vet. Med. 2000, 46, 209–223. [Google Scholar] [CrossRef]
  23. Newell, D.G.; Fearnley, C. Sources of Campylobacter colonization in broiler chickens. Appl. Environ. Microbiol. 2003, 69, 4343–4351. [Google Scholar] [CrossRef]
  24. Messens, W.; Hartnett, E.; Gellynck, X.; Viaene, J.; Halet, D.; Herman, L.; Grijspeerdt, K. Quantitative Risk Assessment of Human Campylobacteriosis through the Consumption of Chicken Meat in Belgium. In Proceedings of the XVIII European Symposium on the Quality of Poultry Meat and the XII European Symposium on the Quality of Eggs and Egg products, Ghent University Academy, Prague, Czech Republic, 2–5 September 2007; pp. 167–168.
  25. Lin, J. Novel approaches for Campylobacter control in poultry. Foodborne Pathog. Dis. 2009, 12, 755–765. [Google Scholar] [CrossRef]
  26. Hilmarsson, H.; Thormar, H.; Thrainsson, J.H.; Gunnarsson, E.; Dadadottir, S. Effect of 20 glycerol monocaprate (monocaprin) on broiler chickens: An attempt at reducing intestinal Campylobacter infection. Poult. Sci. 2006, 85, 588–592. [Google Scholar]
  27. Hermans, D.; Martel, A.; van Deun, K.; Verlinden, M.; van Immerseel, F.; Garmyn, A.; Messens, W.; Heyndrickx, M.; Haesebrouck, F.; Pasmans, F. Intestinal mucus protects Campylobacter jejuni in the ceca of colonized broiler chickens against the bactericidal effects of medium-chain fatty acids. Poult. Sci. 2010, 89, 1144–1155. [Google Scholar] [CrossRef]
  28. El-Shibiny, A.; Scott, A.; Timms, A.; Metawea, Y.; Connerton, P.; Connerton, I. Application of a group II Campylobacter bacteriophage to reduce strains of Campylobacter jejuni and Campylobacter coli colonizing broiler chickens. J. Food Prot. 2009, 72, 733–740. [Google Scholar]
  29. Garcia, A.B.; Bahrndorff, S.; Hald, B.; Hoorfar, J.; Madsen, M.; Vigre, H. Design and data analysis of experimental trials to test vaccine candidates against zoonotic pathogens in animals: The case of a clinical trial against Campylobacter in broilers. Expert Rev. Vaccines 2012, 11, 1179–1188. [Google Scholar] [CrossRef]
  30. Sandberg, M. Personal Communication. Danish Agriculture and Food Council, 2013. [Google Scholar]
  31. Greenland, S. Bayesian perspectives for epidemiological research: I. Foundations and basic methods. Int. J. Epidemiol. 2006, 35, 765–775. [Google Scholar] [CrossRef]
  32. Roberts, J.A.; Cumberland, P.; Sockett, P.N.; Wheeler, J.G.; Rodrigues, L.C.; Sethi, D.; Roderick, J. The study of infectious intestinal disease in England: Socio-economic impact. Epidemiol. Infect. 2003, 130, 1–11. [Google Scholar]
  33. Bronzwaer, S.; Hugas, M.; Collins, J.D.; Newell, D.G.; Robinson, T.; Mäkelä, P.; Havelaar, A. EFSA’s 12th Scientific Colloquium—Assessing health benefits of controlling Campylobacter in the food chain. Int. J. Food Microb. 2009, 131, 284–285. [Google Scholar] [CrossRef]
  34. Laboratory Reports of Campylobacter sp in England and Wales 2000–2011. Available online: http://www.hpa.org.uk/Topics/InfectiousDiseases/InfectionsAZ/Campylobacter/EpidemiologicalData/campyDataEw/ (accessed on 20 December 2012).
  35. Lawes, J.R.; Vidal, A.; Clifton-Hadley, F.A.; Sayers, R.; Rodgers, J.; Snow, L.; Evans, S.J.; Powell, L.F. Investigation of prevalence and risk factors for Campylobacter in broiler flocks at slaughter: Results from a UK survey. Epidemiol. Infect. 2012, 140, 1725–1737. [Google Scholar] [CrossRef]
  36. Heckerman, D.; Mamdani, A.; Wellman, M.P. Real-world applications of Bayesian networks. Commun. ACM 1995, 38, 24–68. [Google Scholar] [CrossRef]
  37. Deeks, J.J.; Altman, D.G.; Bradburn, M.J. Statistical Methods for Examining Heterogeneity and Combining Results from Several Studies in Meta-Analysis. In Systematic Reviews in Health Care: Meta-analysis in Context, 2nd ed.; Egger, M., Davey Smith, G., Altman, D.G., Eds.; BMJ Publication Group: London, UK, 2001. [Google Scholar]
  38. Deeks, J.J.; Higgins, J.P.T.; Altman, D.G. Chapter 9: Analysing Data and Undertaking Meta-Analyses. Available online: http://hiv.cochrane.org/sites/hiv.cochrane.org/files/uploads/Ch09_Analysing.pdf (accessed on 16 November 2012).
  39. Howard, R.A.; Matheson, J.E. Influence Diagrams. In Readings in Decision Analysis; Strategic Decisions Group: Menlo Park, CA, USA, 1981; pp. 763–771. [Google Scholar]
  40. Annan-Prah, A.; Janc, M. The mode of spread of Campylobacter jejuni/coli to broiler flocks. J. Vet. Med. 1988, 35, 11–18. [Google Scholar] [CrossRef]
  41. Stern, N.J. Reservoirs for C. jejuni and Approaches for Intervention in Poultry. In Campylobacter jejuni: Current Status and Future Trends; Nachamkin, I., Blaser, M.J., Tompkins, L.S., Eds.; American Society for Microbiology: Washington, DC, USA, 1992; pp. 49–60. [Google Scholar]
  42. Rice, B.; Rollins, D.; Mallinson, E.; Carr, L.; Joseph, S. Campylobacter jejuni in broiler chickens: Colonization and humoral immunity following oral vaccination and experimental infection. Vaccine 1997, 15, 1922–1932. [Google Scholar] [CrossRef]
  43. Food Survey Information Sheet 04/09. A UK Survey of Campylobacter and Salmonella Contamination of Fresh Chicken at Retail Sale. Available online: http://www.food.gov.uk/multimedia/pdfs/fsis0409.pdf (accessed on 3 December 2012).
  44. Crane, R.; Davenport, R.; Vaughan, R. Farm Business Survey 2009/2010. Poultry Production in England. Available online: http://www.fbspartnership.co.uk/documents/2009_10/PoultryProduction_2009_10.pdf (accessed on 14 January 2012).
  45. Dianova. Available online: http://www.dianova.dk/ (accessed on 17 June 2013).
  46. European Food Safety Authority (EFSA). Analysis of the baseline survey on the prevalence of Campylobacter in broiler batches and of Campylobacter and Salmonella on broiler carcasses, in the EU, 2008—Part A: Campylobacter and Salmonella prevalence estimates. EFSA J. 2010, 8, 1503–1550. [CrossRef]
  47. Allen, V.M.; Bull, S.A.; Corry, J.E.; Domingue, G.; Jorgensen, F.; Frost, J.A.; Whyte, R.; Gonzalez, A.; Elviss, N.; Humphrey, T.J. Campylobacter spp. contamination of chicken carcasses during processing in relation to flock colonisation. Int. J. Food Microb. 2007, 113, 54–61. [Google Scholar] [CrossRef]
  48. Brelade, S.; Harman, C. Practical Guide to Knowledge Management; Thorogood Publishing: London, UK, 2003. [Google Scholar]
  49. Firestone, J.; McElroy, M. Has Knowledge Management Been Done; Emerald Group Publishing Limited: Bradford, UK, 2005. [Google Scholar]
  50. Madsen, A.L.; Karlsen, M.; Barker, G.C.; Garcia, A.B.; Hoorfar, J.; Jensen, F.; Vigre, H. An Architecture for Web Deployment of Decision Support Systems Based on Probabilistic Graphical Models with Applications; Tech Report TR-12-001; Department of Computer Science, Aalborg University: Aalborg, Denmark, 2012. [Google Scholar]
  51. HUGIN EXPERT. The Leading Decision Support Tool. Available online: http://www.hugin.com/ (accessed on 26 September 2012).

