Article

Two-Dimensional Modeling of Pressure Swing Adsorption (PSA) Oxygen Generation with Radial-Flow Adsorber

1
School of Energy and Environmental Engineering, University of Science and Technology Beijing, Beijing 100083, China
2
Beijing Higher Institution Engineering Research Center of Energy Conservation and Environmental Protection, Beijing 100083, China
3
College of Biochemical Engineering, Beijing Union University, Beijing 100023, China
*
Authors to whom correspondence should be addressed.
These authors contributed equally to this work.
Appl. Sci. 2019, 9(6), 1153; https://doi.org/10.3390/app9061153
Submission received: 21 February 2019 / Revised: 14 March 2019 / Accepted: 15 March 2019 / Published: 19 March 2019

Abstract

:
Radial flow is an important type of flow direction for large-scale pressure swing adsorption (PSA) oxygen generation systems. In this study, a numerical simulation of a PSA oxygen generation process based on radial-flow adsorbers was performed with two-dimensional CFD modeling. The gas distribution, the maldistribution factor and the pressure difference were comparatively investigated at each flow type of the radial-flow adsorber. Considering the gas adsorption performance, the results indicated that the centripetal π-flow radial adsorber has the best flow characteristics for the PSA process. The oxygen purity distribution within the adsorption bed was studied to compare centripetal and centrifugal π-flows, and the former was shown to perform better on oxygen enrichment and adsorbent desorption. The steady state was achieved after eight cycles for the centripetal-π adsorber and each of the four steps of the PSA process was explored in detail to show the advantageous properties for oxygen generation in terms of adsorption and desorption. The relationships between the product flow rate and the oxygen purity and recovery were further investigated.

1. Introduction

Large-scale PSA oxygen generation systems have attracted considerable attention in recent years due to the low cost [1] and increasing demand for industrial gases. In China, the pressure swing adsorption (PSA) oxygen generation scale has reached 40,700 Nm3 h−1 in the coal chemical industry. Due to the huge gas flow used in large-scale oxygen generation plants, diameters larger than 4–5 m are generally required in conventional axial-flow adsorbers, which exceed economical shipment limits. Such axial-flow adsorbers also have inherently large void volume percentages in the upper and lower head spaces, and difficulties in flow distribution, leading to negative impacts on oxygen generation [2]. The high gas flow rate results in a high superficial velocity across the bed, creates an unwanted pressure drop typically comprising 10–15% of the total power consumption [3], and contributes to great efficiency loss. In contrast, radial-flow adsorbers have advantages of small pressure gradient at the feed end, better adsorbent utilization during the inward feed step, and have a more effective desorption and purge step [4,5]. Vertical radial-flow adsorbers are widely used in the purification process of large-scale cryogenic air separation systems [6,7] and also used on the large scale of PSA oxygen production [3]. LaCava et al. [8] mentioned that, “As competitive pressures are driving companies to operate their PSA units with high superficial velocities and short mass-transfer zones, radial bed designs are becoming more and more popular.”
Genkin et al. [9] used the full energy conservation equation to derive the mathematical model of the fluid flow in a radial-flow reactor, and verified the model by experiment. It was found that the axial distribution of the fluid along the bed depends on the static of the two sides of the bed. Balakotaiah et al. [10] showed that the radial-flow direction (center or centrifugation) had an effect on the reaction conversion rate. Ponzi and Kaye [11] showed that a uniform distribution of gas flow in the radial-flow bed has a more significant effect on the reaction conversion rate. Bolton et al. [12] investigated the flow distribution in a radial-flow bed reactor using electrical resistance tomography and CFD, and showed the radial velocity gradient of the fluid flowing from the inlet end to the center increased gradually. Smolarek et al. [13] pointed out that the narrow flow path that forms in the radial-flow adsorption bed can improve the uneven distribution of fluids. Celik [14] proposed a non-uniform distribution of openings in the inner and outer cylinders to improve the uniform distribution of airflow. Kareeri et al. [15] studied the flow distribution of four radial-flow react beds and found that the centrifugal-π-flow configuration is the superior configuration for the radial flow reactor. Song et al. [16] found that the centrifugal-π-flow configuration had the most uniform axial flow over other configurations. Heggs et al. [17] concluded that the centripetal π-type flow gives better flow distribution than other types of flow on a specific type of air filter incorporating an annular bed of activated carbons. Li and Zhu [18] investigated the properties of the fluids in flow channels of a three-layer radial-flow reactor. Zhang et al. [19] analyzed the pressure drop in a Z-flow type radial-flow adsorber and derived a differential equation to determine the ideal cross-sectional radii. Hamedi et al. [20] found an optimized axial flow reactor had about 99.4% lower pressure drop in comparison to the conventional configuration. Wang et al. [21] have studied the effect of the structure of a radial-flow adsorber on gas distribution.
Previous works on radial-flow adsorbers mainly focus on gas flow distribution and chemical reaction efficiency. There are limited studies on PSA oxygen generation. Chiang et al. [4] employed a rapid PSA system with radial-flow bed on oxygen generation experimentally and showed inward feed operation gave a better product purity because of a relatively small pressure gradient on the adsorption bed. Huang [5] compared radial- and axial- flow rapid PSA oxygen generations and found that the separation performance of the radial-flow RPSA was better when small adsorbent particles and long effective lengths were used.
Numerical simulation is a very effective method to study the PSA process of oxygen generation [22,23,24,25,26]. However, most of the studies are based on the 1-D assumption, while in actual PSA processes there are often inconsistencies perpendicular to the flow direction [27,28]. Few studies have been reported in the research of PSA oxygen generation based on 2-D or 3-D radial-flow adsorbers. In this study, a 2-D radial-flow model for PSA oxygen generation was strictly built. The performances on gas flow characteristics and oxygen generation were investigated in detail. This work could provide a reference for the application of radial-flow PSA oxygen generator and the optimization of airflow uniformity of radial-flow PSA adsorbers.

2. Numerical Model

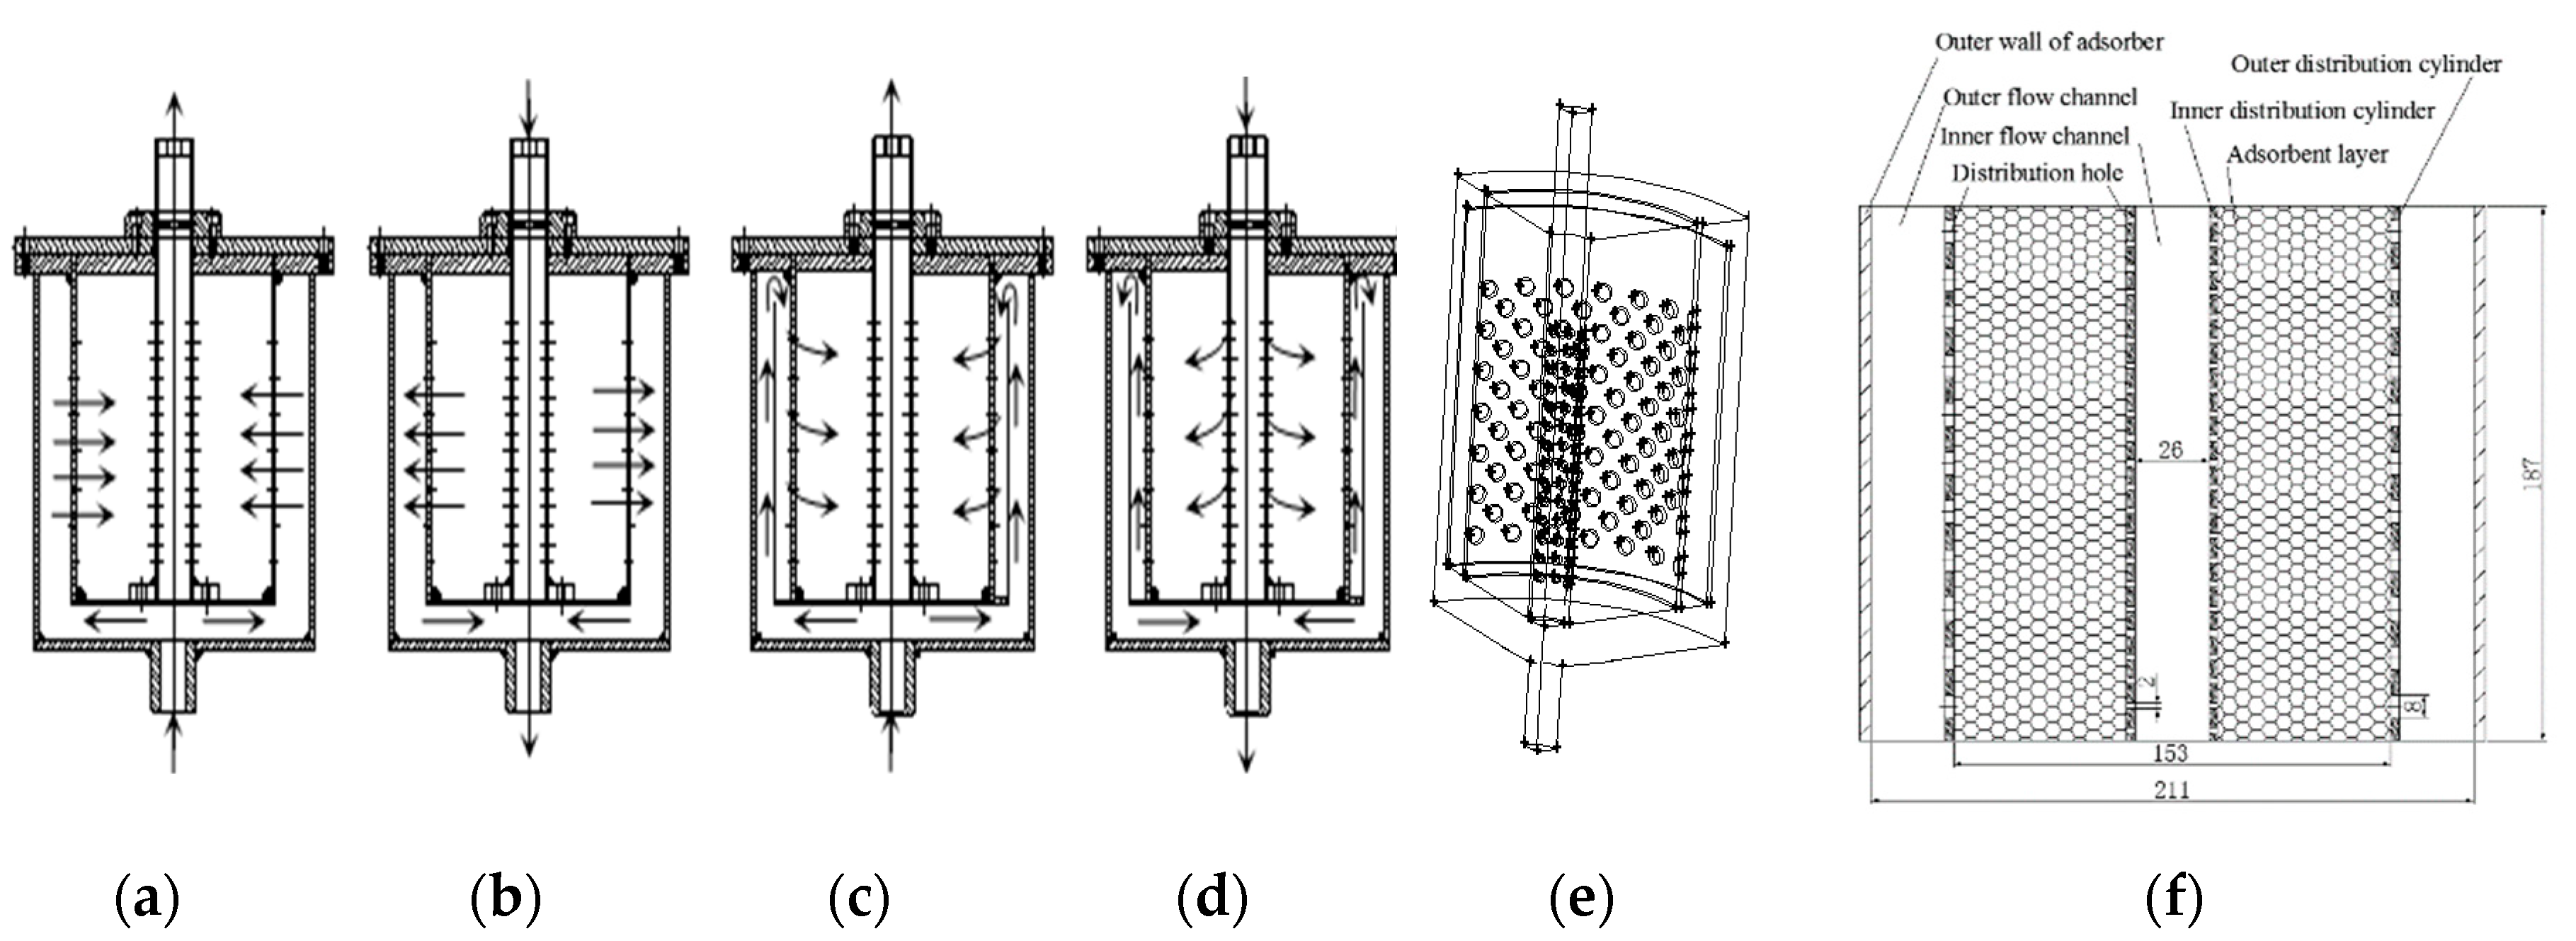
2.1. Models of Adsorbers

The flow field of the adsorber was calculated using a two-dimensional, axisymmetric geometry in order to save computational time. The models of the adsorbers that were investigated are illustrated in Figure 1. The main structure of the radial-flow adsorber consists of a center flow channel, an adsorbent packing layer and an outer flow channel. The holes for gas flow distribution shown in Figure 1e are evenly distributed between the flow channel and the adsorbent loading layer. The x-axis is the radial coordinate and the z-axis is the axial coordinate, and the center of the end of the adsorber inlet is taken as the coordinate origin. The schematic of radial-flow adsorbers including the important sizes are shown in Figure 1f, and the structure parameters of the adsorber are shown in Table 1.
Radial-flow reactors can be classified into z-flow and π-flow types depending on the flow directions in the center channel and in the annular channel next to the adsorbent layer. As shown in Figure 1, in the z-flow type, the flow directions in annular and center channels are the same, while in the π-flow type the two flow directions are opposite. Moreover, radial-flow reactors can also be classified into centripetal (CP) or centrifugal (CF) flow types depending on radial-flow direction. In the CP-flow type, the gas is fed to the annular channel and flows radially inward from the annular channel to the center channel, while in the CF-flow configuration, the gas is fed to the center channel and flows radially outward from the center channel to the annular channel. Therefore, four flow configurations, CP-z, CP-π, CF-z, and CF-π, are selected for modeling the radial-flow adsorbers as shown in Figure 1 [14].

2.2. Governing Equations

The governing equations are consistent with previous research [27,28], and the simulation results were verified experimentally by use of the product of the O2 concentration on the axial flow adsorber [28].
(1) Mass balance
The overall mass balance can be expressed as:
ε ρ f τ + ( ε ρ f u ) = S m
S m = i = 1 n S i
and the mass balance equation for component i can be expressed as:
τ ( ε ρ f Y i ) + ( ε ρ f u Y i ) ( ε ρ f D i Y i ) = S i
S i = ( 1 ε ) ρ p M i q i τ
where, Sm is the total mass source term that results from bulk sorption; ε is the bed porosity; ρf is the density of the gas mixture, km m−3; Yi is the mass fraction of component I; u is the velocity vector, m s−1; Di is the mass dispersion rate, m2 s−1; and Mi is the molar weight of component i, kg mol−1.
(2) Momentum Balance
The porous media are modeled by the addition of a momentum source term to the standard fluid Navier−Stokes equations (laminar flow). The modified N−S equation is written as:
τ ( ρ f u i ) + ( ρ f u u i ) = ρ f g p + μ 2 u + μ 3 ( u ) + S v
S v = ( μ u α + C 2 ρ f | u | u + S m u )
α = ε 3 d p 2 150 ( 1 ε ) 2 , C 2 = 1.75 1 d p 1 ε ε 3
where μ is the dynamic viscosity of the fluid; p is the gas pressure, and Sv is the momentum source term. The momentum source term Sv is written as Equation (6) with the consideration of gas adsorption. The coefficients α and C2 are given by the relations developed by Ergun [29] for the flow in a packed bed.
(3) Energy Balance
For an adiabatic bed with no heat transfer with the surroundings, the overall heat balance can be written as
t ( ε ρ f e f + ( 1 ε ) ρ p e p ) + ( v ( ρ f e f + p ) ) = [ k e f f T + ( τ ¯ ¯ u ) ] + S f h
S f h = ( 1 ε ) ρ p i ( Δ H i q i t )
where ef is the total fluid energy, J kg−1; ep is the total solid medium energy; ∆Hi is the heat of adsorption, kJ mol−1; keff is the effective thermal conductivity of the bed, W m−2 K−1.
(4) Adsorption isotherm and mass transfer rate
The LDF model [25,30,31] is selected as the mass transfer control equation as:
q i ¯ t = k i ( q i * q i ¯ )
where qi is the adsorption amount at time t, mol kg−1; q i * is saturate adsorption capacity, mol kg−1; ki is mass transfer constant, s−1; t is adsorption time, s.
The extend Langmuir equation [23,24,28] is selected as the adsorption equilibrium equation as:
q * = q m b i p i 1 + k = 1 N b k p k
q m = k 1 exp ( k 2 T ) , b = k 3 exp ( k 4 T )
where p is partial pressure of component i, Pa; qm, k1, k2, bi, k3, k4 are Langmuir parameter; T is temperature, K. The parameters of LiX zeolite (CECA-G5000) as typical PSA oxygen generation adsorbent is employed in this study, and the isotherm parameters are shown on Table 2 [28].

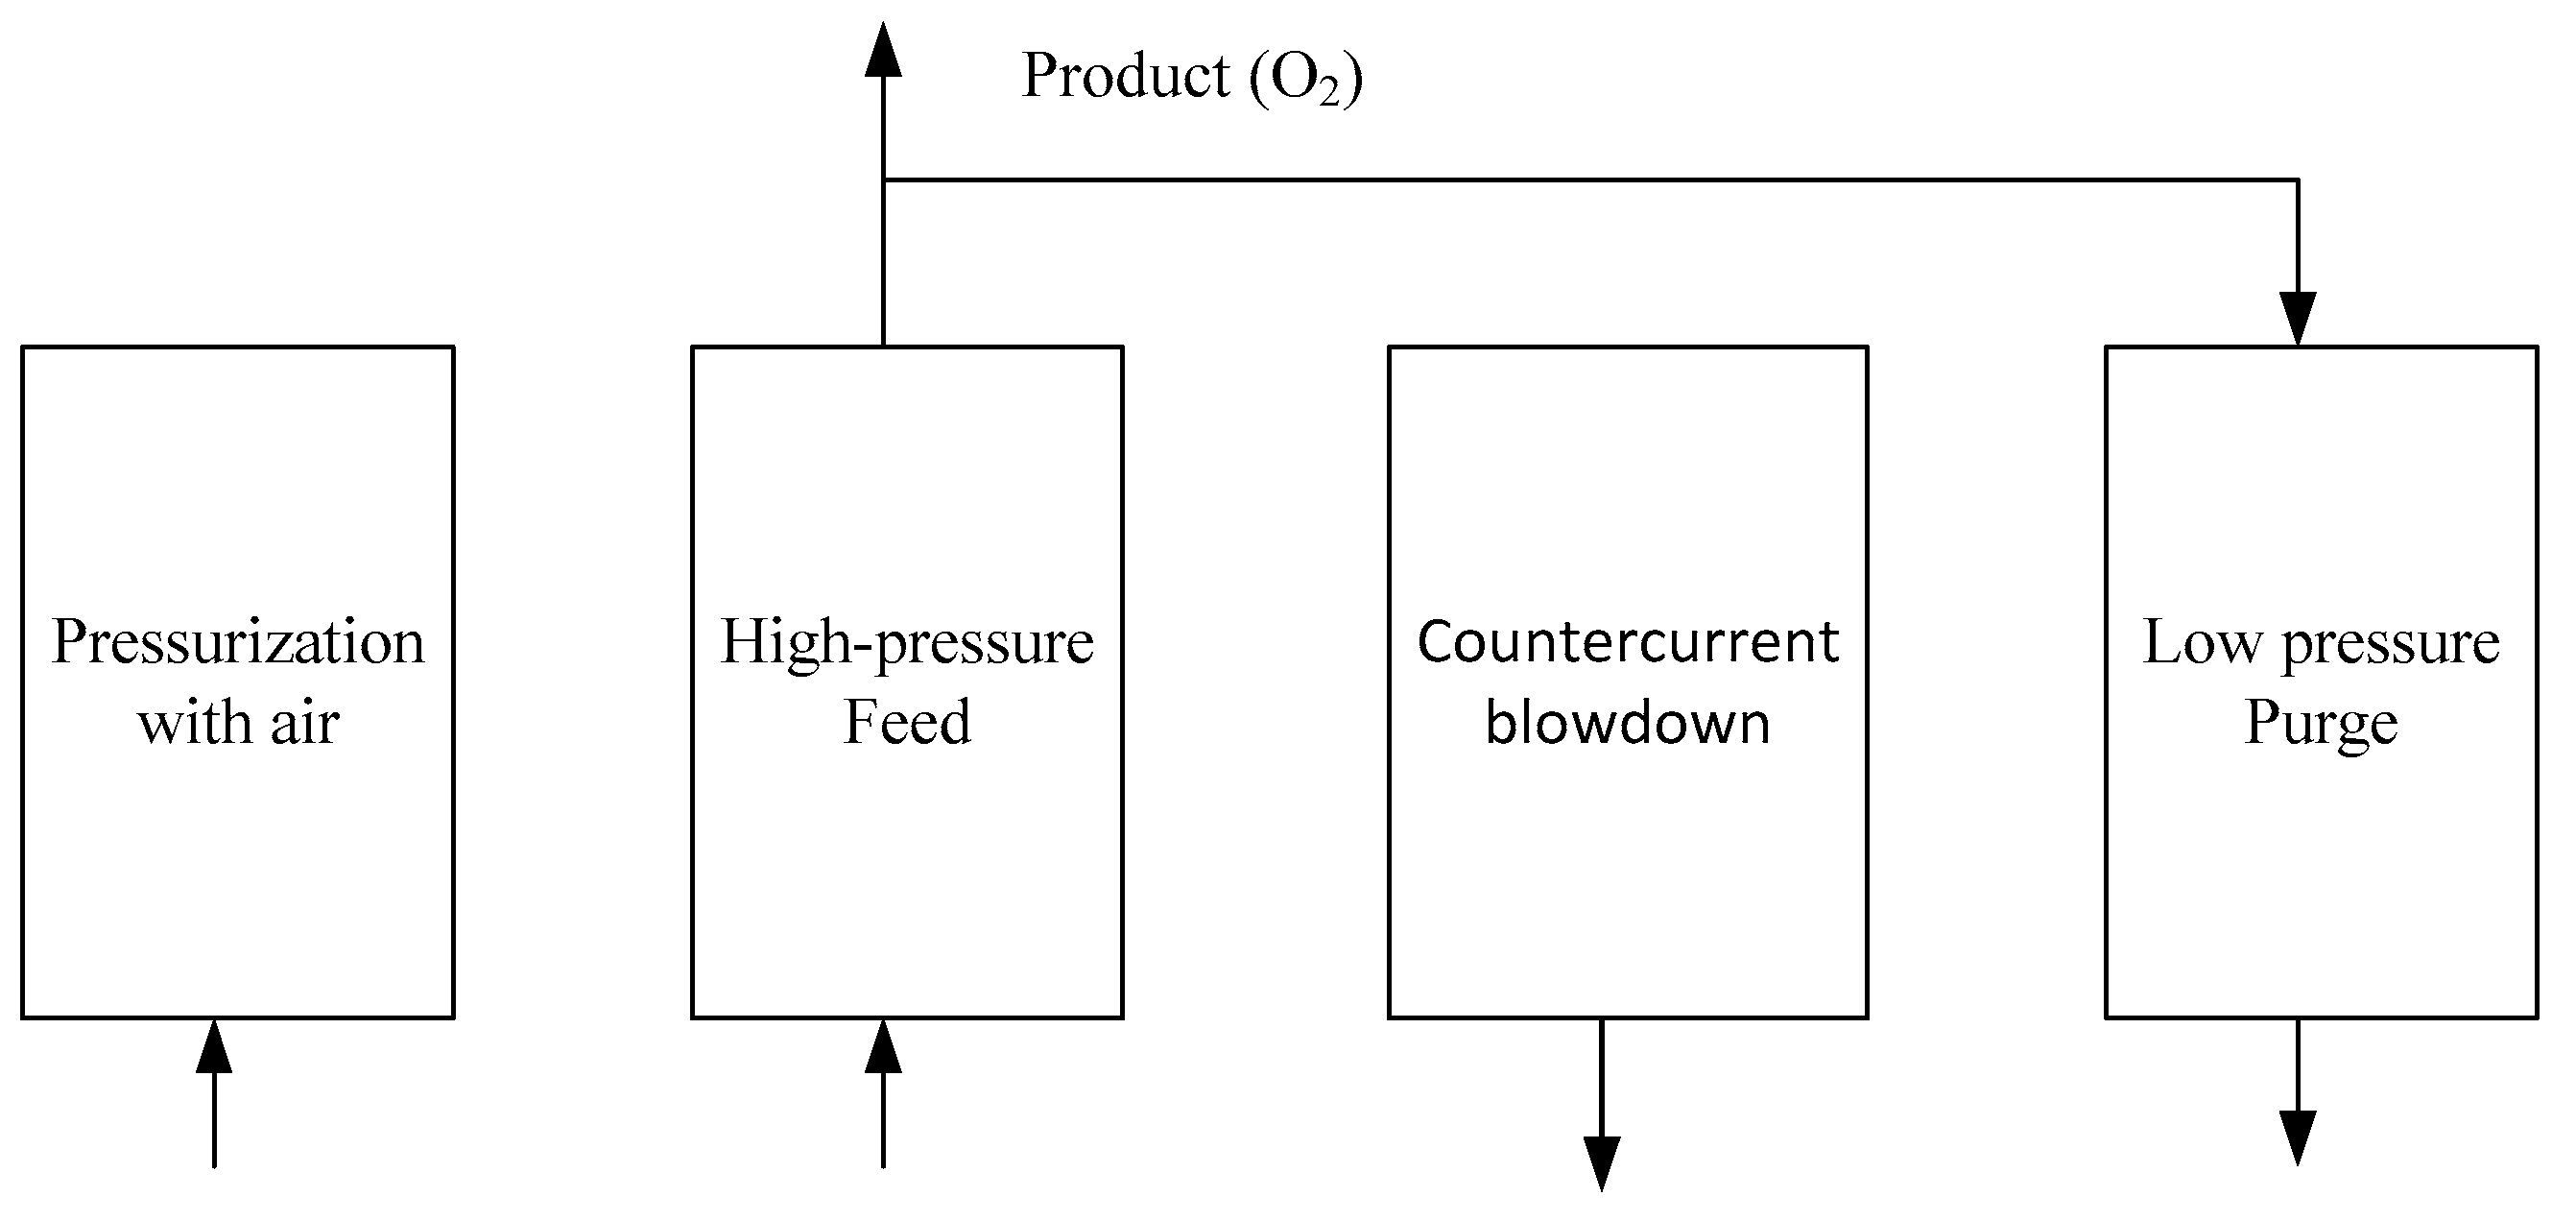
2.3. Simulation Conditions

The Skarstrom cycle [23] was employed in this study, where both beds undergo 4 steps. For clarification purposes, the schematics of the 4-step cycle is given in Figure 2. The sequence of the steps are as follows: pressurization with air (Pr), high-pressure feed to produce an oxygen enriched gas (Ad), countercurrent blowdown (Cb) and a low-pressure purge (Pu) by using the product gas from the Ad step. The gas flow directions of the four steps are shown by arrows in Figure 2. The duration time for these 4 steps are 7 s, 5 s, 3 s, and 5 s, respectively. In the Pr step, the mass flow rate is set to be 104 L min−1 according to the particle compressor (ZW-700A). The low pressure at desorption step was set to be 1 atm. Table 3 lists the initial and boundary conditions used in the simulation. The usual no-slip boundary condition is applied at the “wall” and a zero normal gradient boundary condition is applied on the “axis” for all variables. The entrance and vent in Table 3 represent the position of the feed gas flow in and product flow out of the bed, respectively.
The O2 product recovery is given in Equation (13). The oxygen purity is mole fraction of oxygen.
The initial conditions for simulation and model parameters are listed in Table 4 and Table 5.
Product   Recovery = Product   flow   rate   ×   Product   O 2   purity Feed   gas   flow   rate   ×   Feed   gas   O 2   purity = ( Amount   of   O 2   from   Ad   Steps )     ( Amount   of   O 2   from   Pu   Step ) Amount   of   O 2   feed   in   Steps   Pr   and   Ad

2.4. Modeling Method

The aforementioned equations were numerically solved by using the computational fluid dynamics (CFD) software FLUENT 16 (ANSYS, Inc. Pittsburgh, PA, USA), whereas the pressure–velocity coupling problem in the momentum equations was solved by using the coupled algorithm. For the implementation of the PSA process, the UDS (user-defined scalars) and UDF (user-defined functions) were applied to program the mass transfer and the source terms. The solving process and model parameters are described in a previous study [28].
The 1/4-type radial-flow adsorber was meshed with a hexahedral structure with a mesh number of 240,000 and passed the grid independence check. Due to the different flow velocities in the flow distribution holes, local mesh encryption was used in the vicinity of the airflow distribution channel.

3. Results and Discussion

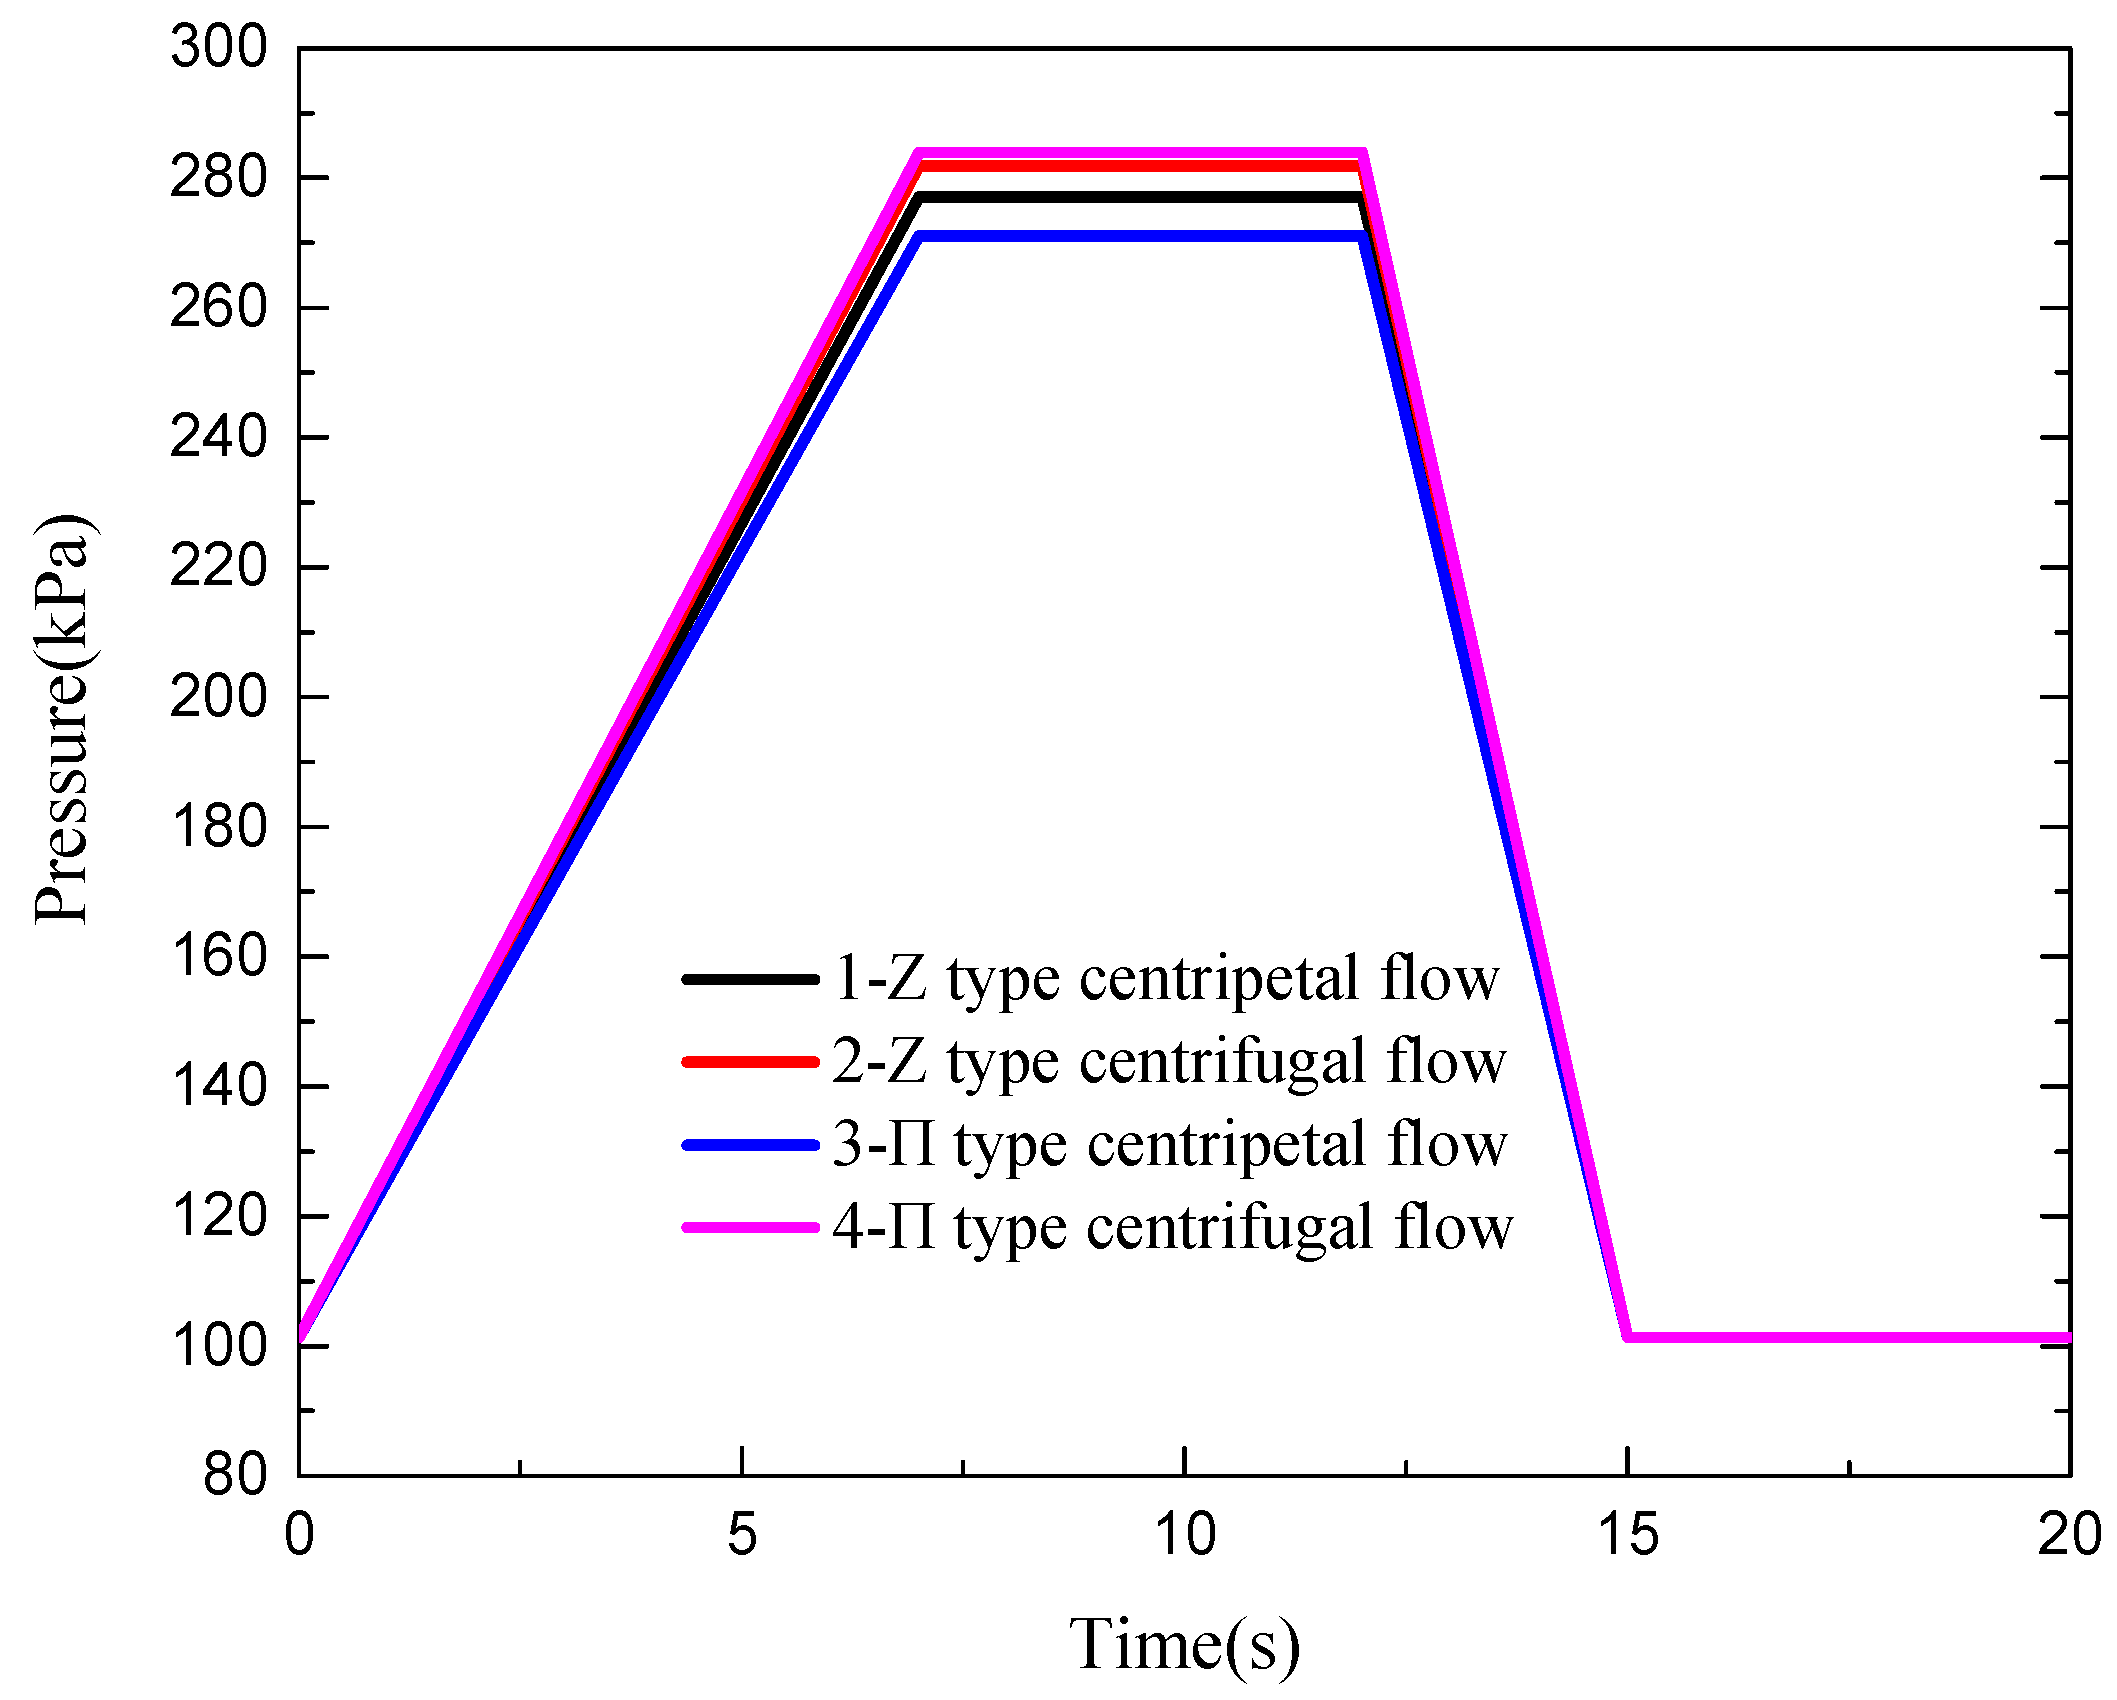
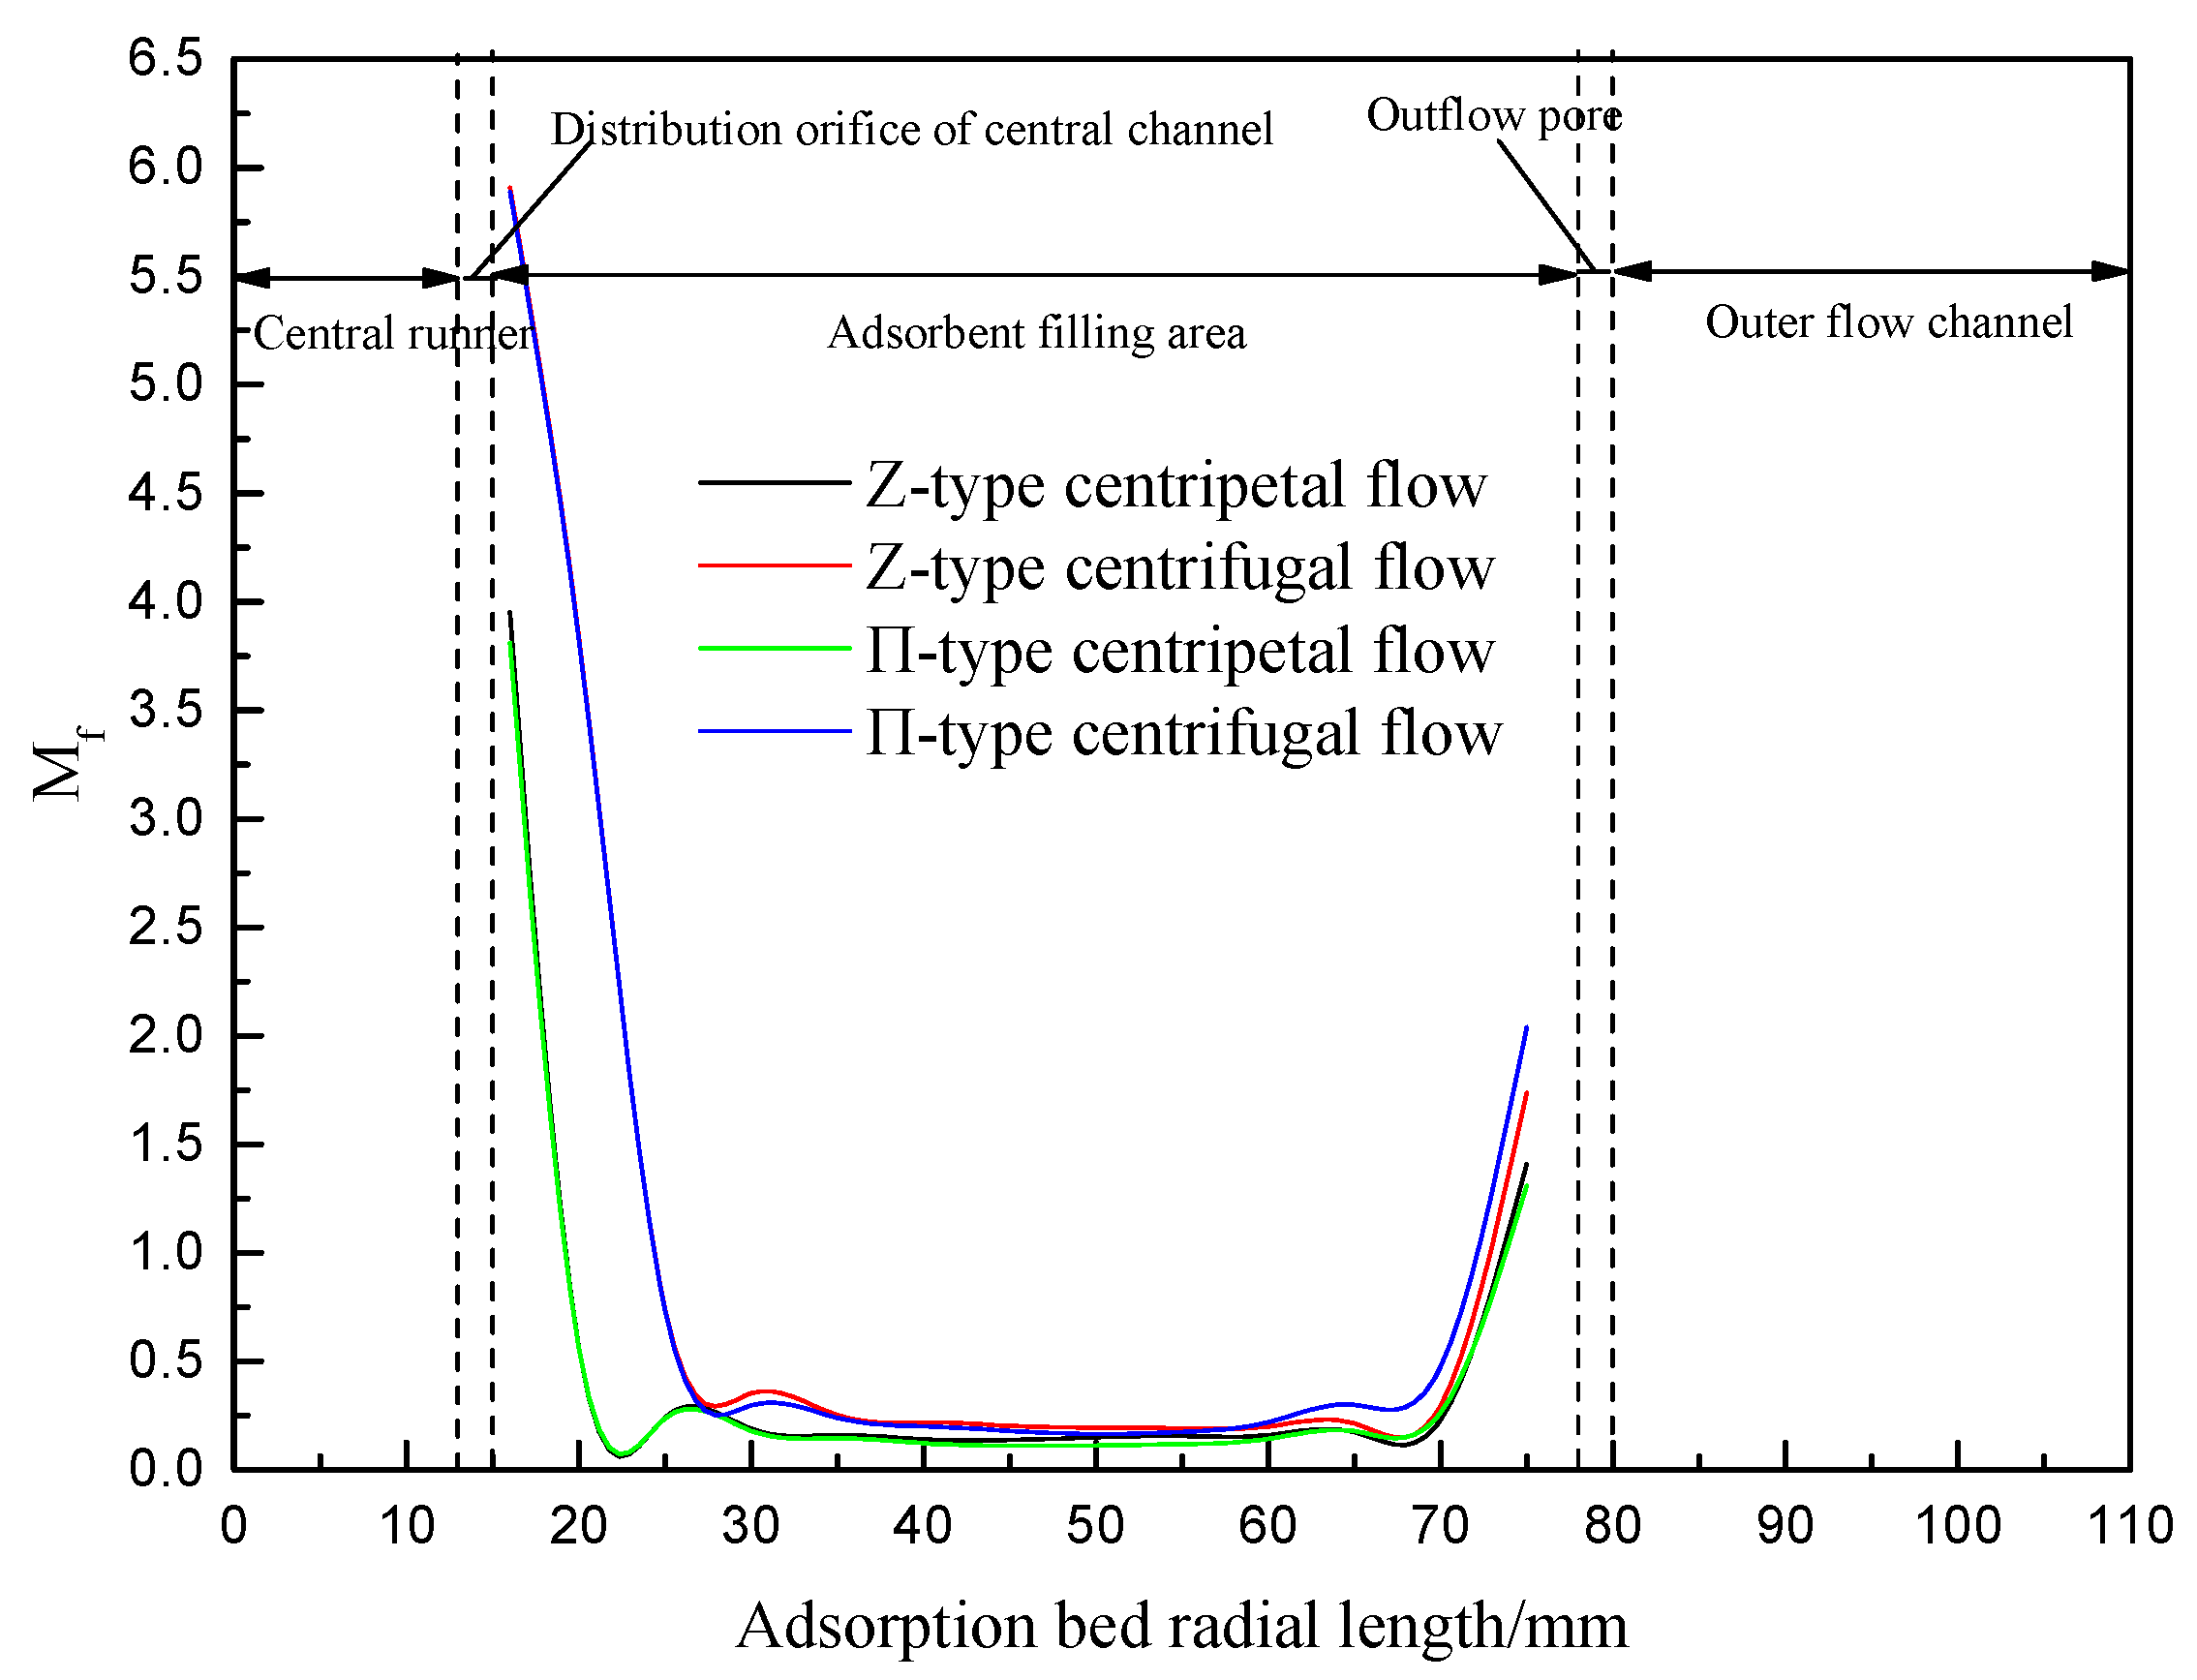
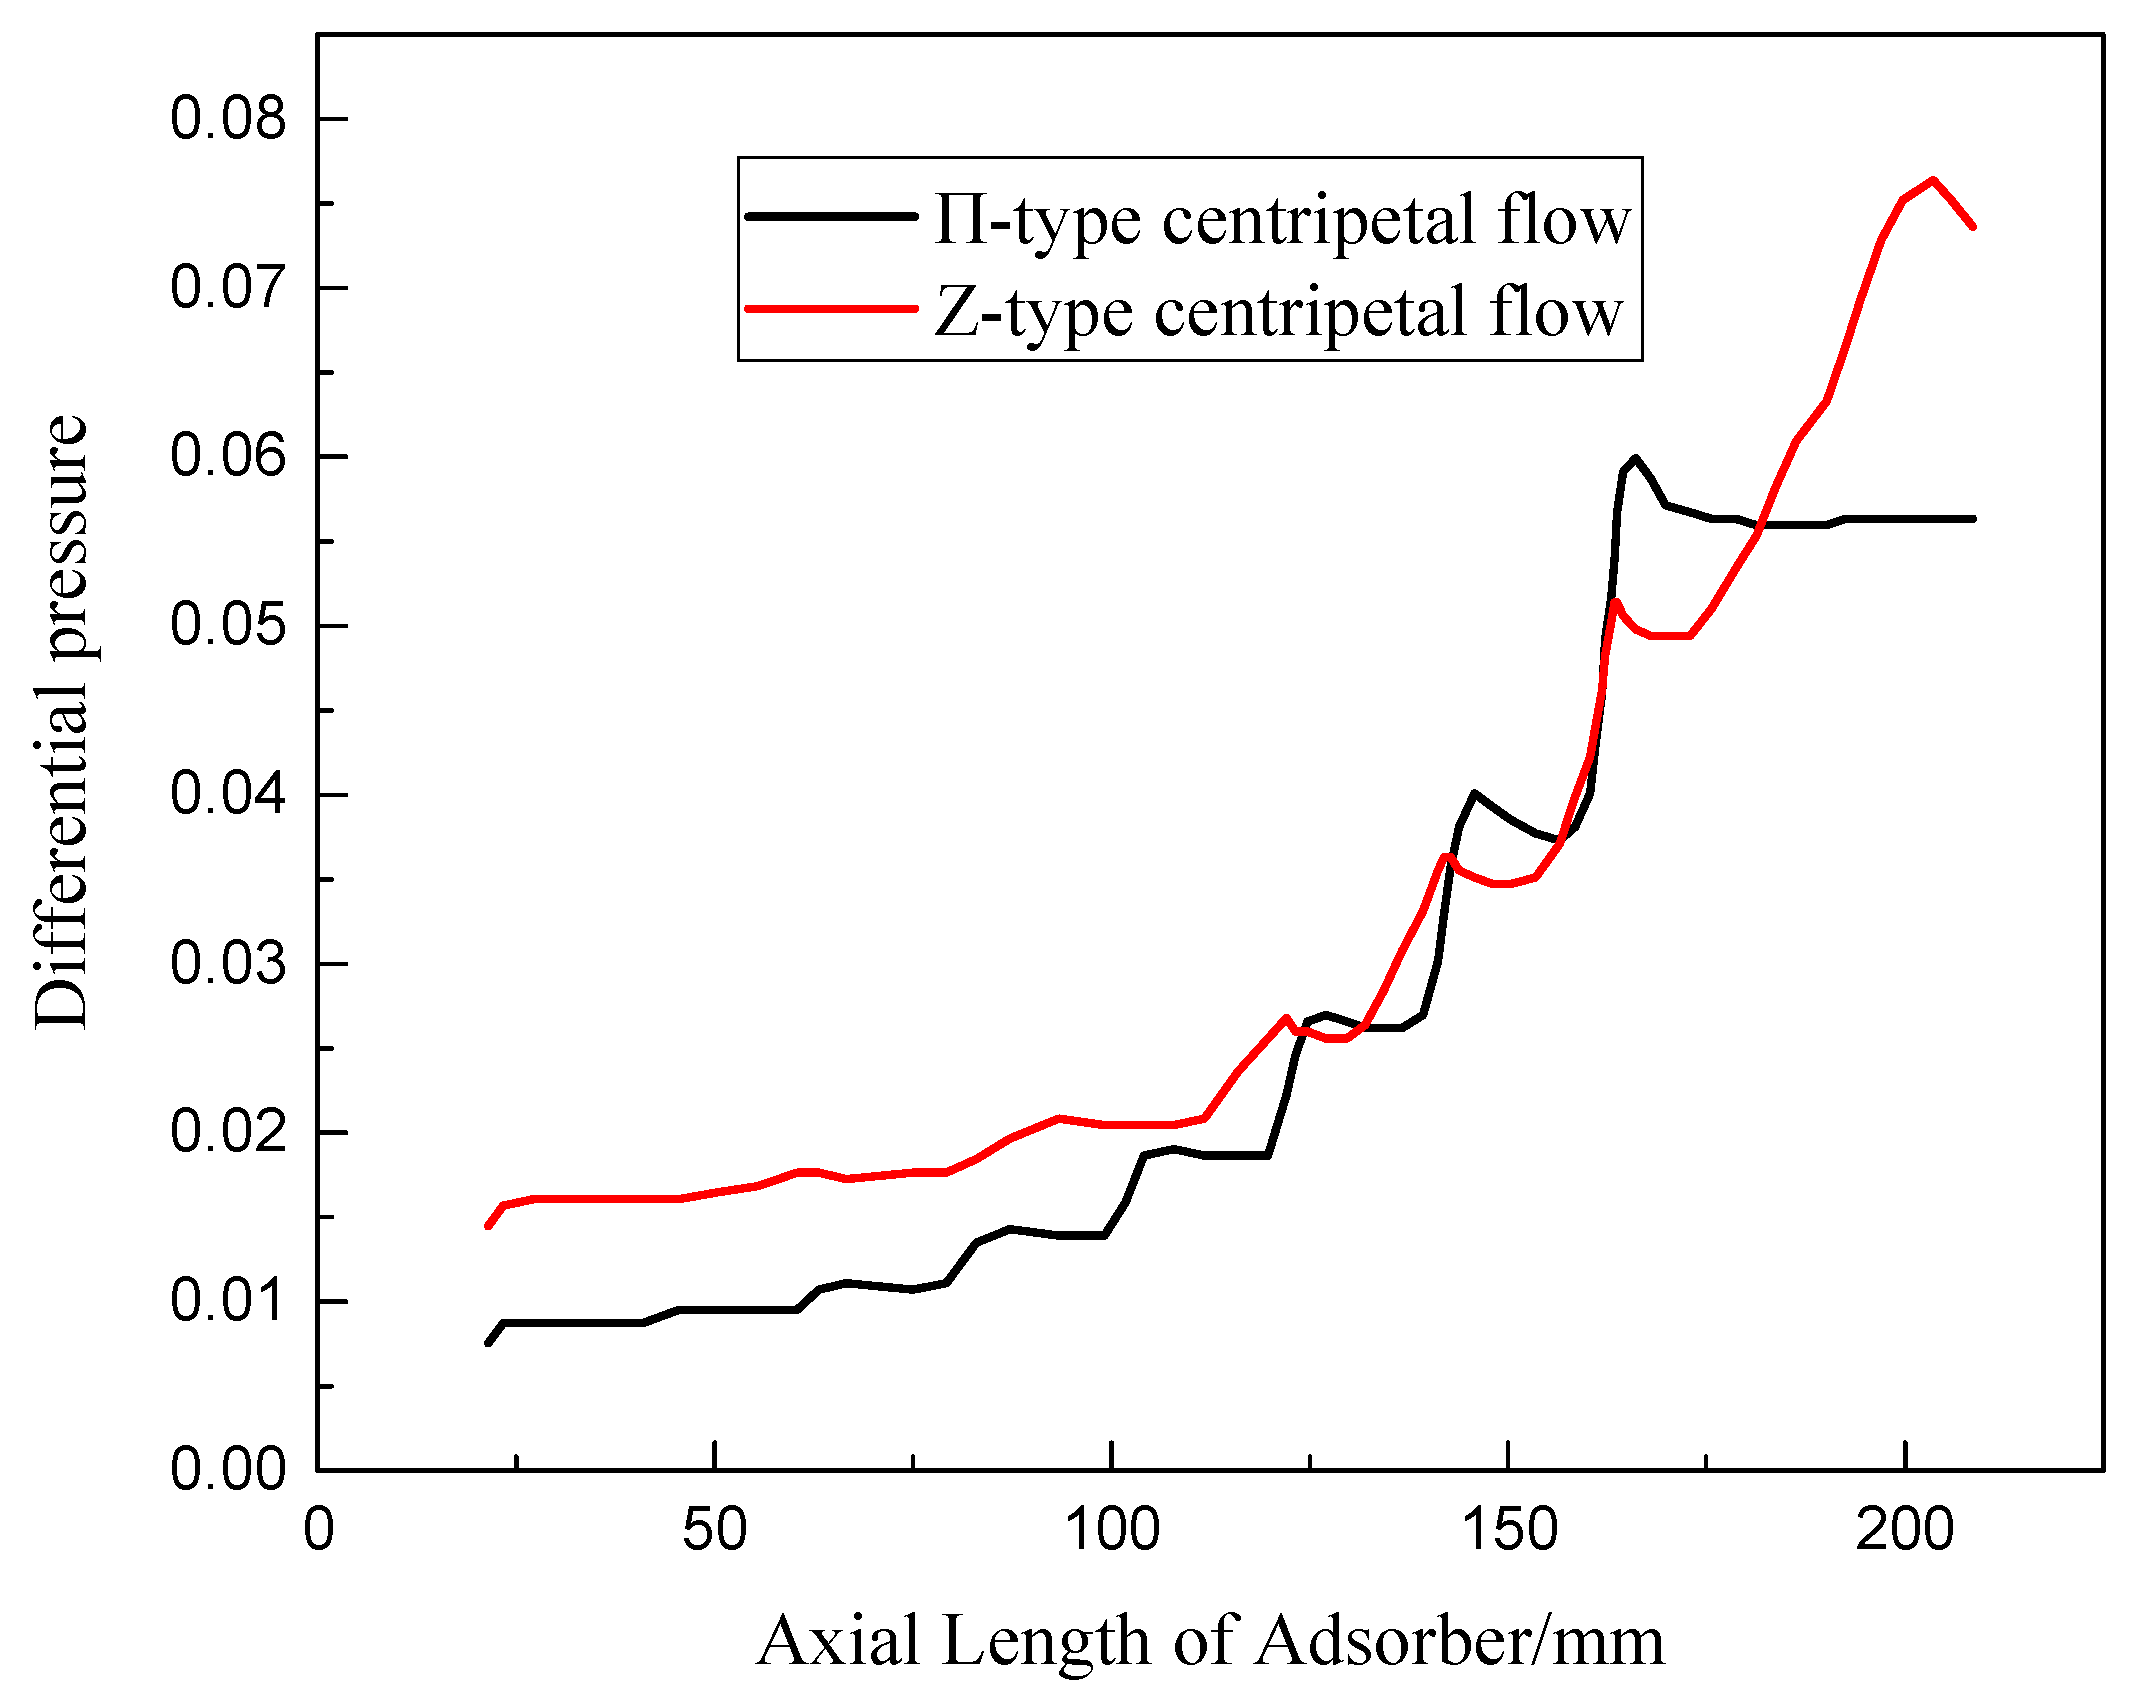
3.1. Selection of the Optimal Radial-Flow Type

Figure 3 gives the change of pressure in the outer flow channel of each radial-flow adsorber within one cycle of a stabilized PSA process. It can be seen that the four radial-flow adsorbers give similar patterns of pressure changes with the order of the value of CF-π>CF-Z>CP-Z>CP-π, indicating that the effect of the flow type on the pressure change in the bed during the radial-flow PSA process is small.
In order to compare the gas distribution of the adsorber in the PSA oxygen generator, a maldistribution factor integrating the surface and corresponding velocity, Mf, was introduced as in [27,36].
M f = 1 F 0 0 F 0 [ w i w ¯ w ¯ ] 2 d F
where F0 is the total bed cross section; wi is the flow velocity in point i; and w ¯ is the overall mean velocity, which is further defined as:
w ¯ = 1 F 0 0 F 0 w i d F
Figure 4 shows the variations in Mf along with adsorption bed radial length at Ad step in each adsorber. The values of Mf in the junction between both the center and outer channel and the adsorbent packing layer is greater than those across the main region of the absorbent packing layer. The concave-type curve shows a higher value of Mf for the center channel than for the outer channel. Moreover, the value of Mf for the centripetal flow is smaller than that for the centrifugal flow. This is mainly attributed to the large inlet flow corresponding to the large cross-sectional area and the small outer flow after adsorption corresponding to the small cross-sectional area in the centripetal flow type. On the contrary, the centrifugal flow exhibits an opposite situation. In this regard, the centripetal flow mode is much more suitable for PSA oxygen generation.
In order to compare the difference in pressure drop between CP-π and CP-Z flows, the variations in the pressure differences between center and outer channels along with axial lengths at the Pu step, which is more sensitive to pressure, are depicted in Figure 5. Both centripetal flow types show similar increasing trends, the value of which is lower for CP-π than for CP-Z. These results indicate better gas distribution in CP-Z flow during the PSA oxygen generation process. The main channels for inlet and outer flow followed the momentum exchange control mode, and therefore, the static pressure in the inlet channel increases along the flow direction while the static pressure of the outer flow channel decreases along the flow direction. When the CP-π flow with opposite direction of the bypass flow and interflow is used, the static pressure drop decreases and gives better gas distribution [14].
In summary, for current radial-flow PSA oxygen generation, CP-π flow is shown to be the optimal type based on the above flow characteristics, and is therefore selected to be further explored for its advantageous oxygen generation properties in the following sections, and similar results are obtained by simulation [17] and experiment [21].

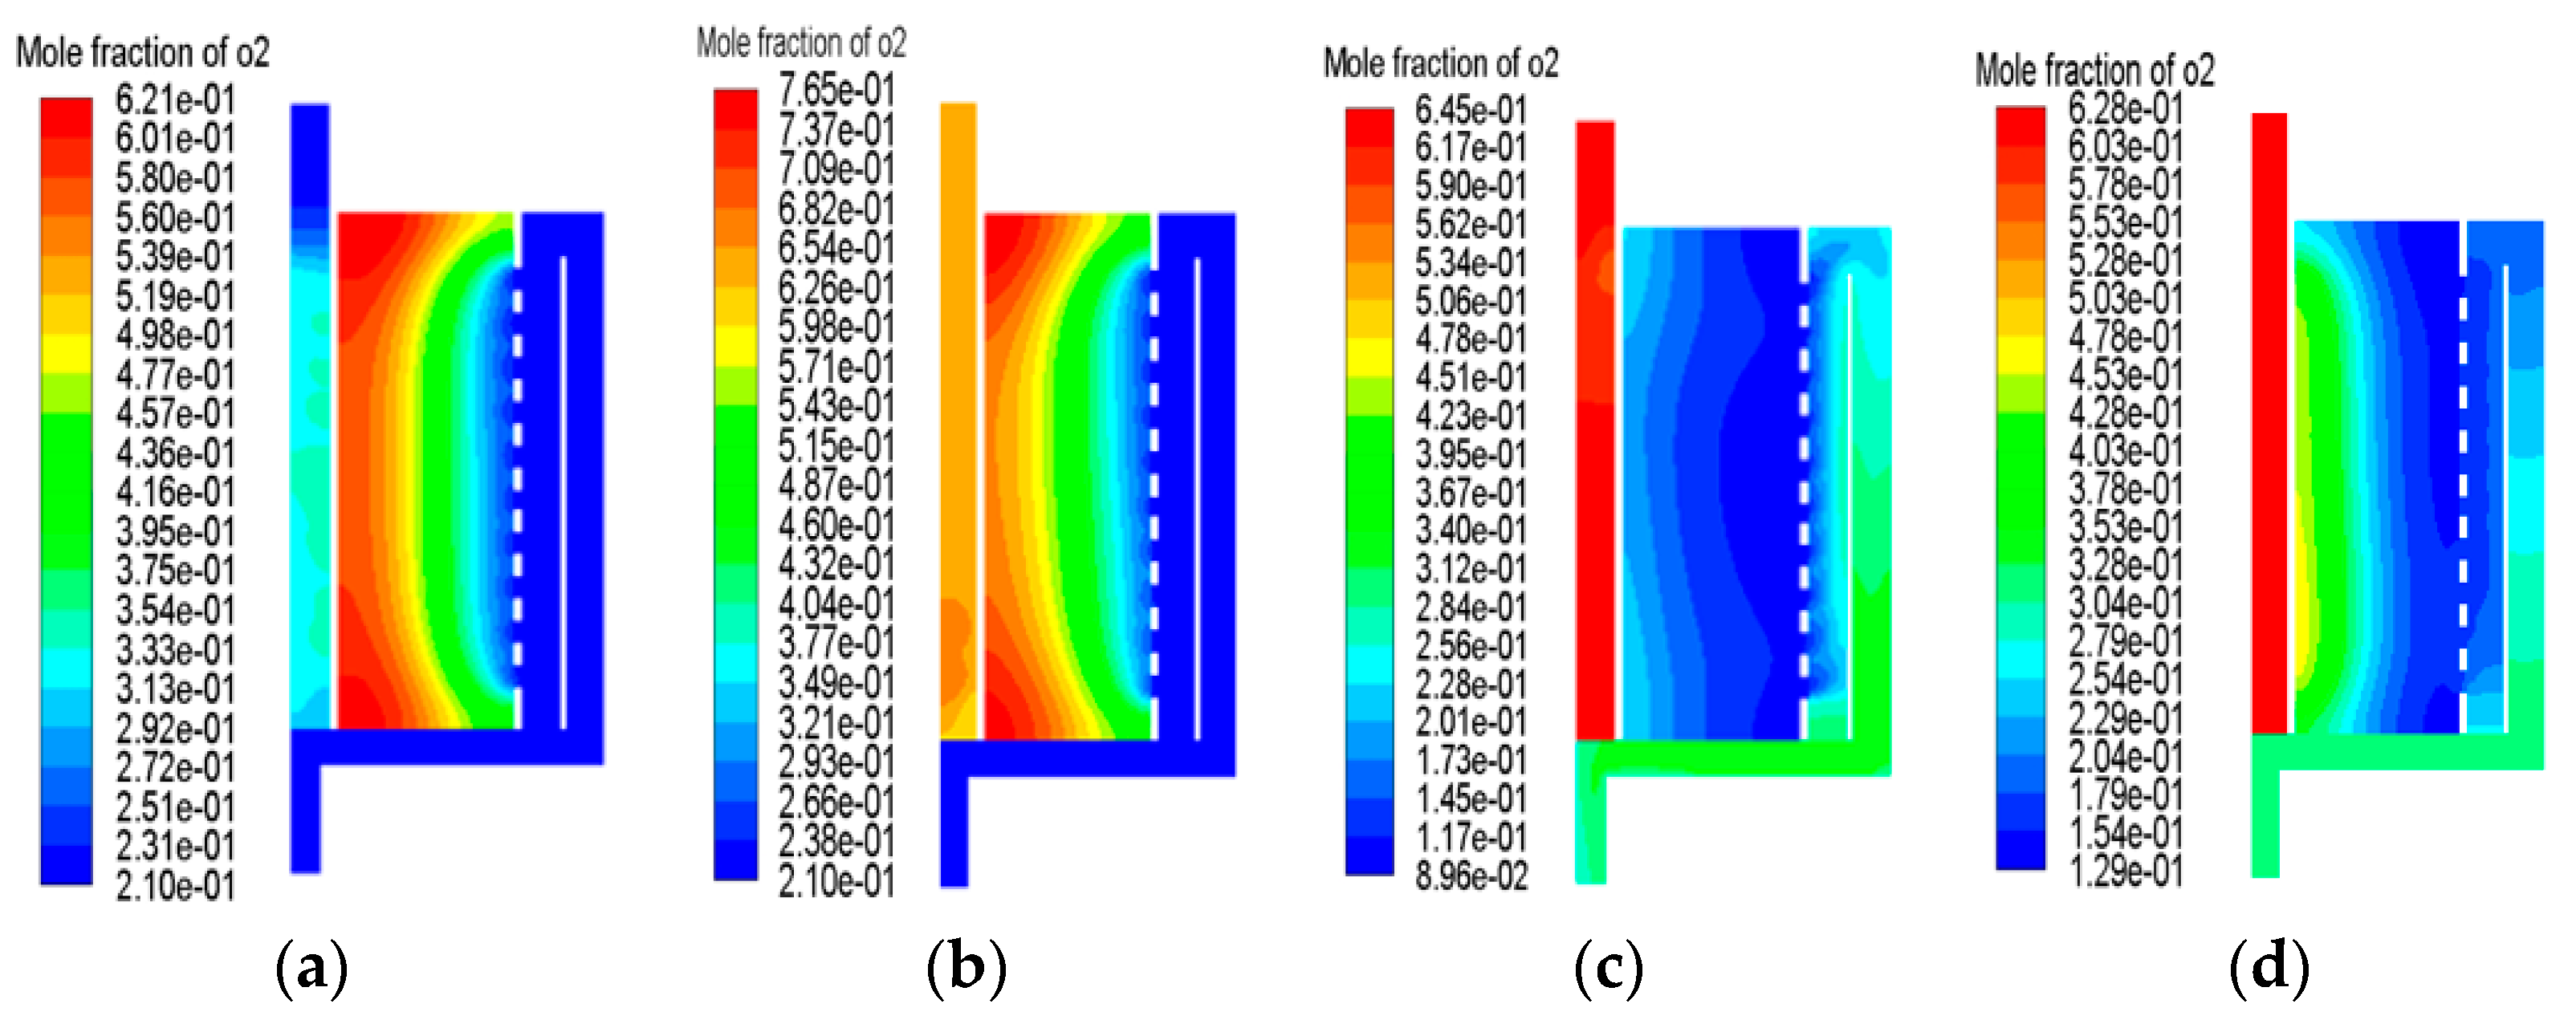
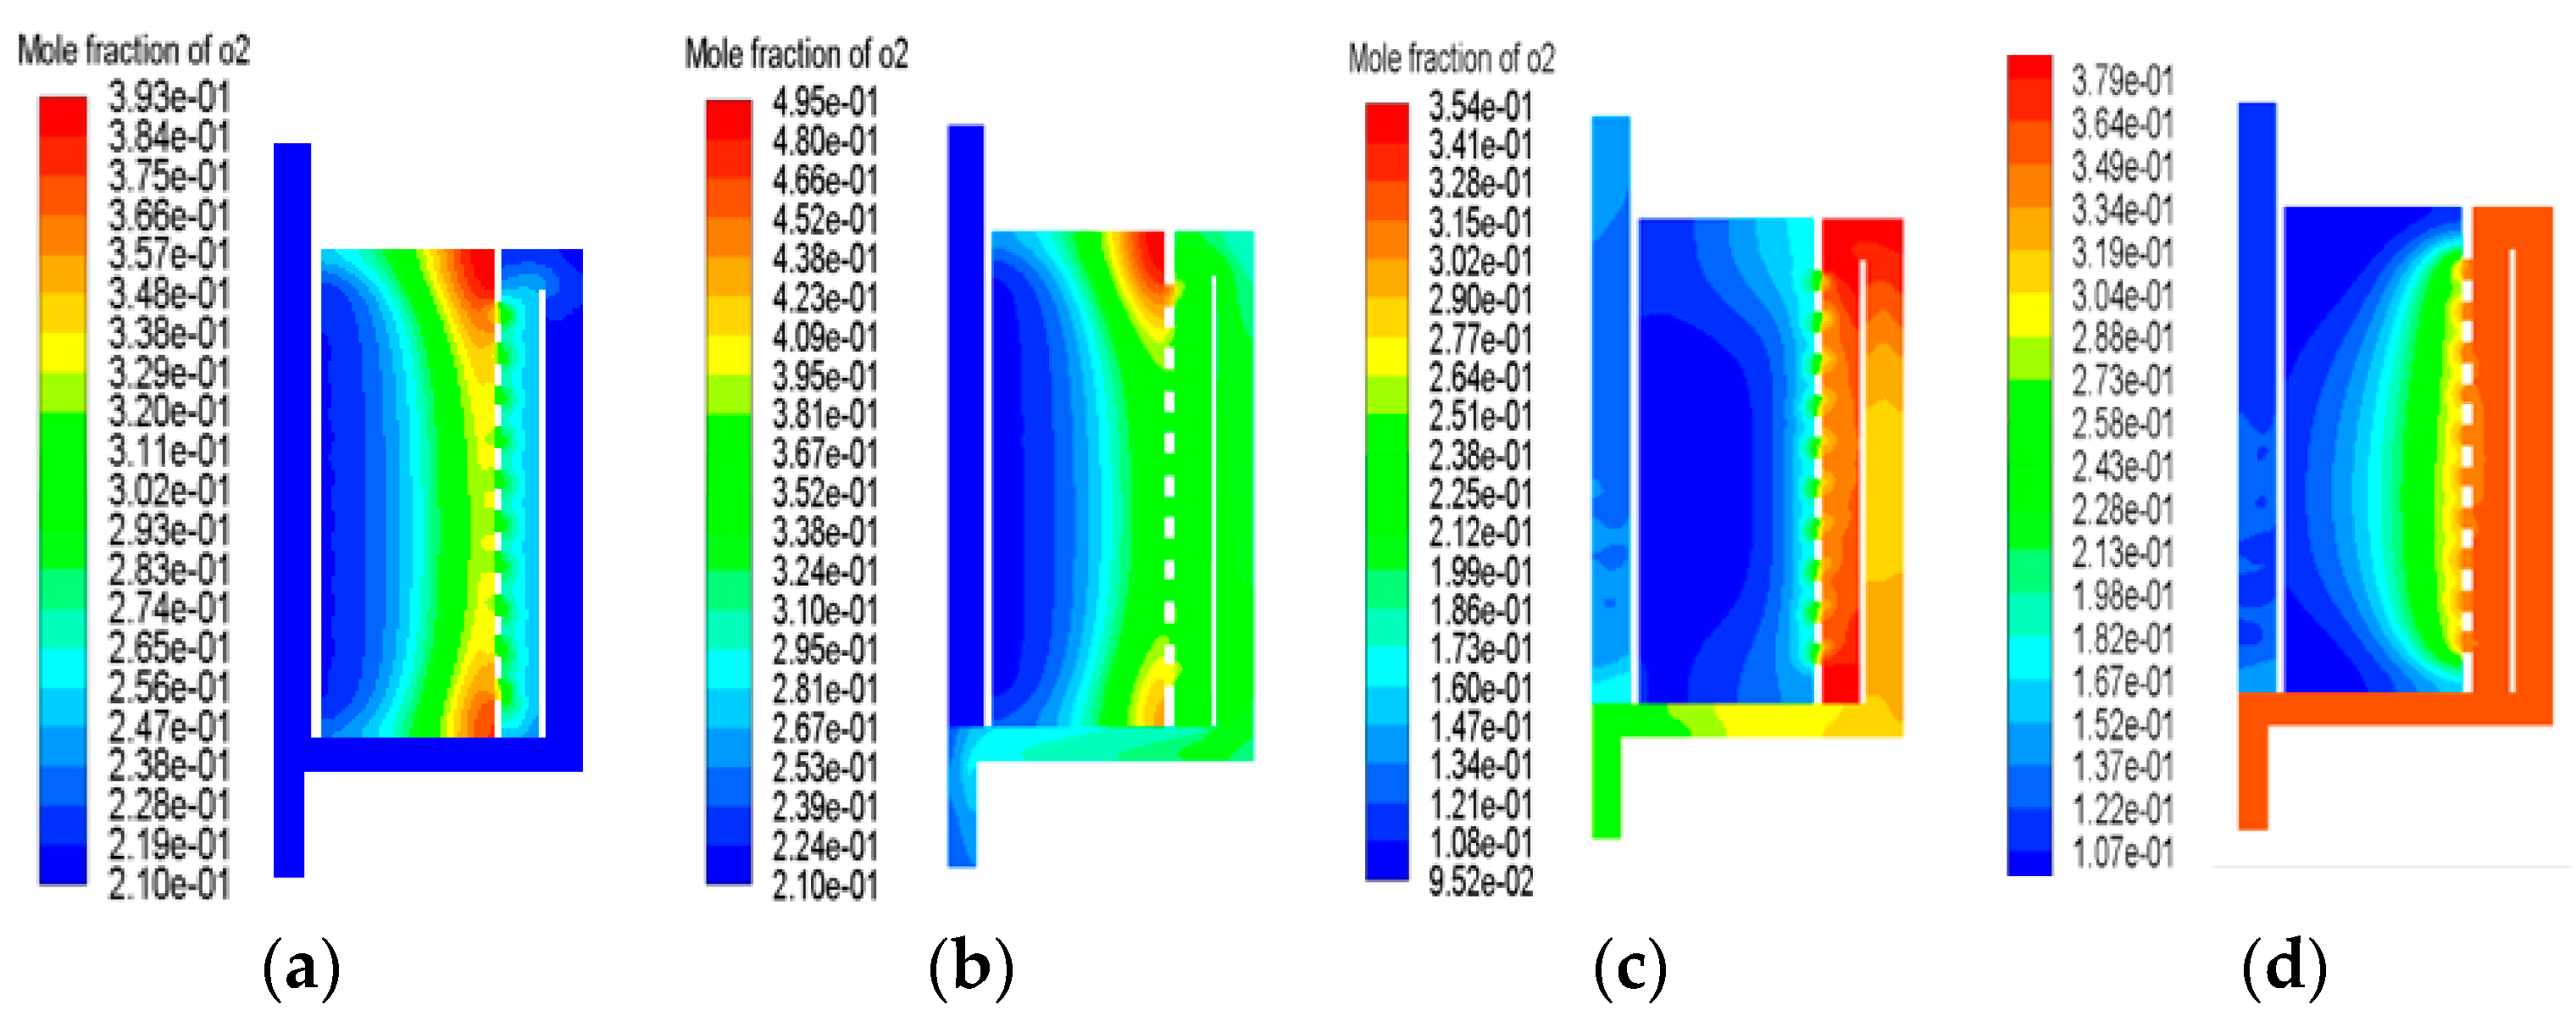
3.2. Comparison of Oxygen Distributions between CP-π and CF-π Adsorbers

Figure 6 shows the distribution of oxygen purity (mole fraction of oxygen on the gas phase) in the adsorbent bed after the first cycle of the PSA oxygen generation in the CP-π adsorber. During the Pr step, the oxygen purity in the bed can reach up to 62.1%. Along the centripetal flow direction, the oxygen purity gradually increased, and the oxygen purity in front of the center area is much closer to the one in the center channel. After the Ad step, the oxygen purity can reach up to 76.5%, demonstrating the enrichment of oxygen. The Cb step leads to the abundant desorption of nitrogen from adsorbents, resulting in decline in oxygen purity to 8.96% at the inlet end of the bed. Owing to the closedown of the center collector pipes, the highest oxygen purity in the adsorber remained at 59%. After the purge process with highly concentrated oxygen, the oxygen purity in the outlet of the bed is about 40%.
Figure 7 shows the distribution of oxygen purity in the adsorbent bed after the first cycle of the PSA oxygen generation in the CF-π adsorber. During the pressurization step, the highest oxygen purity is 39.3% which is closer to the outlet of the adsorbent bed in comparison to the CP-π adsorber. After the Ad step, the highest oxygen purity in the bed is only 49.5%, mainly located at the dead space of the outlet area. The oxygen product concentration can only be enriched to 38%, which is much lower than in the CP-π adsorber. At the end of the Cb step, the oxygen purity in the inlet of the adsorbent bed decreases to 9.52%. After the Pu step, the oxygen purity in the major region is around 10%, indicating that a stronger desorption is needed.
Figure 6 and Figure 7 show that the highest oxygen purity in the bed is remarkably higher for CP-π flow than for CF-π flow. After the Pr step, the mass transfer area in the bed is close to the outlet of the bed for the CF-π adsorber. Nevertheless, for the CP-π adsorber, a larger area of adsorbent bed that is not adsorbed still exists in the outlet of the bed, and the desorption of nitrogen after the Pu step is more complete.
Figure 8a,b show the oxygen purity profiles at the axial center position along with radial length after the first cycle for both adsorbers, which are similar with results from 1-D simulations [22,37] and 2-D axial flow simulations [28]. It is clearly observed that the oxygen purities are all higher in the outlet than in the inlet of the bed. During the Pr and Ad steps, oxygen is enriched along the direction to the outlet of the adsorption bed while during the Cb and Pu steps, an amount of nitrogen desorbed and flowed out of the adsorber. After the Ad and Pu steps, the oxygen purity at the outlet of the adsorption bed of CP-π and CF-π is 66% and 36%, and 45% and 23%, respectively, suggesting a better oxygen enrichment and nitrogen desorption ability of the CP-π adsorber, and thus, more concentrated oxygen can be achieved in the next cycle [1].
The PSA oxygen generation process is a variable mass flow process. The majority of nitrogen in the air is adsorbed by the bed when air flows through the bed, and the flow rate gradually decreases along the flow direction [28]. In the current CP-π adsorber, the cross-sectional area of the inlet is 35 times larger than that of the outlet. This structural setting is favorable for treating the gas with a higher flow rate in the inlet and a lower flow rate in the outlet. During the desorption process, a large cross-sectional area of the inlet channel is effective for the evacuation of the desorbed nitrogen, and thus beneficial for adsorbent bed regeneration. On the contrary, a high flow rate in the inlet corresponds to a narrow cross-sectional area in the CF-π adsorber. Because of the high velocity, it is easy to cause the front edge of the mass transfer zone in the adsorber to move too fast, resulting in early penetration and affecting the oxygen purity of the product in the adsorption process. During the Cb and Pu steps, a narrow outlet channel also negatively affects the evacuation of nitrogen, and causes an incomplete regeneration of adsorbents. It can therefore be concluded that the CP-π flow is much more suitable for PSA oxygen generation when a radial-flow adsorber is employed.

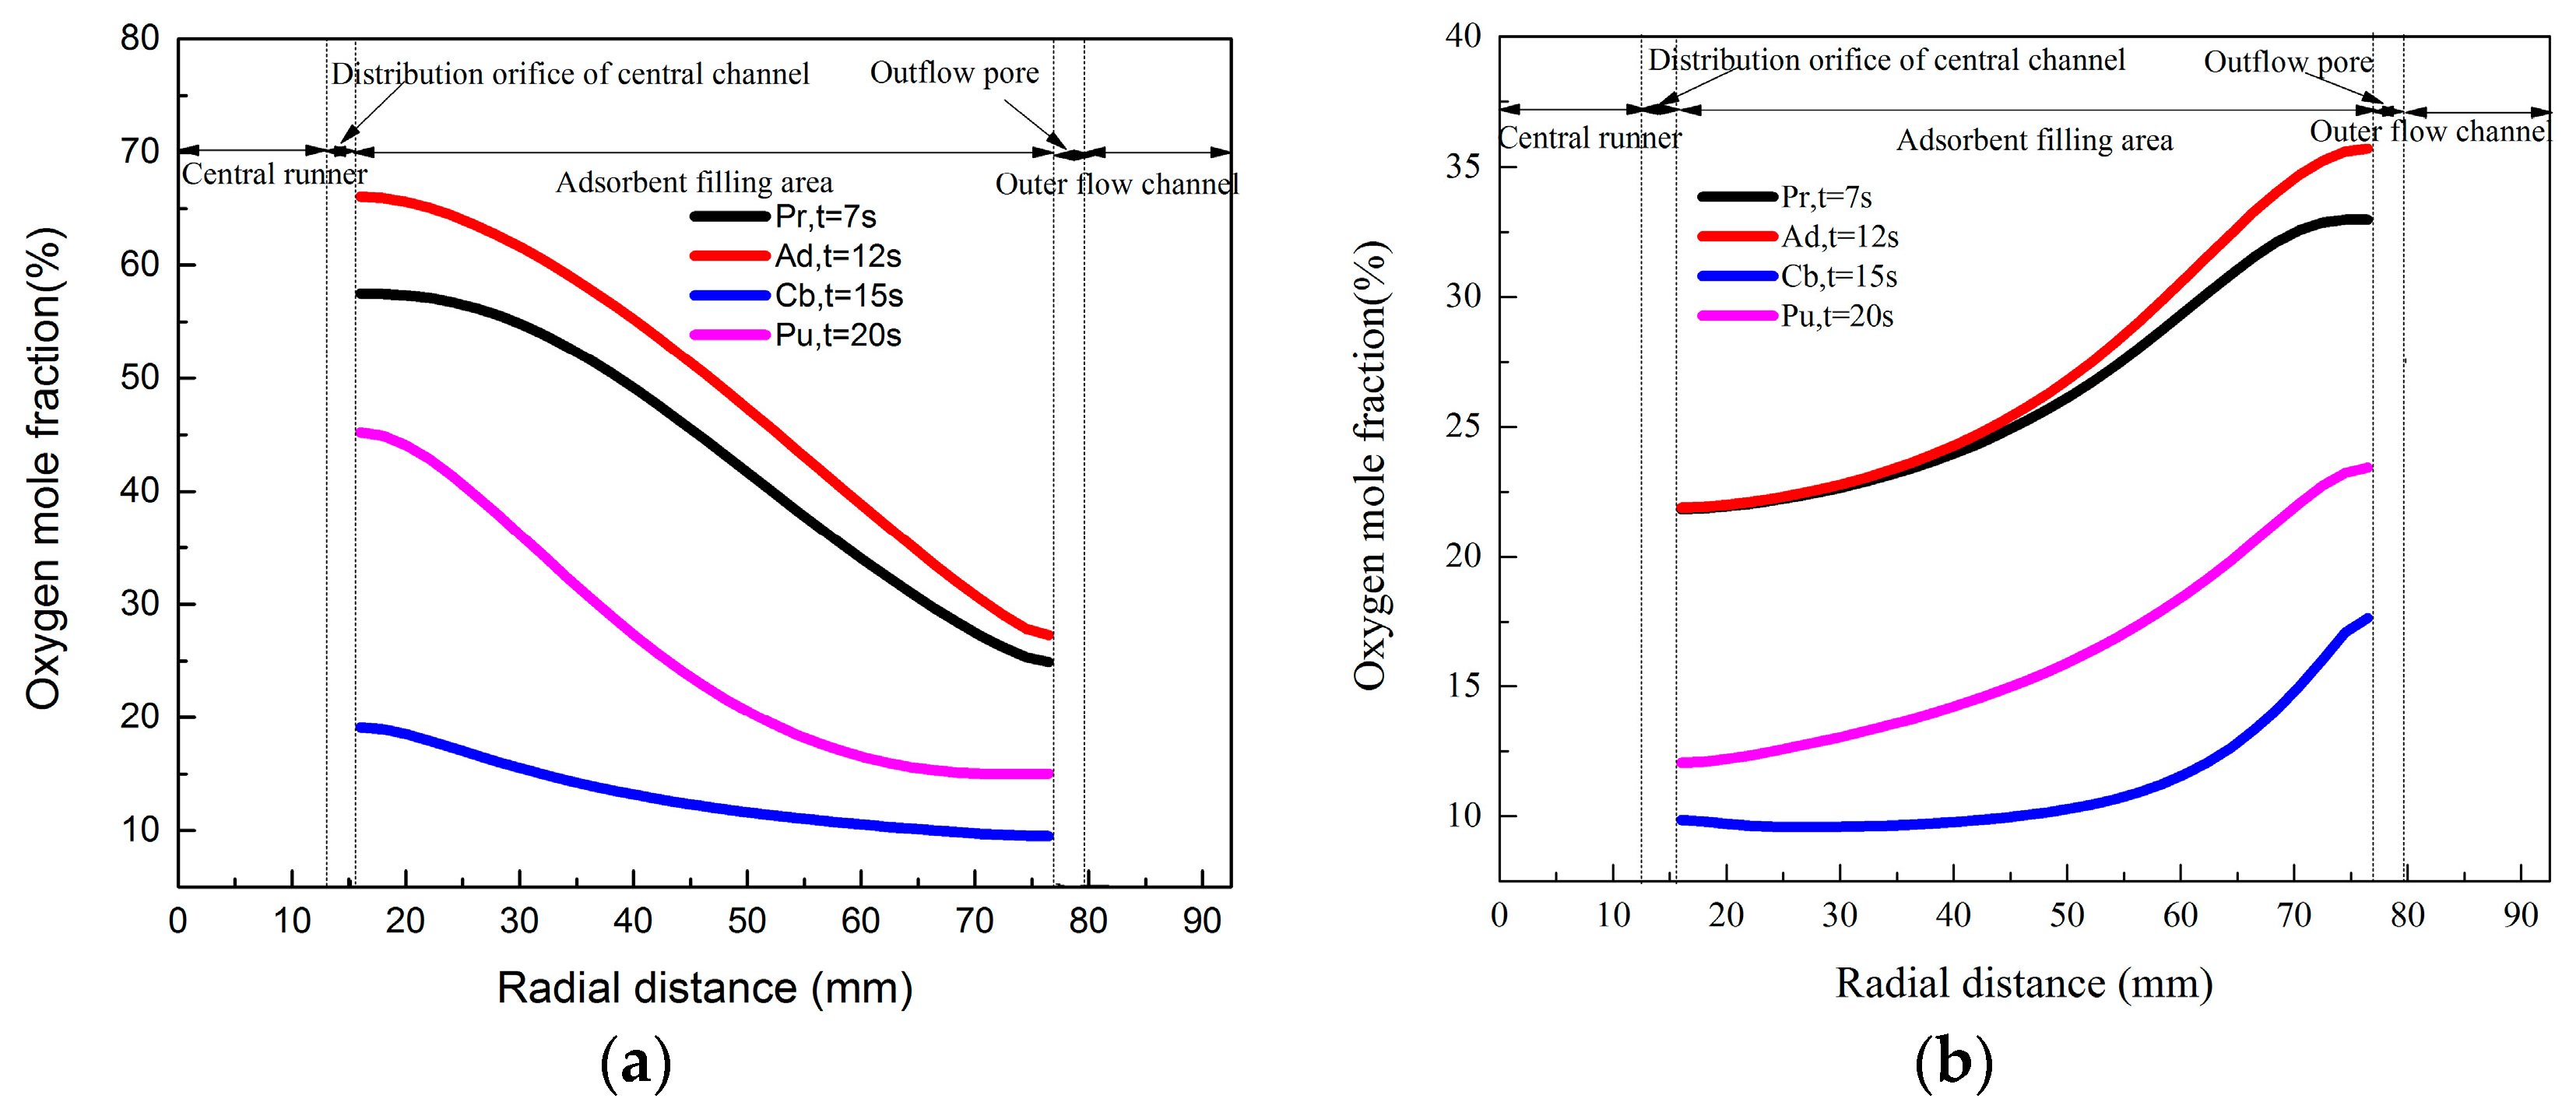
3.3. Oxygen Generation Characteristics of CP-π Adsorber

Figure 9 shows the changes in product oxygen purity and recovery with cycle number for the CP-π adsorber. After the initial cycle, the product purity and recovery significantly increase, from 66% to 98.6% and 29% to 39%, respectively, and level off (steady state) after the 8th cycle.
Figure 10 shows the oxygen distribution at the end of each step in steady state (after the 8th cycle) for the CP-π adsorber. As the adsorption proceeds, the mass transfer area is further shifted to the outlet of the bed, and oxygen purity of 98.6% can be obtained in the outlet after the Ad step. Compared with the Ad step of the first cycle as shown in Figure 6, the oxygen purity is improved and the mass transfer area is compressed. During the Cb step, the pressure in the bed gradually decreases, and the amount of nitrogen desorbed from the bed and flows out from the inlet of the bed, led to the lower oxygen purity in the inlet (12.2%). However, the oxygen purity in the center collector pipes is still as high as 85%. At the end of the Pu step, the oxygen purity in the outlet of the bed can reach up to ~80% with purging by highly concentrated product. In addition, the highest oxygen purity kept in the bed is beneficial to the oxygen generation in the next cycle. Compared to the Pr and Ad steps, the area for oxygen purity variation is broader, and the mass transfer area is longer and more uniform in the Pu step.
Figure 11 shows the oxygen purity profiles at the axial center position at the end of each step in steady state (after the 8th cycle) for the CP-π adsorber. In each step, oxygen purity is lower in the inlet than in the outlet. Oxygen purity increases significantly at the outlet during the Pr step. The mass transfer area is gradually shifted to the outlet of the bed during the Ad step, and highly concentrated oxygen flows out of the adsorption bed. At the Cb step, abundant nitrogen desorbed and flowed out of the bed through the inlet end, leading to significant decrease in oxygen purity in the bed, in which oxygen purity in the inlet and outlet of the bed decrease to 12% and 30%, respectively. At the Pu step, highly concentrated oxygen flowed from the outlet of the bed to the inlet, leading to further desorption of nitrogen, which induced the purity wave shifting to the inlet end. Thus, the oxygen purity in the bed further increased to 28% and 83% for the inlet and outlet, respectively.

3.4. Effect of Product Flow Rate on Oxygen Generation Performance of CP-π Adsorber

The oxygen product flow rate in the outlet end can greatly impact the oxygen generation performance, that is, the product purity and the recovery [34]. Figure 12a shows the variations in the oxygen product purity and the oxygen recovery with product flow rate for the CP-π PSA oxygen generation. The oxygen purity decreases (from 98.6% to 78.5%) and the recovery of the production increases (from 38.72% to 70.18%) with increasing product flow rate (from 0.16 to 0.36 m3 h−1). Under the same conditions, improving the product flow rate requires additional feed gas flow, which further increases the gas velocity and faster movement of the mass transfer area in bed. Meanwhile, due to the unchanged mass transfer coefficient of the adsorbent, the higher product flow rate prolongs the mass transfer area and leads to the increased recovery as well as the lowered maximum oxygen purity. Figure 12b gives the non-recovered oxygen contributions by the Cb and Pu steps. The contribution of the non-recovered oxygen mainly comes from the Cb step; this is because an amount of oxygen with high pressure and concentration remains in the outlet of the bed after the Ad step (as shown on Figure 11). With increases in the product flow rate, the high oxygen purity area moves towards the outlet of the adsorber, and the non-recovered oxygen contributions by Cb decrease.
The recovery and product flow rate simultaneously grow and are very important for selection of the oxygen generator for industrial application. By lowering the requirement for oxygen purity, generating more oxygen in the same equipment can decrease operational costs, lower the scale of the equipment, and thus save the initial investment. For instance, oxygen purity of 80% can meet a lot of industrial requirements [25].
The modeling results show that when the oxygen purity is lowered from 98% to 80% at a product flow rate from 0.16 m3 h−1 to 0.35 m3 h−1, the total amount of generated oxygen increases by 2.19 times due to the significant rise in recovery from 38.7% to 67%. Therefore, based on a constant demand, e.g., 100 m³/h, for the total amount of generated oxygen in a certain application, the feed flow rate derived from Equation (13) could be reduced by ~40% from 1230 m³ h−1 to 711 m³ h−1. Finally, ~40% of the energy consumption proportional to the feed flow rate of the compressor could be saved, which is a benefit of the process adjustment according to the simulation results.

4. Conclusions

CFD modeling was performed for the numerical simulation of the two-dimensional radial-flow PSA oxygen generation process. The gas distributions and pressure differences were investigated at different flow types, and the results indicated that the CP-π-typed adsorber renders better flow characteristics for PSA oxygen generation. A comparative study between centripetal and centrifugal π-flow types was carried out based on the first PSA cycle. The centripetal flow exhibited a much better performance on oxygen enrichment and adsorbent desorption. The steady state was reached after 8 cycles, and the product oxygen purity and recovery were 98.6% and 38.9%, respectively, at a product flow rate of 0.16 m3 h−1. By increasing the product flow rate from 0.16 m3 h−1 to 0.35 m3 h−1, the amount of generated oxygen increased by 2.19 times while the oxygen purity decreased from 98.6% to 80%. Lowering the oxygen purity can significantly save energy consumption if oxygen with a medium purity can meet practical requirements.

Author Contributions

Conceptualization, X.Y. and H.W.; methodology, H.W., J.C., C.Z. and Z.L.; writing, X.Y., and Z.L.; project administration, Y.L. and Y.X.

Funding

This research was funded by the National Natural Science Foundation of China (51604016, 21808012, 21676025), National Key R&D Program of China (No. 2017YFC0806304), Beijing Natural Science Foundation (No. 8182019), the National Postdoctoral Program for Innovative Talents (No. BX201700029), the China Postdoctoral Science Foundation (No. 2018M630075), the Fundamental Research Funds for the Central Universities (No. FRF-TP-17-063A1, FRF-BD-18-015A).

Conflicts of Interest

The authors declare no conflict of interest.

References

  1. Fan, M.H.; Panezai, H.; Sun, J.H.; Bai, S.; Wu, X.B. Thermal and kinetic performance of water desorption for N2 adsorption in Li-LSX zeolite. J. Phys. Chem. C 2014, 118, 23761–23767. [Google Scholar] [CrossRef]
  2. Ruthven, D.M.; Farooq, S.; Knaebel, K.S. Pressure Swing Adsorption; VCH Publishers: New York, NY, USA, 1994. [Google Scholar]
  3. Smolarek, J.; Leavitt, F.W.; Nowobilski, J.J.; Bergsten, V.E.; Fassbaugh, J.H. Radial Bed Vaccum/Pressure Swing Adsorber Vessel. U.S. Patent 5,759,242, 2 June 1998. [Google Scholar]
  4. Chiang, A.S.T.; Hong, M.C. Radial flow rapid pressure swing adsorption. Adsorption 1995, 1, 153–164. [Google Scholar] [CrossRef]
  5. Huang, W.C.; Chou, C. Comparison of radial-and axial-flow rapid pressure swing adsorption processes. Ind. Eng. Chem. Res. 2003, 42, 1998–2006. [Google Scholar] [CrossRef]
  6. Dai, Z.; Yu, M.; Rui, D.; Zhang, X.; Zhao, Y. Investigation on a vertical radial flow adsorber designed by a novel parallel connection method. Chin. J. Chem. Eng. 2018, 26, 484–493. [Google Scholar] [CrossRef]
  7. Tian, Q.; He, G.; Wang, Z.; Cai, D.; Chen, L. A novel radial adsorber with parallel layered beds for prepurification of large-scale air separation units. Ind. Eng. Chem. Res. 2015, 54, 7502–7515. [Google Scholar] [CrossRef]
  8. LaCava, A.I.; Shirley, A.I.; Ramachandran, R. How to specify pressure-swing adsorption units. Chem. Eng. 1998, 105, 110–118. [Google Scholar]
  9. Genkin, V.S.; Dilman, V.V.; Sergeev, S.P. Distribution of a gas stream over height of a catalyst bed in a radial contact apparatus. Int. Chem. Eng. 1973, 13, 24–28. [Google Scholar]
  10. Balakotaiah, V.; Luss, D. Effect of Flow Direction on Conversion in Isothermal Radial Flow-Bed Reactors. AIChE J. 1981, 27, 442–450. [Google Scholar] [CrossRef]
  11. Ponzi, P.R.; Kaye, L.A. Effects of Flow Maldistribution on Conversion and Selectivity in Radial Flow Fixed-Bed Reactors. AIChE J. 1979, 25, 100–108. [Google Scholar] [CrossRef]
  12. Bolton, G.T.; Hooper, C.W.; Mann, R.; Stitt, E.H. Flow distribution and velocity measurement in a radial flow fixed bed reactor using electrical resistance tomography. Chem. Eng. Sci. 2004, 59, 1989–1997. [Google Scholar] [CrossRef]
  13. Smolarek, J.; Nowobilskj, J.J.; Ackley, M.W. Bed Restraint for an Adsorber. U.S Patent 6334889 B1, 1 September 2002. [Google Scholar]
  14. Celik, C.E.; Smolarek, J. Radial Bed Flow Distributor for Radial Pressure Adsorber Vessel. U.S. Patent 7,128,775, 12 April 2004. [Google Scholar]
  15. Kareeri, A.A.; Zughbi, H.D.; Al-Ali, H.H. Simulation of flow distribution in radial flow reactors. Ind. Eng. Chem. Res. 2006, 45, 2862–2874. [Google Scholar] [CrossRef]
  16. Song, X.; Wang, Z.; Jin, Y.; Gong, M. Investigations on Hydrodynamics of Radial Flow Moving Bed Reactors. Chem. Eng. Technol. 1993, 16, 383. [Google Scholar] [CrossRef]
  17. Heggs, P.J.; Ellis, D.I.; Ismail, M.S. The Modeling of Fluid-Flow Distributions in annular Packed Beds. Gas Sep. Purif. 1994, 8, 257. [Google Scholar] [CrossRef]
  18. Li, R.; Zhu, Z. Investigations on hydrodynamics of multilayer Π-type radial flow reactors. Asia-Pac. J. Chem. Eng. 2012, 7, 517–527. [Google Scholar] [CrossRef]
  19. Zhang, X.; Lu, J.; Qiu, L.; Zhang, X.; Wang, X. A mathematical model for designing optimal shape for the cone used in z-flow type radial flow adsorbers. Chin. J. Chem. Eng. 2013, 21, 494–499. [Google Scholar] [CrossRef]
  20. Hamedi, N.; Tohidian, T.; Rahimpour, M.R.; Iranshahi, D.; Raeissi, S. Conversion enhancement of heavy reformates into xylenes by optimal design of a novel radial flow packed bed reactor, applying a detailed kinetic model. Chem. Eng. Res. Des. 2015, 95, 317–336. [Google Scholar] [CrossRef]
  21. Wang, H.; Liu, Y.; Meng, Y. Effect of the gas distribution system structure of a radial flow adsorber on gas distribution. Chin. J. Eng. 2015, 37, 91–96. [Google Scholar] [CrossRef]
  22. Yang, R.T. Gas Separation by Adsorption Processes; Imperial College Press: London, UK, 1997. [Google Scholar]
  23. Yang, X.; Epiepang, F.E.; Li, J.; Wei, Y.; Liu, Y.; Yang, R.T. Sr-LSX zeolite for air separation. Chem. Eng. J. 2019, 362, 482–486. [Google Scholar] [CrossRef]
  24. Epiepang, F.E.; Yang, X.; Li, J.; Liu, Y.; Yang, R.T. Mixed-cation LiCa-LSX zeolite with minimum lithium for air separation. AIChE J. 2018, 64, 406–415. [Google Scholar] [CrossRef]
  25. Zhu, X.; Liu, Y.; Yang, X.; Liu, W. Study of a novel rapid vacuum pressure swing adsorption process with intermediate gas pressurization for producing oxygen. Adsorption 2017, 23, 175–184. [Google Scholar] [CrossRef]
  26. Ding, Z.; Han, Z.; Fu, Q.; Shen, Y.; Tian, C.; Zhang, D. Optimization and analysis of the VPSA process for industrial-scale oxygen production. Adsorption 2018, 24, 1–18. [Google Scholar] [CrossRef]
  27. Liu, Y.; Zheng, X.; Dai, R. Numerical study of flow maldistribution and depressurization strategies in a small-scale axial adsorber. Adsorption 2014, 20, 757–768. [Google Scholar] [CrossRef]
  28. Zheng, X.; Liu, Y.; Liu, W. Two-dimensional modeling of the transport phenomena in the adsorber during pressure swing adsorption process. Ind. Eng. Chem. Res. 2010, 49, 11814–11824. [Google Scholar] [CrossRef]
  29. Ergun, S. Fluid Flow through Packed Columns. Chem. Eng. Prog. 1952, 48, 89. [Google Scholar]
  30. Li, Z.; Liu, Y.; Wang, H.; Tsai, C.J.; Yang, X.; Xing, Y.; Zhang, C.; Xiao, P.; Webley, P.A. A numerical modelling study of SO2 adsorption on activated carbons with new rate equations. Chem. Eng. J. 2018, 353, 858–866. [Google Scholar] [CrossRef]
  31. Li, G.; Xiao, P.; Zhang, J.; Webley, P.A.; Xu, D. The role of water on postcombustion CO2 capture by vacuum swing adsorption: Bed layering and purge to feed ratio. AIChE J. 2014, 60, 673–689. [Google Scholar] [CrossRef]
  32. Sun, L.M.; Amar, N.B.; Meunier, F. Numerical Study on Coupled Heat and Mass Transfers in an Adsorber with External Fluid Heating. Heat. Revov. Syst. 1995, 15, 19. [Google Scholar] [CrossRef]
  33. Prakash, M.J.; Madhu, P.; Srinivasan, K. Modeling of Thermal Conductivity of Charcoal-Nitrogen Adsorption Beds. Carbon 2000, 38, 907. [Google Scholar] [CrossRef]
  34. Rege, S.U.; Yang, R.T. Limits for Separation by Adsorption with LiX Zeolite. Ind. Eng. Chem. Res. 1997, 36, 5358. [Google Scholar] [CrossRef]
  35. Chahbani, M.H.; Tondeur, D. Pressure Drop in Fixed-Bed Adsorbers. Chem. Eng. J. 2001, 81, 23. [Google Scholar] [CrossRef]
  36. Zheng, T.; Du, Z.; Cao, H.; Jiang, J.; Zheng, W.; Tang, S.; Wang, N.; Wang, P. Development of a novel mobile industrial-scale fluidized adsorption process for emergency treatment of water polluted by aniline: CFD simulation and experiments. Adv. Powder Technol. 2016, 27, 1576–1587. [Google Scholar] [CrossRef]
  37. Serbezov, A.; Sotirchos, S.V. Particle-Bed Model for Multicomponent Adsorption-Based Separations: Application to Pressure Swing Adsorption. Chem. Eng. Sci. 1999, 54, 5647. [Google Scholar] [CrossRef]
Figure 1. Models of radial-flow adsorbers: (a) CP-Z flow; (b) CF-Z flow; (c) CP-π flow; (d) CF-π flow; (e) the model of the 1/4 sector radial-flow adsorber; (f) schematic of radial-flow adsorbers.
Applsci 09 01153 g001
Figure 2. Schematic diagram of the Skarstrom cycle.
Applsci 09 01153 g002
Figure 3. Pressure changes in the outer flow channels of radial-flow adsorbers in a stabilized cycle.
Applsci 09 01153 g003
Figure 4. Variations of maldistribution factor integrating the surface and corresponding velocity (Mf) along with adsorption bed radial length at Ad step in each adsorber.
Applsci 09 01153 g004
Figure 5. Variations in the pressure differences between center and outer channels along with axial lengths of CP-π and CP-Z adsorbers at the Pu step.
Applsci 09 01153 g005
Figure 6. Oxygen distribution in the CP-π adsorber at the end of steps (a) Pr, (b) Ad, (c) Cb, and (d) Pu.
Applsci 09 01153 g006
Figure 7. Oxygen distribution in the CF-π adsorber at the end of steps (a) Pr, (b) Ad, (c) Cb, and (d) Pu.
Applsci 09 01153 g007
Figure 8. Comparison of axial O2 purity profiles at the end of the 4 steps of the first cycle at the axial center position; (a) CP-π radial-flow adsorber (b) CF-π radial-flow adsorber.
Applsci 09 01153 g008
Figure 9. Changes in oxygen product purity and recovery with cycle number for the CP-π adsorber.
Applsci 09 01153 g009
Figure 10. Oxygen distribution in steady state (after the 8th cycle) for the CP-π adsorber at the end of each step: (a) Pr, (b) Ad, (c) Cb, and (d) Pu.
Applsci 09 01153 g010
Figure 11. Oxygen purity profiles at the axial center position at the end of each step in steady state (after the 8th cycle) for the CP-π adsorber.
Applsci 09 01153 g011
Figure 12. Effect of product flow rate on separation effect; (a) effect of product flow rate on oxygen product purity and recovery, (b) effect of product flow rate on non-recovered oxygen contributions on Cb and Pu step.
Applsci 09 01153 g012
Table 1. Structure parameters of the adsorbers.
Structure ParametersValuesStructure ParametersValues
Diameter of adsorber/m219Sorbent filling height/mm187
Inner diameter of the adsorber/m211Diameter of outer distribution hole/mm8
Outer diameter of sorbent layer/m153Opening ratio of outer distribution cylinder %3.6
Diameter of inner flow channel/m26Diameter of inner distribution hole/mm2
Wall thickness of distribution tube/mm3Opening ratio of inner distribution cylinder %24.5
Table 2. Adsorption isotherm parameters.
Sorbatek1 (mol·kg−1·Pa−1)k2 (K)k3 (Pa−1)k4 (K)ΔH (kJ mol−1)
O27.87 × 10−91541.2116.79 × 10−101968.2412
N29.86 × 10−92010.9081.67 × 10−9225018
Table 3. The cyclic sequence time and boundary conditions for simulation.
ItemsPr StepAd StepCb StepPu Step
Duration (s)7535
Boundary Conditions for bed 1
Entrancemass-flow-inletmass-flow-inletpressure-outletpressure-outlet
Ventwallpressure-outletwallmass-flow-inlet
Adsorber wallwallwallwallwall
Adsorber axisaxisaxisaxisaxis
Table 4. Initial conditions for simulation.
ParameterValueUnit
Gas composition21% O2, 79% N2-
Pressure101325Pa
Temperature298K
Amount of O2 adsorbed per unit mass of sorbent0.0262832mol/kg
Amount of N2 adsorbed per unit mass of sorbent0.6328067mol/kg
Table 5. Model parameters.
AdsorbentLiX zeolite (CECA-G5000)
Typesphere
Particle density, ρp(kg·m−3)1035
Radius, rp(mm)0.8
Thermal conductivity, keff (W m−2 K)0.2 [32,33]
Heat capacity of pellet, Cp (J.kg−1 K−1)1010 [34,35]
Adsorption bed
Bed external porosity, ε0.4
Dispersion coefficient, D (m2 s−1)5 × 10⁻⁵ [28]
LDF constant for oxygen, kO2 (s−1)62.0 [1]
LDF constant for nitrogen, kN2(s−1)19.7 [1]
Ambient temperature, (K)298
Feed
Feed composition21% O2, 79% N2
Feed gas temperature, (K)298

