Experimental and Theoretical Study on the Heat Transfer Coefficients of Building External Surfaces in the Tropical Island Region

Key Laboratory of Green Built Environment and Energy Efficient Technology, Beijing, Beijing University of Technology, Beijing 100124, China
*
Author to whom correspondence should be addressed.
Appl. Sci. 2019, 9(6), 1063; https://doi.org/10.3390/app9061063
Submission received: 9 January 2019
/
Revised: 7 March 2019
/
Accepted: 8 March 2019
/
Published: 13 March 2019
(This article belongs to the Special Issue Heat and Mass Transfer: Fundamentals and Applications in Thermal Energy)
Abstract
:China is actively promoting ocean territory construction, and how to design low-energy buildings to fit the unique climate of tropical island regions has received much attention. The heat transfer coefficient of a building external surface plays a vital role in calculating air-conditioning load accurately. To obtain reasonable heat transfer coefficients in the tropical island region, this study introduced a naphthalene sublimation experiment to conduct full-scale measurements on convective heat transfer coefficients (CHTCs) in the tropical island region, and proposed a simplified calculation model of evaporative heat transfer coefficients (EHTCs). Results indicated that the function expression between CHTC and wind speed was CHTC = 5.56 + 4.48u (R2 = 0.94), and it was validated to be reliable. Furthermore, compared with CHTCs and radiation heat transfer coefficients (RHTCs), the EHTC had a wider changing range, owing to rainfall effects. Moreover, whether evaporation was considered or not, the difference of total heat transfer coefficients (THTCs) on building external surfaces was 5.2 W/(m2·K) for the whole year, so evaporation cannot be ignored directly. Additionally, THTCs with consideration of evaporation in winter and summer were 33.4 W/(m2·K) and 38.9 W/(m2·K) severally, which are much larger than the recommended values in the Chinese standard. This study would make up for the lack of surface heat transfer coefficients in energy conservation design of tropical island buildings.
1. Introduction
During the past 50 years, tropical island building construction in the South China Sea has been faced with two problems: Extremely scarce conventional building materials and very difficult energy supply. Nowadays, China is energetically advocating the strategy of land–sea integration and promoting ocean territory construction. Thus, studying building energy conservation in tropical island regions is urgently imperative [1,2,3]. However, on the one hand, compared with the Chinese inland area, the climate in the tropical island region situated in the South China Sea is exceedingly different, reflected in high temperatures, high humidity, intense radiation, high wind speeds, and strong rainfall etc. On the other hand, the current energy efficiency design standard performed in China is aimed at inland climates. Therefore, some design parameters in the current standard are not applicable for tropical island regions.
Heat transfer coefficients of building external surfaces play a vitally important role in estimating building thermal load accurately, and some research has shown that the predicted energy loss might change from 20% to 40% depending on different values of the convective heat transfer coefficient (CHTC) in the literature [4], and a 15% uncertainty in CHTC can bring about a corresponding 15%–20% uncertainty of heat flow through building envelope [5]. However, the current national code [6] has certain limitations on the regulation of heat transfer coefficients. Firstly, the total heat transfer coefficient (THTC) of a building external surface is stipulated as a constant, for example, 23.0 W/(m2·K) in winter and 19.0 W/(m2·K) in summer. Secondly, the THTC only includes two parts: CHTC and radiation heat transfer coefficient (RHTC). Envelope surfaces are assumed to be dry all the time and the evaporative heat transfer coefficient of a building external surface (EHTC) is ignored. Based on the analysis above, it is extremely necessary to survey the reasonable values of heat transfer coefficients, making up for the lack of surface heat transfer coefficients in energy conservation design of tropical island buildings. In the past work, a large number of studies aimed at determining more reliable CHTCs have been performed, owing to the complexity of convective heat transfer. One of the earliest experimental investigations on CHTC was that of Jurges, and this work was conducted in a wind tunnel. Finally, CHTC was expressed as a linear relation or exponential form of wind speed, which is still cited by many references widely [7]. Similarly, Zhang [8], Yun [9], and Montazeri [10] also measured CHTCs on a structure surface in a wind tunnel laboratory. However, although experimental conditions in a wind tunnel could be controlled easily, it cannot produce a real enough outdoor environment [11,12], bringing about deviation for experimental results. Hence, it is a better choice to conduct full-scale measurements, and a large number of full-scale measurements on CHTC have been conducted in the past studies. Jayamaha et al. [13] investigated the influences of solar radiation, wind speed, and temperature difference between wall surfaces and ambient air on CHTC, and found that CHTC would not follow the variation mode of solar radiation and temperature differences, but was directly related to wind speed. Sharple et al. [14] tested the CHTCs of slanting housetops by heating plates in natural environments, and linked wind speeds and CHTCs on the windward or leeward sides. Hagishima and Tanimoto [15,16] performed lots of outdoor experiments by the heat balance method and gave the correlation between wind velocity and CHTC, which considered the turbulent effect. Liu and Harris [17] measured the CHTC on the surface of a low-storied building in shelter circumstances, and obtained various relational expressions between CHTCs and wind speeds. Furthermore, some similar full-scale measurements were performed in other studies [18,19,20,21,22]. In addition, Palyvos [23], Defraeye [24], and Mirsadeghi [25] summarized the existing correlations between CHTC and wind speed in the literature. However, there are two main problems for the full-scale measurements mentioned above: Firstly, the climatic environment, experimental conditions, and operations were respectively different in the processes of obtaining the correlations, leading to CHTCs under the same wind speed being very dissimilar. Thus, these CHTC predictive formulas, which were surveyed in specific environment conditions, cannot be commonly used in the tropical island region. Secondly, the heat balance method was used universally in the field measurements above, and it is an indirect test method involving many experimental instruments. Furthermore, the difference value of temperature between ambient air and the envelope surface is required to be more than 15 °C. Comparatively speaking, the heat–mass transfer analogy method is a direct test, without having to measure the envelope surface heat transfer and solar radiation. As a result, this method uses less instruments, which could reduce cumulative errors and improve ease of operation, helping to solve the difficulties of discommodious traffic and harsh experiment conditions in tropical island regions properly. Recently, Shao et al. [26,27] exploited a novel method based on the analogy theory of heat and mass transfer, and performed a full-scale measurement of CHTC. Moreover, the feasibility of this method was validated by contrasting with the heat balance method aimed at the same building in an identical test environment. Thus, according to the foregoing literature survey, to obtain a reasonable value of CHTC, a full-scale measurement based on the theory of heat–mass transfer analogy in the tropical island region would likely be a very effective attempt.
There were few reports on either experimental or theoretical aspects of EHTCs. Sodha et al. [28,29] carried out relevant exploration on the relationship between EHTC and CHTC in the late 1970s and early 1980s. Meng et al. [30] proved the general relationship of EHTC and CHTC on a wet surface based on the Lewis criterion, and found that EHTC was largely affected by wind speed. Chen [31] investigated the heat transfer coefficients on dry or wet building surfaces in three Chinese cities, and found that the heat transfer coefficients on wet surfaces were obviously larger than those on dry surfaces. Liu et al. [32] also drew a similar conclusion that evaporation on building surfaces affects total heat transfer coefficient size. Through these scanty studies on EHTC, we knew that the strong wind and heavy rainfall in tropical island regions would work together to make EHTC large. Considering the weather features with abundant wind and rain in tropical island regions, if the envelope surfaces are still treated as dry and evaporation is ignored, there would probably be large deviations for THTCs. Therefore, the degree of influence of EHTC on THTC needs to be discussed, and THTC would be more reasonable if EHTC was added for tropical island regions.
In this study, a naphthalene sublimation experiment based on heat–mass transfer analogy was adopted to conduct a full-scale measurement of CHTC in the tropical island region, and a simplified calculation model of EHTC was put forward. Subsequently, a statistical analysis was performed to explore the changing conditions of heat transfer coefficients, wind speeds, and rain hours at different times. Finally, the paper discussed the degree of influence of EHTC on THTC, indicating that EHTC cannot be directly ignored for tropical island buildings, and a comparison between research results and China’s standard regarding THTCs was made. This study makes up for the lack of surface heat transfer coefficients in energy conservation design of tropical island buildings, improving the calculation accuracy of air-conditioning loads in tropical island regions.
2. Methods
In this study, heat transfer coefficients of building external surfaces in the tropical island region were respectively obtained by following methods:
- (a)
- For CHTC, field measurements based on a naphthalene sublimation experiment were conducted in the tropical island region.
- (b)
- By combing the RHTC calculation theory with the annual average temperature in Xisha, the RHTC in the tropical island region was determined.
- (c)
- By considering the difficult point that the occurrence of rainfall and evaporation heat transfer does not exactly correspond in real time, a simplified calculation model of daily average EHTC was put forward.
2.1. Naphthalene Sublimation Experiment
2.1.1. Experiment Principle
Based on the analogy theory of heat and mass transfer, the naphthalene sublimation method was explored. Since the governing equation of the heat and mass transfer process was similar, the results of mass transfer for naphthalene were applicable for the heat transfer process [33]. Research work has demonstrated that the mechanism of heat–mass transfer is analogous when liquid flows through the surface of a solid body, and the empirical relations are often described as below [34]:
where the definition of the Nusselt number is Nu = hcl/λ, the definition of the Reynolds number is Re = ul/ν, the definition of the Prandtl number is Pr = ν/a, the definition of the Sherwood number is Sh = hdl/D, the definition of the Schmidt number is Sc = ν/D, and the definition of the Lewis number is Le = Sc/Pr.
According to the definitions of the dimensionless numbers above, the following correlation can be acquired:
where n is a constant value determined by the empirical results, and has been found to be in the range of 1/3–0.4 depending on the flow conditions through the past studies [35]. It has been determined to be 0.4 under the condition of turbulent flow surrounding the buildings in this study.
hd can be given by:
where ρv,∞ is the vapor density of naphthalene in free-flowing air (kg/m3) and is regarded as 0, and ρv,s is the saturated vapor density on the test specimen surface (kg/m3), which is expressed as below:
where Pv,s is the saturated vapor pressure on the test specimen surface (Pa) and it can be reckoned in the light of the empirical relation recommended by Ambrose [37].
On the condition that atmospheric pressure correction is not considered, then the calculation formula of convective heat transfer coefficient is as follows:
Thus, based on the principle analysis of the naphthalene sublimation experiment, it can be found that the convective heat transfer coefficient can be obtained by measuring Ta, Ts, δm, and δt.
2.1.2. Experiment Instruments or Devices
The experimental instruments or devices used in the field measurement are presented in Figure 1.
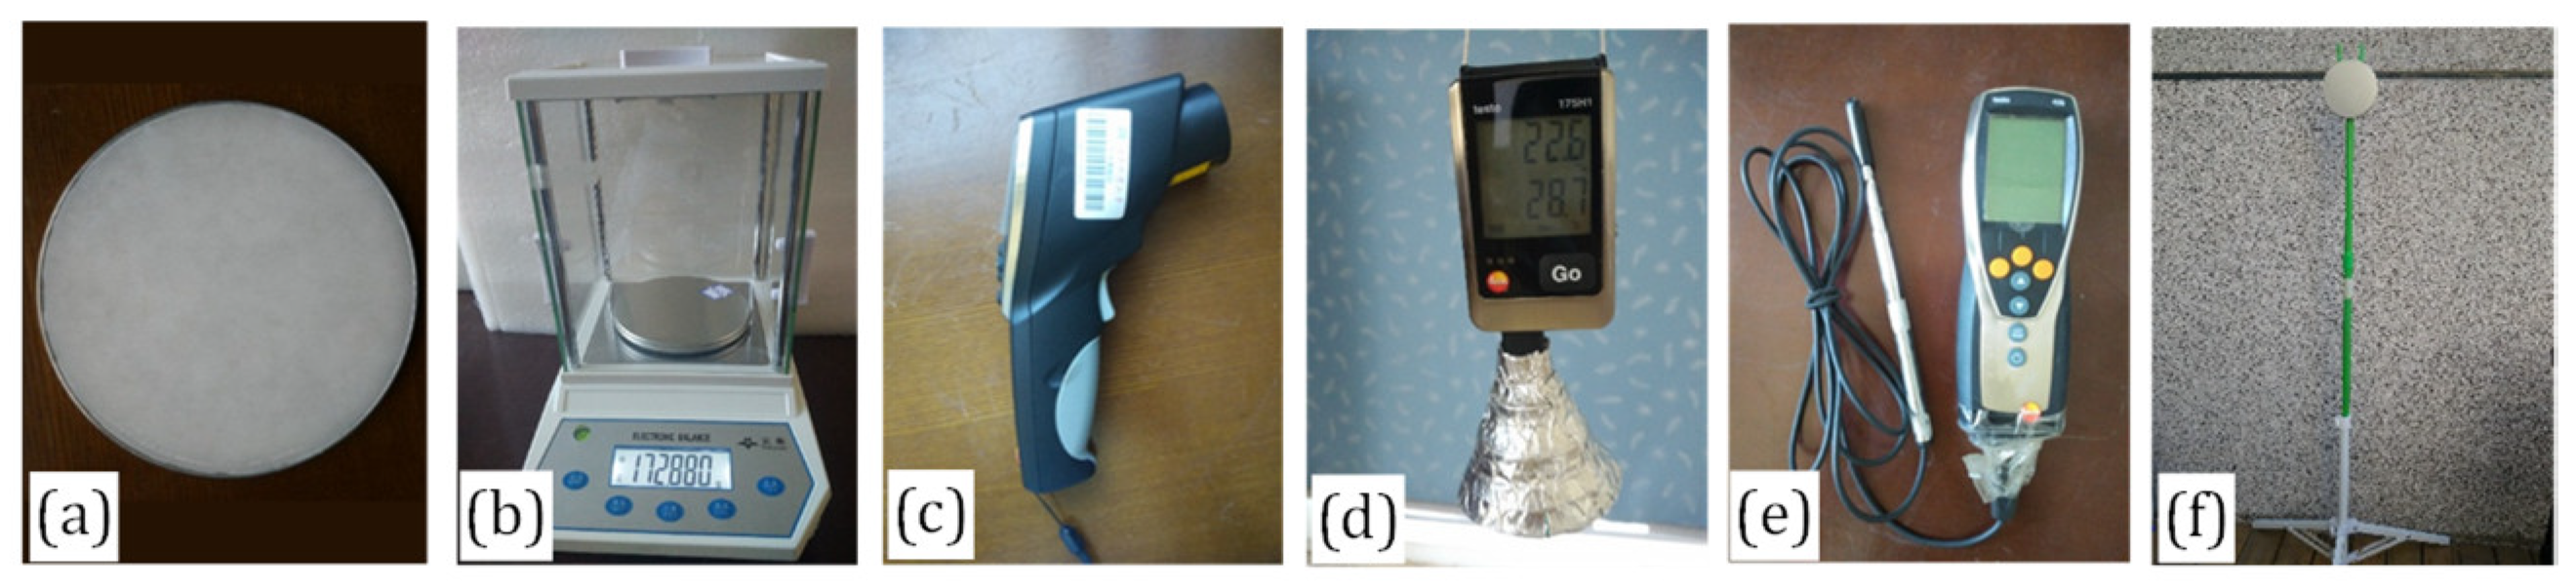
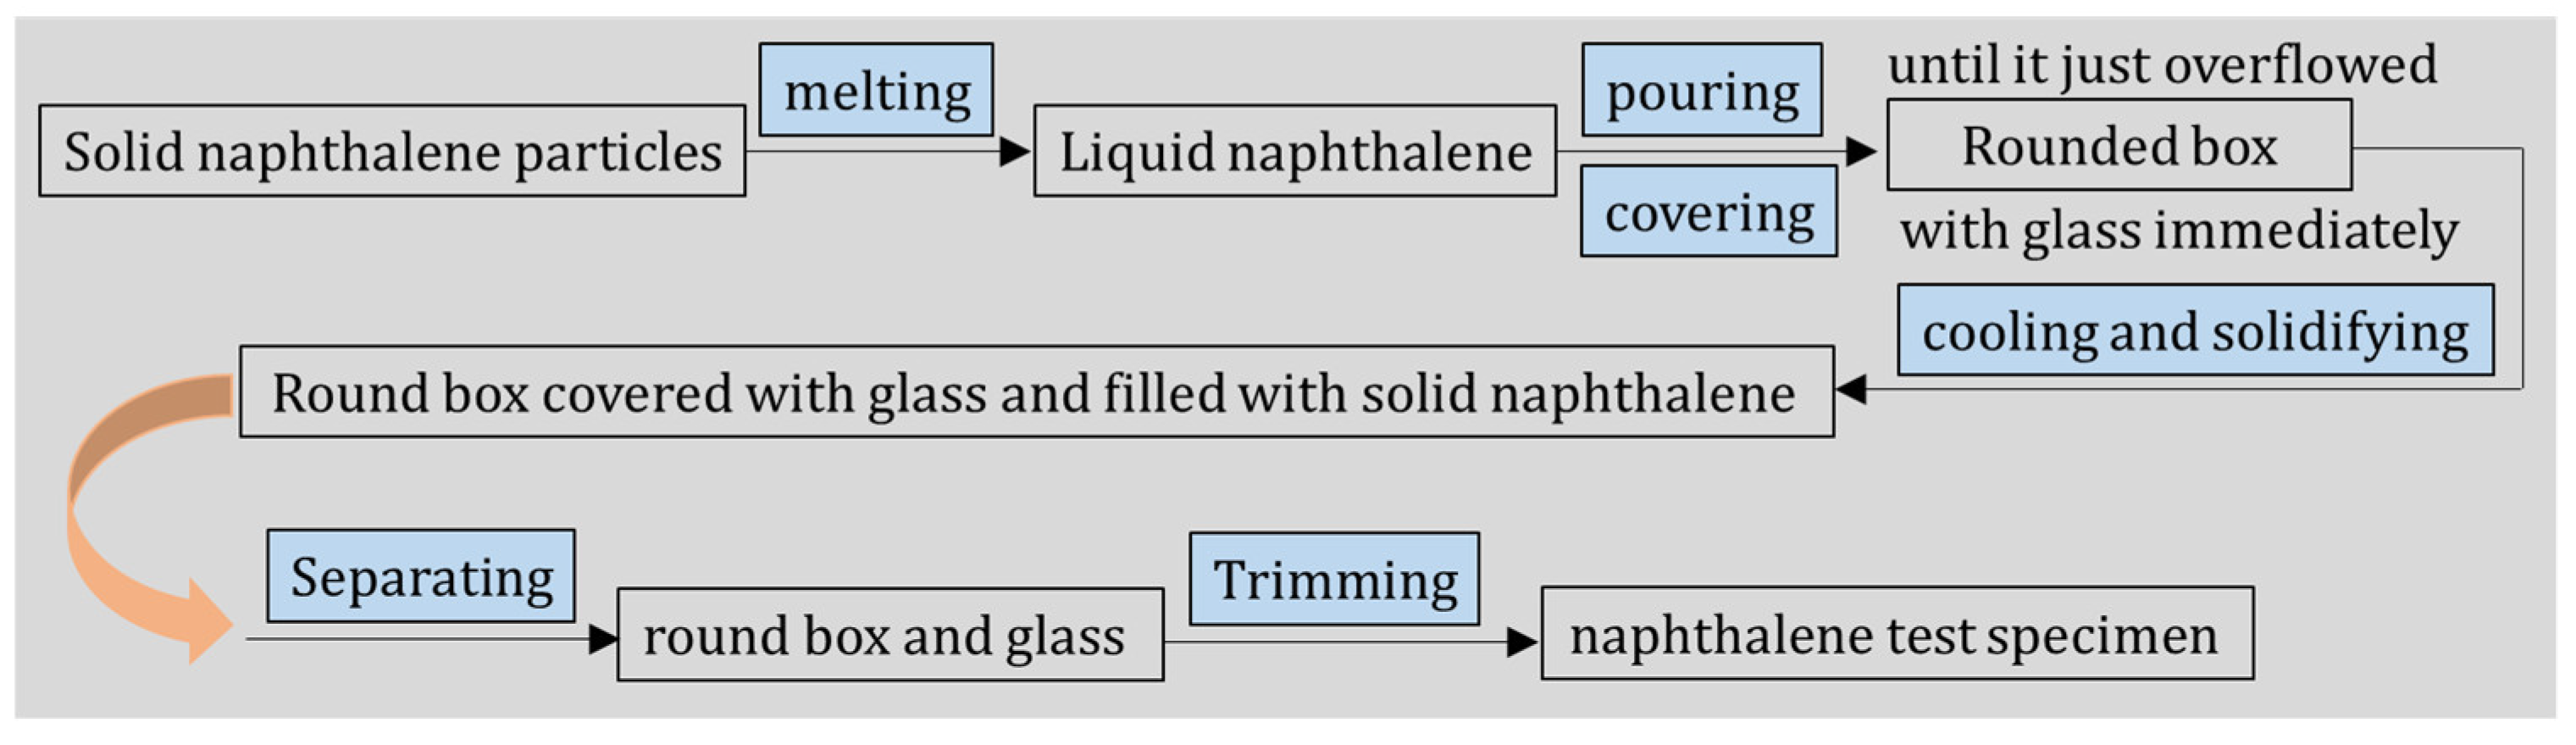
The naphthalene specimen was a core component throughout the experiment, and Figure 2 summarizes the production process of the naphthalene specimen. Firstly, a rounded aluminum box was selected as a container for naphthalene, and its diameter and thickness were 13.3 and 0.9 cm, respectively. Additionally, the purity of the solid naphthalene particles should be more than 98%, otherwise the naphthalene purity might affect the CHTC calculation results. Furthermore, a smooth and flat sublimating surface was also required to ensure a homogeneous surface temperature.
For the measurements of mass loss of the naphthalene specimen, surface temperature on the test specimen, air temperature, and wind speed, we adopted the experimental instruments in Figure 1b–e. The accuracies, sampling intervals, and mounting heights of these instruments are listed in Table 1.
It must be clarified that the problems of inconvenience traffic, difficult transport, and poor experimental conditions in the tropical island region determined that the experimental instruments should be operated more simply and carried more easily as much as possible. The infrared thermometer has obvious advantages in portability, convenience, and economy, and therefore, although a thermal camera is more intuitive and efficient than an infrared thermometer, we chose an infrared thermometer instead of a thermal camera in this study. Additionally, considering the reasonable placement of the naphthalene specimen was an important segment to reduce the weighing error, and so we introduced a homemade bracket and employed sucker hooks as interconnecting pieces between the naphthalene specimen and the bracket felicitously, providing an advantage for taking and placing the naphthalene box easily. Thus, there were significant improvements from previous studies.
2.1.3. Experiment Steps
The steps to measure CHTC in this experiment are shown in Figure 3. It should be noted that the naphthalene specimen must be weighed with cover, otherwise the naphthalene surface will still be undergoing the sublimation process when weighing mass, leading to large weighing error. Additionally, because the experimental instruments used to measure air temperature, relative humidity, and wind speed possess automatic recording functions, several parameters were recorded in fine time intervals. However, on the one hand, the infrared thermometer cannot record surface temperature in real time, but on the other hand, the changes of naphthalene surface temperature in a test cycle and the effects of inhomogeneous naphthalene surface temperature on results should be considered. Thus, the naphthalene surface temperature was measured every 10 min during a test period (60 min), and multiple surface points were chosen per measurement.
2.2. RHTC Calculation Theory
The RHTC is mainly determined by the actual long-wave radiation heat transfer between a building external surface and the outside environment, including the two parts of long-wave radiation heat transfer between the building external surface and the sky or the ground. However, considering that the sky and ground radiation conditions are hard to determine, the surface temperature of the outside environment is usually replaced by the air temperature around the envelope within the margin of error so as to simplify calculations in the field of thermal engineering in China. The long-wave radiation heat transfer between the building external surface and the sky or the ground would not be reflected in the RHTC calculation, but this does not mean that there is a problem in RHTC calculation theory. In the simplification process, radiation heat transfer qra between the envelope surface and the surrounding environment can be calculated through the following equation [38]:
εwa is system emissivity and can be expressed as:
where F1 and F2 are the envelope surface area (m2) and atmosphere radiation area (m2), respectively, and it is quite obvious that F1 is much less than F2. Therefore, εwa is equal to εw.
Thus, Equation (8) can be rewritten as Equation (10):
For general building materials, the surface emissivity is usually from 0.85 to 0.95 [38]. Thus, the range of RHTCs under different Tm values can be calculated, and the results are listed in Table 2. It can be observed that θ barely changes when Tm varies within a certain range. It should be noted that the actual sky radiation conditions were not taken into consideration in the analysis, owing to the RHTC processing method in this study. According to the RHTC calculation theory, it can be known that RHTC depends on the average temperatures of the envelope surface and air. Furthermore, the tropical island region has its own unique climatic features, such as small daily temperature range, small annual temperature range, and unclear four seasons, together with the characteristics of RHTC and Tm shown in Table 2. Thus, it is reasonable for RHTC to be treated as a constant. Additionally, considering that the annual average temperature in Xisha is more than 28 °C, the RHTC in this study is determined as 5.8 W/(m2·K).
2.3. EHTC Simplified Calculation Model
2.3.1. Calculation Principle
The external building surface in the pluvial region is often wet due to the influence of rainfall, and the liquid water on the surface must transfer heat by evaporation. On wet surfaces, the water mass flow of evaporation can be calculated by the following formula [39]:
Putting the Lewis relation hc/hd = ρcpLe2/3 into Equation (13), Equation (13) can be converted to Equation (14):
where Le is the Lewis number, which can be determined as 0.857 when water vapor diffuses through the air [30].
For the partial pressure of water vapor, it can be obtained by the following relationship:
where ps is the saturated vapor pressure (Pa), which can be calculated in the following form [40]:
By equalizing the evaporative heat transfer to the Newton cooling formula, the following relation can be found:
where r is latent heat of water (kJ/kg), which can be calculated by the formula below:
If β is defined as he/hc, then β can be expressed as Equation (19):
Therefore, β can be calculated by merely measuring Tw, Ta, φw, and φa, and then the evaporative heat transfer coefficient can be acquired by combining with CHTC.
2.3.2. Simplified Processing Method
A moist envelope surface is the precondition for evaporation heat transfer, and the wet condition of an envelope surface is largely influenced by local rainfall. Similar to solar radiation, rainfall takes on discontinuity. However, it also has its own unique characteristics, such as randomness and uncertain intensity, causing the determination method of EHTC to be more complex than solar radiation. The main problematic point is that the occurrence of rainfall and evaporation do not correspond exactly in real time, namely, when rainfall intensity is particularly small over a certain period of time, evaporative heat transfer is probably very weak or non-existent. However, if quite heavy rainfall occurs at a certain time, evaporation heat transfer may last for a long time.
For a rainy day, we can obtain hourly air temperature, relative humidity, and precipitation according to existing weather data in the tropical island region. By considering the complexity of evaporation heat transfer, this study puts forward a simplified method to obtain EHTC. We stipulate that if the rainfall precipitation within an hour is more than zero, the envelope surface is wet, and water on the surface transfers heat by evaporation in this hour all the time. Then, EHTC can be obtained by determining Ta, φa, Tw, and φw in this hour. Among these parameters, Ta and φa can be acquired directly from existing weather data in the tropical island region, and φw on wet surfaces is regarded as 100%. Considering that the clouds are thicker on rainy days and can strongly weaken solar radiation, the temperature difference between the envelope surface and air is actually small. Additionally, based on the temperature ranges of the envelope surfaces and air on rainy days derived from reference [32], we determined the Tw by adding 3 K to Ta. Therefore, when there is rainfall precipitation within an hour, according to the determination of hourly CHTC, Ta, φa, Tw, and φw, the daily average EHTC can be obtained.
It should be pointed out that several ideal assumptions are proposed referring to the previous work [32] to simplify the problem above, and they are as follows: (a) If there is precipitation within an hour, the envelope surface is wet and water on the surface transfers heat by evaporation in this hour all the time; (b) prolonged evaporation heat transfer caused by intense rainfall moments is ignored; and (c) the φw on wet surfaces is regarded as 100%.
Here, we need to clarify that the assessment of EHTC in this paper is based on the approach that was formulated for the case of evaporation of liquids from free surfaces, and the research necessity of this part stems from the special climate of high wind speed and strong rainfall in the tropical island region. There is actually another type of evaporation heat transfer, for which the wall structure is made from porous material and permeated by moisture, and the evaporation process mechanism is different from that in this paper and even more complex. Considering that the exterior surfaces of buildings in this area are often in a humid state under the combined action of high wind speed and strong rainfall, there must be liquid water on surfaces to transfer heat by evaporation, and so this study mainly discussed the case of evaporation of liquids from free surfaces. It should be noted that there are several issues in the assessment method: (a) The impact of building external surface characteristics on EHTC was not considered in this assessment method, and (b) the assumptions above were determined on the basis of theoretical analysis or reference material, instead of actual measurements. Additionally, wet and rainy weather is the prerequisite for discussing the EHTC, and it is unnecessary to analyze the EHTC for the dry areas with little rain. Finally, the study of how to add EHTC into the total heat transfer coefficient is still in the preliminary exploration stage, and so we think that it is acceptable to adopt the proposed approach in this paper to estimate the EHTC.
3. Results
3.1. Naphthalene Sublimation Experiment
3.1.1. Test Subject and Weather Conditions
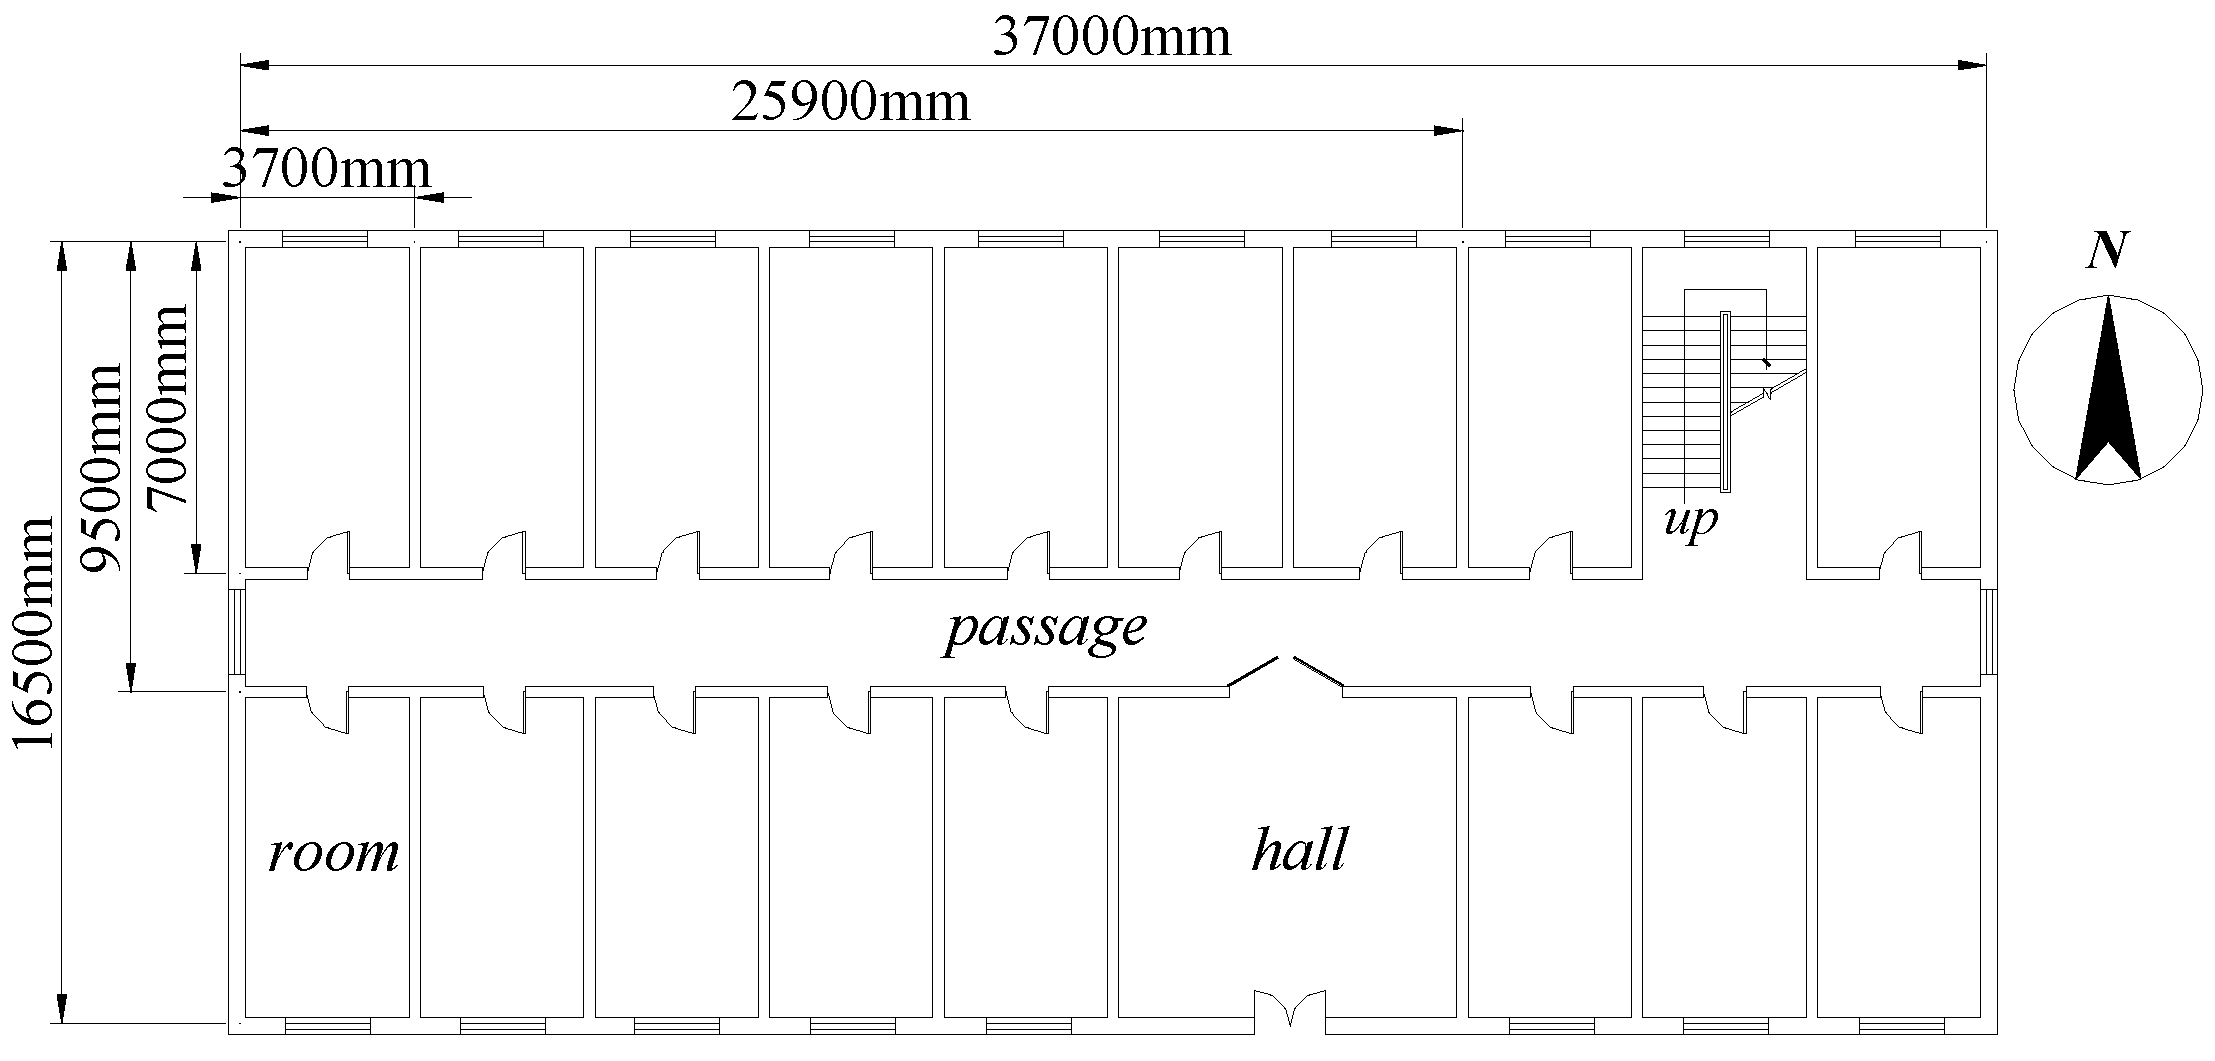
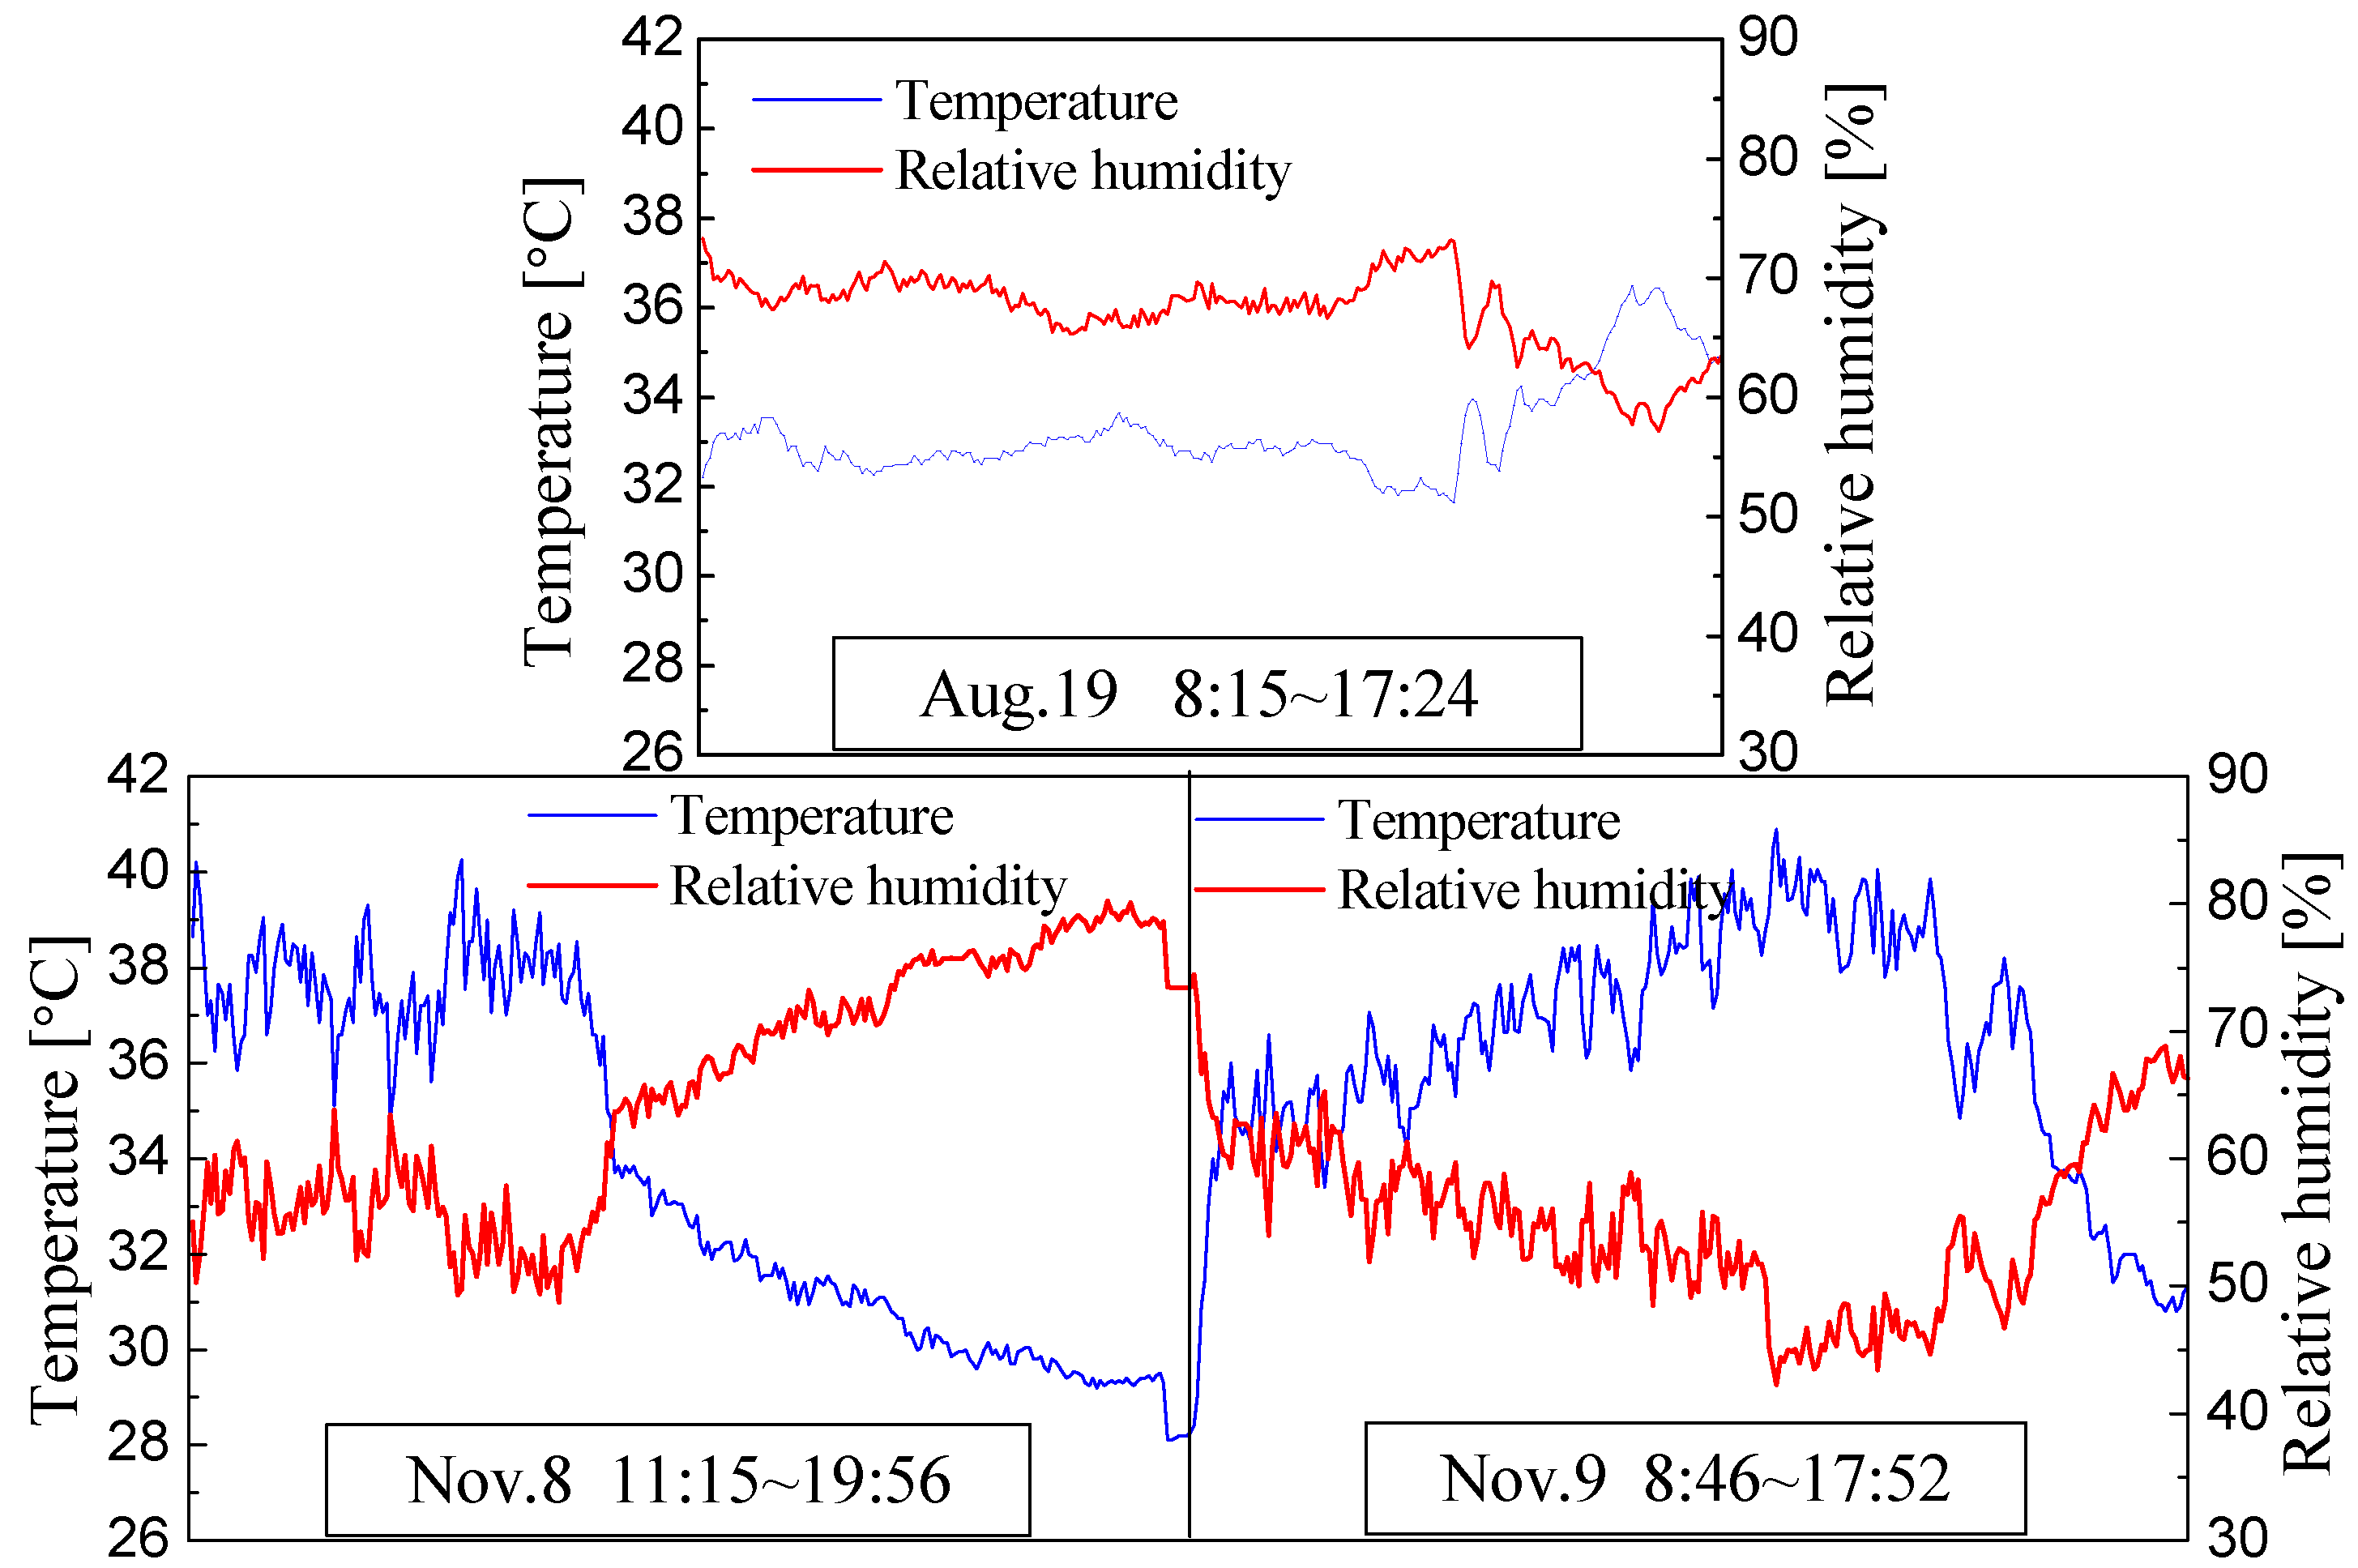
The test subject was a full-size dormitory building in the tropical island region with plentiful wind and rain. Figure 4 shows the plan graph of the test object, and it was 37 m long and 16.5 m wide. The testing was accomplished on 19 August, 8 November, and 9 November 2016, and Figure 5 presents the changing diagram of ambient air temperature and relative humidity in the period of testing. As shown in Figure 5, the air temperature and relative humidity fluctuated weakly on 19 August, but the two outdoor parameters both had great changes on 8 November and 9 November, in the range of about 28–40 °C and 40–80%, respectively. Furthermore, it was sunny on 8 November and 9 November, but the weather was cloudy and windy on 19 August.
3.1.2. Relationship between CHTC and Wind Speed
Considering that wind speed is the main influence factor of CHTC, this study explored the correlation between CHTC and wind speed, supported by experimental data from 8 November and 9 November. It must be pointed out that the field measurements were carried out aiming at four building facades of the test subject, but in order to ensure the convenience of engineering design, the CHTC and wind speed from four different directions were analyzed together. Therefore, the CHTC presented in the relational expression represented all four building facades. The relationship between CHTC and wind speed can be found in Figure 6, and the function expression between the two parameters is given in Equation (20). According to the analysis of the original measured wind speed, which was applied to get the CHTC predictive model, it can be found that the maximum measured wind speed was 4.08 m/s, and so the provided equation describing convective heat transfer coefficients is well applicable to the wind speeds below 4.08 m/s. Additionally, from the Figure 6, it can be observed that 65% of wind speeds throughout the year in Xisha are less than the maximum measured wind speed, and together with the effects of height on wind velocity, the frequency accumulation curve presented in Figure 6 would shift in the direction of low wind speed. Then, the applicable time scope of the CHTC forecast model would be broadened, and so we think that it is acceptable to adopt the CHTC forecast model to assess the convective heat transfer coefficient of this tropical island building.
where the wind velocity u was measured at a height of 1.2 m above the ground, and it is a time-averaged value during a test cycle.
3.1.3. Verification of CHTC Predictive Model
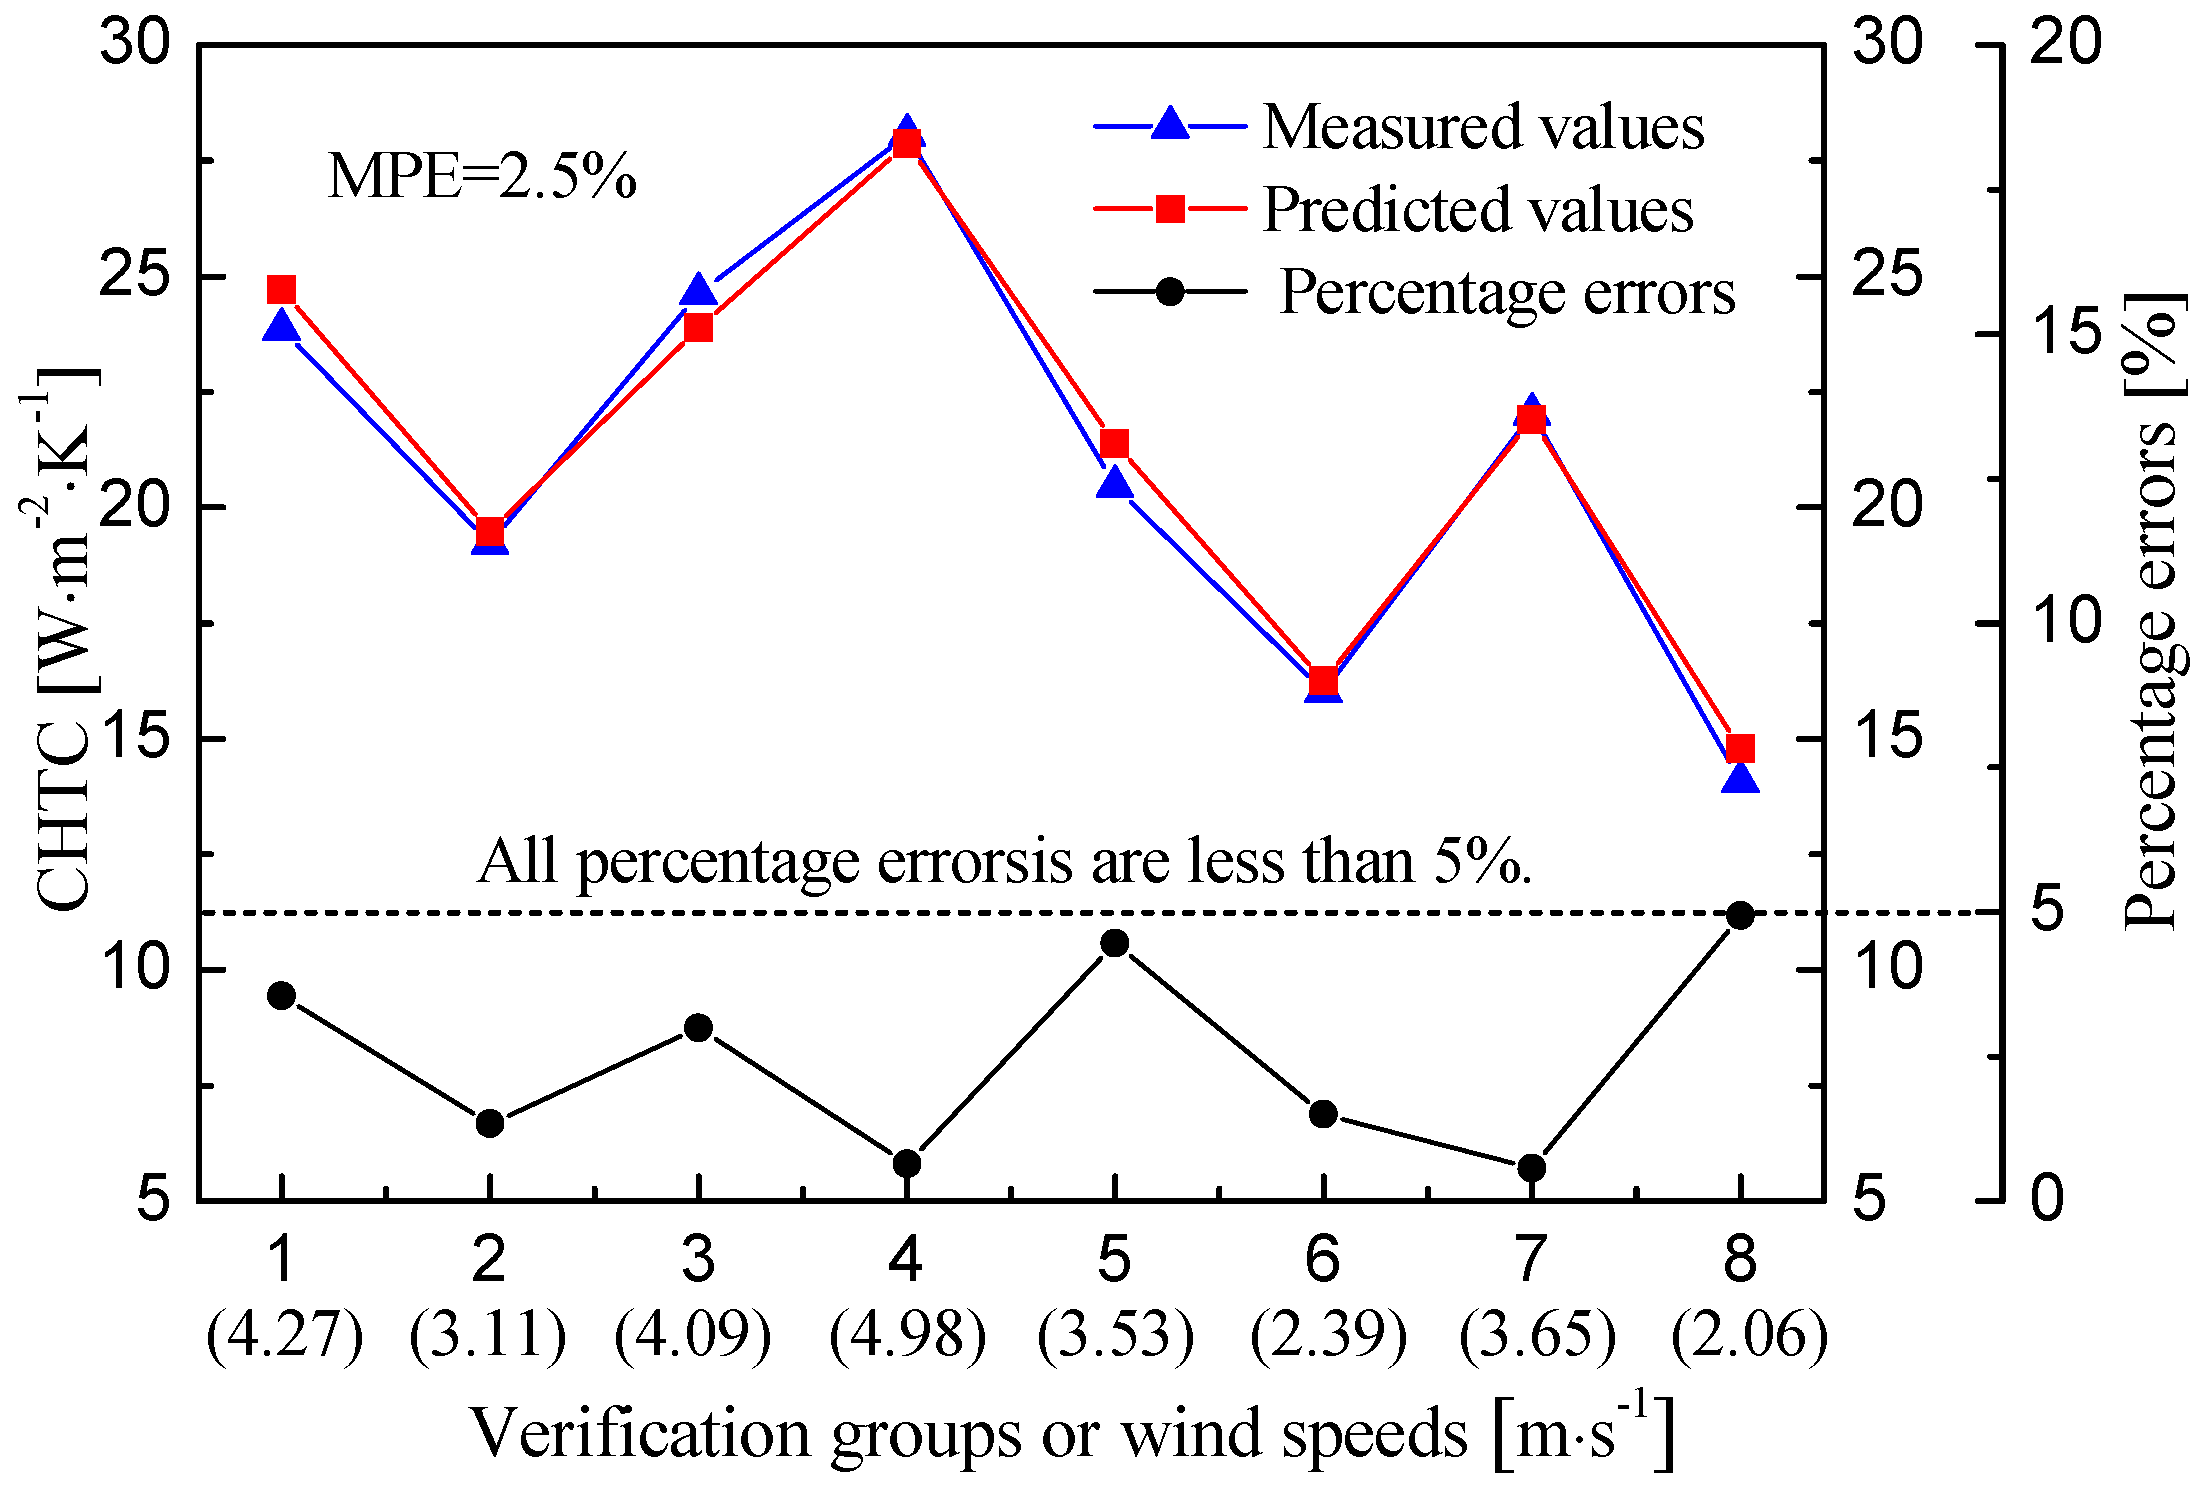
The CHTC predictive model was verified and examined by comparing the predicted CHTCs under measured wind speeds with the measured CHTCs on 19 August 2016. The percentage error (PE) was introduced, and its definition is as follows:
where Ci and Qi are the predicted values and measured values, respectively.
Figure 7 shows the comparative results between the predicted and measured CHTCs, and it can be observed obviously that the differences between predicted and measured CHTCs were quite small. The percentage errors were all less than 5% for different verification groups or measured wind speeds, and the mean percentage error (MPE) was merely 2.50%. Accordingly, the CHTC predictive model raised in this study was examined as reliable for estimating CHTC in the tropical island region.
3.1.4. Uncertainty Analysis of the Naphthalene Sublimation Method
Based on the error propagation theory and the expression of hc given in Equation (8), the uncertainty of the naphthalene sublimation experiment can be evaluated as Equation (22), and it mainly includes the balance quality measurement error, temperature measurement error, and the error caused by empirical formula.
According to the analysis of the accuracies of the experimental instruments and the minimum values of measured variables in the process of field measurements, the quality measurement error of balance and the temperature measurement error can be acquired. In addition, the empirical formula for calculating the saturated vapor pressure on the naphthalene test specimen surface has an uncertainty of 3.77% [37]. Therefore, the overall uncertainty of CHTC in the naphthalene sublimation experiment is approximately 5.4%, and thus the accuracy of the experimental result can be secured.
3.2. Features of Wind and Rain in the Tropical Island Region
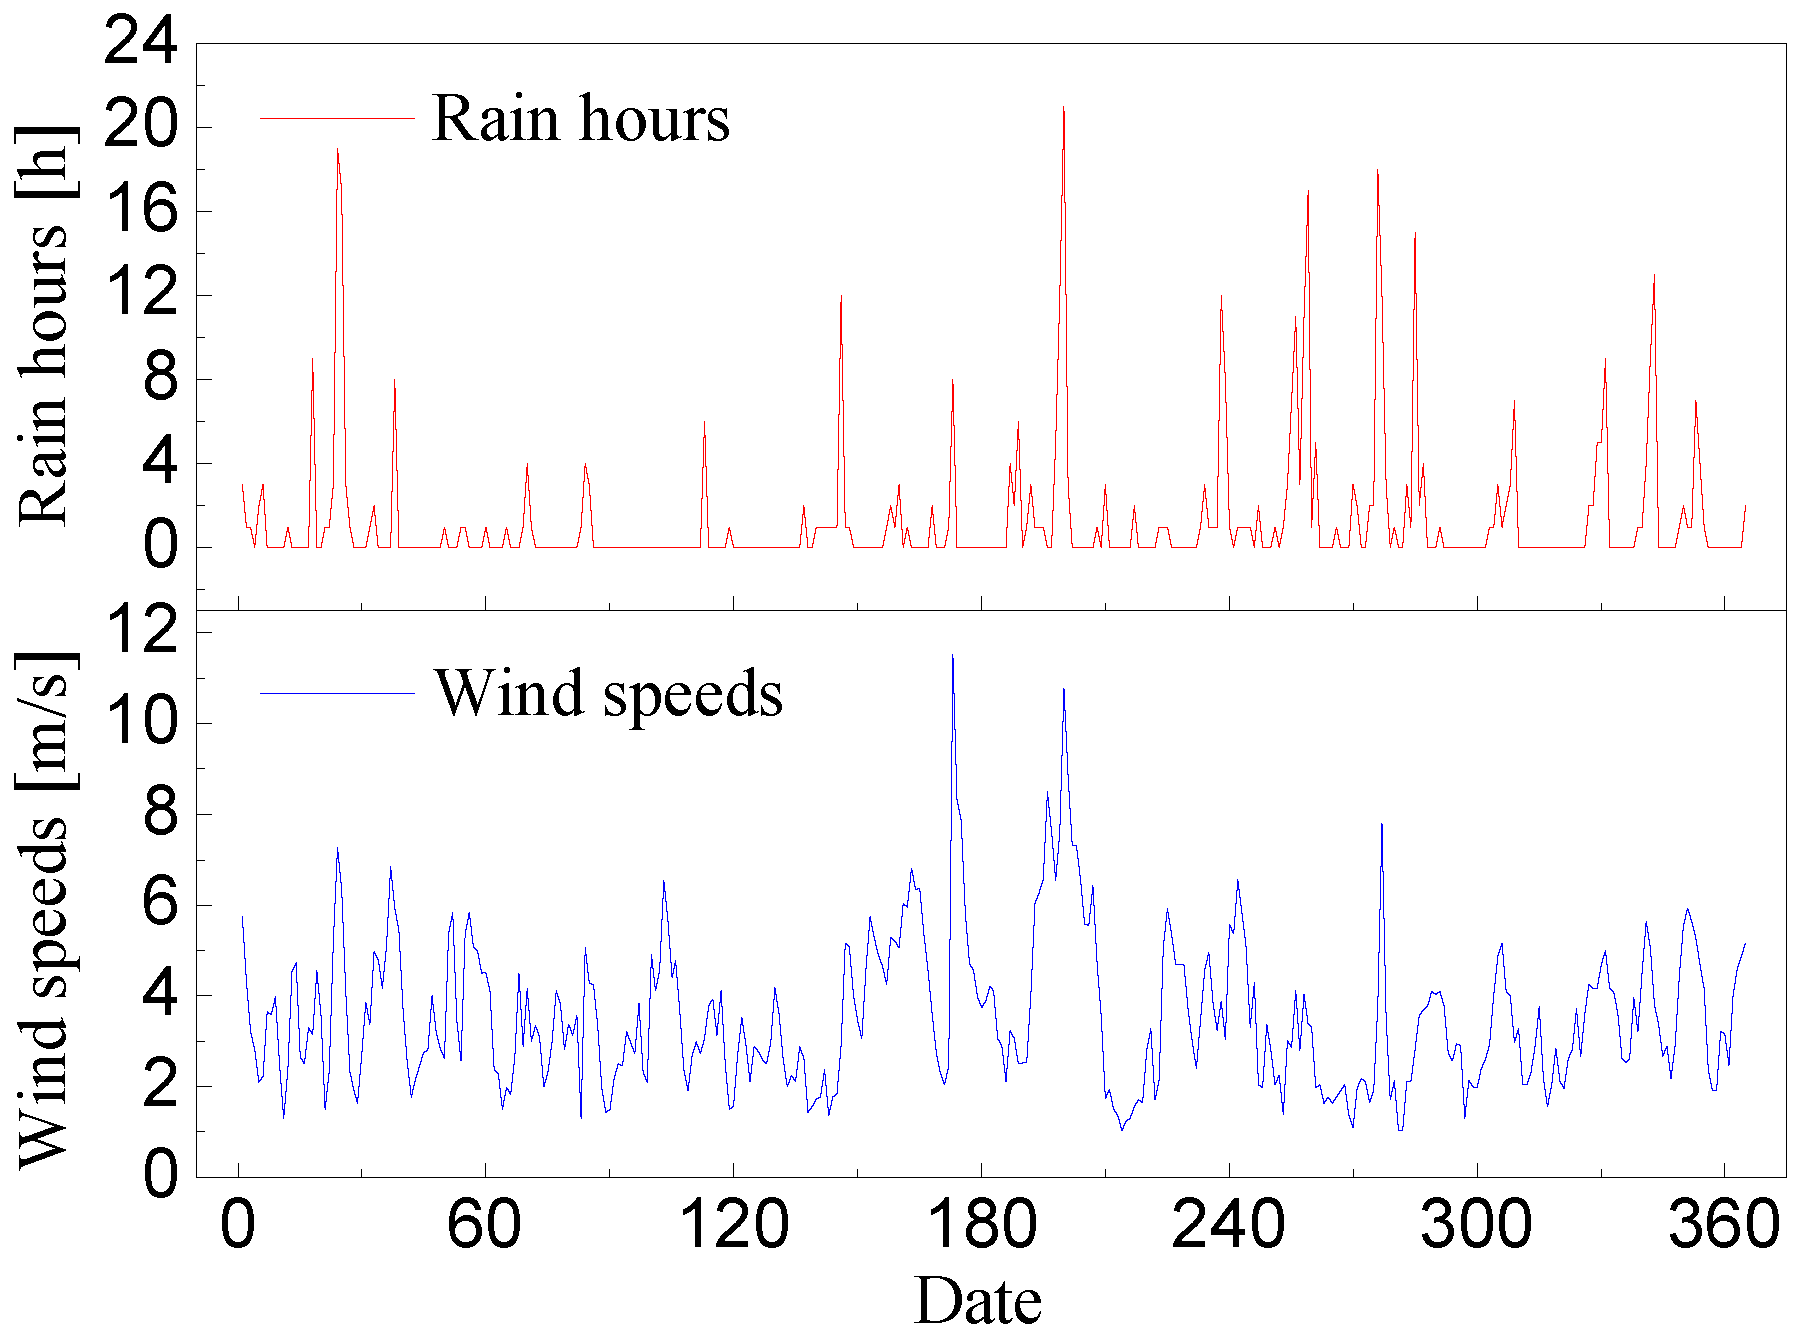
Based on meteorological data of hourly wind speed and rainfall in Xisha from June 2015 to May 2016, Figure 8 shows the daily variation curves of average wind speeds and total rain hours throughout the year in Xisha. We can know that the variation ranges of outdoor average wind speeds and total rain hours are wide all throughout the year, changing from 1.0 to 11.5 m/s and 0 to 21 h, respectively. Moreover, rainfall shows strong randomness, discontinuity, and intensity uncertainty.
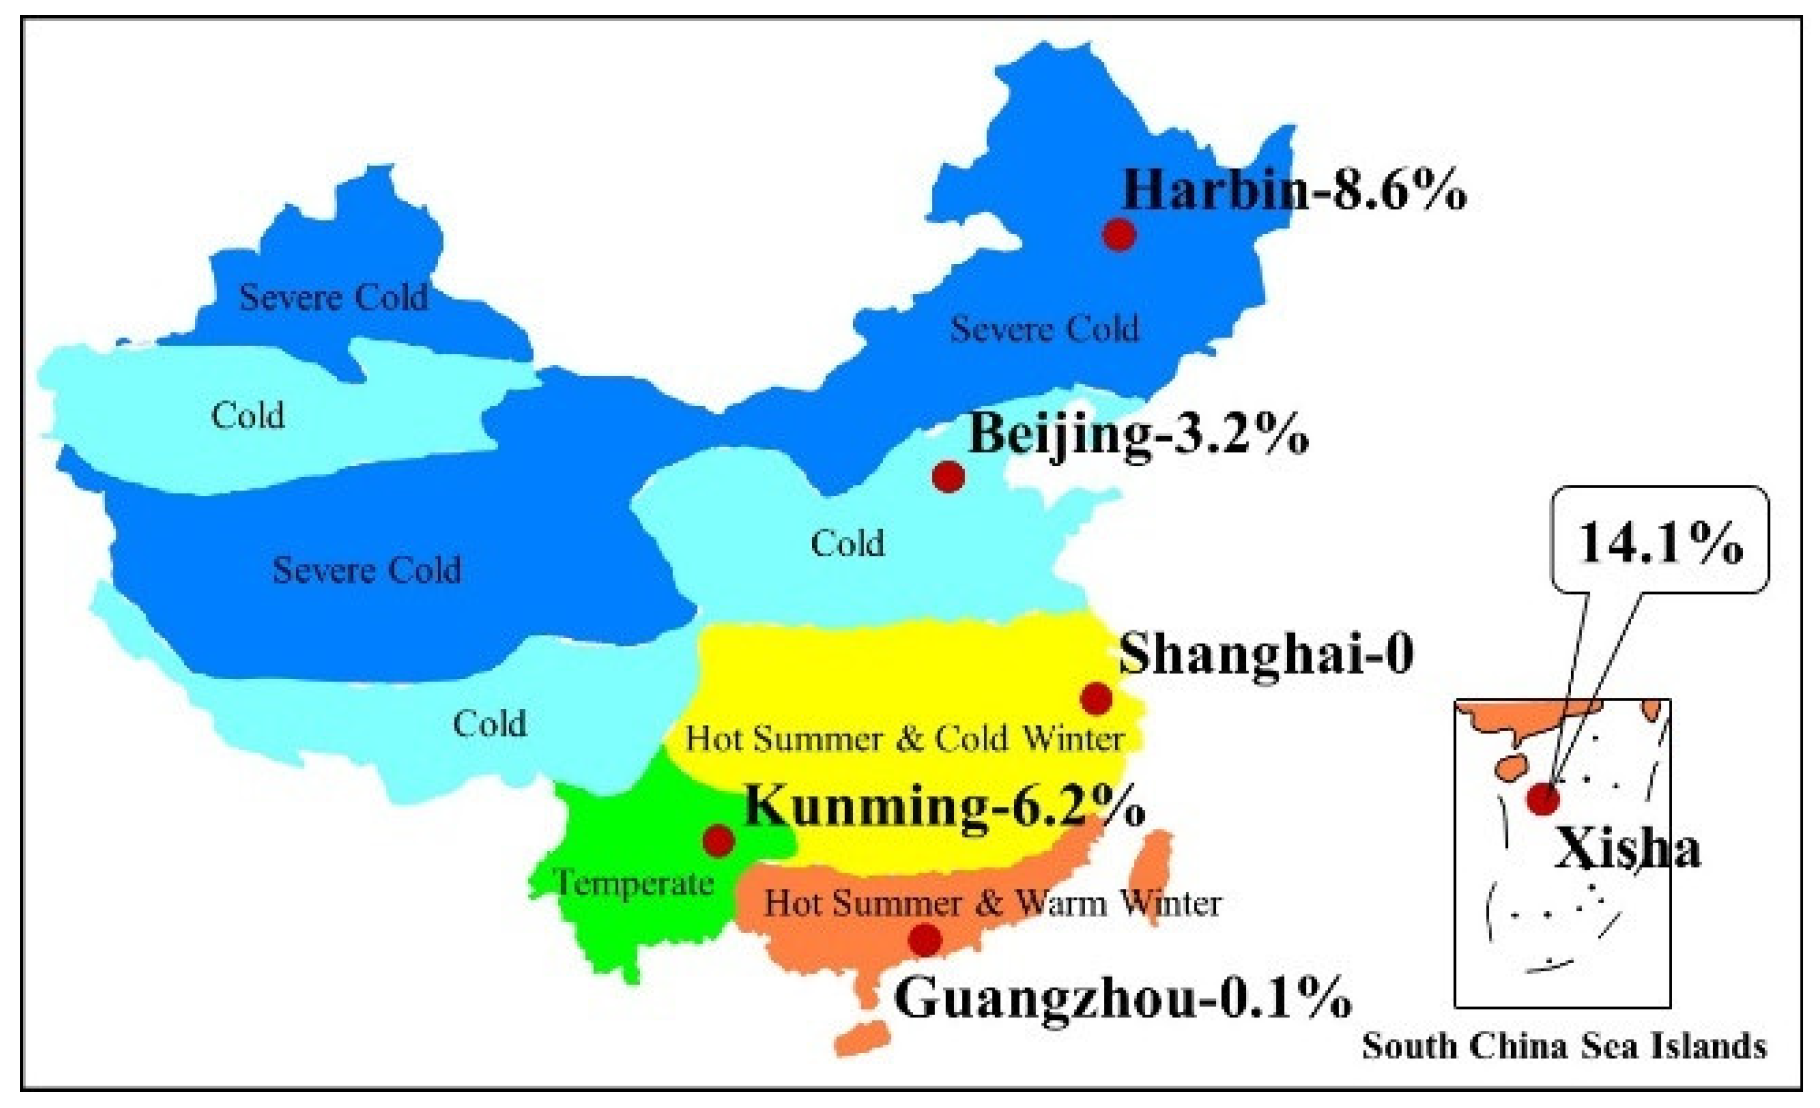
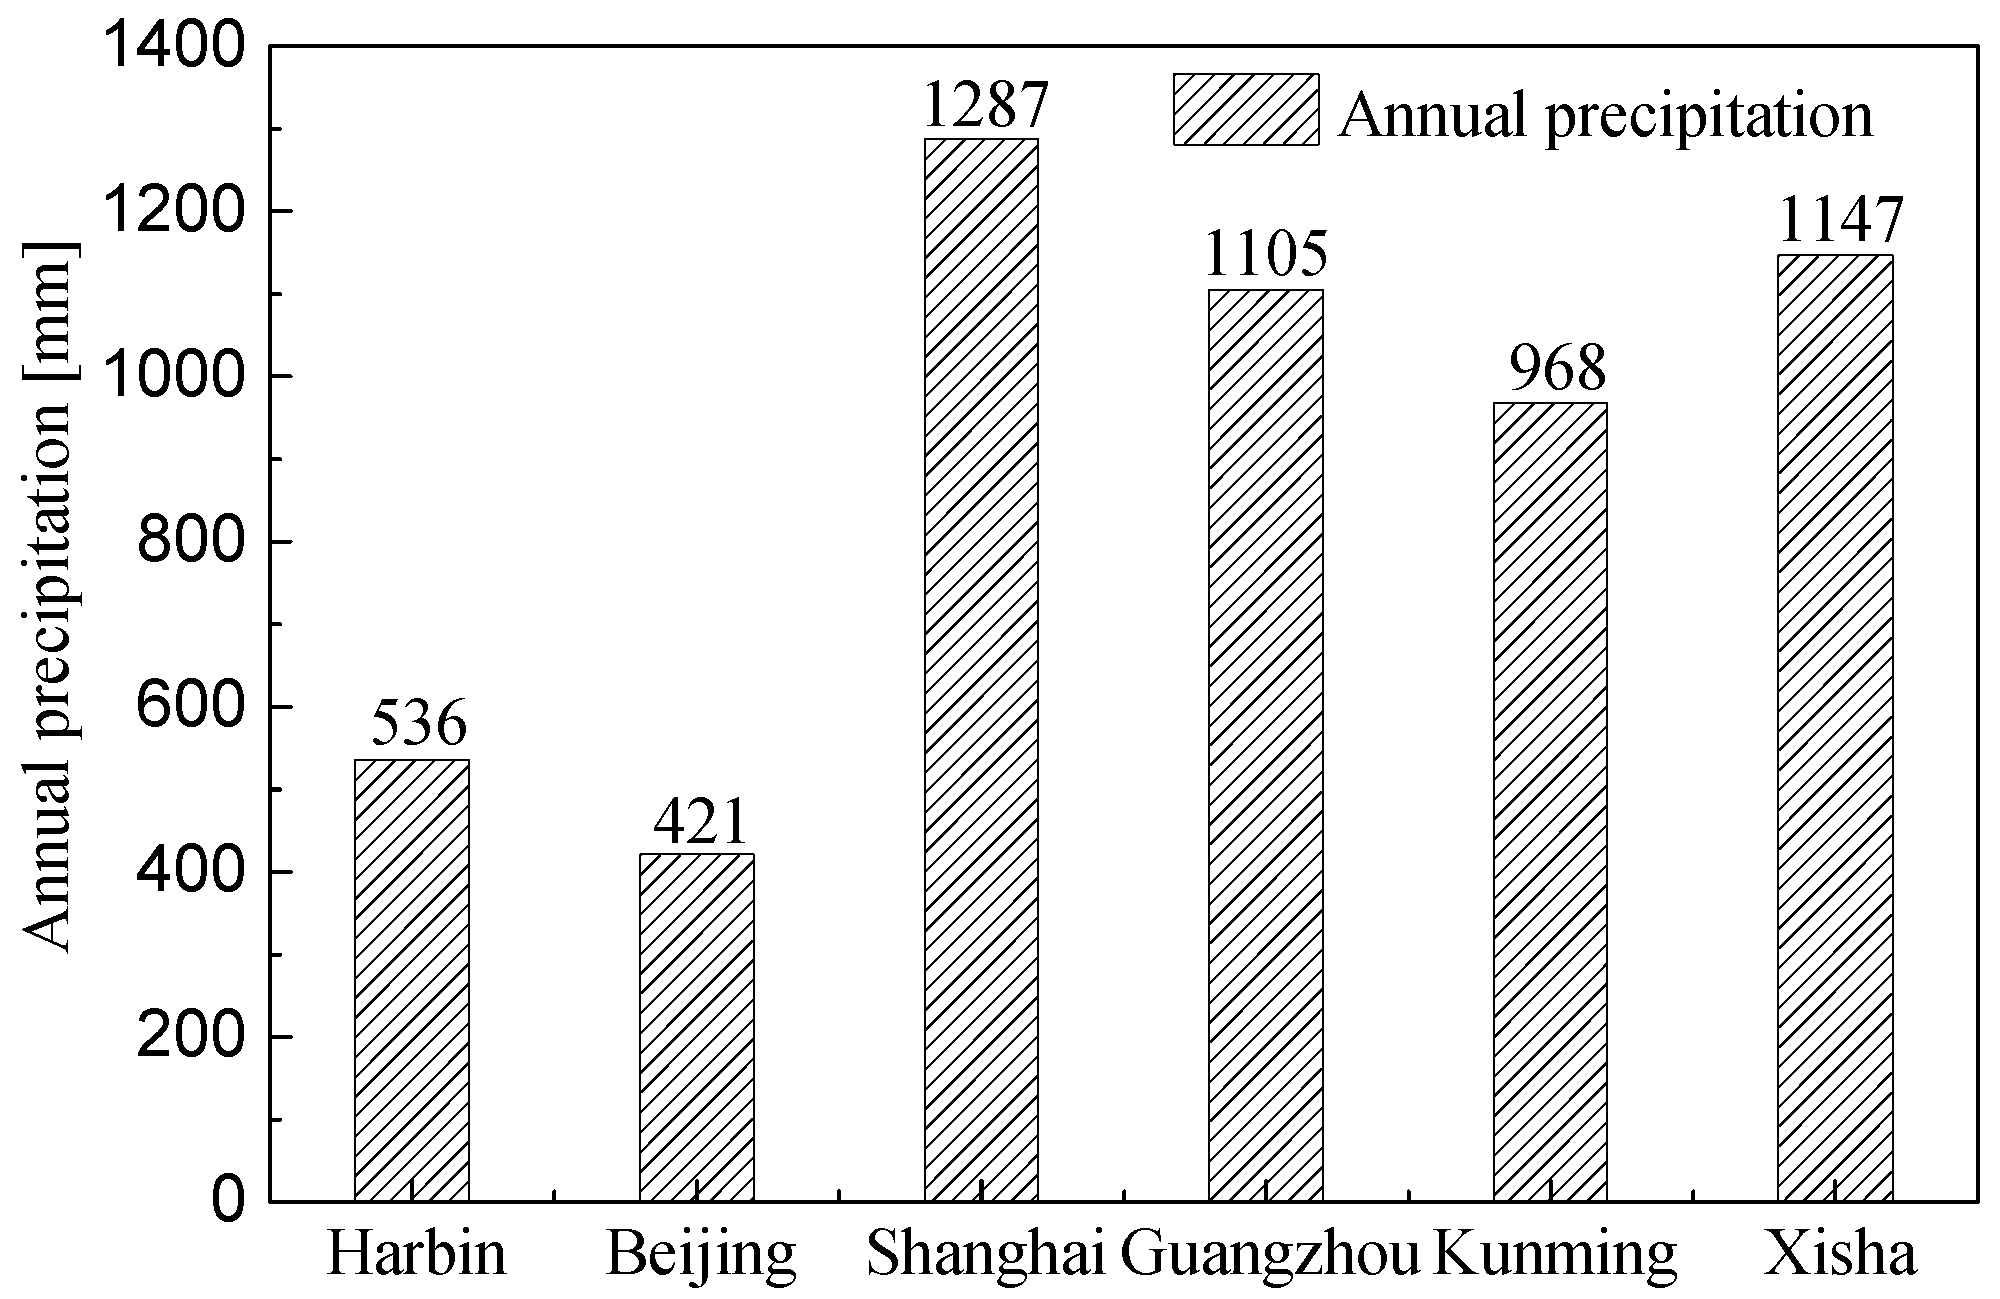
Assuming that the wind speeds above level three are high, then Harbin, Beijing, Shanghai, Guangzhou, and Kunming were selected as representative cities of different climate zones to arrange the proportions of high wind speeds, and the statistical result is shown in Figure 9. There is a proportion of 14.1% high wind speeds in Xisha, which is obviously larger than those of the representative inland cities. Moreover, Figure 10 presents the annual precipitation of the different representative cities, and we can know that the precipitation in Xisha is second only to Shanghai, and more than other representative cities.
3.3. Heat Transfer Coefficient in the Tropical Island Region
3.3.1. Daily Average Heat Transfer Coefficient
Relation between Heat Transfer Coefficients, Wind Speeds, and Rain Hours
By combining the CHTC predictive model derived from full-scale measurements and daily mean wind speeds in the tropical island region, the daily average CHTC throughout the year can be calculated. Then, the daily average EHTC can be obtained by adopting the simplified calculation model described above. Figure 11 shows the variation relationship between daily average heat transfer coefficients, wind speeds, and rain hours. As can be seen, the variation trend of CHTC is coincident with wind speed, and the daily average CHTCs are all concentrated in the range of 10–60 W/(m2·K). Furthermore, RHTC is almost impervious to wind speed and rainfall, keeping unchanged at 5.8 W/(m2·K). However, compared with CHTC and RHTC, the EHTC shows strong randomness and indeterminacy, owing to rainfall, and it has a wider changing range from 0 to 160 W/(m2·K).
Frequency Distribution of Daily Average Heat Transfer Coefficients
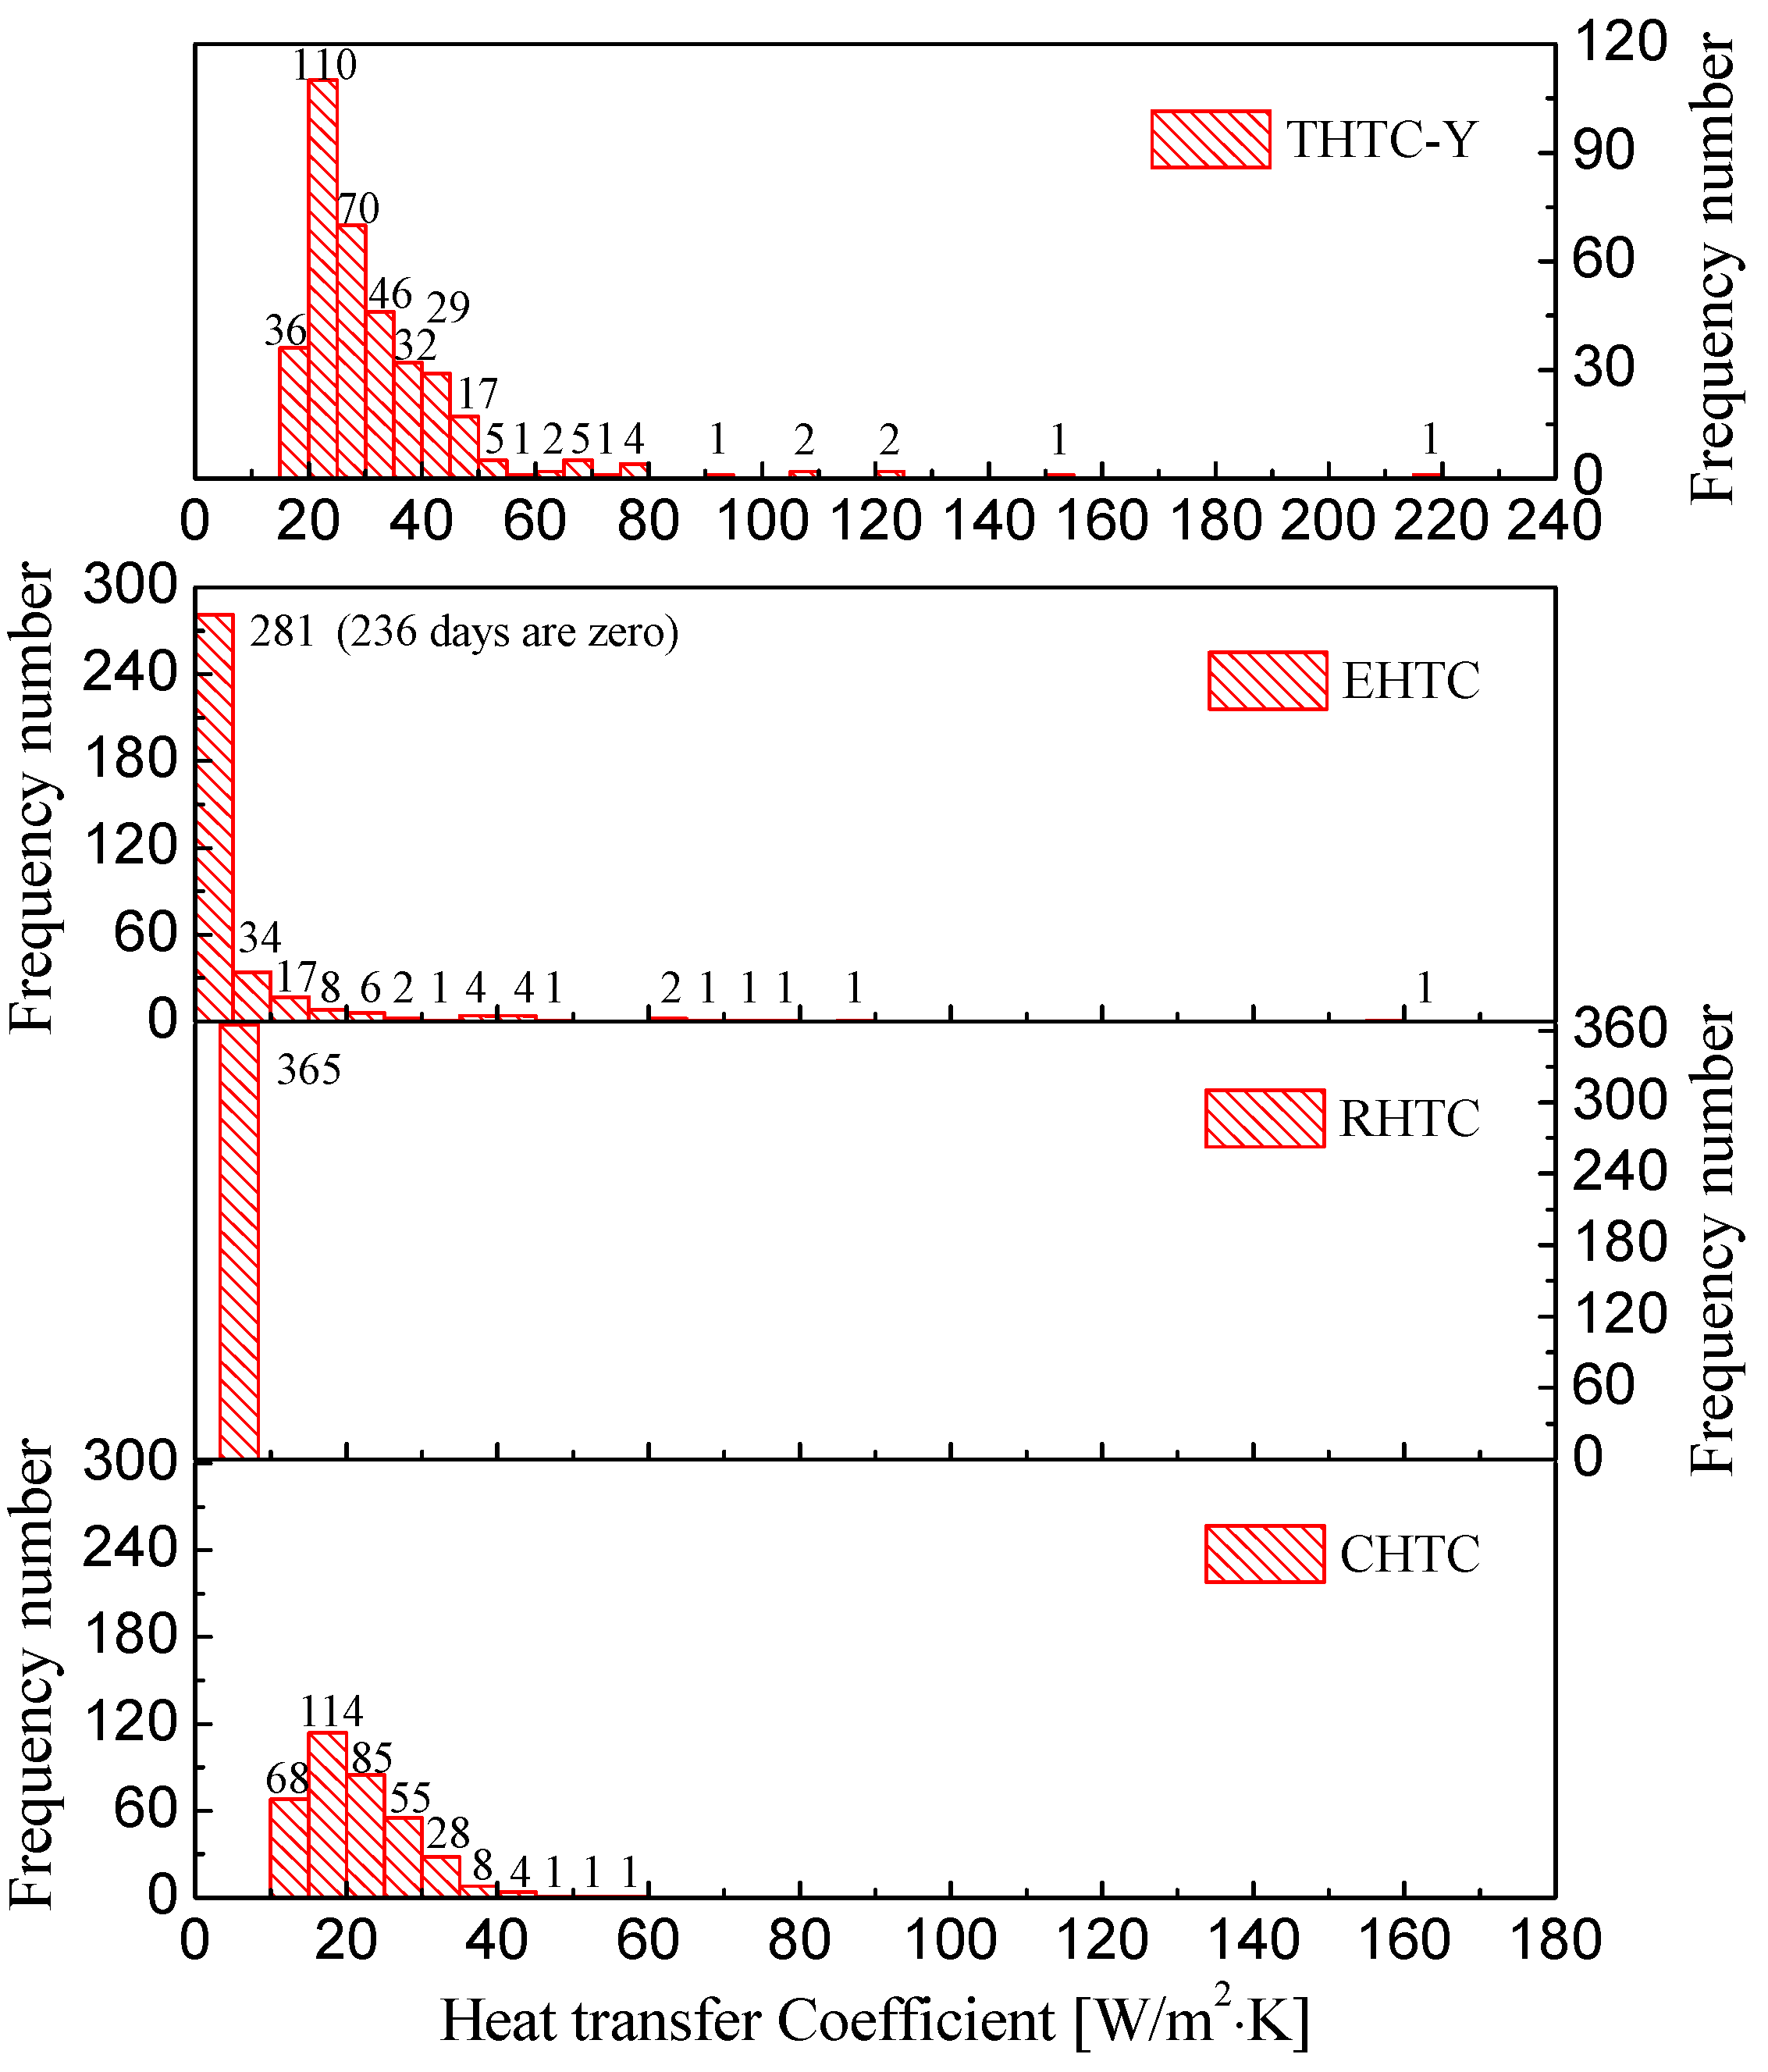
The frequency distribution of daily average heat transfer coefficients in the tropical island region is presented in Figure 12. It can be seen that the CHTCs and RHTCs are all in relatively centralized distributions, but the distribution of EHTC is discrete on account of the uncertain rainfall intensity. Consequently, the total heat transfer coefficient with consideration of evaporation heat transfer (THTC-Y) is equipped with a wide distribution range of approximately 16–220 W/(m2·K). Furthermore, with respect to THTC-Y, the range from 20 to 25 W/(m2·K) occupies the highest frequency, with up to 110 days (30.1%). And the THTC-Y which is in the scope of 20–50 W/(m2·K) accounts for a proportion of more than 80% year-round time. Additionally, considering that the THTC recommended values for winter or summer in the Chinese current standard are all less than 25 W/(m2·K), and therefore, taking 25 W/(m2·K) as the boundary line, it can be found that the number of days that THTC-Y is less or more than 25 W/(m2·K) are 146 (40%) or 219 (60%), respectively.
3.3.2. Monthly Average Heat Transfer Coefficient
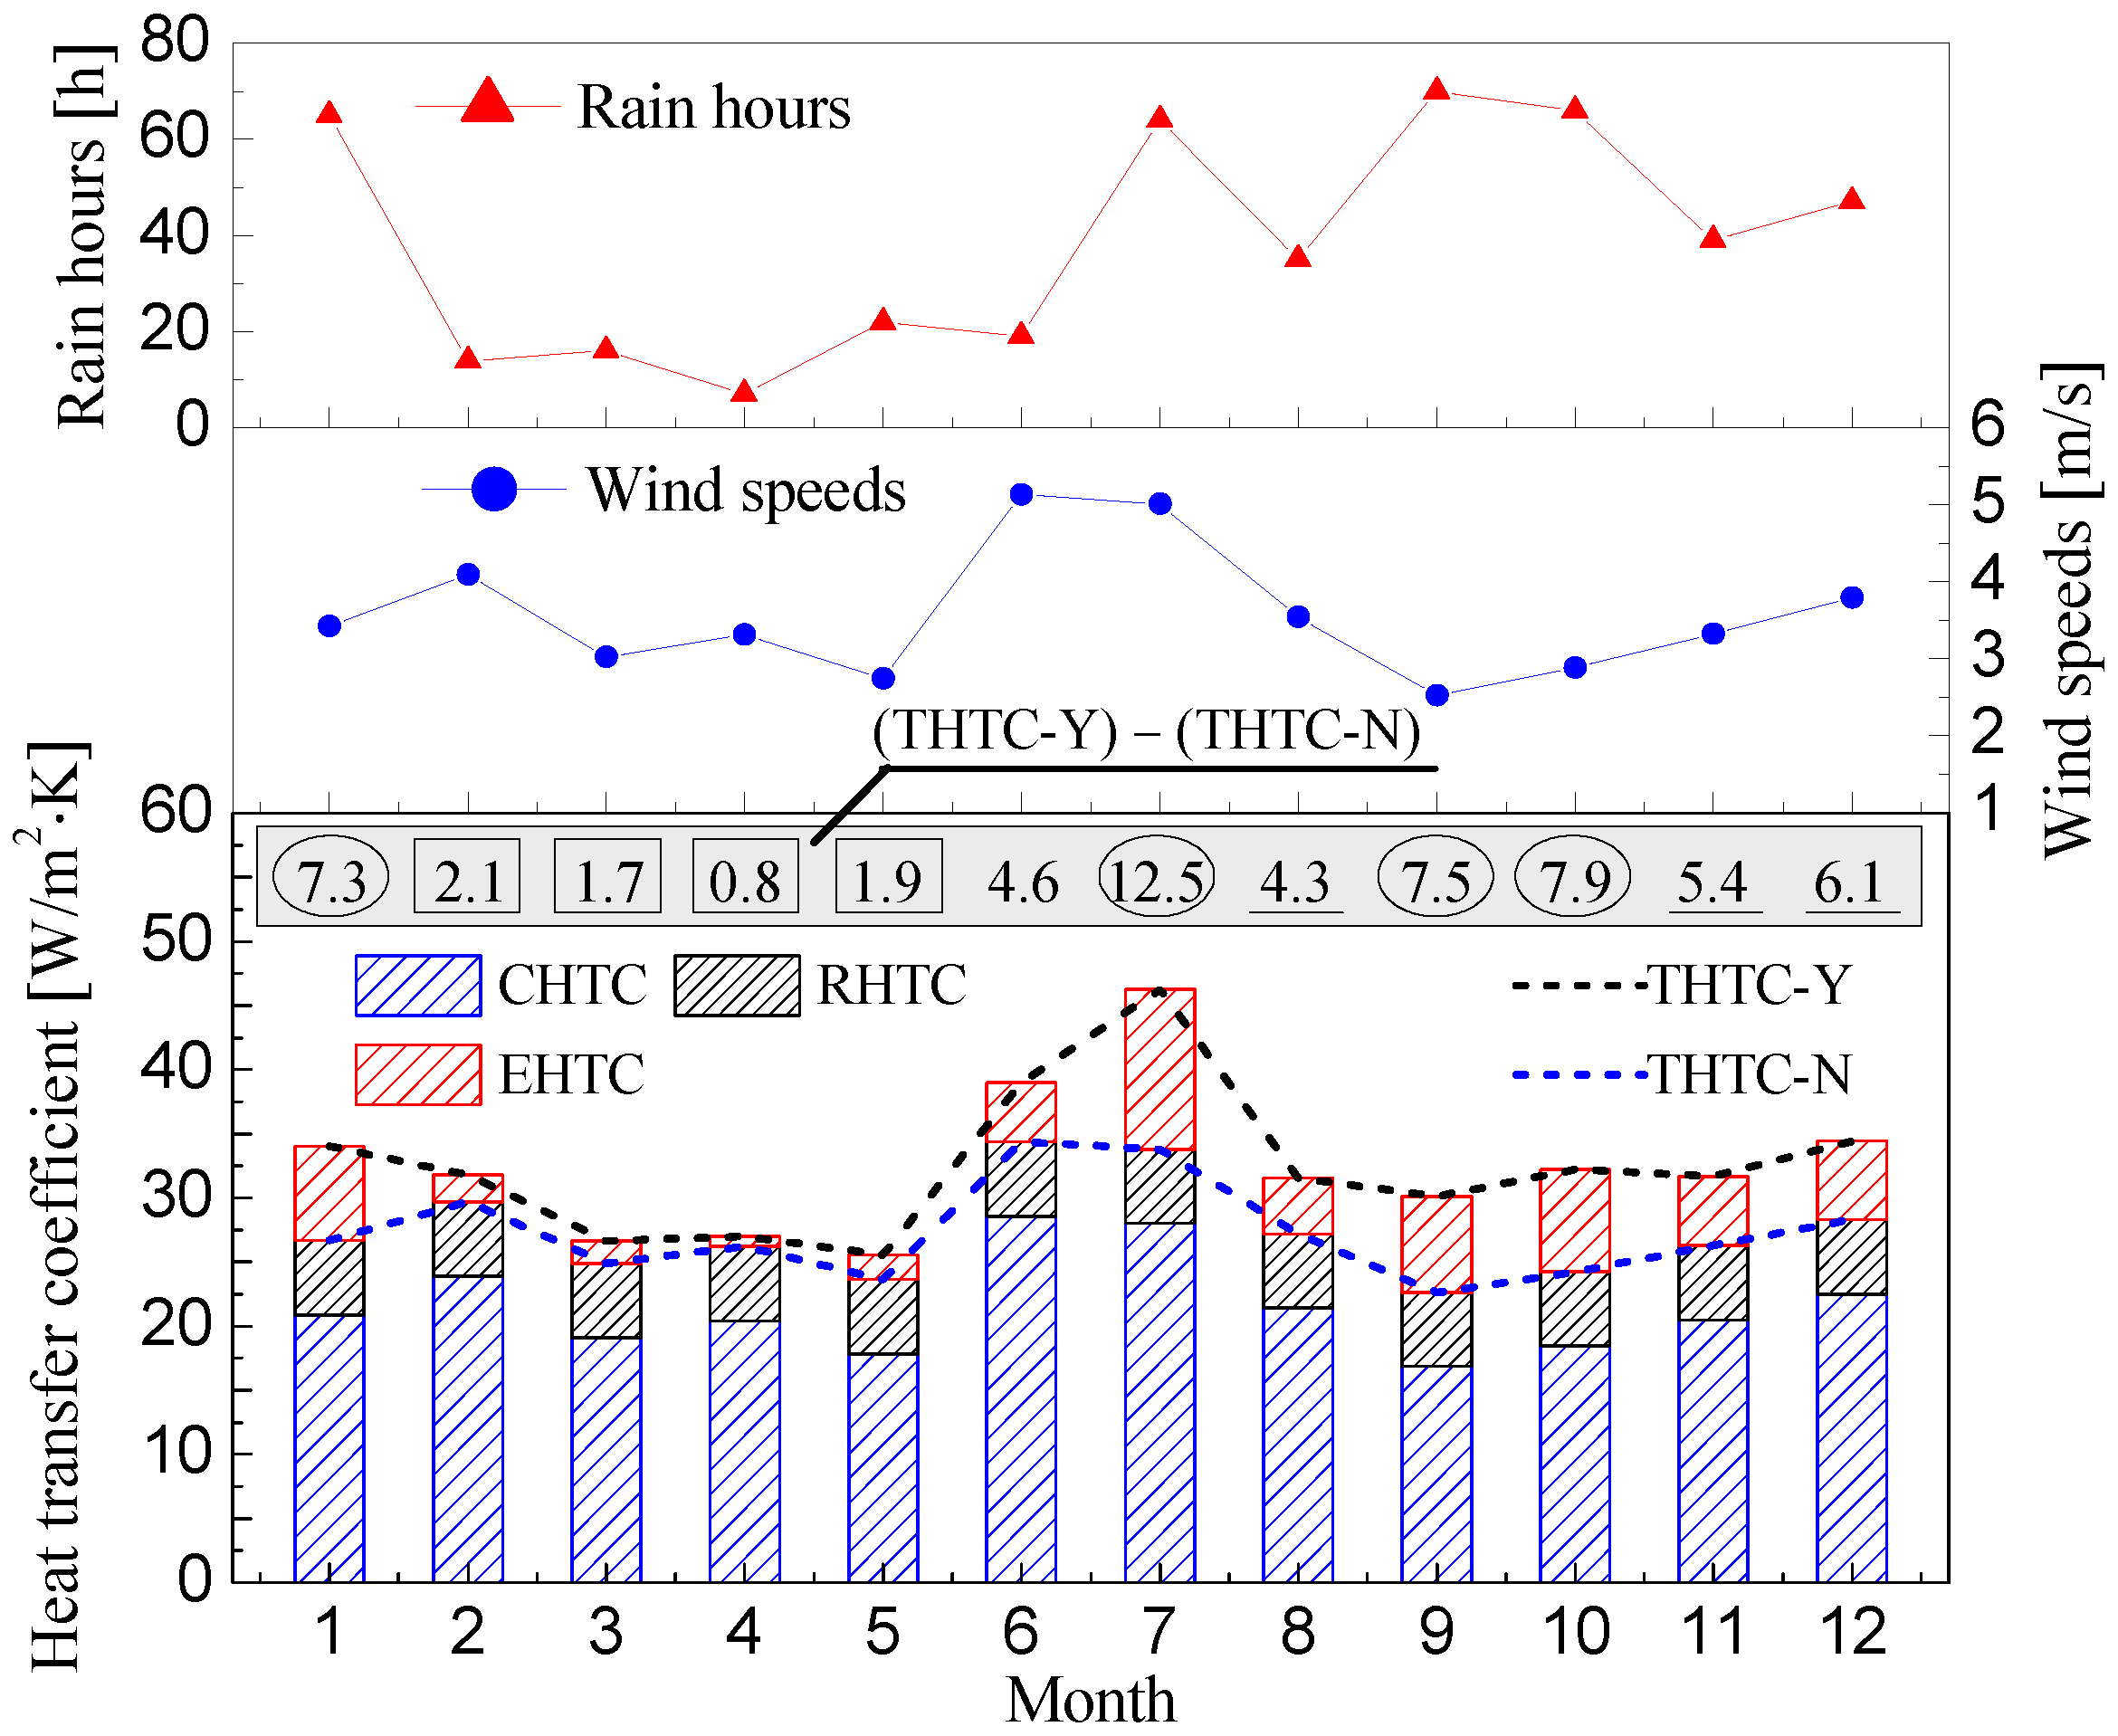
Figure 13 shows the relationship between heat transfer coefficients, wind speeds, and rain hours for every month throughout the year in the tropical island region. It can be observed that THTC-Y in July is the largest (up to 46.3 W/(m2·K)), since the average wind speed and total rainfall hours in July are all large among the twelve months. Moreover, less rain hours and the highest monthly average wind speed induce THTC-Y in June to rank second only to that in July (up to 39.0 W/(m2·K)). Furthermore, because the average wind speeds and total rain hours are generally small in March, April, and May, accordingly, the values of THTC-Y in these months are all small (around 26 W/(m2·K)). Except for the months described above, the THTC-Y values of the remaining months have little differences, and are approximately 32 W/(m2·K).
The difference between THTC-Y and the total heat transfer coefficient without considering evaporation heat transfer (THTC-N) is mainly reflected in EHTC. From Figure 13, it can be observed that the difference can be divided into three categories according to average wind speeds and total rain hours of every month:
- (a)
- The differences between THTC-Y and THTC-N are large in January, July, September, and October with climate features of high wind speeds and strong rainfall, or relatively low wind speeds and especially frequent rainfall. For July particularly, EHTC reaches up to 12.5 W/(m2·K) under the combined action of high wind speeds and strong rainfall.
- (b)
- The differences between THTC-Y and THTC-N are small from February to May, as these months possess relatively low or medium wind speeds and very few total rain hours. The EHTCs in these several months are all less than 2.5 W/(m2·K) (only 0.8 W/(m2·K) for April).
- (c)
- The differences between THTC-Y and THTC-N are in the range of 4–6 W/(m2·K) in August, November, and December, when the outdoor mean wind speeds and total rain hours are medium.
It should be noted that the difference between THTC-Y and THTC-N in June does not belong to any of the categories above, and the characteristic of high wind speed and little rainfall is particularly similar with that of winter in northern China. As a result, the EHTC in June is 4.6 W/(m2·K).
3.3.3. Seasonal Average Heat Transfer Coefficients
The heat transfer coefficients of different seasons in the tropical island region are listed in Table 3, and the meteorological division method is used to delimit four seasons in this study. From Table 3, we can know that the difference between THTC-Y and THTC-N is minimum in spring and maximum in summer, and they are 1.5 W/(m2·K) and 7.2 W/(m2·K) respectively. Except for this, the difference is 5.2 W/(m2·K) for the whole year. Thus, the effect of evaporation heat transfer on THTC is significant and cannot be ignored directly. Additionally, because the current Chinese standard only gives THTC recommended values in summer and winter, we mainly make a comparison between the THTCs provided by this study and the THTCs recommended by the standard here. It should be noted that THTC recommended values in the current Chinese standard are a consequence without distinction for wind speed size and consideration for evaporation heat transfer, and they must have a certain gap with the THTCs considering wind speed size and evaporation effects in this study. Furthermore, the differences are 19.9 W/(m2·K) in summer and 10.4 W/(m2·K) in winter, respectively. Therefore, as far as the tropical island building is concerned, strong wind contributes to large CHTC, together with heavy rainfall, then EHTC cannot be ignored. Consequently, THTCs in the tropical island region are much higher than the recommended values in the current Chinese standard aimed at inland climates.
Here, it should be noted that convective, radiation, and evaporative heat transfer are three forms of heat transfer between an envelope surface and the ambient environment in the heat balance equation of external building surfaces. When the envelope surface is wet, the three forms of heat transfer occur simultaneously, but the interaction effects among the three forms of heat transfer are not considered in the heat balance equation of external building surfaces. Therefore, it is unnecessary to take into account the influence of rain on CHTC and RHTC.
4. Discussion
4.1. Analysis on Data Sample Size of the Naphthalene Sublimation Experiment
Owing to the hard experimental conditions and other factors, the field measurements in the tropical island region were very difficult. Thus, the CHTC testing days and sample size of the naphthalene sublimation experiment were fewer. However, this would not affect the reliability of the CHTC model, because the data used to obtain the correlation between CHTC and wind speed were from 8 November and 9 November 2016, and the weather on the two days was sunny and had a certain representativeness. Additionally, the CHTC predictive model was examined by comparing the predicted CHTCs under measured wind speeds and the measured CHTCs on 19 August 2016, and the percentage errors were all less than 5% for the different verification groups, additionally, the mean percentage error (MPE) was merely 2.50%. Therefore, the CHTC predictive model presented in this study was thought to be reliable for estimating CHTC in the tropical island region.
4.2. Effect of Envelope Surface Roughness on CHTC Calculation
The CHTC is influenced by many factors, such as wind speed, surface roughness, fluid characteristics, and so on. However, considering that the convective heat transfer coefficient is mainly affected by wind velocity, we investigated the correlation between CHTC and wind velocity only. It should be pointed out that other influencing factors are also included in the fitting formula according to the analogy theory of heat and mass transfer, because the measuring parameters, such as air temperature (Ta) and test specimen surface temperature (Ts), are influenced by surface roughness and fluid characteristics. Therefore, the surface roughness has been considered in the CHTC calculation result.
4.3. Optimization Study on EHTC Calculation Model
Considering that the occurrence of rainfall and evaporation heat transfer do not correspond exactly in real time, we calculated EHTC with some simplifications and hypotheses. It must be pointed out that our study on EHTC is still in the preliminary exploration stage for the presentation of the evaporative concept, discussing the degree of influence of EHTC on THTC and indicating that EHTC is non-negligible in the tropical island region. To date, the daily average EHTC can be obtained by the simplified calculation model, and the optimization study on the calculation model will appear in our follow-up work.
4.4. Improvement of Meteorological Data
Limited by the lack of meteorological data in the tropical island region, parameters such as hourly temperature, relative humidity, wind speed, and rainfall were all concentrated in the period from June 2015 to May 2016 in this study. We have realized that this is a shortcoming for our study. Therefore, we are bound to pay attention to collecting and organizing climatological data in the tropical island region uninterruptedly in order to update and improve the basic meteorological database, and then increase the reliability of correlational studies in the future works.
5. Conclusions
According to the experimental and theoretical study on heat transfer coefficients of building external surfaces in the tropical island region, some main findings can be summarized as below:
- Based on full-scale measurements in the tropical island region, the function expression between CHTC and wind speed was investigated to be CHTC = 5.56 + 4.48u (R2 = 0.94), and the CHTC predictive formula was validated to be reliable, with a mean percentage error of 2.50% for estimating CHTCs in the tropical island region.
- The characteristics of daily average heat transfer coefficients in the tropical island region were as follows: The variation trend of CHTC was coincident with wind speed, and the daily average CHTCs were all concentrated in the range of 10–60 W/(m2·K); RHTC was almost impervious to wind speed and rainfall variations, keeping unchanged at 5.8 W/(m2·K); and EHTC showed strong randomness and indeterminacy owing to rainfall effects, and it had a wider changing range from 0 to 160 W/(m2·K).
- Whether evaporation was considered or not, THTC differences were all less than 2.5 W/(m2·K) from February to May, since these months possessed relatively low or medium wind speeds and very few total rain hours. Except for the several months above, THTC differences were all more than 4.6 W/(m2·K), and for July particularly, the THTC difference reached up to 12.5 W/(m2·K) under the conjoint action of high wind speed and strong rainfall. Additionally, in terms of the whole year, the THTC difference was 5.2 W/(m2·K). Consequently, the effect of evaporation heat transfer on THTC is significant and cannot be ignored directly.
- When evaporation was taken into account, the daily average THTC ranged from approximately 16 to 220 W/(m2·K) throughout the year. Furthermore, the number of days that THTC was more than 25W/(m2·K) was 219, occupying a 60% proportion of year-round time.
- THTCs with consideration of evaporation in winter and summer were respectively 33.4 W/(m2·K) and 38.9 W/(m2·K) in the tropical island region, which are much larger than the recommended values in the current national standard.
Author Contributions
J.X. and J.L. designed and performed the experiments; P.X. analyzed the data; Y.C. conceived and wrote the paper.
Funding
This research was funded by National Natural Science Foundation of China, grant number 51590912 and 51578013, and Natural Science Foundation of Beijing, Youth Program, grant number 8184061.
Acknowledgments
The authors would like to express their gratitude to all the people and organizations involved in this study.
Conflicts of Interest
The authors declare no conflict of interest.
Nomenclatures
| English symbols | |
| hc | convective heat transfer coefficient, W/m2·K |
| hd | convective mass transfer coefficient, m/s |
| hr | radiation heat transfer coefficient, W/m2·K |
| he | evaporative heat transfer coefficient, W/m2·K |
| Cp | specific heat, kJ/kg·K |
| D | mass diffusion coefficient, m2/s |
| l | representative length of target surface, m |
| u | wind velocity, m/s |
| a | thermal diffusion coefficient, m2/s |
| Nu | Nusselt number (=hl/λ) |
| Sh | Sherwood number (=hdl/D) |
| Re | Reynolds number (=ul/ν) |
| Pr | Prandtl number (=ν/a) |
| Sc | Schmidt number (=ν/D) |
| Le | Lewis number (=λ/ρCpD) |
| n | empirical constant |
| m | empirical constant |
| Ta | air temperature, K |
| Patm | atmospheric pressure close to measured position, Pa |
| Ts | test specimen surface temperature, K |
| Pv,s | naphthalene saturated pressure on test specimen surface, Pa |
| Rnapht | gas constant for naphthalene, J/kg·K |
| qra | radiation heat transfer between envelope surface and surrounding environment, W/m2 |
| Cb | blackbody radiation constant, 5.67W/(m2·K4) |
| Tw | envelope surface temperature, K |
| F1 | envelope surface area, m2 |
| F2 | atmosphere radiation area, m2 |
| Tm | average temperature between envelope surface and air, K |
| mwater | the water mass flow of evaporation, (kg/s·m2) |
| Cw | water vapor concentration on building surface, kg/m3 |
| Ca | water vapor concentration in ambient air, kg/m3 |
| Rwater | gas constant for water vapor, J/kg·K |
| Pw | water vapor partial pressure on envelope surface, pa |
| Pa | water vapor partial pressure in ambient air, pa |
| r | latent heat of water, kJ/kg |
| Greek symbols | |
| ρ | density, kg/m3 |
| λ | thermal conductivity, W/m·K |
| ν | kinematical viscosity, m2/s |
| δm | mass loss of specimen per unit of naphthalene surface area, kg/m2 |
| δt | time interval, s |
| ρv,s | naphthalene saturated vapor density on test specimen surface, kg/m3 |
| ρv,∞ | naphthalene vapor density in free-flowing air, kg/m3 |
| εwa | system emissivity |
| εw | envelope surface emissivity |
| εa | atmosphere emissivity |
| θ | temperature factor, K3 |
| φw | relative humidity on envelope surface, % |
| φa | relative humidity in ambient air, % |
| β | ratio of evaporation heat transfer coefficient to convection heat transfer coefficient |
References
- Liu, Y.X.; Luo, G.L.; Zhuang, Y. The Status and Forecast of China’s Exploitation of Renewable Marine Energy Resources. J. Coast. Res. 2015, 73, 193–196. [Google Scholar] [CrossRef]
- Wu, H.; Wang, D.J.; Liu, Y.F.; Wang, Y.Y. Study on the effect of building envelope on cooling load in hot-humid climate. Procedia Eng. 2017, 205, 975–982. [Google Scholar] [CrossRef]
- Zhang, Y.; Gong, X.W. The Energy Saving Effect Evaluation for Outside Wall with Different Material in Island District. Adv. Mater. Res. 2011, 301–303, 377–383. [Google Scholar] [CrossRef]
- Emmel, M.G.; Abadie, M.O.; Mendes, N. New external convective heat transfer coefficient correlations for isolated low-rise buildings. Energy Build. 2007, 39, 335–342. [Google Scholar] [CrossRef]
- Wijeysundera, N.E.; Chou, S.K.; Jayamaha, S.E.G. Heat flow through walls under transient rain conditions. J. Build. Phys. 1993, 17, 118–141. [Google Scholar] [CrossRef]
- MOHURD. Code for Thermal Design of Civil Building (GB 50176-2016); China Architecture & Building Press: Beijing, China, 2016. (In Chinese) [Google Scholar]
- McAdams, W.H. Heat Transmission, 3rd ed.; McGraw-Hill: New York, NY, USA, 1954. [Google Scholar]
- Zhang, J. A study on the convective heat transfer coefficient of concrete in wind tunnel experiment. China Civ. Eng. J. 2006, 39, 39–42. [Google Scholar]
- Lee, Y.; Choi, M.S.; Yi, S.T.; Kim, J.K. Experimental study on the convective heat transfer coefficient of early-age concrete. Ceme. Concr. Comp. 2009, 31, 60–71. [Google Scholar] [CrossRef]
- Montazeri, H.; Blocken, B. New generalized expressions for forced convective heat transfer coefficients at building facades and roofs. Build. Environ. 2017, 119, 153–168. [Google Scholar] [CrossRef]
- Kanda, M. Progress in the scale modeling of urban climate: Review. Theor. Appl. Climatol. 2006, 84, 23–33. [Google Scholar] [CrossRef]
- Li, Q.S.; Fu, J.Y.; Xiao, Y.Q.; Li, Z.N.; Ni, Z.H.; Xie, Z.N.; Gu, M. Wind tunnel and full-scale study of wind effects on China’s tallest building. Eng. Struct. 2006, 28, 1745–1758. [Google Scholar] [CrossRef]
- Jayamaha, S.E.G.; Wijeysundera, N.E.; Chou, S.K. Measurement of the heat transfer coefficient for walls. Build. Environ. 1996, 31, 399–407. [Google Scholar] [CrossRef]
- Sharples, S.; Charlesworth, P.S. Full-scale measurements of wind-induced convective heat transfer from a roof-mounted flat plate solar collector. Sol. Energy 1998, 62, 69–77. [Google Scholar] [CrossRef]
- Hagishima, A.; Tanimoto, J. Field measurements for estimating the convective heat transfer coefficient at building surfaces. Build. Environ. 2003, 38, 873–881. [Google Scholar] [CrossRef]
- Hagishima, A.; Tanimoto, J.; Narita, K. Intercomparisons of experimental convective heat transfer coefficients and mass transfer coefficients of urban surfaces. Bound-Lay Meteorol. 2005, 117, 551–576. [Google Scholar] [CrossRef]
- Liu, Y.; Harris, D.J. Full-scale measurements of convective coefficient on external surface of a low-rise building in sheltered conditions. Build. Environ. 2007, 42, 2718–2736. [Google Scholar] [CrossRef]
- Loveday, D.L.; Taki, A.H. Convective heat transfer coefficients at a plane surface on a full-scale building façade. Int. J. Heat Mass Tran. 1996, 39, 1729–1742. [Google Scholar] [CrossRef]
- Zhang, L.; Sun, J.; Chen, Y.M.; Tang, G.F. Research on system identification of wall surface heat transfer processes. Exp. Heat Transf. 2002, 15, 31–47. [Google Scholar] [CrossRef]
- Ito, N.; Kimura, K.; Oka, J. A field experiment study on the convective heat transfer coefficient on exterior surface of a building. ASHRAE Trans. 1972, 78, 184–191. [Google Scholar]
- Clear, R.D.; Gartland, L.; Winkelmann, F.C. An empirical correlation for the outside convective air-film coefficient for horizontal roofs. Energy Build. 2003, 35, 797–811. [Google Scholar] [CrossRef]
- Makhmalbaf, M.H.M. Experimental study on convective heat transfer coefficient around a vertical hexagonal rod bundle. Heat Mass Transf. 2012, 48, 1023–1029. [Google Scholar] [CrossRef]
- Palyvos, J.A. A survey of wind convection coefficient correlations for building envelope energy systems’ modeling. Appl. Therm. Eng. 2008, 28, 801–808. [Google Scholar] [CrossRef]
- Defraeye, T.; Defraeye, B.; Carmeliet, J. Convective heat transfer coefficients for exterior building surfaces: Existing correlations and CFD modelling. Energy Convers. Manag. 2011, 52, 512–522. [Google Scholar] [CrossRef]
- Mirsadeghi, M.; Costola, D.; Blocken, B.; Hensen, J.L.M. Review of external convective heat transfer coefficient models in building energy simulation programs: Implementation and uncertainty. Appl. Therm. Eng. 2013, 56, 134–151. [Google Scholar] [CrossRef]
- Shao, J.T.; Liu, J.; Zhao, J.N.; Zhang, W.W.; Sun, D.X.; Fu, Z.P. A novel method for full-scale measurement of the external convective heat transfer coefficient for building horizontal roof. Energy Build. 2009, 41, 840–847. [Google Scholar] [CrossRef]
- Shao, J.T.; Liu, J.; Zhao, J.N.; Zhang, W.W.; Fu, Z.P.; Zhu, Q.Y. Field measurement of the convective heat transfer coefficient on vertical external building surfaces using naphthalene sublimation method. J. Build. Phys. 2010, 33, 307–326. [Google Scholar] [CrossRef]
- Sodha, M.S.; Khatry, A.K.; Malik, M.A.S. Reduction of heat flux through a roof by water film. Sol. Energy 1978, 20, 189–191. [Google Scholar] [CrossRef]
- Sodha, M.S.; Kumar, A.; Singh, U.; Tiwari, G.N. Periodic theory of an open roof pond. Appl. Energy 1980, 7, 305–319. [Google Scholar] [CrossRef]
- Meng, Q.L.; Chen, Q.G.; Ran, M.Y.; Li, J.C.; Cai, N. Derivation of the vaporizing heat transfer coefficient he. Acta Energiae Sol. Sin. 1999, 20, 216–219. (In Chinese) [Google Scholar]
- Chen, Q.G. The valve of heat transfer coefficient at exterior of building envelope in heat insulation calculation. In Proceedings of the Architectural Physics Study, Chongqing, China, 1 September 2004; pp. 171–174. (In Chinese). [Google Scholar]
- Liu, Y.F.; Liu, J.P. Study of heat transfer coefficient of building external surface. J. Xi’an Univ. Arch. Technol. (Nat. Sci. Ed.) 2008, 40, 407–412. (In Chinese) [Google Scholar]
- Goldstein, R.J.; Cho, H.H. A review of mass transfer measurements using naphthalene sublimation. Exp. Therm. Fluid Sci. 2015, 10, 416–434. [Google Scholar] [CrossRef]
- Lau, S.C.; Cervantes, J.; Han, J.C.; Rudolph, R.J.; Flannery, K. Measurements of wall heat (mass) transfer for flow through blockages with round and square holes in a wide rectangular channel. Int. J. Heat Mass Tran. 2003, 46, 3991–4001. [Google Scholar] [CrossRef]
- Sang, D.H.; Jang, I.H.; Cho, H.H. Experimental study on flow and local heat/mass transfer characteristics inside corrugated duct. Int. J. Heat Fluid Fluid 2006, 27, 21–32. [Google Scholar]
- Cho, K.N.; Irvine, T.F.; Karni, J. Measurement of the diffusion coefficient of naphthalene into air. Int. J. Heat Mass Tran. 1992, 35, 957–966. [Google Scholar]
- Ambrose, D.; Lawrenson, I.J.; Sprake, C.H.S. The vapour pressure of naphthalene. J. Chem. Thermodyn. 1975, 7, 1173–1176. [Google Scholar] [CrossRef]
- Yan, Q.S.; Zhao, Q.Z. Building Thermal Process, 1st ed.; China Architecture & Building Press: Beijing, China, 1986. (In Chinese) [Google Scholar]
- Tao, W.Q. Numerical Heat Transfer, 2nd ed.; Xi’an Jiaotong University Press: Xian, China, 2001. (In Chinese) [Google Scholar]
- Tang, R.S.; Etzion, Y. Comparative studies on the water evaporation rate from a wetted surface and that from a free water surface. Build. Environ. 2004, 39, 77–86. [Google Scholar] [CrossRef]
Figure 1.
Experimental instruments or devices: (a) Naphthalene test specimen, (b) electronic balance, (c) infrared thermometer, (d) temperature and humidity recorder, (e) hot-wire anemometer, and (f) homemade bracket.
Figure 1.
Experimental instruments or devices: (a) Naphthalene test specimen, (b) electronic balance, (c) infrared thermometer, (d) temperature and humidity recorder, (e) hot-wire anemometer, and (f) homemade bracket.

Figure 2.
Production process of the naphthalene specimen.

Figure 3.
Steps of the naphthalene sublimation experiment.
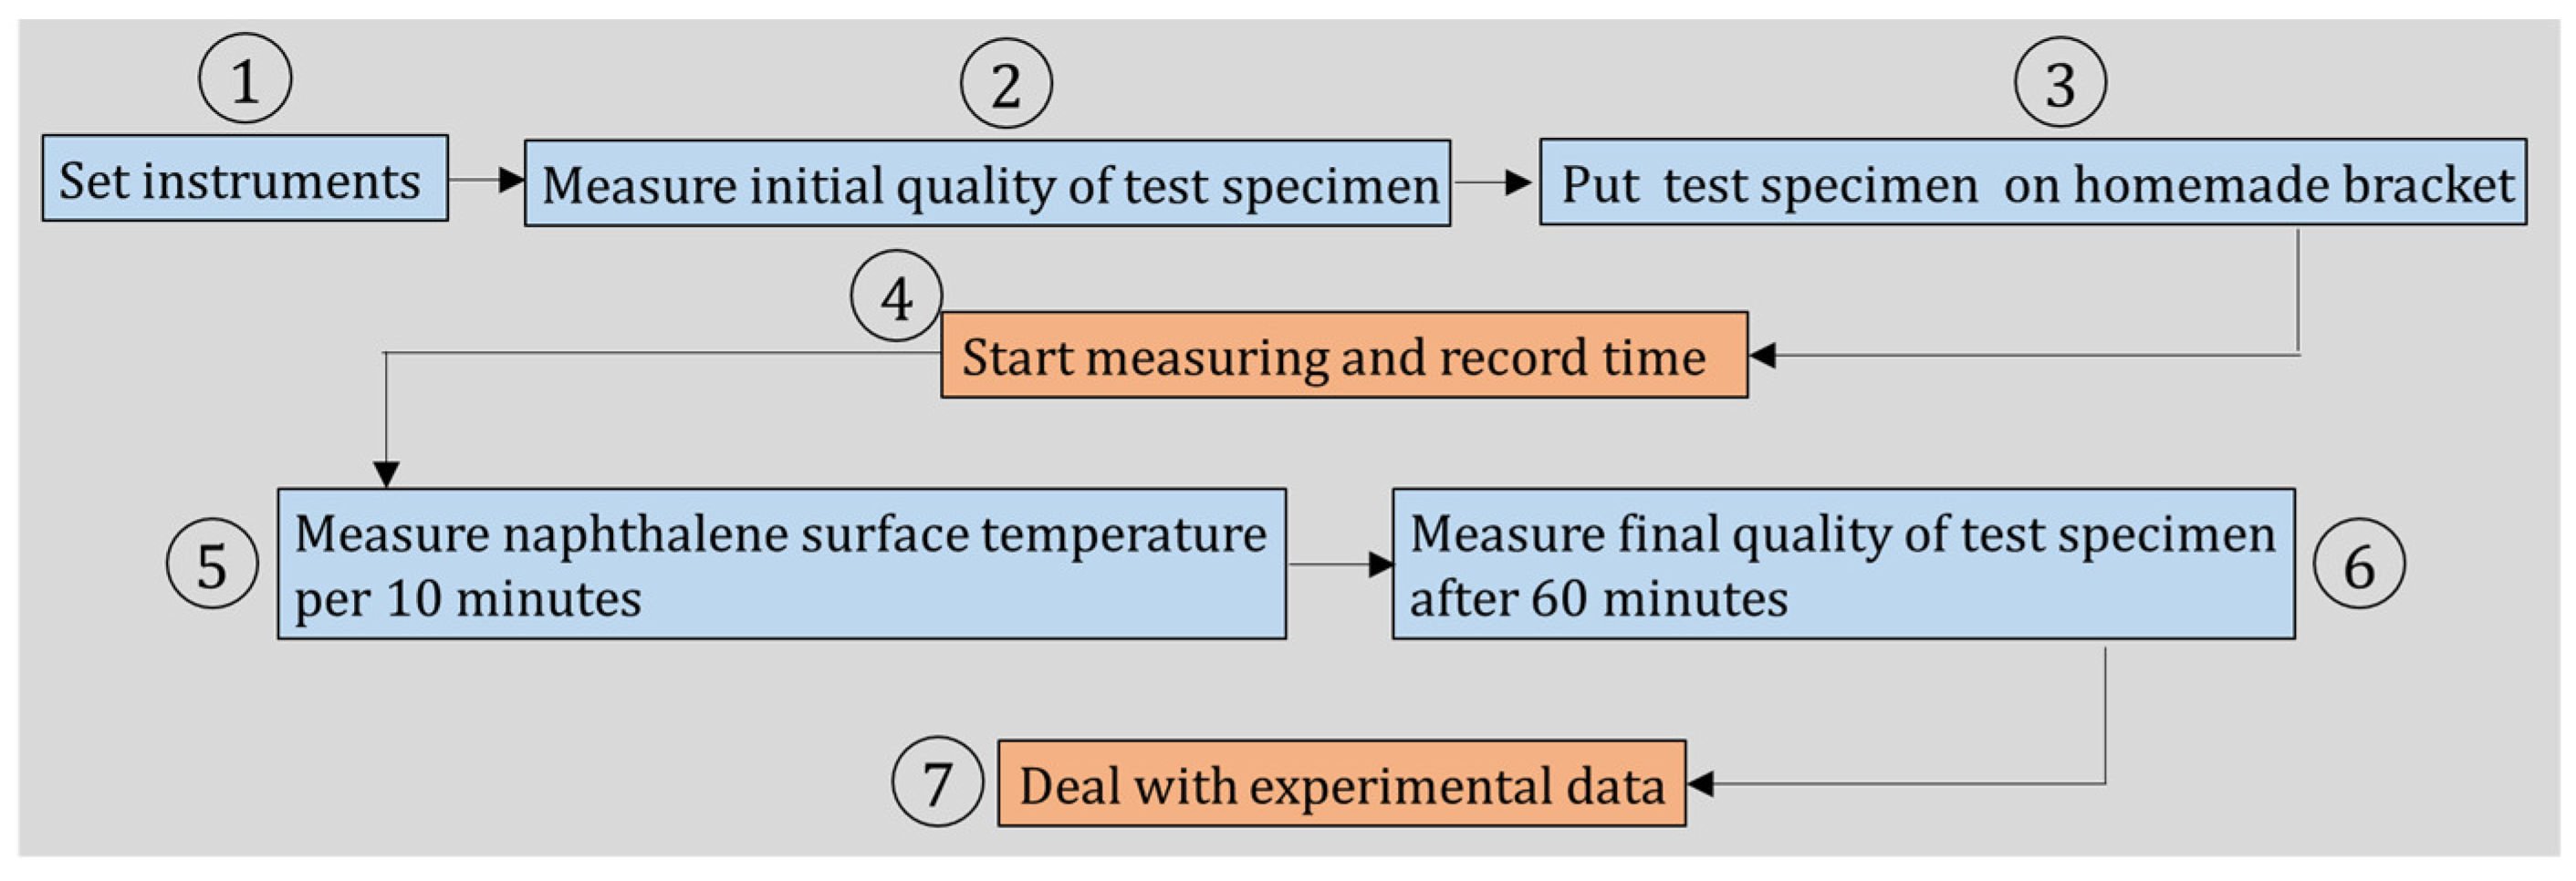
Figure 4.
Plan graph of the test subject.

Figure 5.
Changing diagram of air temperature and relative humidity during testing.

Figure 6.
Relationship between convective heat transfer coefficient (CHTC) and wind speed.
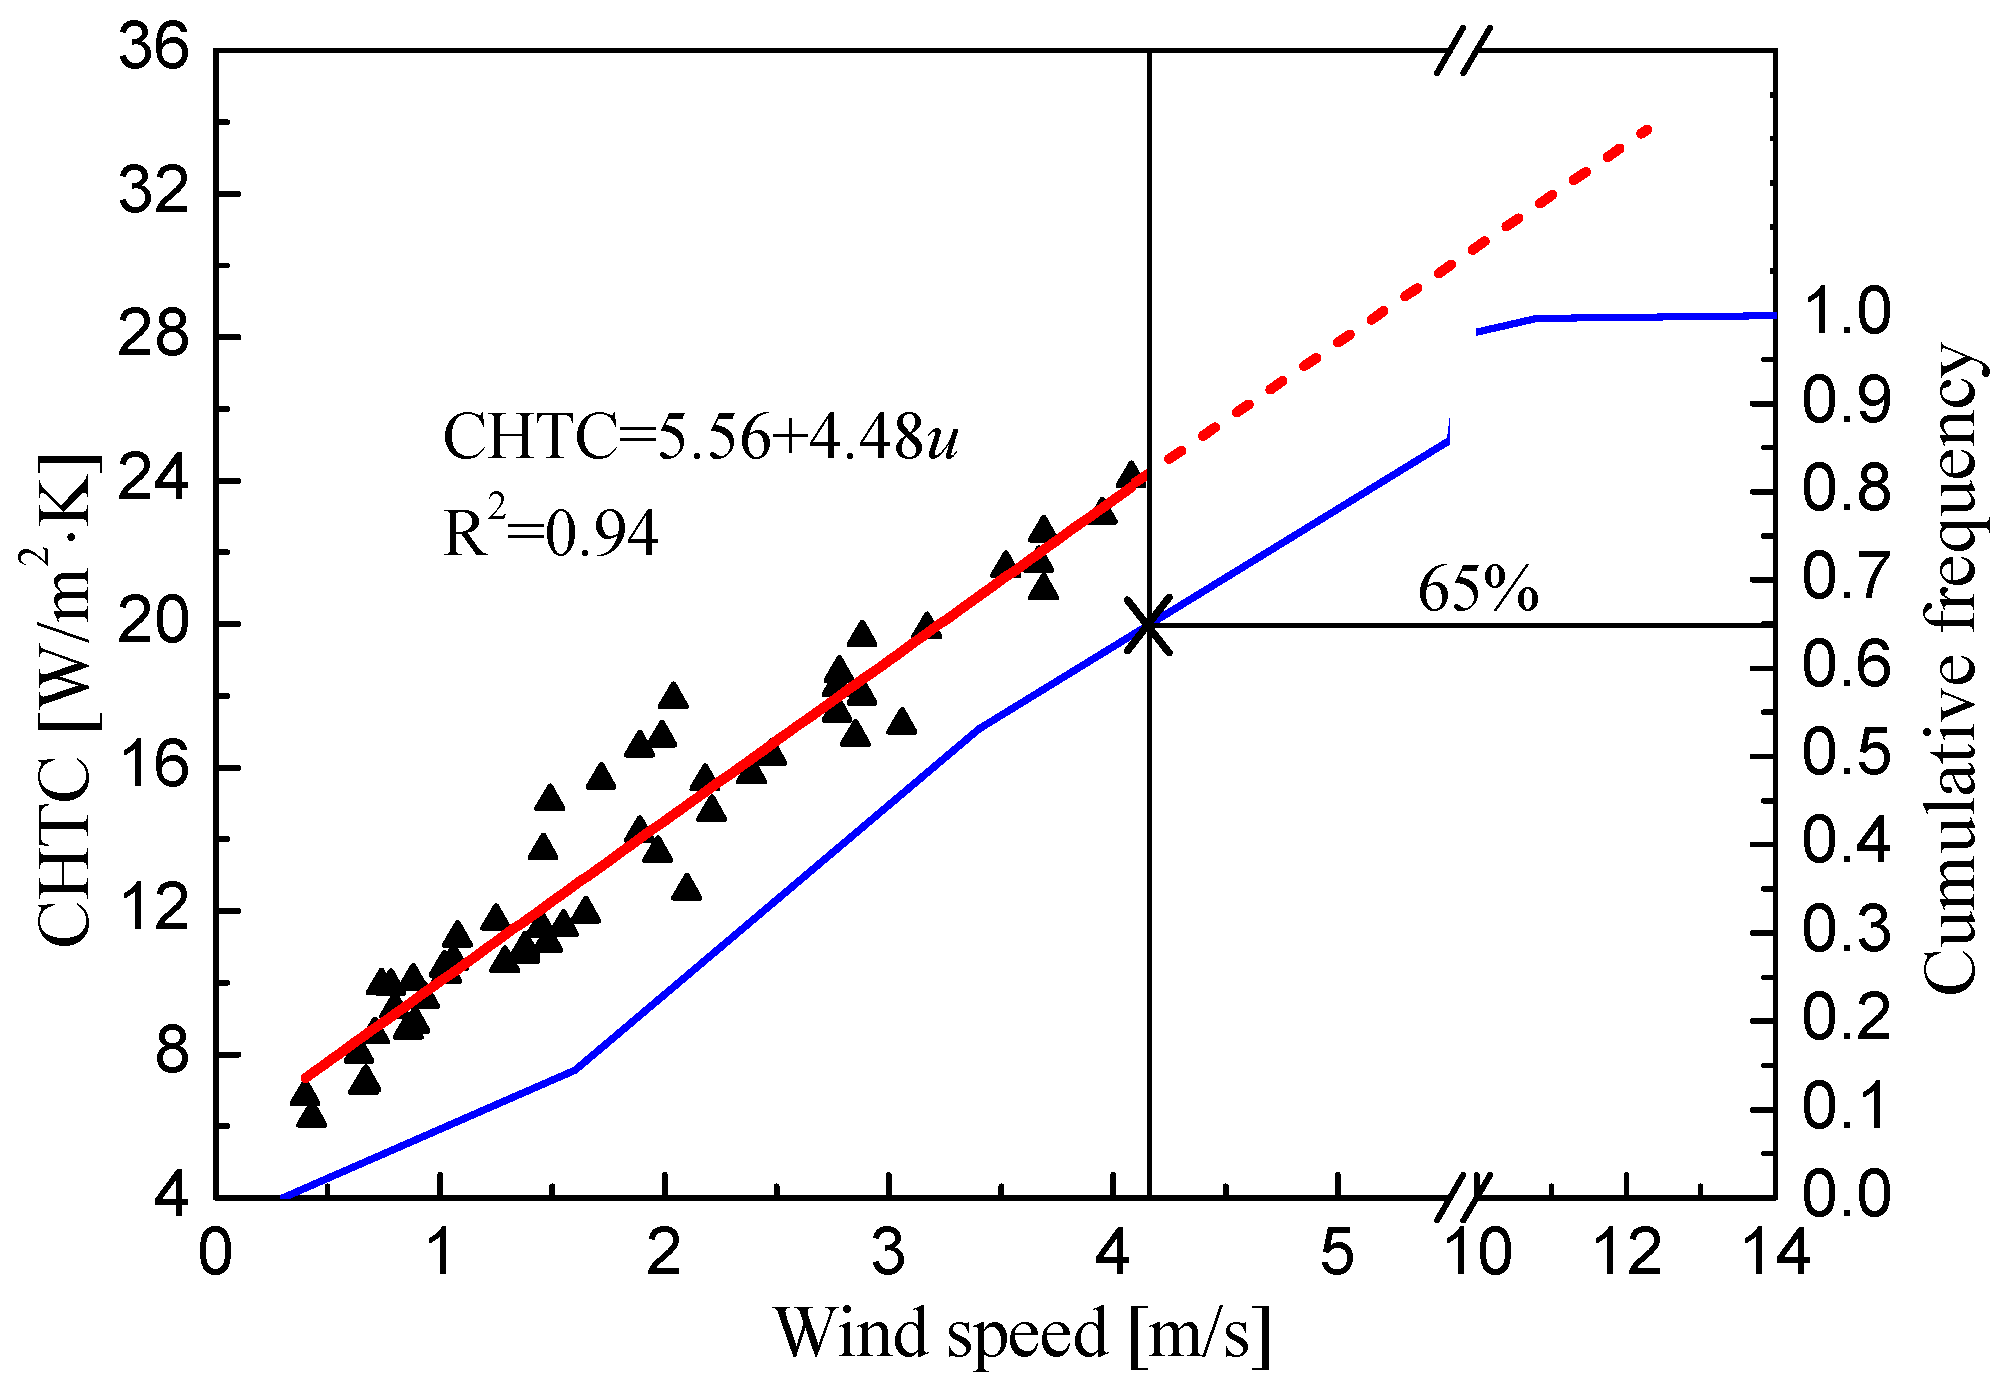
Figure 7.
Comparative results between predicted and measured CHTCs.

Figure 8.
Daily variation curves of average wind speeds and total rain hours in Xisha.

Figure 9.
Statistical result of high wind speed proportions among different cities.

Figure 10.
Annual precipitation of different representative cities.

Figure 11.
Daily variation relationship between heat transfer coefficients, wind speeds, and rain hours in the tropical island region.
Figure 11.
Daily variation relationship between heat transfer coefficients, wind speeds, and rain hours in the tropical island region.
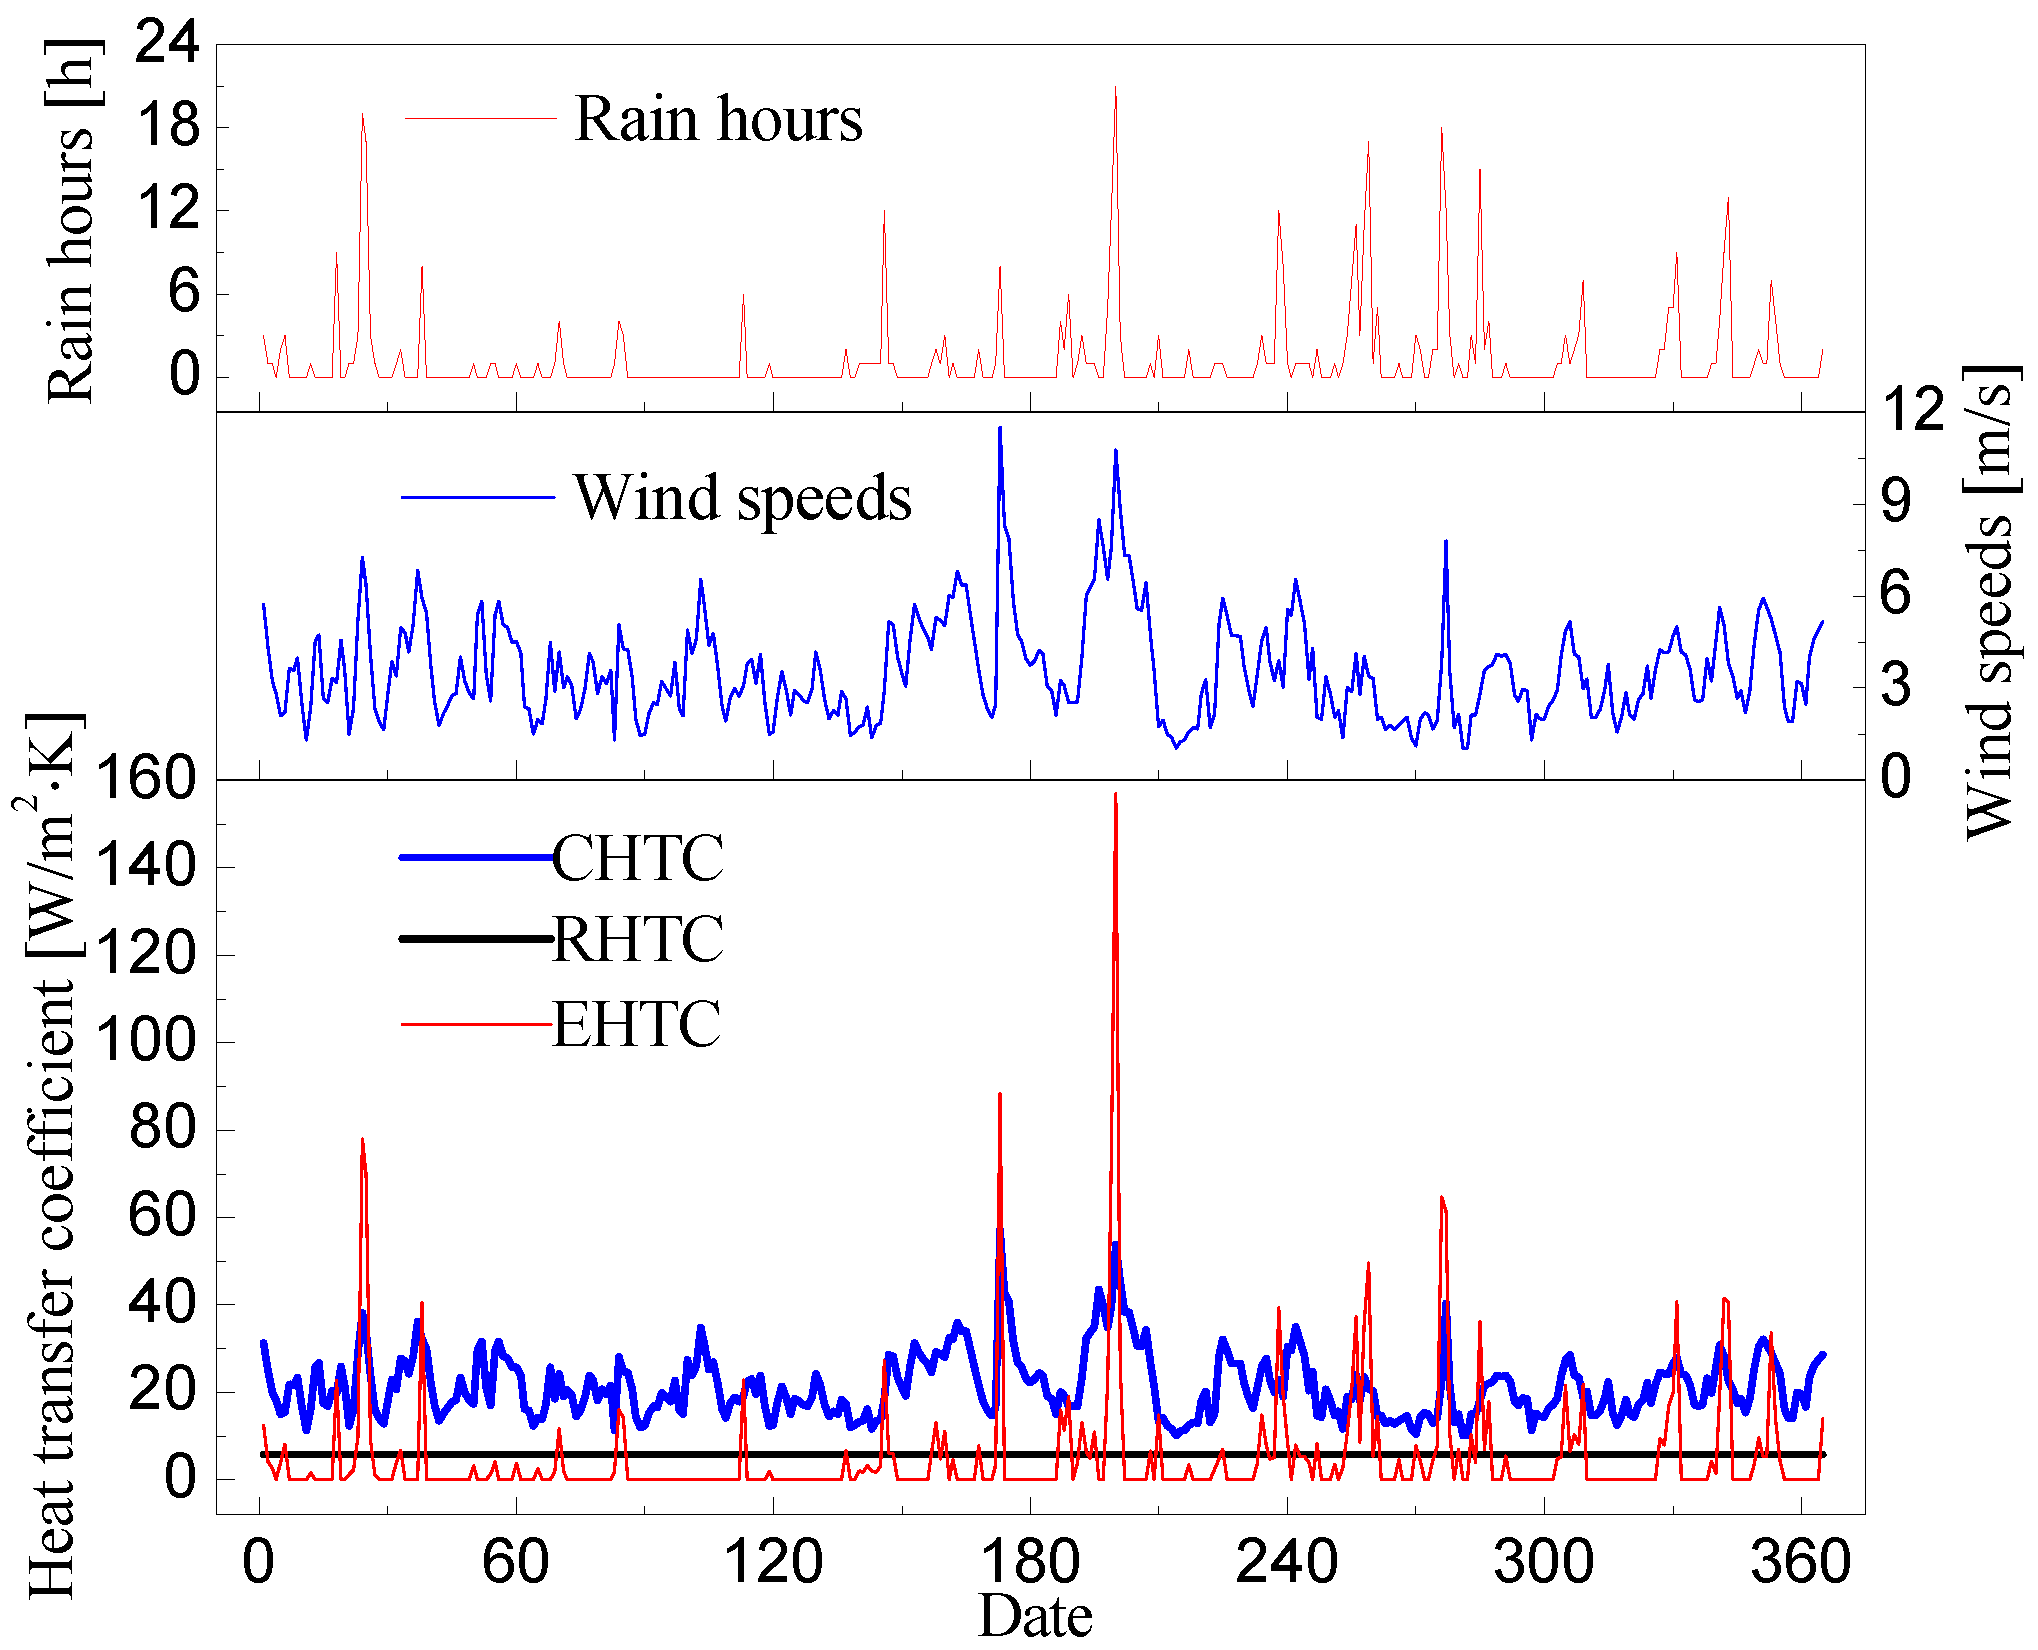
Figure 12.
Frequency distribution of daily average heat transfer coefficient.

Figure 13.
Monthly variation relationship between heat transfer coefficients, wind speeds, and rain hours in the tropical island region.
Figure 13.
Monthly variation relationship between heat transfer coefficients, wind speeds, and rain hours in the tropical island region.


Table 1.
Accuracies, sampling intervals, and mounting heights of instruments.
| Instruments | Accuracy | Sampling Interval | Mounting Height |
|---|---|---|---|
| Electronic balance | 0.001 g | — | — |
| Temperature and humidity recorder | ±0.4 °C, ±2%RH | 30 s | 1.2 m |
| Infrared thermometer | ±0.75 °C | — | — |
| Hot-wire anemometer | (0.03 + 5% measured value) m/s | 10 s | 1.2 m |
Table 2.
Radiation heat transfer coefficients (RHTCs) under different average temperatures.
| tm/°C | 40 | 37.5 | 35 | 32.5 | 30 | 27.5 |
| Tm/K | 313 | 310.5 | 308 | 305.5 | 303 | 300.5 |
| θ/K3 | 1.23 | 1.20 | 1.17 | 1.14 | 1.11 | 1.09 |
| RHTC/[W/m2·K] | 5.91~6.61 | 5.77~6.45 | 5.63~6.30 | 5.50~6.14 | 5.36~5.99 | 5.23~5.85 |
Table 3.
Heat transfer coefficients of different seasons in the tropical island region.
| Time | u [m/s] | Rain Hours [h] | CHTC | RHTC | EHTC | THTC-Y | THTC-N | THTC (Standard) |
|---|---|---|---|---|---|---|---|---|
| [W/m2·K] | ||||||||
| Spring | 3.02 | 45 | 19.1 | 5.8 | 1.5 | 26.4 | 24.9 | — |
| Summer | 4.56 | 118 | 26.0 | 7.2 | 38.9 | 31.8 | 19.0 | |
| Autumn | 2.91 | 175 | 18.6 | 6.9 | 31.3 | 24.4 | — | |
| Winter | 3.76 | 126 | 22.4 | 5.2 | 33.4 | 28.2 | 23.0 | |
| Whole year | 3.56 | 464 | 21.5 | 5.2 | 32.5 | 27.3 | — | |
© 2019 by the authors. Licensee MDPI, Basel, Switzerland. This article is an open access article distributed under the terms and conditions of the Creative Commons Attribution (CC BY) license (http://creativecommons.org/licenses/by/4.0/).
Share and Cite
MDPI and ACS Style
Cui, Y.; Xie, J.; Liu, J.; Xue, P. Experimental and Theoretical Study on the Heat Transfer Coefficients of Building External Surfaces in the Tropical Island Region. Appl. Sci. 2019, 9, 1063. https://doi.org/10.3390/app9061063
AMA Style
Cui Y, Xie J, Liu J, Xue P. Experimental and Theoretical Study on the Heat Transfer Coefficients of Building External Surfaces in the Tropical Island Region. Applied Sciences. 2019; 9(6):1063. https://doi.org/10.3390/app9061063
Chicago/Turabian StyleCui, Yaping, Jingchao Xie, Jiaping Liu, and Peng Xue. 2019. "Experimental and Theoretical Study on the Heat Transfer Coefficients of Building External Surfaces in the Tropical Island Region" Applied Sciences 9, no. 6: 1063. https://doi.org/10.3390/app9061063
Note that from the first issue of 2016, this journal uses article numbers instead of page numbers. See further details here.