Article

Disentangling Long Trajectory Contributions in Two-Colour High Harmonic Generation

1
Max Planck Insitute for the Physics of Complex Systems, Nöthnitzer Straße 38, D-01187 Dresden, Germany
2
Department of Physics, ETH Zurich, 8093 Zurich, Switzerland
*
Author to whom correspondence should be addressed.
Appl. Sci. 2018, 8(3), 341; https://doi.org/10.3390/app8030341
Submission received: 18 January 2018 / Revised: 20 February 2018 / Accepted: 23 February 2018 / Published: 28 February 2018
(This article belongs to the Special Issue Extreme Time Scale Photonics)

Abstract

:
This work investigates High Harmonic Generation (HHG) in gas targets, induced by intense two-colour driving fields. We compared classical trajectory Monte Carlo simulations based on a semiclassical model of strong field tunnel ionisation of helium to experimental HHG spectra, and investigated the relative contribution of long trajectories to low harmonic orders. This phenomenon can be found even when the experimental setup is chosen to suppress long trajectories and favour phase matching for short trajectories.

1. Introduction

The fundamental process of High Harmonic Generation (HHG) was first discovered in the late 1980s [1,2]. Starting from ultrashort few-femtosecond (fs = 10 15 s) driving pulses (typically in the visible or near-infrared wavelength domain), HHG is an extremely nonlinear frequency up-conversion process, creating Extreme Ultra-Violet (XUV) pulses with a pulse duration shorter than a femtosecond (the current world record is 43 attoseconds (as = 10 18 s) [3]). Since then, HHG-created XUV pulses have found diverse applications in ultrafast science [4,5,6,7]. First, the intuitive three-step-model of HHG was developed within a single-atom response [8,9,10], which introduced the concept of short and long trajectories in HHG. Then, the macroscopic medium was also taken into account including propagation and phase matching [11,12,13], which typically favours the short trajectories. Finally, the temporal coherence was explored [14], which showed two distinct spatial regions with different coherence times in the far-field pattern of the high harmonics depending on the two different trajectories. As the general understanding became better, HHG spectroscopy was also proposed [15,16], which combines sub-Ångström spatial with attosecond temporal resolution. Dudovich then proposed a new approach for HHG with a two-colour field in an orthogonal configuration that enables controlling and decoupling the angle of ionisation and the angle of recollision and therefore increasing the dimensionality of HHG spectroscopy [17,18]. Here, we explore the contribution of the long trajectories and the parent ion interactions in two-colour HHG using Classical Trajectory Monte Carlo (CTMC) simulations. The work presented in this article focuses on HHG in helium gas.
The intuitive three-step-model of HHG was developed by [8,9,10]. In the first, quantum mechanical step, a strong driving field tunnel ionises an electron, which is subsequently accelerated classically by the strong laser field. In the case of small ellipticity or linear polarisation, photoelectrons can be driven back into their parent ion by the laser field. These photoelectrons can then either rescatter, or recombine again, representing the third step. In the case of recombination, a high energy photon is emitted, where the frequency of the high harmonic is determined by energy conservation
ω n = E kin + I p ,
with ω n = n · ω , I p the ionisation potential and E kin the kinetic energy of the photoelectron when recombining. Atomic units are used throughout this manuscript, unless otherwise specified.
The linearly polarised driving field is given by
F x ( t ) = f ( t ) F 0 cos ω t x ^ ,
with envelope f ( t ) , maximum field strength F 0 , optical frequency ω , and polarisation axis x. The standard Strong Field Approximation (SFA) [19] neglecting the ion Coulomb field after ionisation, and dipole approximation [20] neglecting the spatial dependence of the laser field are used, as well as a single active electron assumption [21].
Depending on time t i when a photoelectron is liberated, the trajectories will return at a different time t r ( t i ) and carry a different kinetic energy E t i , indicated by the colour code in Figure 1. For most energies, there are two trajectories, a long trajectory that starts soon after the peak of the field (greyed out in Figure 1), and a short trajectory that starts later in the cycle (full colours). The energy cutoff of the returning photoelectrons is provided by the single trajectory separating the domains of short and long trajectories. The cutoff energy is calculated to be
E cutoff = n max ω = 3.17 U p + I p ,
which corresponds to the maximum possible electron kinetic energy at the time of recombination [22]. Depending on the focus position relative to the gas jet for HHG, the contribution of the long trajectories in the HHG signal can be changed [14] and, with the right balance, quantum path interference between the short and long trajectory was observed for the first time in HHG [23] in excellent agreement with theory [24], and then extended to many other gas targets [25].
During the derivation of this quantum model by Lewenstein et al. [22], several assumptions of the classical trajectory three-step-model are confirmed. The contributing trajectories must return to their parent ion again, which also imparts conditions on the initial momentum of the trajectory right after tunnel ionisation. Furthermore, in a recent experimental study, it was found that the spatial excursions of HHG trajectories are also well explained by the semiclassical model [26]. Therefore, it is valid and helpful to investigate the HHG process in greater detail using Classical Trajectory Monte Carlo (CTMC) simulations.
Since the strong field tunnel ionisation rate declines exponentially with decreasing field strength [19], long trajectories are preferentially created. However, due to the spreading of the wave packet during the propagation, the probability of recombination decreases with increasing excursion time. In addition, long trajectories show more efficient phase matching in the converging beam, when the gas interaction region is placed before the focus of the driving laser beam [27]. For short trajectories, on the other hand, the phase matching is more efficient in the diverging beam after the laser focus, and it is easier to achieve than for short trajectories. Optimizing the gas jet parameters after the beam focus, combined with the quantum spreading of the wave packet, one can work against the preference towards long trajectories from the ionisation rate. In practice, therefore, the optimised HHG spectrum consists almost exclusively of short trajectory contributions [18,27].

2. Two-Colour HHG

Here, we build on concepts first introduced in Ref. [18], and related to Refs. [28,29]. Shafir et al. [18] employ a two-colour HHG method to extract the instant of time when electrons exit from their bound state and enter the continuum. Figure 2 illustrates the underlying concept.
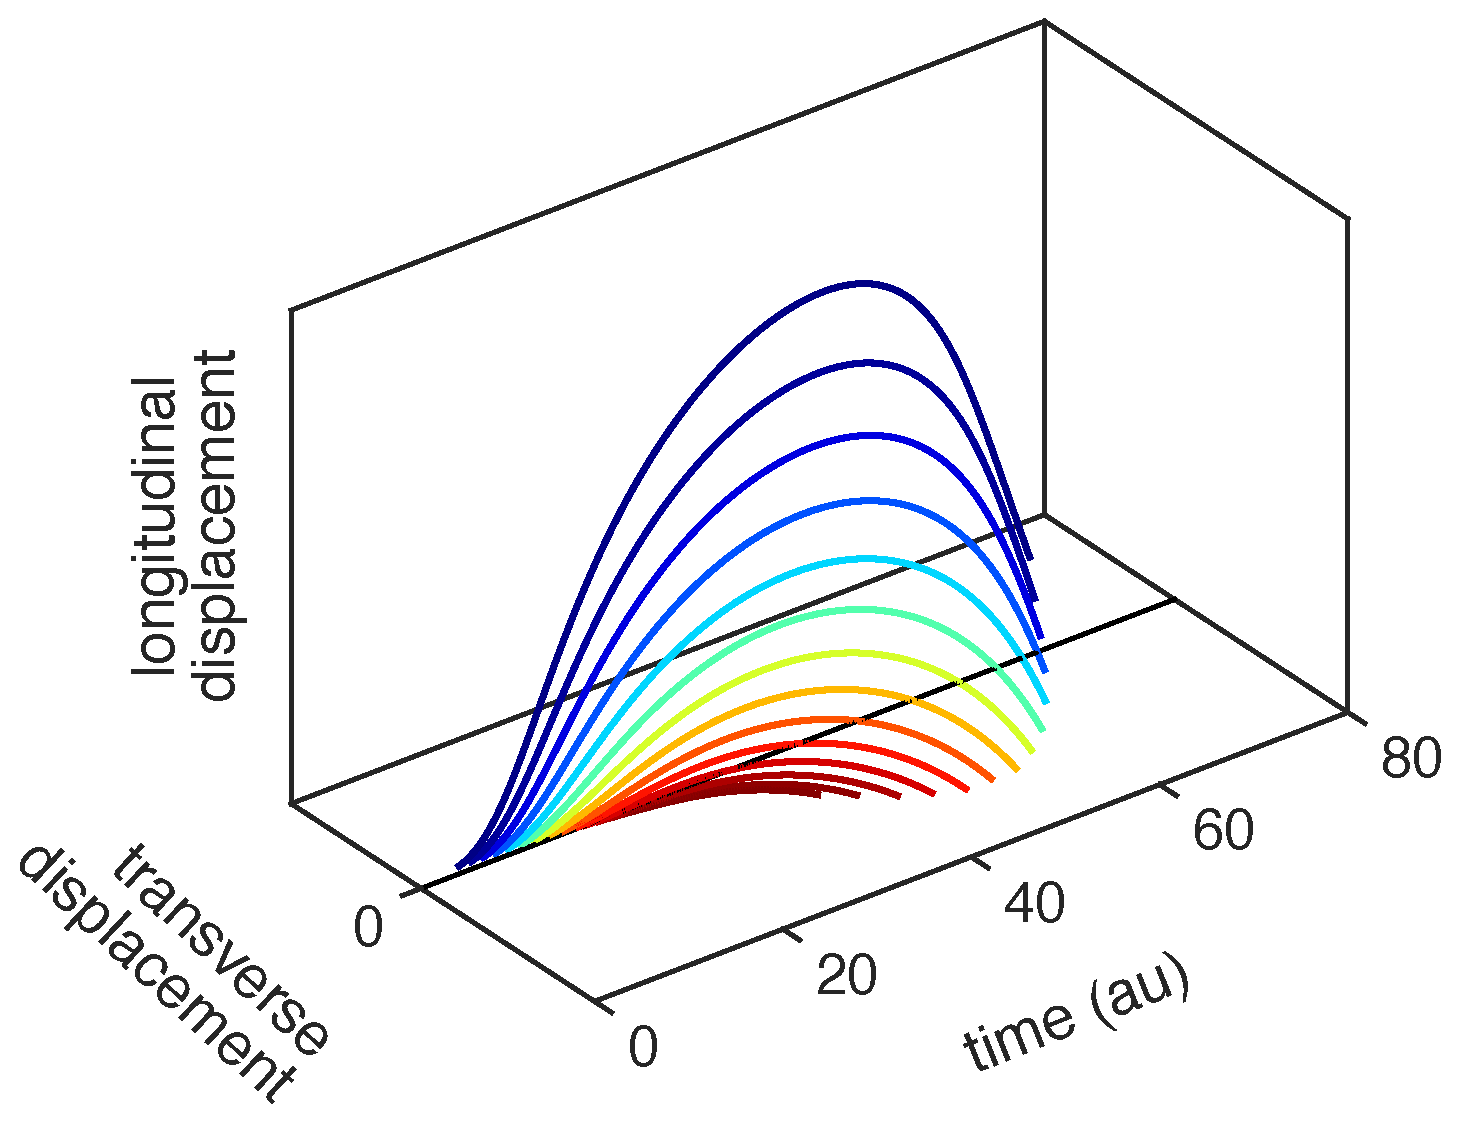
The strong fundamental driving field acts along the longitudinal coordinate x, as described in Equation (2). It dominates the ionisation rate and the major component of the photoelectron trajectories. A weak co-propagating second harmonic field with relative intensity I 2 ω / I ω = ξ acts along the orthogonal direction y
F y ( t , φ ) = f ( t ) F 0 ξ cos ( 2 ω t + φ ) y ^ ,
slightly displacing the trajectories, depending on the two-colour delay φ .
In Figure 2, examples of short trajectories are drawn, always with an initial transverse momentum v i , y = 0 . For each set of initial conditions ( t i , v i , y ) , a specific two-colour delay φ ( t i , v i , y ) can be found for which the transverse displacement cancels out. The trajectory then returns to the parent ion at return time t r and can contribute to the HHG spectrum. The transverse velocity v i , y = 0 is the most probable initial condition both in the adiabatic case [30,31] and in the non-adiabatic (almost) linear case [32,33]. Therefore, the HHG signal of harmonic order n is maximised exactly for
φ max ( n ) : = φ ( t i , v i , y = 0 ) .
This displacement gate method as developed by the Dudovich group gives access to the initial and return times for different harmonic orders in the HHG spectrum [18,28,34]. To perform the analysis and extract the times, Shafir et al. [18] neglected the effect of the ion Coulomb potential on the trajectories of the photoelectrons, according to SFA, allowing them to analytically describe the photoelectron trajectories. Then, combining the requirement that a trajectory must return to the origin after time t r with the extracted φ max from the measurement and setting v i , y = 0 , one can solve for the initial and return times t i and t r [18].

3. CTMC Method

CTMC simulations offer a more direct access to the dynamics and trajectory parameters of photoelectrons that generate high harmonics. The absolute phase between the two colours φ is known, whereas, in the experiment, only a phase relative to an unknown constant shift can be directly determined [18]. Through a comparison of the resulting HHG spectra with experimental data, the CTMC also offers the possibility to investigate the relative contributions of short and long trajectories to the high harmonic spectrum.
The initial conditions of the CTMC are based on the adiabatic Ammosov Delone Krainov (ADK) theory [30,31]. A cloud of 150000 trajectories is launched during a quarter cycle of the electric field oscillation, starting at the peak of the field at the centre of the ultrashort pulse, until the zero-crossing of the field. The probability weight is defined by the ADK ionisation rate, and each trajectory receives a random initial transverse momentum (in the plane orthogonal to the instantaneous laser field direction) following the ADK momentum distribution [19,35,36]. The longitudinal initial momentum is assumed to be zero, following a standard approach [19,32]. The exit point for each trajectory was given by the radius calculated from a parabolic coordinates approach [35,37,38,39], and taken exactly in the direction of the instantaneous laser field. The laser parameters are chosen to imitate the experiment on helium [18]. As was done for all presented theories in Ref. [18], we calibrated the pulse amplitude such that the retrieved HHG cutoff energy matched with the experiment, resulting in F 0 = 0.1139 au. The fundamental IR pulse had a f ( t ) = cos 2 ( Ω t ) envelope for the field, Ω was chosen to yield a 6 fs FWHM in intensity, and the carrier wavelength was λ = 800 nm.
For the subsequent propagation, classical Newton’s equations were solved in two versions, using the MATLAB (R2016a, MathWorks® Inc., Natick, MA, USA) native ode45 function. This 4th order Runge–Kutta scheme employs 5th order error estimates, and adapts the time-steps to fulfill a relative error tolerance of 10 7 . The first version of the equations of motion are according to SFA, where the force term only includes the electric field. The second version propagates in the superposed forces of the electric field pulse, the ion Coulomb force and the field induced dipole on the ion. The latter corresponds to the TIPIS model (Tunnel ionisation in Parabolic coordinates with Induced dipole and Stark Shift) [39,40]. More details of the CTMC implementations can be found in [35,41].
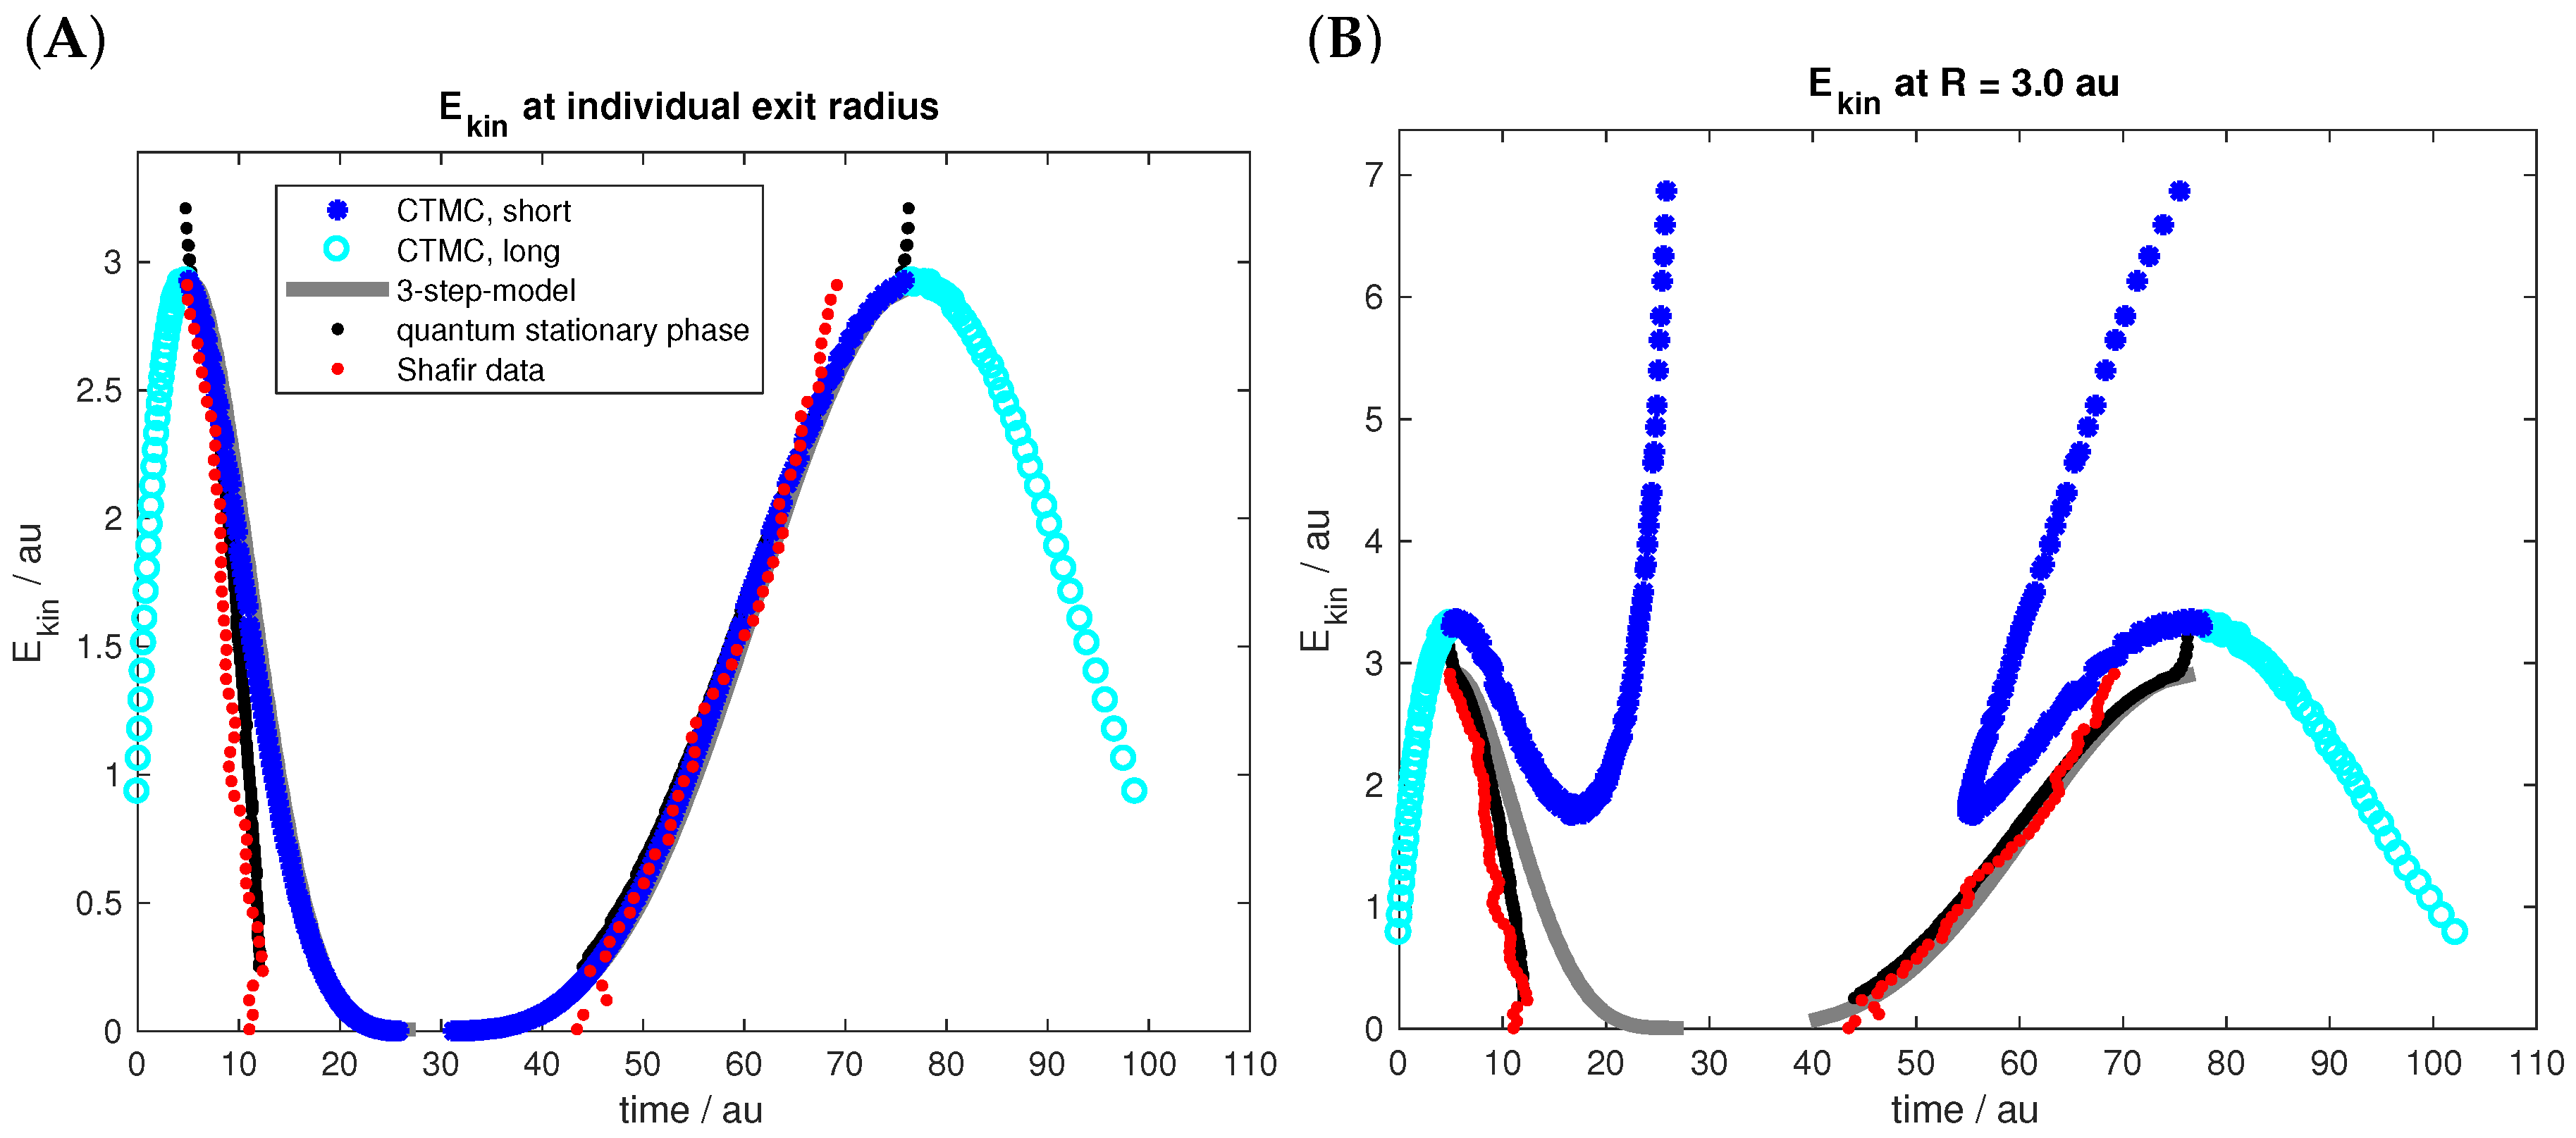
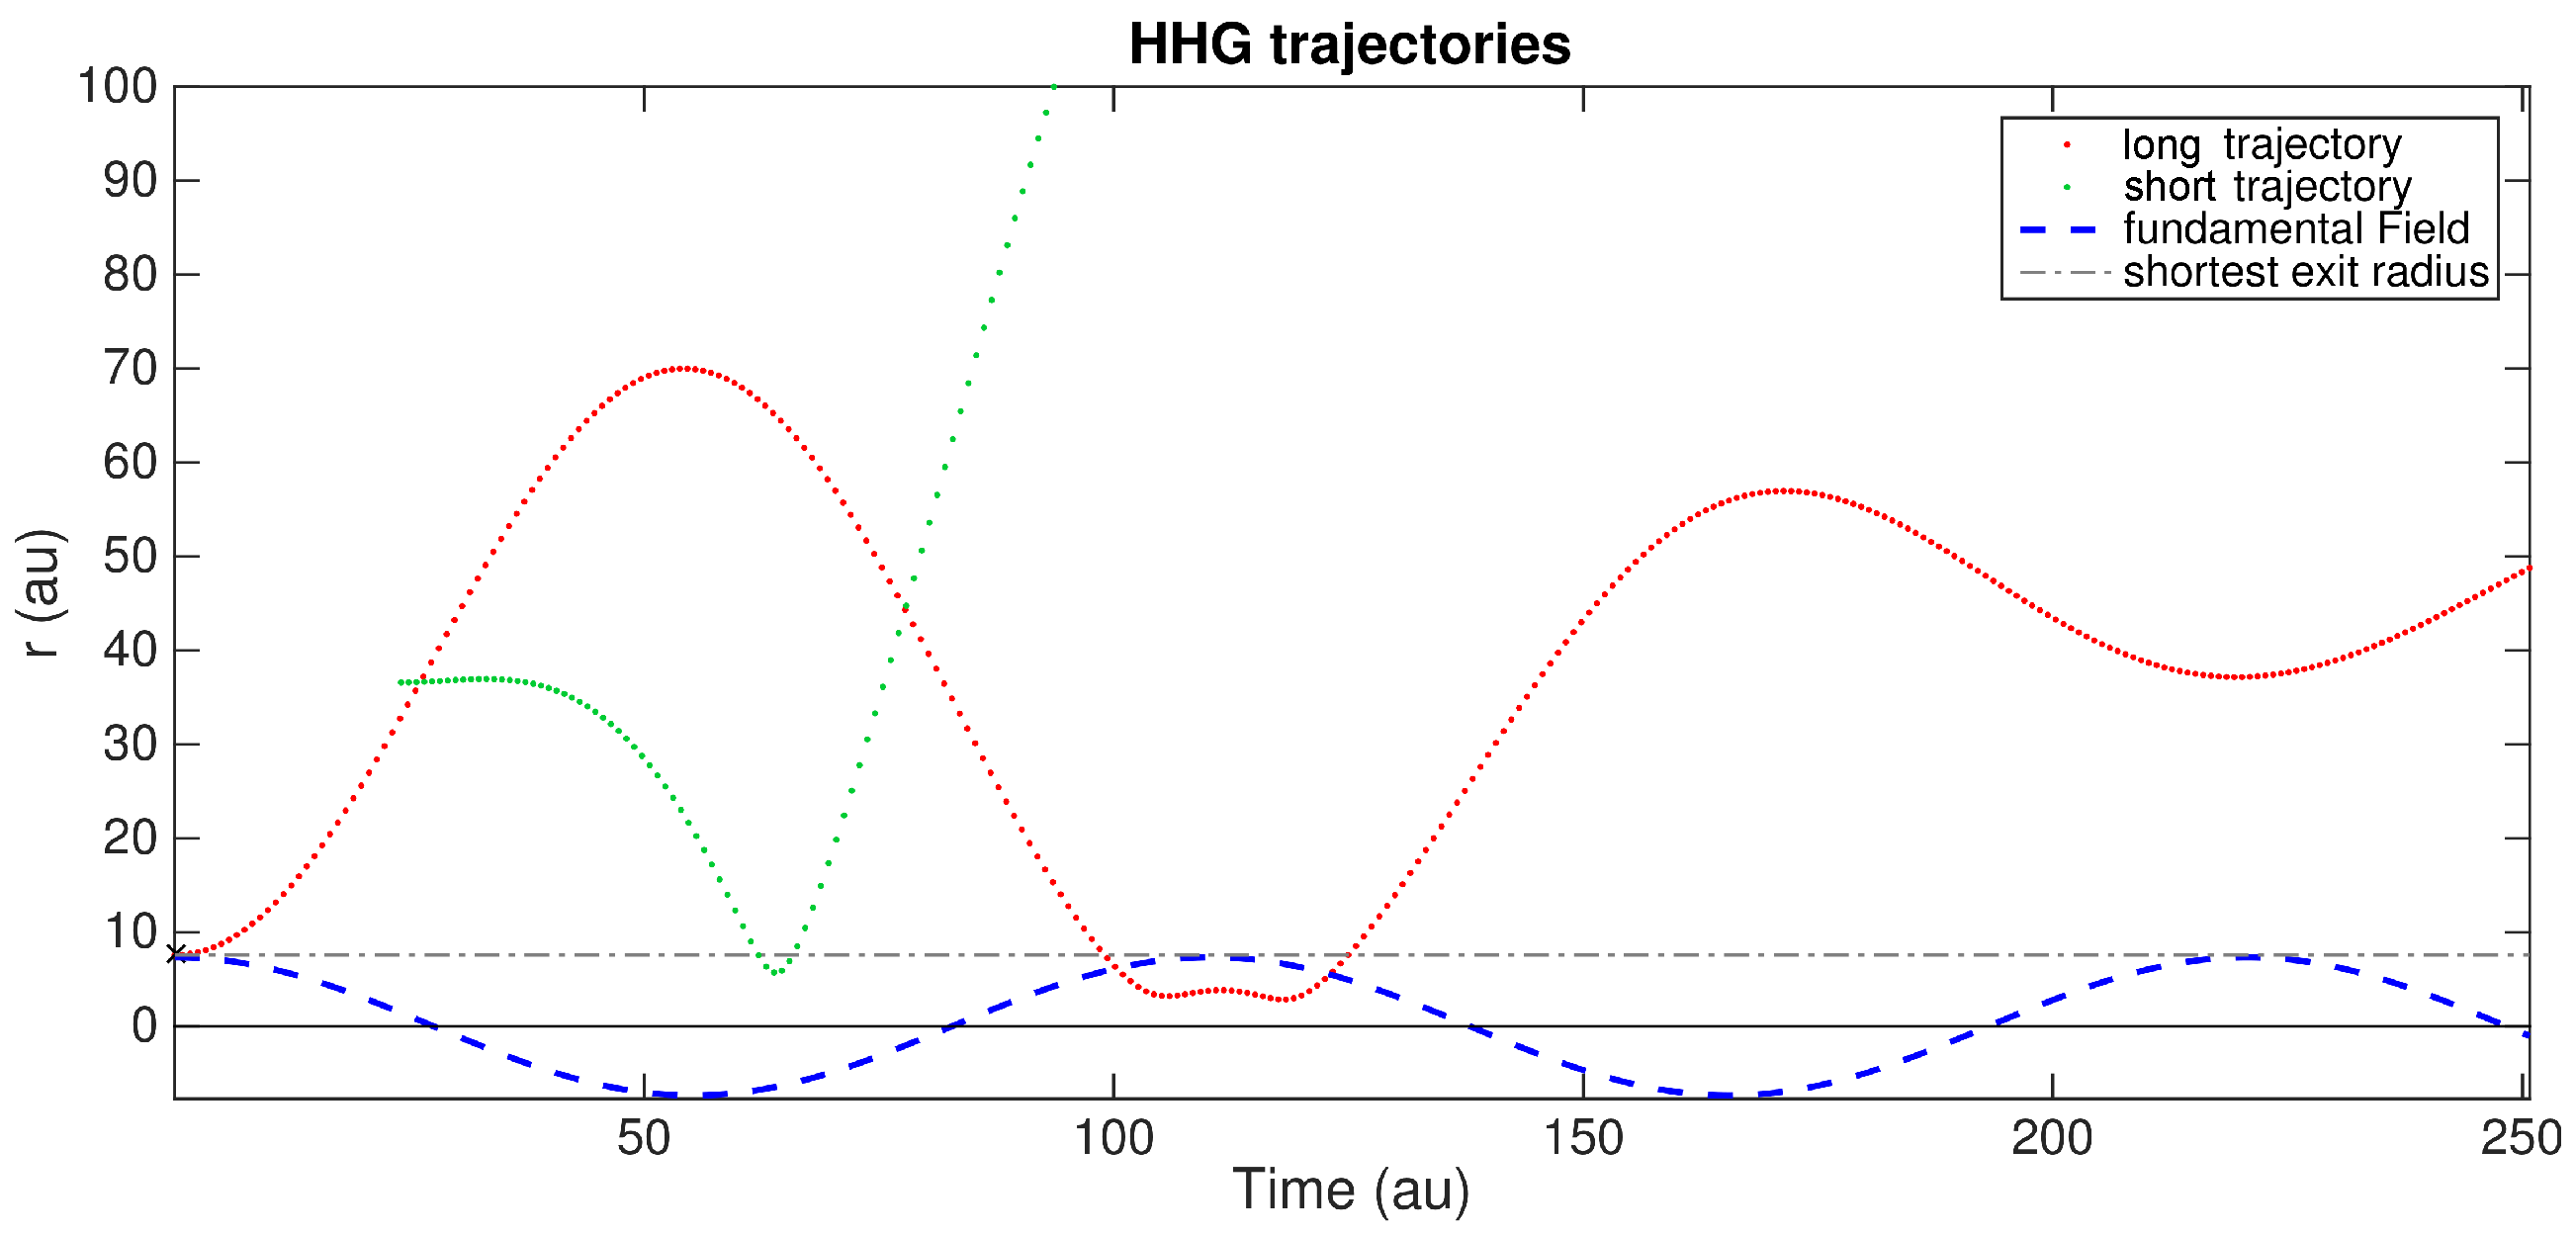
Purely classical trajectories only experience scattering off the Coulomb potential, but of course do not recombine during the numerical calculation. Thus, possible recombination events must be filtered out of the recorded trajectories a posteriori. From our CTMC simulations, we find the best qualitative agreement between the extracted kinetic energies and experimental HHG spectra if the recombination condition “returning to the individual exit radius” is used (see Figure 3A). These findings agree with Ref. [42], where Xiong et al. also conclude that a recombination distance equal to the exit point was necessary to yield the correct description for short trajectories in the near-threshold part of the HHG spectrum. When checking the kinetic energy at a closer specific radius, then short trajectories gain additional kinetic energy from being accelerated by the laser field while travelling closer to the ion (see Figure 3B and Figure 4). Long trajectories do not experience this acceleration because they return to the ion when the field is already driving them away again, decelerating them slightly when they have to approach closer than their individual exit point. To illustrate this key difference between short and long trajectories, Figure 4 plots the radius over time for two exemplary trajectories. The red dotted curve is a long trajectory, which was ionised right when the electric field (blue dashed) reaches its maximum value, corresponding to the shortest possible exit radius (grey dot-dashed line) in the simulation. Compare also the sketch in Figure 1 for short and long trajectories within the SFA and three-step-model. The green dotted curve represents a short trajectory that was launched just shortly before the electric field changes sign. The comparatively small field strength this late in the quarter cycle results in a larger exit radius. Evidently, the short trajectory must first be accelerated towards the ion in order to reach a smaller recombination distance condition.

4. Macroscopic Propagation

Both the semiclassical three-step-model [8,9,10] as well as the quantum theory [22] describe the single atom response of HHG. In order to have efficient production of high-order harmonic radiation, phase matching conditions for constructive interference at harmonic order n,
k n = n · k 1 + K ,
must be satisfied over the complete propagation distance of the driving laser field through the target interaction region. All new parameters and quantities are defined in Table 1. Equation (6) takes account of the Gouy-phase of a Gaussian beam, the phase of the electron wave packet (described by the classical action) and the phase due to the time passed until the recombination. On the other hand, it neglects dispersion effects induced by the neutral and ionised gas.
Experimental setups are typically optimised for short trajectory phase matching on axis (see also Ref. [18] and their supplementary material). In that case, the phase matching condition for long trajectories is best fulfilled for emitted wave vectors diverging from the optical axis [27]. These contributions to the final HHG spectrum can easily be filtered out spatially, as was done in Ref. [18]. However, there still might be a small contribution of long trajectories to the low harmonics even when looking along the axis. The phase mismatch is then given by
δ k = k n | n · k 1 + K ( z , r = 0 ) | .
For an interaction region on axis ( r = 0 ) in forward propagation along the axis, this mismatch can be estimated as
δ k ( z , n , τ ) = n ω c n ω c 2 b b 2 + 4 z 2 + F 0 2 z 0 2 z 2 ω 2 ( z 2 + z 0 2 ) 2 · τ ,
where we used approximations described in Ref. [27].
Figure 5A shows the phase mismatch δ k of the wave vectors for two sample excursion times τ short = 25 au and τ l o n g = 80 au at harmonic order n = 22 , and the gas jet positioned after the focus of the beam ( z > 0 ). In an optimal position of the jet after the focus, long trajectories are very efficiently, but not completely, suppressed along the axis (corresponding to large | δ k | ).
Starting from the phase mismatch δ k ( z , n , τ ) Equation (8), one can estimate the total amplitude efficiency with the help of a geometric series
G S ( z , n , τ , N ) = t = 0 N 1 exp i δ k ( z , n , τ ) j N · t 1 N .
This geometric series oscillates around a value for low N, and converges for larger N 40 . The limit of N is given by
G S ( z , n , τ ) = i ( 1 exp ( i j δ k ( z , n , τ ) ) ) j δ k ( z , n , τ ) .
A typical XUV pulse contains several orders of magnitude more photons than N = 40 per harmonic order, which justifies taking the limit of N . Then, the absolute square
P M ( z , n , τ ) = G S ( z , n , τ ) G S ( z , n , τ ) = 2 j 2 δ k 2 ( z , n , τ ) 2 cos ( j δ k ( z , n , τ ) ) j 2 δ k 2 ( z , n , τ )
yields the efficiency for the intensity of the high-order harmonic radiation. For perfect phase matching
lim δ k 0 P M ( z , n , τ ) = 1 ,
the estimate yields perfect efficiency of constructive interference, as expected. Figure 5B shows the phase matching efficiency for varying positions of the gas jet after the focus, with a jet diameter of j = 0.95 mm [43].

5. CTMC Simulations

In this section, we compare our CTMC calculations with the experimental results published by Shafir et al. in Ref. [18].

5.1. Displacement Gate

Scanning the relative phase φ between the second harmonic and the fundamental allows for finding the φ max ( n ) for each harmonic order n in the spectrum, for which the recorded intensity generated at that harmonic order is maximised. Out of the complete cloud of trajectories started in the CTMC, every returning trajectory is assigned their harmonic order n with
n = 1 ω E kin ( t r ) + I p .
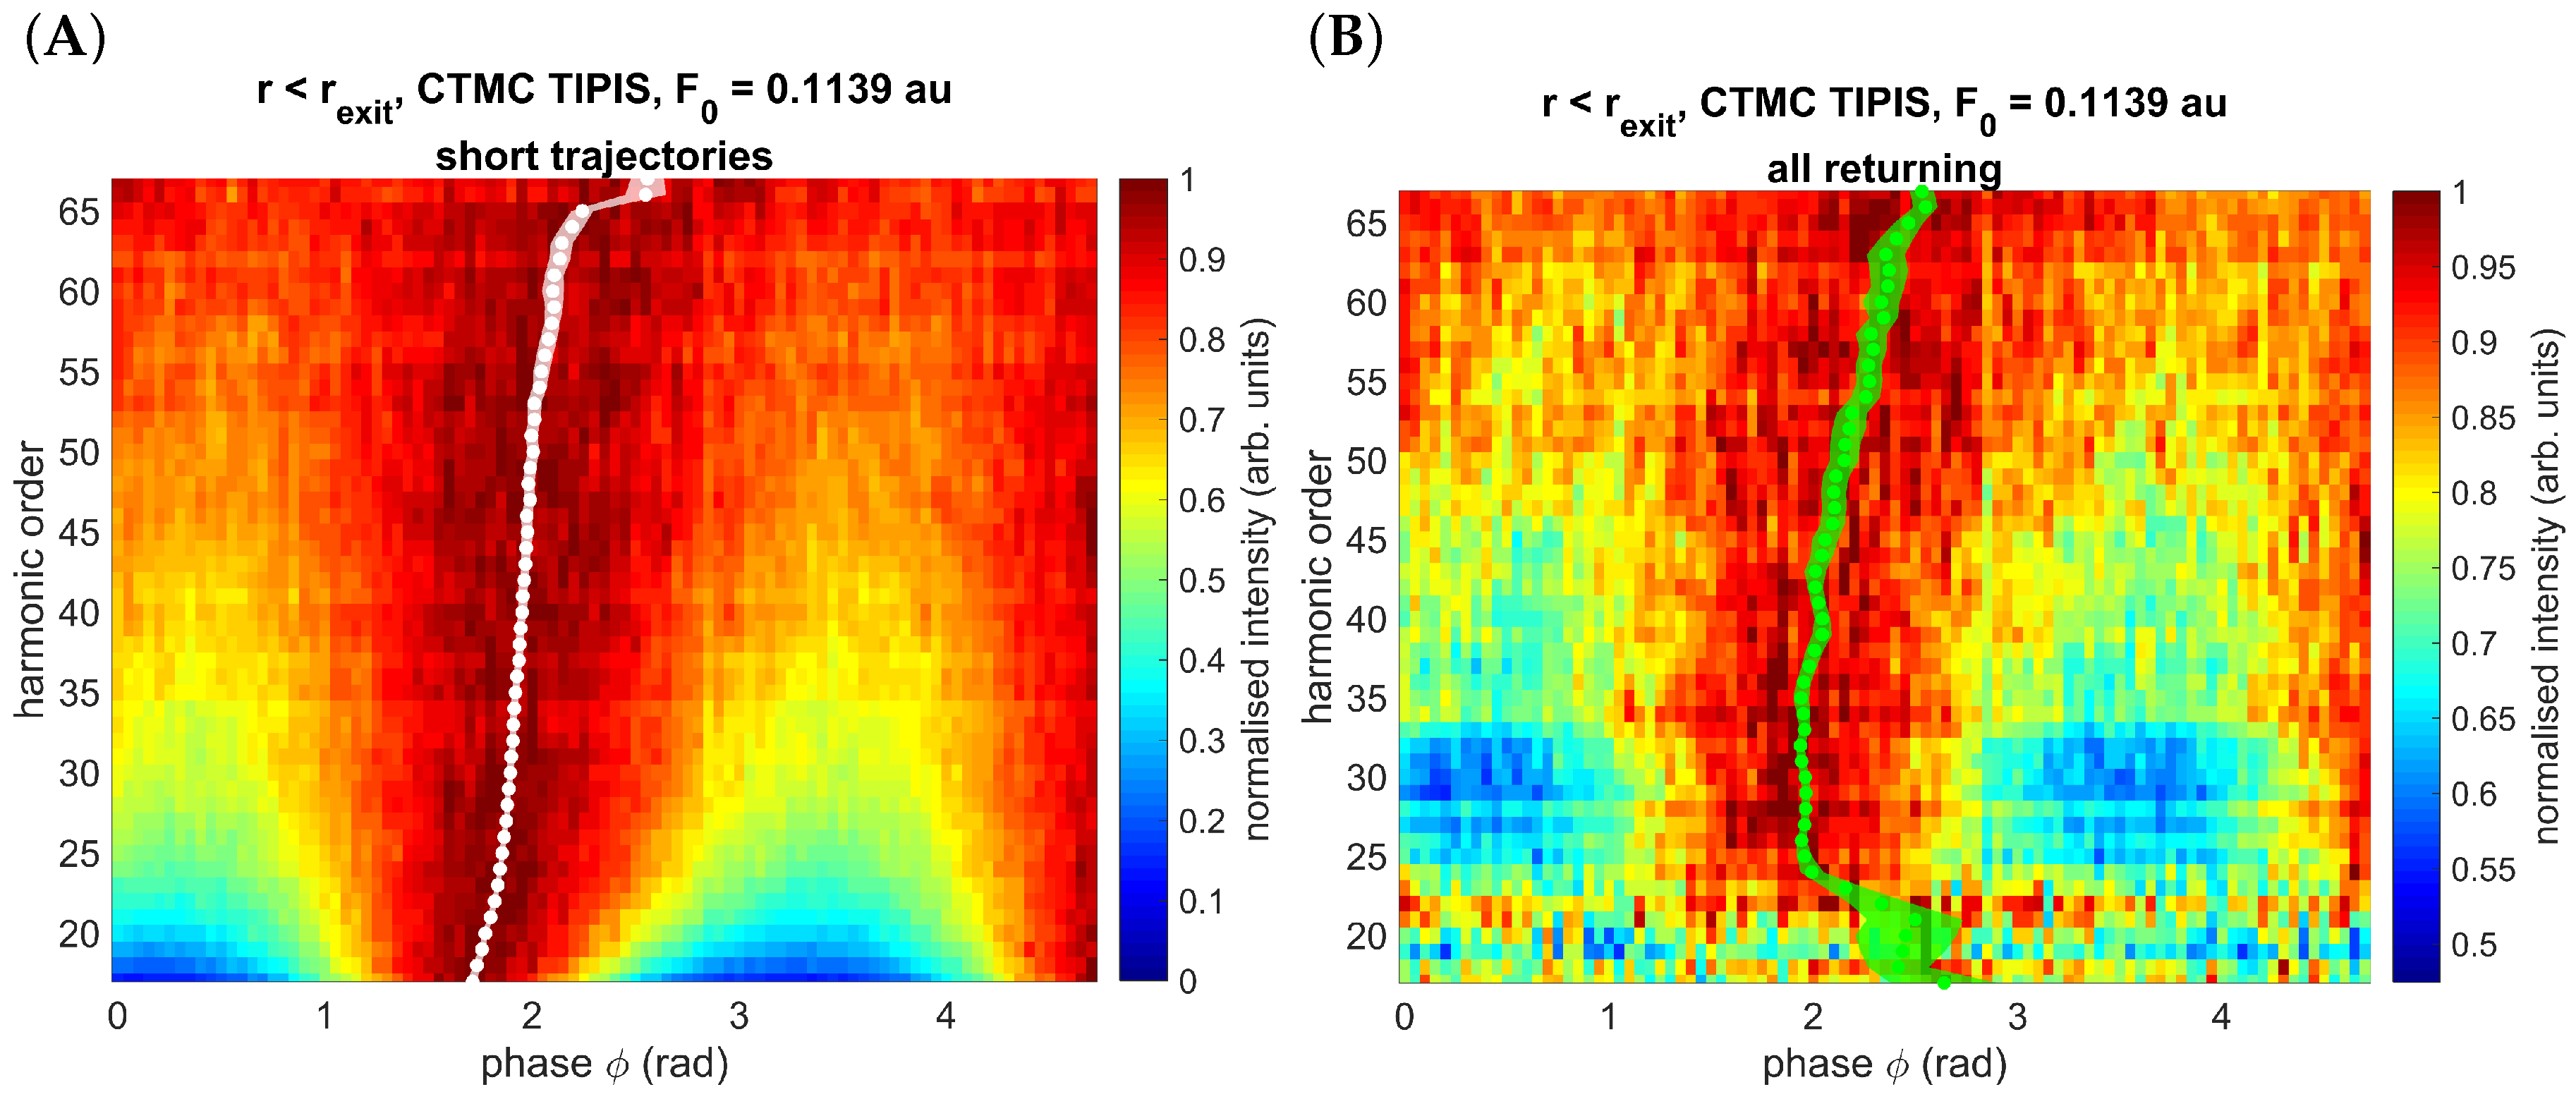
Then, the summed up probability weights of all returned trajectories contributing to harmonic order n from the CTMC simulation with two-colour phase φ is shown in Figure 6A. These displacement gate plots are normalised to the maximum intensity within each harmonic order individually. The normalisation is to show the maximum intensity within each harmonic order more clearly in the plot.
The horizontal line cut of each harmonic order can be fitted with a
I ( n , φ ) = C ( n ) cos 2 ( φ + φ max ( n ) ) + B ( n )
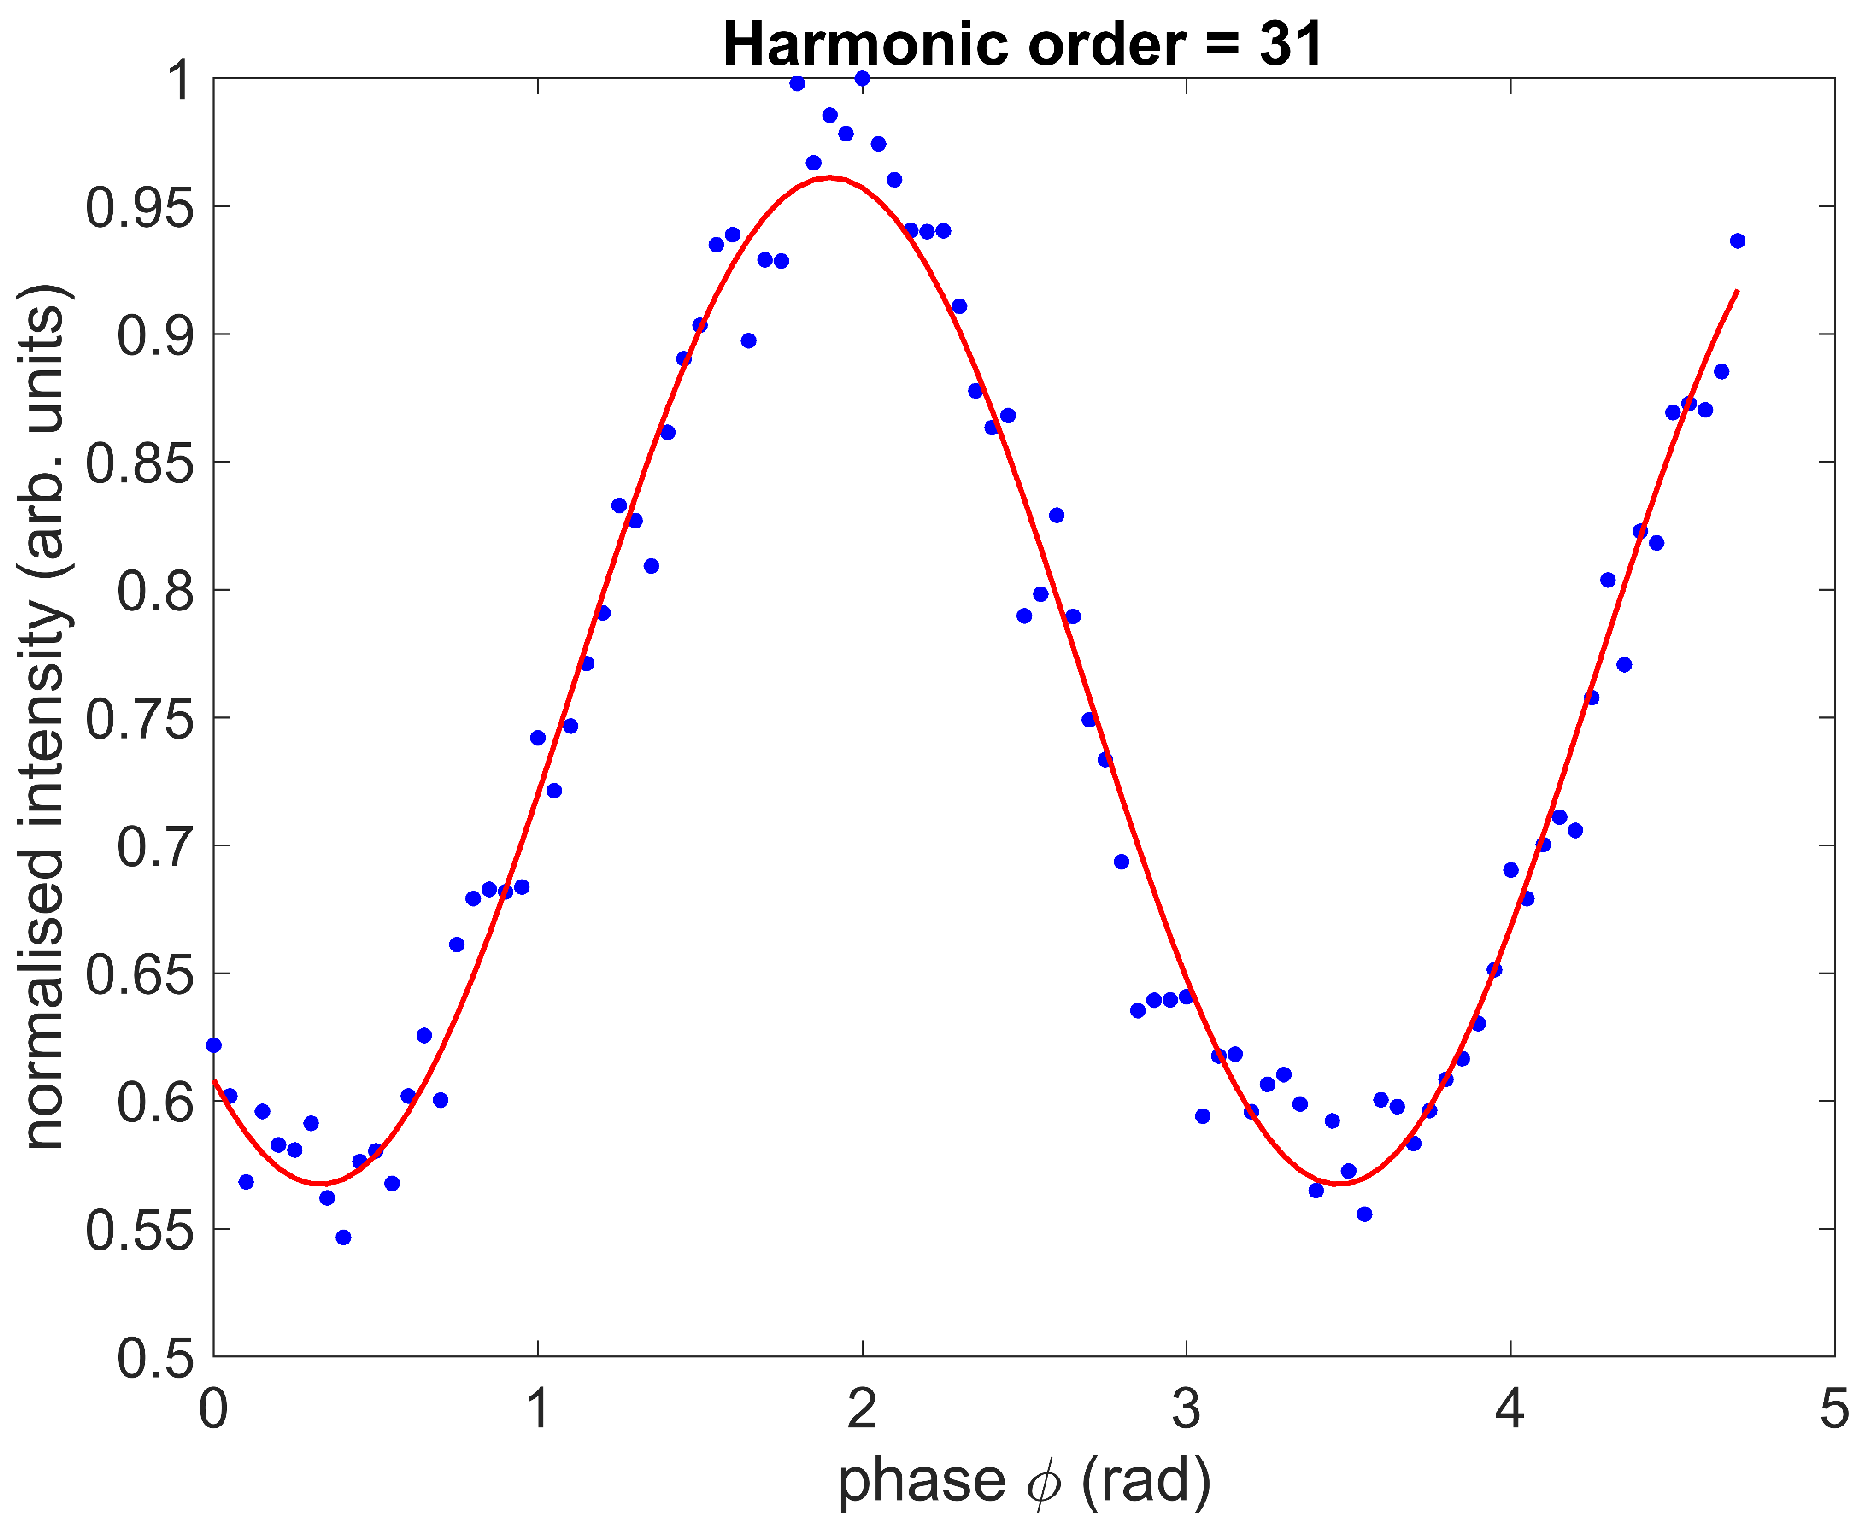
function, where C ( n ) describes the contrast of displacement gate and B ( n ) is the constant background intensity. As an example, Figure 7 shows the line out for harmonic order 31 of the dataset displayed in Figure 6A, together with the fitted function.
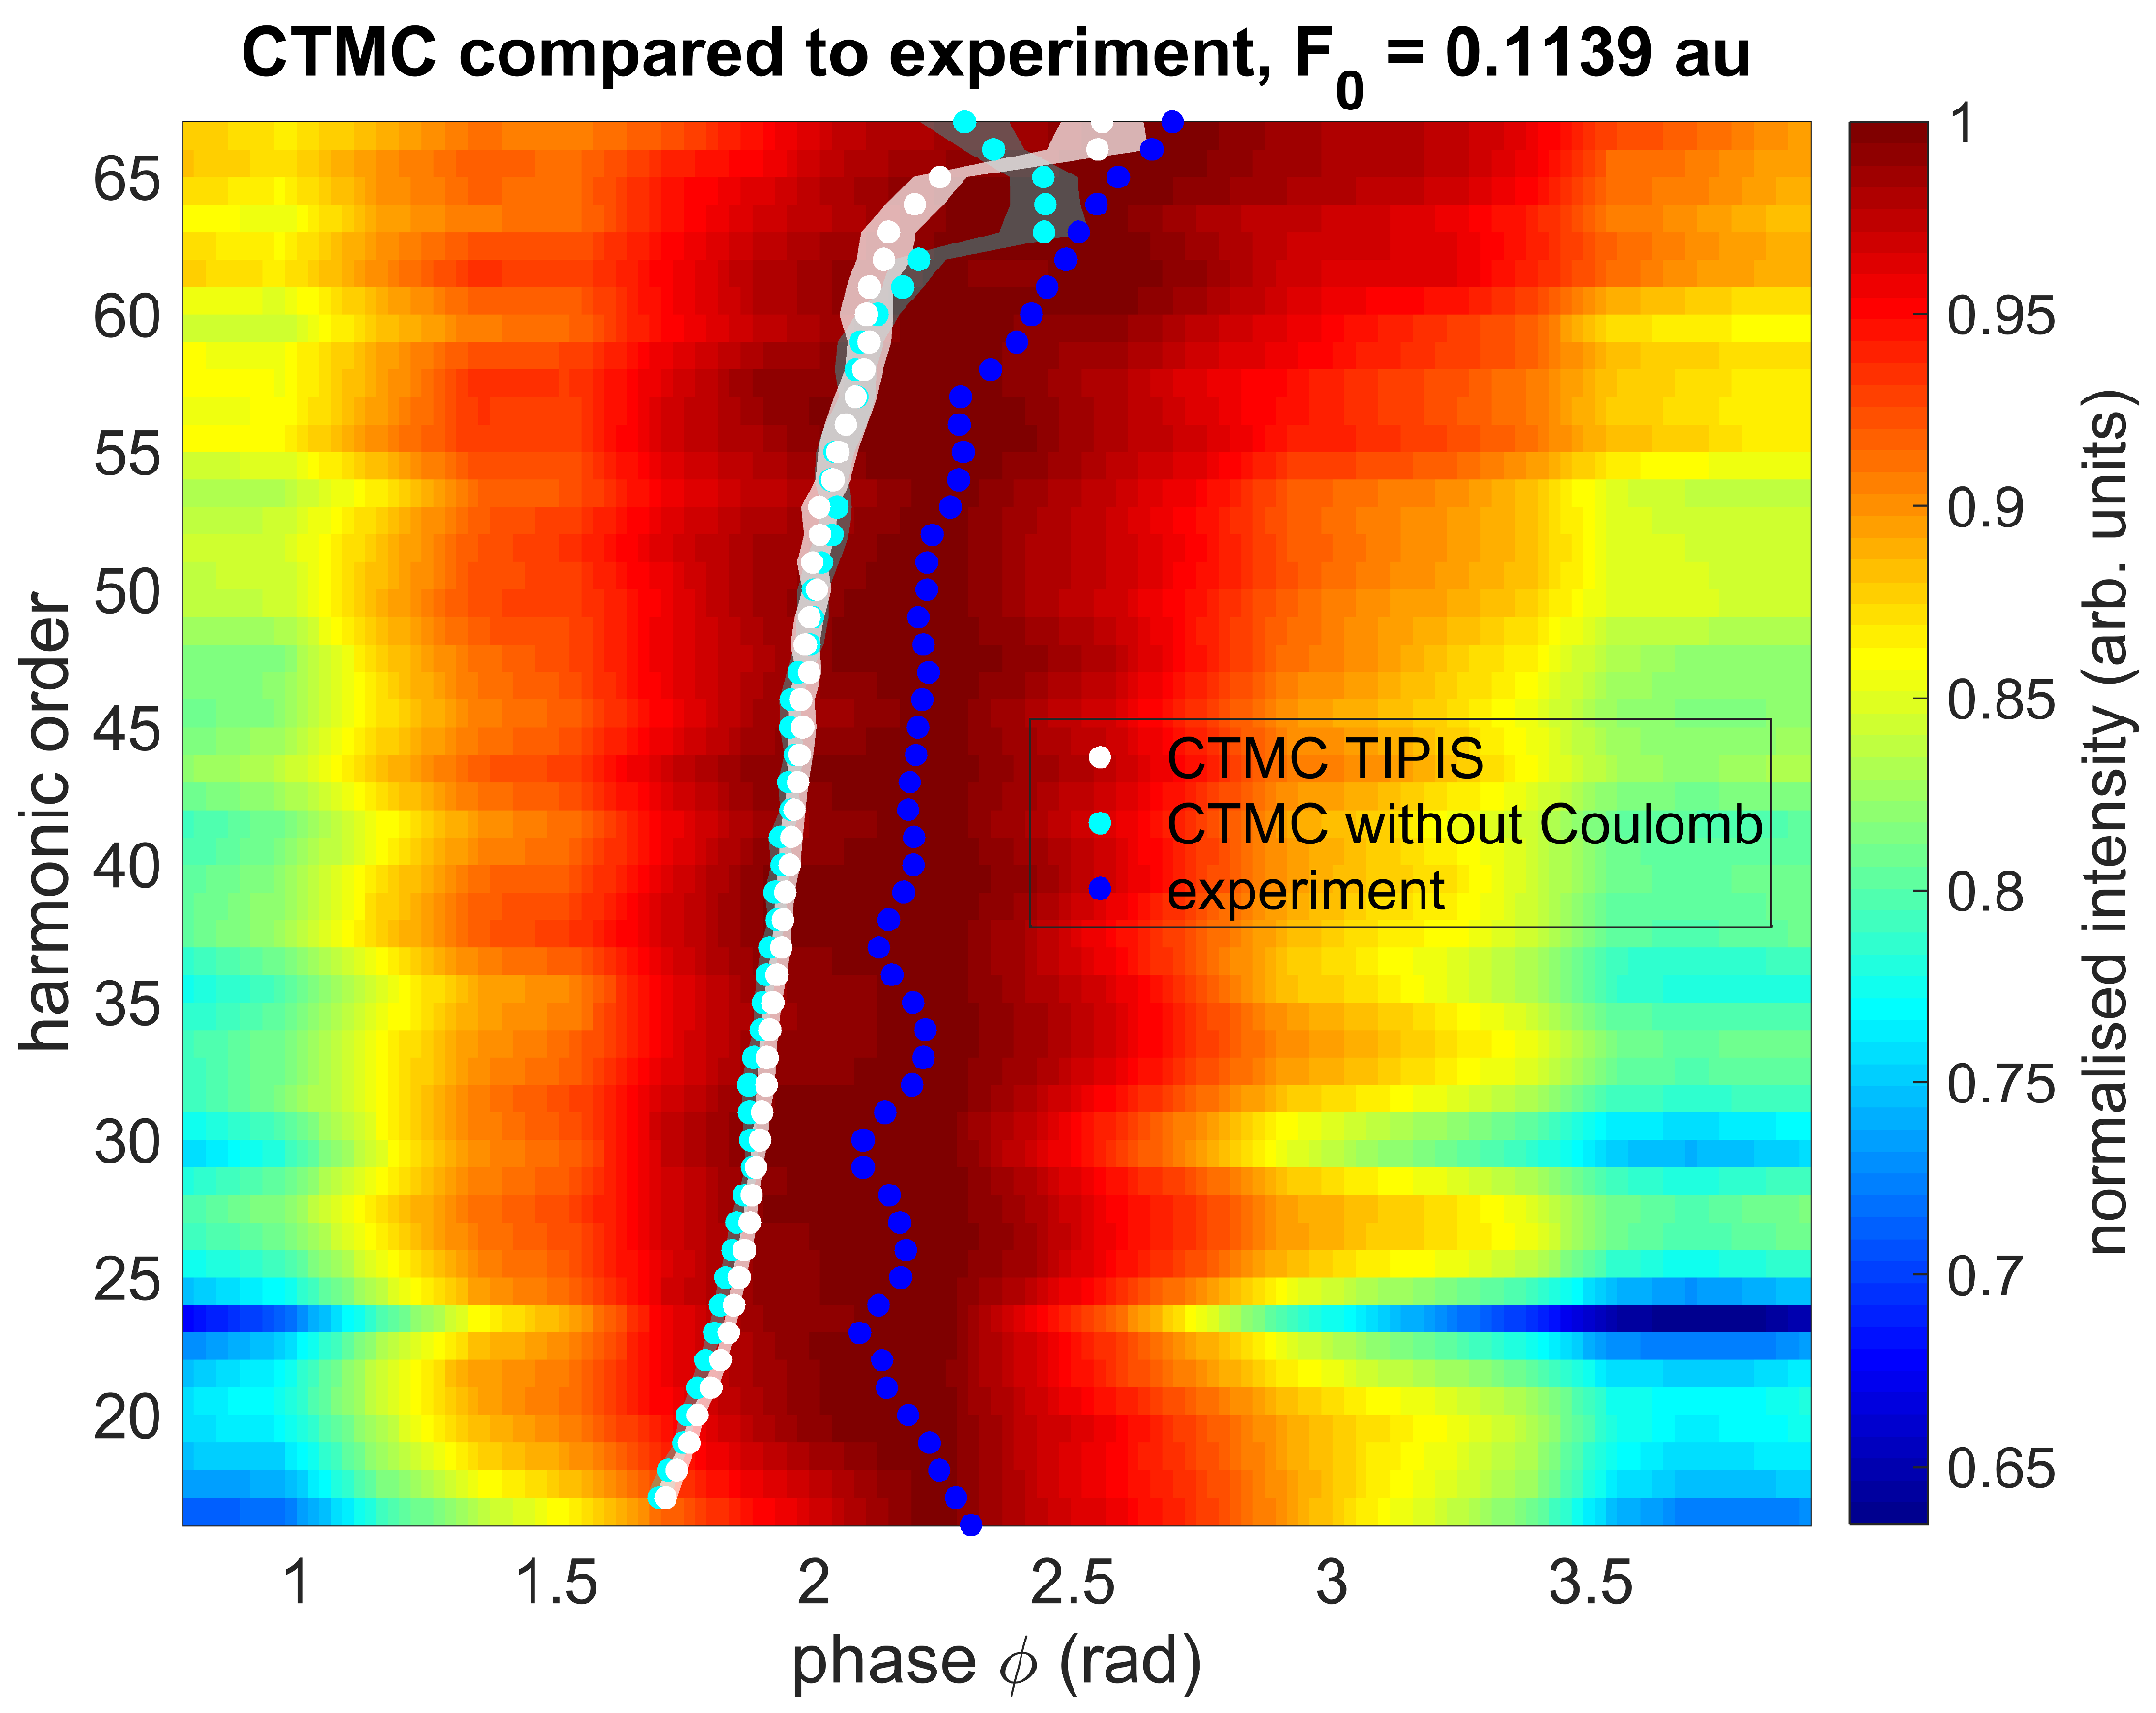
The retrieved φ max for the two different simulation cases are shown on top of the experimental displacement gate plot in Figure 8. Neglecting the Coulomb potential (cyan) does not have any significant effect on the HHG spectra for most of the harmonic spectrum. Comparable φ max ( n ) are found both in the CTMC with Coulomb and the CTMC without Coulomb cases, and only around the cutoff energy do the two curves diverge. In addition, the φ max ( n ) curves extracted from the different CTMC simulations show remarkable agreement with the experimental spectrum for harmonics n 25 . A constant shift between the experimental and CTMC values can be attributed to the unknown absolute phase difference in the experiment [18].

5.2. Long Trajectories Contribution

In Section 5.1, it was found that the maximizing phase φ max in the CTMC agrees reasonably with the experimental results, except for low harmonics slightly above the HHG threshold n < 25 . For these low harmonic orders, the φ max extracted from CTMC shows an opposite slope from the experimental displacement gate plot. This is the range of energies where most long trajectories are initiated since the field is the strongest.
In order to estimate the efficiency of the HHG build up, the phase matching efficiency Equation (11) is calculated for all numerically computed returning trajectories. The final phase matching corrected probability weight Γ PM of a returning trajectory is given by
Γ PM = Γ ( t i , p i ) · P M ( n , τ ) ,
where Γ ( t i , p i ) is the ionisation probability at time t i with initial transverse momentum p i . For the following calculations, the jet centre is assumed to be located at z = 5 mm , with a jet diameter of j = 0.95 mm [43].
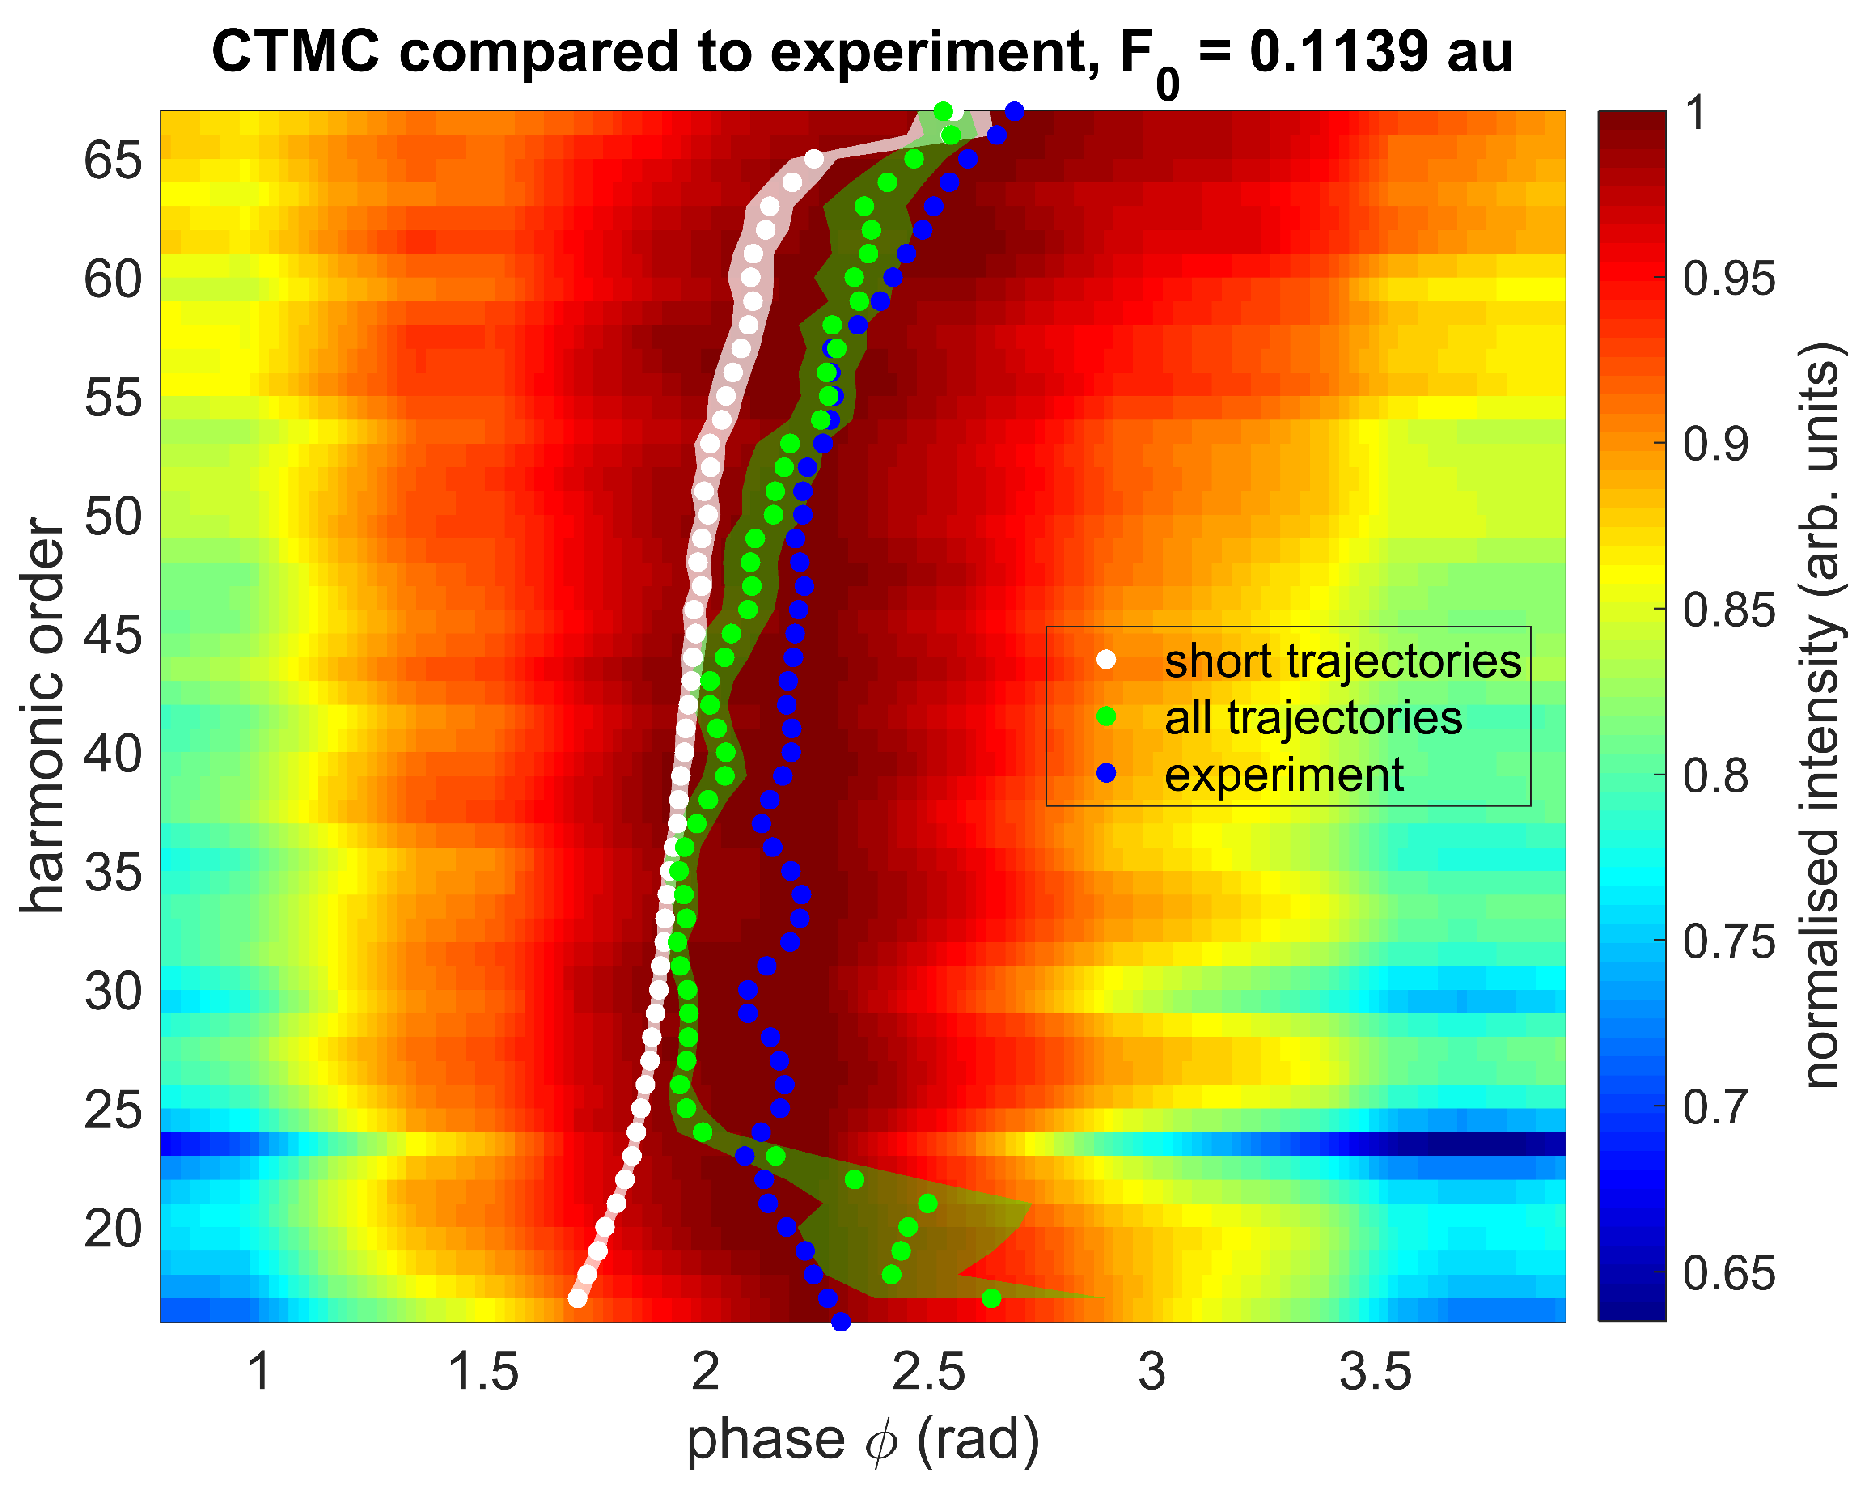
Figure 6 contrasts two displacement gate plots. In Figure 6A, only short trajectories are considered, with their probability weights given by Γ ( t i , p i ) . In Figure 6B, the HHG spectra were calculated by summing up the corrected weights Γ PM from Equation (15), including also long trajectories. The effect for higher harmonic orders is relatively small. However, including long trajectories does yield a change in the slope of the φ max curve, similar to that found in the experiment (see Figure 9). Figure 6B is much noisier than the plot focusing on only short trajectories Figure 6A. While there are more trajectories included in Figure 6B, the increased number is not enough to completely compensate for the additional statistical fluctuation due to the introduced complex phase for all trajectories.
The shape and the value of P M ( n , τ ) strongly depends on the detailed parameters of the beam geometry, such as the spot size on the focusing mirror, the exact geometry of the gas jet in the interaction region with the laser beam, the minimal beam waist, the confocal parameter of the focused beam, and the jet position relative to the focus. Performing the CTMC analysis with just slightly different beam geometry leads to differences in the extracted φ max larger than their respective 95% confidence intervals for the fits in the extraction process (shown as the band covering the data points in displacement gate plots). Considering this, it is difficult to predict accurately the ratio of short and long trajectories corresponding to the experimental conditions. However, including long trajectories based on phase matching efficiency always shifted the φ max ( n ) curve to larger phases, with the strongest influence on the lower harmonics. Taking into account long trajectories therefore leads to qualitatively better agreement with the experimental displacement gate, compared to the version where all long trajectories are excluded a priori.
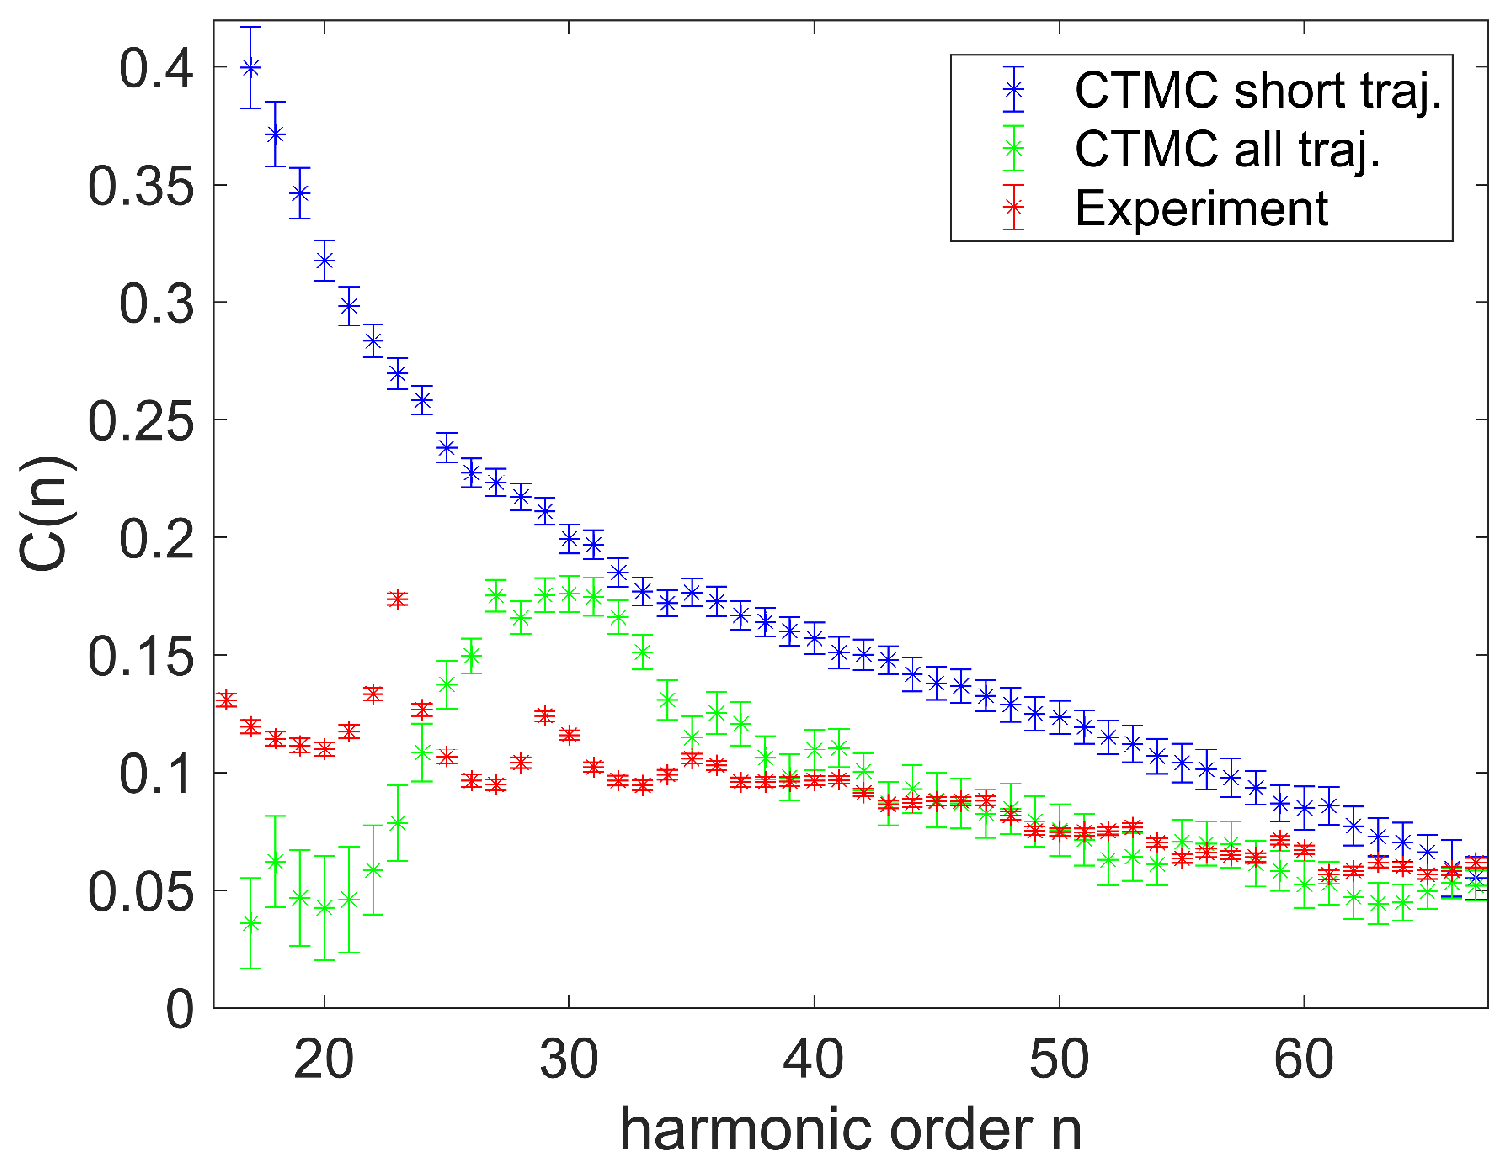
Additionally, the oscillation contrast C ( n ) of the displacement gate plot especially for the lower harmonic orders is reduced by adding long trajectories. Compare again the two plots in Figure 6. Figure 10 highlights that the displacement gate contrast in the CTMC with only short trajectories is much stronger (blue) than the contrast in the experiment of [18] (red). In the case when long trajectories are considered as well (green), the contrast drops to comparable values.

6. Conclusions

We have shown that CTMC simulations, whether they take the ion Coulomb force into account or not, essentially reproduce the three-step-model of HHG [10]. The extracted φ max ( n ) is virtually independent of the ion Coulomb force. Consequently, the reconstructed initial and return times in Ref. [18] are expected to be robust, and the approximations used for the calculations are valid. If exclusively short trajectories are used for the analysis, then the experimental displacement gate can be reproduced for harmonic orders n 25 . Long trajectories, however, were needed for qualitative agreement between the CTMC simulations and the experiment for low harmonic orders. Their contribution can be estimated by looking at the phase matching efficiency. The displacement gate contrast strongly depends on whether long trajectories are considered or not. Agreement is only achieved again if phase matching is considered for all trajectories.

Acknowledgments

The authors gratefully acknowledge helpful discussions with Nirit Dudovich and Hadas Soifer. The data from Figure 3a,c of Ref. [18] were kindly proved by Hadas Soifer. A.S.L. acknowledges the Max Planck Centre of Attosecond Science (MPC-AS). This research was supported by the National Centre of Competence in Research Molecular Ultrafast Science and Technology (NCCR MUST), funded by the Swiss National Science Foundation (SNSF).

Author Contributions

C.H., A.S.L. and U.K. conceived and designed the project; C.H. performed the numerical simulations and analytical estimates; C.H. analysed the data; C.H. and A.S.L. interpreted the data; C.H. wrote the manuscript draft; C.H., A.S.L. and U.K. edited and revised the manuscript.

Conflicts of Interest

The authors declare no conflict of interest.

Abbreviations

The following abbreviations are used in this manuscript:
HHGHigh Harmonic Generation
SFAStrong Field Approximation
CTMCClassical Trajectory Monte Carlo Simulation
ADKAmmosov Delone Krainov
TIPISTunnel Ionisation in Parabolic Coordinates with Induced Polarisation and Stark Shift
XUVExtreme Ultra-Violet
IRInfrared
FWHMFull Width Half Maximum

References

  1. McPherson, A.; Gibson, G.; Jara, H.; Johann, U.; Luk, T.S.; McIntyre, I.A.; Boyer, K.; Rhodes, C.K. Studies of multiphoton production of vacuum-ultraviolet radiation in the rare gases. J. Opt. Soc. Am. B 1987, 4, 595. [Google Scholar] [CrossRef]
  2. Ferray, M.; L’Huillier, A.; Li, X.F.; Lompre, L.A.; Mainfray, G.; Manus, C. Multiple-harmonic conversion of 1064 nm radiation in rare gases. J. Phys. B At. Mol. Opt. Phys. 1988, 21, L31–L35. [Google Scholar] [CrossRef]
  3. Gaumnitz, T.; Jain, A.; Pertot, Y.; Huppert, M.; Jordan, I.; Ardana-Lamas, F.; Wörner, H.J. Streaking of 43-attosecond soft-X-ray pulses generated by a passively CEP-stable mid-infrared driver. Opt. Express 2017, 25, 27506. [Google Scholar] [CrossRef] [PubMed]
  4. Muller, H. Reconstruction of attosecond harmonic beating by interference of two-photon transitions. Appl. Phys. B 2002, 74, s17–s21. [Google Scholar] [CrossRef]
  5. Itatani, J.; Quéré, F.; Yudin, G.L.; Ivanov, M.Y.; Krausz, F.; Corkum, P.B. Attosecond Streak Camera. Phys. Rev. Lett. 2002, 88, 173903. [Google Scholar] [CrossRef] [PubMed]
  6. Krausz, F.; Ivanov, M. Attosecond physics. Rev. Mod. Phys. 2009, 81, 163–234. [Google Scholar] [CrossRef]
  7. Gallmann, L.; Cirelli, C.; Keller, U. Attosecond science: Recent highlights and future trends. Ann. Rev. Phys. Chem. 2012, 63, 447–469. [Google Scholar] [CrossRef] [PubMed]
  8. Krause, J.L.; Schafer, K.J.; Kulander, K.C. High-order harmonic generation from atoms and ions in the high intensity regime. Phys. Rev. Lett. 1992, 68, 3535–3538. [Google Scholar] [CrossRef] [PubMed]
  9. Schafer, K.J.; Yang, B.; DiMauro, L.F.; Kulander, K.C. Above threshold ionization beyond the high harmonic cutoff. Phys. Rev. Lett. 1993, 70, 1599–1602. [Google Scholar] [CrossRef] [PubMed]
  10. Corkum, P.B. Plasma perspective on strong field multiphoton ionization. Phys. Rev. Lett. 1993, 71, 1994–1997. [Google Scholar] [CrossRef] [PubMed]
  11. Antoine, P.; L’Huillier, A.; Lewenstein, M. Attosecond Pulse Trains Using High–Order Harmonics. Phys. Rev. Lett. 1996, 77, 1234–1237. [Google Scholar] [CrossRef] [PubMed]
  12. Lindner, F.; Stremme, W.; Schätzel, M.G.; Grasbon, F.; Paulus, G.G.; Walther, H.; Hartmann, R.; Strüder, L. High-order harmonic generation at a repetition rate of 100 kHz. Phys. Rev. A 2003, 68, 013814. [Google Scholar] [CrossRef]
  13. Heyl, C.M.; Güdde, J.; L’Huillier, A.; Höfer, U. High-order harmonic generation with μJ laser pulses at high repetition rates. J. Phys. B At. Mol. Opt. Phys. 2012, 45, 074020. [Google Scholar] [CrossRef]
  14. Lyngå, C.; Gaarde, M.B.; Delfin, C.; Bellini, M.; Hänsch, T.W.; L’ Huillier, A.; Wahlström, C.G. Temporal coherence of high-order harmonics. Phys. Rev. A 1999, 60, 4823–4830. [Google Scholar] [CrossRef]
  15. Itatani, J.; Levesque, J.; Zeidler, D.; Niikura, H.; Pépin, H.; Kieffer, J.C.; Corkum, P.B.; Villeneuve, D.M. Tomographic imaging of molecular orbitals. Nature 2004, 432, 867–871. [Google Scholar] [CrossRef] [PubMed]
  16. Baker, S.; Robinson, J.S.; Haworth, C.A.; Teng, H.; Smith, R.A.; Chirila, C.C.; Lein, M.; Tisch, J.W.G.; Marangos, J.P. Probing Proton Dynamics in Molecules on an Attosecond Time Scale. Science 2006, 312, 424–427. [Google Scholar] [CrossRef] [PubMed]
  17. Dudovich, N.; Levesque, J.; Smirnova, O.; Zeidler, D.; Comtois, D.; Ivanov, M.Y.; Villeneuve, D.M.; Corkum, P.B. Attosecond Temporal Gating with Elliptically Polarized Light. Phys. Rev. Lett. 2006, 97, 253903. [Google Scholar] [CrossRef] [PubMed]
  18. Shafir, D.; Soifer, H.; Bruner, B.D.; Dagan, M.; Mairesse, Y.; Patchkovskii, S.; Ivanov, M.Y.; Smirnova, O.; Dudovich, N. Resolving the time when an electron exits a tunnelling barrier. Nature 2012, 485, 343–346. [Google Scholar] [CrossRef] [PubMed]
  19. Ivanov, M.Y.; Spanner, M.; Smirnova, O. Anatomy of strong field ionization. J. Mod. Opt. 2005, 52, 165–184. [Google Scholar] [CrossRef]
  20. Reiss, H.R. The tunnelling model of laser-induced ionization and its failure at low frequencies. J. Phys. B At. Mol. Opt. Phys. 2014, 47, 204006. [Google Scholar] [CrossRef]
  21. Majety, V.P.; Scrinzi, A. Absence of electron correlation effects in the Helium attoclock setting. J. Mod. Opt. 2017, 0340, 1–5. [Google Scholar] [CrossRef]
  22. Lewenstein, M.; Balcou, P.; Ivanov, M.Y.; L’Huillier, A.; Corkum, P.B. Theory of high-harmonic generation by low-frequency laser fields. Phys. Rev. A 1994, 49, 2117–2132. [Google Scholar] [CrossRef] [PubMed]
  23. Zaïr, A.; Holler, M.; Guandalini, A.; Schapper, F.; Biegert, J.; Gallmann, L.; Keller, U.; Wyatt, A.S.; Monmayrant, A.; Walmsley, I.A.; et al. Quantum Path Interferences in High-Order Harmonic Generation. Phys. Rev. Lett. 2008, 100, 143902. [Google Scholar] [CrossRef] [PubMed]
  24. Auguste, T.; Salières, P.; Wyatt, A.S.; Monmayrant, A.; Walmsley, I.A.; Cormier, E.; Zaïr, A.; Holler, M.; Guandalini, A.; Schapper, F.; et al. Theoretical and experimental analysis of quantum path interferences in high-order harmonic generation. Phys. Rev. A 2009, 80, 033817. [Google Scholar] [CrossRef]
  25. Holler, M.; Zaïr, A.; Schapper, F.; Auguste, T.; Cormier, E.; Wyatt, A.; Monmayrant, A.; Walmsley, I.A.; Gallmann, L.; Salières, P.; et al. Ionization effects on spectral signatures of quantum-path interference in high-harmonic generation. Opt. Express 2009, 17, 5716. [Google Scholar] [CrossRef] [PubMed]
  26. Kurz, H.G.; Kretschmar, M.; Binhammer, T.; Nagy, T.; Ristau, D.; Lein, M.; Morgner, U.; Kovačev, M. Revealing the Microscopic Real-Space Excursion of a Laser-Driven Electron. Phys. Rev. X 2016, 6, 031029. [Google Scholar] [CrossRef]
  27. Balcou, P.; Salières, P.; L’Huillier, A.; Lewenstein, M. Generalized phase-matching conditions for high harmonics: The role of field-gradient forces. Phys. Rev. A 1997, 55, 3204–3210. [Google Scholar] [CrossRef]
  28. Soifer, H.; Bruner, B.D.; Negro, M.; Devetta, M.; Faccialà, D.; Vozzi, C.; Silvestri, S.D.; Stagira, S.; Dudovich, N. Studying the universality of field induced tunnel ionization times via high-order harmonic spectroscopy. J. Phys. B At. Mol. Opt. Phys. 2014, 47, 204029. [Google Scholar] [CrossRef]
  29. Bruner, B.D.; Soifer, H.; Shafir, D.; Serbinenko, V.; Smirnova, O.; Dudovich, N. Multidimensional high harmonic spectroscopy. J. Phys. B At. Mol. Opt. Phys. 2015, 48, 174006. [Google Scholar] [CrossRef]
  30. Ammosov, M.V.; Delone, N.B.; Krainov, V.P. Tunnel ionization of complex atoms and atomic ions by an alternating electromagnetic field. Sov. Phys. JETP 1986, 64, 1191–1194. [Google Scholar]
  31. Delone, N.B.; Krainov, V.P. Energy and angular electron spectra for the tunnel ionization of atoms by strong low-frequency radiation. J. Opt. Soc. Am. B 1991, 8, 1207–1211. [Google Scholar] [CrossRef]
  32. Perelomov, A.M.; Popov, V.S.; Terent’ev, M.V. Ionization of Atoms in an Alternating Electric Field: II. Sov. Phys. JETP 1967, 24, 207–217. [Google Scholar]
  33. Mur, V.; Popruzhenko, S.; Popov, V. Energy and momentum spectra of photoelectrons under conditions of ionization by strong laser radiation (The case of elliptic polarization). Sov. Phys. JETP 2001, 92, 777–788. [Google Scholar] [CrossRef]
  34. Zhao, J.; Lein, M. Determination of Ionization and Tunneling Times in High-Order Harmonic Generation. Phys. Rev. Lett. 2013, 111, 043901. [Google Scholar] [CrossRef] [PubMed]
  35. Hofmann, C.; Landsman, A.S.; Cirelli, C.; Pfeiffer, A.N.; Keller, U. Comparison of different approaches to the longitudinal momentum spread after tunnel ionization. J. Phys. B At. Mol. Opt. Phys. 2013, 46, 125601. [Google Scholar] [CrossRef]
  36. Hofmann, C.; Zimmermann, T.; Zielinski, A.; Landsman, A.S. Non-adiabatic imprints on the electron wave packet in strong field ionization with circular polarization. New J. Phys. 2016, 18, 043011. [Google Scholar] [CrossRef]
  37. Landau, L.D.; Lifshitz, E.M. Quantum Mechanics, 2nd ed.; Pergamon Press Ltd.: Oxford, UK, 1965. [Google Scholar]
  38. Fu, L.B.; Liu, J.; Chen, J.; Chen, S.G. Classical collisional trajectories as the source of strong-field double ionization of helium in the knee regime. Phys. Rev. A 2001, 63, 043416. [Google Scholar] [CrossRef]
  39. Pfeiffer, A.N.; Cirelli, C.; Smolarski, M.; Dimitrovski, D.; Abu-samha, M.; Madsen, L.B.; Keller, U. Attoclock reveals natural coordinates of the laser-induced tunnelling current flow in atoms. Nat. Phys. 2012, 8, 76–80. [Google Scholar] [CrossRef]
  40. Shvetsov-Shilovski, N.I.; Dimitrovski, D.; Madsen, L.B. Ionization in elliptically polarized pulses: Multielectron polarization effects and asymmetry of photoelectron momentum distributions. Phys. Rev. A 2012, 85, 23428. [Google Scholar] [CrossRef]
  41. Hofmann, C. Attosecond Electron Dynamics in Strong-Field Ionization. Ph.D. Thesis, ETH Zurich, Zurich, Switzerland, 2016. Available online: http://dx.doi.org/10.3929/ethz-a-010859956 (accessed on 18 January 2018).
  42. Xiong, W.H.; Geng, J.W.; Gong, Q.; Peng, L.Y. Half-cycle cutoff in near-threshold harmonic generation. New J. Phys. 2015, 17, 123020. [Google Scholar] [CrossRef]
  43. Tiedemann, D.; Stiebing, K.; Winters, D.; Quint, W.; Varentsov, V.; Warczak, A.; Malarz, A.; Stöhlker, T. A pulsed supersonic gas jet target for precision spectroscopy at the HITRAP facility at GSI. Nucl. Instrum. Methods Phys. Res. Sect. A Accel. Spectrom. Detect. Assoc. Equip. 2014, 764, 387–393. [Google Scholar] [CrossRef]
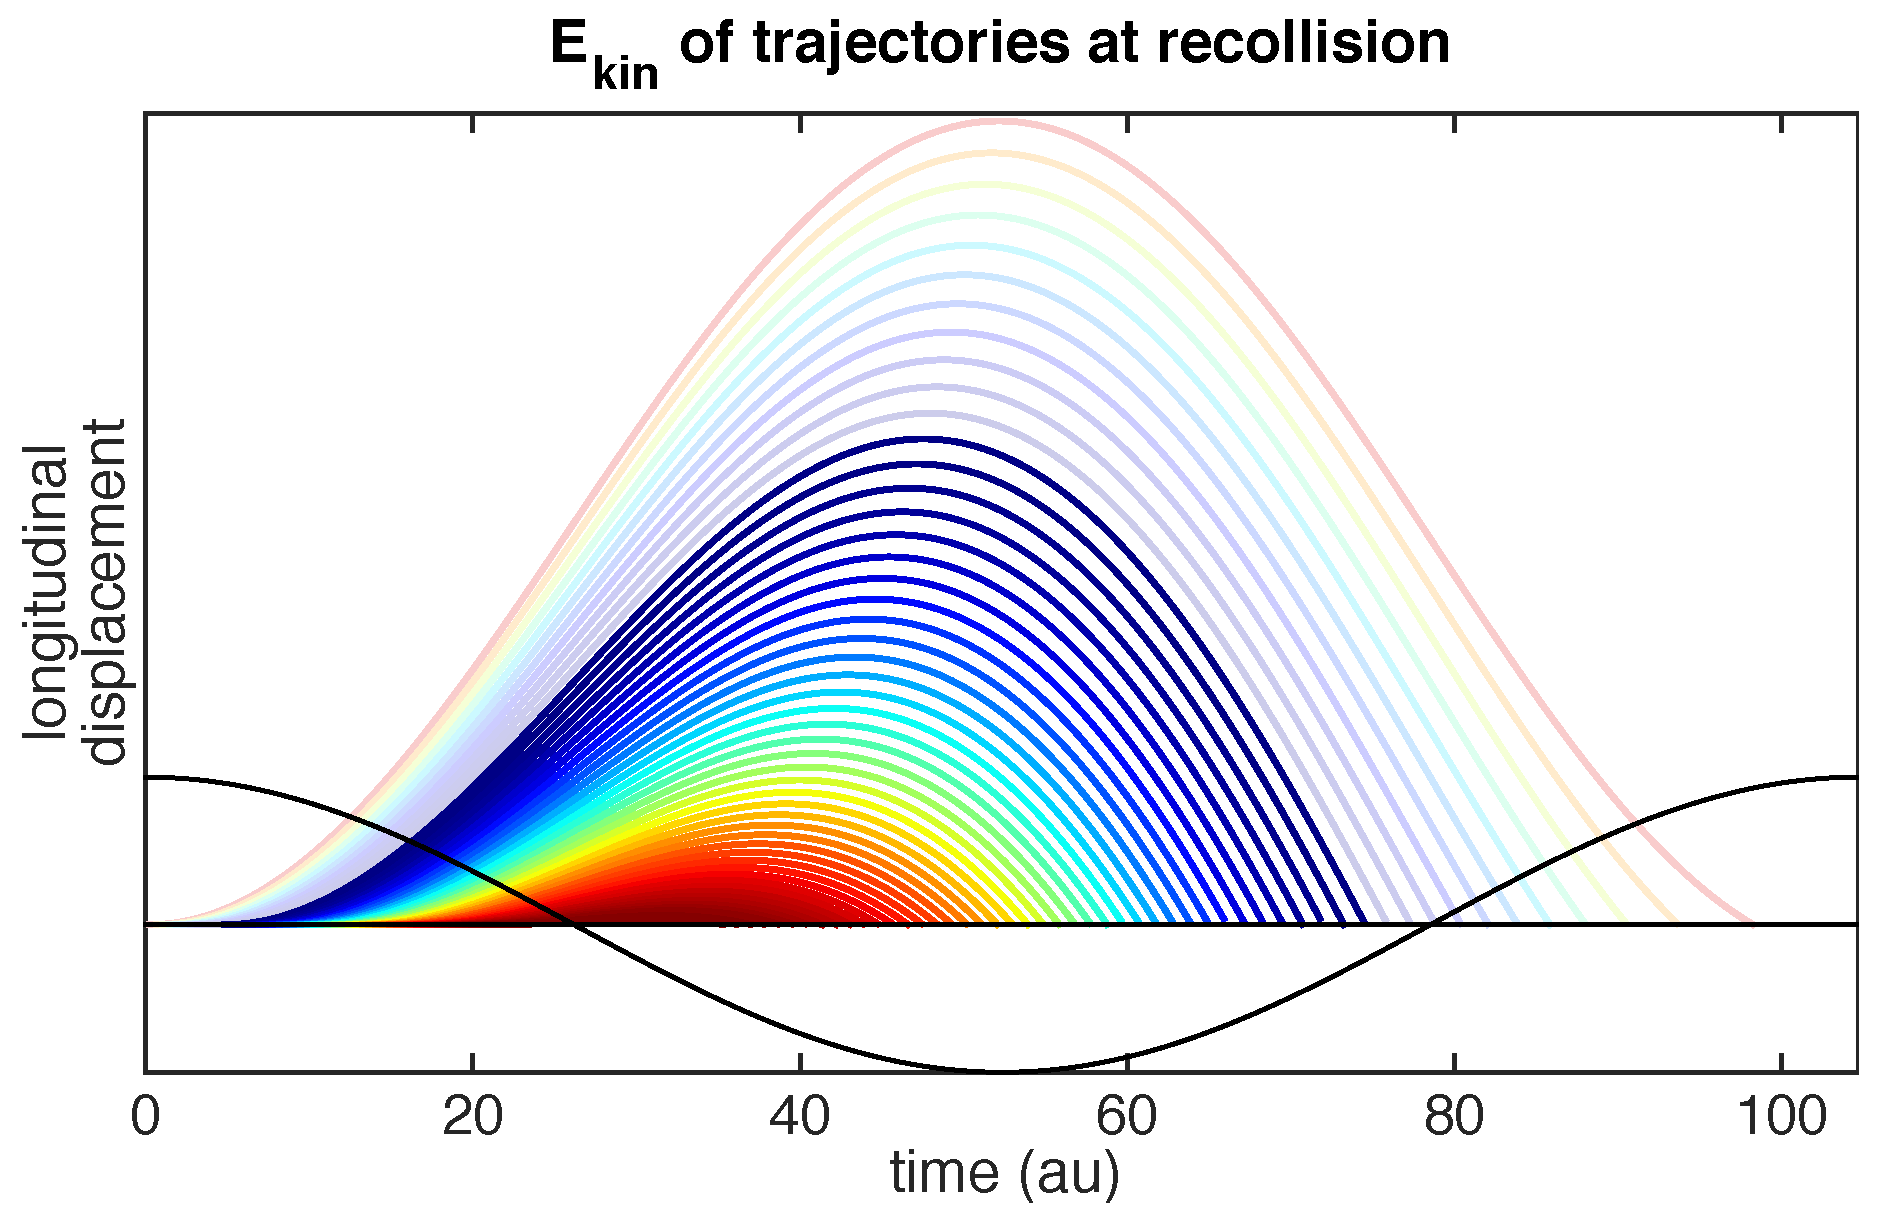
Figure 1. Photoelectron trajectories contributing to High Harmonic Generation (HHG). The colour code represents the kinetic energy of the trajectory at the return, where red is low and dark blue is high energy. Long trajectories are greyed out because typically the short trajectories dominate the spectrum. The black solid line represents the driving laser field F x ( t ) .
Applsci 08 00341 g001
Figure 2. Short trajectories in two-colour HHG displacement gate. Some trajectories are displaced and miss the parent ion on the return, and others can come back to where they originated. The colour code corresponds to the kinetic energy carried by the electrons at the return, blue = high energy, red = low energy.
Applsci 08 00341 g002
Figure 3. Kinetic energy of single classical trajectory calculations with Coulomb. (A) recorded at the exit radius for each trajectory; (B) recorded at a radius of 3 au from the parent ion. A fixed radius yields spurious energy for trajectories which are ionised late in the cycle, and low harmonics in the spectrum can not be recovered. Dark blue stars (light blue circles) represent short (long) trajectories, respectively. Red dots show the experimental data from Shafir et al. black the values from quantum stationary phase calculation [32] and grey the three-step-model [10]. Values for the last three provided from [18]. The values extracted from the Classical Trajectory Monte Carlo (CTMC) simulation in (A) reproduce the three-step-model so closely that the grey line is barely visible. The CTMC is of course based on this analytical model, except that it takes the Coulomb potential into account.
Applsci 08 00341 g003
Figure 4. The plot compares two example trajectories from the CTMC calculations. Red dots: ionised immediately at the peak of the field, resulting in a long trajectory. Green dots: short trajectory ionised later in the quarter-cycle. The grey dot-dashed curve represents the shortest exit radius. If this radius is chosen as recombination condition R, then short trajectories travel a relatively large distance from their initially larger exit radius towards the ion nucleus until they cross this radius, while being accelerated by the laser field (blue dashed) that has already turned around. Long trajectories, however, can be decelerated by the field during their approach to the ion.
Applsci 08 00341 g004
Figure 5. (A) phase mismatch for an example long and short trajectory, depending on the position of the gas jet after the laser beam focus; (B) phase matching efficiency for two example trajectories depending on the position of the gas jet z.
Applsci 08 00341 g005
Figure 6. CTMC with Coulomb simulation, the two displacement gate plots show the influence of long trajectories. (A) only short trajectories with extracted φ max ( n ) shown in white; (B) both long and short trajectories are considered.
Applsci 08 00341 g006
Figure 7. Intensity oscillation of harmonic order 31 while scanning the two-colour phase φ . Blue dots are extracted from Figure 6A, the red line is the fit of Equation (14).
Applsci 08 00341 g007
Figure 8. φ max extracted from CTMC with Coulomb (white) or CTMC without Coulomb (cyan) compared to the experimental displacement gate (colour code) [18].
Applsci 08 00341 g008
Figure 9. The extracted φ max ( n ) curves for the case of only short trajectories (white), and all trajectories with phase matching (green) are compared to the experimental displacement gate plot (colour bar) [18].
Applsci 08 00341 g009
Figure 10. The displacement gate contrasts C ( n ) extracted from fitting Equation (14) to the experimental data (red [18]), the CTMC TIPIS model (Tunnel ionisation in Parabolic coordinates with Induced dipole and Stark Shift) with only short trajectories (blue) and the CTMC TIPIS model considering all trajectories (green). The error bars show the 95% confidence interval of the Equation (14) fit.
Applsci 08 00341 g010
Table 1. Quantities in phase matching.
zlongitudinal position in direction of beam propagation
rradial position away from the beam axis
t i exit time
t r return time
τ = t r t i excursion time
k n = n ω c k ^ 1 radiated harmonic
k 1 = ω c z ^ + arg 1 b + 2 i z exp ω c r 2 b + 2 i z fundamental Gaussian beam
S p ( t r , t i ) classical action for electron wave packet propagation
K ( z , r ) = n ω t r S p ( t r , t i ) intrinsic atomic phase
Ntotal number of interacting targets along the axis
jgas jet diameter