Reduction of T2 Relaxation Rates due to Large Volume Fractions of Magnetic Nanoparticles for All Motional Regimes


Department of Physics, UAE University, P.O. Box 15551, Al-Ain, UAE
Appl. Sci. 2018, 8(1), 101; https://doi.org/10.3390/app8010101
Submission received: 1 December 2017
/
Revised: 6 January 2018
/
Accepted: 9 January 2018
/
Published: 11 January 2018
(This article belongs to the Special Issue Biological Applications of Magnetic Nanoparticles)
Abstract
:Featured Application
MRI Contrast Agents.
Abstract
The effect of high volume fraction of magnetic nanoparticles (MNP) on Magnetic Resonance Imaging (MRI) transverse relaxation rates (R2 = 1/T2 and R2* = 1/T2*) is investigated using Monte Carlo (MC) simulations. Theoretical models assume that particles occupy a small volume fraction of the sample space. Results presented in this work show that models based on both motional averaged (MAR) and static dephasing (SDR) regimes respectively underestimate and overestimate relaxation rates at large volume fractions. Furthermore, both R2* and R2* become echo-time dependent. This suggests that diffusion is involved with larger echo-times producing smaller relaxation rates due to better averaging of the magnetic field gradients. Findings emphasize the need for the models to be modified to take account of high particle concentration especially important for application involving clustering and trapping of nanoparticles inside cells. This is important in order to improve the design process of MNP Contrast Agents.

1. Introduction
The ability to synthesize nanoparticles and functionalize them have opened many areas for scientific and technical applications in recent years. Nanoscale magnetic particles possess unique physical, and particularly magnetic properties extremely different from their bulk counterparts. In moving from ferromagnetism to superparamagnetism, many critical parameters need to be quantified based on not only their nano size but also considering the new interactions and modified environment. Finite size effects [1] (e.g., canting and disordered surfaces) influence many magnetic parameters such as anisotropy energy () [2,3,4], Néel () and Brownian () relaxation times, and blocking temperature () [5]. Understanding not only the individual evolution of these parameters with scale, magnetic field, temperature, but also their interaction, mutual and with the surrounding environment, is of paramount importance to the design and application of intelligent and multifunctional magnetic nanoparticles (MNP). In biomedicine, MNPs and in particular superparamagnetic iron oxides (SPIO) have a wide range of applications such as magnetic particle imaging (MPI) [6], drug delivery [7], magnetic hyperthermia (MH) [8,9,10], MRI [11], cell tracking [12,13], magnetic biosensors [14,15], regenerative medicine and tissue engineering [16,17], etc. When used as MRI contrast agents (CA) SPIOs can reduce both T1 and T2 relaxation times and hence enhance tissue contrast [18,19,20,21]. Modern synthesis techniques of nanoparticles control their physical and chemical properties to great precision in order to control and predict interactions and functionality of the MNP within tissues such as their biocompatibility and toxicity, spatial distribution, and the relaxation enhancement per unit concentration (i.e., relaxivity). Transverse relaxation enhancement is controlled mainly by the MNP size and magnetization (or susceptibility [2,3]) which create magnetic field inhomogeneities that are sampled by the diffusing spins. Generally, SPIO induced relaxation of water protons is due to two outer sphere elements. The first is the above mentioned process of spins moving through magnetic field inhomogeneities modulated by the translational correlation time. This is known as Curie (or susceptibility) relaxation because it is the nonfluctuating average electronic spin of the MNP which relaxes water protons. It is a dipolar interaction and modulated by reorientation and exchange. The second element is due to the fluctuations or relaxation of the superparamagnetic magnetic moment which is characterized by global correlation time () and its relation to the proton’s precessional frequency [2]. Crystal anisotropy influences this process through Néel’s time constant () where is the anisotropy energy, is the preexponential factor, and kT is thermal energy. At high magnetic fields (typical of clinical MRI scanners) and large MNP the first relaxation mechanism is dominant because the magnetic moment is locked along the external field and Néel relaxation is not possible. For small particles (few nm), both mechanisms contribute because crystal anisotropy is small leading to the appearance of low field dispersion in the Nuclear Magnetic Resonance Dispersion (NMRD) profile [2,3].
It is known that spins diffusing around magnetic material, such as blood vessels or magnetic nanoparticles, accumulate phase due to the presence of magnetic field gradients created by the susceptibility difference between these materials and the surrounding background [22,23]. It is the non-uniform nature of the magnetic fields that create phase dispersion leading to transverse magnetization decay. This inhomogeneity will depend not only on size of the local field disturbance as reflected by the combination of particle size and magnetization, or magnetic moment, but also on the number of particles per unit volume and their spatial distribution. For example, increasing the volume fraction of MNP will expectedly enhance transverse relaxation due to increased local gradients, however, these gradients may saturate even though the value of the field itself continues to increase with the particle volume fraction.
Theoretical models manage to predict transverse relaxation rates (R2 = 1/T2 and R2* = 1/T2*) for both spin-echo and gradient-echo experiments using physical parameters describing both MNP and the system such as the particle size and magnetization, the volume fraction occupied by the MNP, and the diffusion coefficient of water molecules diffusing around the MNP, in addition to pulse sequence parameters. Two limiting models known as the motional averaged (MAR) [24,25,26] and static dephasing (SDR) [23,27] Regimes describe transverse relaxation and agree with both experimental and computational studies. These models were developed under the conditions that the MNP volume fraction is small (~10−5). This work examines transverse relaxation behavior when the MNP volume fraction becomes large and compares MC simulation predictions with the existing models. The disagreement between them is examined as a function of particle volume fraction, particle size, and echo-time under both limiting motional regimes. Large concentration of MNP can ensue due to clustering or compartmentalization inside cells [28,29,30,31]. The ability to track and quantify these agents depends on the accuracy of measuring relaxation times. However, large errors in measuring T2 and T2* have been reported and the linearity of these parameters with the MNP concentration is compromised. This work uses MC simulation, proven to be highly accurate in predicting relaxation times under low MNP concentrations, to study the effect of high concentration on the already available theoretical models mentioned above and explained in more details in the Methods section below. We prefer this approach over the experimental approach in this preliminary work because it offers high accuracy and control, and avoids problems of clustering and particles size spread usually associated with synthesis techniques. These problems intensify when high temperatures are used or when particles enter biological tissues.
2. Methods
Theoretical models quantify R2 and R2* in terms of a dynamic parameter known as the diffusion or translational correlation time () which is given by . R is the radius of the particle and D is the diffusion coefficient of the sample investigated. Two limiting regimes exist based on the value of the product () where is the Larmor frequency experienced by the proton at the equatorial line of the particle surface (radius = R, θ = π/2) of a magnetic particle of radius R and magnetization M, and is given by . For small spherical particles satisfying (), the MAR (also known as diffusional narrowing regime) relaxation rate [24,25,26] is given by ()
where f is the particle volume fraction. The water spins are very efficient in sampling and averaging the magnetic field variations introduced by the small MNP as long as they are not interrupted by refocusing RF pulses or MNP boundaries. Both R2 and R2* are equal and independent of the echo time.
For larger particles in SDR satisfying (), relaxation is independent of both R and D and reaches a limiting value given by [23,27]
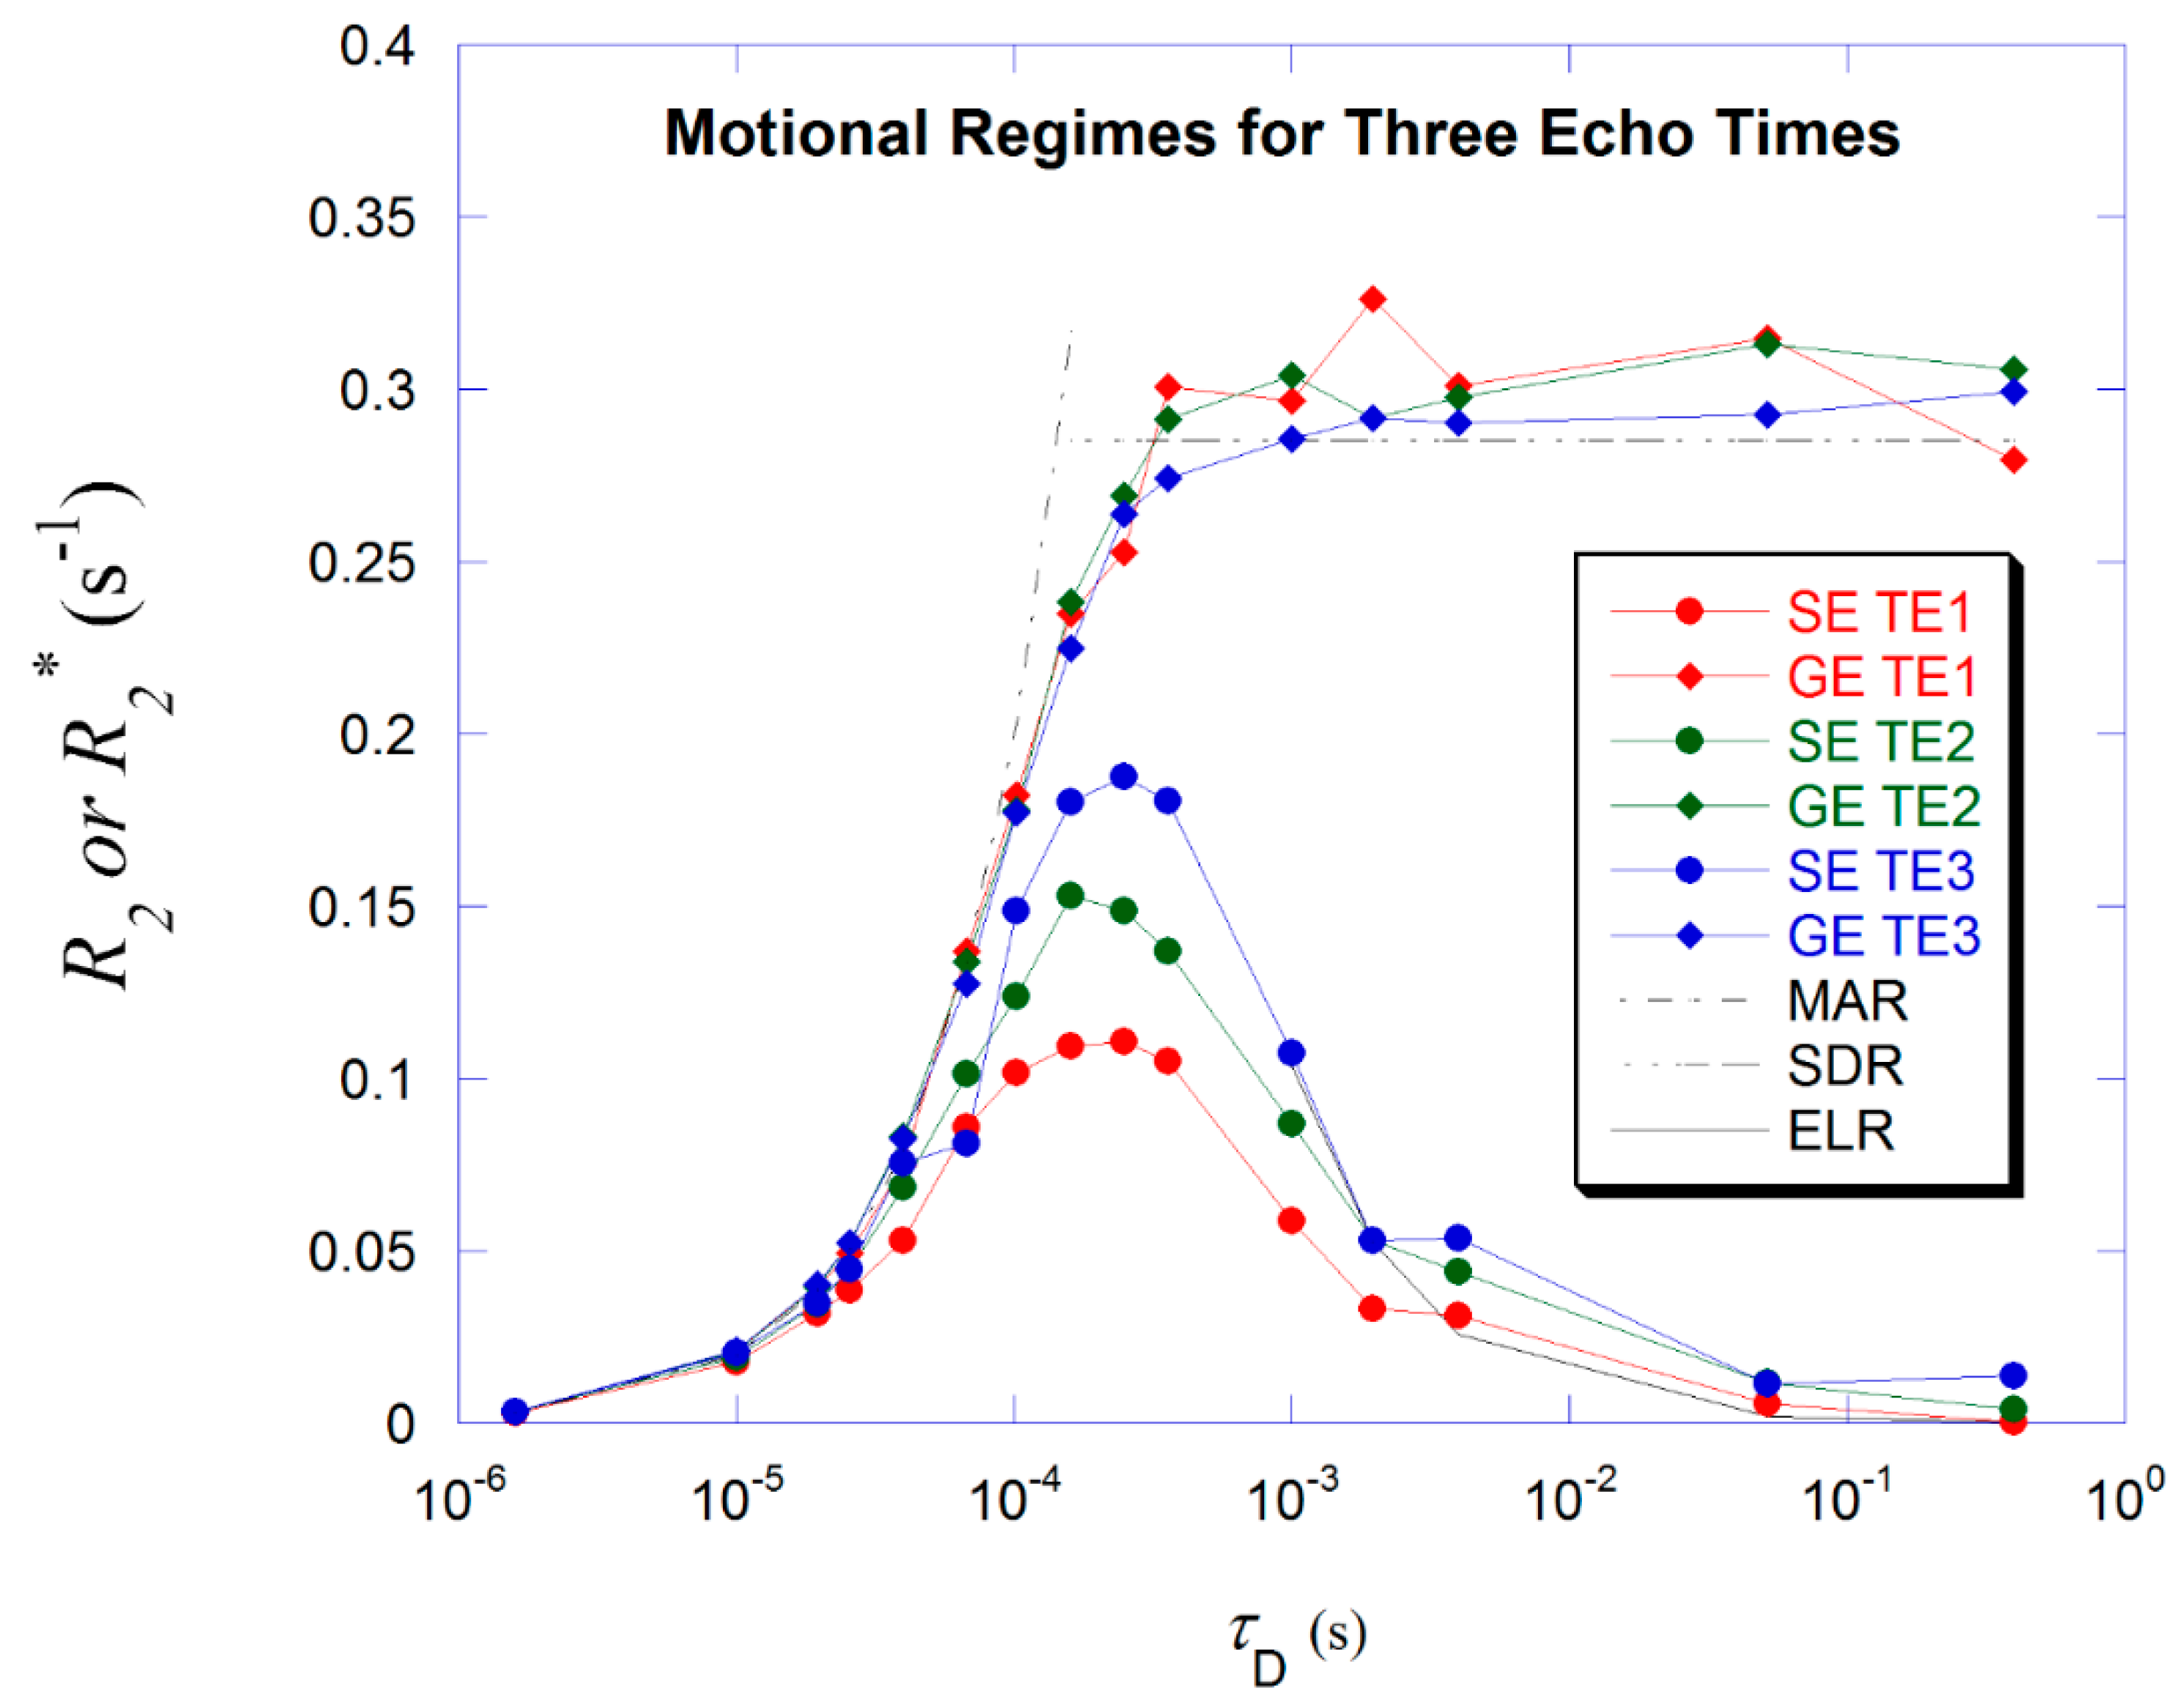
These two limiting cases are shown in Figure 1 along with the theoretical models given by Equations (1) and (2) above. The data shows the ability of MC technique to accurately predict relaxation rates. Details of the MC simulation are explained below.
For spin-echo (SE) sequences (large particles) and as the echo-time is reduced the refocusing RF pulses become more effective and partial refocusing occurs and R2 decreases compared to . This is the echo-limited regime (ELR) [32,33,34] valid for , the relaxation time is given by
where and is half the echo-time in a single Hahn echo or half the 180 RF pulses spacing in a Carr–Purcell sequence. All the above models assume uniform size and magnetization distributions, spherical particle shape, and low volume fractions. The dependence of R2 on is shown in Figure 1.
We will evaluate these models under the condition of large particle volume fraction against R2 and R2* values obtained using Monte Carlo simulations as these techniques have demonstrated agreement with both theoretical models and experimental findings by many previous studies [22,35,36]. Spins sample the inhomogeneous magnetic fields randomly due to Brownian motion and accumulate phase shift () in time () according to the relation
where Bz is the magnetic field component parallel to the static field B0 and is the sum of contributions from the all MNPs according to their size and magnetization. The time step is chosen such that the step length of each displacement (given by Einstein’s relation for one-dimensional displacement) does not exceed half the smallest particle radius. This is very important in order to yield adequate sampling of the magnetic field spatial inhomogeneity and consistent results. Our voxel is chosen to be cubic and its volume is calculated according to the chosen values of the volume fraction for any particle size distribution (i.e., voxel or sample volume ). The boundary conditions at the surface of the cube are periodic where a diffusing spin is re-entered at the opposite face of the cubic voxel if the size of the next random walk jump would take it outside the voxel. The surface of the spherical MNP is impermeable and therefore spins are not allowed to either bypass the particle nor to take a jump that would leave the spin inside it. Details of the MC simulation are similar to those used in references mentioned above. The spin performs a random walk (jumps Δh in each Cartesian direction) and accumulates transverse phase according to Equation (4). This process continues for duration of the total MRI experiment TE. For simulating T2 decay, the phase is inverted due to the application of the refocusing RF pulses. The number of spin jumps during is governed by the value (/). The value of the transverse magnetization is given by
where N is the number of spins (N = 4000). The simulated magnetization is fitted to a monoexponential curve from which R2 and R2* are extracted. The parameters’ values chosen in this study are as follows: ωr = 2.36 × 10⁴ rad/s, D = 2.5 × 10⁻⁹ m2/s, particle’s radii: 1040–3000 nm for SDR and 69–200 nm for MAR, volume fraction (f) 1 × 10⁻⁶–2 × 10⁻¹, the number of spin echoes is eight., This process is repeated for 40 spatial distributions (i.e., particle’s locations) of the MNP and averaged together.
For each limiting motional regime we used two particle size arrangements: variable and fixed size arrangements. For MAR Table 1 shows the two size arrangements below.
For SDR Table 2 below shows the two size arrangements used.
3. Results
3.1. Small Volume Fraction—MAR
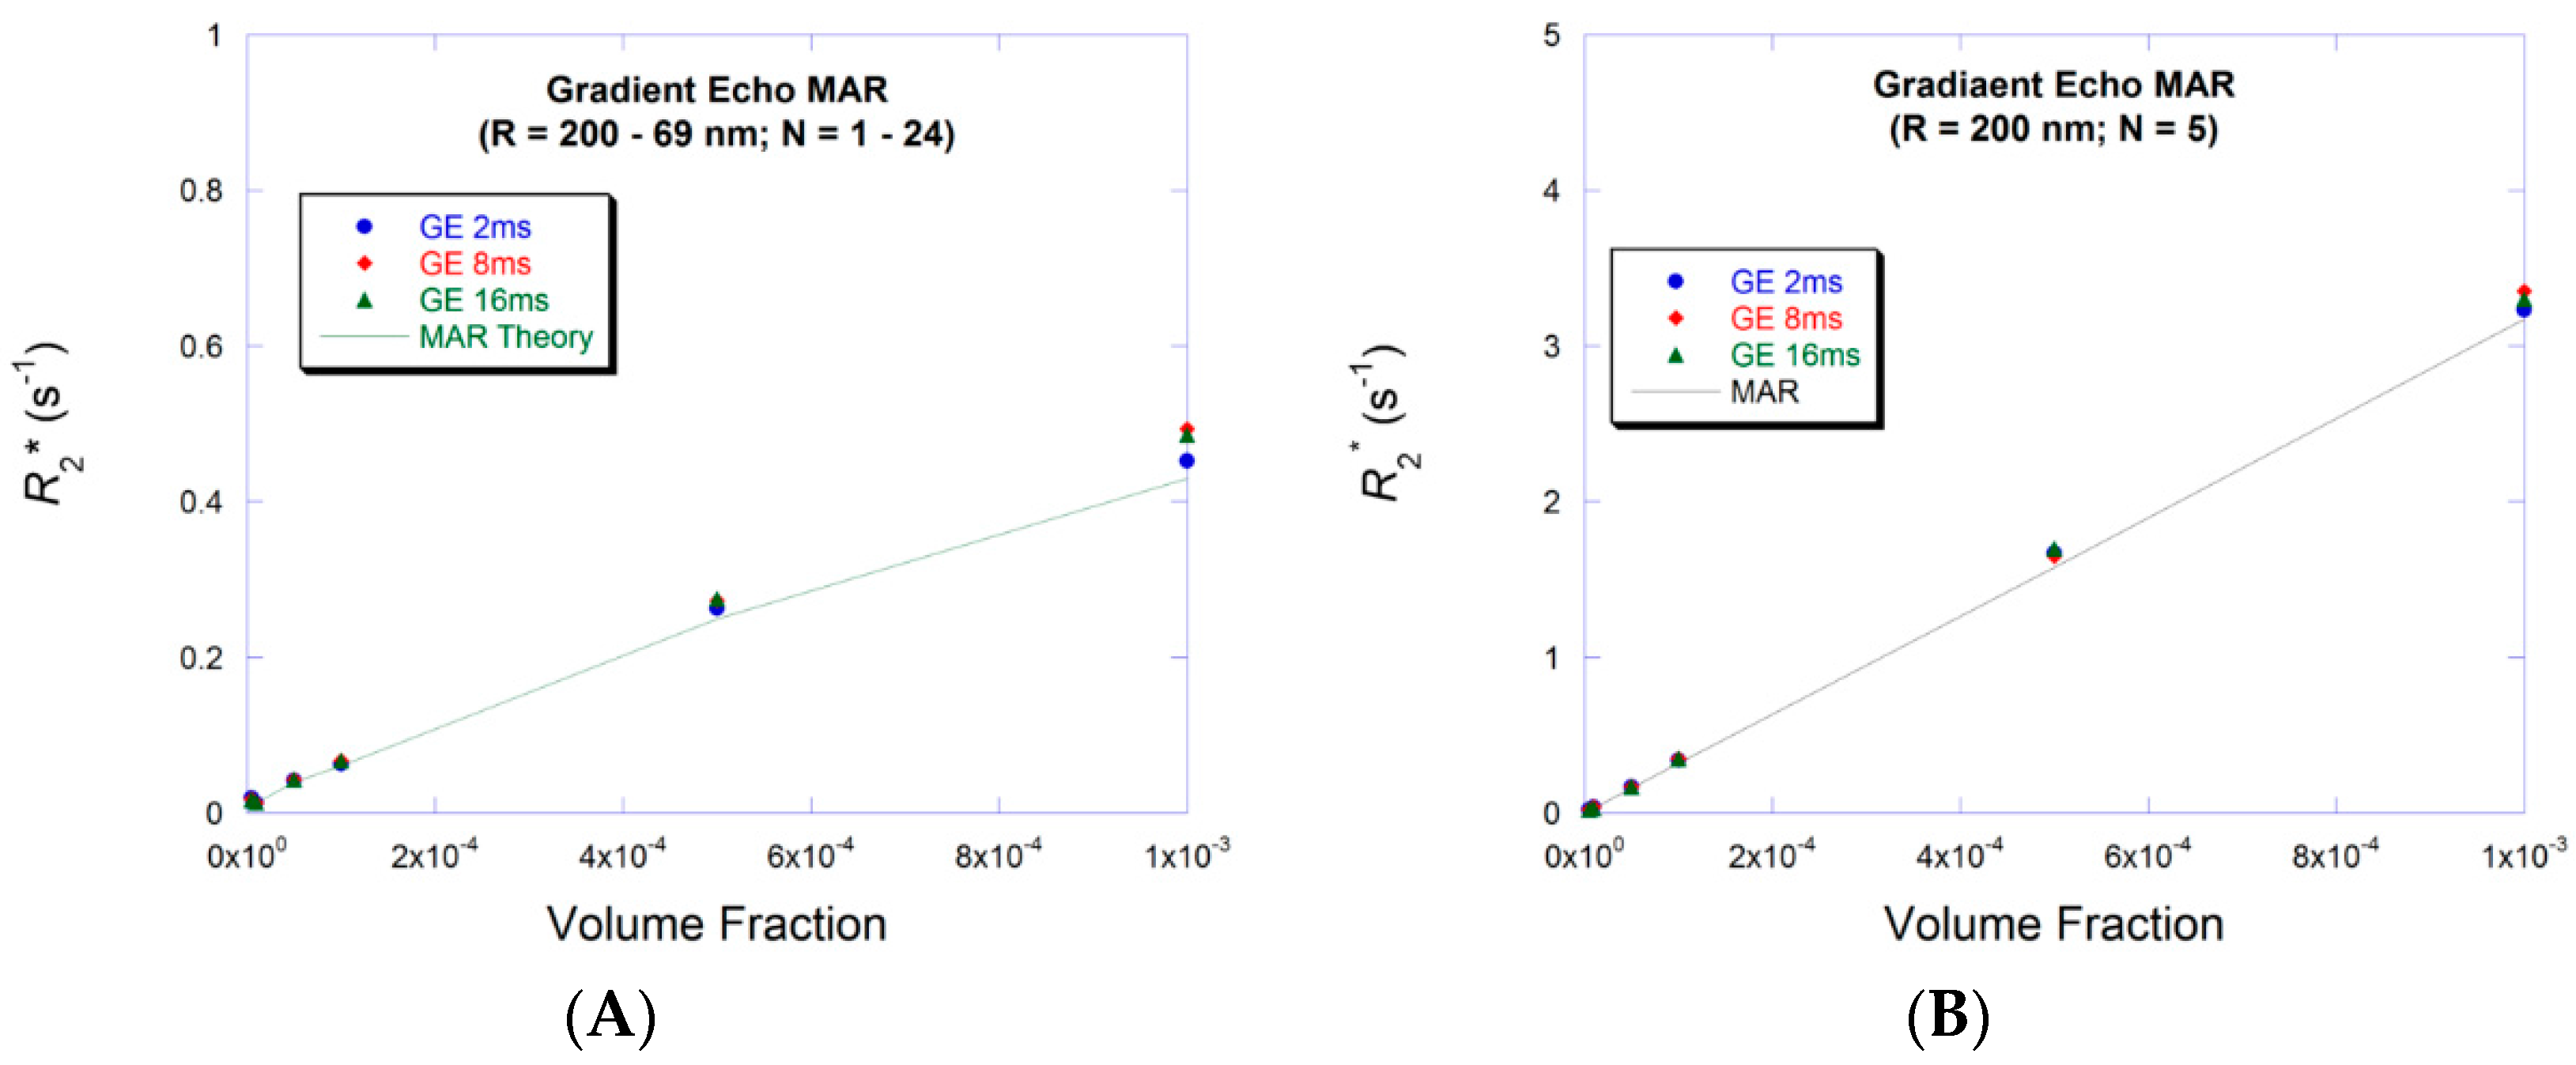
Figure 2 shows simulated R2* values for the lower range of volume fraction (f: 1 × 10⁻⁶–1 × 10⁻³) in good agreement with theory. This is shown for two arrangements of particles’ size and number. In Figure 2A the size of the particles is decreased while their number is increased in order to yield increasing volume fraction; while the size and number are kept constant with decreasing sample volume () for the second arrangement (Figure 2B). Similar configuration is shown for the spin-echo sequence in Figure 2. R2 and R2* are equal as predicted by MAR theory for each particle size arrangement: variable size as in Figure 2A and Figure 3A; or fixed size as in Figure 2B and Figure 3B. However, relaxation is faster for fewer larger particles than for many small particles as shown in Figure 2B vs. Figure 2A or Figure 3B vs. Figure 3A. Furthermore, there is no echo-time dependence as predicted by Equation (1).
3.2. Small Volume Fraction—SDR
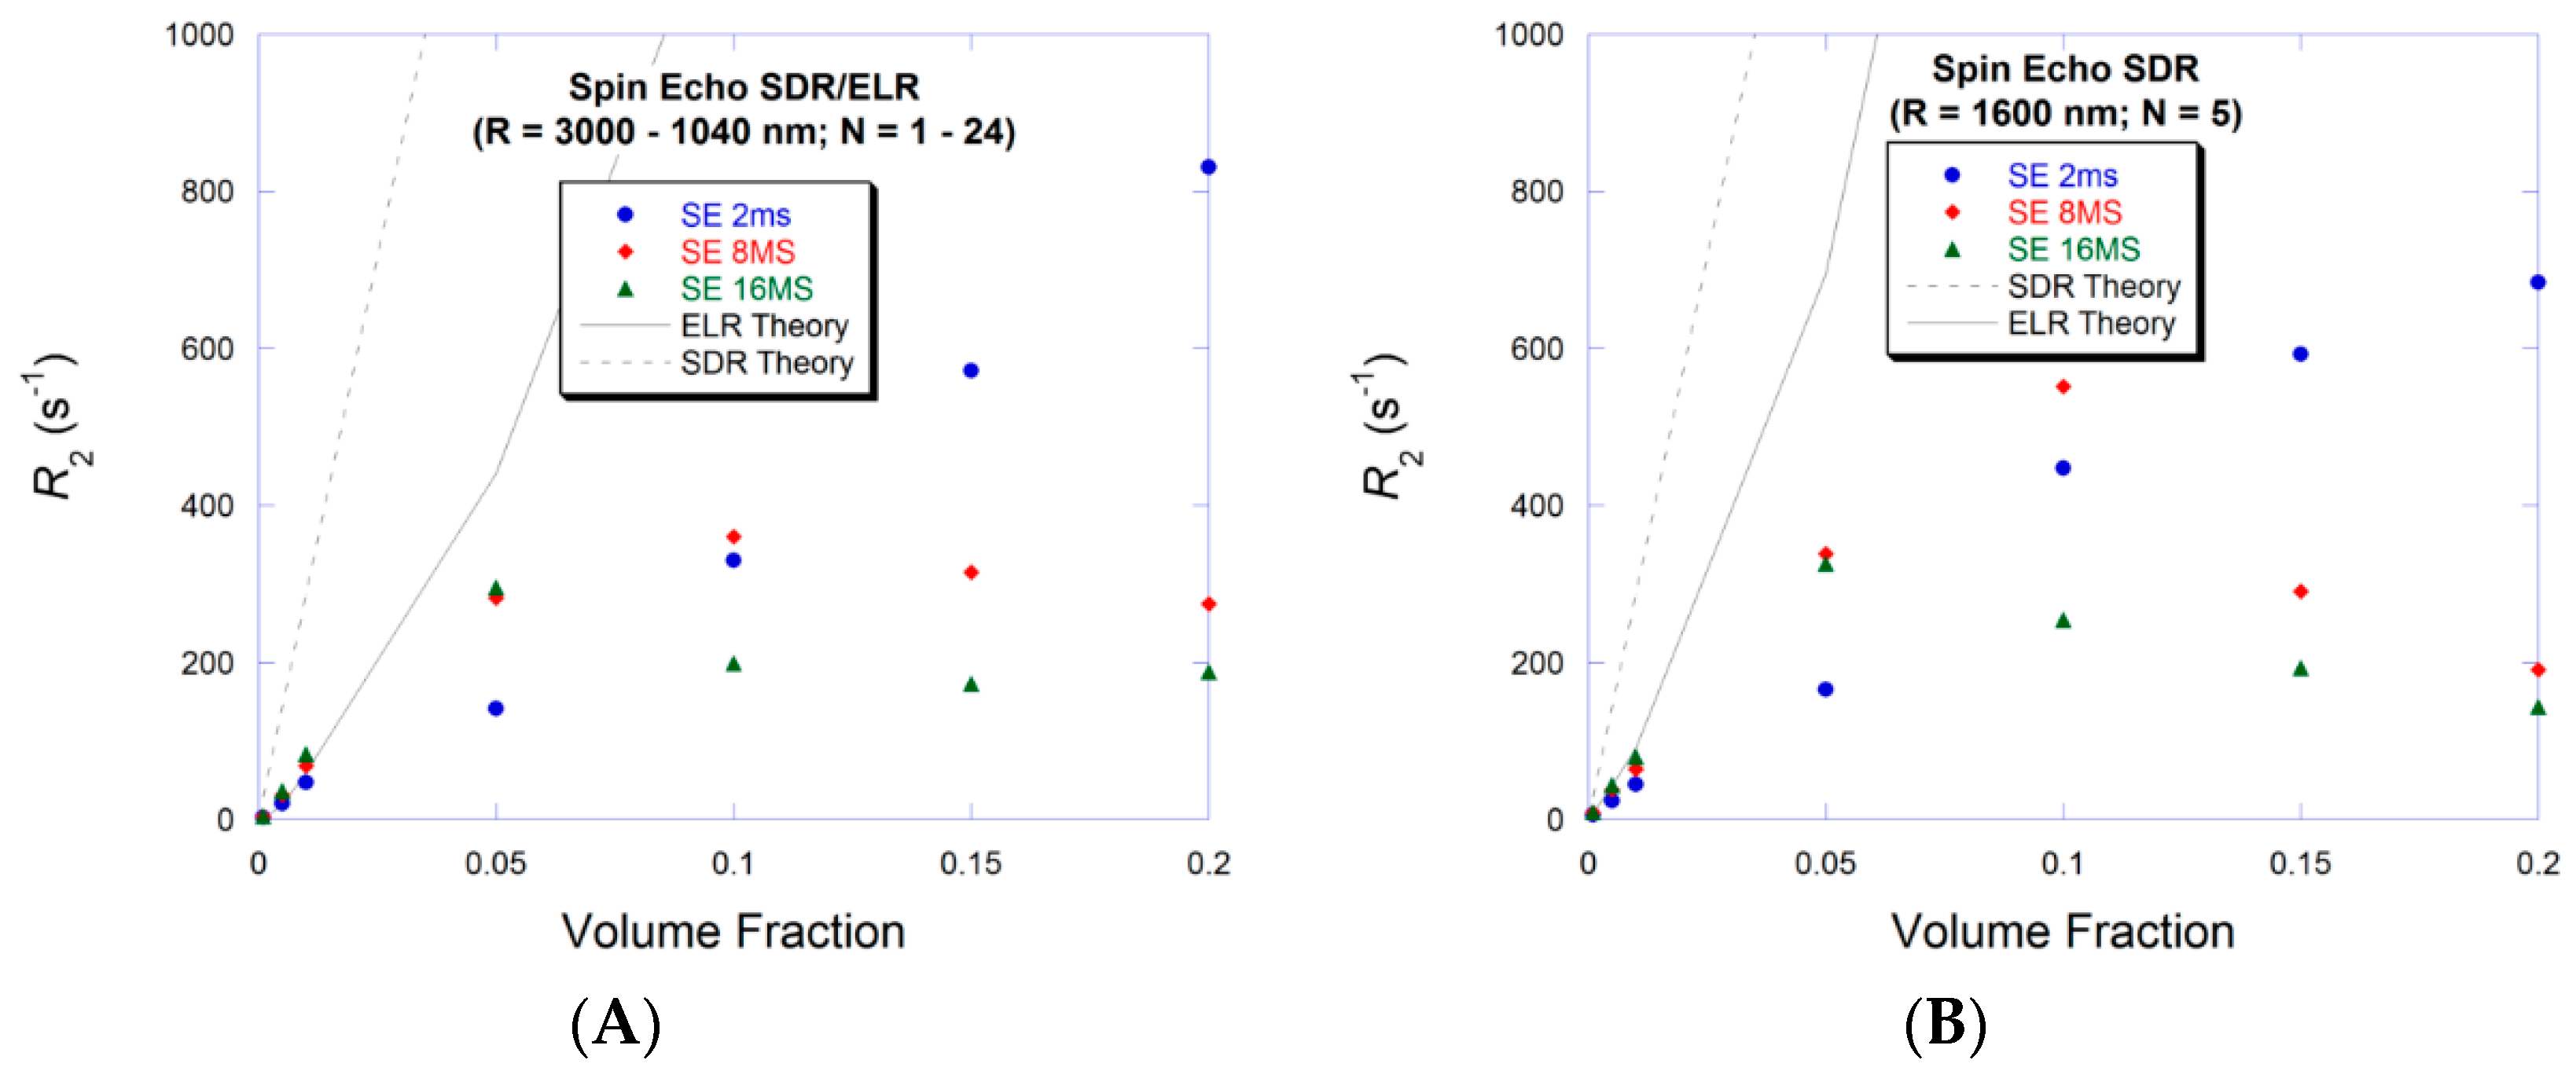
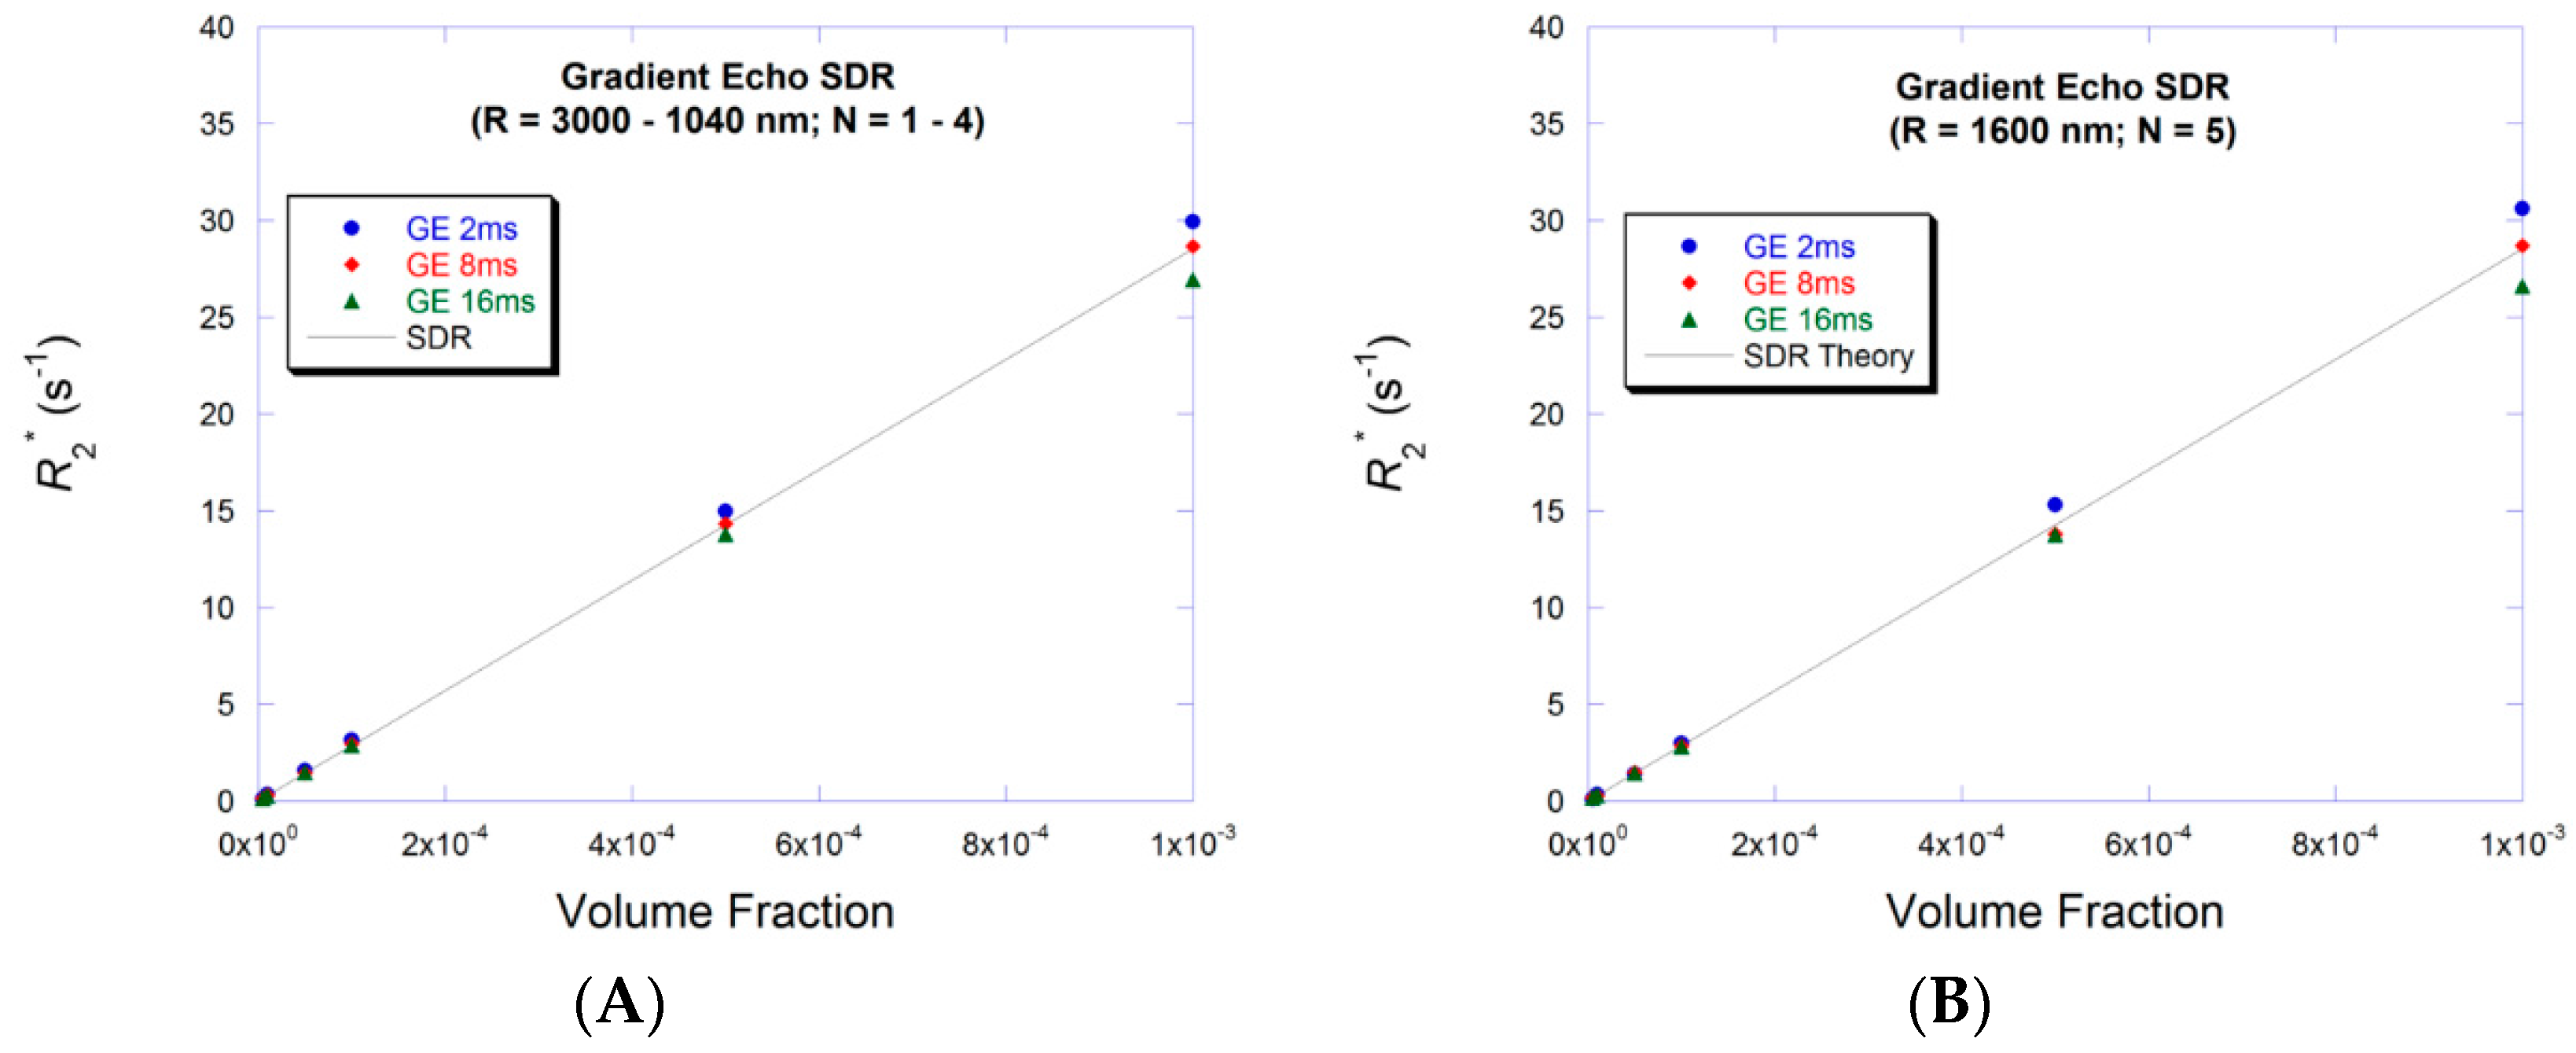
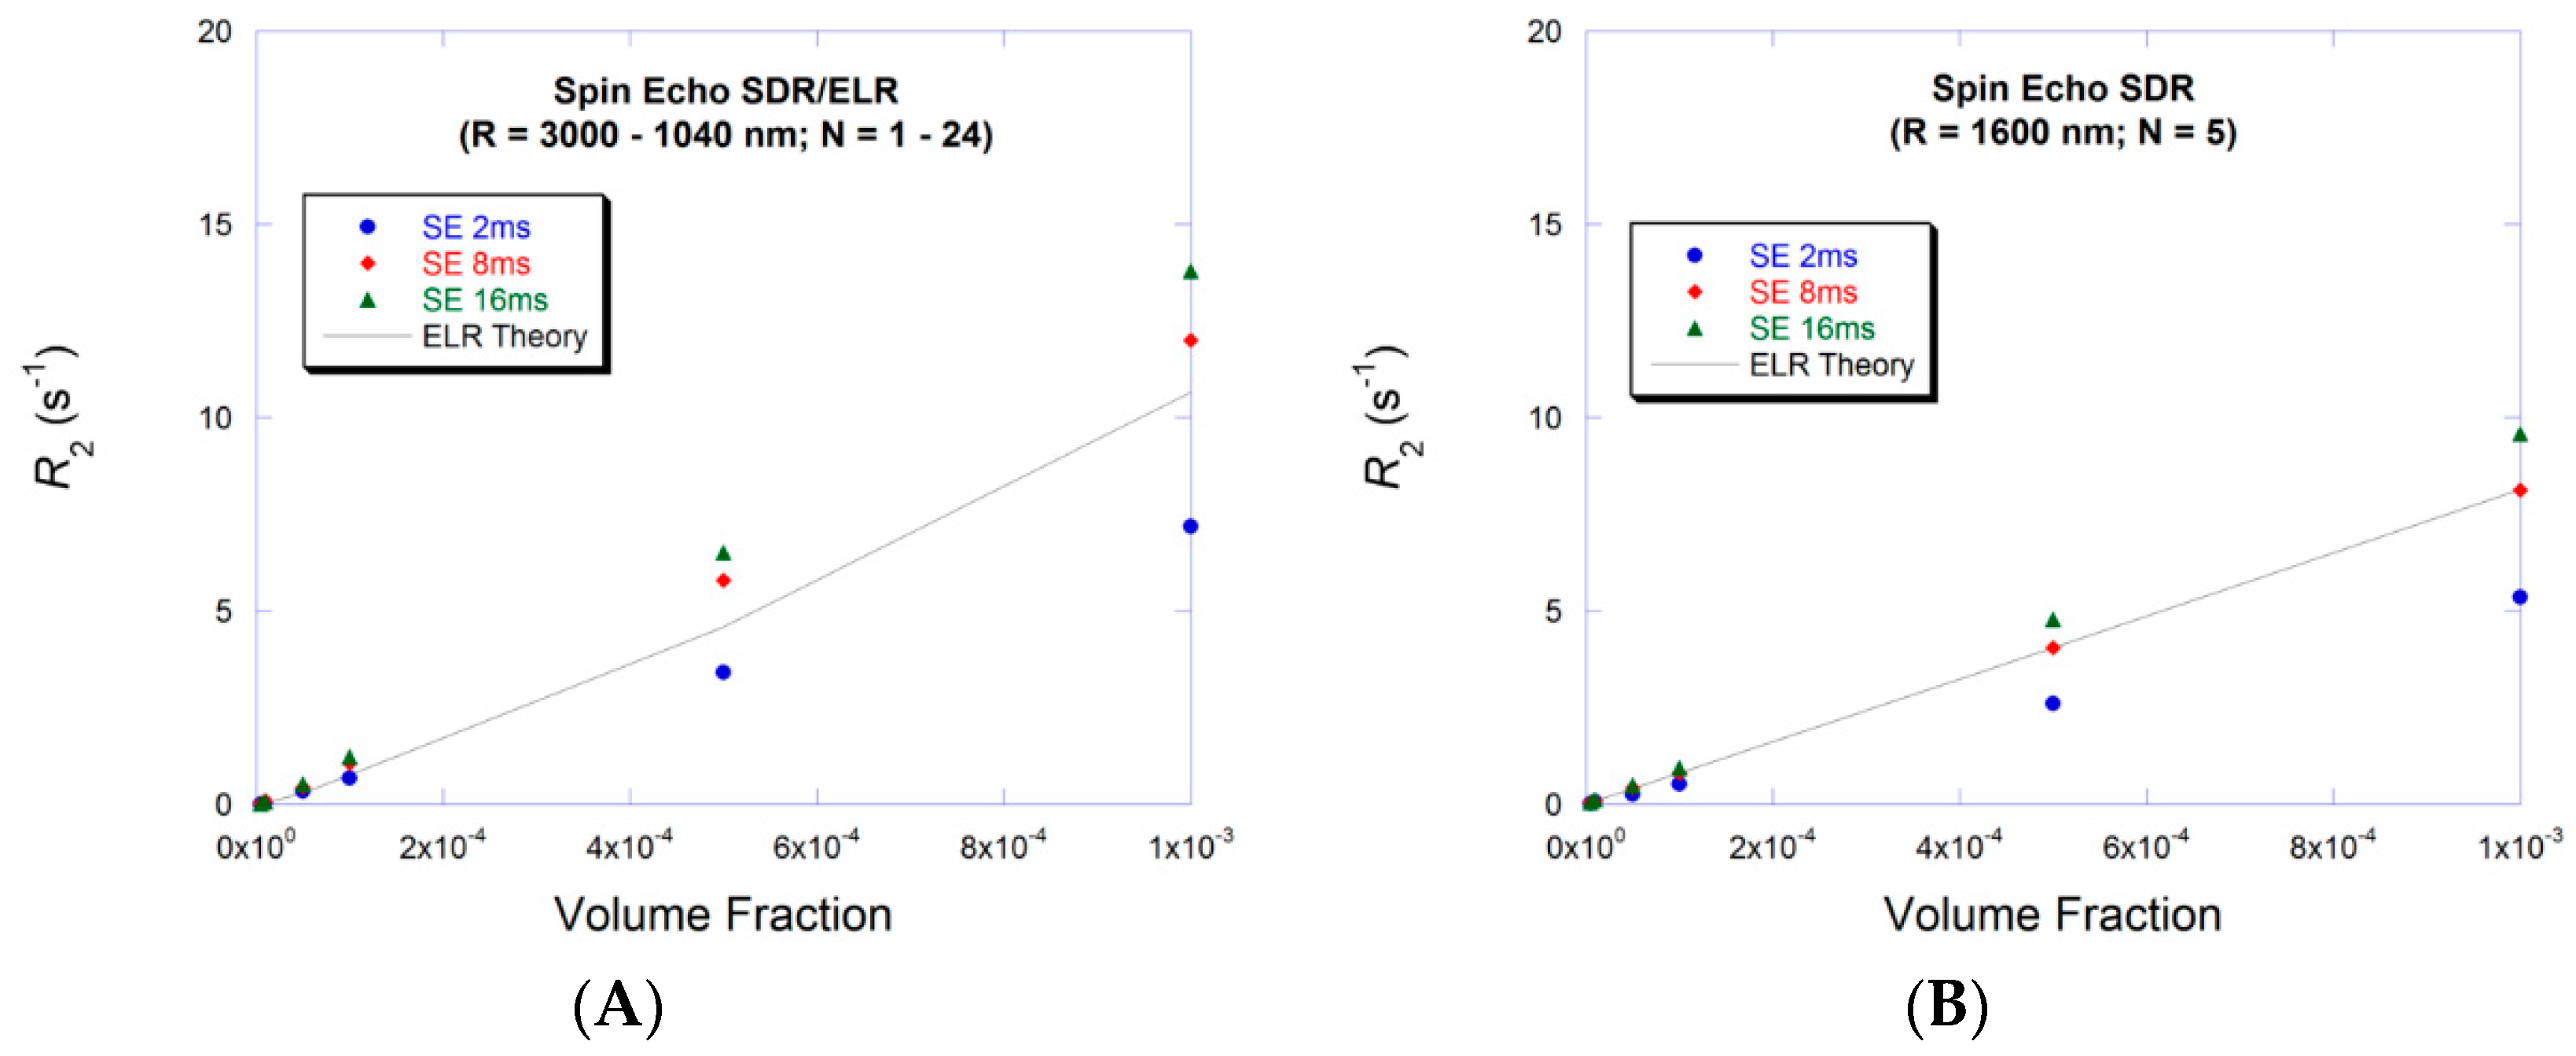
For larger particles (SDR) at small volume fractions R2* are equal for both particle size and number arrangements as shown in Figure 4A,B. Particle arrangement has no significance within this regime contrary to the cases shown for MAR cases in Figure 2 and Figure 3. R2* increases linearly with the volume fraction and independently of echo-time as predicted by SDR theory in Equation (2). R2 is smaller than R2* (for each particle size arrangement) and shows the expected echo-time dependence (Figure 5) of the ELR given by Equation (3) due to the involvement of diffusion.
3.3. Large Volume Fraction—MAR
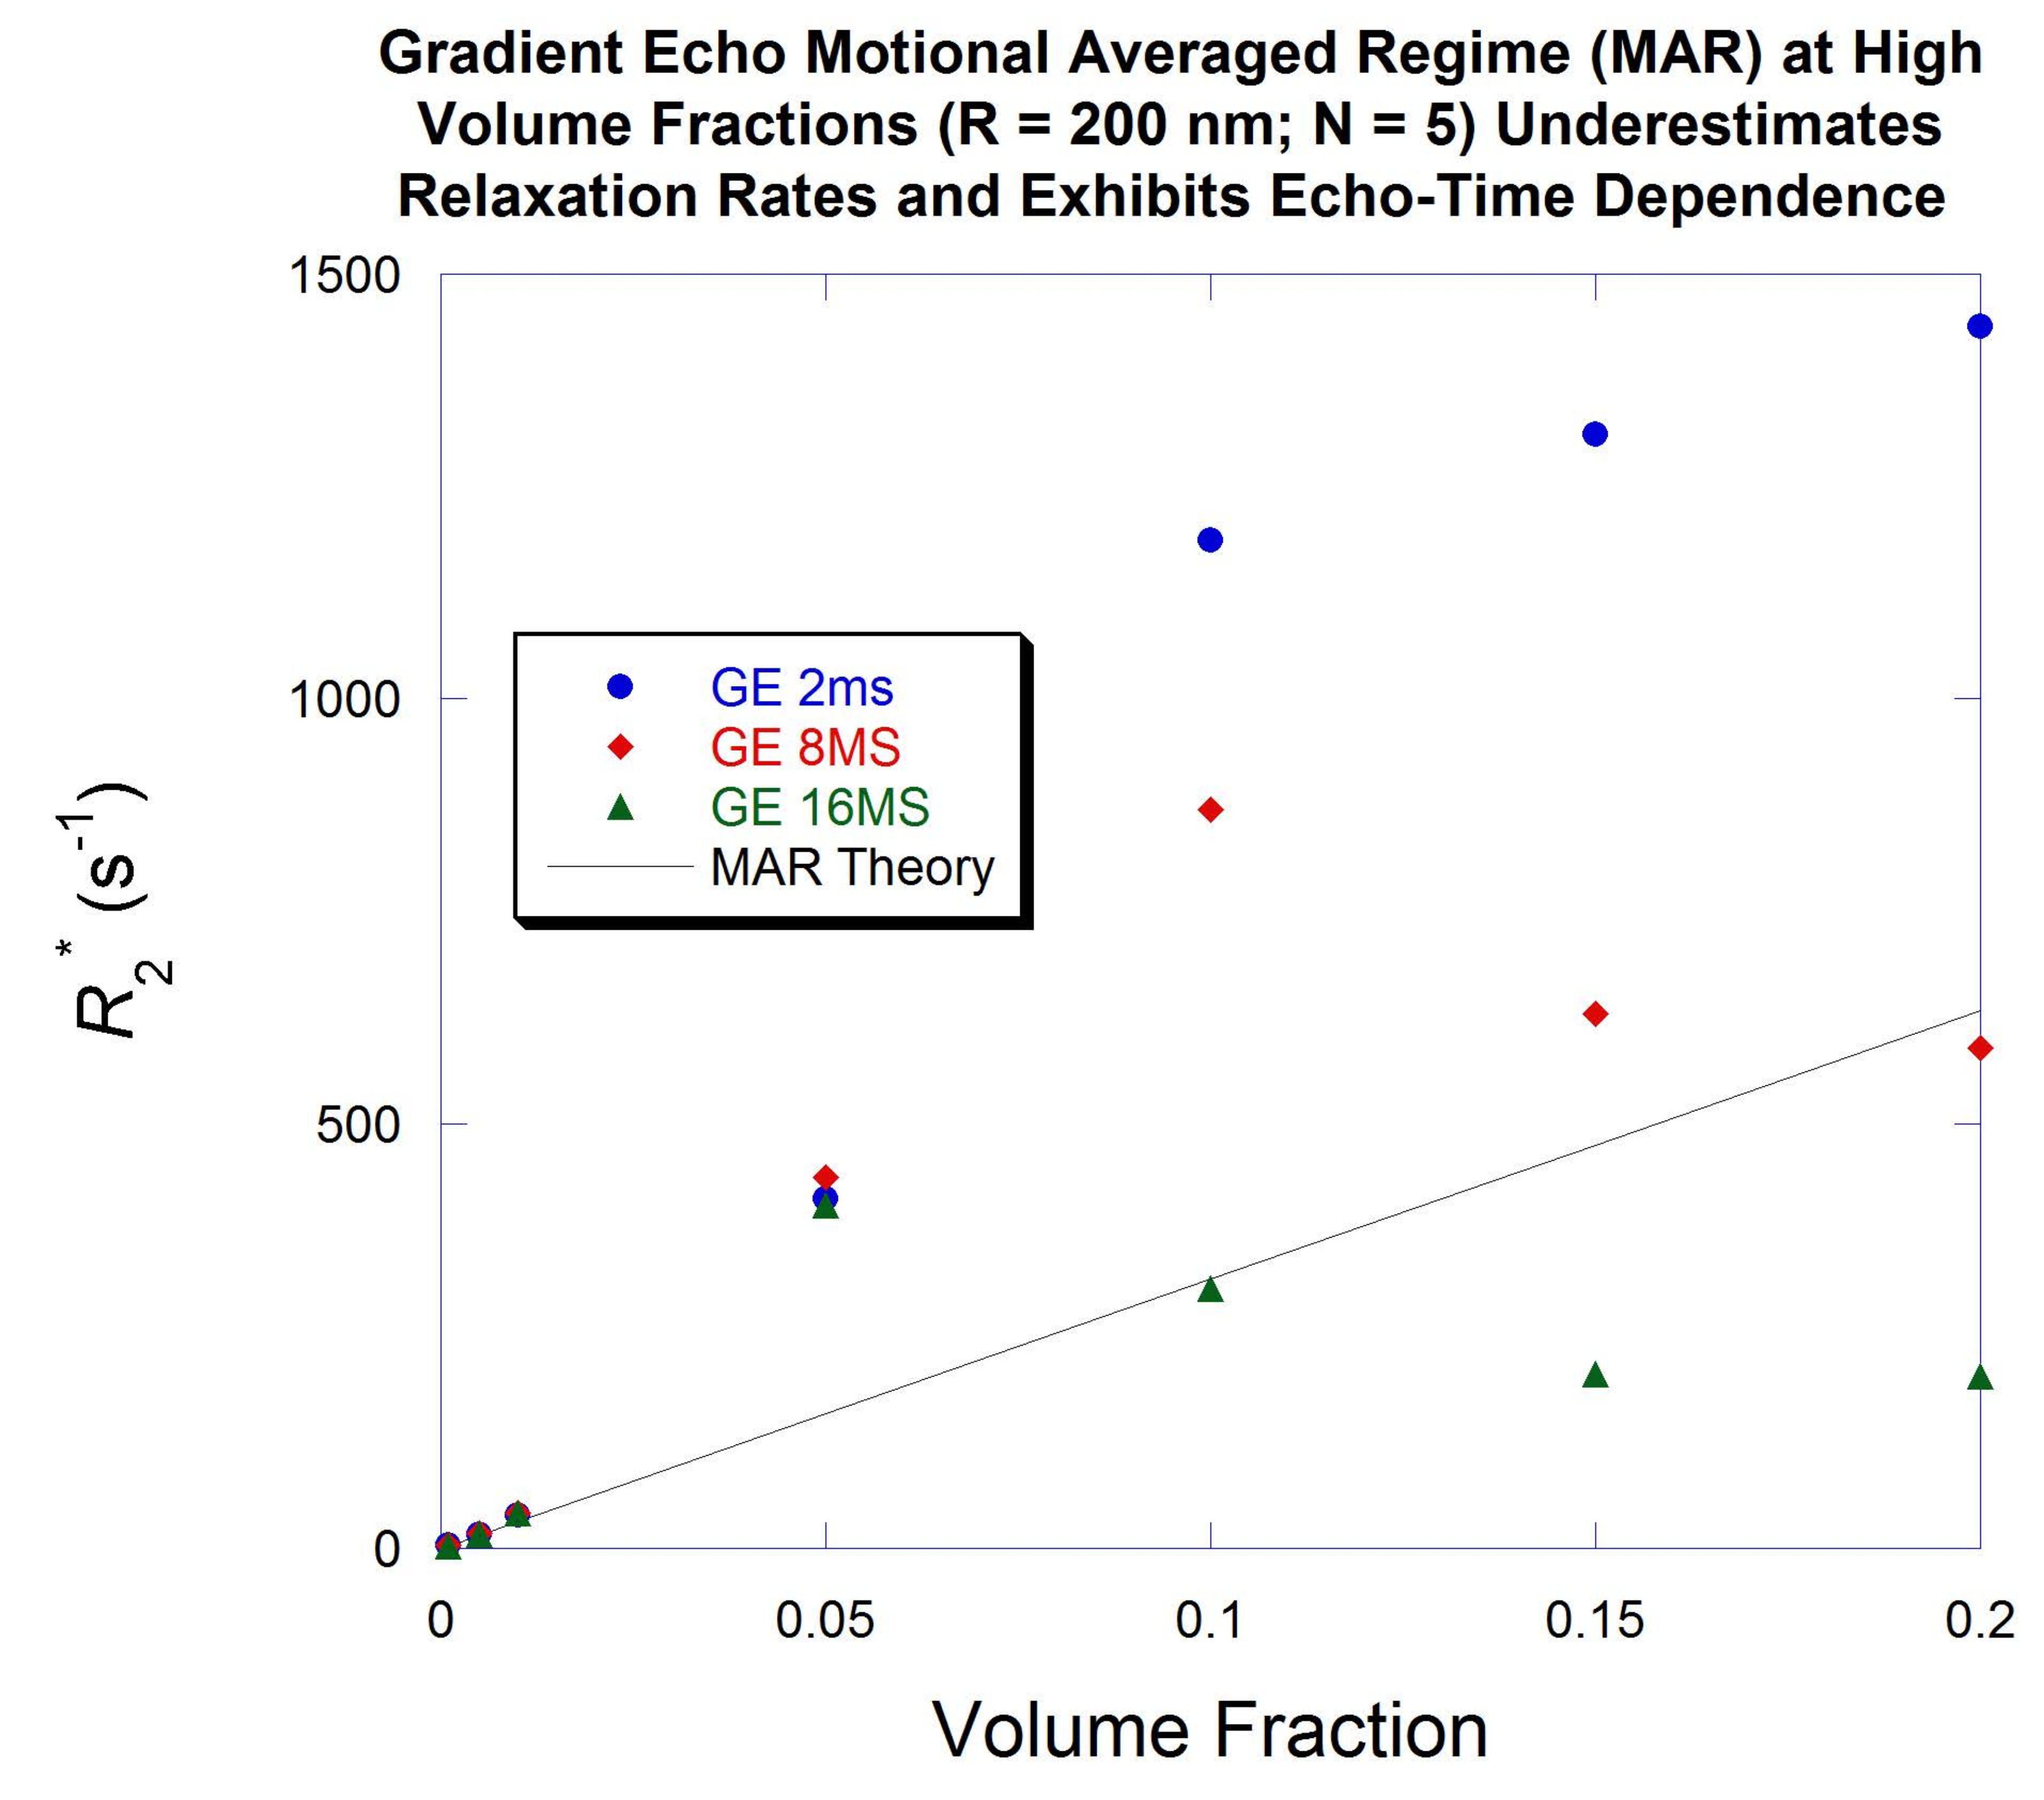
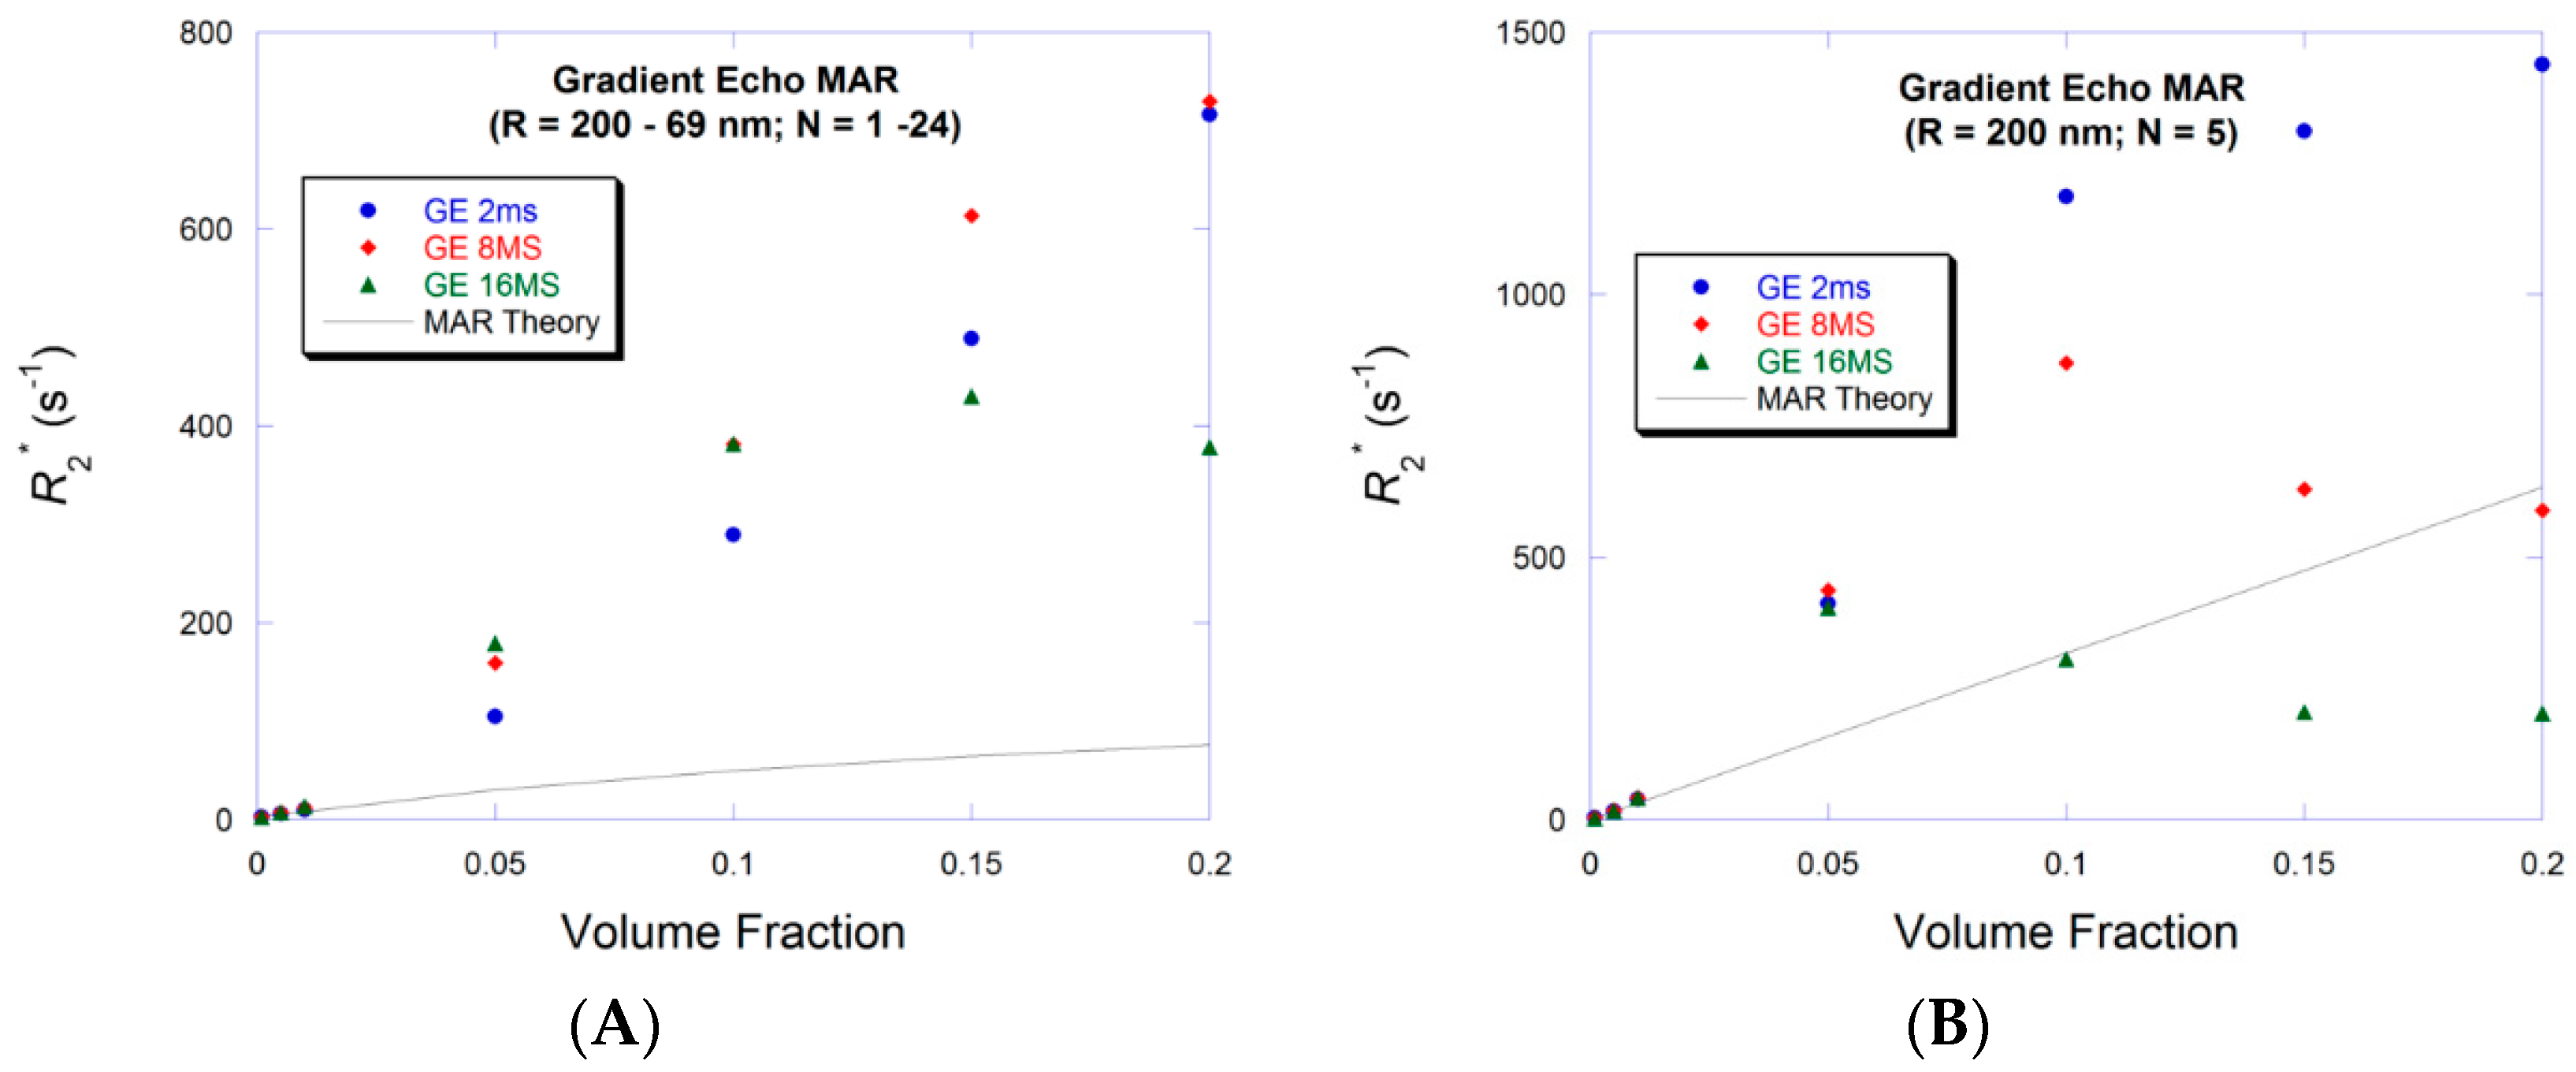
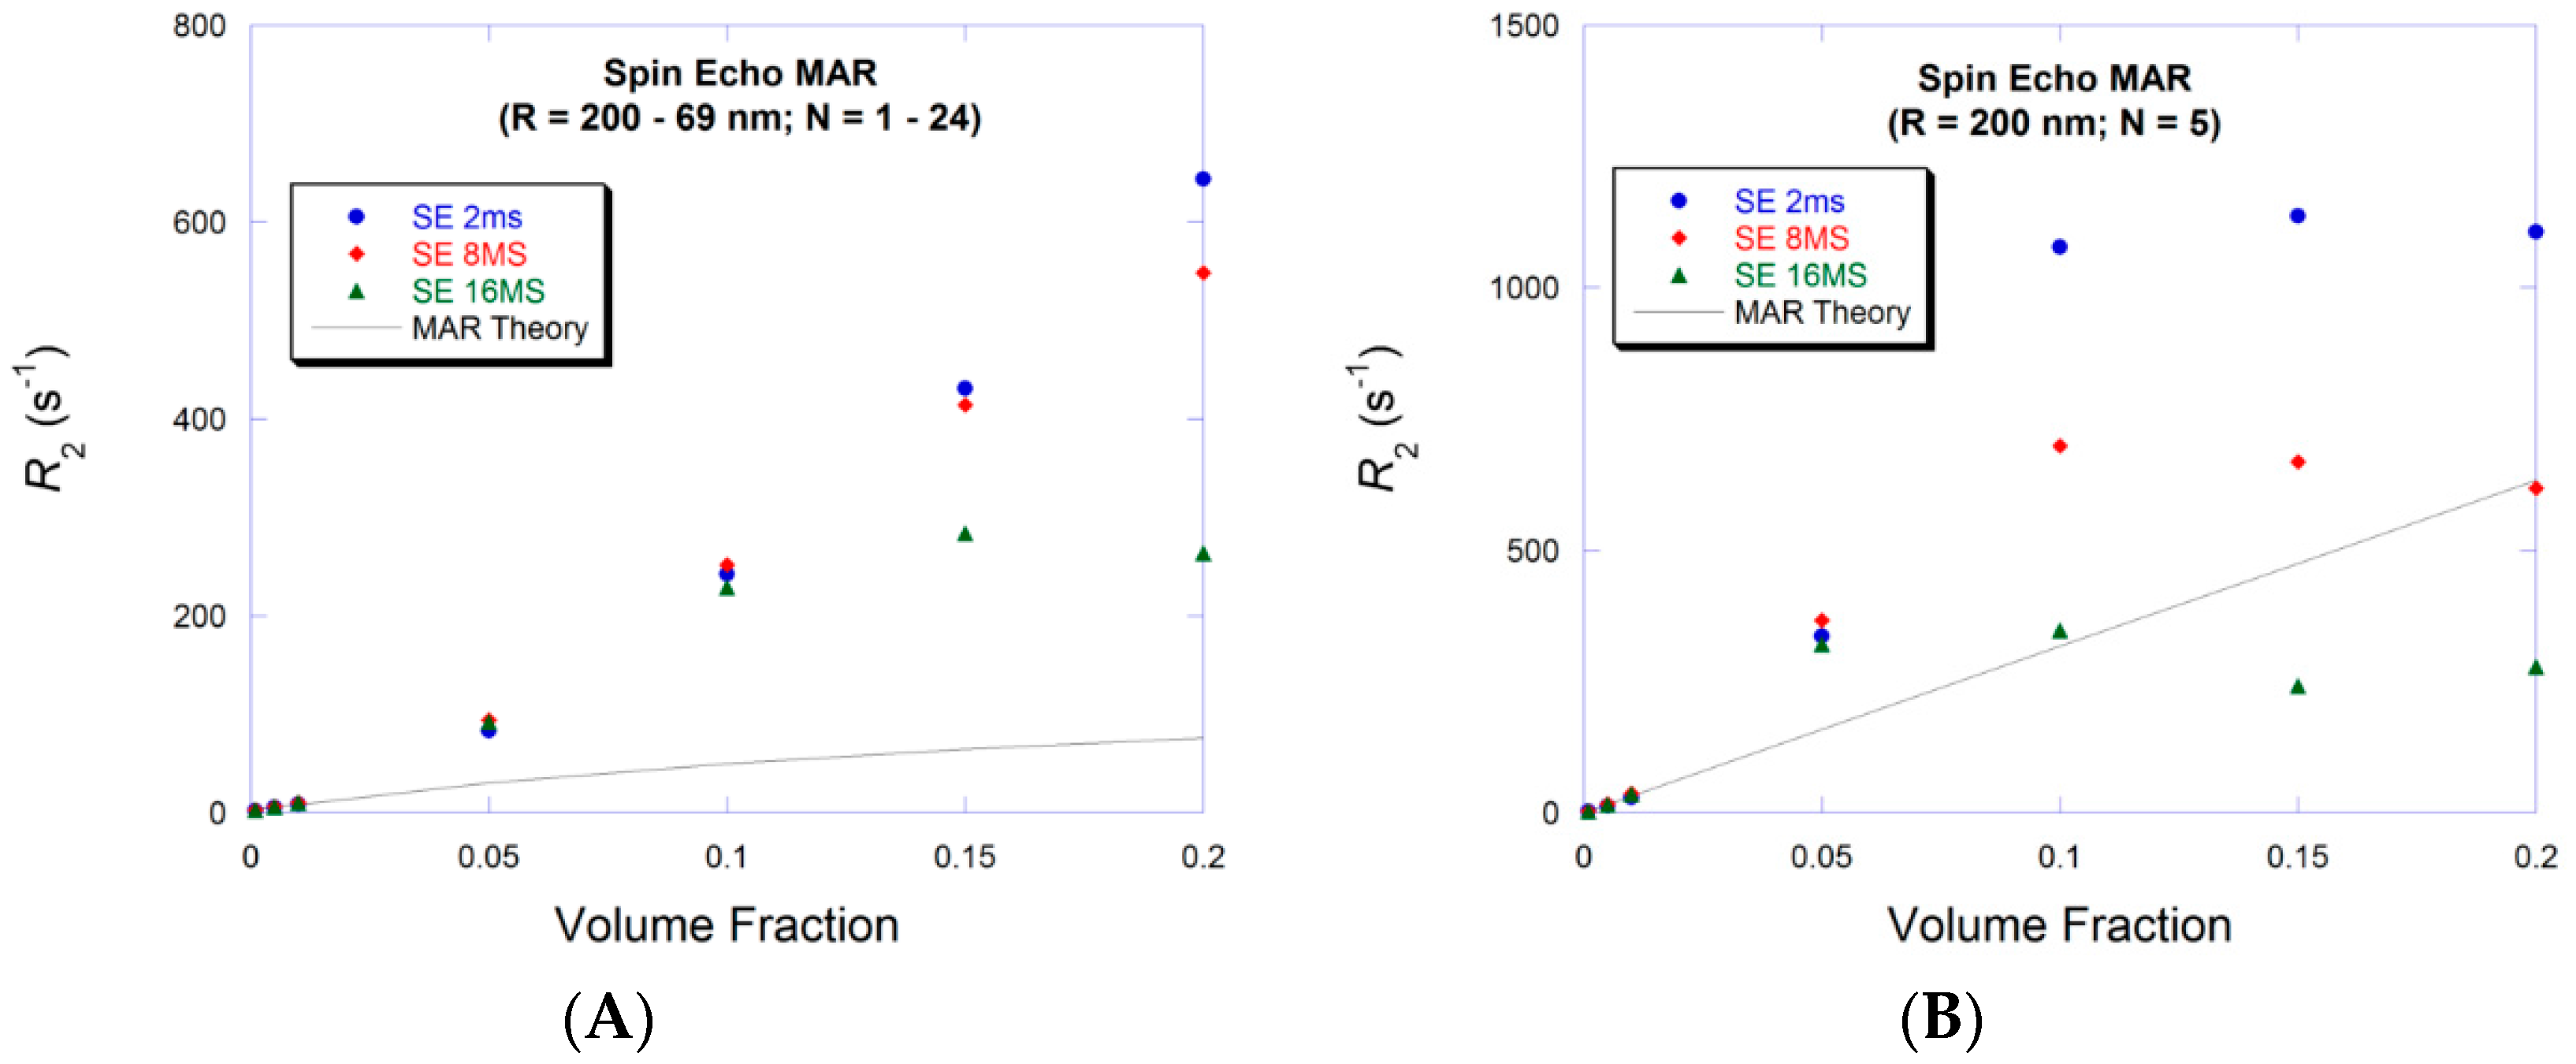
For the higher volume fraction range (f: 0.001–0.20) Figure 6 confirms the expected failure of the theory to correctly predict R2* values for both particle size and number arrangements. Echo-time dependence is clearly evident for the fixed size large particles (Figure 6B) with R2* reaching peak value at smaller volume fractions for the larger echo-times before continuing to decrease again. Reaching the peak value for the smaller particles (Figure 6A) appears at larger volume fraction and only for largest echo-time. R2 values are similar to R2* for the variable size (Figure 7A vs. Figure 6A) and for the fixed size (Figure 7B vs. Figure 6B). MAR theory underestimates R2* and R2 simulated values.
The data points represent averages of four measurements. Error bars representing the standard deviation were too small to show on the figures. For example, at volume fraction value 0.1, the standard deviation values were for the second particle arrangement (in ms−1), respectively (i.e., Figure 5B and Figure 6B), 3.9, 7.2 for TE = 2 ms; 75.0, 31.4 for TE = 8 ms; and 13.0, 25.0 for TE = 16 ms.
3.4. Large Volume Fraction—SDR
Particle size arrangement has no effect on R2* for SDR as shown in Figure 8A,B. For both arrangements, reaching peak values are similar to those shown for the MAR fixed size particle arrangement shown in Figure 6B and Figure 7B, followed by a very small reduction in relaxation rates. It is noticeable that R2* values are similar for both radii 200 nm (Figure 6B) and 1600 nm (Figure 8B). SDR R2 theory overestimates R2 simulated values. R2 values (Figure 9) show no dependence on particle size arrangement and faster decay after reaching their peak values.
4. Discussion
The failure of available theory to predict R2 and R2* values for large particle volume fraction (Figure 6, Figure 7, Figure 8 and Figure 9) is not surprising since their derivation relied on the assumption of low particle volume fraction (See e.g., [23] or [26]). For low particle volume fraction, the magnetization of each particle (and hence its magnetic field) was assumed to be independent of the magnetic field of other particles i.e., only depends on through . This assumption is of course violated for the large particle volume fraction when the inter-particle spacing becomes very small and hence the magnetization of the particle becomes affected by the magnetic field of the adjacent particles. This situation is more relevant for smaller applied field (B0—i.e., the when the magnetic moment of the MNP has not reached saturation) and for large susceptibility (). The second important factor influencing relaxation is the fact that increasing the particle volume fraction causes saturation of the magnetic field gradients. For low and high particle volume fraction within MAR the particle size arrangement is important since particles are still small and hence their overlapping magnetic fields are not fully saturated, while it is not for the large particles within SDR. For the second particle arrangement where particles are few and large (MAR—Figure 6B and Figure 7B) the efficiency of averaging the magnetic fields improves with echo-time. Furthermore, increasing the volume fraction of particles seems to reduce R2* (Figure 6B) and have smaller reduction on R2 for the same echo-time (Figure 7B). This may suggest that the distribution of the magnetic field gradient values has reached the saturation level. This point needs further investigation since there are now two competing factors: the efficiency of diffusion to average outfield inhomogeneities and field gradient distribution width. Similar analysis applies for R2* SDR data shown in Figure 8B, however, R2* values are almost double those of MAR data.
For the R2 and R2* SDR data (Figure 8 and Figure 9) particle size arrangement is irrelevant since particle size is already large and the extent of its associated magnetic field is large for all sizes included in the range of 1040–3000 nm. The R2* values (Figure 8A,B) show similar dependence on the echo-time as that for the fixed size MAR particles (Figure 6B) reaching saturation (for the two larger echo-times) at a smaller volume fraction value ~0.05 compared to ~0.1. Relaxation rates seem to reach the same values for echo-times greater than 8 ms.
5. Conclusions
This work examines quantifying transverse relaxation rates at high volume fraction of magnetic particles and the inadequacy of current theoretical models developed under conditions of small volume fractions. For both ranges of volume fraction, it is shown that within MAR, particle arrangement (i.e., size and number) is important and that fewer and larger particles produce larger relaxation rates. This is not the case for larger particles within SDR. Available theoretical models underestimate relaxation rates within MAR while they overestimate them within SDR. Finally echo-time becomes significant for both regimes at large volume fractions suggesting that diffusion is more efficient in averaging field inhomogeneities for the larger echo-times. Therefore, increasing the particle volume fraction seems to have caused saturation of the magnetic field gradient distribution. This study emphasizes the need to modify the existing models.
Acknowledgments
United Arab Emirates University, Research Affairs, Grants UPAR 31S157 and UPAR 31S246.
Conflicts of Interest
The author declares no conflict of interest.
References
- Issa, B.; Obaidat, I.M.; Albiss, B.A.; Haik, Y. Magnetic nanoparticles: Surface effects and properties related to biomedicine applications. Int. J. Mol. Sci. 2013, 14, 21266–21305. [Google Scholar] [CrossRef] [PubMed]
- Laurent, S.; Forge, D.; Port, M.; Roch, A.; Robic, C.; Vander Elst, L.; Muller, R.N. Magnetic iron oxide nanoparticles: Synthesis, stabilization, vectorization, physicochemical characterizations, and biological applications. Chem. Rev. 2008, 108, 2064–2110. [Google Scholar] [CrossRef] [PubMed]
- Roch, A.; Muller, R.N.; Gillis, P. Theory of proton relaxation induced by superparamagnetic particles. J. Chem. Phys. 1999, 110, 5403–5411. [Google Scholar] [CrossRef]
- Poperechny, I.S.; Raikher, Y.L.; Stepanov, V.I. Ferromagnetic resonance in a dilute suspension of uniaxial superparamagnetic particles. J. Magn. Magn. Mater. 2017, 424, 185–188. [Google Scholar] [CrossRef]
- Villaraza, A.J.L.; Bumb, A.; Brechbiel, M.W. Macromolecules, dendrimers, and nanomaterials in magnetic resonance imaging: The interplay between size, function, and pharmacokinetics. Chem. Rev. 2010, 110, 2921–2959. [Google Scholar] [CrossRef] [PubMed]
- Saritas, E.U.; Goodwill, P.W.; Croft, L.R.; Konkle, J.J.; Lu, K.; Zheng, B.; Conolly, S.M. Magnetic particle imaging (MPI) for NMR and MRI researchers. J. Magn. Reson. 2013, 229, 116–126. [Google Scholar] [CrossRef] [PubMed]
- Kateb, B.; Chiu, K.; Black, K.L.; Yamamoto, V.; Khalsa, B.; Ljubimova, J.Y.; Ding, H.; Patil, R.; Portilla-Arias, J.A.; Modo, M.; et al. Nanoplatforms for constructing new approaches to cancer treatment, imaging, and drug delivery: What should be the policy? NeuroImage 2011, 54, S106–S124. [Google Scholar] [CrossRef] [PubMed]
- Branquinho, L.C.; Carrião, M.S.; Costa, A.S.; Zufelato, N.; Sousa, M.H.; Miotto, R.; Ivkov, R.; Bakuzis, A.F. Effect of magnetic dipolar interactions on nanoparticle heating efficiency: Implications for cancer hyperthermia. Sci. Rep. 2013, 3, 2887. [Google Scholar] [CrossRef] [PubMed]
- Obaidat, I.; Issa, B.; Haik, Y. Magnetic Properties of Magnetic Nanoparticles for Efficient Hyperthermia. Nanomaterials 2015, 5, 63–89. [Google Scholar] [CrossRef] [PubMed]
- Chen, X.; Klingeler, R.; Kath, M.; El Gendy, A.A.; Cendrowski, K.; Kalenczuk, R.J.; Borowiak-Palen, E. Magnetic silica nanotubes: Synthesis, drug release, and feasibility for magnetic hyperthermia. ACS Appl. Mater. Interfaces 2012, 4, 2303–2309. [Google Scholar] [CrossRef] [PubMed]
- Issa, B.; Obaidat, I.M.; Hejasee, R.H.; Qadri, S.; Haik, Y. NMR relaxation in systems with magnetic nanoparticles: A temperature study. J. Magn. Reson. Imaging 2014, 39, 648–655. [Google Scholar] [CrossRef] [PubMed]
- Korchinski, D.J.; Taha, M.; Yang, R.; Nathoo, N.; Dunn, J.F. Iron Oxide as an MRI Contrast Agent for Cell Tracking. Magn. Reson. Insights 2015, 8, 15–29. [Google Scholar] [CrossRef] [PubMed]
- Yang, J.-X.; Tang, W.-L.; Wang, X.-X. Superparamagnetic iron oxide nanoparticles may affect endothelial progenitor cell migration ability and adhesion capacity. Cytotherapy 2010, 12, 251–259. [Google Scholar] [CrossRef] [PubMed]
- Kurlyandskaya, G.V.; Novoselova, I.P.; Schupletsova, V.V.; Andrade, R.; Dunec, N.A.; Litvinova, L.S.; Safronov, A.P.; Yurova, K.A.; Kulesh, N.A.; Dzyuman, A.N.; et al. Nanoparticles for magnetic biosensing systems. J. Magn. Magn. Mater. 2017, 431, 249–254. [Google Scholar] [CrossRef]
- García-Arribas, A.; Martínez, F.; Fernández, E.; Ozaeta, I.; Kurlyandskaya, G.V.; Svalov, A.V.; Berganzo, J.; Barandiaran, J.M. GMI detection of magnetic-particle concentration in continuous flow. Sens. Actuators A Phys. 2011, 172, 103–108. [Google Scholar] [CrossRef]
- Blyakhman, F.A.; Safronov, A.P.; Zubarev, A.Y.; Shklyar, T.F.; Makeyev, O.G.; Makarova, E.B.; Melekhin, V.V.; Larrañaga, A.; Kurlyandskaya, G.V. Polyacrylamide ferrogels with embedded maghemite nanoparticles for biomedical engineering. Results Phys. 2017, 7, 3624–3633. [Google Scholar] [CrossRef]
- Van Rijt, S.; Habibovic, P. Enhancing regenerative approaches with nanoparticles. J. R. Soc. Interface 2017, 14. [Google Scholar] [CrossRef] [PubMed]
- Corti, M.; Lascialfari, A.; Micotti, E.; Castellano, A.; Donativi, M.; Quarta, A.; Cozzoli, P.D.; Manna, L.; Pellegrino, T.; Sangregorio, C. Magnetic properties of novel superparamagnetic MRI contrast agents based on colloidal nanocrystals. J. Magn. Magn. Mater. 2008, 320, e320–e323. [Google Scholar] [CrossRef]
- Szpak, A.; Fiejdasz, S.; Prendota, W.; Strączek, T.; Kapusta, C.; Szmyd, J.; Nowakowska, M.; Zapotoczny, S. T1-T2 Dual-modal MRI contrast agents based on superparamagnetic iron oxide nanoparticles with surface attached gadolinium complexes. J. Nanopart. Res. 2014, 16, 1–11. [Google Scholar] [CrossRef] [PubMed]
- Waters, E.A.; Wickline, S. A Contrast agents for MRI. Basic Res. Cardiol. 2008, 103, 114–121. [Google Scholar] [CrossRef] [PubMed]
- Carroll, M.R.J.; Woodward, R.C.; House, M.J.; Teoh, W.Y.; Amal, R.; Hanley, T.L.; St Pierre, T.G. Experimental validation of proton transverse relaxivity models for superparamagnetic nanoparticle MRI contrast agents. Nanotechnology 2010, 21, 35103. [Google Scholar] [CrossRef] [PubMed]
- Weisskoff, R.M.; Zuo, C.S.; Boxerman, J.L.; Rosen, B.R. Microscopic Susceptibility Variation and Transverse Relaxation: Theory and Experiment. Magn. Reson. Med. 1994, 31, 601–610. [Google Scholar] [CrossRef] [PubMed]
- Yablonskiy, D.A.; Haacke, E.M. Theory of NMR Signal Behavior in Magnetic ally Inhomogeneous Tissues: The Static Dephasing Regime. Magn. Reson. Med. 1994, 32, 749–763. [Google Scholar] [CrossRef] [PubMed]
- Ayant, Y.; Belorizky, E.; Alizon, J.; Gallice, J. Calcul Des Densités Spectrales Résultant D’un Mouvement Aléatoire De Translation En Relaxation Par Interaction Dipolaire Magnétique Dans Les Liquides. J. Phys. (Paris) 1975, 36, 991–1004. [Google Scholar] [CrossRef]
- Brooks, R.A.; Moiny, F.; Gillis, P. On T2-Shortening by Weakly Magnetized Particles: The Chemical Exchange Model. Magn. Reson. Med. 2001, 1020, 1014–1020. [Google Scholar] [CrossRef] [PubMed]
- Jensen, J.H.; Chandra, R. NMR relaxation in tissues with weak magnetic inhomogeneities. Magn. Reson. Med. 2000, 44, 144–156. [Google Scholar] [CrossRef]
- Brown, R.J.S. Distribution of fields from randomly placed dipoles: Freeprecession signal decay as result of magnetic grains. Phys. Rev. 1961, 121, 1379–1382. [Google Scholar] [CrossRef]
- Heyn, C.; Bowen, C.V.; Rutt, B.K.; Foster, P.J. Detection threshold of single SPIO-labeled cells with FIESTA. Magn. Reson. Med. 2005, 53, 312–320. [Google Scholar] [CrossRef] [PubMed]
- Hak, S.; Goa, P.E.; Stenmark, S.; Bjerkholt, F.F.; Haraldseth, O. Transverse relaxivity of iron oxide nanocrystals clustered in nanoemulsions: Experiment and theory. Med. Reson. Med. 2014, 74, 858–867. [Google Scholar] [CrossRef] [PubMed]
- Hartung, A.; Lisy, M.R.; Herrmann, K.-H.; Hilger, I.; Schüler, D.; Lang, C.; Bellemann, M.E.; Kaiser, W.A.; Reichenbach, J.R. Labeling of macrophages using bacterial magnetosomes and their characterization by magnetic resonance imaging. J. Magn. Magn. Mater. 2007, 311, 454–459. [Google Scholar] [CrossRef]
- Zhang, J.; Chamberlain, R.; Etheridge, M.; Idiyatullin, D.; Corum, C.; Bischof, J.; Garwood, M. Quantifying iron-oxide nanoparticles at high concentration based on longitudinal relaxation using a three-dimensional SWIFT look-locker sequence. Magn. Reson. Med. 2014, 71, 1982–1988. [Google Scholar] [CrossRef] [PubMed]
- Brooks, R.A. T2-shortening by strongly magnetized spheres: A chemical exchange model. Magn. Reson. Med. 2002, 47, 388–391. [Google Scholar] [CrossRef] [PubMed]
- Gillis, P.; Moiny, F.; Brooks, R. A On T2-shortening by strongly magnetized spheres: A partial refocusing model. Magn. Reson. Med. 2002, 47, 257–263. [Google Scholar] [CrossRef] [PubMed]
- Chen, D.X.; Sun, N.; Huang, Z.J.; Cheng, C.M.; Xu, H.; Gu, H.C. Experimental study on T2 relaxation time of protons in water suspensions of iron-oxide nanoparticles: Effects of polymer coating thickness and over-low 1/T2. J. Magn. Magn. Mater. 2010, 322, 548–556. [Google Scholar] [CrossRef]
- Matsumoto, Y.; Jasanoff, A. T2 relaxation induced by clusters of superparamagnetic nanoparticles: Monte Carlo simulations. Magn. Reson. Imaging 2008, 26, 994–998. [Google Scholar] [CrossRef] [PubMed]
- Boxerman, J.L.; Hamberg, L.M.; Rosen, B.R.; Weisskoff, R.M. Mr contrast due to intravascular magnetic susceptibility perturbations. Magn. Reson. Med. 1995, 34, 555–566. [Google Scholar] [CrossRef] [PubMed]
Figure 1.
R2 and R2* values are plotted vs. the diffusion correlation coefficient () for three different echo-times = 0.02, 0.05, and 2.0 ms. The agreement of Monte Carlo (MC) values with the asymptotic models in the two limiting regimes is evident for all three echo-times. The echo-limited regime (ELR) dependence on echo-time is also shown (circles) for large particle radii ( > 5 × 10⁻⁴ s).

Figure 2.
R2* values are plotted vs. particle volume fraction for particles within motional averaged (MAR). (A) The particle size is increased while the radius is decreased to achieve increasing volume fraction; (B) The particle size and radius are kept constant while the sample space is decreased to achieve increasing volume fraction. Relaxation is more efficient for few large particles (B) than for many small particles (A).

Figure 3.
R2 values are plotted vs. particle volume fraction for particles within MAR. (A) The particle size is increased while the radius is decreased to achieve increasing volume fraction; (B) The particle size and radius are kept constant while the sample space is decreased to achieve increasing volume fraction. R2 is also equal to R2* shown in Figure 2.
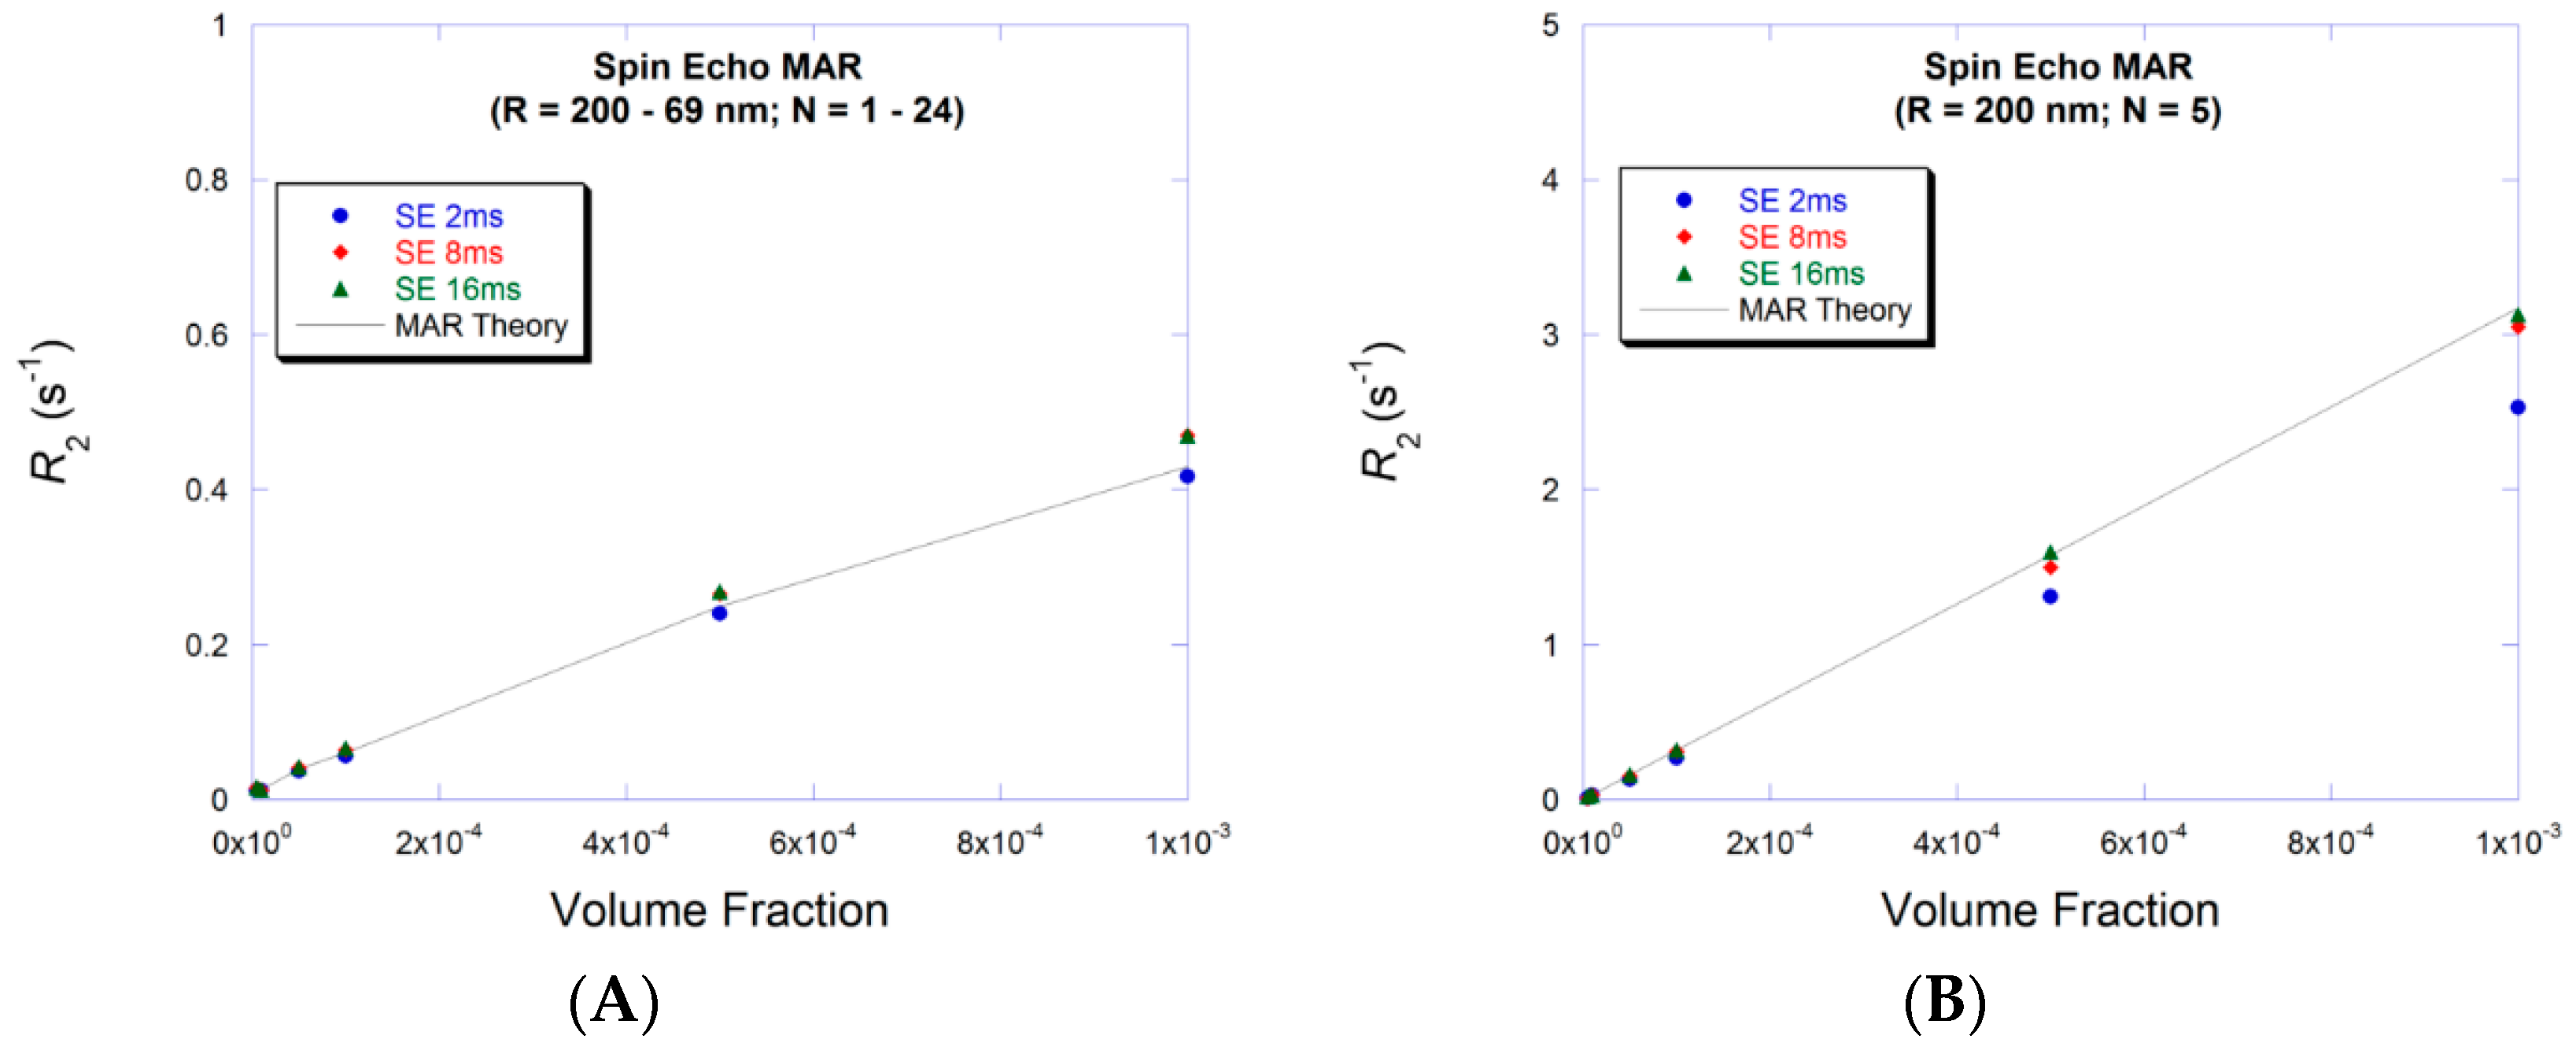
Figure 4.
R2* values are plotted vs. particle volume fraction for particles within MAR. (A) The particle size is increased while the radius is decreased to achieve increasing volume fraction; (B) The particle size and radius are kept constant while the sample space is decreased to achieve increasing volume fraction. Static dephasing (SDR) theory manages to correctly predict R2* for low particle volume fraction. Data is echo-time independent.

Figure 5.
R2 values are plotted vs. particle volume fraction for particles within MAR. (A) The particle size is increased while the radius is decreased to achieve increasing volume fraction; (B) The particle size and radius are kept constant while the sample space is decreased to achieve increasing volume fraction. ELR theory is shown for the echo-time (8 ms—red full circle) since data is now echo-time dependent.

Figure 6.
R2* values are plotted vs. particle volume fraction for particles within MAR. (A) The particle size is increased while the radius is decreased to achieve increasing volume fraction; (B) The particle size and radius are kept constant while the sample space is decreased to achieve increasing volume fraction. Particle size arrangement is important at higher particle concentrations as demonstrated by the different R2* values between Figure 6A,B. Furthermore, longer echo-times produce more efficient averaging of field inhomogeneities. MAR theory underestimates R2* simulated values.

Figure 7.
R2 values are plotted vs. particle volume fraction for particles within MAR. (A) The particle size is increased while the radius is decreased to achieve increasing volume fraction. (B) The particle size and radius are kept constant while the sample space is decreased to achieve increasing volume fraction. R2 values approach R2* (Figure 6) for each particle size arrangement. MAR theory underestimates R2 simulated values.

Figure 8.
R2* values are plotted vs. particle volume fraction for particles within MAR. (A) The particle size is increased while the radius is decreased to achieve increasing volume fraction; (B) The particle size and radius are kept constant while the sample space is decreased to achieve increasing volume fraction. R2* values are flattened or saturated especially for the higher two echo-times values. SDR R2 theory overestimates R2 simulated values.
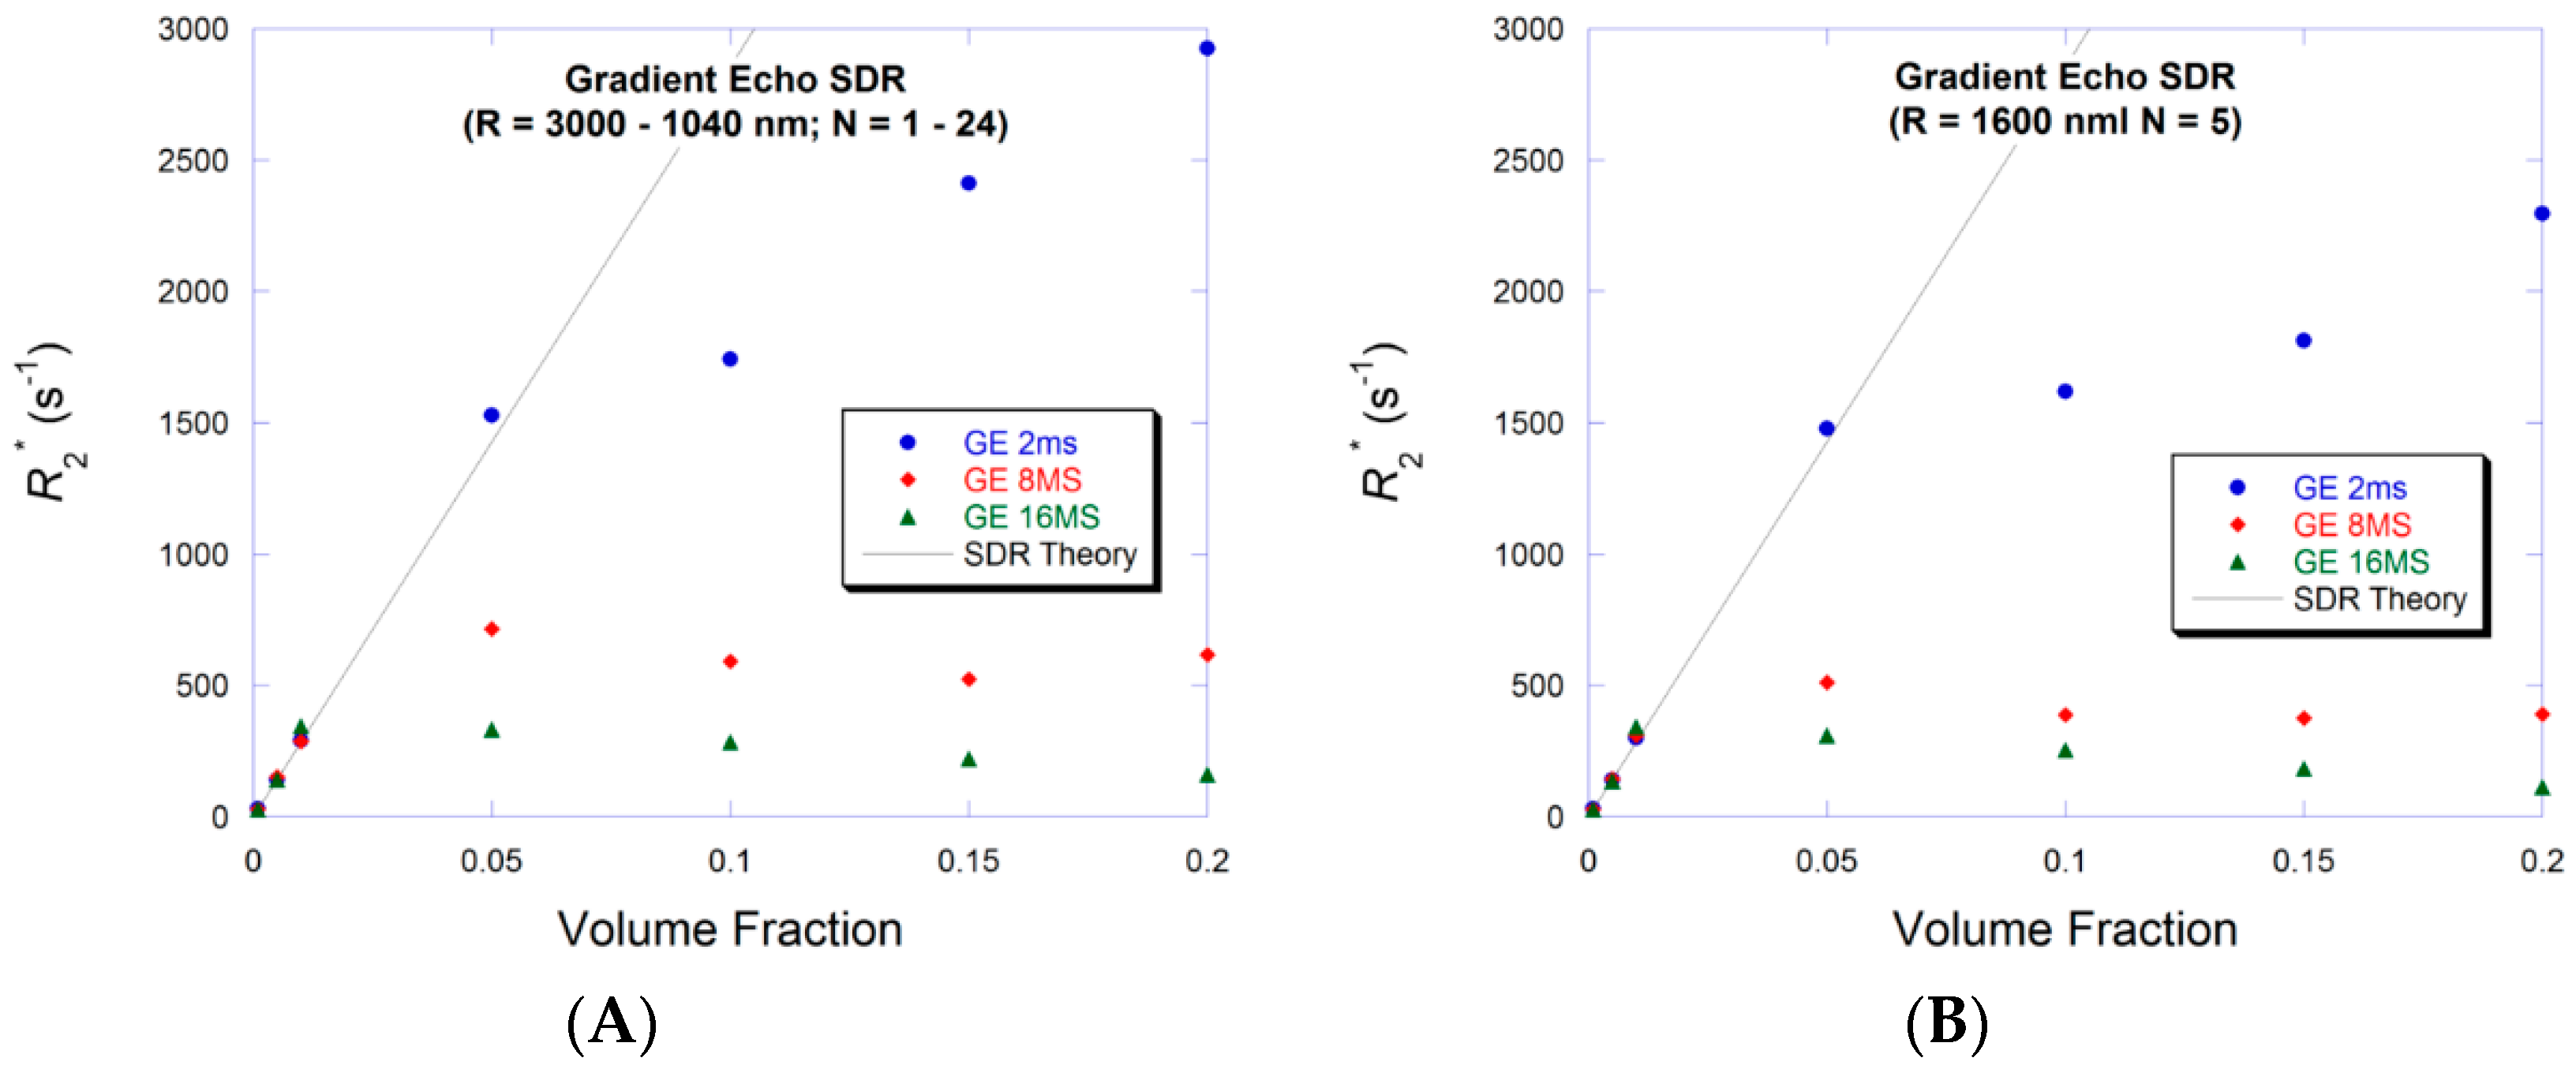
Figure 9.
R2 values are plotted vs. particle volume fraction for particles within MAR. (A) The particle size is increased while the radius is decreased to achieve increasing volume fraction; (B) The particle size and radius are kept constant while the sample space is decreased to achieve increasing volume fraction. ELR R2 theory overestimates R2 simulated values.

Table 1.
Number of particles and their radii along with sample space side (q) in the first three columns. Similar data is shown for fixed particle size arrangement in the last three columns. The center column contains the volume fraction values common to both arrangements.
Table 1.
Number of particles and their radii along with sample space side (q) in the first three columns. Similar data is shown for fixed particle size arrangement in the last three columns. The center column contains the volume fraction values common to both arrangements.
| Arrangement 1 | Volume Fraction | Arrangement 2 | ||||
|---|---|---|---|---|---|---|
| No. Particles | q (nm) | R (nm) | No. Particles | q (nm) | R (nm) | |
| 1 | 1.89 × 10⁻⁵ | 200 | 5.0 × 10⁻⁶ | 5 | 3.22 × 10⁻⁵ | 200 |
| 4 | 1.50 × 10⁻⁵ | 126 | 1.0 × 10⁻⁵ | 5 | 2.56 × 10⁻⁵ | 200 |
| 8 | 8.75 × 10⁻⁶ | 100 | 5.0 × 10⁻⁵ | 5 | 1.50 × 10⁻⁵ | 200 |
| 12 | 6.95 × 10⁻⁶ | 87.4 | 1.0 × 10⁻⁴ | 5 | 1.19 × 10⁻⁵ | 200 |
| 16 | 4.06 × 10⁻⁶ | 79.4 | 5.0 × 10⁻⁴ | 5 | 6.95 × 10⁻⁶ | 200 |
| 20 | 3.22 × 10⁻⁶ | 73.7 | 1.0 × 10⁻³ | 5 | 5.51 × 10⁻⁶ | 200 |
| 24 | 1.89 × 10⁻⁶ | 69.3 | 5.0 × 10⁻³ | 5 | 3.22 × 10⁻⁶ | 200 |
Table 2.
Number of particles and their radii along with sample space side (q) in the first three columns. Similar data is shown for fixed particle size arrangement in the last three columns. The center column contains the volume fraction values common to both arrangements.
Table 2.
Number of particles and their radii along with sample space side (q) in the first three columns. Similar data is shown for fixed particle size arrangement in the last three columns. The center column contains the volume fraction values common to both arrangements.
| Arrangement 1 | Volume Fraction | Arrangement 2 | ||||
|---|---|---|---|---|---|---|
| No. Particles | q (nm) | R (nm) | No. Particles | q (nm) | R (nm) | |
| 1 | 4.84 × 10⁻⁵ | 3000 | 5.0 × 10⁻⁶ | 5 | 3.31 × 10⁻⁵ | 1200 |
| 4 | 2.83 × 10⁻⁵ | 1890 | 1.0 × 10⁻⁵ | 5 | 1.93 × 10⁻⁵ | 1200 |
| 8 | 2.24 × 10⁻⁵ | 1500 | 5.0 × 10⁻⁵ | 5 | 1.54 × 10⁻⁵ | 1200 |
| 12 | 1.31 × 10⁻⁵ | 1310 | 1.0 × 10⁻⁴ | 5 | 8.98 × 10⁻⁶ | 1200 |
| 16 | 1.04 × 10⁻⁵ | 1190 | 5.0 × 10⁻⁴ | 5 | 7.13 × 10⁻⁶ | 1200 |
| 20 | 9.10 × 10⁻⁶ | 1110 | 1.0 × 10⁻³ | 5 | 6.23 × 10⁻⁶ | 1200 |
| 24 | 8.27 × 10⁻⁶ | 1040 | 5.0 × 10⁻³ | 5 | 5.66 × 10⁻⁶ | 1200 |
© 2018 by the author. Licensee MDPI, Basel, Switzerland. This article is an open access article distributed under the terms and conditions of the Creative Commons Attribution (CC BY) license (http://creativecommons.org/licenses/by/4.0/).
Share and Cite
MDPI and ACS Style
Issa, B. Reduction of T2 Relaxation Rates due to Large Volume Fractions of Magnetic Nanoparticles for All Motional Regimes. Appl. Sci. 2018, 8, 101. https://doi.org/10.3390/app8010101
AMA Style
Issa B. Reduction of T2 Relaxation Rates due to Large Volume Fractions of Magnetic Nanoparticles for All Motional Regimes. Applied Sciences. 2018; 8(1):101. https://doi.org/10.3390/app8010101
Chicago/Turabian StyleIssa, Bashar. 2018. "Reduction of T2 Relaxation Rates due to Large Volume Fractions of Magnetic Nanoparticles for All Motional Regimes" Applied Sciences 8, no. 1: 101. https://doi.org/10.3390/app8010101
Note that from the first issue of 2016, this journal uses article numbers instead of page numbers. See further details here.