Article

Methods of In-Process On-Machine Auto-Inspection of Dimensional Error and Auto-Compensation of Tool Wear for Precision Turning

1
Department of Mechanical Engineering, Chung Yuan Christian University, Taoyuan 32023, Taiwan
2
Mechanical and Systems Research Laboratories, Industrial Technology Research Institute, Hsinchu 31040, Taiwan
*
Author to whom correspondence should be addressed.
Appl. Sci. 2016, 6(4), 107; https://doi.org/10.3390/app6040107
Submission received: 1 February 2016 / Revised: 20 March 2016 / Accepted: 21 March 2016 / Published: 12 April 2016
(This article belongs to the Special Issue Design and Applications of Coordinate Measuring Machines)

Abstract

:
The purpose of this study is mainly to develop an information and communication technology (ICT)-based intelligent dimension inspection and tool wear compensation method for precision tuning. With the use of vibration signal processing/characteristics analysis technology combined with ICT, statistical analysis, and diagnosis algorithms, the method can be used to proceed with an on-line dimension inspection and on-machine tool wear auto-compensation for the turning process. Meanwhile, the method can also monitor critical tool life to identify the appropriate time for cutter replacement to reduce machining costs and improve the production efficiency of the turning process. Compared to the traditional ways, the method offers the advantages of requiring less manpower, and having better production efficiency, high tool life, fewer scrap parts, and low costs for inspection instruments. Algorithms and diagnosis threshold values for the detection, cutter wear compensation, and cutter life monitoring were developed. In addition, a bilateral communication module utilizing FANUC Open CNC (computer numerical control) Application Programming Interface (API) Spec was developed for the on-line extraction of instant NC (numerical control) codes for monitoring and transmit commands to CNC controllers for cutter wear compensation. With use of local area networks (LAN) to deliver the detection and correction information, the proposed method was able to remotely control the on-machine monitoring process and upload the machining and inspection data to a remote central platform for further production optimization. The verification experiments were conducted on a turning production line. The results showed that the system provided 93% correction for size inspection and 100% correction for cutter wear compensation.

Graphical Abstract

1. Introduction

Precision turning plays an important role in manufacturing industry. The products made by turning process include automotive components, aerospace parts, and precise industrial parts, etc. Turning accuracy is mainly influenced by the accuracy of the machine, the condition of the cutter, cutting parameters, and environmental conditions, such as external vibration, the environment temperature, etc. Since tool wear could cause more cutting resistance, machining vibration, machining temperature, and machining errors, it usually needs on-line monitoring of the status of tool wear and compensating of the tool wear via offsetting the tool position for the next machining process.
To receive a better performance from a machining process, Greg et al. carried out a series of research activities [1,2] on improving the multi-gene genetic programming approach. They proposed a modified multi-gene genetic programming (M-MGGP) method using a stepwise regression approach in which the lower-performance genes were eliminated and the high-performing genes were combined. Validation was carried out by applying surface roughness to modeling when turning hardened American Iron and Steel Institute (AISI) H11 steel, and the results showed that M-MGGP has better performance than that of standard MGGP and other methods. They also proposed a new complexity-based multi-gene genetic programming approach in which the functional relationships between the energy consumption and the input process parameters of a milling process were obtained to find an optimum set of input settings; this will conserve a greater amount of energy from these operations. To improve the generalization ability of MGGP, Greg et al. [3] developed a new ensemble-based MGGP framework that used statistical and classification strategies. The method was applied on the reliable experimental database in which the outputs were surface roughness, tool life and power consumption. With the use of an embedded approach to molecular dynamics and MGGP, Greg et al. [4] proposed a method to investigate the thermal property of single-layer graphene sheet. In this study, the response of thermal conductivity of the graphene sheet with changes in system temperature and Stone-Thrower-Wales (STW) defect concentration was analyzed. In addition, they [5] also used an explicit model formulated by a molecular dynamics-based computational intelligence approach and a paradigm of a computational intelligence (CI) cluster comprising genetic programming to study the nano-drilling process of boron nitride nanosheet panels.
Much research related to tool wear prediction and monitoring had been carried out in past years. Usui et al. [6] proposed a method of cutter wear prediction for certain cutting condition, and conducted verification cutting experiments. With the use of different sensor signals, Dimla et al. [7] proposed a monitoring method of cutter wear. Li et al. [8] proposed methods for cutter wear inspection and failure diagnosis, which could predict the influence of surface quality of the machined work piece caused by cutter wear. Choi et al. [9] developed an intelligent monitoring system which could provide on-line monitoring of the wear condition of the turning tool. Prickett et al. studied [10] the ways for monitoring the condition of end mills. With the use of the neural network method, Risbood et al. [11] proposed a way to predict the dimension errors caused by cutting force and radial cutting vibration. Panda et al. [12] used a back-propagation neural network (BPN) to predict the status of tool wear to avoid cutter breakage.
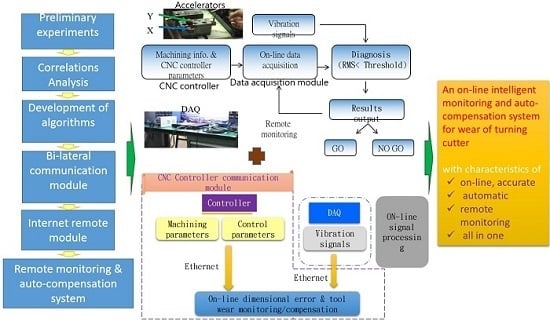
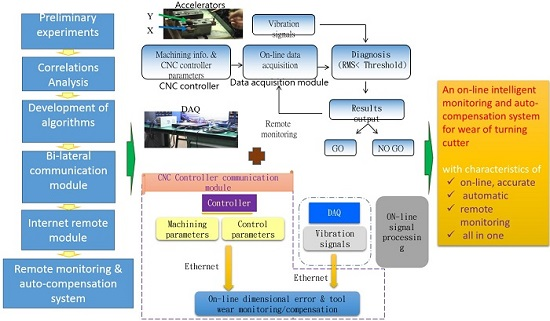
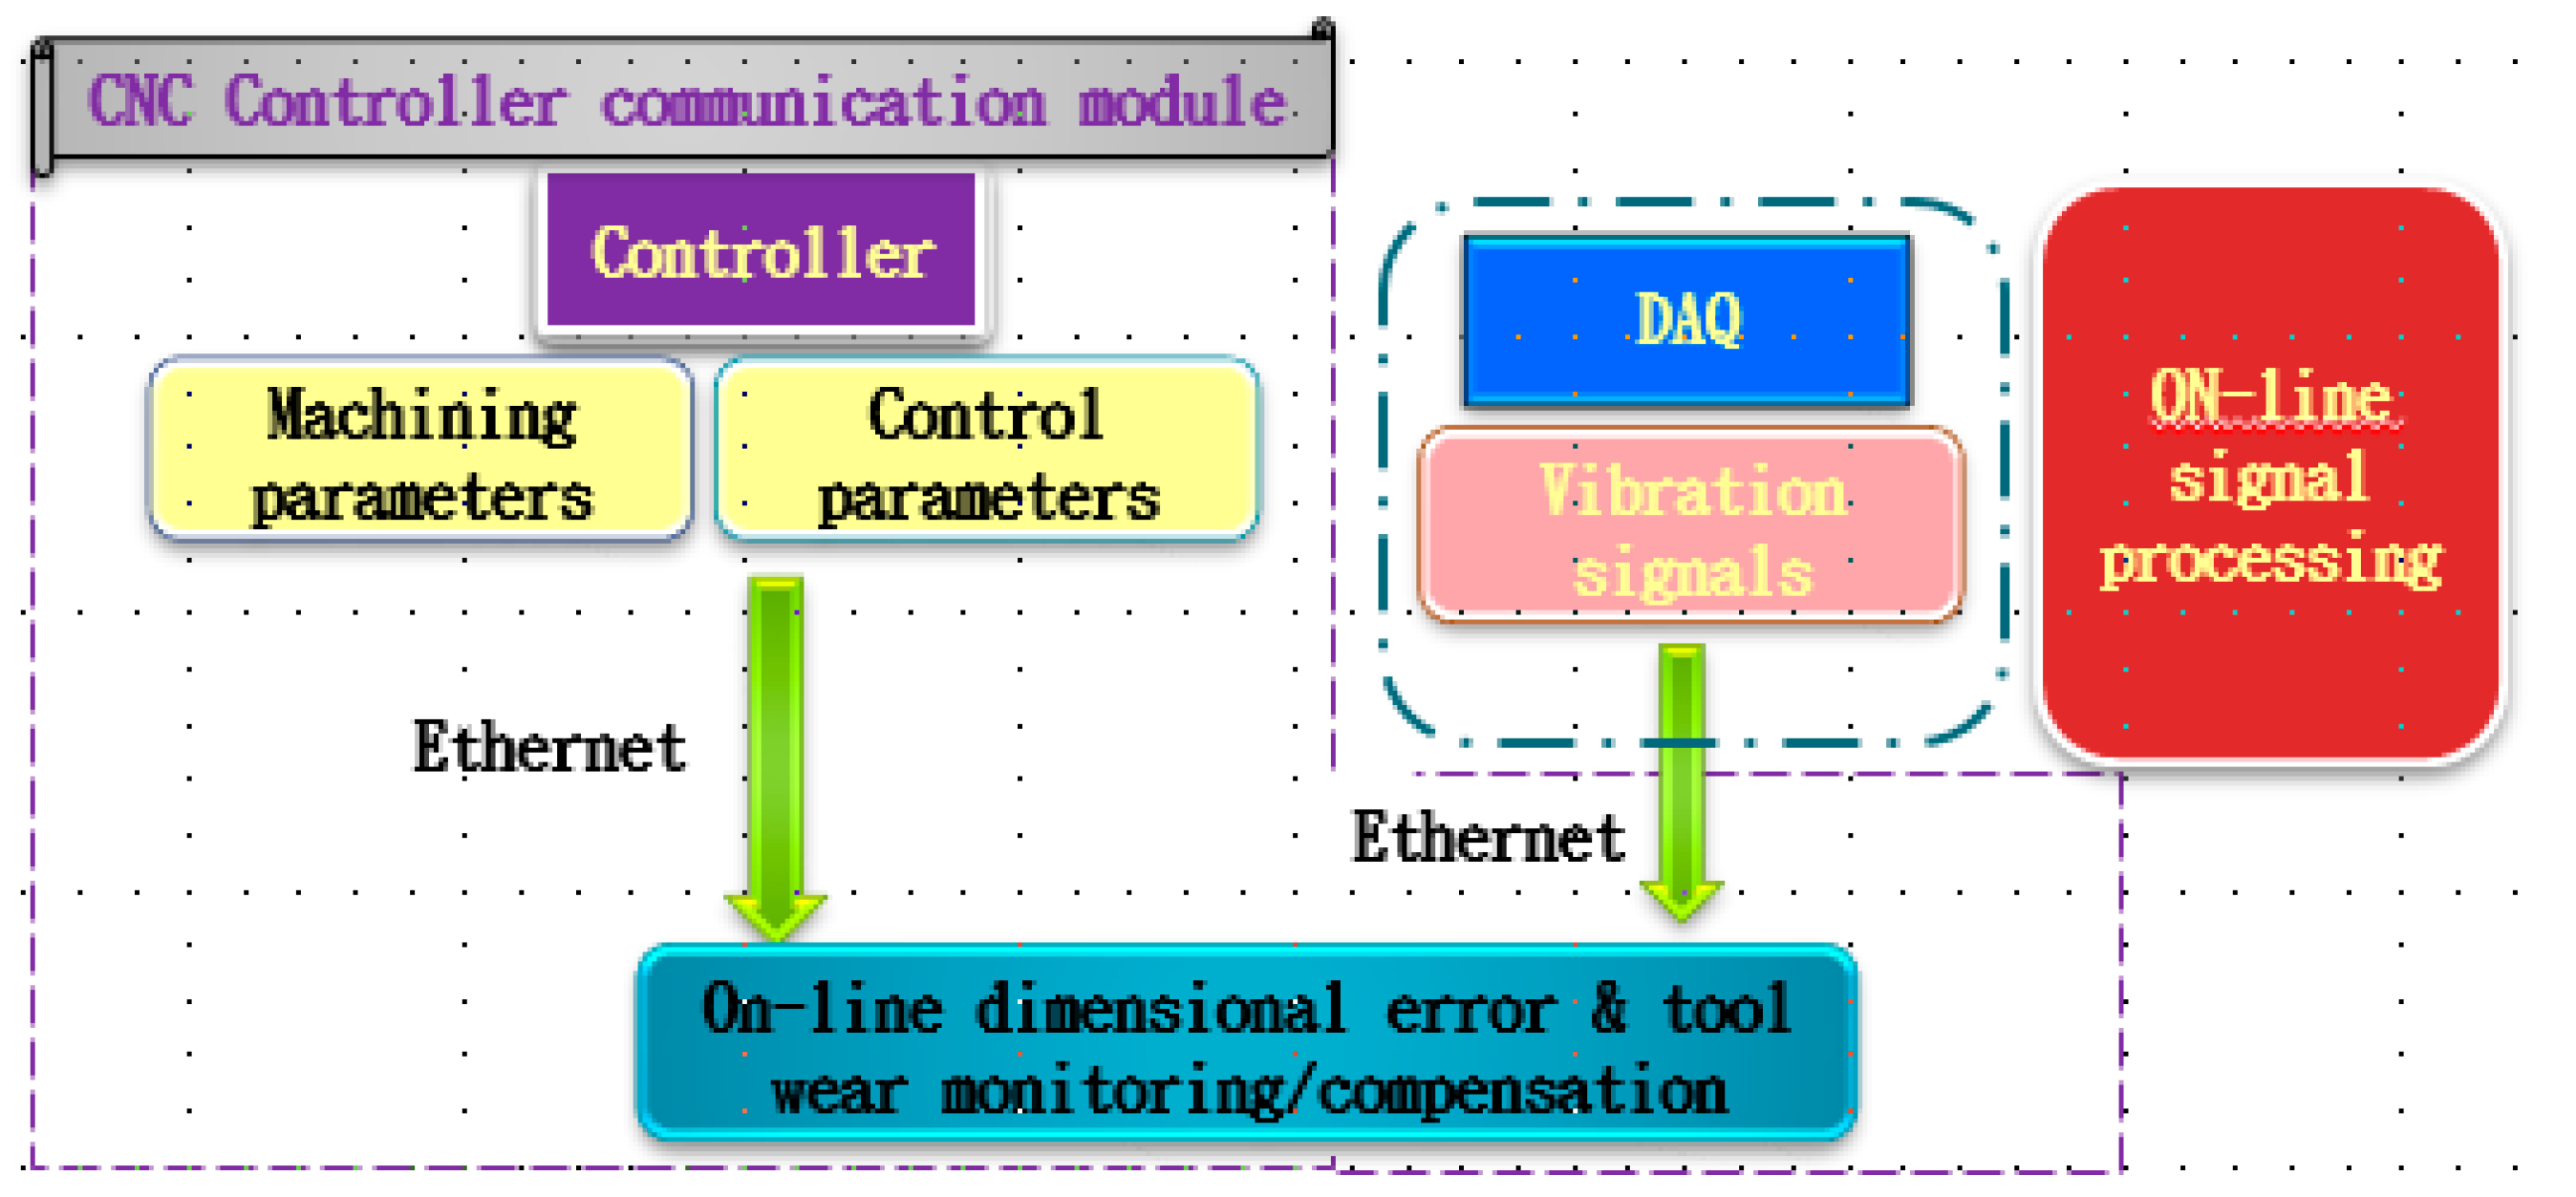
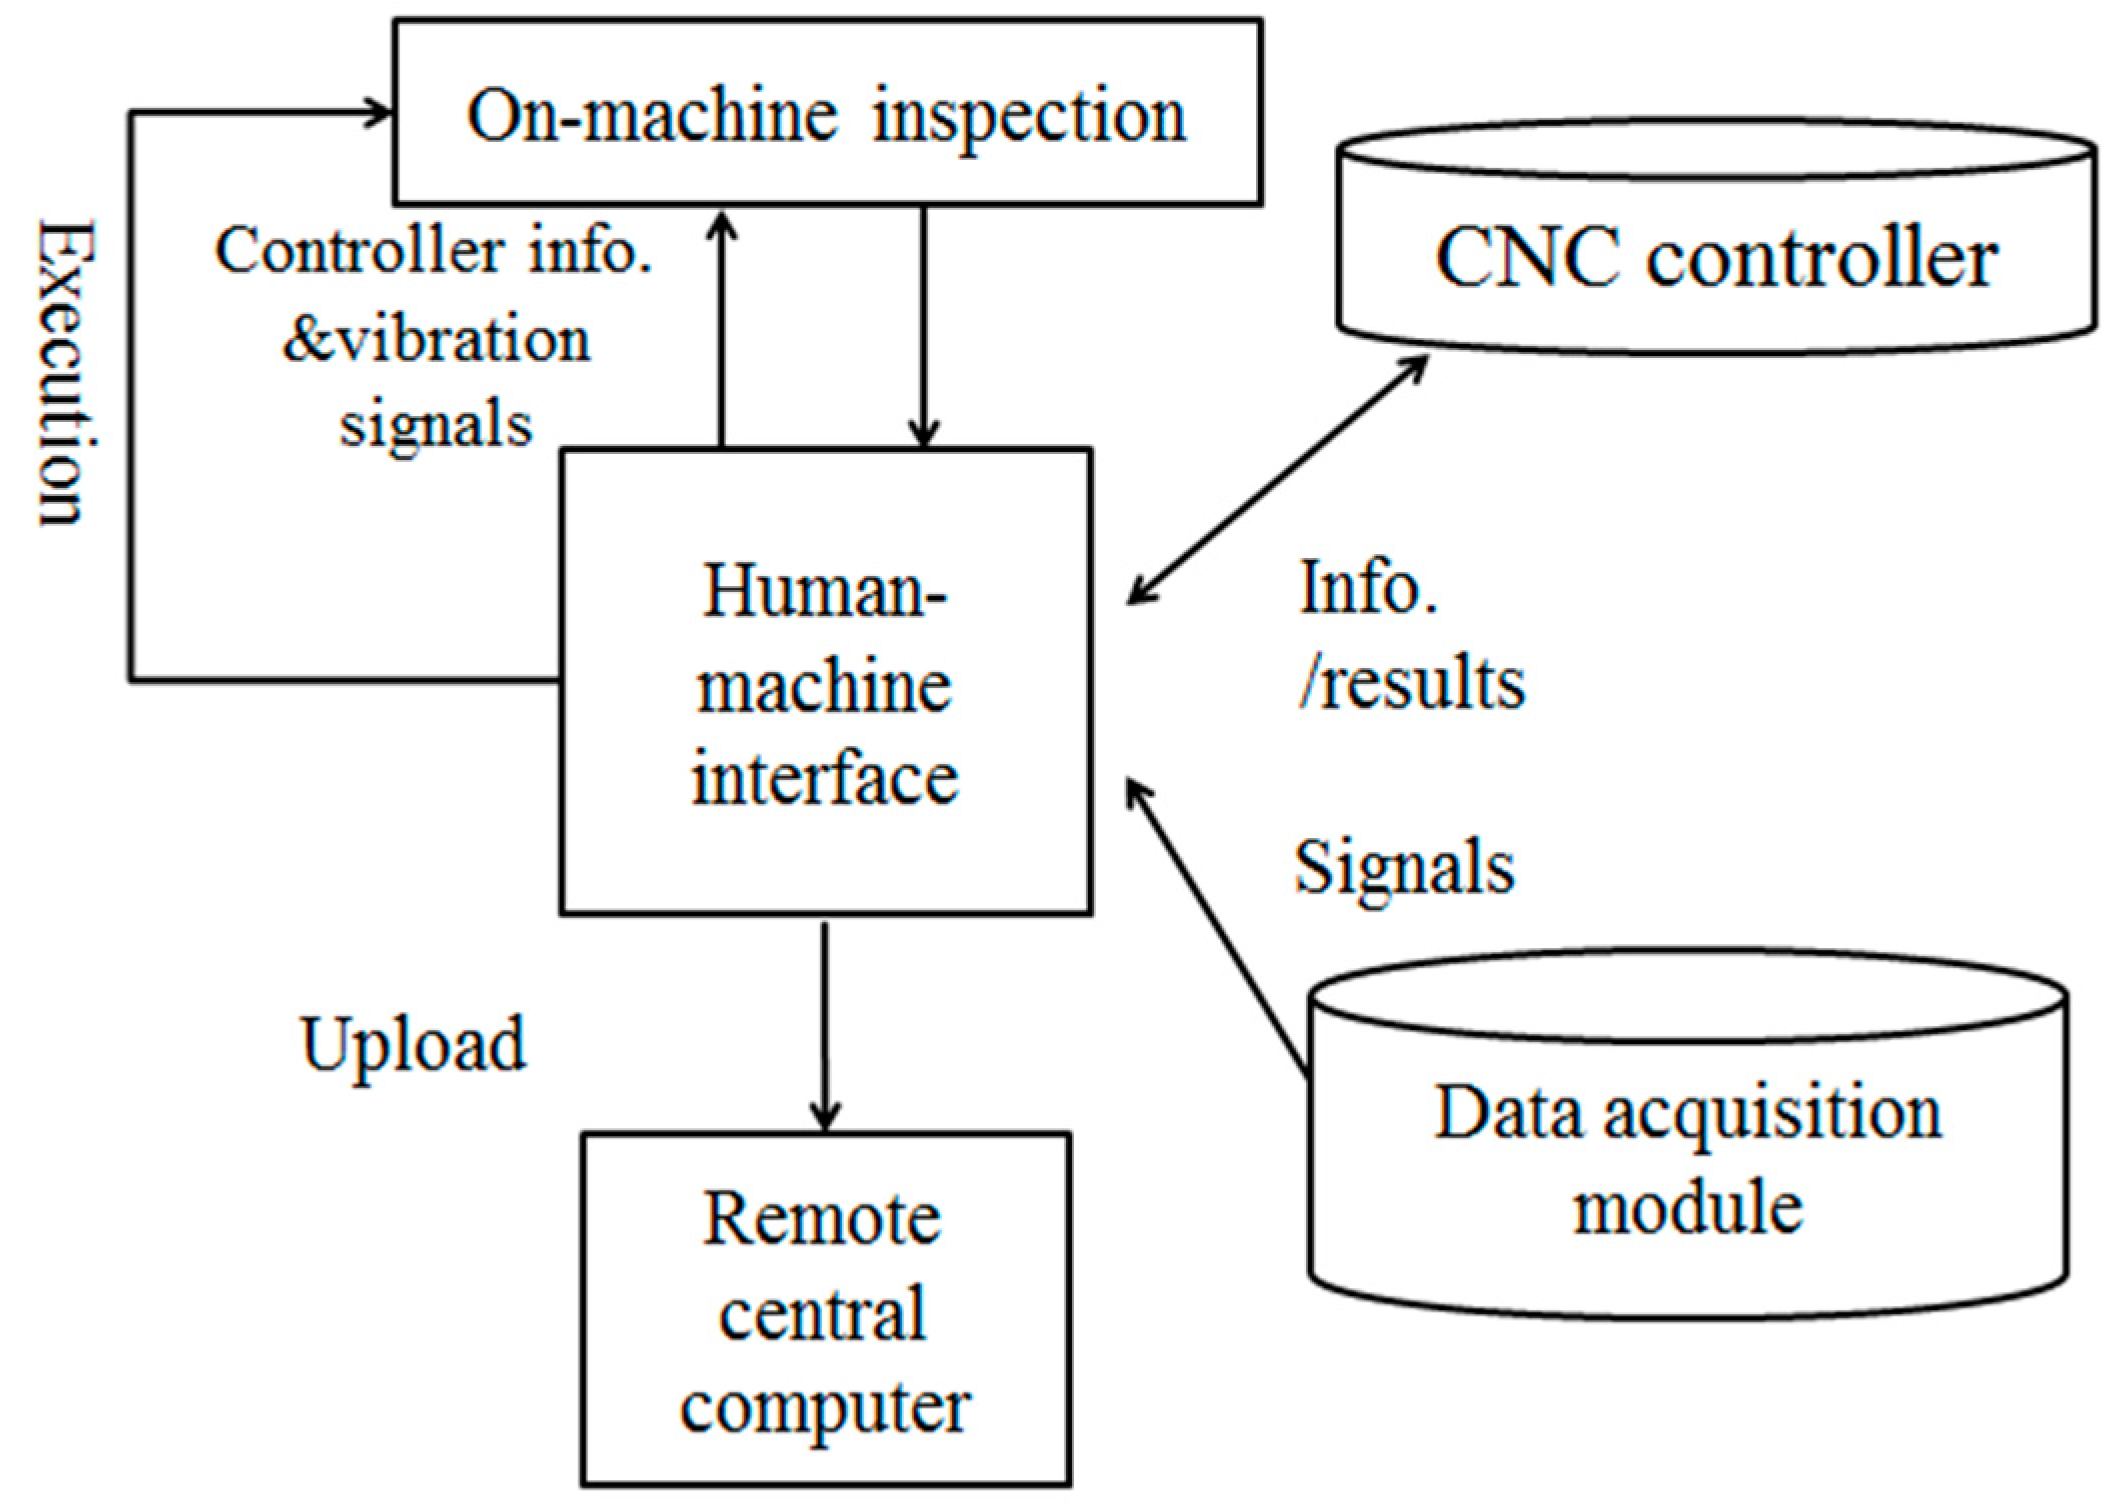
In order to meet the requirements of tight tolerance and high production yield rates for production, in-process tool wear monitoring and compensation and in-process quality inspection are usually developed and become a part of the manufacturing process. However, because those processes are off-machine or manual, they take more time and incur greater costs due to the additional measurement and inspection instruments and work hours. With the use of the on-line diagnosis method, information and communication technology (ICT), and the empirical statistics method, an on-line monitoring and auto-compensation system for the wear of the turning cutter was developed in this study. The system predicts the machining quality inspection and status of the cutter based on the analysis of on-line turning vibration and machining information while turning is operational. Subsequently, the predicted tool wear will be auto-compensated to the computer numerical control (CNC) controller for next turning work. The method was implemented on an automotive component production line, and both of the original off-machine quality inspection and the manually tool wear compensation were able to be eliminated and replaced by the proposed method.
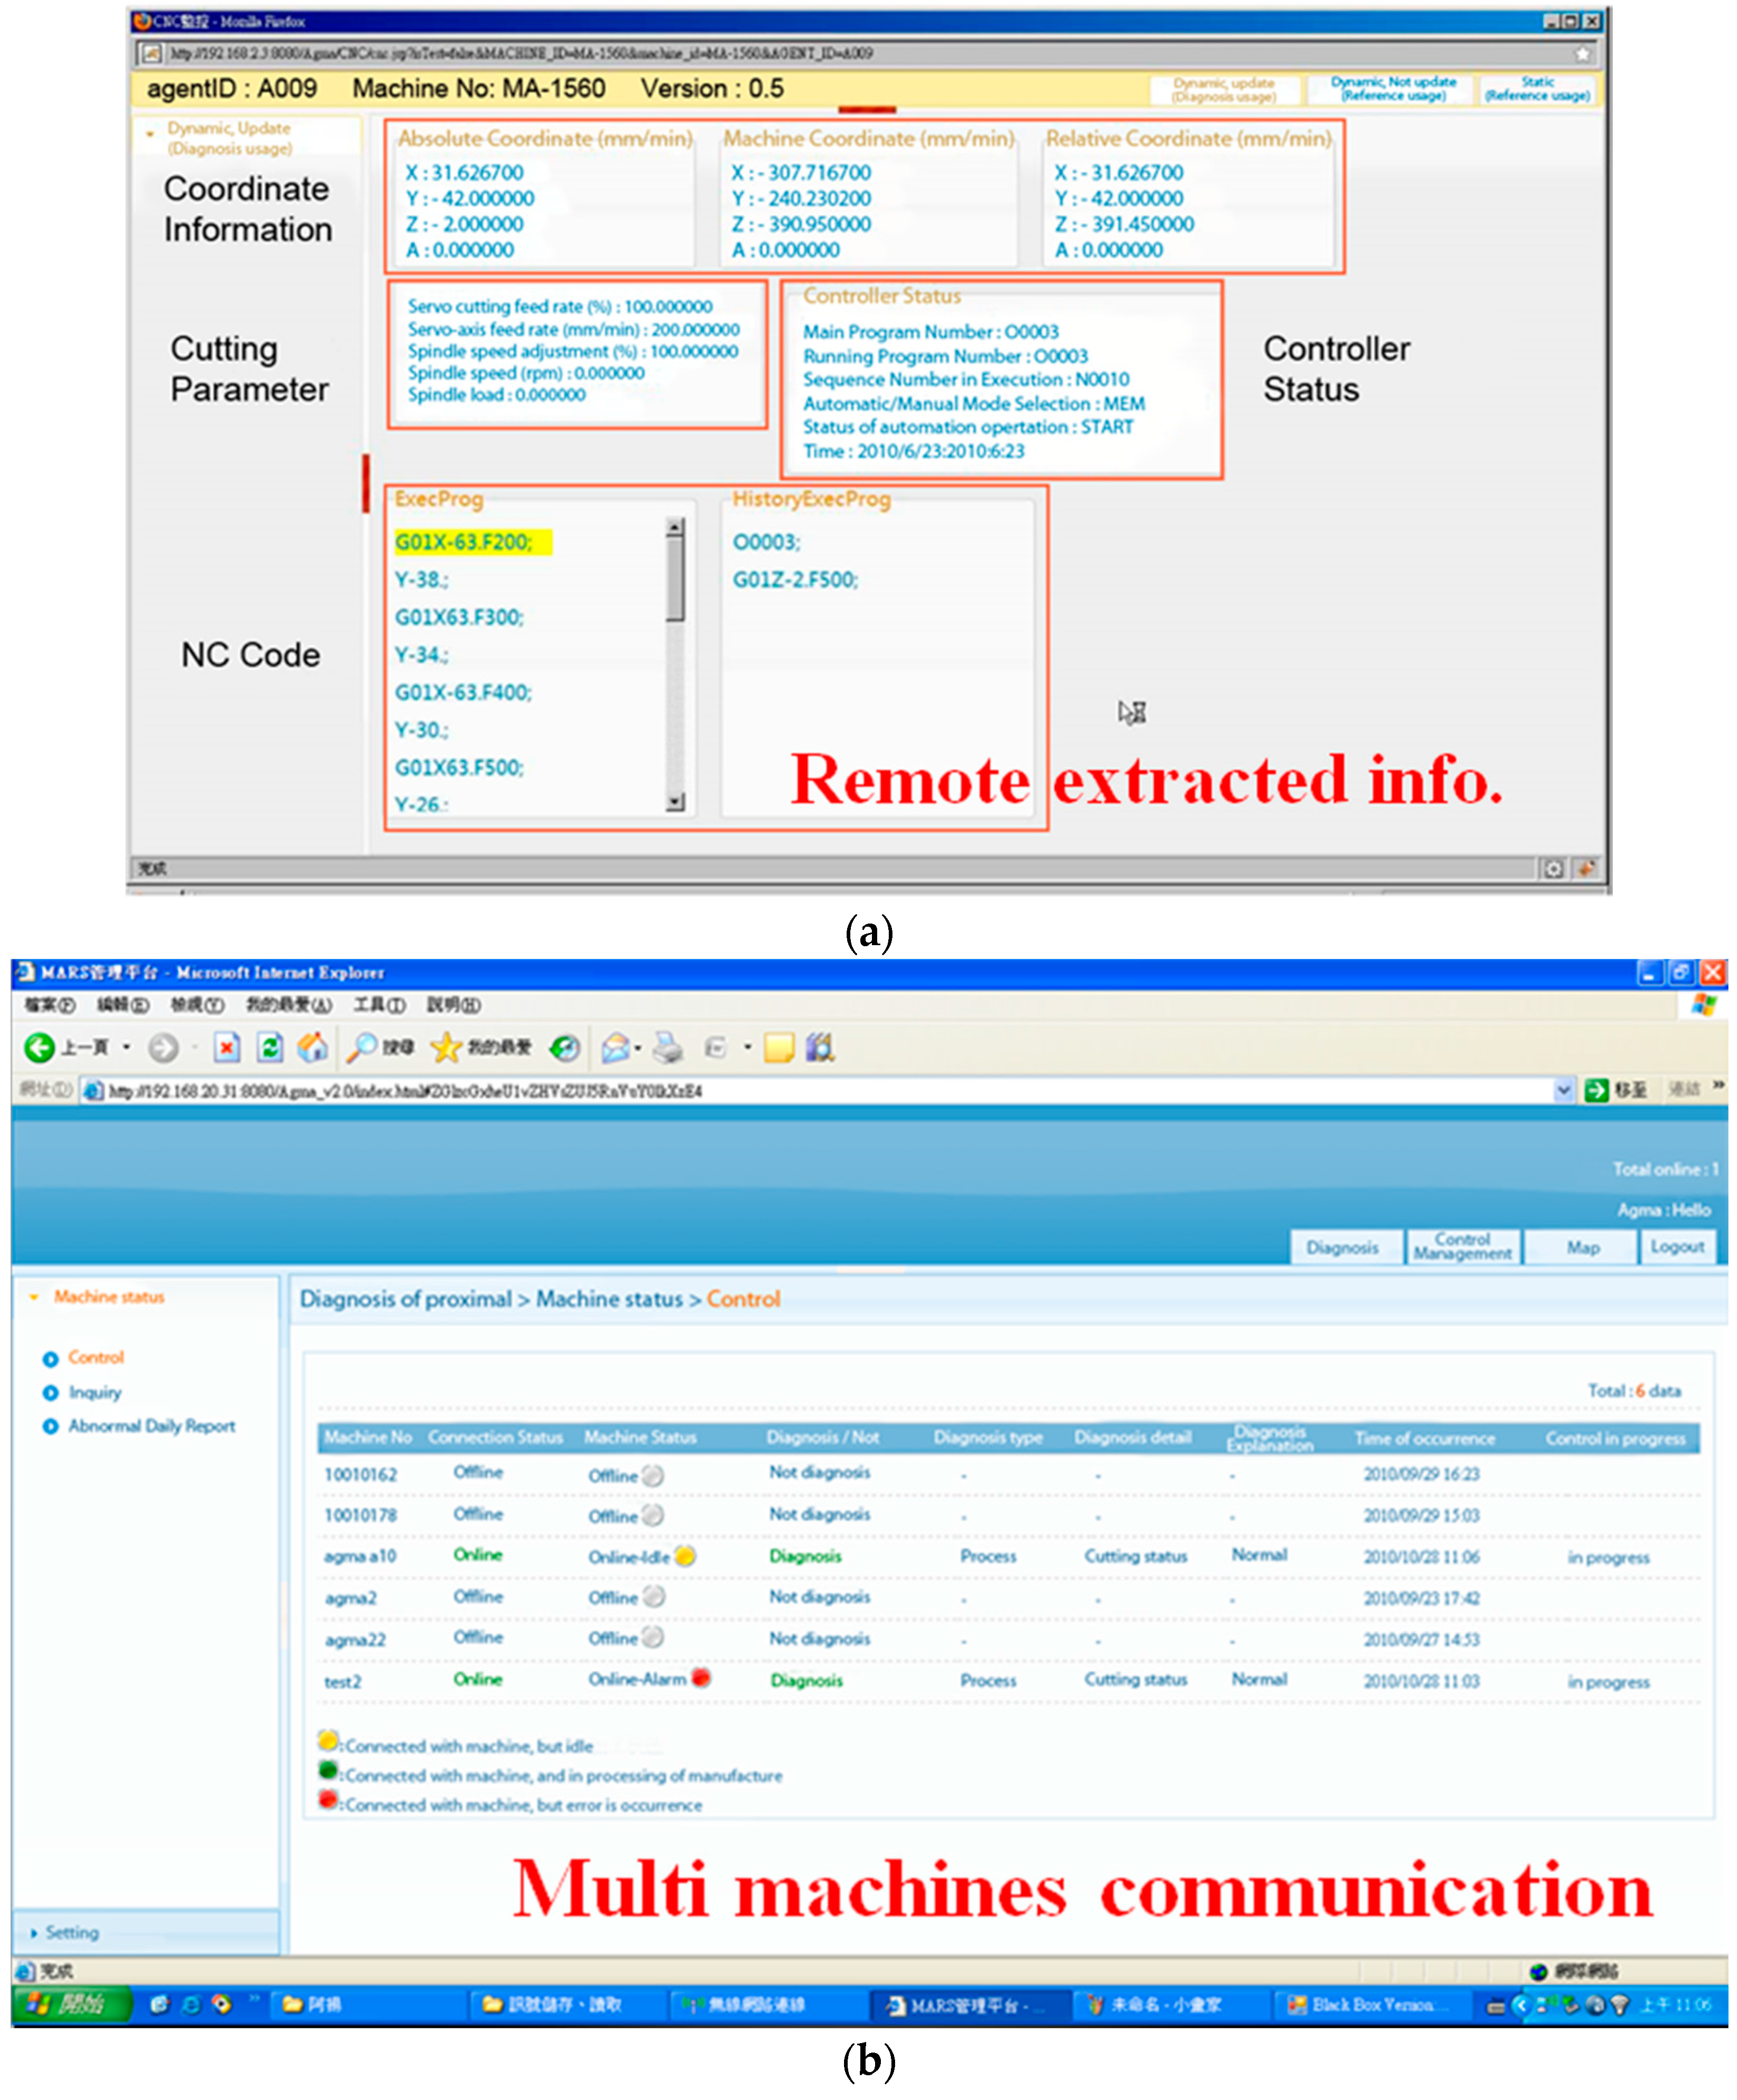
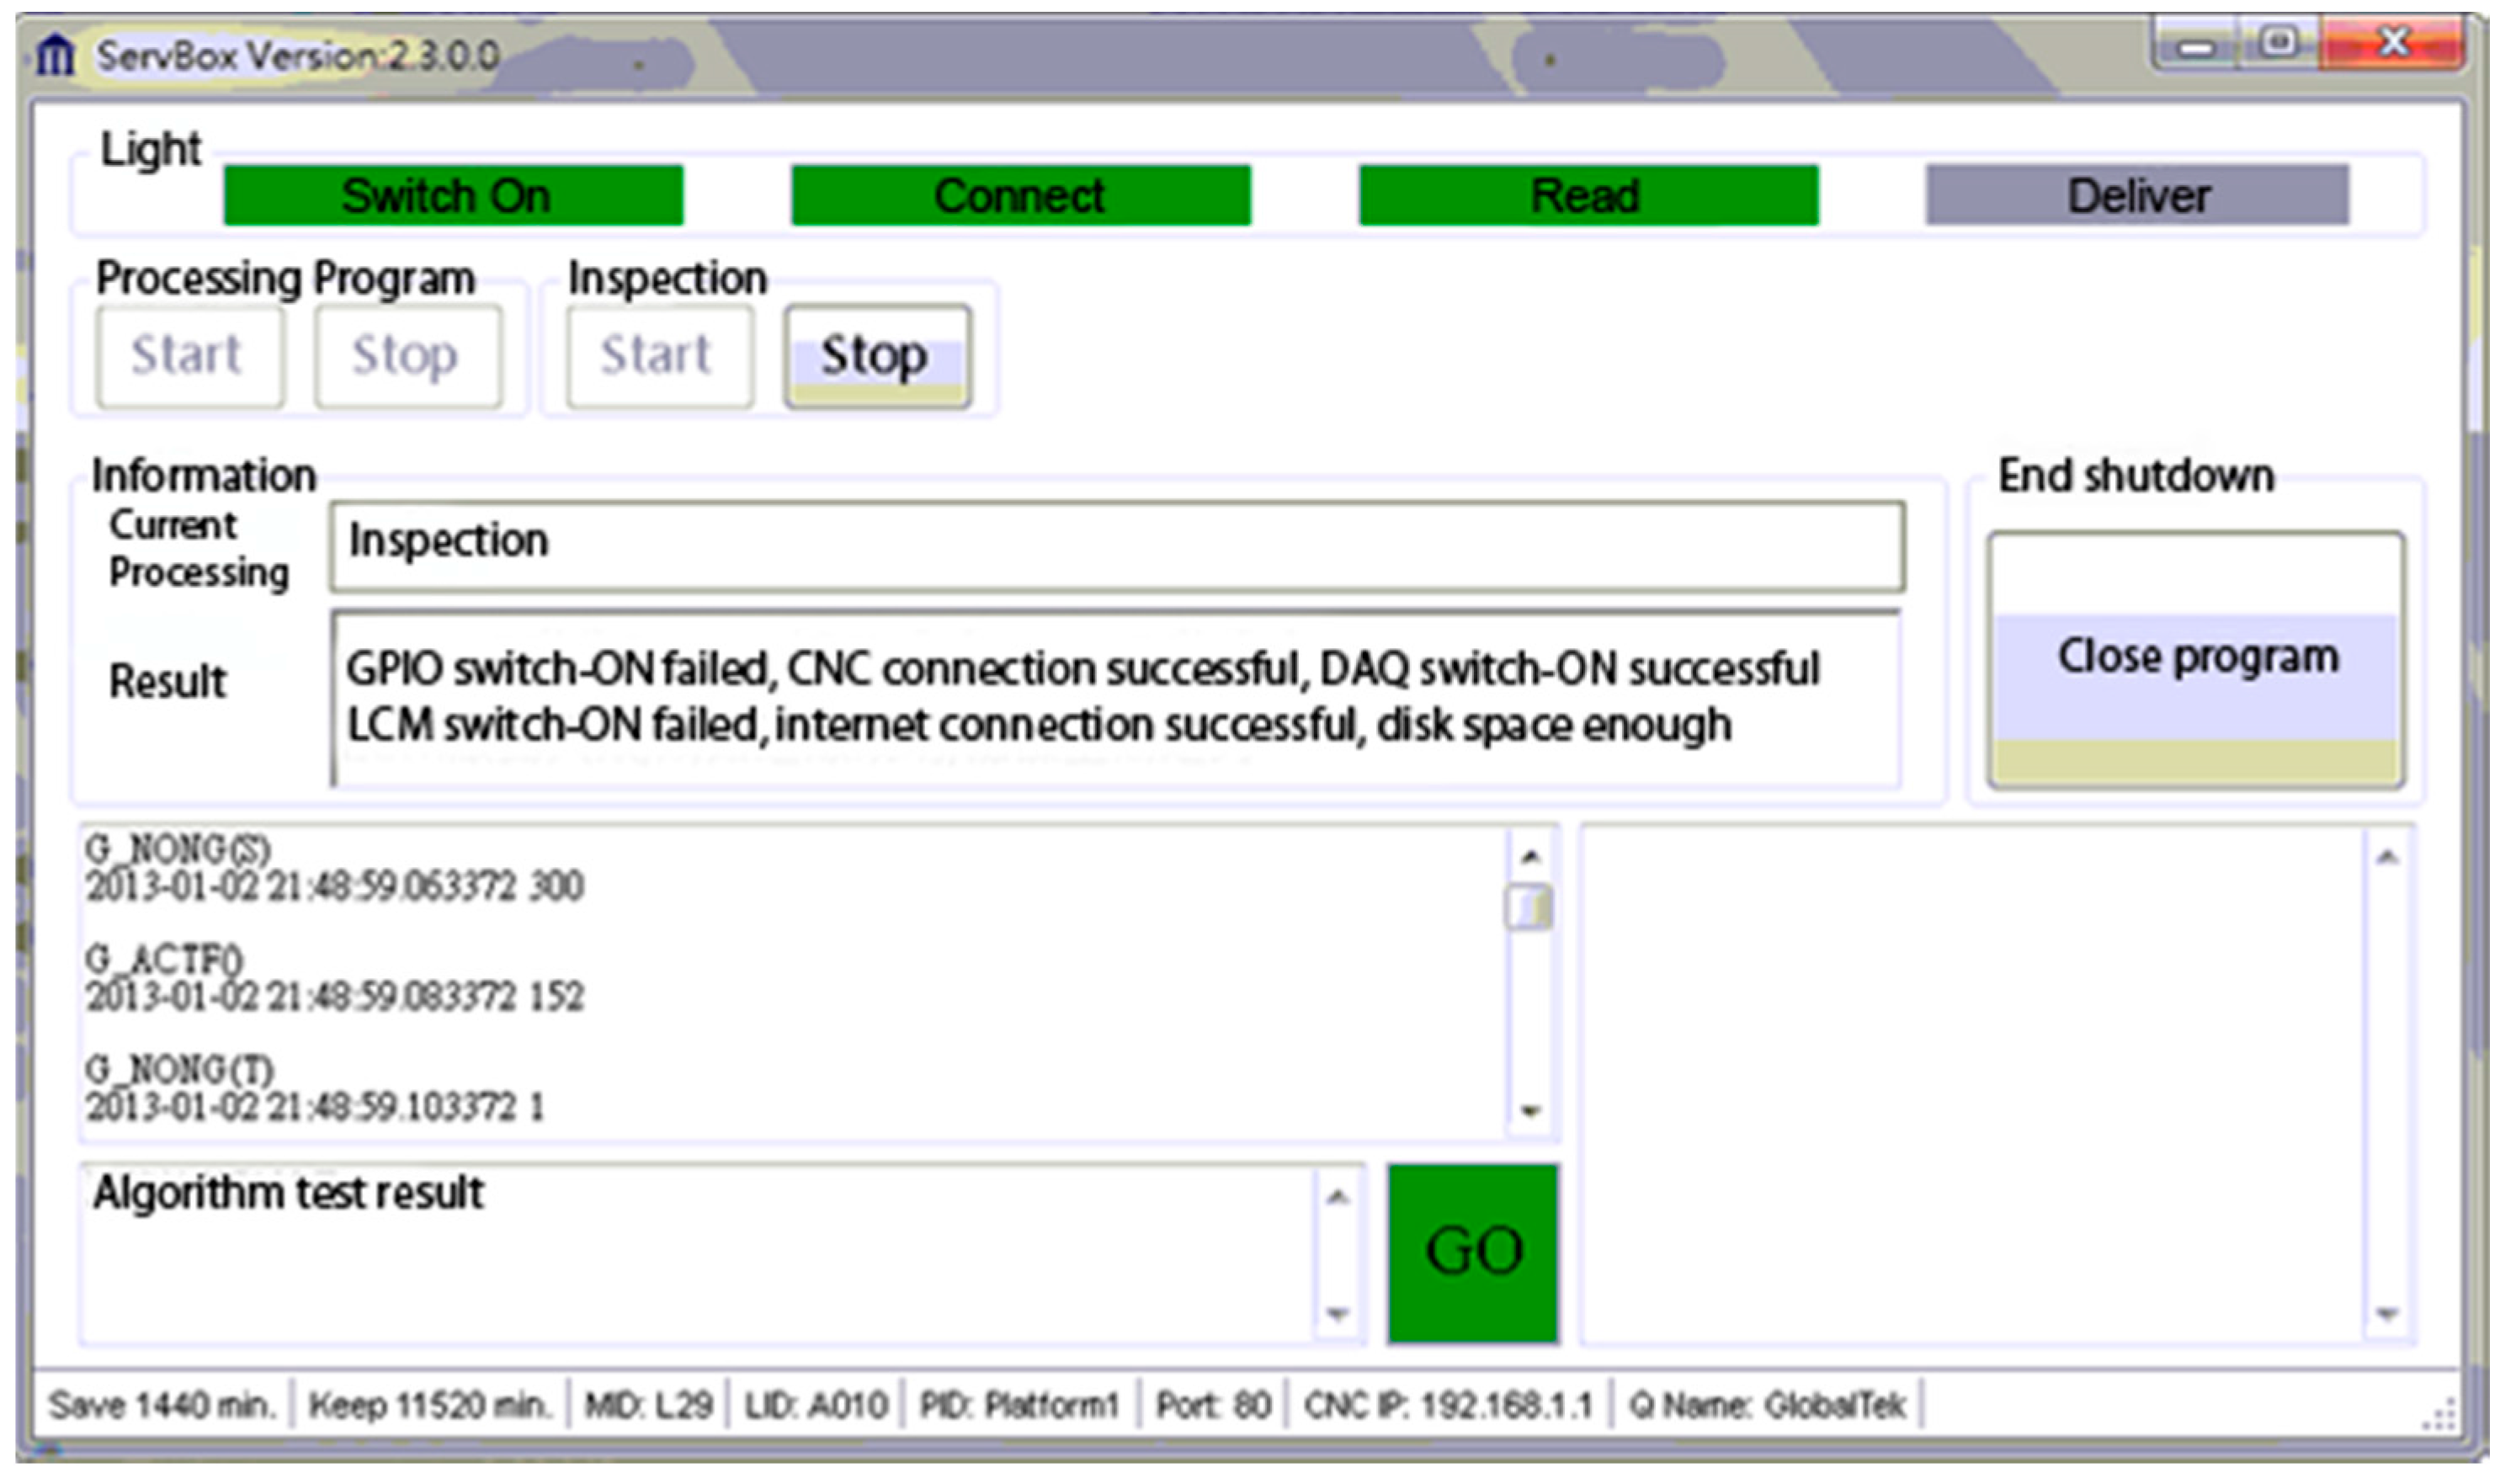
In the study, preliminary experiments were first conducted to collect the data so that the correlations between the variation of cutting vibration signals, cutter wear, and machining errors could be obtained. The diagnosis algorithms were then developed based on the correlations. Lots of experimental data were collected to analyze the characteristics of tool wear and determine the compensation value for tool wear. Based on the statistical analysis and the developed algorithms, a monitoring system with an auto-compensation function was built. Furthermore, adopting FANUC Open CNC API (application programming interface) Specification provided by FANUC Co., Oshino-mura, Japan, a bilateral communication module for a CNC controller was developed with the ability for on-line communication with the CNC controller in order to extract cutting information (such as instantly executing NC (numerical control) codes, coordinates, and the number of cuts, etc.) and send compensation commands to the CNC controller for the predicted tool wear. The module can also save all the monitoring results and information to a remote central computer for continuous engineering improvement in the future. An interface with functions of data acquisition, inspection, and error compensation was developed in C# language for easy operation. Finally, experiments on a CNC turning machine were conducted to verify the feasibility and effectiveness of the proposed system.

2. Preliminary Experiments

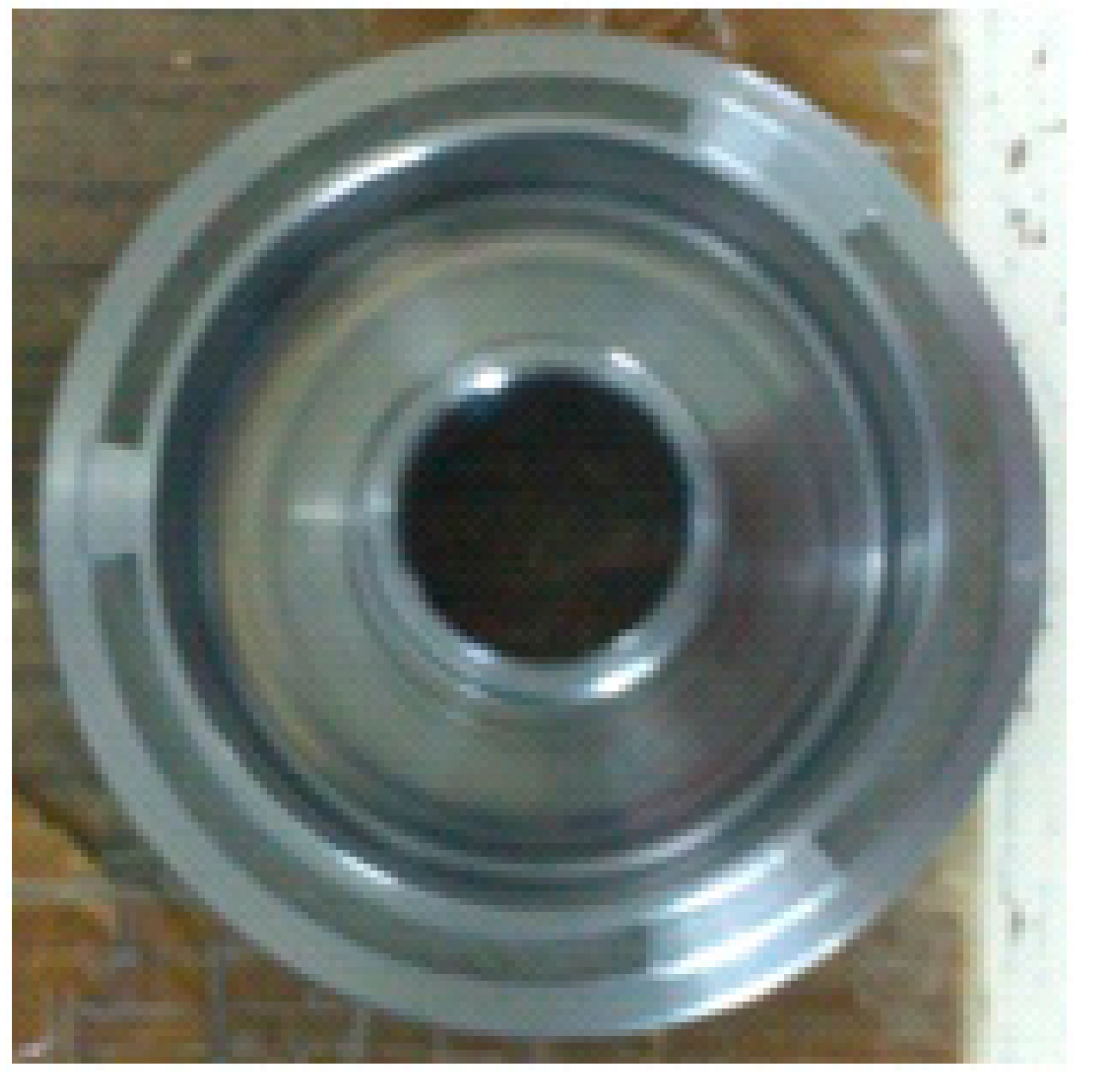
An automotive component (Figure 1) (GlobalTek, Taoyuan, Taiwan) made of steel (SAE 1018) was chosen for the experiment. Two finish turning processes for the automotive component were used as an implementation object in this study: (1) T03—finishing for the inner diameter; (2) T04—finishing for the outer diameter. Different tungsten turning tools with Chemical vapor deposition (CVD) coatings of TiCN + Al2O3 + TiN were used in the two turning processes. The automotive components was produced on a mass production line. According to the manufacturing requirement, production needs to have a quality inspection of 100%, especially for the inner and outer diameters. Therefore, after the T04 and T03 processes finished, the work pieces were removed from the turning machine for outer/inner-diameter inspection with four air gauge instruments (GlobalTek, Taoyuan, Taiwan). The differences in inspected errors between two consecutive work pieces were regarded as the influence of tool wear, and were used as the tool wear compensation values which were manually inputted in the CNC controller (FANUC, Tokyo, Japan).
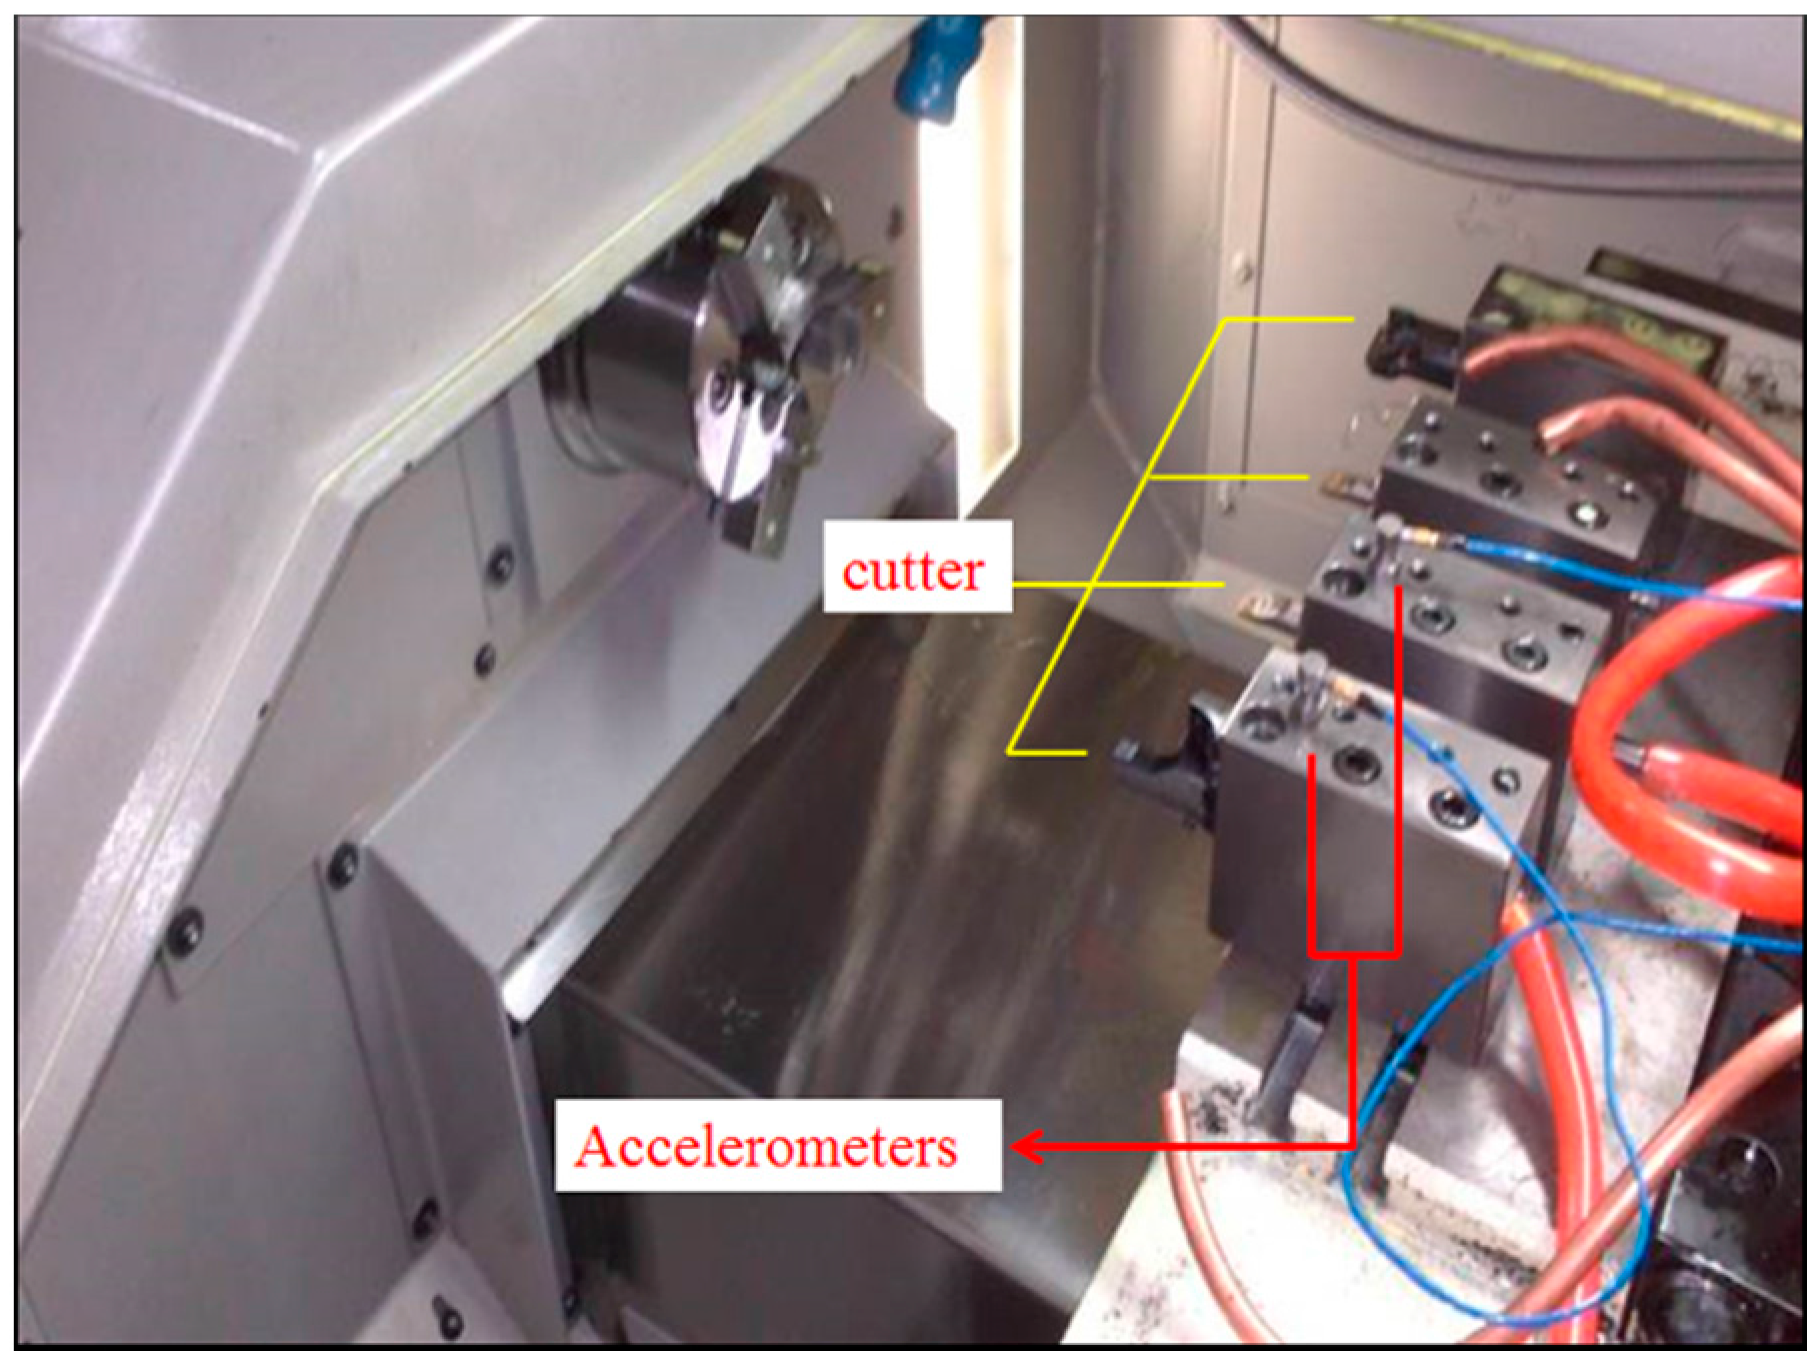
The preliminary experiments were designed to understand three phenomena: (1) the characteristics of the cutting vibration caused by machining force and tool wear; (2) the correlation between the depth of cut and cutting vibration; (3) the correlation between vibration signals and machining quality. The experimental results were used to design the algorithms for dimension inspection and tool wear compensation. The experimental analysis includes: (1) the correlation between dimension error and cutting vibration; (2) an investigation of the vibration pattern caused by tool wear. In order to carry out on-line collection the cutting vibration signals for analysis, two accelerometers (PCB Piezatronics Inc., Depew, NY, USA) were attached to the tool posts (Figure 2), which are close to the work piece to collect the actual vibration signals.

2.1. Correlation between Dimension Error and Cutting Vibration

Tool wear could influence the depth of cut, and the variation of the depth of cut could cause changes to the cutting vibration. Variation in the depth of cut could also cause dimension errors in the component. Using cutting vibration as an index of tool wear, it is very important to ensure that the cutting vibration is sensitive enough to identify the occurrence of tool wear, and sensitive enough to differentiate the variation in the dimension errors.
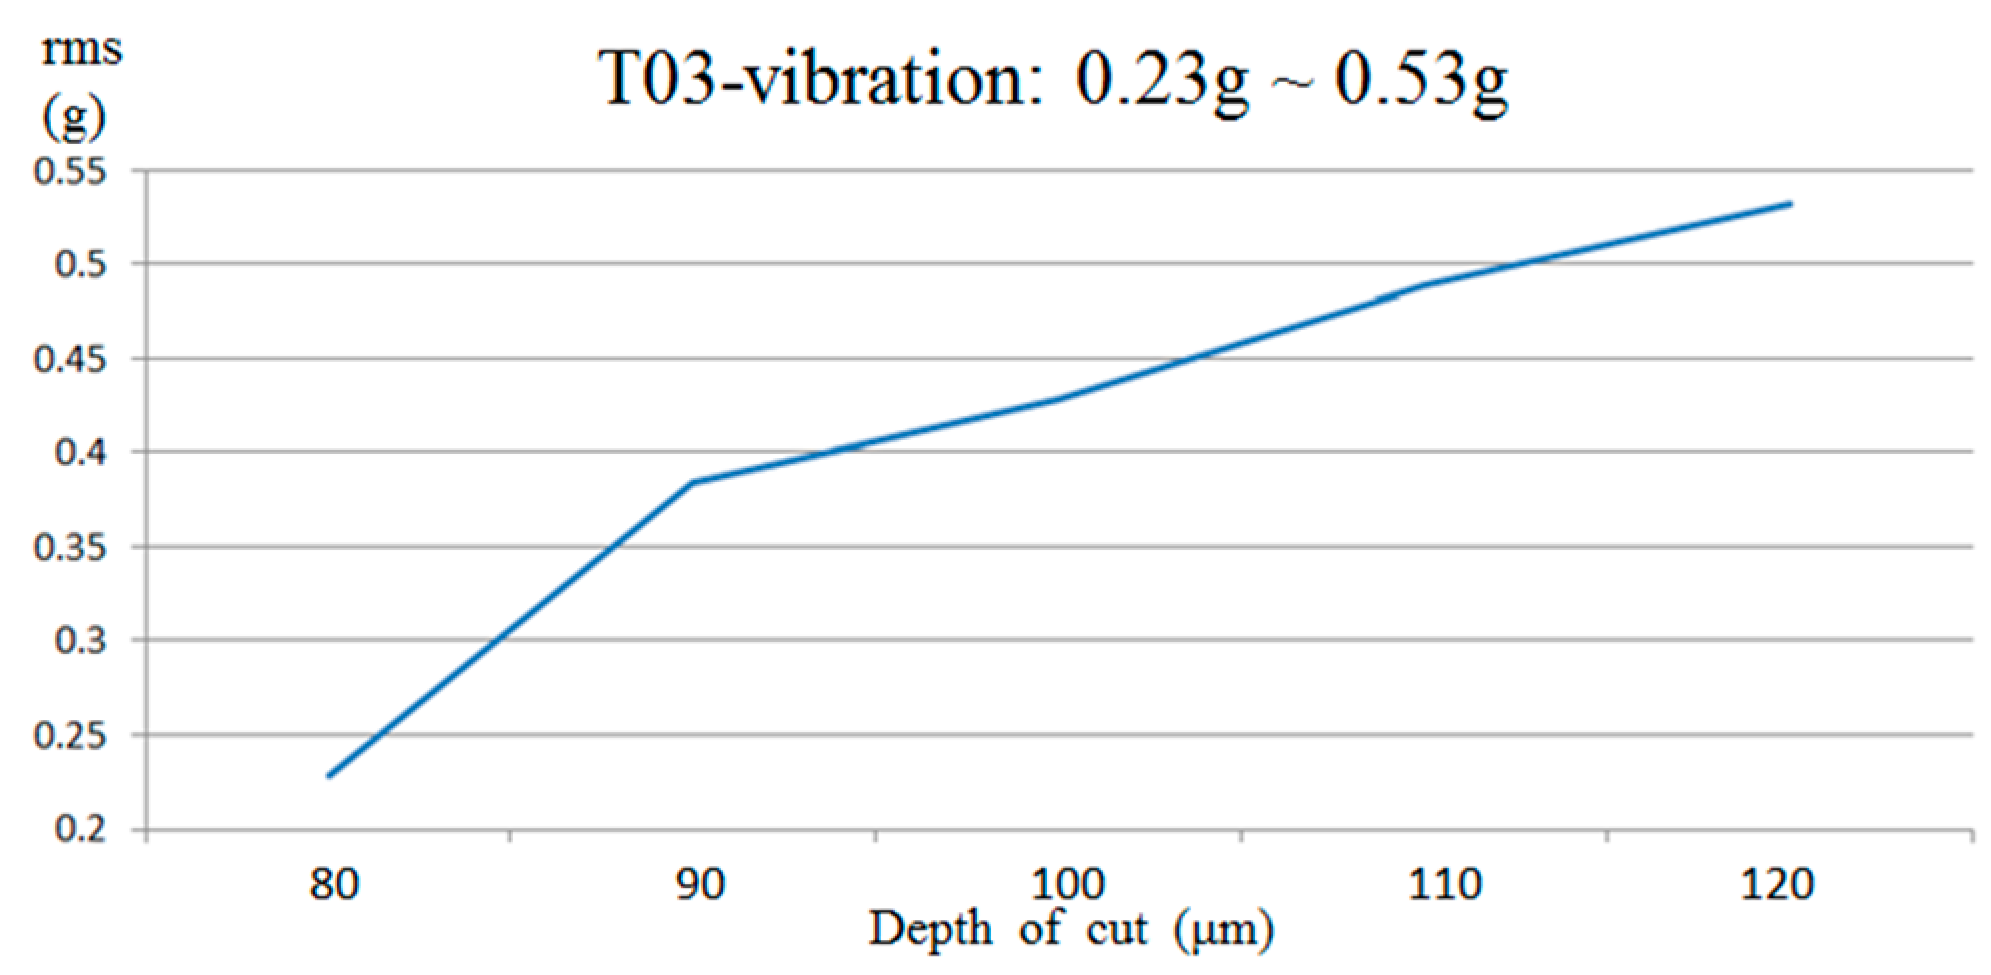
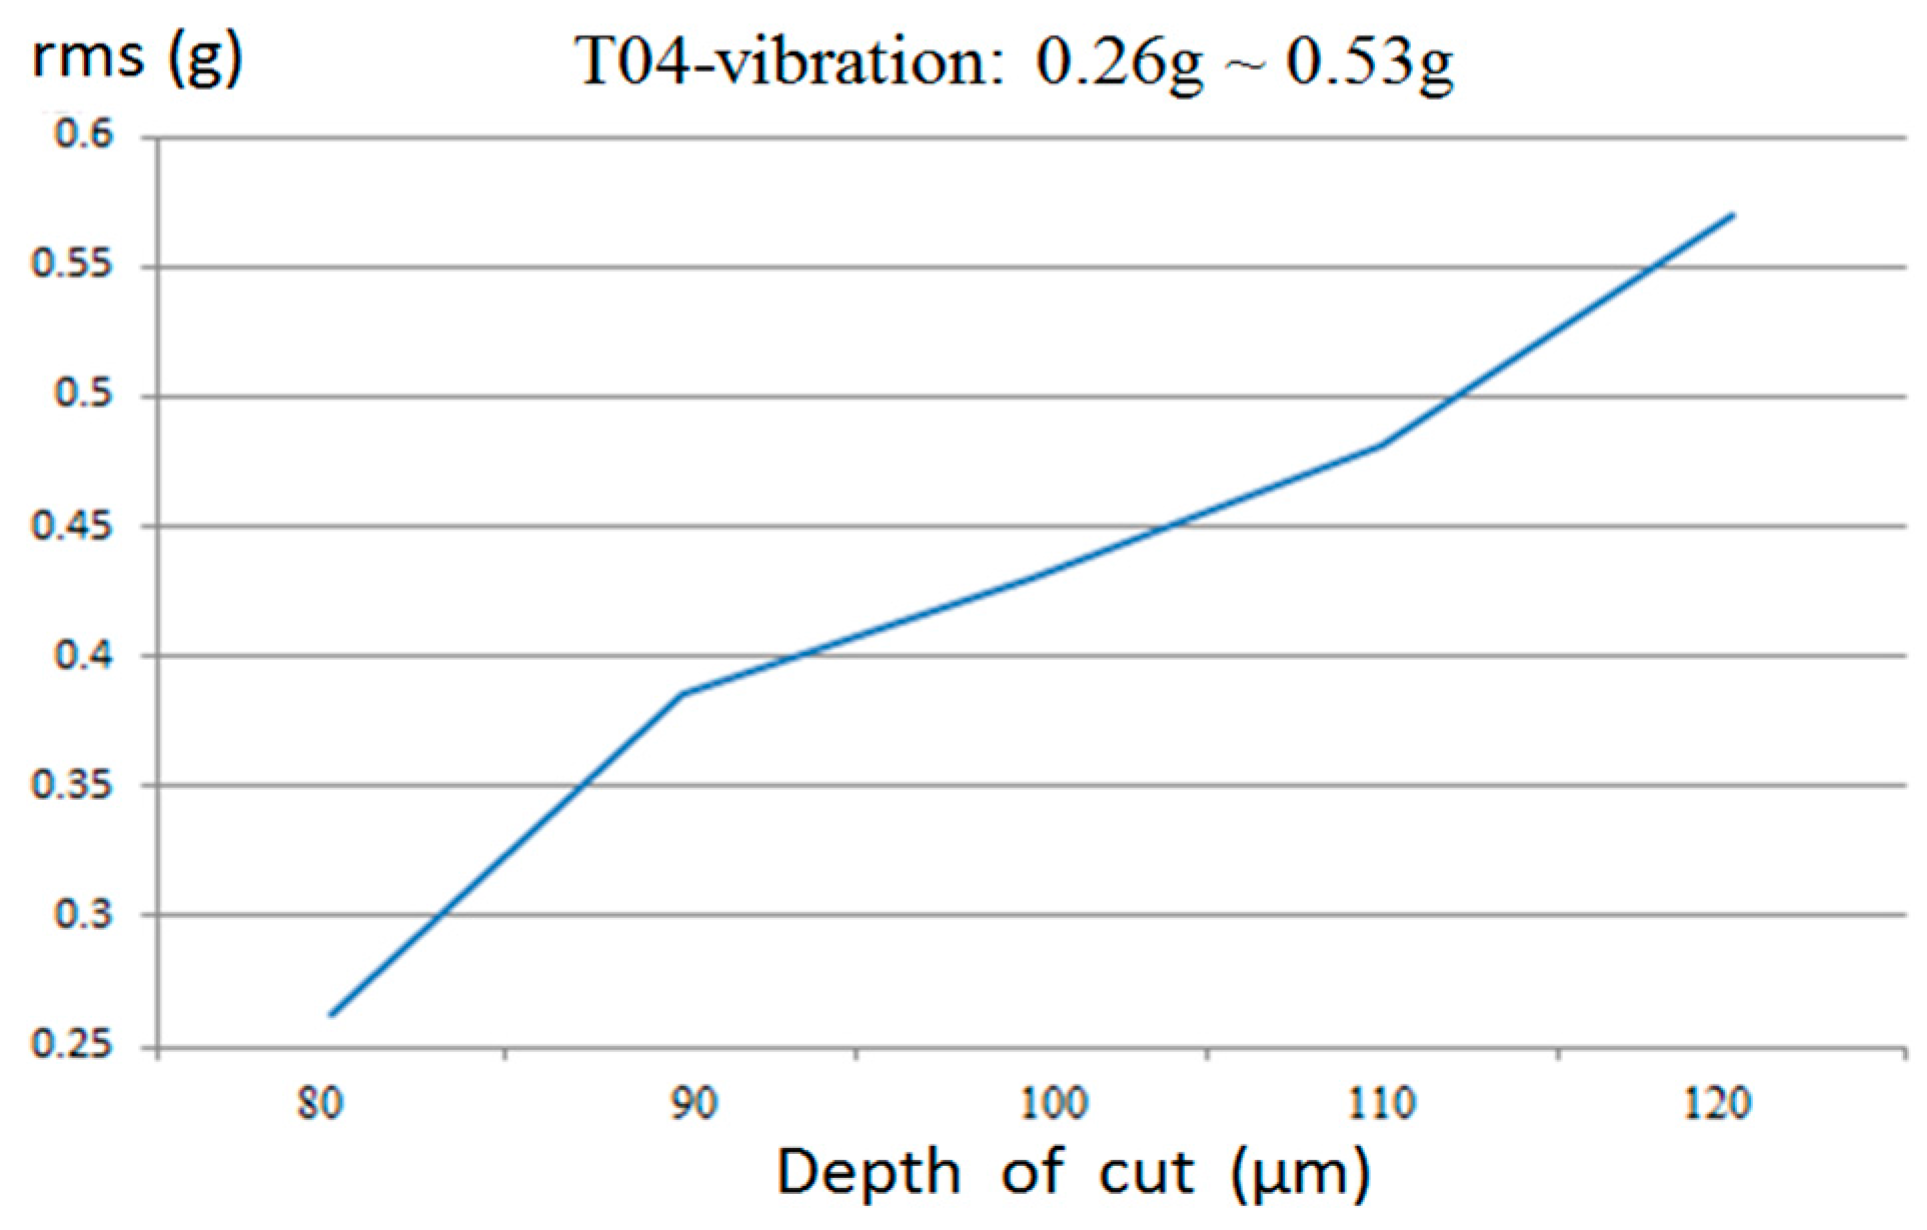
The experiment started with 0.08 mm for the depth of cut, and increased by 0.01 mm each time to 0.12 mm. The cutting vibration for each cut was measured by the accelerometers, and root-mean-square values of the vibration were calculated. Figure 3 and Figure 4, respectively, show the correlation of the depth of cut and cutting vibration for T03 and T04. It is noted that the cutting vibration is nearly linear in proportion to the depth of cut (0.05 g/0.01 mm), and the depth of cut can be estimated based on the measured vibration of a stable machining process. The same experiment was repeated 14 times, and the results were very repeatable.

2.2. Investigation of Tool Wear Patterns and Cutting Vibration Patterns

In a stable machining process, when the number of cuts increases, the tool wear of a cutter increases with a repeatable pattern. Through empirical analysis, the correlation of tool wear and the number of cuts can be obtained and used to build the pattern. Subsequently, the pattern can be used to check whether the tool wear increases normally or not. If the tool wear increases following the pattern, it could be estimated based on the statistical model built with collected experimental data.
In the preliminary experiments, the machining processes T03 and T04 were consecutively conducted, and the relationship between tool wear and its associated numbers of cuts was investigated. The tool wear was measured using a vision-based measurement system.
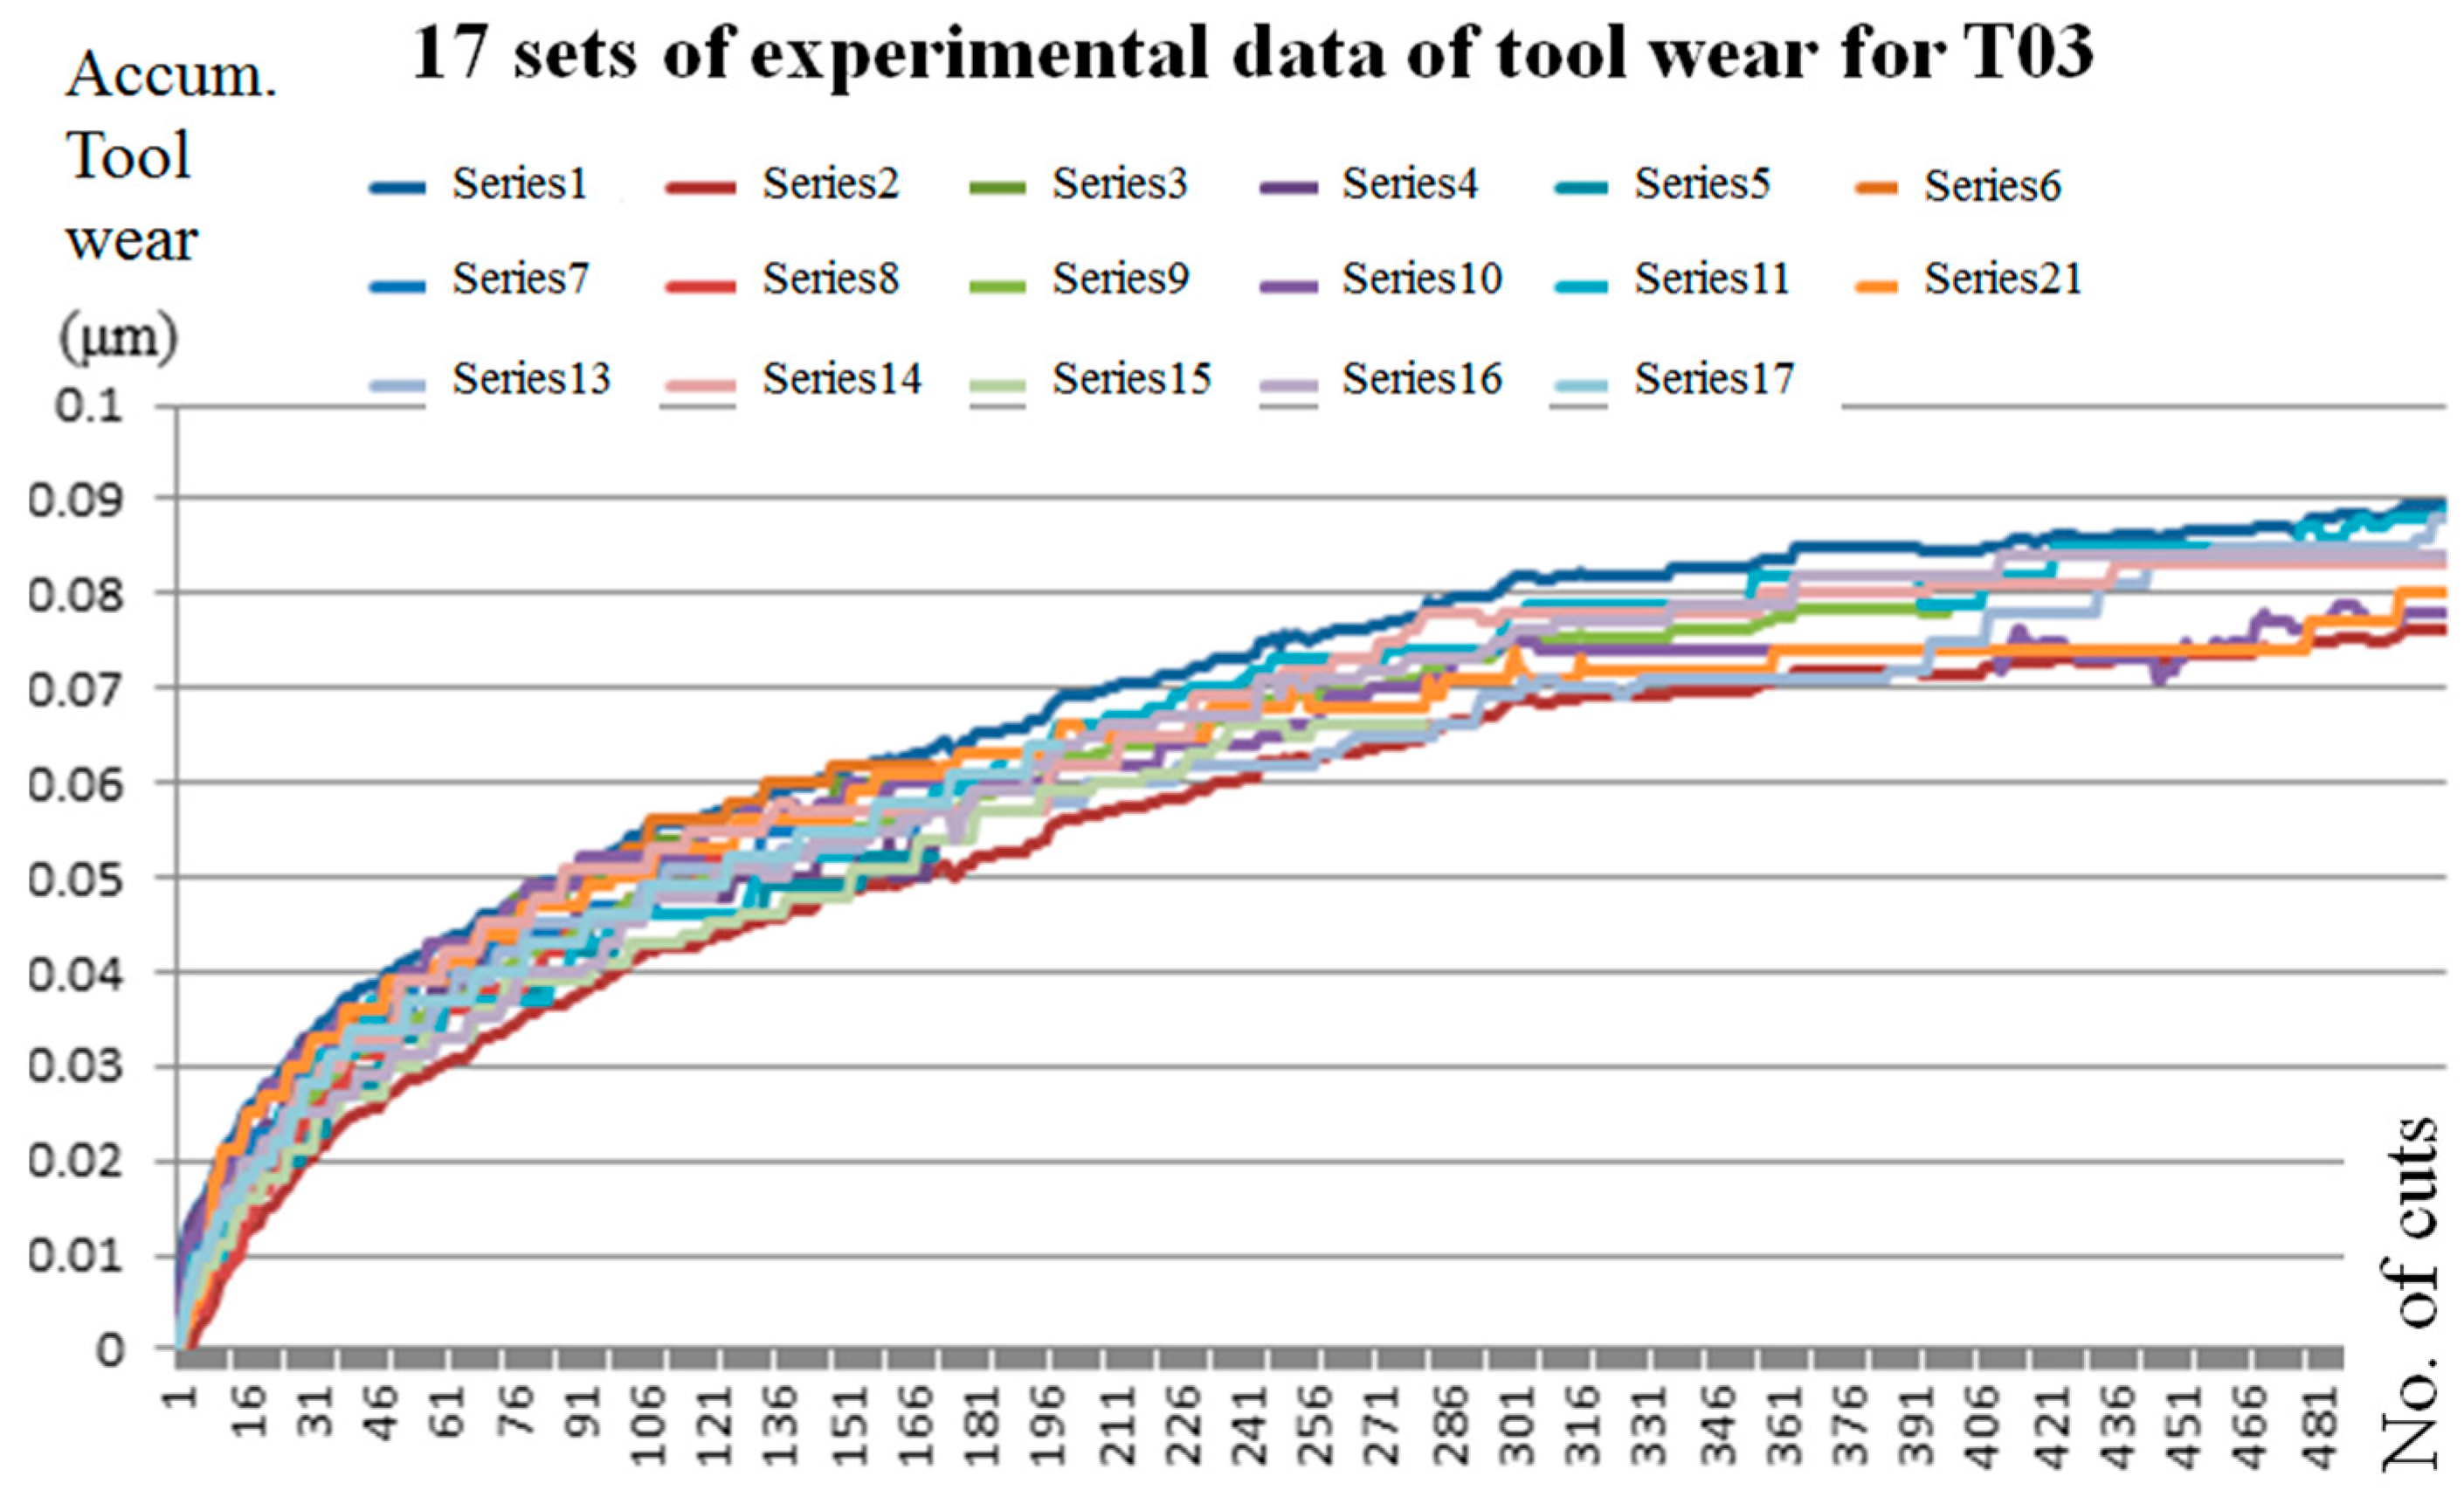
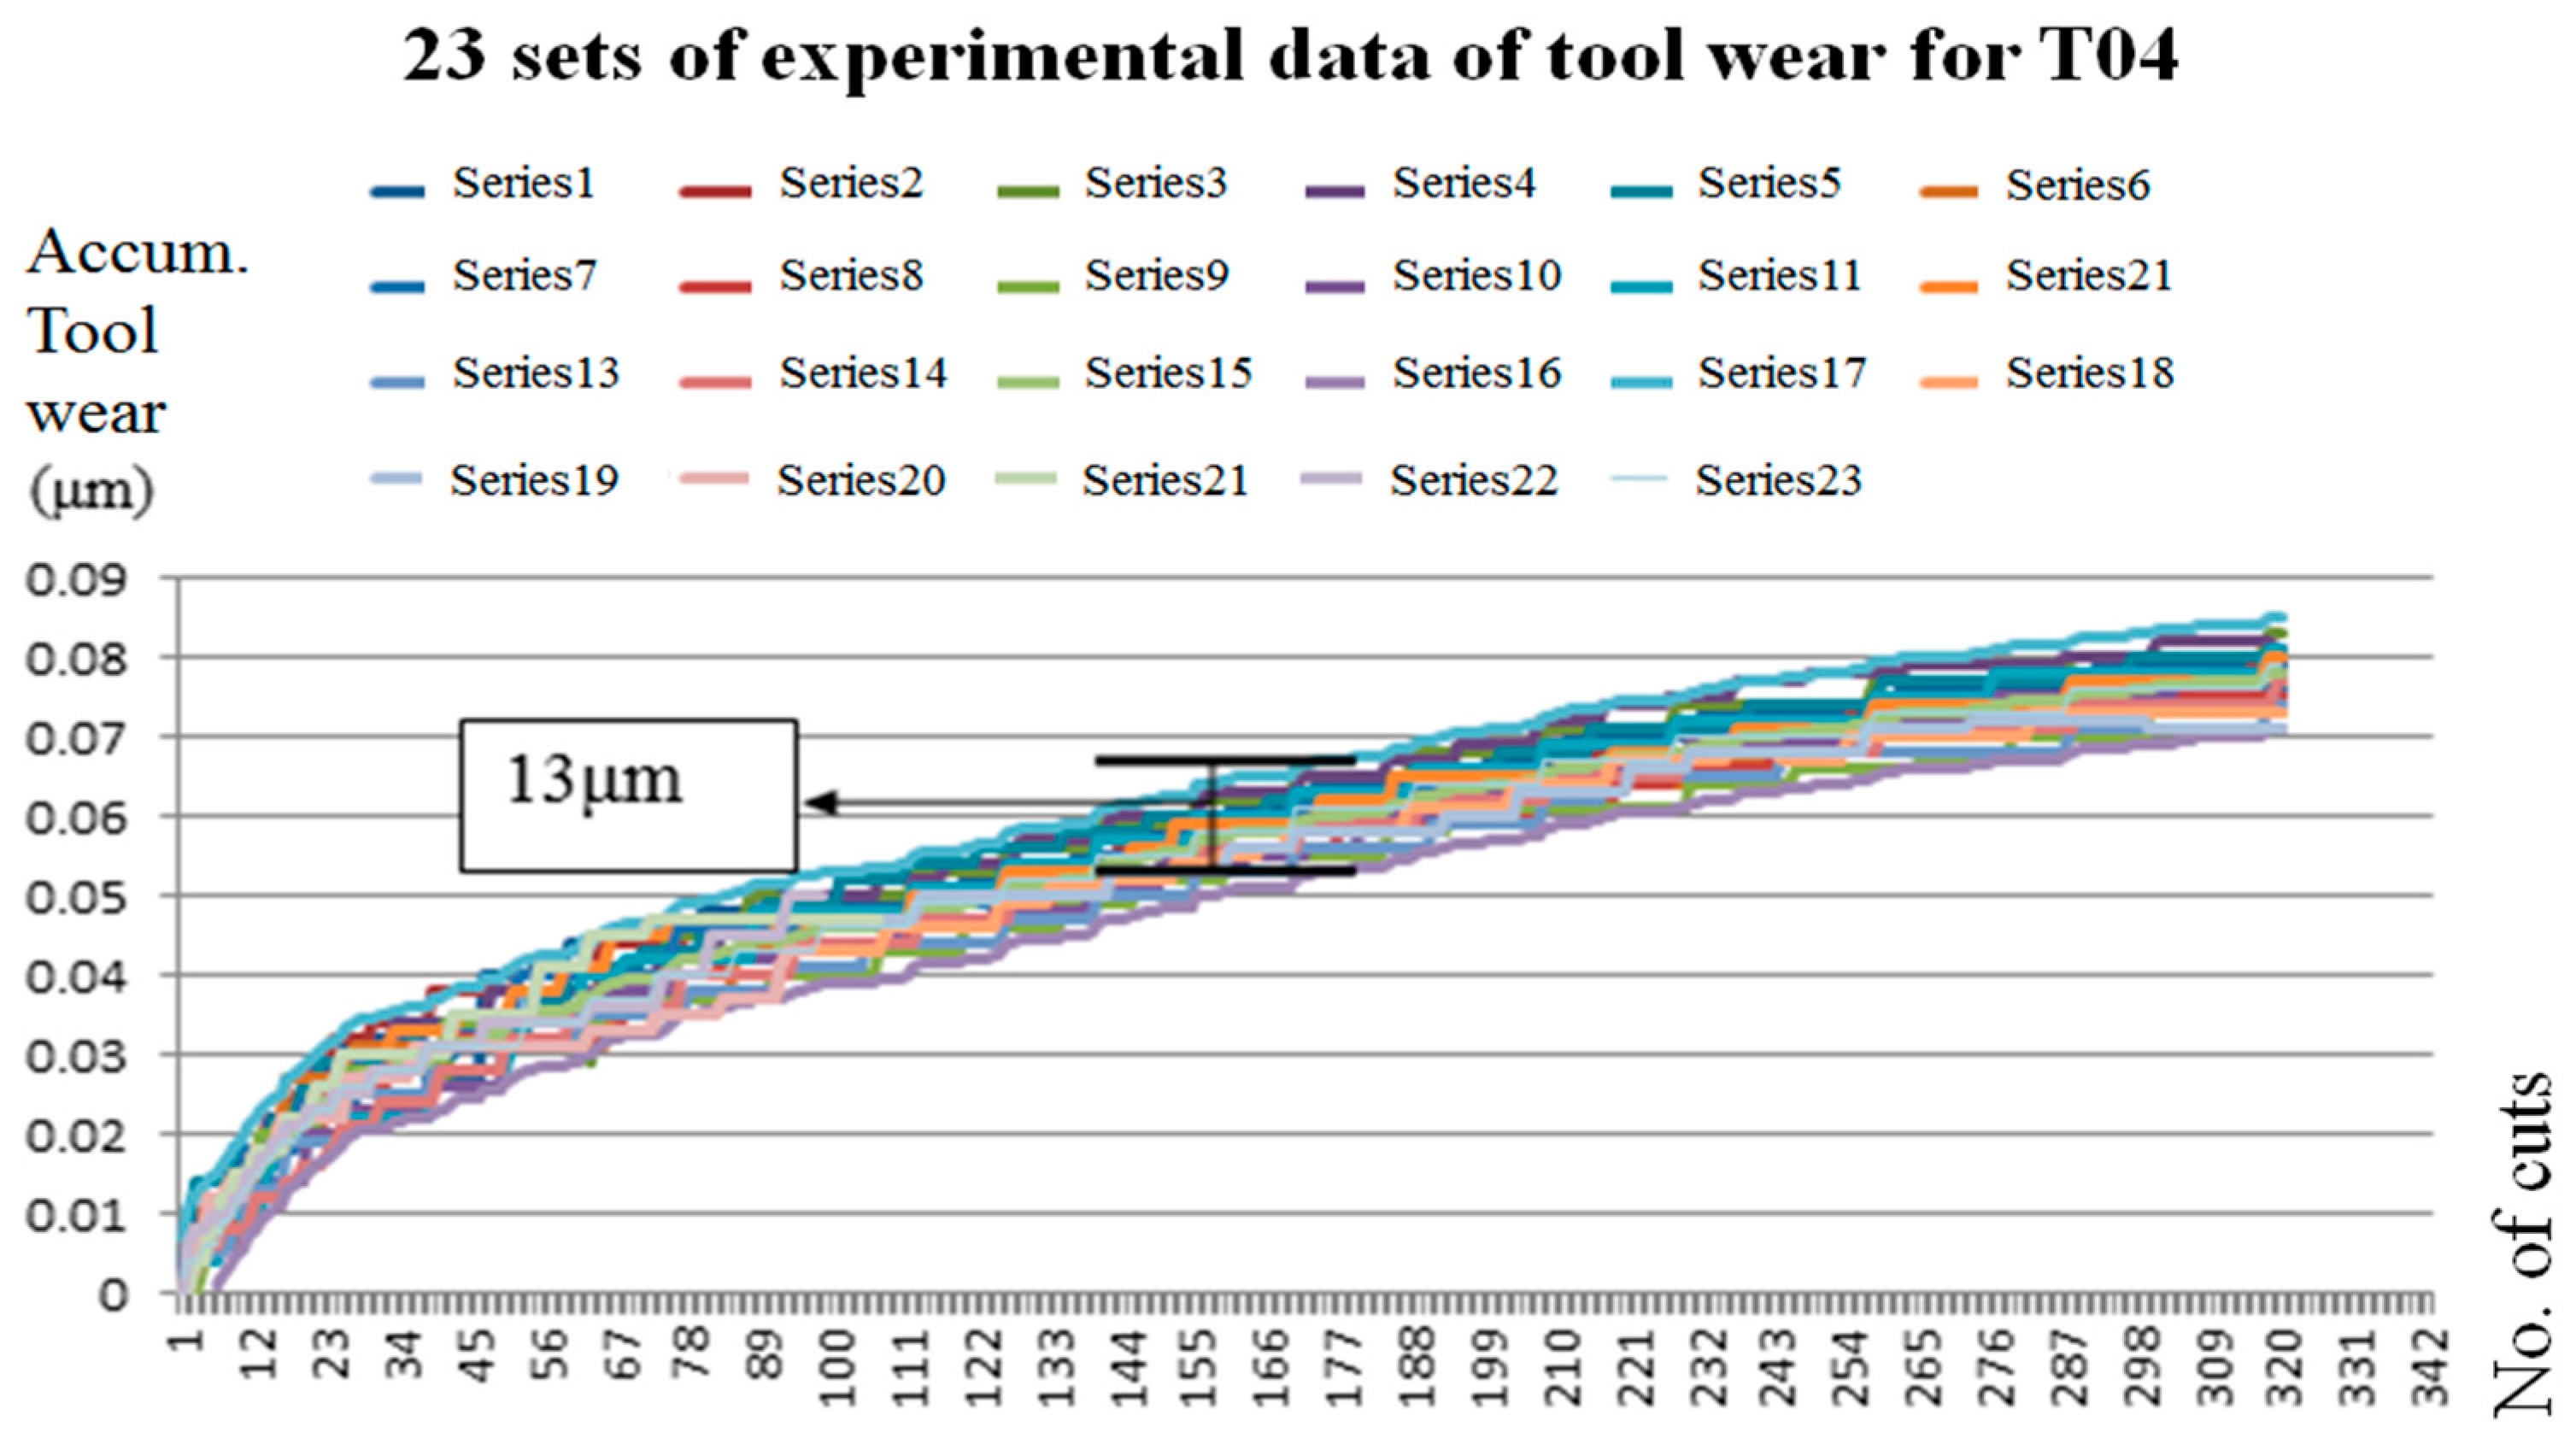
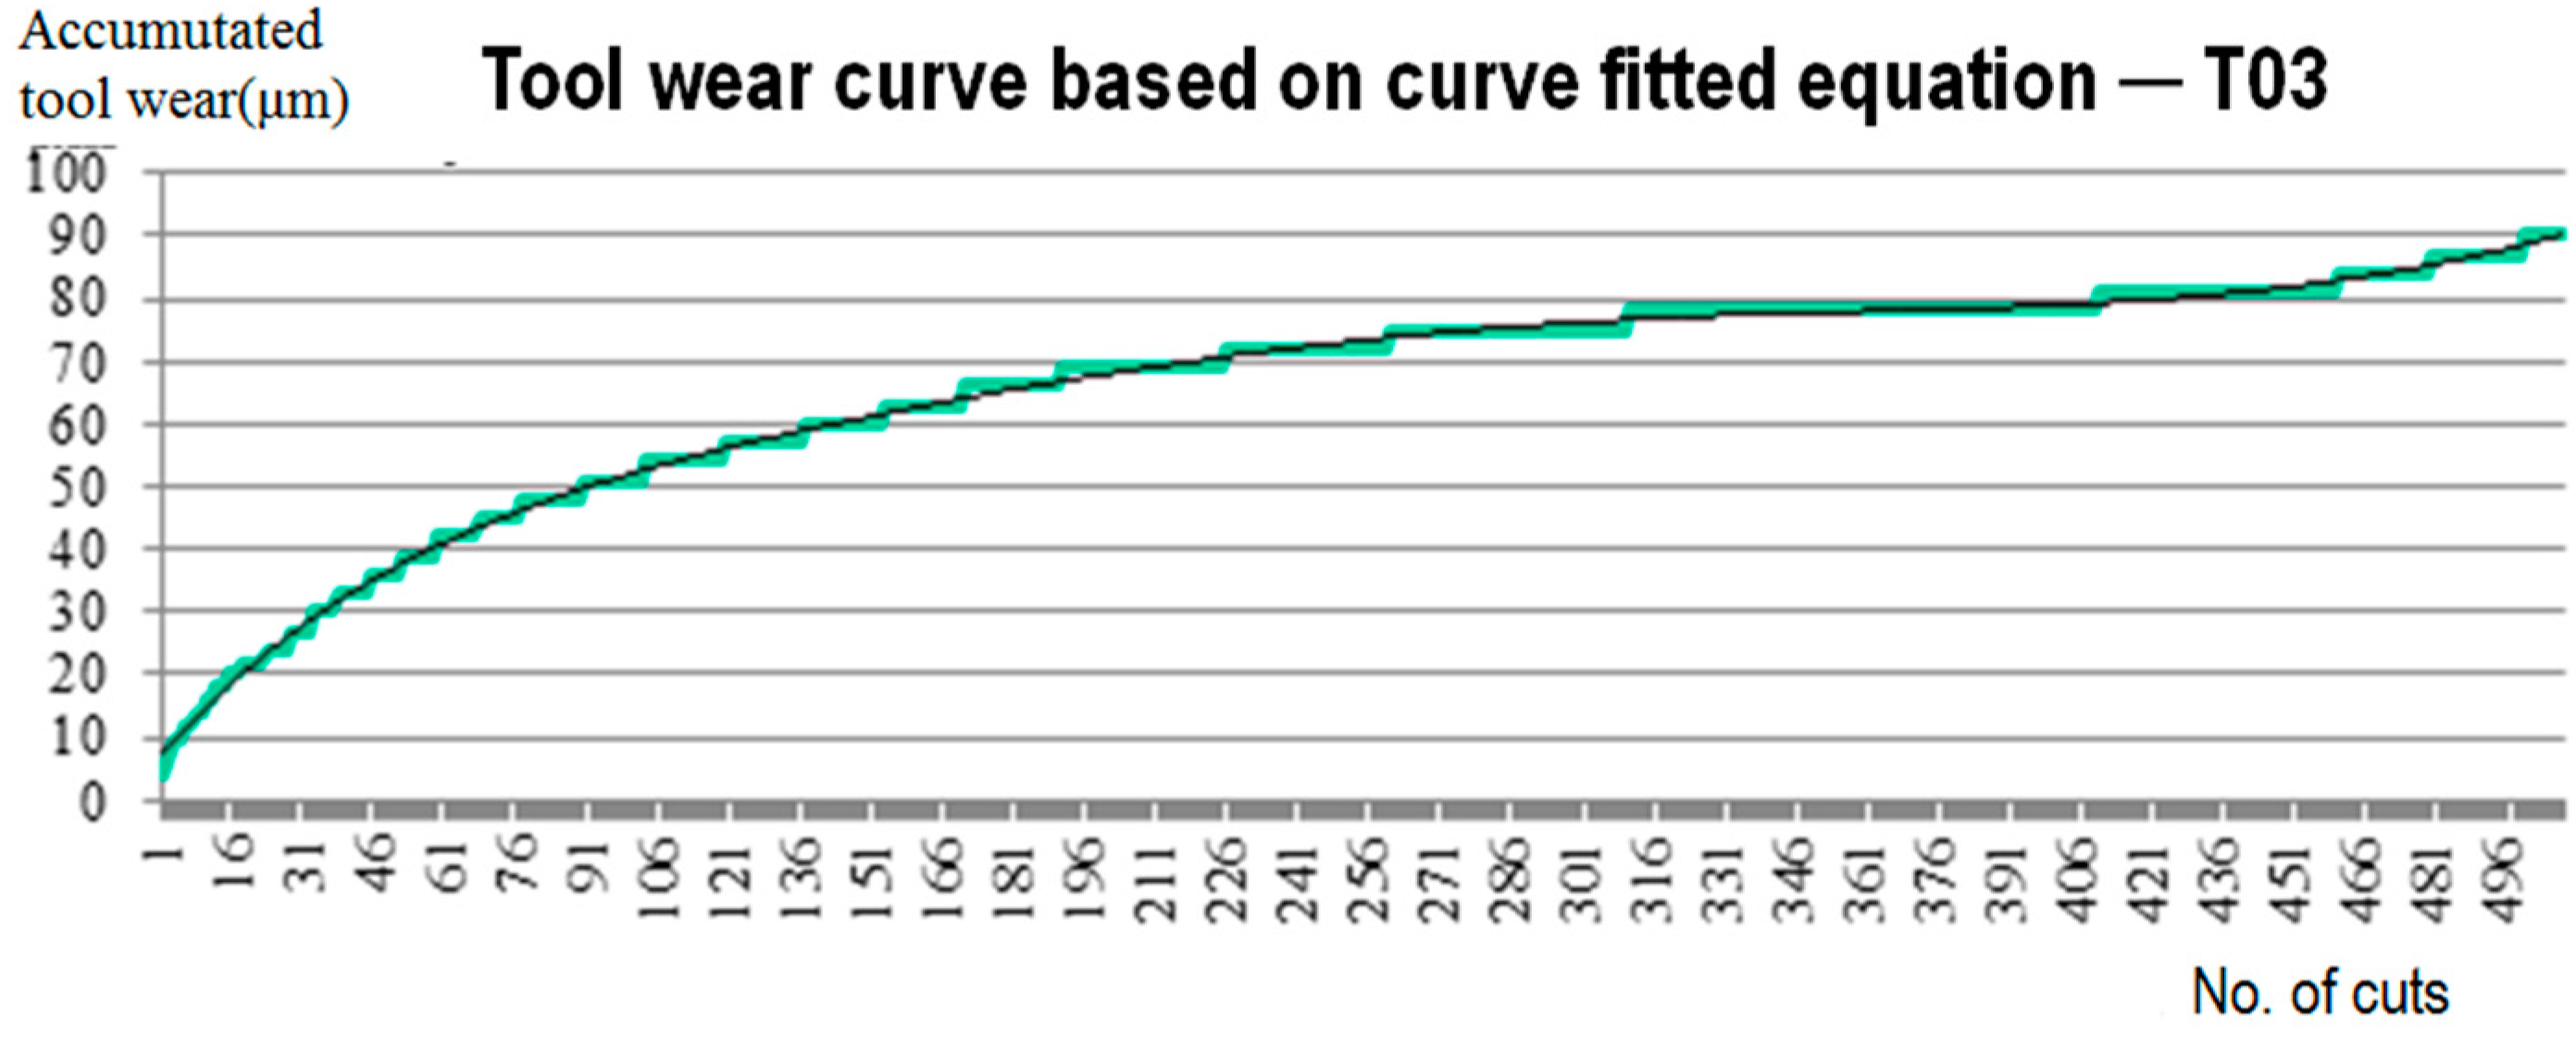
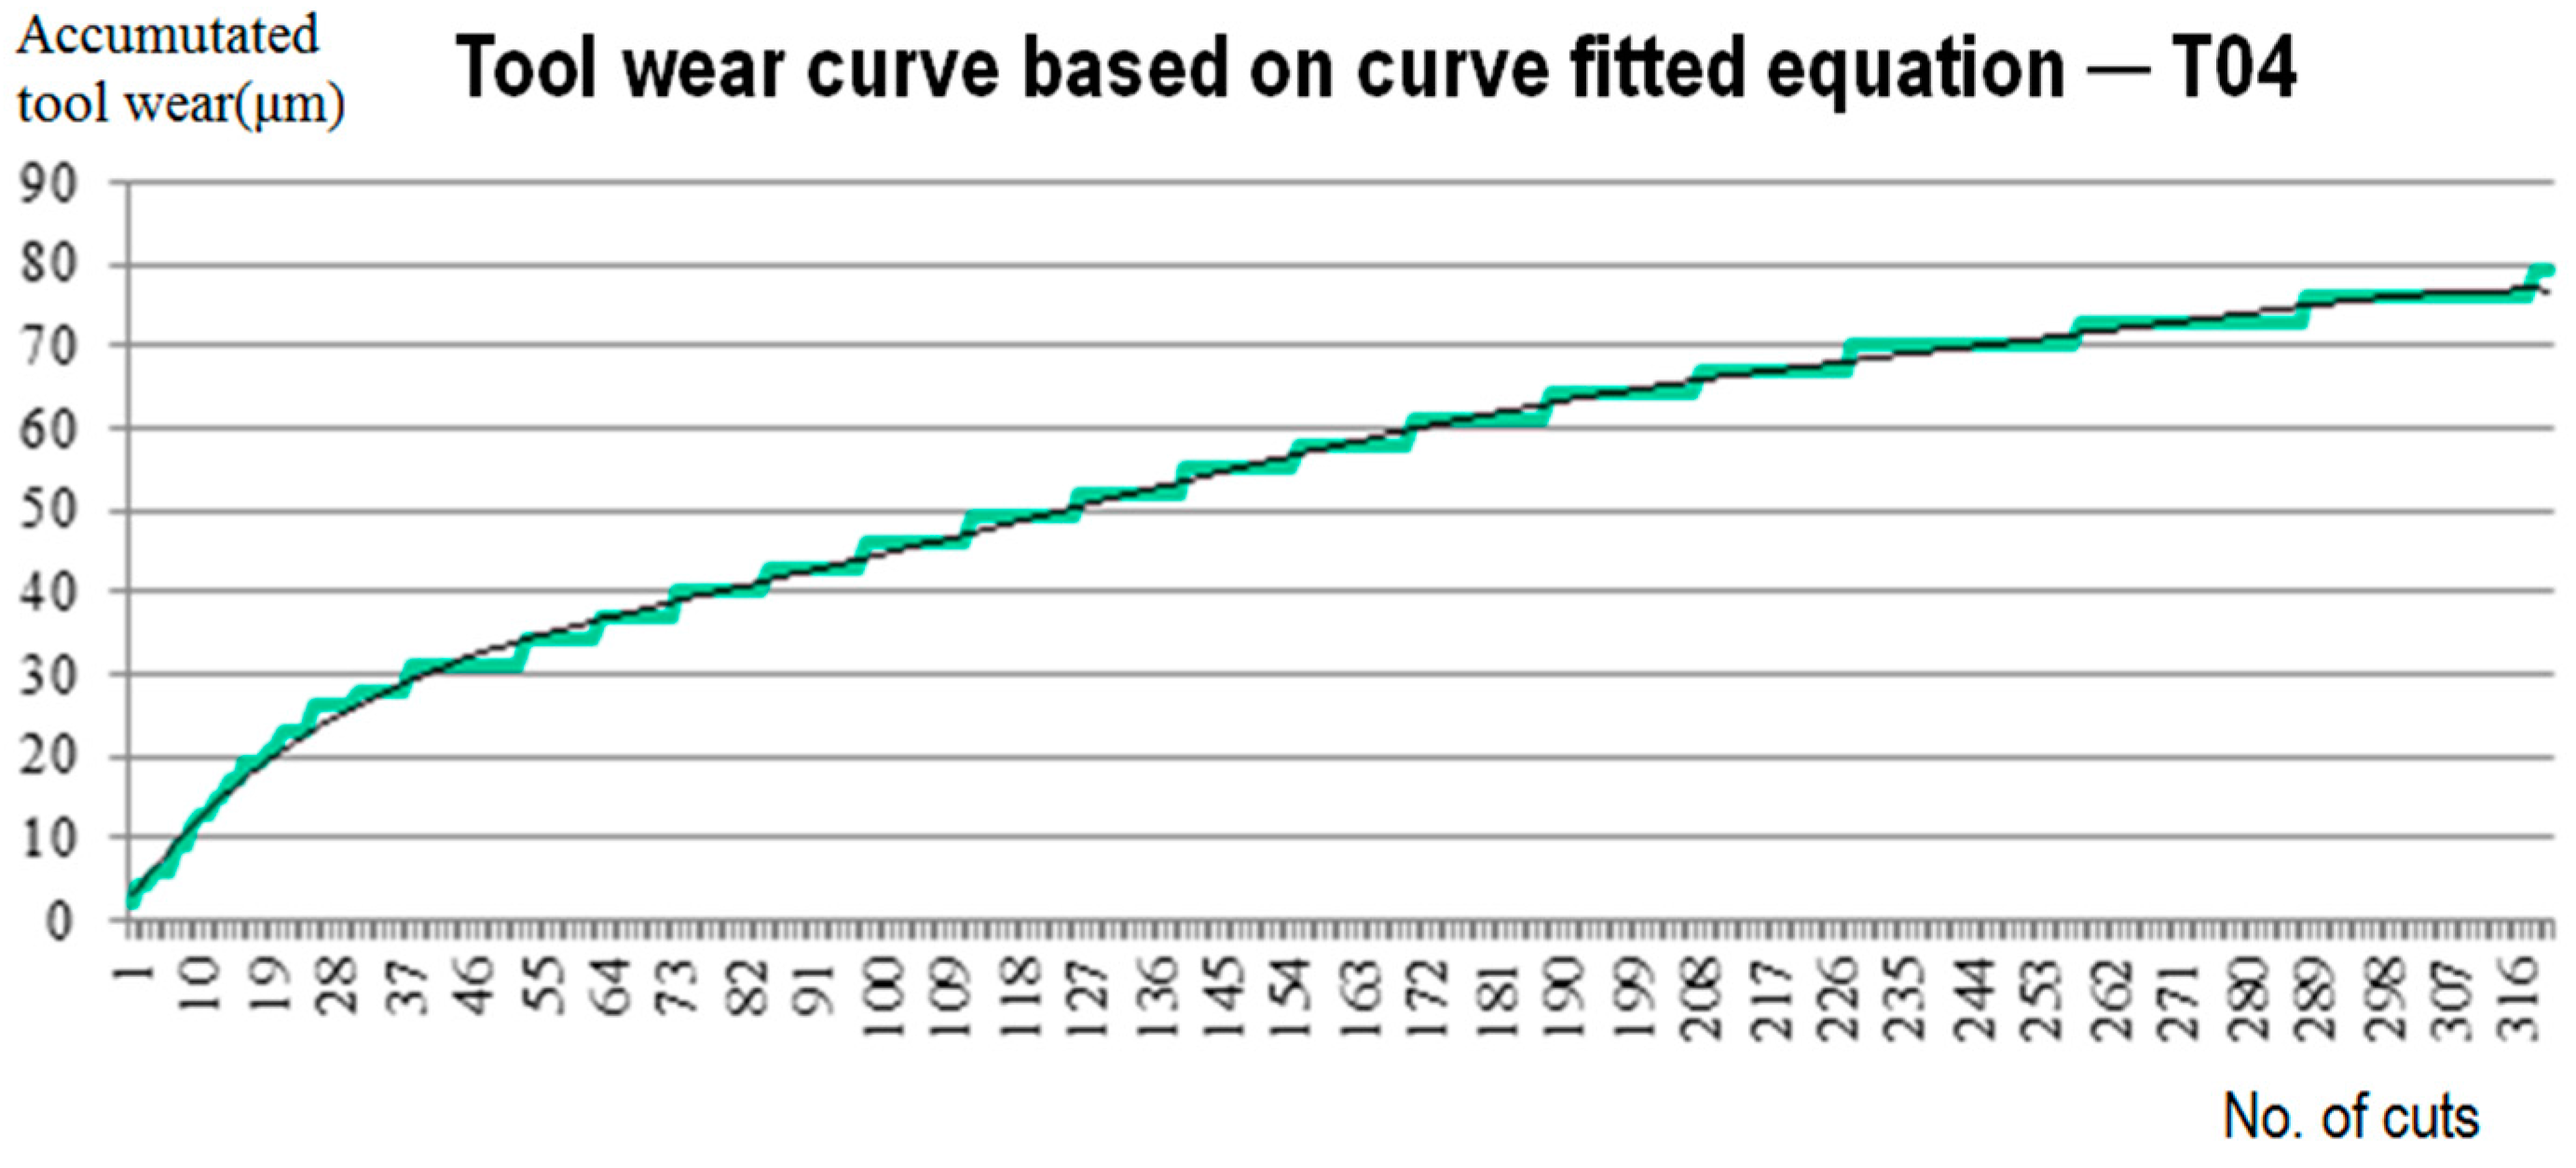
 Figure 5 and Figure 6, respectively, show the correlation of tool wear and the numbers of cuts of T03 and T04. It is noted that the tool wear of a cutter have three developing stages: faster wear, normal wear, and critical wear. The fast wear stage usually happens when a new cutter has begun to be used, because the new cutter is sharper and wear occurs more easily. At the normal wear stage, the tool wears slowly and stably. After the normal wear stage, tool wear will increase again at a faster rate. When a cutter is close to its tool life, tool wear will increase rapidly and it will soon to be worn out. This is regarded as critical wear. When critical wear occurs, the cutter wears out quickly and could damage the work piece. Therefore, critical wear could be a significantly signal to monitor for cutter replacement.
From the figures, it was found that the cutter had fast wear when it was new (for example, for the first 50 cuts for T03, and the first 60 cuts for T04), and then the wear increased slowly until the accumulated wear was close to the upper limit of the dimension tolerance of 0.1 mm. As we can see from 
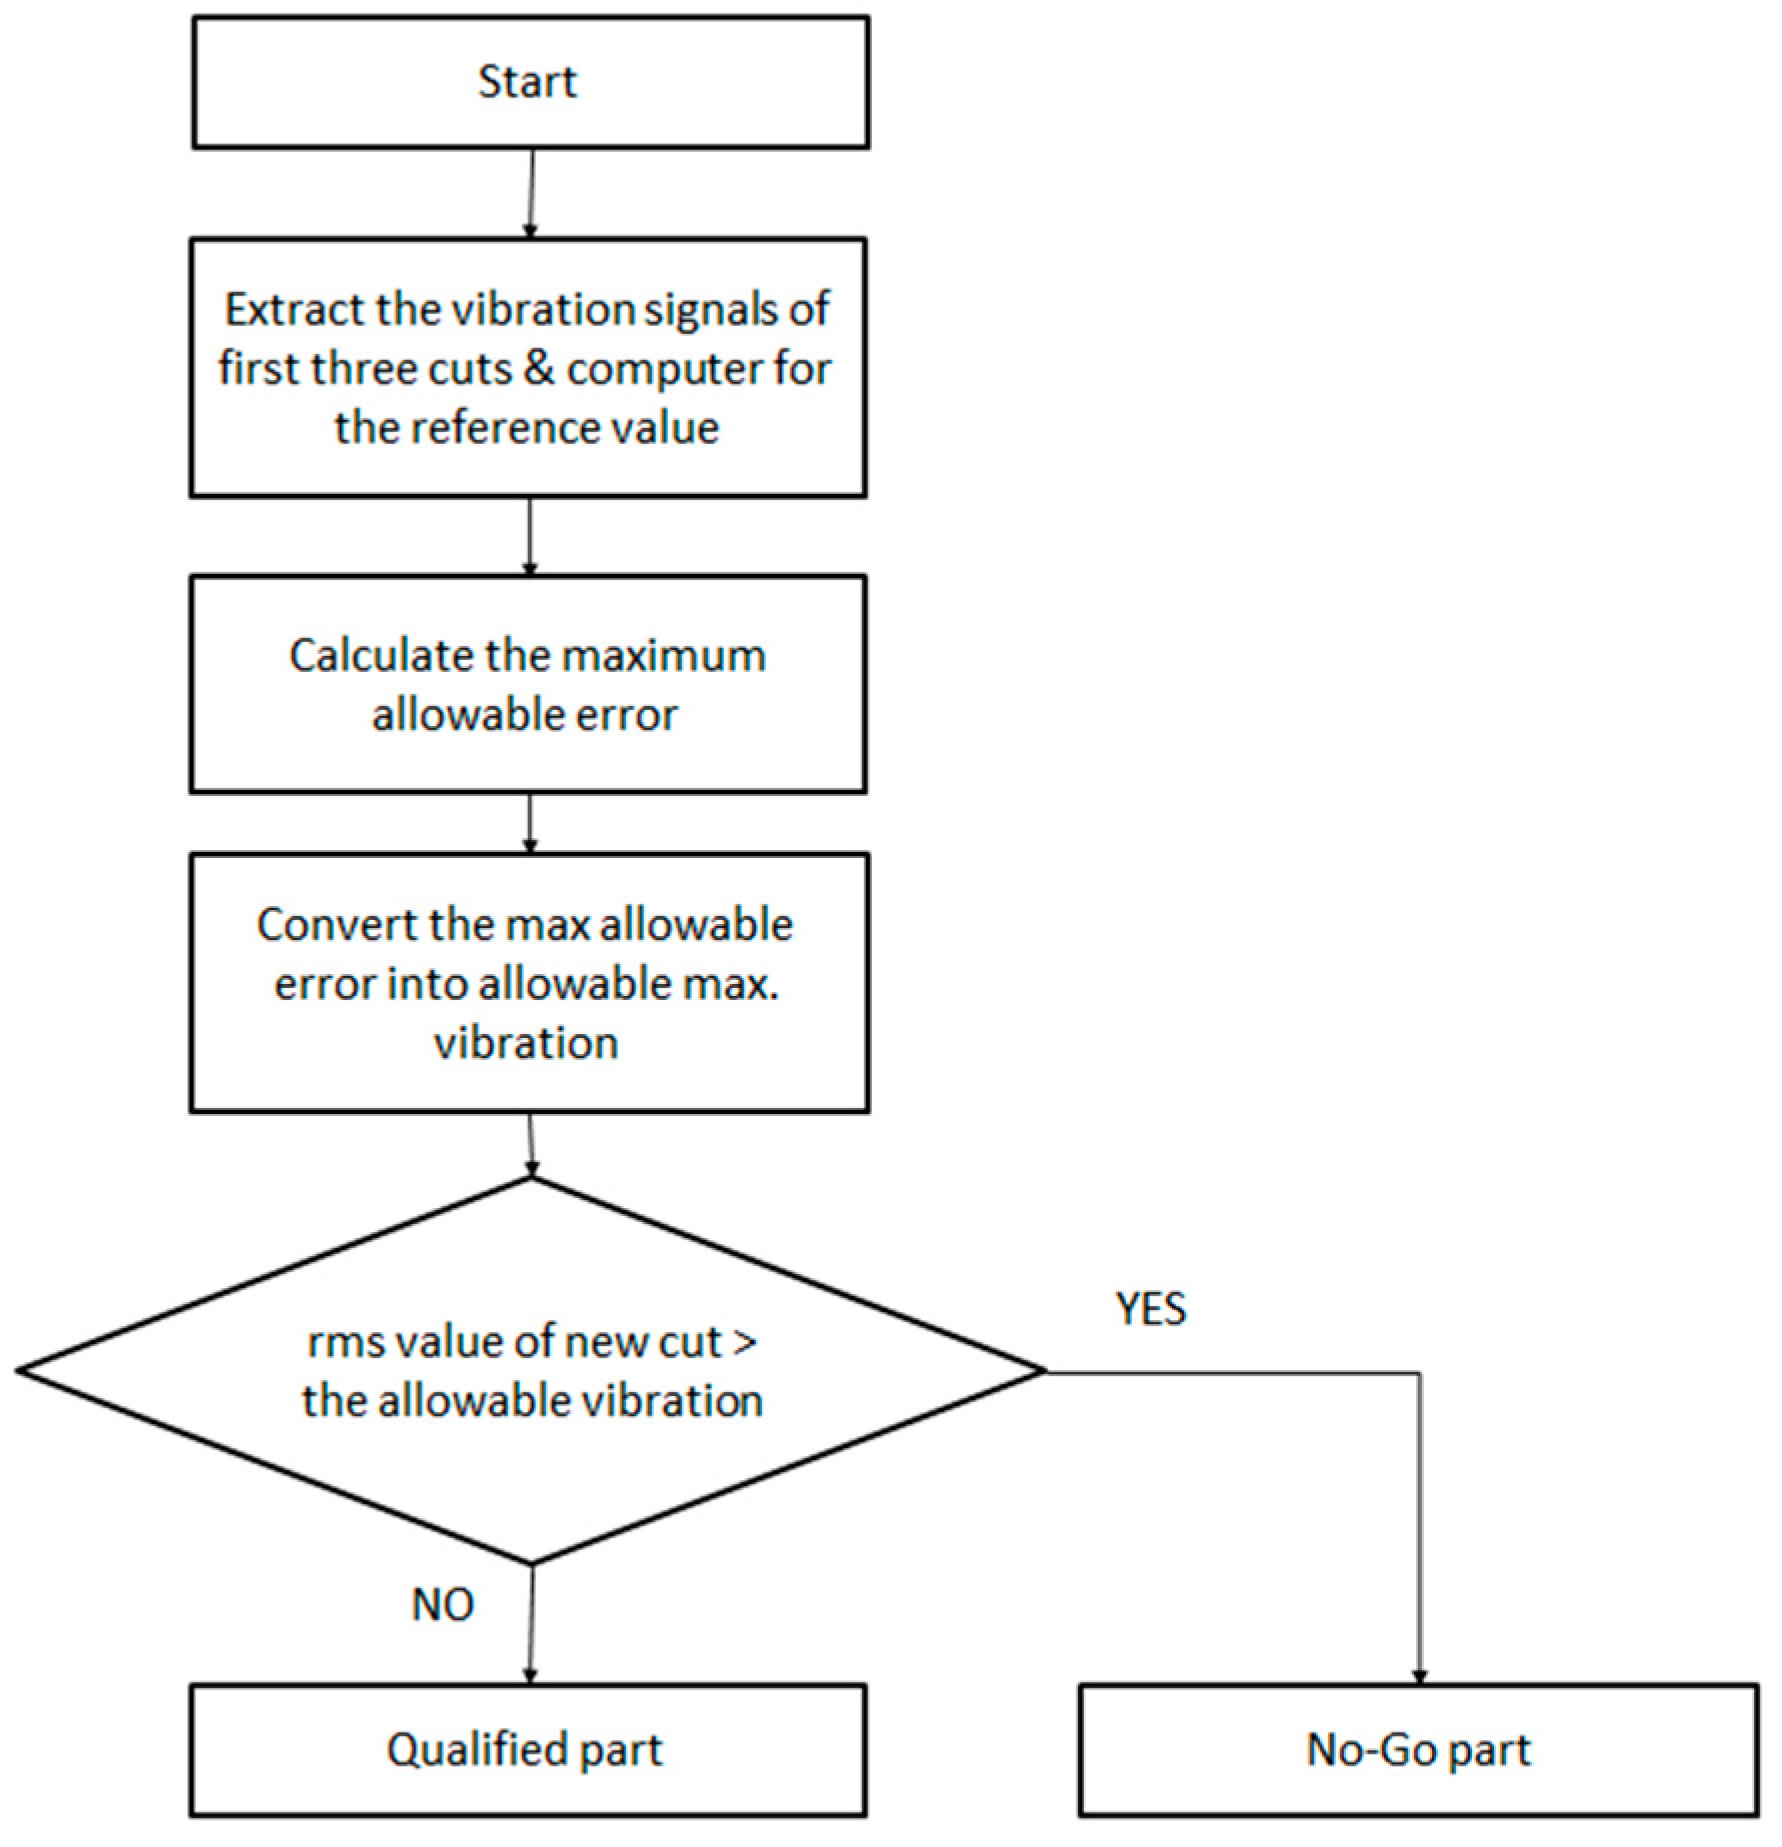
Figure 5, the tool wear of T03 increased slowly and stably when the accumulated wear was within the range of 40 μm to 77 μm. This period was regarded as the normal wear stage. The total number of cuts made within this range were 425 (from cut 51 to cut 476). The tool wear that happened at this stage was very small (<1 µm). After the 476th cut, the tool wear increased rapidly at about 90 μm for about 100 cuts. Since the required tolerances of the machining are ±10 μm for both the inner diameter and the outer diameter, it is easy to produce a No-Go (i.e., dimension accuracy not qualified) part when the accumulated wear of the cutter approaches 0.1 mm. Therefore, the cutter should be replaced at this time. According to the results, the tool life for T03 and T04 could be respectively defined as 450 cuts and 250 cuts.
Different levels of tool wear will cause different cutting resistances, which will generate different cutting vibrations. In order to use cutting vibration as the index for tool wear monitoring, it is necessary to understand the characteristics of the change in the cutting vibration pattern caused by tool wear. Thus, while conducting the preliminary experiments for the relationship between tool wear and the number of cuts, the associated cutting vibration signals were also on-line measured by the accelerators.
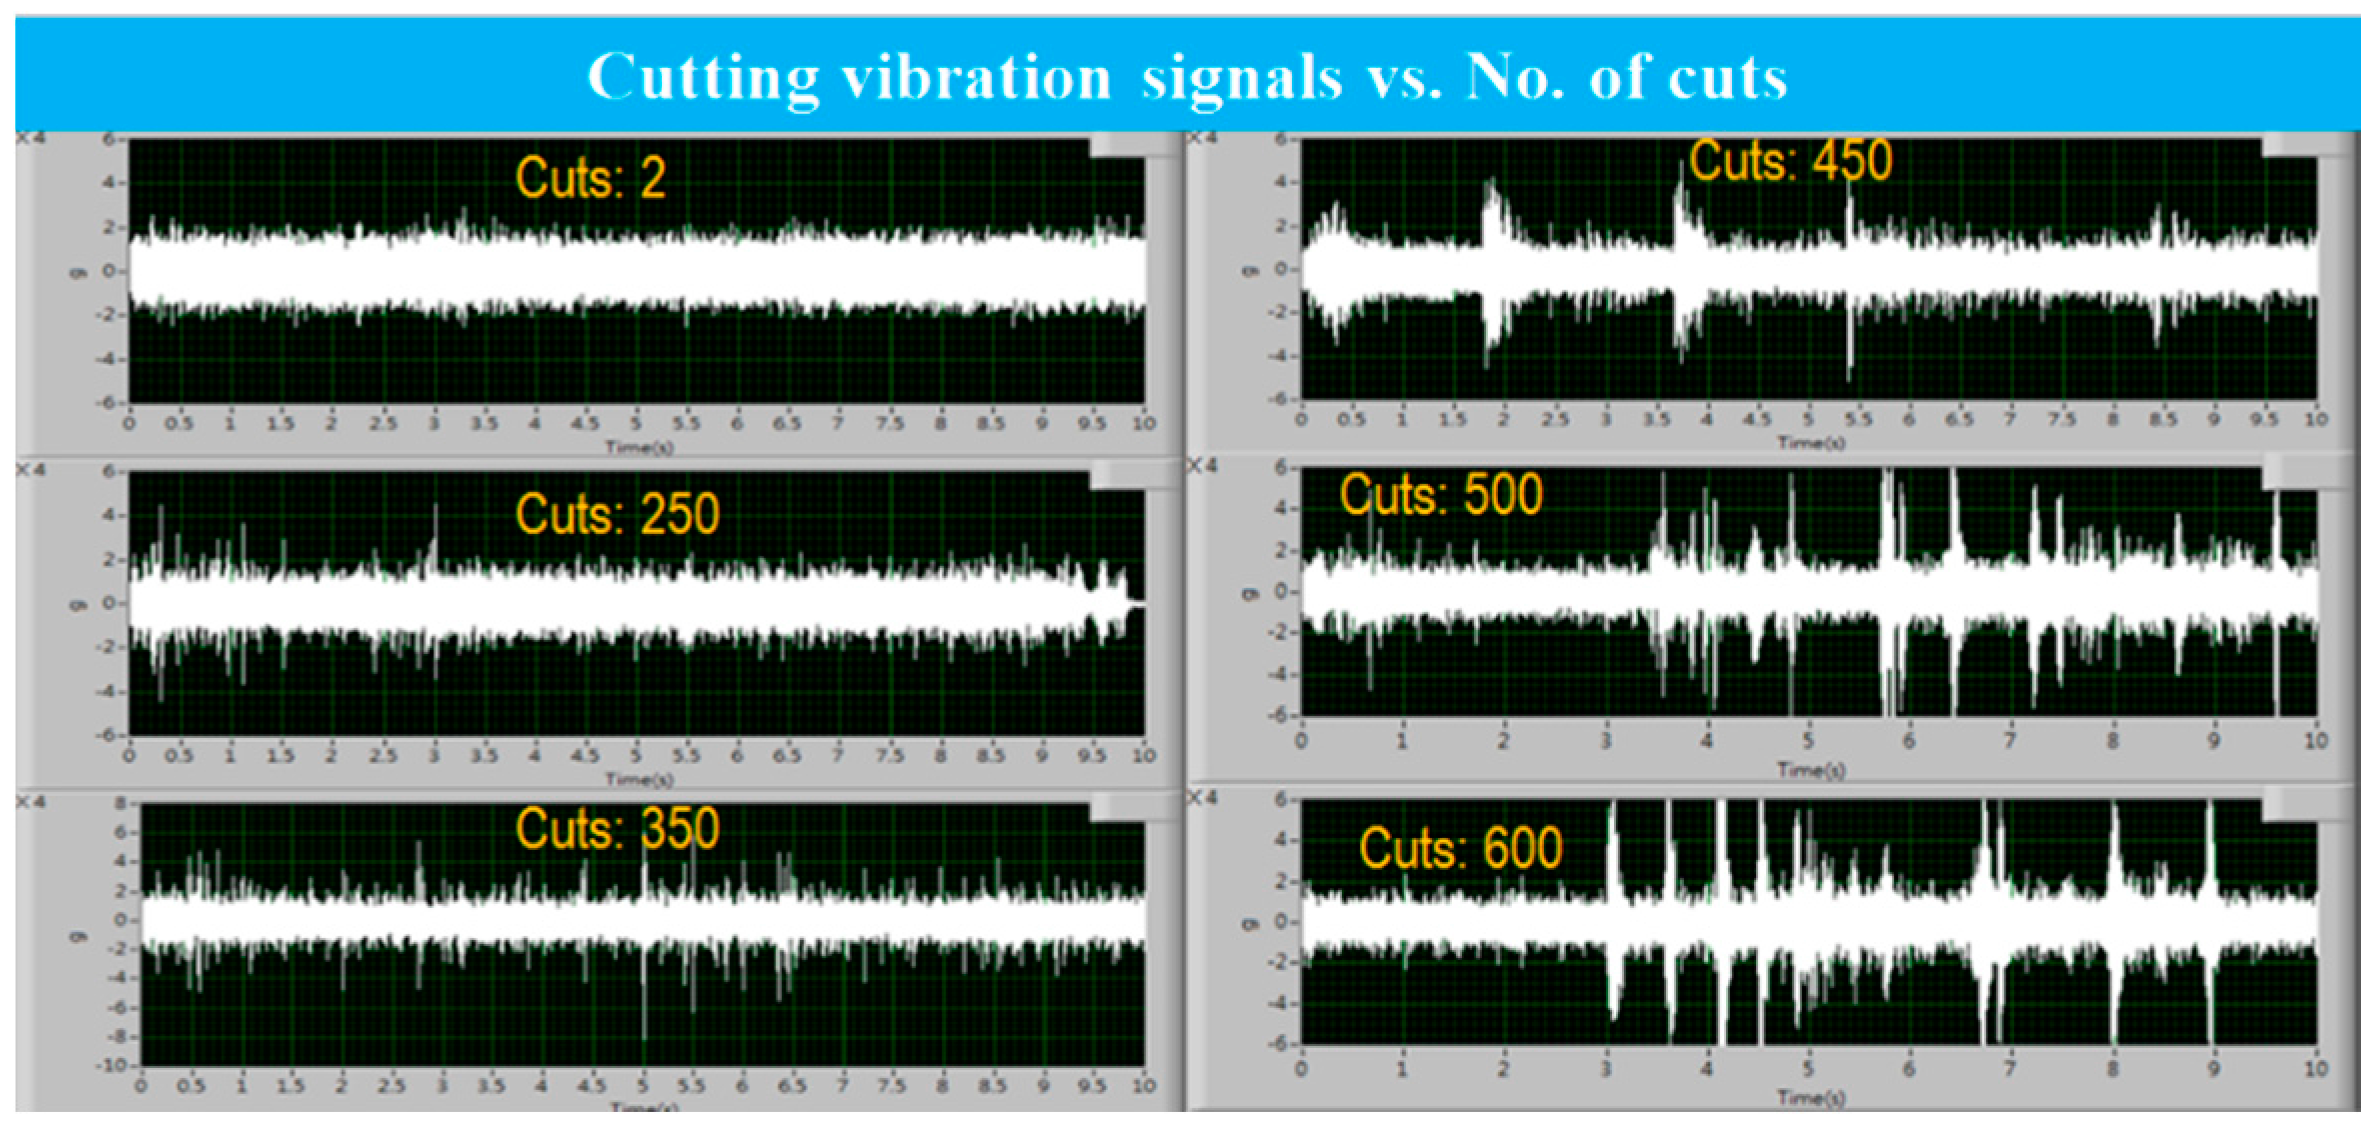
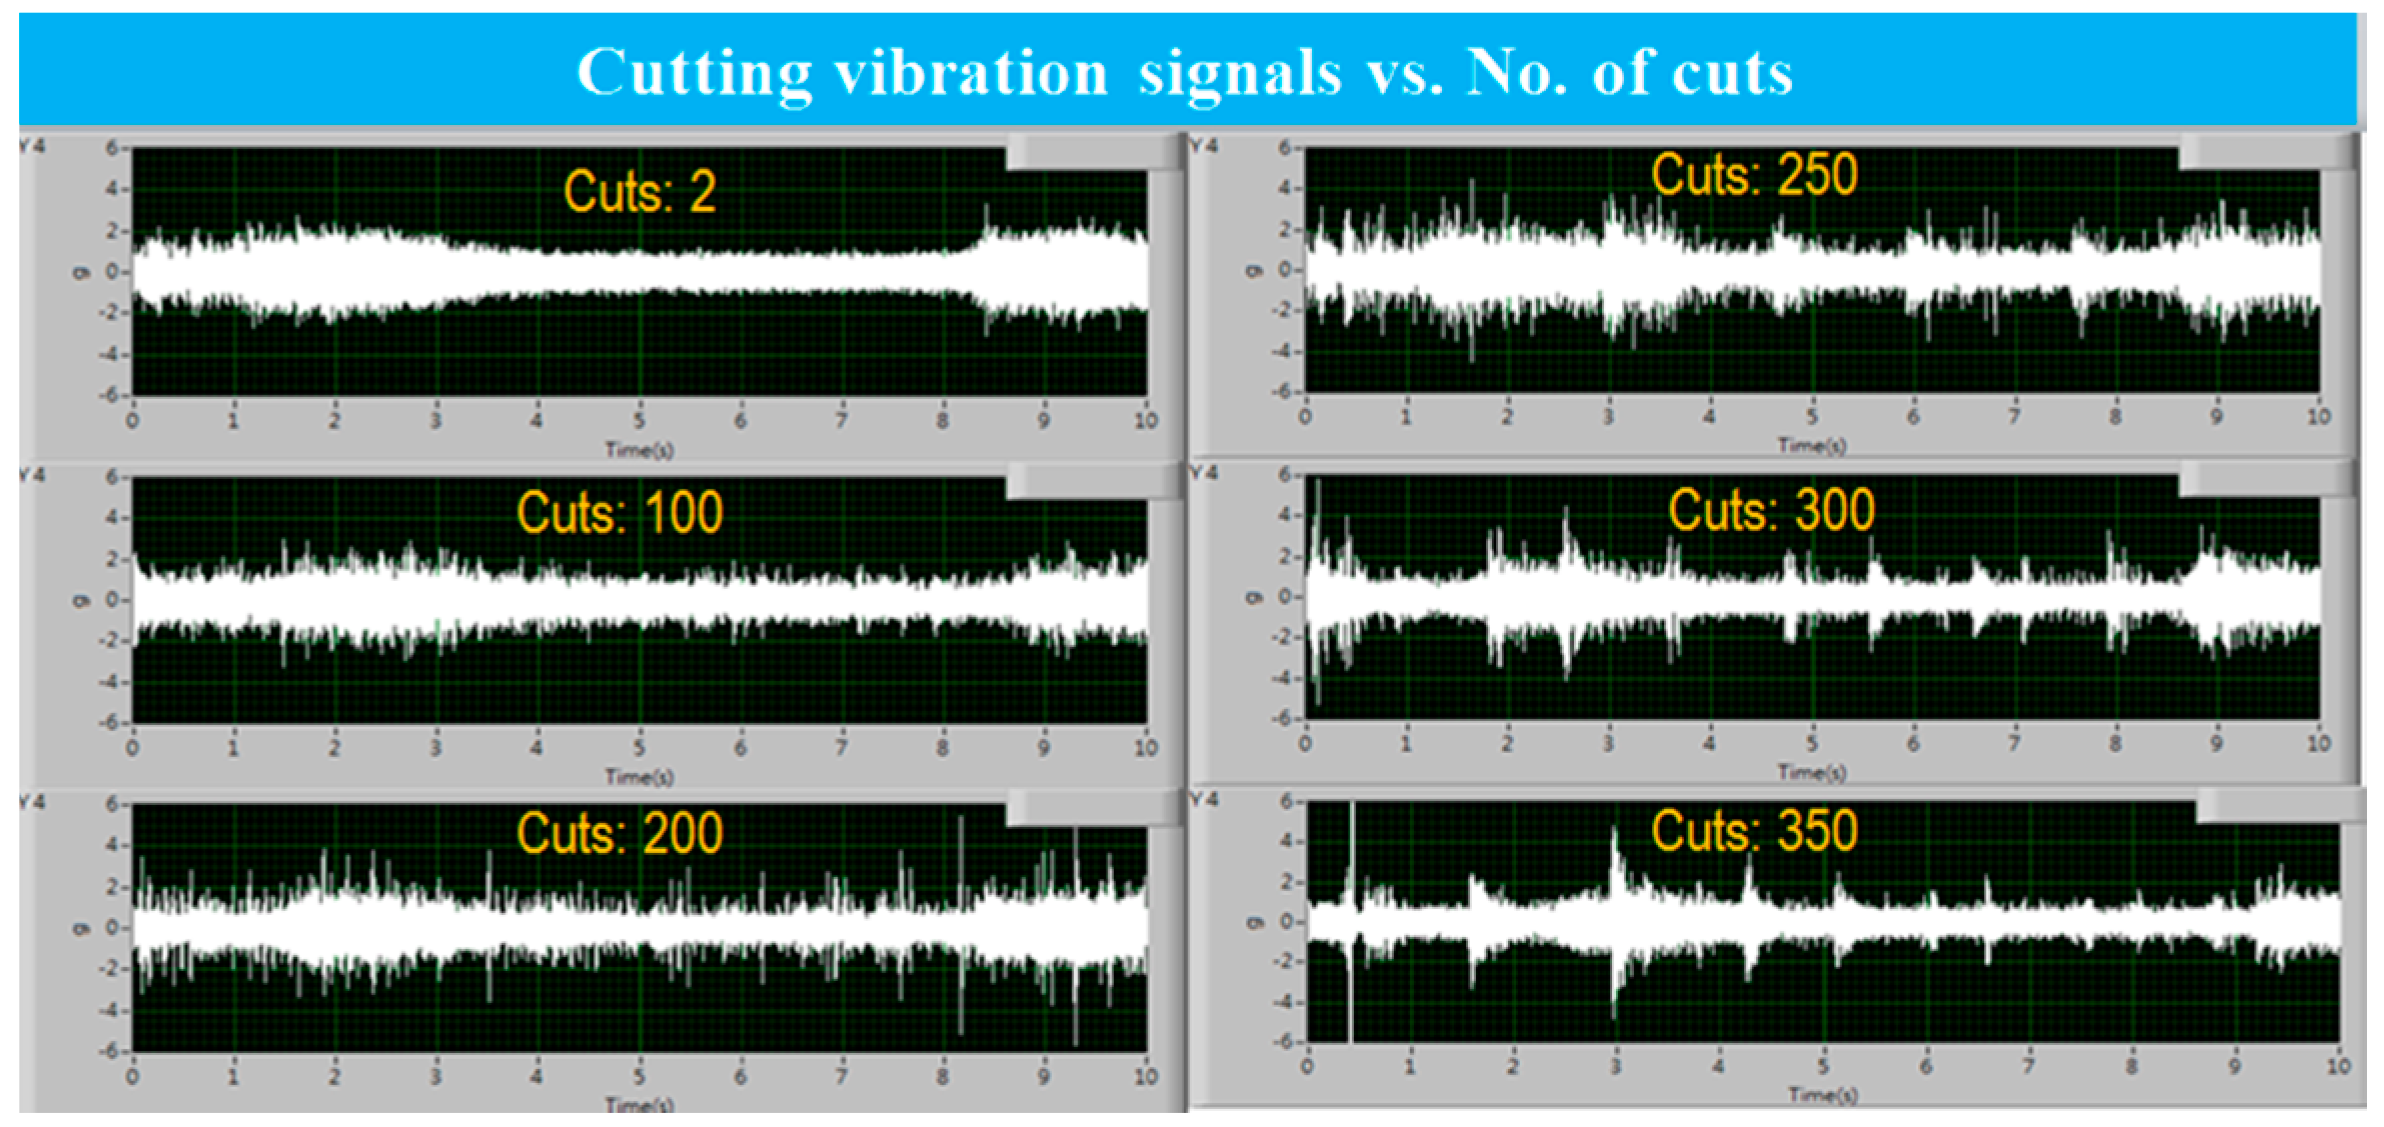
 Figure 7 and Figure 8, respectively, show the cutting vibration at different cuts of T03 and T03. It is noted that when the cutter showed light wear, the cutting vibration (<2 g) was quite stable (for cut 2 and 250 for T03; cut 2 and 100 for T04). As the tool wear increased, few significant vibrations (4 g) occurred (cut 200 for T03; cut 350 for T04). When the tool wear became greater, significant vibration occurred more frequently (this happened at cut 450 and 500 for T03 and cut 300 and 350 for T04). When comparing Figure 5 and Figure 6, it can be concluded that the significant vibrations were mainly caused by the tool wear. When significant vibration occurred frequently, the tool wear had reached 80 µm and up. According to the results, it can be concluded that the variation of vibration and the frequency of occurrence could be the two indexes for monitoring the status of tool wear. For a stable turning process, the tool wear can be predicted based on the number of cuts. Meanwhile, by checking the cutting vibration pattern, it is able to know whether the cutter has abnormal wear conditions. If a cutter is at the normal wear stage but is experiencing large vibrations, it means the cutter has an abnormal wear status.

3. Algorithms for On-Machine Inspection and Tool Wear Auto-Compensation

The on-line inspection algorithm for Go/No-Go (Go: dimension accuracy is qualified; No-Go: dimension accuracy is not qualified) and the algorithm of tool wear auto-compensation were developed based on the statistical analysis of experimental data.

3.1. Algorithm for On-Machine Dimension Error Inspection

For a stable cutting process, cutting force is mainly influenced by the depth of cut, the spindle speed and federate, while different cutting forces cause different cutting vibrations. Tool wear influences the dimension and geometry of a cutter. A worn turning cutter gives a smaller depth of cut, which will cause errors in the machined diameter of the work piece. In addition, different depths of cut cause different cutting forces which influence the cutting vibration. Therefore, it is possible to use cutting vibration to predict tool wear and, furthermore, to estimate the machining error caused by tool wear.
In the experiments, five depths of cut (0.08, 0.09, 0.1, 0.11, 0.12 mm) were chosen for T03 and T04. While turning, the cutting vibrations were measured and their root-mean-square (r.m.s.) values were calculated. Figure 9 and Figure 10 show the correlation between the cutting vibration and the depth of cut. As we can see from the two figures, the cutting vibration was about proportional to the depth of cut. The curves of T03 and T04 are very similar. When the depth of cut increased by 0.01 mm, the cutting vibration increased by about 0.05 g. To ensure the phenomenon shown in Figure 9 and Figure 10 is true and repeatable, 14 experiments were conducted, and all the results were very similar. It implies that the correlation between cutting vibration and depth of can be used to develop the algorithm for on-machine dimension error inspection. The inspection algorithm is designed as follows:
(i)
On-line extract the vibration signals (10-s length) of the first three cuts to compute the average r.m.s. value as the reference value.
(ii)
Calculate the maximum allowable error based on the tolerance error given by the customer.
(iii)
Convert the maximum allowable error into allowable vibration based on the curves shown in Figure 9 and Figure 10.
(iv)
On-line extract the vibration signals of the new cut. If the r.m.s. value of the cutting vibration of the new cut is greater than the allowable vibration, the machined work piece is a No-Go part. Otherwise, it is a qualified part.
Figure 11 shows the flowchart of the on-machine dimension error inspection.

3.2. Algorithm for Prediction and Auto-Compensation of Tool Wear

Tool wear is influenced by cutting resistance, cutting temperature, the geometry of the cutter, the material of the work piece and cutter, the cutting parameters, and the number of cuts, etc. Wear of a new cutter increases slowly at the beginning, and will increase rapidly after many cuts are performed. If a machining process is stable and has high repeatability, the tool wear can usually be described with a model developed with regression analysis and the curve fitting method. Thus, it is feasible to use regression analysis and curve fitting methods with the experimental data of tool wear to build an empirical model for tool wear prediction and compensation. With 17 sets of experimental data for each process, Figure 12 and Figure 13 show the statistics of tool wear for T03 and T04, respectively. For T03, after 500 cuts, the accumulated tool wear was about 90 µm. For T04, after 300 cuts, the accumulated tool wear was about 75 µm. In addition, it can be seen that both T03 and T04 show good stability and repeatability in their tool wear trends. For the same number of cuts, the variation of tool wear was 11 μm for T03 and 13 μm for T04, which is smaller than the allowable tolerance of dimension (15 μm). Thus, it makes it possible to build regression models based on the experimental data for tool wear prediction. With the use of the curve fitting method, Equations (1) and (2), which respectively describe the relationship between tool wear and the number of cuts for T03 and T04, were obtained.
y = −7 × 10−14x6 + 1 × 10−10x5 – 9 × 10−8x4 + 3 × 10−5x3 − 6.6 × 10−3x2 + 0.8672x + 6.5828
y = −2 × 10−12x6 + 2 × 10−9x5 – 9 × 10−7x4 + 2 × 10−4x3 − 0.0192x2 + 1.2403x + 1.7959
where y represents tool wear (µm), and x represents number of cuts. For a stable turning process, if the number of cuts is known and substituted into Equations (1) and (2), the tool wear can be predicted and used for compensation. The compensation value is directly sent to CNC controller to offset the position of the cutter. Because the predicted wear is an accumulated value, the compensation value should be the difference between the current wear and the previous wear. Based on Equations (1) and (2), Figure 14 and Figure 15 show the tool wear curves (to be used as a compensation reference) for T03 and T04.
The effectiveness of the tool wear compensation also depends on the machine accuracy. If the tool wear is less than the machine’s positioning accuracy, the compensation can be skipped until the accumulated wear is greater than the machine’s positioning accuracy. Because of it, the compensation strategy is designed based on when the consecutive cuts have very similar tool wear (difference < 1 µm); the accumulated tool wear of those cuts are regarded as identical so that the compensation values calculated based on the tool wear curves for those cuts are zero. The green curves with a step-shape in Figure 14 and Figure 15 represent this compensation strategy.
Equations (1) and (2) are good for a stable tool wear condition. Due to the imperfect manufacturing of the cutter or unexpected errors, a cutter may have abnormal wear which is different from the predicted wear solved by Equations (1) and (2). As aforementioned, tool wear could affect the depth of cut. If abnormal tool wear occurs, the cutting vibration patterns collected on-line will be different from that in Figure 7 and Figure 8. Thus, it is necessary to on-line monitor the cutting vibration for tool wear prediction instead of only using Equation (1) and (2). When abnormal tool wear happens, the monitoring system should send an alarm message to operators/engineers to double-check. The algorithms for the prediction and auto-compensation of tool wear are as follows:
(i)
Get the number of cuts from the CNC controller.
(ii)
Input the number of cuts into Equation (1) and (2) to compute for the current tool wear.
(iii)
Calculate the difference between the current tool wear and the previous tool wear, and use it as the compensation value.
(iv)
On-line monitor the cutting vibration, and check whether it is an abnormal vibration.
(v)
If it is not an abnormal vibration, send the compensation value to the CNC controller to offset the cutter for the next machining application; If it is an abnormal vibration, send an alarm message to notify the operator that abnormal tool wear is occurring.

4. Bilateral Communication Module

To directly communicate the CNC controller for the extraction of machining information for tool wear monitoring and auto-compensation, a bilateral communication module that can call the Application Programming Interface (API) to extract instantly executing NC codes, the true spindle speed and feedrate for dimensional error inspection and tool wear monitoring (Figure 16) was developed based on FANUC Open CNC API Spec and Ethernet protocol. The module can also extract other instant machining information and control parameters from the CNC controller. The module enables the proposed system to remote control the on-machine monitoring process and upload the machining and inspection data to the remote central platform for further production optimization. Figure 17a is the human-machine interface containing the on-line extracted information, such as the coordinates of the cutter, the machining parameters, and the CNC control parameters, etc. Furthermore, the module can synchronously communicate with several machines for production line monitoring and control. Figure 17b is the screen showing several machines simultaneously connected and monitored.

5. Human-Machine Interface

According to the developed algorithms, a system with on-machine inspection functions for machining errors, on-machine monitoring of tool wear, and auto-compensation of tool wear, was built in C# language. To provide a convenient operation, a human-machine interface was built in C# to easily connect to a data acquisition device and a CNC controller for bilateral data transmission. Moreover, it also provides access for executing the proposed functions. Figure 18 shows the developed human-machine interface, and Figure 19 shows the flowchart of the function execution.

6. Experimental Verification

Two experiments, including on-machine machining error (diameter error) inspection and on-machine tool wear monitoring auto-compensation, were conducted to verify the feasibility and effectiveness of the proposed algorithms and the developed system. The automotive component part shown in Figure 1 was the tested work piece, because the component was produced in a mass production line. The experiments were directly applied to the two finish turning processes for T03 and T04. Table 1 shows the experiment conditions. The tolerance of the inner and outer diameters is ±6 µm. Two accelerometers were attached to the cutter post to on-line collect the cutting vibration signals for monitoring. Meanwhile, machining information, such as instantly executing NC codes, machining parameters, etc., were also extracted with the bilateral communication module as a reference for monitoring.

6.1. On-Machine Machining Error (Diameter Error) Inspection

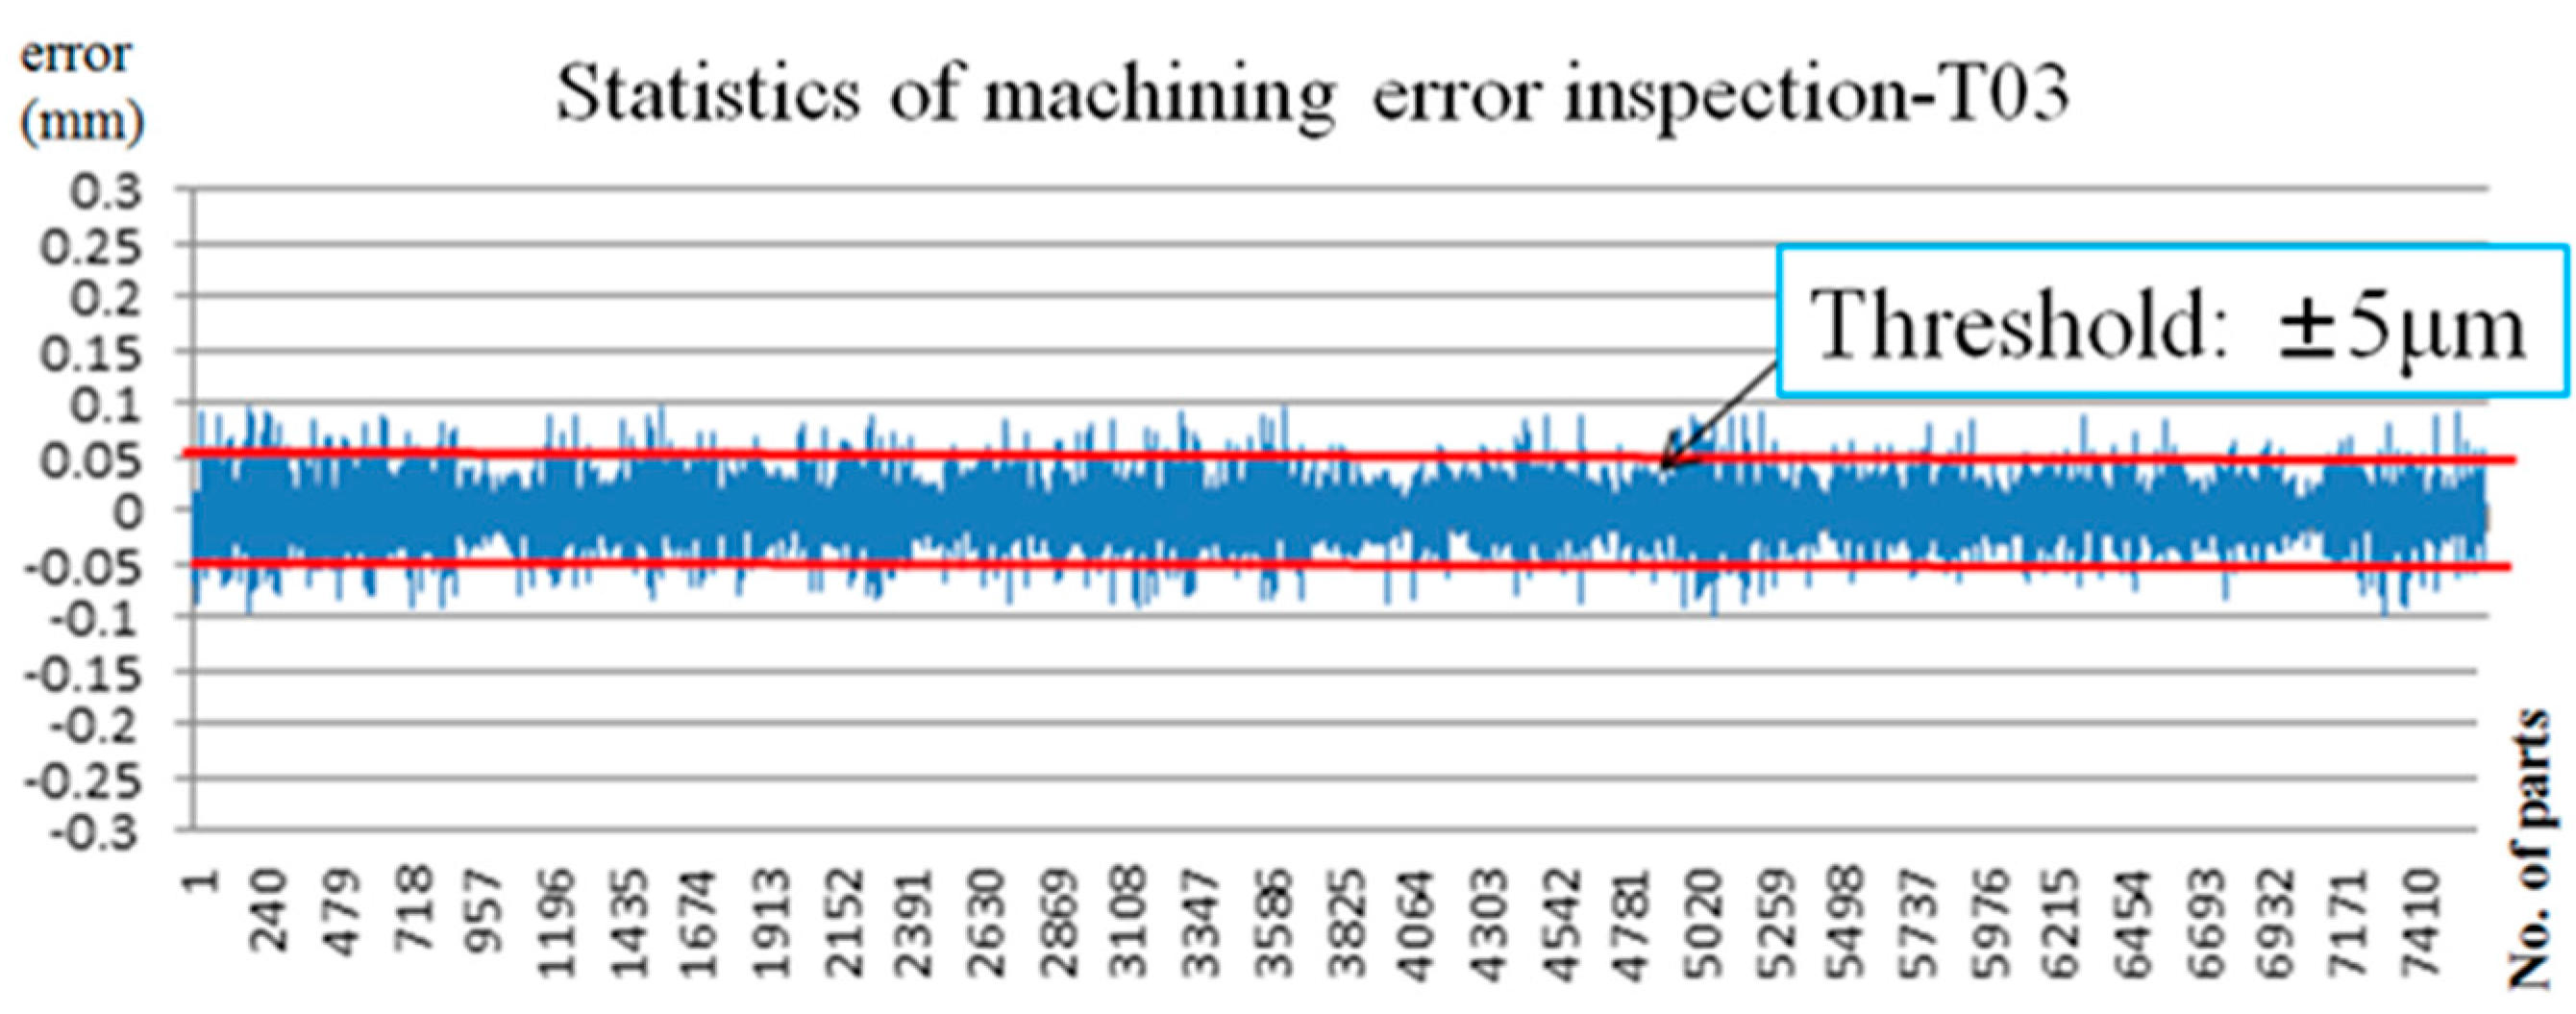
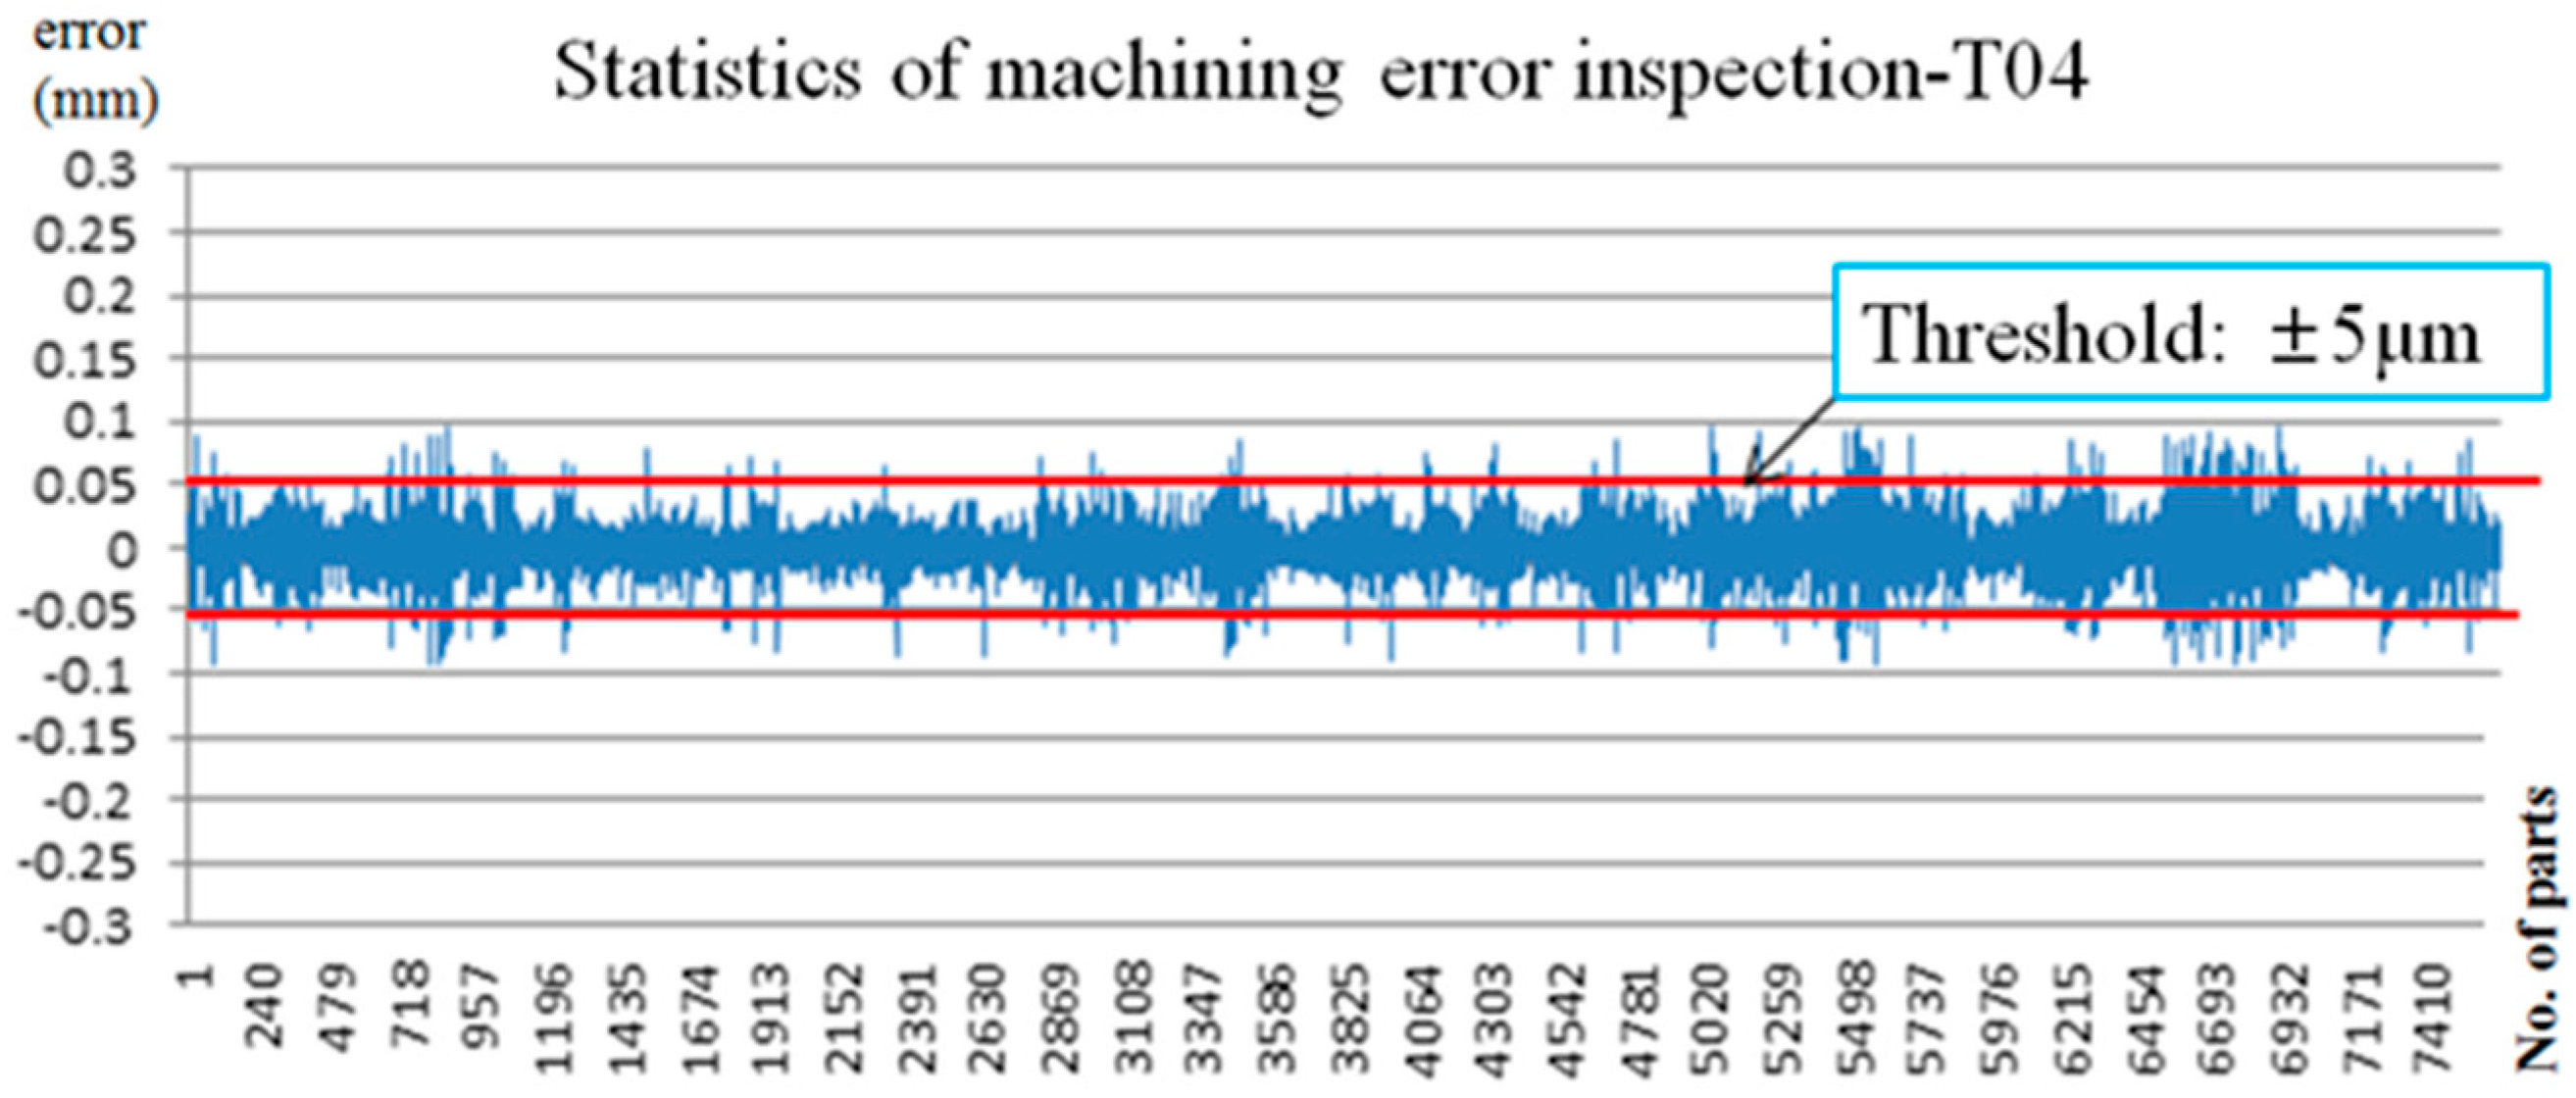
In this experiment, the on-machine machining error auto-inspection function was applied to the production line of GlobalTek Co. (Taoyuan, Taiwan) to verify the effectiveness of the inspection function. A total of 7643 components were tested in this experiment. The inspection results made by the auto-inspection function were compared to that made using the air gauge instruments, which were originally used by the company. The threshold value of the inspection was set to ±5 µm. Of the produced components, 93% were qualified, and 7% of the produced components were inspected as No-Go parts. The results were very close to the results made using the air gauge instruments. It shows that the proposed function can be used to replace the original manual inspection process made with air gauge instruments. It saved work hours and manufacturing cost for the production. Figure 18 shows the inspection results.
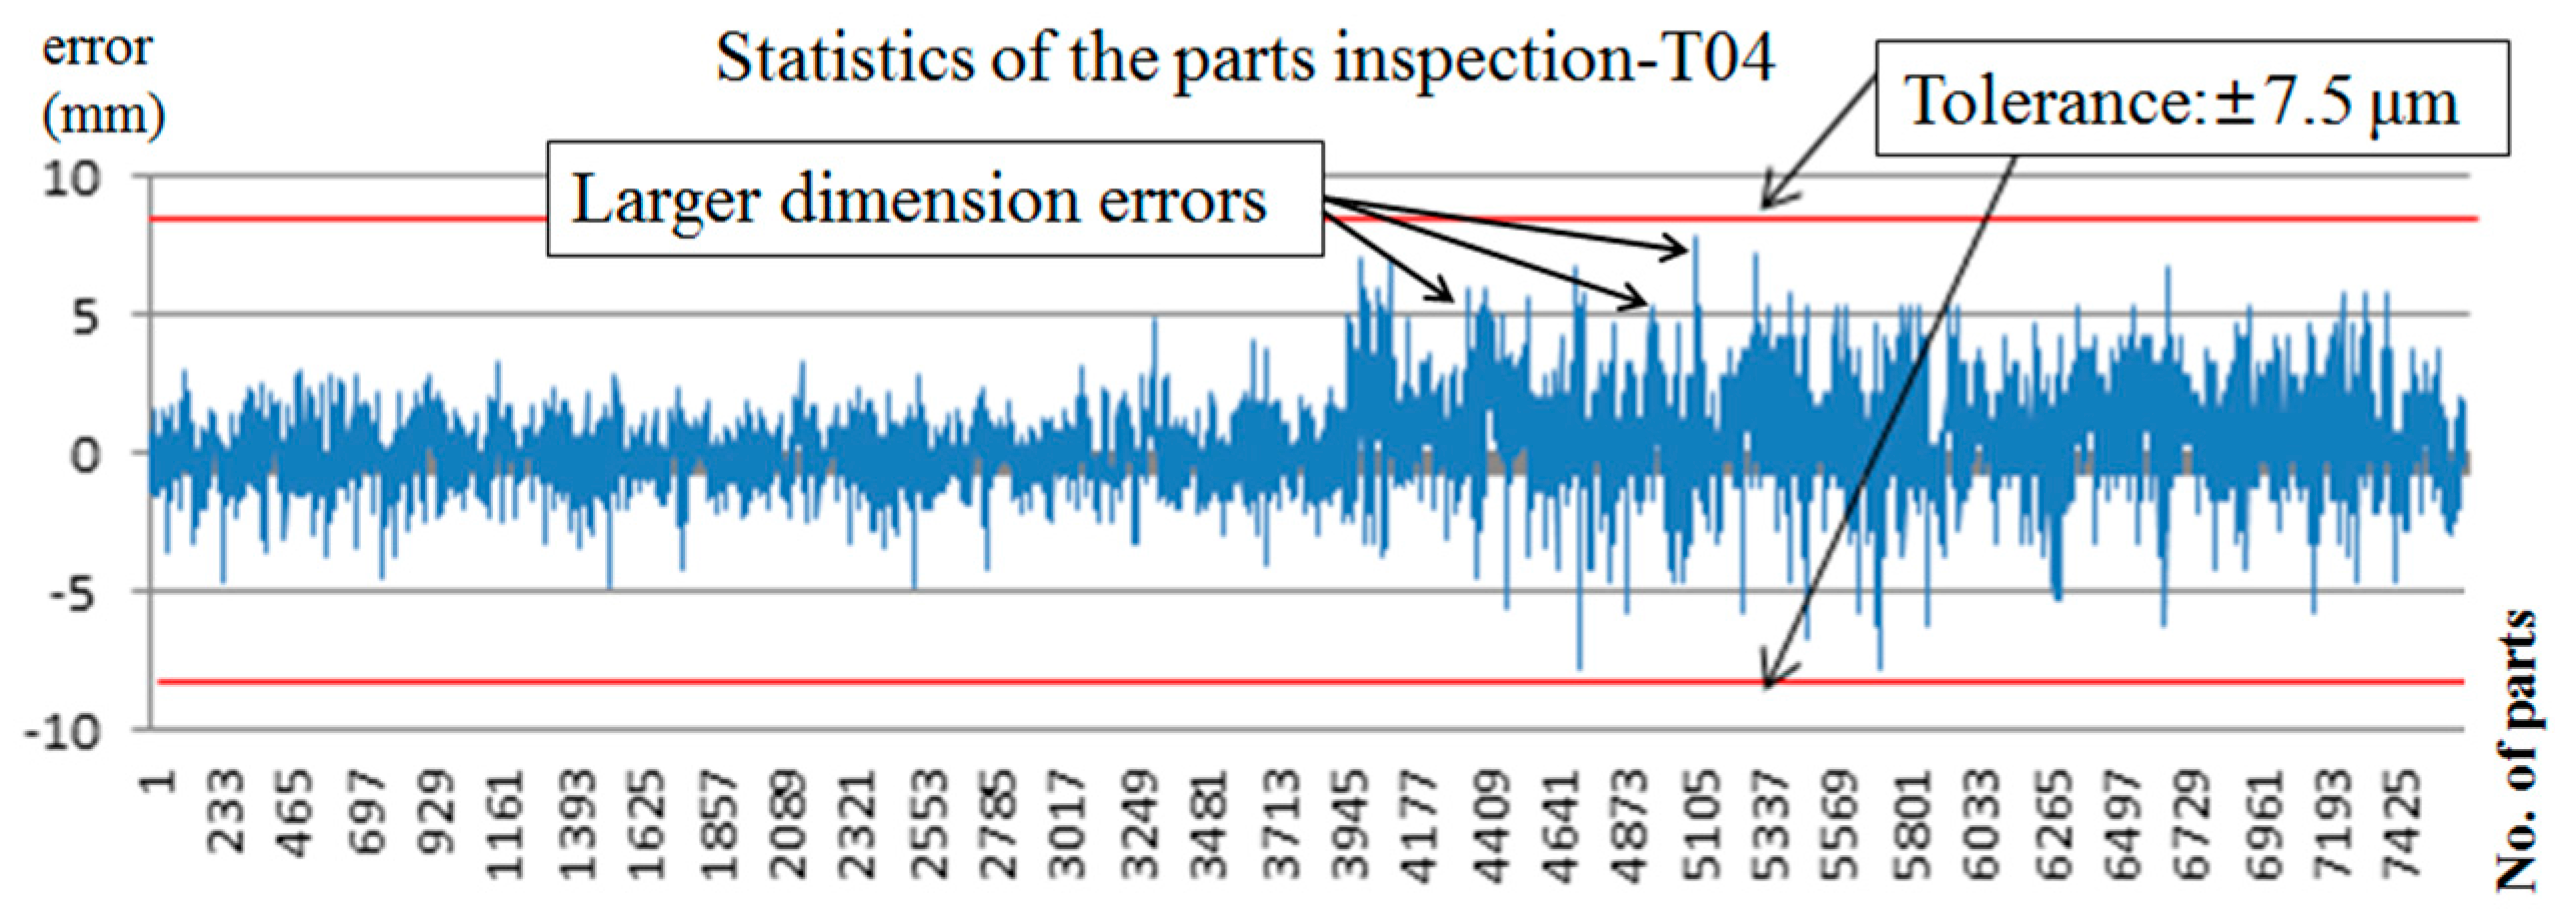
 Figure 20 and Figure 21 show the statistics of the inspection of T03 and T04, respectively.

6.2. On-Machine Tool Wear Monitoring and Auto-Compensation

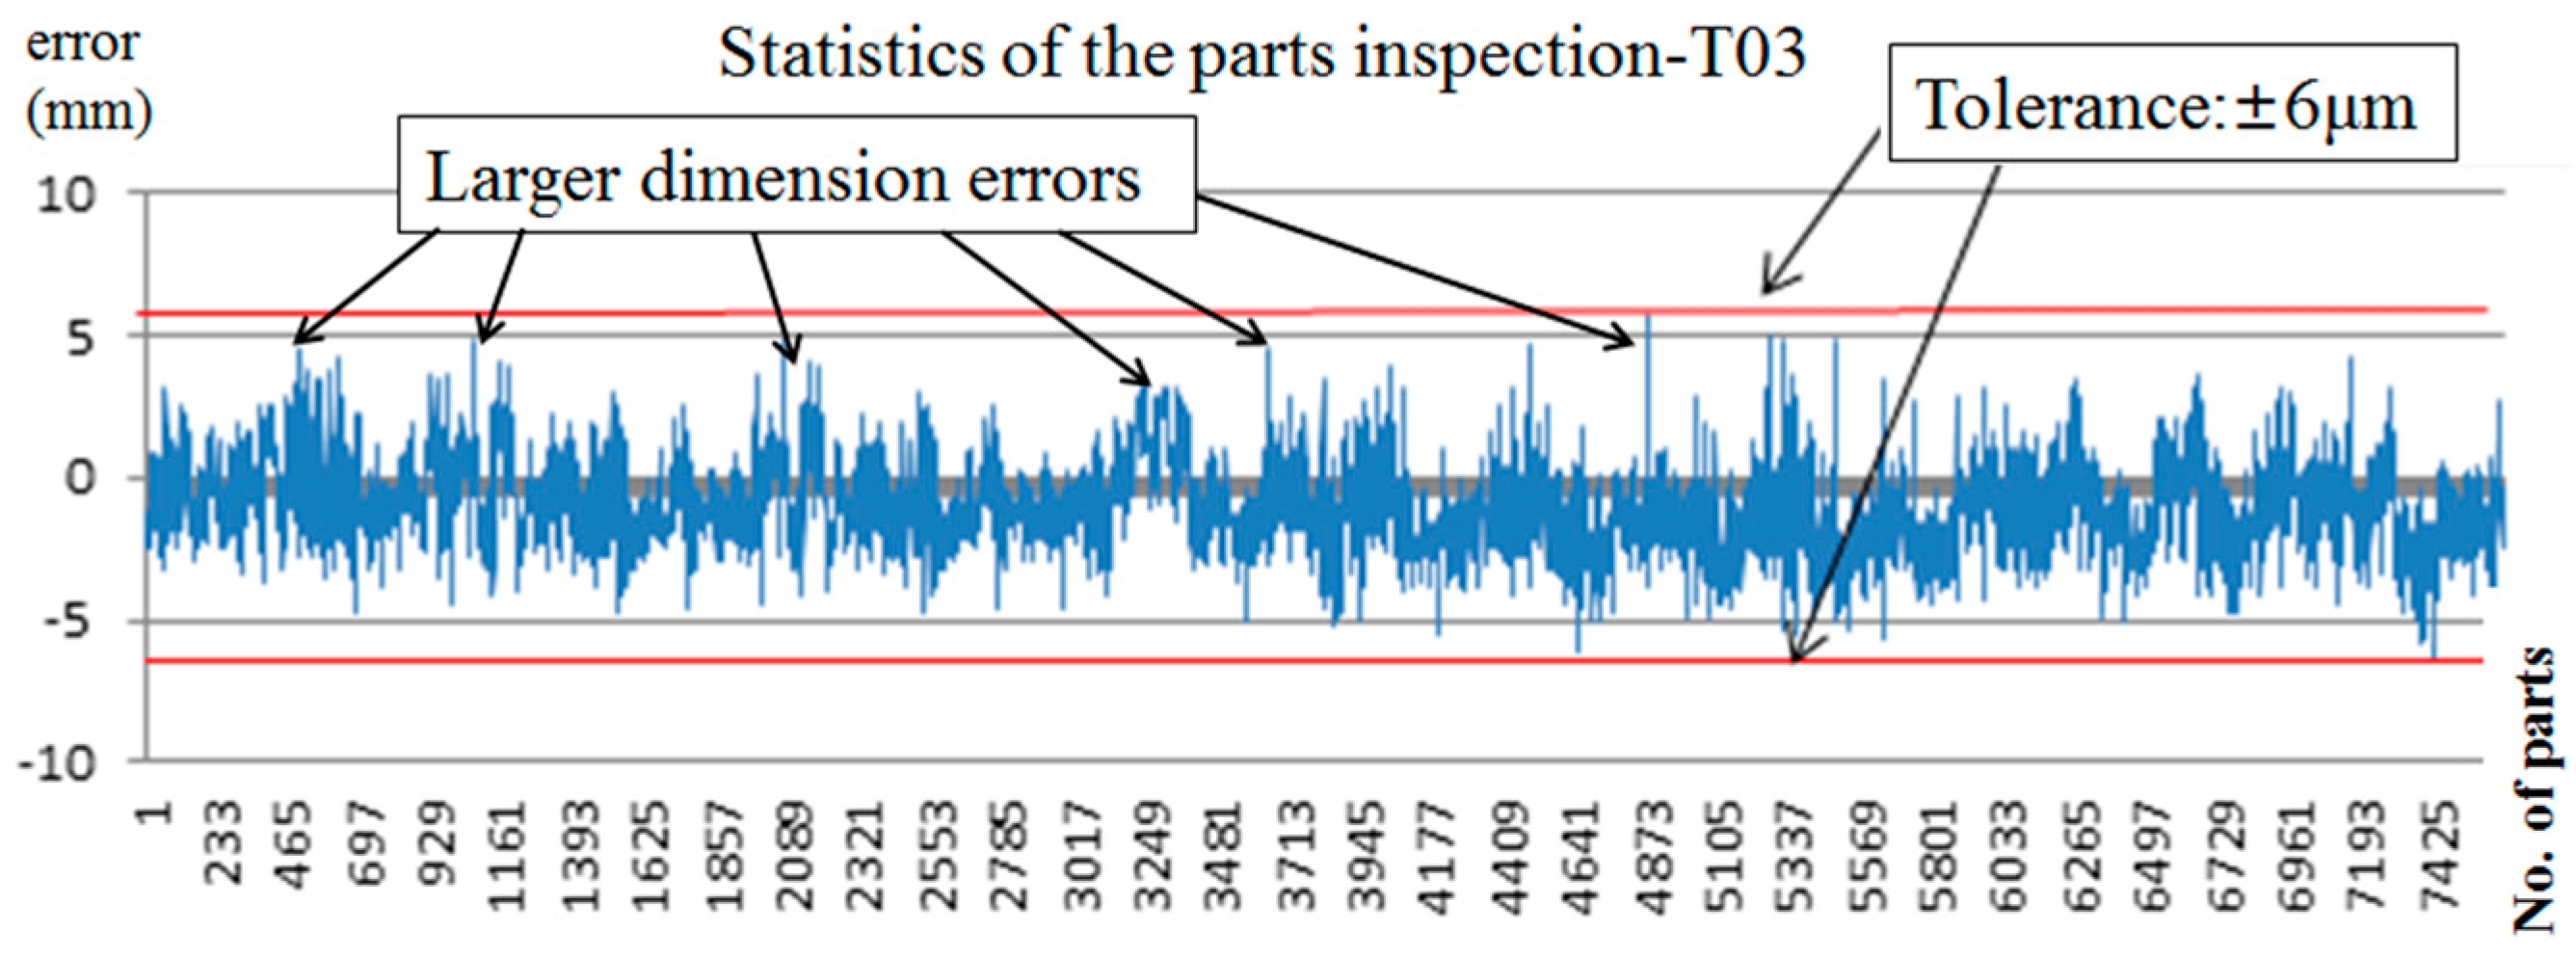
In this experiment, the two functions, on-machine auto-monitoring and auto-compensation of tool wear, were used in the production line of GlobalTek Co. to verify the effectiveness and feasibility of the two functions. Except for the tolerances (T03: ±6 μm; T04: ±7.5 μm), the same machining conditions as shown in Table 1 were used. Another 7643 components were tested in this experiment. With use of the proposed system, the tool wear of each cut was predicted and auto-compensated to the CNC controller of the turning machine for the next component.
Figure 22 and Figure 23 show the statistics of the dimension inspection results made with the air gauge instruments. It can be seen that all the machined components matched the requirement for dimension tolerance. It was also noted that most of the parts had dimension errors of about 2–3 μm. Because of the tool wear, some parts had larger dimension errors of about 4–5 μm, but they all still met the tolerance requirement. The results showed that the two functions (on-machine auto-monitoring and auto-compensation of tool wear) can provide appropriate prediction and compensation of tool wear for each cutting process.
According to the verification results, it showed that the proposed method is suitable for on-line monitoring/compensation for a mass production line. The proposed method is mainly based on the correlation between the variation of cutting vibration signals (detected by the vibration sensors), cutter wear, and machining errors. However, very light tool wear causes very little change in cutting vibration, which it may not be possible to clearly detect using a vibration sensor if the sensitivity of the sensor used is not fine enough. Therefore, the possible limitation of this method is the sensitivity of the selected vibration sensors. The better the sensors, the higher the cost. Thus, the vibration sensors should be selected based on the requirements of the machining process.

7. Conclusions

This study developed an intelligent system with functions of on-machine error inspection and auto-monitoring/auto-compensation of tool wear for precision tuning processes. With the use of vibration signal processing/characteristics analysis technology, combined with ICT, statistical analysis and diagnosis algorithms, the system can proceed with on-line dimension error inspection and on-line tool wear auto-compensation for turning processes. The system can also monitor the critical tool life such that the appropriate time for cutter replacement can be identified to reduce manufacturing costs and improve the production efficiency of a turning process. Algorithms for on-machine dimension error inspection and tool wear auto-compensation were proposed. Based on the algorithms, the system was built in C# language. The results of the verification experiments showed that the developed functions provided correct inspection and appropriate tool wear compensation for turning processes in order to save manufacturing time and costs.

Acknowledgments

This study was supported by Ministry of Science and Technology under the grant number MOST 104-2221-E-033-010 and MOST 104-3011-E-033-001, and by Industrial Technology Research Institute under the program The features of Multi-coupling Dynamic Signal Analysis Technology.

Author Contributions

S.-M.W. conceived and designed the method and algorithm. Y.-S.C. and C.-Y.L. conducted the experiments. Y.-S.C. and C.-C.W. analyzed the data. S.-M.W. and C.-C.Y. wrote the paper.

Conflicts of Interest

The authors declare no conflict of interest.

References

  1. Garg, A.; Tai, K. Stepwise approach for the evolution of generalized genetic programming model in prediction of surface finish of the turning process. Adv. Eng. Software 2014, 78, 16–27. [Google Scholar] [CrossRef]
  2. Garg, A.; Lam, J.S.L.; Gao, L. Energy conservation in manufacturing operations: Modelling the milling process by a new complexity-based evolutionary approach. J. Clean. Prod. 2015, 108, 34–45. [Google Scholar] [CrossRef]
  3. Garg, A.; Lam, J.S.L. Improving environmental sustainability by formulation of generalized power consumption models using an ensemble based multi-gene genetic programming approach. J. Clean. Prod. 2015, 102, 246–263. [Google Scholar] [CrossRef]
  4. Garg, A.; Vijayaraghavan, V.; Wong, C.H.; Tai, K.; Gao, L. An embedded simulation approach for modeling the thermal conductivity of 2D nanoscale material. Simul. Model. Pract. Theory 2014, 44, 1–13. [Google Scholar] [CrossRef]
  5. Garg, A.; Vijayaraghavan, V.; Lam, J.S.L.; Singru, P.M.; Gao, L. A molecular simulation based computational intelligence study of a nano-machining process with implications on its environmental performance. Swarm Evol. Comput. 2015, 21, 54–63. [Google Scholar] [CrossRef]
  6. Usui, T.S. Analytical prediction of cutting tool wear. Wear 1984, 100, 129–151. [Google Scholar] [CrossRef]
  7. Dimla, E.; Snr, D. Sensor signals for tool-wear monitoring in metal cutting operations—A review of methods. Int. J. Mach. Tools Manuf. 2003, 40, 1073–1098. [Google Scholar] [CrossRef]
  8. Li, D.; Mathew, J. Tool wear and failure monitoring techniques for turning—A review. Int. J. Mach. Tools Manuf. 1990, 30, 579–598. [Google Scholar]
  9. Choi, G.S.; Wang, Z.X.; Dornfeld, D.A.; Tsujino, K. Development of an intelligent on-line tool wear monitoring system for turning operations. In Proceedings of the USA-Japan Symposium on Flexible Automation, Asia Pacific Rim Conference ISCIE, Kyoto, Kyoto, Japan, 18–20 June 1990; pp. 683–690.
  10. Prickett, P.W.; Johns, C. An overview of approaches to end milling tool monitoring. Int. J. Mach. Tools Manuf. 1999, 39, 105–122. [Google Scholar] [CrossRef]
  11. Risbood, K.A. Prediction of surface roughness and dimensional deviation by measuring cutting forces and vibrations in turning process. J. Mater. Process. Technol. 2003, 132, 203–214. [Google Scholar] [CrossRef]
  12. Panda, S.S.; Singh, A.K.; Chakraborty, D.; Pal, S.K. Drill wear monitoring using back propagation neural network. J. Mater. Process. Technol. 2004, 172, 283–290. [Google Scholar] [CrossRef]
Figure 1. Automotive component used in the study.
Applsci 06 00107 g001
Figure 2. Setup of cutter and accelerometers.
Applsci 06 00107 g002
Figure 3. Correlation of depth of cut and cutting vibration for the machining process T03.
Applsci 06 00107 g003
Figure 4. Correlation of depth of cut and cutting vibration for machining process T04.
Applsci 06 00107 g004
Figure 5. Tool wear vs. number of cuts of T03.
Applsci 06 00107 g005
Figure 6. Tool wear vs. number of cuts of T04.
Applsci 06 00107 g006
Figure 7. Cutting vibration vs. number of cuts for machining process T03.
Applsci 06 00107 g007
Figure 8. Cutting vibration vs. number of cuts for machining process T04.
Applsci 06 00107 g008
Figure 9. Cutting vibration vs. depth of cut for T03.
Applsci 06 00107 g009
Figure 10. Cutting vibration vs. depth of cut for T04.
Applsci 06 00107 g010
Figure 11. Flowchart of on-machine dimension inspection.
Applsci 06 00107 g011
Figure 12. Statistics of tool wear for T03.
Applsci 06 00107 g012
Figure 13. Statistics of tool wear for T04.
Applsci 06 00107 g013
Figure 14. Tool wear curve for T03.
Applsci 06 00107 g014
Figure 15. Tool wear curve for T04.
Applsci 06 00107 g015
Figure 16. The communication module extracts information for monitoring/compensation.
Applsci 06 00107 g016
Figure 17. Bilateral communication module for computer numerical control (CNC) controller. (a) On-line extracted information from CNC controller; (b) The module synchronously communicates with several machines.
Applsci 06 00107 g017
Figure 18. Human-machine interface of the monitoring system.
Applsci 06 00107 g018
Figure 19. Flowchart of the function execution.
Applsci 06 00107 g019
Figure 20. On-machine machining inspection result for T03.
Applsci 06 00107 g020
Figure 21. On-machine machining inspection result for T04.
Applsci 06 00107 g021
Figure 22. Statistics of parts inspection for T03.
Applsci 06 00107 g022
Figure 23. Statistics of parts inspection for T04.
Applsci 06 00107 g023
Table 1. Machining conditions.
ItemDescription
Turning cutterTungsten Carbide with CVD coating
Material of workpieceS27 low-carbon steel
Machining typeInner and out diammeters (T03: inner dia.; T04: outer dia)
Depth of cut0.1 mm
Cutting length12 mm
Spindle speed1500
federate0.15 mm/rad
Cutting fluidyes
Tolerance± 6 µm

