Abstract
This article reviews the size-dependent structural properties of ion beam synthesized Co nanoparticles (NPs) and the influence of ion irradiation on the size, shape, phase and structure. The evolution of the aforementioned properties were determined using complementary laboratory- and advanced synchrotron-based techniques, including cross-sectional transmission electron microscopy, small-angle X-ray scattering and X-ray absorption spectroscopy. Combining such techniques reveals a rich array of transformations particular to Co NPs. This methodology highlights the effectiveness of ion implantation and ion irradiation procedures as a means of fine tuning NP properties to best suit specific technological applications. Furthermore, our results facilitate a better understanding and aid in identifying the underlying physics particular to this potentially technologically important class of nanomaterials.
1. Introduction
In recent years the advantageous optical, electrical and magnetic properties of nanoparticle-based materials have made them the focus of an intensive research effort in a range of scientific disciplines. In particular, the drive for further miniaturization of electronic, magnetic and photonic devices has led to numerous experimental and theoretical efforts to understand the physical properties of various metal and semiconductor nanoparticles (NPs) with emphasis on the effects of size, shape and host matrix (see for example [1–7]). Furthermore, metallic NPs embedded in a dielectric host matrix (such as SiO2) are of particular interest as their unique nonlinear opto-electrical properties have direct applications in nano-electronic devices (e.g., in optical memories, nonlinear waveguide devices and optical switches) [8].
The size-dependent structural, and vibrational properties of metallic NPs differ considerably compared to those of their bulk counterparts. Such differences stem from a large fraction of surface atoms compared to the NP volume, or large surface-to-bulk ratio (SBR). The large SBR typically results in a depression in the melting temperature of metallic NPs [9–11] and structural deviations including reduced coordination number and increased structural disorder [12].
Of the many different metallic NPs studied, Co NPs have attracted particular attention due to their size, shape, and phase-dependent magnetic properties [13,14] leading to potential applications in biomedicine [15] and magnetic storage technology [16]. Co NPs can exist in either the hexagonal closed packed (HCP), face-centered cubic (FCC), body-centered cubic (BCC), or epsilon ϵ (similar to the β phase of Mn [13]) phases, the relative stability of which depends on the route of formation [17–19] host matrix [20–22] and thermal history [23,24]. Of these four phases, HCP has the highest coercive field [13,25] and is thus the most obvious candidate for ultrahigh-density recording applications. Co nanorods and nanowires also exhibit unique perpendicular magnetic anisotropy, coercivity, remanence, and activation volumes that are heavily dependent on the nanorod length (or equivalently, major diameter) [26]. Novel methods to tailor and control the structure and shape of Co NP ensembles are thus of paramount importance if they are to be successfully implemented into future magnetic devices.
An emerging technique that is particularly useful in modifying the various properties of NPs is the combination of ion implantation and ion irradiation. Ion implantation is in fact a well established technique in the semiconductor integrated-circuit manufacturing industry and is now routinely used to introduce dopants, modify electrical properties and promote compound formation (to name but a few applications).
As an ion passes through a solid, energy is transferred to the host lattice via interactions with target nuclei (nuclear energy loss (Sn)) and target electrons (electronic energy loss (Se)). The Sn and Se components of the stopping power of Au ions in Co as a function of ion energy are shown Figure 1. The energy dependence of the two contributions are evident with Sn dominating in the low energy ion irradiation (LEII) region (keV to low MeV), while above ∼30 MeV in the swift heavy ion irradiation (SHII) region the energy loss is predominantly Se.
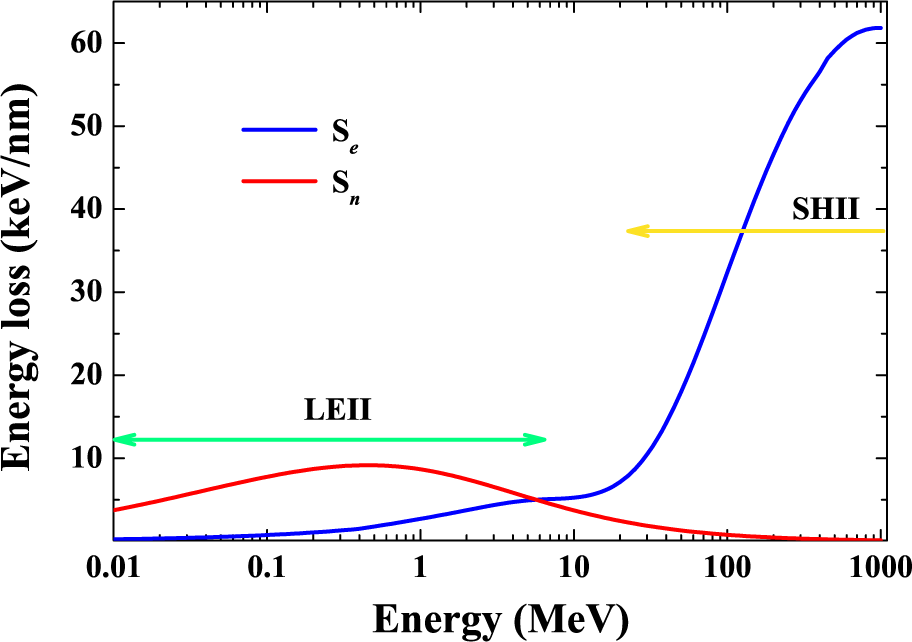
Figure 1.
Electronic and nuclear energy loss, Se and Sn, respectively, as a function of ion energy for Au in a Co matrix.
In the LEII regime, collisions with target nuclei may result in the formation of amorphous zones/clusters [27] and the accumulation of such zones may produce the amorphous phase. The open nature of the diamond structure and poor damage regeneration due to directional bonding in bulk semiconductors enhances the irradiation-induced disorder leading to the formation of the amorphous phase. The close-packed, non-directional bonding in metals however have strong damage regeneration, and irradiation-induced disorder rapidly regenerates and amorphisation is generally not achieved.
In the SHII regime the ionization and electronic excitation processes are dominant. Two competing models are usually proposed to account for the formation of ion tracks and SHII-induced damage: the “Coulomb explosion” [28,29] and “thermal spike” [30,31] models. The former is based on the electrostatic repulsion between the ions generated in the wake of the incident projectile and can lead to the disruption of the initial position of lattice atoms. In contrast, for the latter, energy is transferred to the lattice via electron-phonon coupling and the resulting rapid increase in local temperature (or thermal spike) can yield a molten ion track of several nanometres in diameter [32].
In this article, we review the effects of ion irradiation on the shape and structural properties of Co NPs in SiO2 formed by ion implantation and thermal annealing. We identify various irradiation energy-dependent shape and structural changes demonstrating the usefulness of ion irradiation as a method of fabricating Co NPs with specific crystallographic phase, size and shape. The evolution of the NP shape and structure were characterized by cross-sectional transmission electron microscopy (XTEM), small-angle X-ray scattering (SAXS), and X-ray absorption spectroscopy (XAS). The experimental and analytical conditions are described in Section 2. In Section 3, we present a detailed characterisation of the as-prepared Co NPs. In Sections 4 and 5 we discuss, respectively, the effects of LEII and SHII on the crystallographic phase of Co NPs. In Section 6, we describe the effects of SHII on the shape and structure of the embedded NPs, and finally, in Section 7 we conclude.
2. Experimental Section
Co NP samples were prepared by implanting Co ions at either liquid-N2 temperature or 400 °C into 2 μm thick SiO2 layers thermally grown on Si (100) substrates. Implantation energies ranged from 416–1,400 keV with fluences varying from 3.8 × 10¹⁵ to 3.0 × 10¹⁷/cm2. The resulting peak Co concentrations ranged from 0.3 to 9.0 at.% as calculated by TRIM [33]. Samples were then annealed at 800–1,100 °C under forming gas (5% H2 + 95% N2) for 1 h to promote Co precipitation and NP growth.
Selected samples were then irradiated at room temperature with 197Au ions at energies of 9, 27, 54, 89, 110 and 185 MeV, where the ion penetration depth was beyond that of the NP distribution. The range, Se and Sn for Au ions in a-SiO2 and Co, as calculated by TRIM [33], are listed in Table 1.

Table 1.
Parameters for Au ions in SiO2 and Co calculated by TRIM [33].
The NP shape and size were quantified with XTEM and SAXS, respectively. XTEM samples were prepared entirely at or below room temperature to stem thermal effects. Electron transparency was achieved with conventional mechanical thinning, polishing, and dimpling followed by ion milling at liquid-N2 temperature with 3.5 keV Ar ions at an incident angle of 4°. XTEM bright-field images and electron diffraction (ED) patterns were acquired using a Phillips CM300 microscope operating at 300 kV.
For the synchrotron measurements, two unique sample preparation methods [34,35] were used to isolate the thin SiO2 layer containing the Co NPs. For XAS samples, the Si substrate was initially removed through mechanical grinding and selective wet chemical etching with KOH, and then multiple NP rich SiO2 layers were stacked together between two Kapton windows. As a consequence, considerable NP material was concentrated within the sample holder, scattering from the Si substrate was eliminated, and high-resolution measurements were enabled. For the SAXS measurements the thick Si substrate was thinned by mechanically grinding to a thickness of ∼200 μm. A concavity of ∼150 μm in depth was then formed in the Si substrate using a dimple grinder. The sample was finally placed in a KOH solution, and etched until a ∼1 mm window in the SiO2 was formed. This sample preparation methodology results in a self-supporting and substrate-free NP rich thin SiO2 layer for fast, high-contrast transmission SAXS measurements.
Bulk Co XAS standards were prepared by thermal evaporation of a Co film 250 nm onto a SiO2/Si wafer followed by the plasma-enhanced chemical vapor deposition of a SiO2 capping layer. To produce HCP material, samples were annealed at 400 °C in N2 to remove disorder and any residual FCC component. FCC material was prepared by rapid thermal annealing at 900 °C in N2 followed by rapid quenching. The purity of each phase was confirmed with x-ray diffraction.
Fluorescence-mode XANES and EXAFS measurements were performed at beamline 20-B of the Photon Factory, Japan. Samples were measured at the Co K-edge (7.709 keV) between temperatures of 15 and 300 K. Spectra were recorded using a 6 × 6 pixel-array Ge detector with the Si (111) monochromator detuned by 50% for harmonic rejection. Data were collected to a photoelectron wavenumber (k) value of 17 Å−1. For energy calibration, a Co HCP reference foil was simultaneously measured in transmission mode.
Background subtraction, spectra alignment and normalization of the EXAFS data were performed with ATHENA [36]. The position of the Co K-edge was determined from the maximum of the first derivative of the absorption spectra. Isolated EXAFS spectra were then Fourier-transformed (FT) over a k range of 3.3–15.3 Å−1 with an adaptive Hanning window and back FT over a non-phase-corrected radial distance (R) range of 1.6–2.7 Å to isolate the first nearest neighbor (NN) shell. Structural parameters were determined with ARTEMIS [36] utilizing the IFEFFIT [37] code with theoretical scattering amplitudes and phase shifts calculated ab initio with the FEFF8 code [38]. The amplitude reduction factor
was determined for the HCP metal standard (0.80 ± 0.02) and then fixed for the subsequent fitting of all NP spectra. The energy shift parameter (E0) was fitted for the standards and then fixed for the NP samples. The coordination number (CN) was set to 12 for the FCC and HCP standards and fitted for the NP samples. The bondlength (BL), DebyeWaller factor (σ2), and third cumulant (C3) were also fitted. All data sets were fitted with multiple k-weights of 1–4 to reduce inter-parameter correlation.
For the measurement-temperature-dependent EXAFS analysis, the evolution of the first NN structural parameters was determined by analysing each data set over the 15–300 K temperature range individually with the CN and E0 fixed to the values determined from the lowest-temperature data (15 K). The BL, C3 and σ2 were allowed to vary freely and the temperature dependence of σ2 and C3 were fit with a correlated Einstein model (Equations (1) and (2)) to determine the static and temperature dependent contributions to the total σ2 and C3.
Transmission SAXS measurements were performed at beamline 15ID-D of the Advanced Photon Source, Argonne, IL, using 11.27 keV X-rays (1.1 Å wavelength). The scattering intensity I(Q) was collected for 5 s at a camera length of 1,871 mm. A scattering spectrum from an unimplanted SiO2 layer was subtracted from all NP spectra. The maximum entropy method (MEM) [39,40] was used to determine the NP size distribution.
3. Formation of Cobalt Nanoparticles by Ion Implantation
3.1. Introduction
In this section, the evolution of Co NPs as a function of the formation conditions is characterised to identify the relative influences of the processing parameters. Using SAXS and XAS in combination with XTEM, the variation of the NP size, phase and structural parameters is investigated. EXAFS is also used to probe the vibrational properties of Co NPs and determine size- and phase-dependent Einstein temperatures.
3.2. Results
Representative XTEM images and corresponding volume-weighted size distributions determined from the SAXS analysis for three samples are shown in Figure 2. The NPs shown in Figure 2 were formed by implanting (a) 3.0 at.% Co and annealing at 800 °C for 1 h; (c) implanting 4.5 at.% Co at 400 °C; and (e) 3.0 at.% Co and annealing at 1100 °C for 1 h. The NPs increase in size with concentration and annealing temperature. The NP sizes are listed in Table 2 (these samples will be used in later sections to demonstrate the various size-dependent responses of Co NPs to ion irradiation). In this section we only focus on samples that have been annealed after implantation, since the as-implanted samples have a considerable fraction of Co atoms in an oxidised state. The fraction of oxidised Co atoms were progressively converted to the metallic HCP and FCC phases with an increase in temperature. The relative fraction of HCP and FCC phases was governed by both concentration and annealing temperature [41].
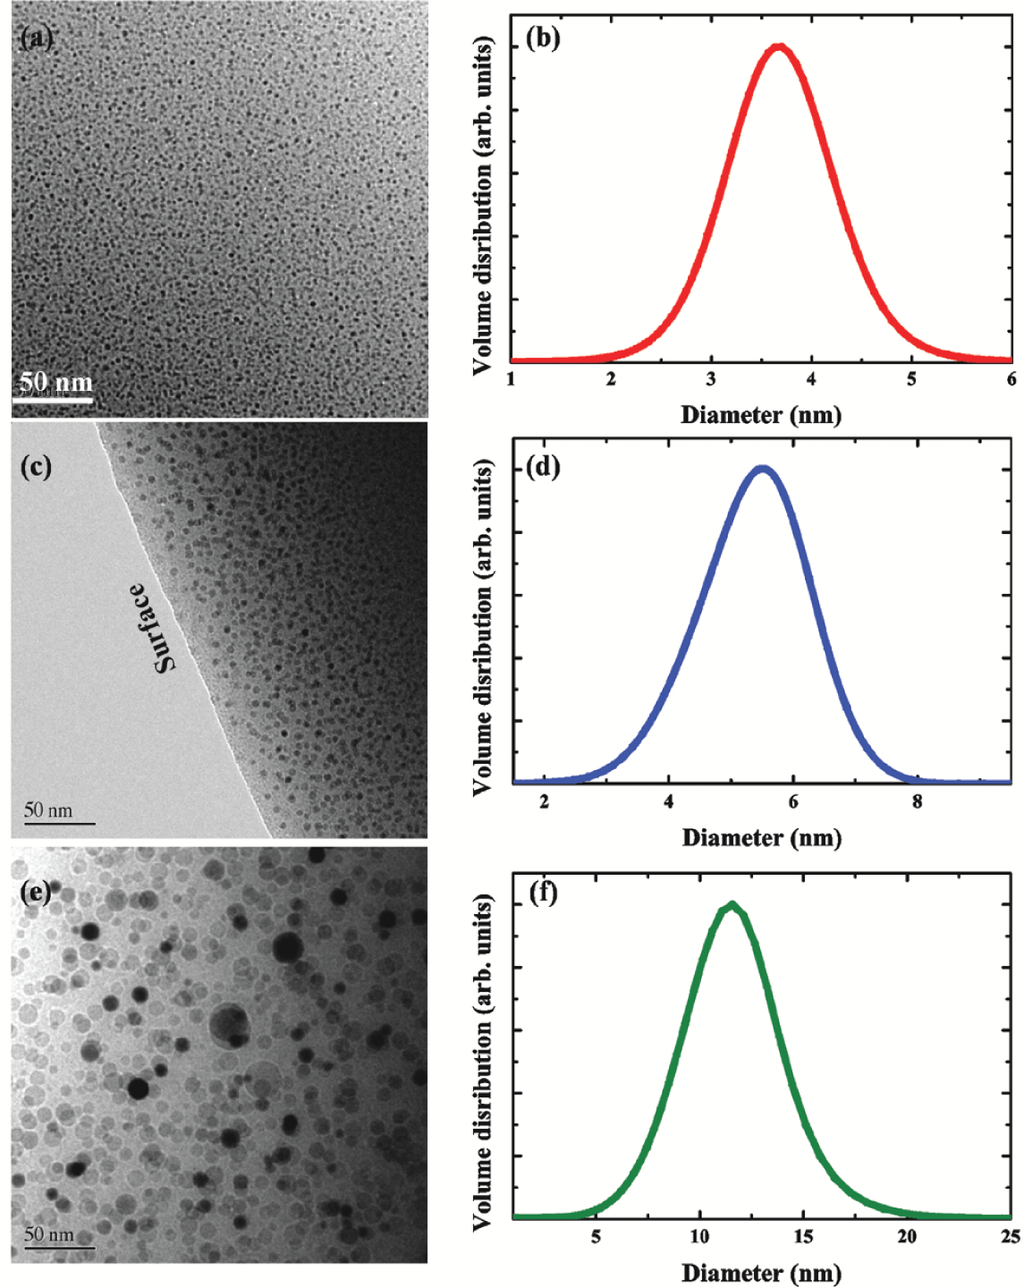
Figure 2.
Bright field XTEM micrographs (a), (c), (e) and corresponding size distributions (b), (d), (f) determined from SAXS. The NPs were formed by implanting (a) 3.0 at.% Co and annealing at 800 °C for 1 h; (c) implanting 4.5 at.% Co at 400 °C; and (e) 3.0 at.% Co and annealing at 1,100 °C for 1 h.
Table 2.
Refined EXAFS fitting parameters and SAXS mean sizes. a These samples were implanted at 400 °C.
Figure 3(a–e) shows representative k3-weighted EXAFS spectra as a function of annealing temperature and implanted Co concentration. The amplitude increases with an increase in either parameter, consistent with the previously demonstrated increase in NP size. From a comparison with the two standards, the largest NPs are clearly bulk-like. Figure 3(b–f) shows the corresponding phase-corrected FT spectra with refined structural parameters listed in Table 2. As above, the FT amplitude increases with an increase in either temperature or concentration, due to an increase in average CN and decrease in structural disorder.
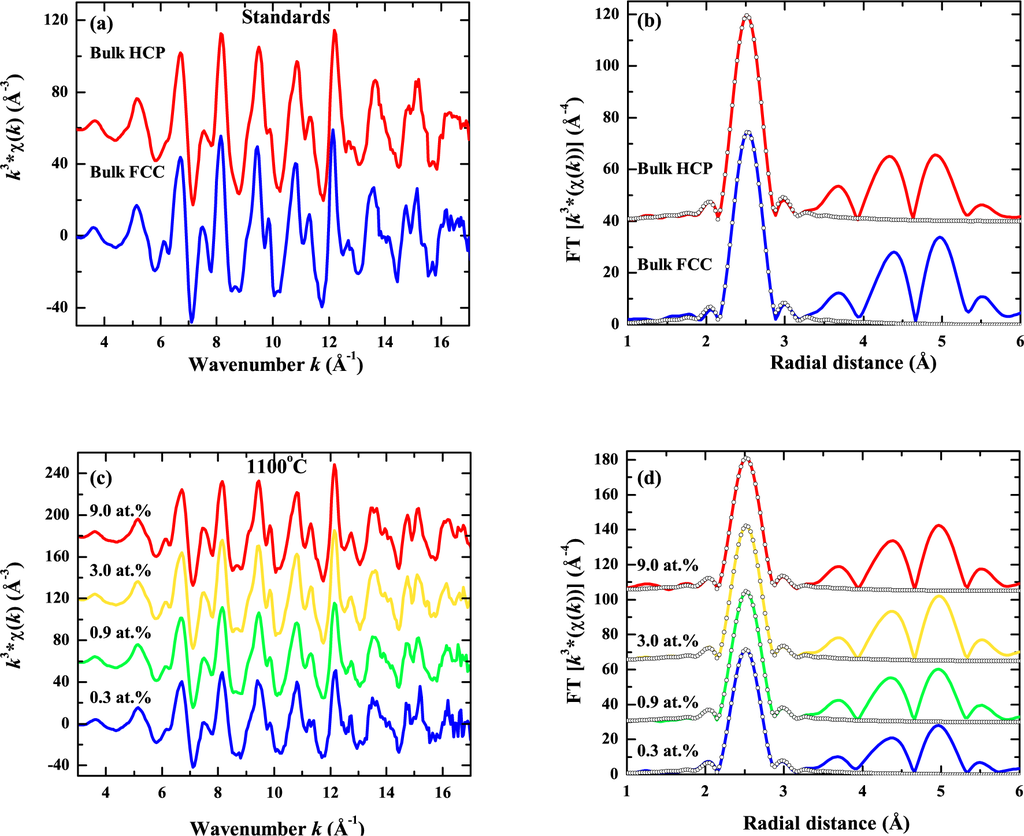
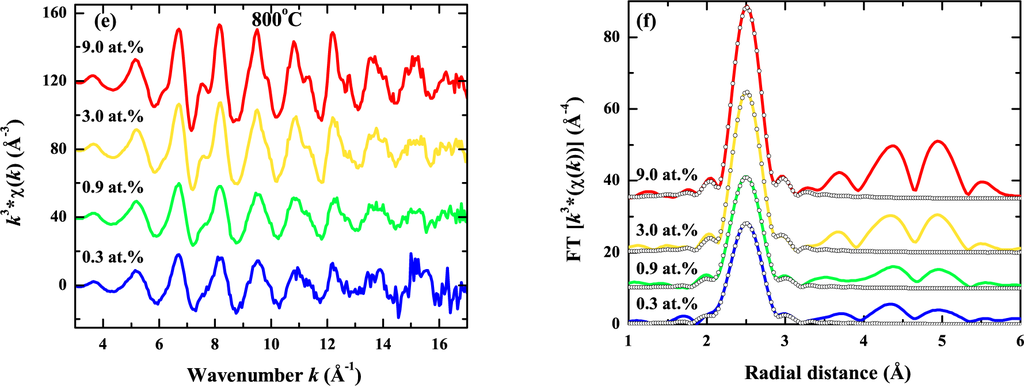
Figure 3.
(a), (c), and (e) k3-weighted EXAFS spectra (offset for comparison) and corresponding phase-corrected FT spectra (b), (d), and (f) for bulk standards, 1,100 °C, and 800 °C samples measured at 18 K. Open circles (b), (d) and (f) represent fits to experimental data.
The reconstructed interatomic distance distribution for selected samples is shown in Figure 4 following Reference [42] and using a photoelectron mean free path of 8 Å, the latter following from [43]. This figure better demonstrates finite-size effects. The observed structural changes with decreasing NP size relative to the bulk standard are as follows: (a) the decrease in peak height (or lower coordination) stems from the under-coordinated surface atoms; (b) the increasing FWHM (or increasing disorder) results from the relaxation and reconstruction of the under-coordinated surface atoms; (c) surface-curvature-induced capillary pressure yields a BL contraction; and finally (d) the asymmetric bondlength distribution (or negative C3) results from the superposition of the different BLs from the core and surface/interface (where the latter are shorter). For semiconductor NPs embedded in SiO2, simulations [44] and experiments [45] have demonstrated that the interfacial atom environment is highly distorted to accommodate material and bonding differences across the interface. Similar trends have been reported for other embedded elemental metal NPs [46–49].
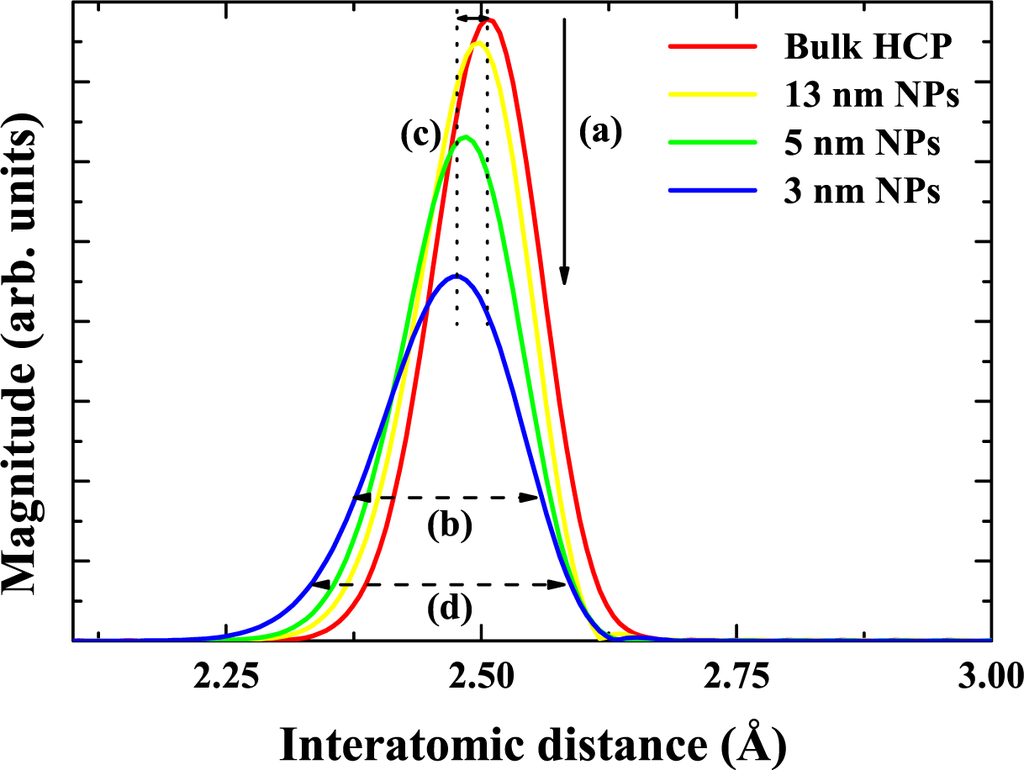
Figure 4.
Reconstructed interatomic distance distributions for bulk HCP Co, 13 nm, 5.2 nm and 3.3 nm diameter Co NPs.
Temperature-dependent, phase-corrected FT EXAFS spectra are presented in Figure 5 for bulk HCP Co and both 5.2 nm and 2.8 nm diameter HCP Co NPs. The amplitude of the signal decreases with an increase in measurement temperature due to the increase in thermal disorder, while, as mentioned above, the amplitude for bulk material exceeds that for NPs at any given temperature due to the reduced CN and enhanced structural disorder associated with NPs.
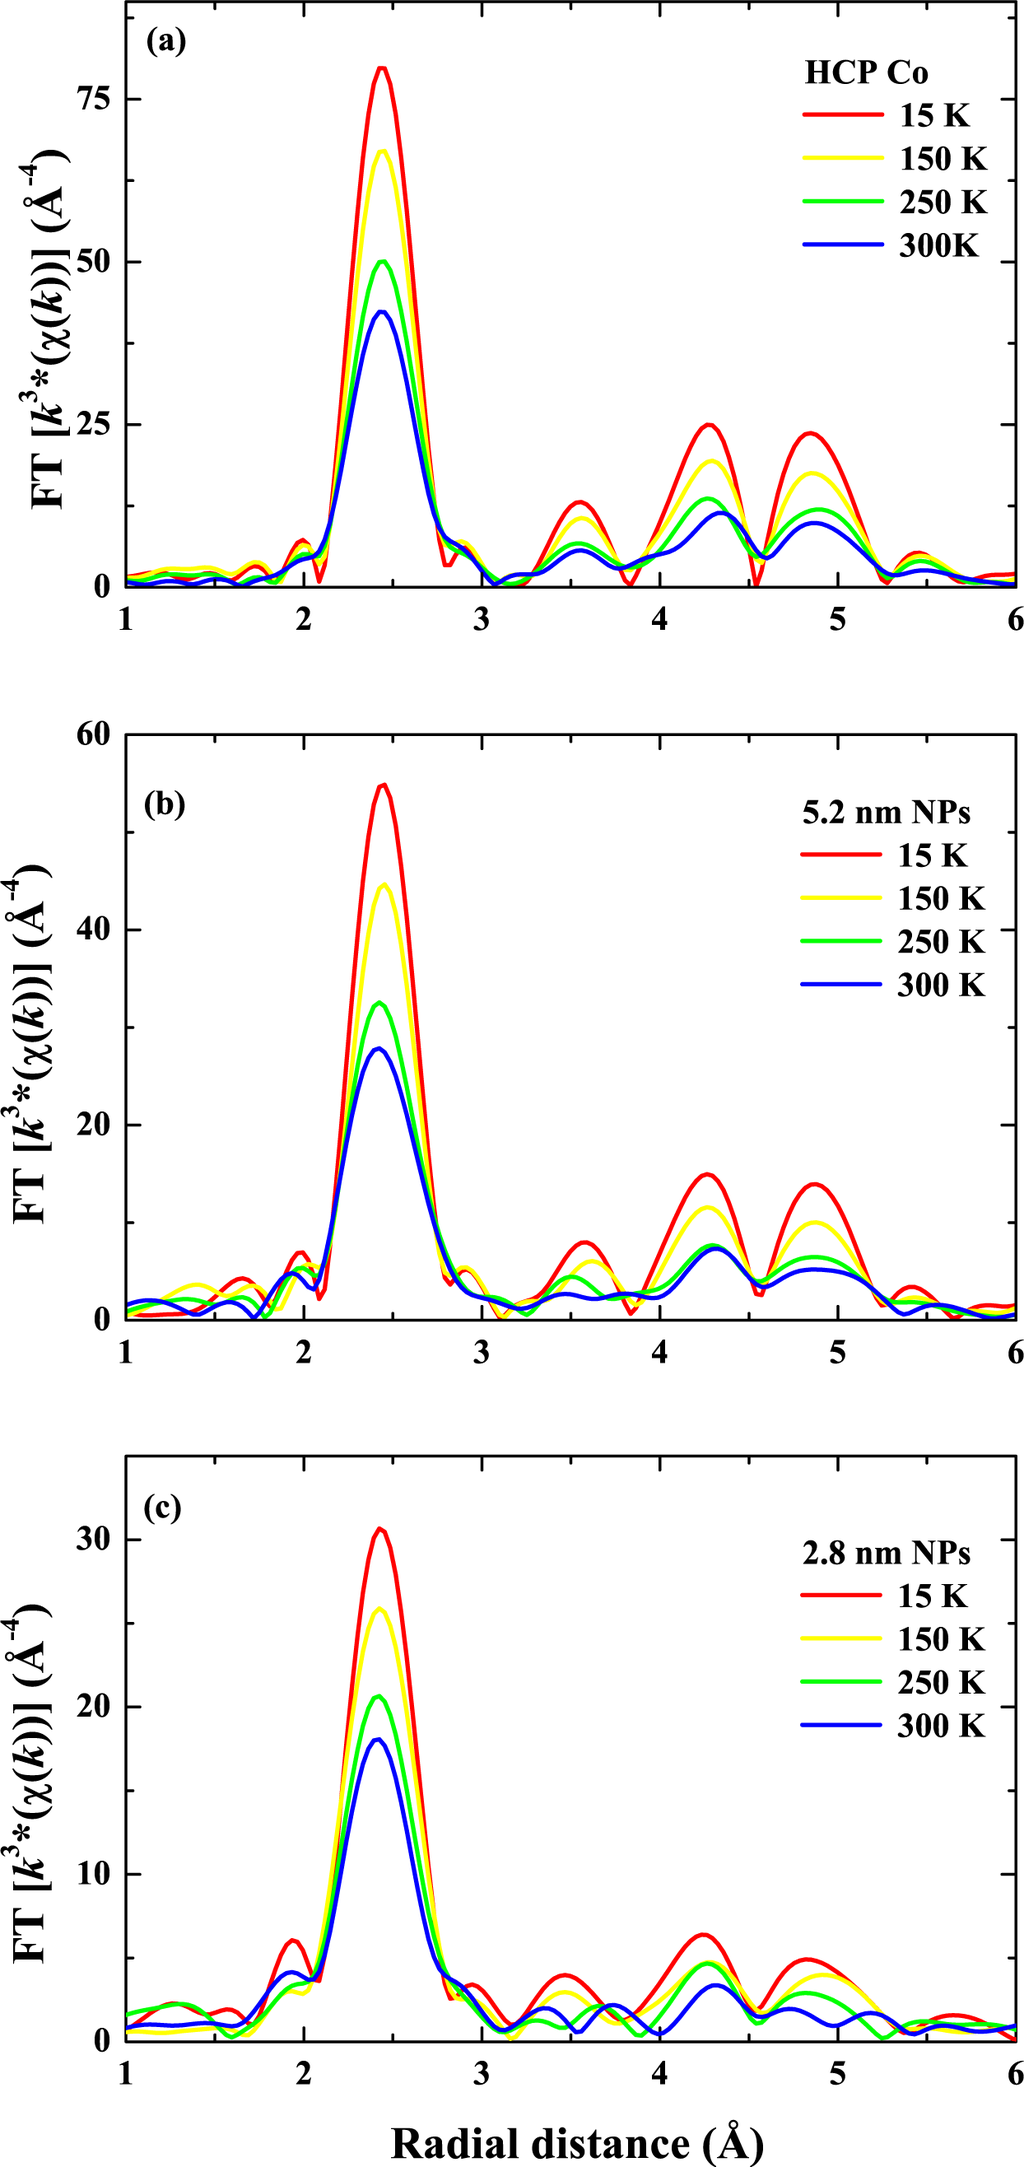
Figure 5.
FT EXAFS spectra for (a) bulk HCP Co, (b) 5.2 nm and (c) 2.8 nm diameter HCP Co NPs, as a function of measurement temperature.
For any given sample, the general increase in σ2 and C3 as a function of measurement temperature is due to an increase in thermal disorder. Included in Figure 6(a,b) are fits to the correlated Einstein model [50] given for σ2 and C3 respectively as:
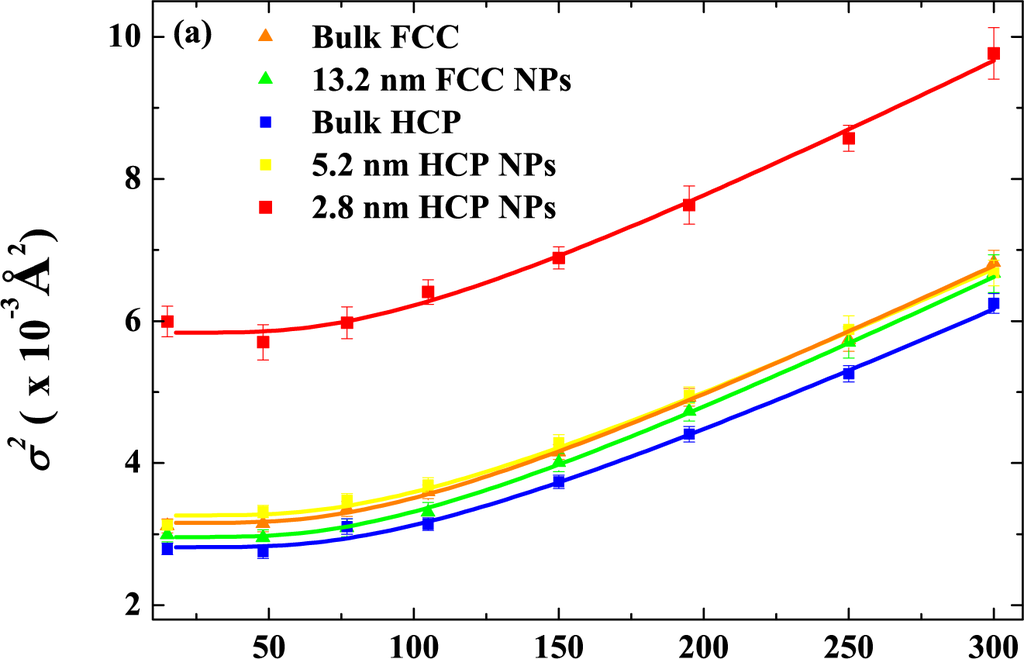
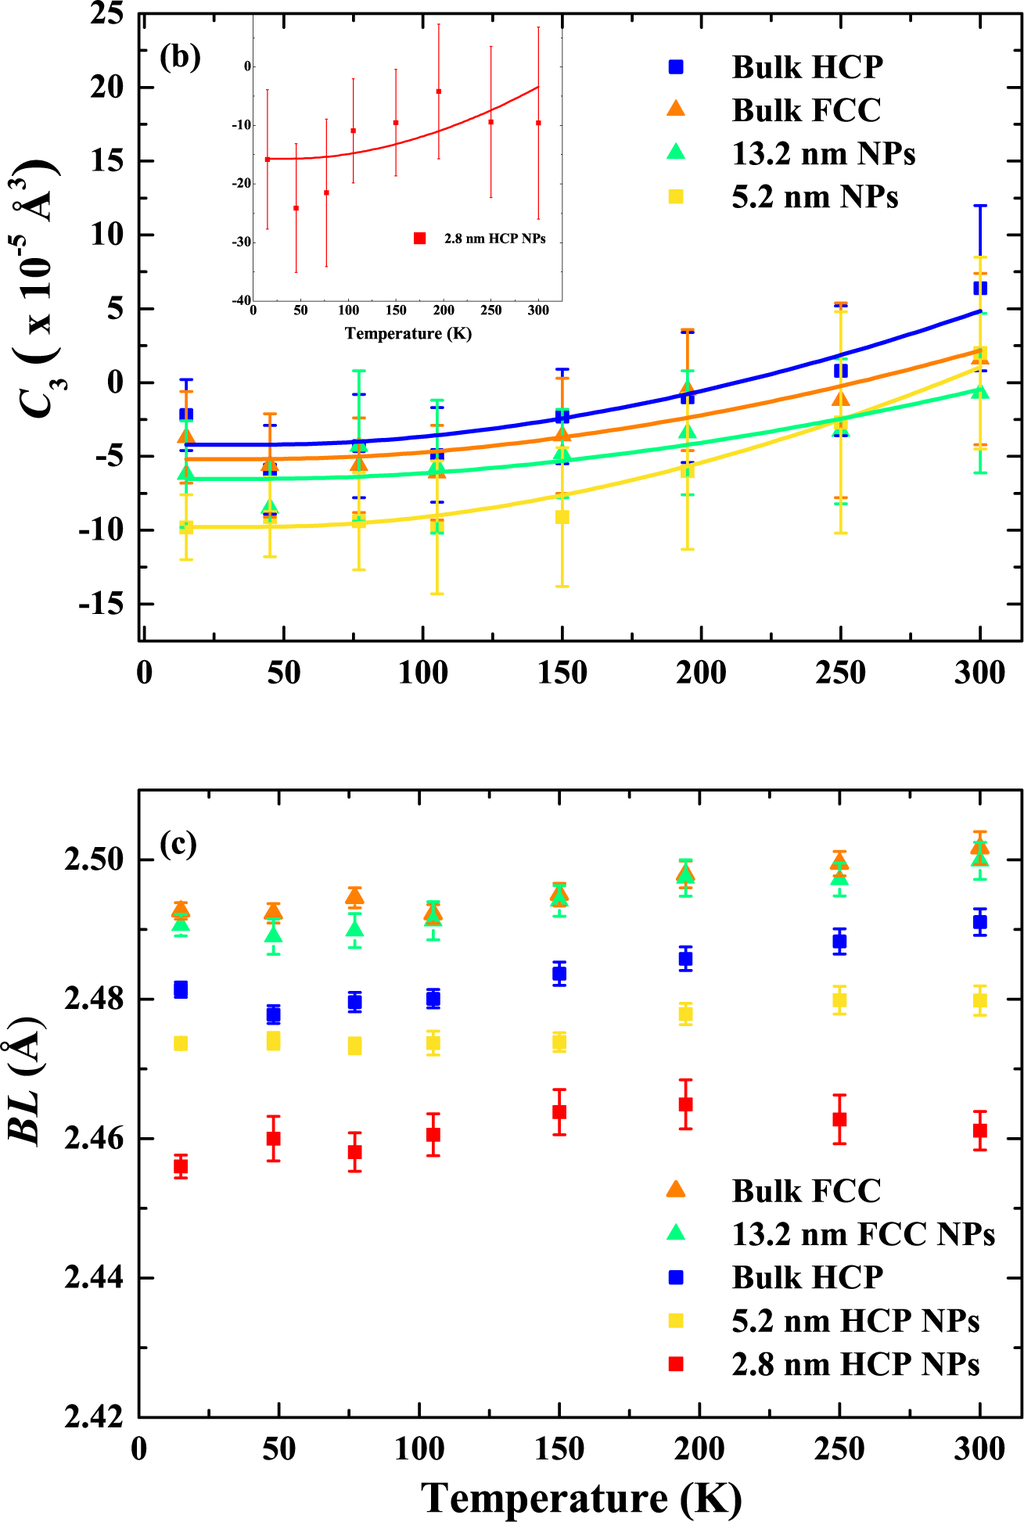
Figure 6.
Thermal evolution of the first NN; (a) σ2; (b) C3; and BL for the Co standards and NP samples. Solid lines are fits with a correlated anharmonic Einstein model (Equations (1) and (2)).
Here, ħ is Planck’s constant divided by 2π, wE is the Einstein frequency
, μ is the reduced mass of the atomic pair under investigation, keff is the effective harmonic spring constant, β is the cubic anharmonicity constant, z = exp(−ΘE/T) and T is the measurement temperature. The Einstein temperature is given by ΘE = ħwE/kB where kB is Boltzmann’s constant.
and C3S are the temperature independent (or static) contributions to the total disorder and asymmetry, respectively. Further discussion of the correlated Einstein model and application to various materials can be found in [42,51–54]. Table 3 lists values for ΘE,
and keff.
Experimental data comparing the vibrational properties of bulk HCP and FCC Co is appreciably scant. Our measurements suggest they are subtly different, with ΘE values of 295 ± 1 and 286 ± 2 K, respectively. If one considers the ΘE as a measure of effective bond strength [42], the data presented herein is indicative of slightly stronger metallic bonds in the HCP phase compared to the FCC phase. The validity of such a difference is supported by our findings for 5.2 nm diameter HCP and 13.2 nm diameter FCC NPs which yield ΘE values of 291 ± 3 and 285 ± 3 K, respectively. Recall from Table 2 that the structural properties of these NPs were nearly bulk-like. Clearly their vibrational properties are also near bulk-like including the subtle phase-specific difference in ΘE. Finite-size effects are more apparent in the vibrational (and structural) properties of smaller NPs. The 2.8 nm diameter HCP NPs exhibit a ΘE value of 280 ± 3 K. Relative to bulk HCP material, the reduction in ΘE reflects a lower mean vibrational frequency and softening of the metallic bonds in the NP sample. Simulations for elemental metallic NPs show capillary pressure and disordered surface atoms shift the vibrational density of states (VDOS) in opposite directions—to higher and lower frequencies, respectively [55]. Our results thus indicate that surface/interfacial disorder is the dominant influence on the vibrational properties of Co NPs. A similar size-dependent trend in the ΘE values was reported for small FCC Cu and (recently) Ni NPs embedded in SiO2 [49,56].
The temperature dependence of the C3 values is shown in Figure 6(b). At temperatures below 100 K the C3 values are very small, though non-zero due to low temperature quantum effects and zero point motion [57]. From ∼150 K onwards C3 increases in value. Similar trends can be observed across all bulk and NP data sets, each with a different constant offset due to different static contributions (C3S). Fitting results from the temperature dependence of C3 with Equation (2) are tabulated in Table 3. In general, the magnitude of both β and C3S is greater for the NP samples relative to the bulk standards and, furthermore, increases as the NP size decreases. Again, these trends are attributed to the increase in SBR or equivalently the increase in relative fraction of surface/interfacial atoms with a distorted environment different to that from the (contracted) FCC or HCP NP core.
Figure 6(c) shows the evolution of the BL as a function of measurement temperature for all bulk standards and NP samples. The NPs are offset from the bulk standards due to the BL contraction discussed above. Figure 6 shows that the NPs exhibit less thermal expansion compared to the bulk Co standards and the effect is more pronounced for NPs of smaller sizes. Similar results have been observed for Pt [58] and Ge [45] NPs embedded in SiO2, where both studies demonstrated that the thermal expansion of the interatomic distances was lowest for small NPs and increased with increasing NP size. It was suggested that the SiO2 matrix restricts the thermal expansion of the embedded NPs. The thermal expansion coefficient of SiO2 is negative below 180 K and above this temperature becomes positive but low in value [59,60]. Like the aforementioned studies, the reduced thermal expansion of the Co NPs is attributed to the restriction imposed by the surrounding SiO2 matrix.
3.3. Summary
In summary, the influence of the processing conditions on the structural and vibrational properties of Co NPs has been investigated with SAXS, TEM, and EXAFS measurements. The NP size increased as a function of both implantation fluence and annealing temperature. Finite-size effects were readily apparent in the Co NP structural parameters including a reduction in average CN and BL plus enhanced structural disorder and asymmetric deviation from a Gaussian-like interatomic distance distribution. Using a correlated anharmonic Einstein model, subtle differences were apparent in the bulk HCP and FCC standards. Finite-size effects were also evident in the Co NP vibrational properties. A reduction in Einstein temperature or equivalently softer bonding relative to bulk material was measurable in the smallest NPs. The relative influence of loosely-bonded and under-coordinated surface/interfacial atoms on the VDOS must thus be greater than that due to capillary pressure.
4. Ion Irradiation-Induced Amorphisation of Cobalt Nanoparticles
4.1. Introduction
In this section, we discuss the effect of low energy ion irradiation on the size and atomic structure of Co NPs. The amorphisation of small Co NPs was readily apparent with low fluence irradiation. The NP shape, size, and structure were characterized by XTEM, SAXS and XAS, respectively. We have also performed MD simulations of the atomic structure for bulk amorphous Co for comparison with experimental results and have investigated the vibrational properties of amorphous Co NPs using temperature-dependent XAS measurements. Details of the parameters used in the MD simulations can be found in Reference [61]
For this study, three samples with mean NP sizes of 3.7, 5.2 and 13.7 nm (the same samples shown in Figure 2) were investigated. Samples were then irradiated at room temperature with 9 MeV 197Au ions to a fluence of 2 × 10¹³/cm2. With reference to Figure 1, Se and Sn are comparable. The energy loss in Co is greater than in SiO2 given the greater atomic number of the former (see Table 1).
4.2. Results
Figures 7(a) and (b) show XTEM images for unirradiated (c-) and irradiated (a-) Co NPs, respectively, confirming the spherical shape of the NPs before and after irradiation.
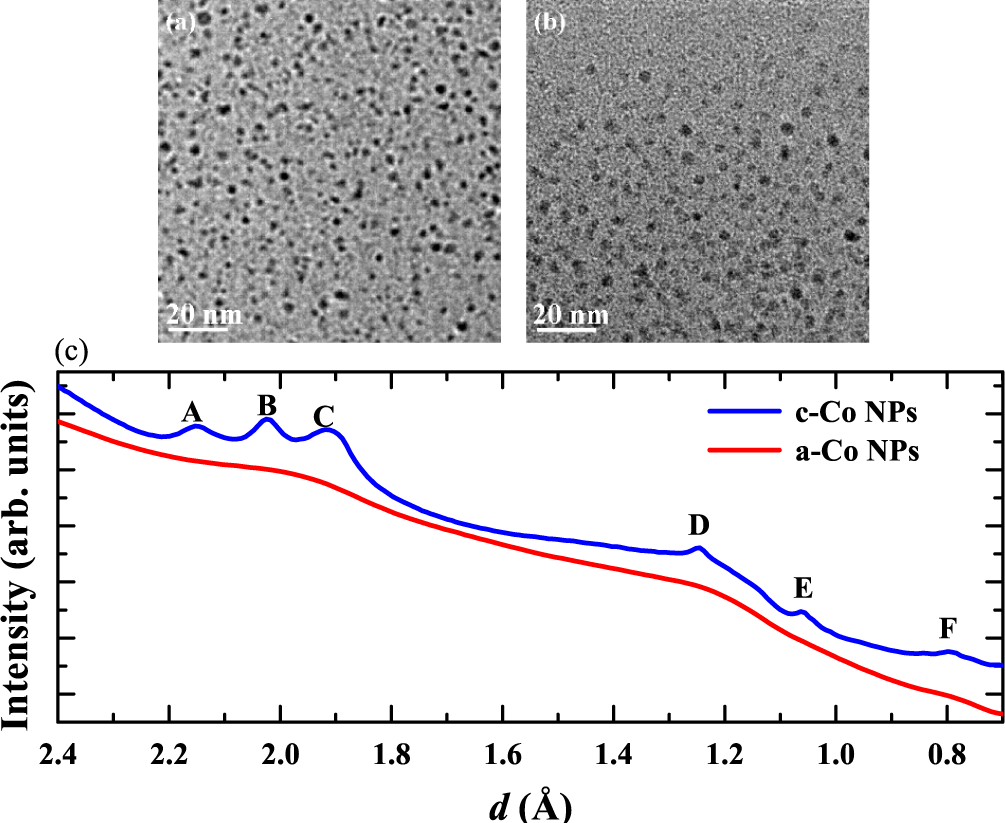
Figure 7.
XTEM micrographs for (a) 3.7 nm c-Co NPs and (b) 3.6 nm a-Co NPs and (c) shows the radially integrated ED patterns for both samples.
The NP size is effectively unchanged from the unirradiated state (3.7 nm). The ED patterns collected for the c-NPs and a-NPs were radially averaged and the resulting intensity profiles are shown in Figure 7(c). Indexing the ED patterns (peaks labeled A–E) yields the results listed in Table 4 and shows that the unirradiated c-Co NPs are comprised of a mixture of HCP and FCC phases. The well-defined peaks typical of randomly-oriented crystalline NPs vanish upon irradiation, consistent with (though not necessarily indicative of) the formation of an amorphous phase.
Table 4.
d-spacings indexed for the 3.7 nm c-Co NPs in Figure 7. Theoretical d spacings for bulk HCP and FCC Co are included for reference.
Figure 8(a) shows background-corrected SAXS spectra for the c- and a-Co NPs with the fitted Q range overlaid as a solid line while Figure 8(b) demonstrates that the normalized size distributions are clearly Gaussian in shape. The average NP diameter before and after irradiation was 3.7 ± 1.0 nm and 3.6 ± 1.0 nm, respectively, and thus irradiation did not produce a change in NP size. These results agree well with the TRIDYN [62] simulations of Figure 9 for irradiation-induced atomic inter-mixing of a Co layer (3.7 nm in thickness) embedded in SiO2 and irradiated with Au ions to a fluence of 2 × 10¹³/cm2 at an energy of 5.3 MeV. The Au ion energy for the TRIDYN simulation was that of the Au ions in SiO2 at the peak Co concentration (1 μm) in the NP sample. Recoiled Co, Si and O atoms slightly alter the Co atomic depth distribution leading to a less well defined Co/SiO2 interface after irradiation. Inter-mixing of the matrix constituents and Co layer is clearly minimal and well below that required to stabilize the amorphous phase in bulk Co through the addition of Si and O atoms [63]. As such, it is argued that the irradiation-induced structural changes described below do not result from the presence of recoiled matrix constituents. As above, the nuclear and electronic energy losses are comparable. To identify if one or both energy loss regimes is/are responsible for the observed amorphisation would necessitate experiments as a function of Au ion energy.
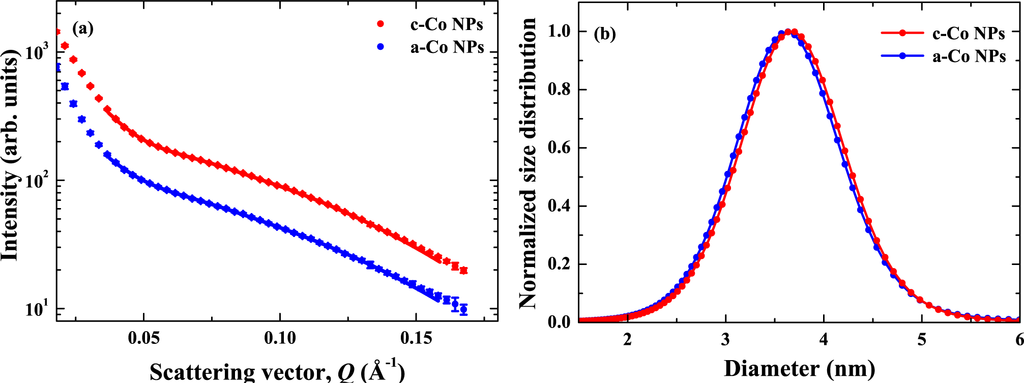
Figure 8.
(a) Background-subtracted SAXS intensities for c-Co NPs and a-Co NPs (solid lines represent fitted regions) with spectra offset for comparison and (b) normalized NP size distributions.
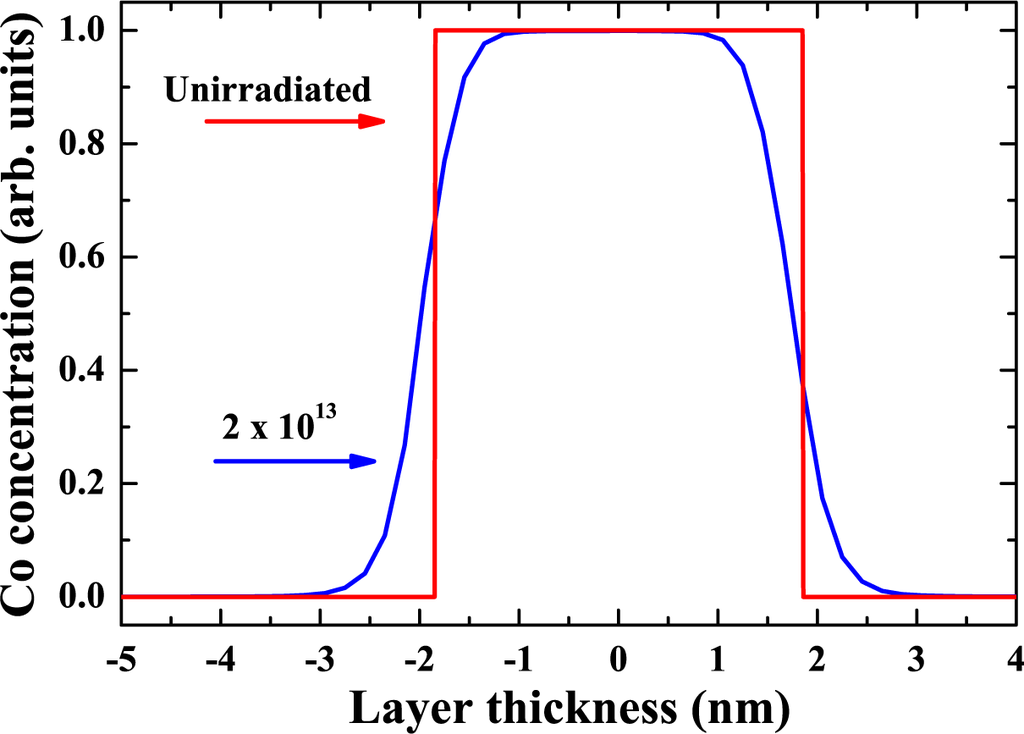
Figure 9.
TRIDYN simulation of ion beam mixing in a 3.7 nm Co layer embedded in SiO2 induced by 9 MeV Au irradiation.
XANES spectra for two bulk standards plus c- and a-Co NPs are shown in Figure 10. The sensitivity of the XANES technique to valence state, crystallographic phase, multiple scattering effects (and more) makes for an effective means of “fingerprinting” the crystallographic phase of a material under investigation [45,64]. The prominent features of the bulk HCP Co and c-Co NP spectra in Figure 10 result from multiple scattering resonances of the 1s photoelectron [20]. The a-Co NP spectrum (and those of disordered or amorphous materials in general) exhibits less fine structure due to the loss of such multiple scattering contributions [45,65]. This spectrum is also similar to that reported previously for thin-film amorphous Co [66]. The changes in the a-Co NP XANES spectra (compared to the c-Co NPs and bulk HCP Co) are consistent with those observed for other transition metals including Cu NPs [67] and bulk amorphous Fe prepared sonochemically [65]. The observed changes are attributed to the disappearance of multiple scattering (MS) features and shape resonances associated with these MS paths in the amorphous phase.
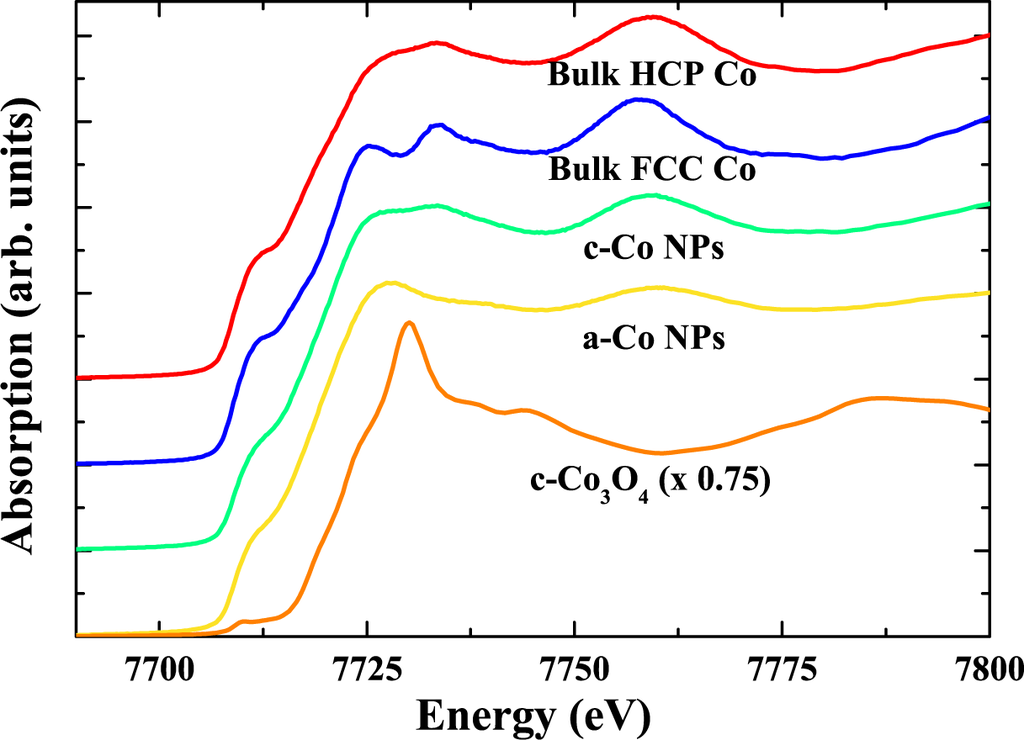
Figure 10.
XANES spectra at the Co K-edge for bulk HCP Co, 3.7 nm c-Co NPs, 3.6 nm a-Co NPs and bulk crystalline Co3O4 with spectra offset for comparison.
Figure 11 displays (a) k3-weighted and (b) FT EXAFS spectra, respectively, for the HCP standard and NP samples. The isolated EXAFS spectra were analysed following the methods described in Section 2, with the exception that the spectra were FT over a k range of 3.3–14.5 Å−1. Comparing spectra for HCP Co and c-Co NPs, the reduction in amplitude of the latter is due to a decrease in CN and increase in σ2, as listed in Table 5. Such changes stem from finite-size effects as discussed in Section 3. A further, more pronounced reduction in amplitude is evident in the a-Co NP spectrum of Figure 11. Again a decrease in CN (due to less efficient atomic packing) and, to a greater extent, an increase in the σ2 (due to greater structural disorder) drive this change (see Table 5). Furthermore, an increase in BL and a change of sign in C3 are also observed. Similar structural changes have been observed in amorphous semiconductors [68–70] and attributed to, respectively, the increase in disorder intrinsic to the amorphous phase and the sampling of more anharmonicity in the interatomic potential. Comparing c- and a-Co NPs, the changes in all four structural parameters (CN, σ2, BL and C3) are consistent with theoretical predictions for the amorphous phase of an elemental metal [71]. The trends in the structural parameters, including a BL expansion and a BL distribution skewed to longer BLs are in excellent agreement with recent investigations of ion irradiated Cu and Au NPs [67,72]. The aforementioned studies also report a decrease in the CN and a significant increase in the σ2 (∼3 times larger than the bulk) in the disordered phase. Note also the lack of scattering beyond the first NN shell in the a-Co NP spectrum is in stark contrast to the c-Co NP counterpart where contributions from the first four NN shells are readily apparent. Such a trend is typical of the crystalline-to-amorphous phase transformation [69,73] and thus further supports the assertion of amorphous phase formation upon irradiation of c-Co NPs.
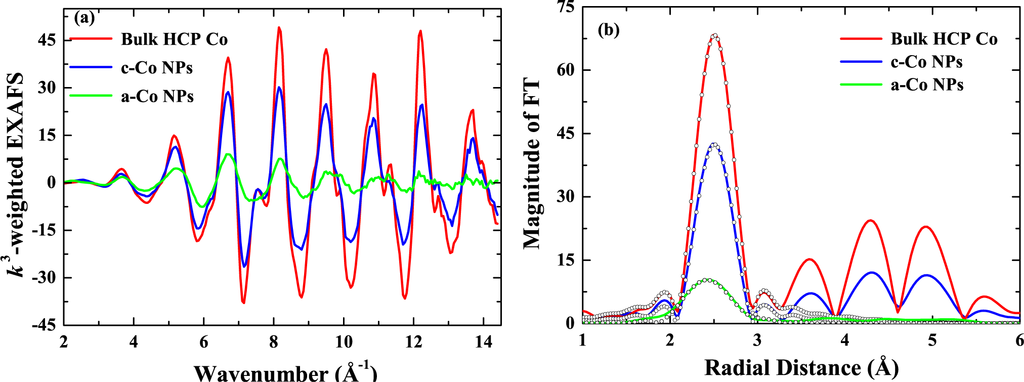
Figure 11.
(a) k3-weighted EXAFS spectra and (b) corresponding phase corrected FT EXAFS spectra for bulk HCP Co, 3.7 nm c-Co NPs and 3.6 nm a-Co NPs (irradiated with 9 MeV Au ions to a fluence of 2 × 10¹³/cm2) measured at 18 K. Open circles represent fits to experimental data.
Table 5.
Refined EXAFS structural parameters and SAXS mean NP sizes for bulk HCP Co, 3.7 nm c-Co NPs, 3.6 nm a-Co NPs and 3.6 nm a-Co NPs annealed at 100 and 400 °C.
Note that the CN for a-Co NPs listed in Table 5 is necessarily influenced by finite-size effects. Given the nil change in NP diameter upon irradiation and assuming (CNbulk a-Co/CNbulk c-Co) = (CNa-Co NPs/CNc-Co NPs), we estimate the CN of bulk a-Co should thus be 9.4 atoms, in excellent agreement with that previously determined for thin-film a-Co formed by vapour deposition and stable only at low temperatures [66].
The amorphous phase is also observable for 9 MeV Au ion irradiated 5.2 nm HCP Co NPs as demonstrated in Figure 12 with the loss of structure beyond the first NN shell readily apparent. In contrast, large 13.2 nm FCC Co NPs do not transform after irradiation and higher NN peaks are still observable, indicating that the amorphisation process is size dependent. The large 13.2 nm NPs have structural parameters similar to the bulk and as discussed in Section 1, the amorphous phase formation by ion irradiation has not been achievable in bulk elemental metals. Figure 12 also indicates that the amorphisation process in Co NPs is potentially insensitive to the initial crystal phase, as both mixed HCP/FCC and pure HCP phase NPs both transform with irradiation. Further experiments on small FCC Co NPs would need to be performed to confirm this however.
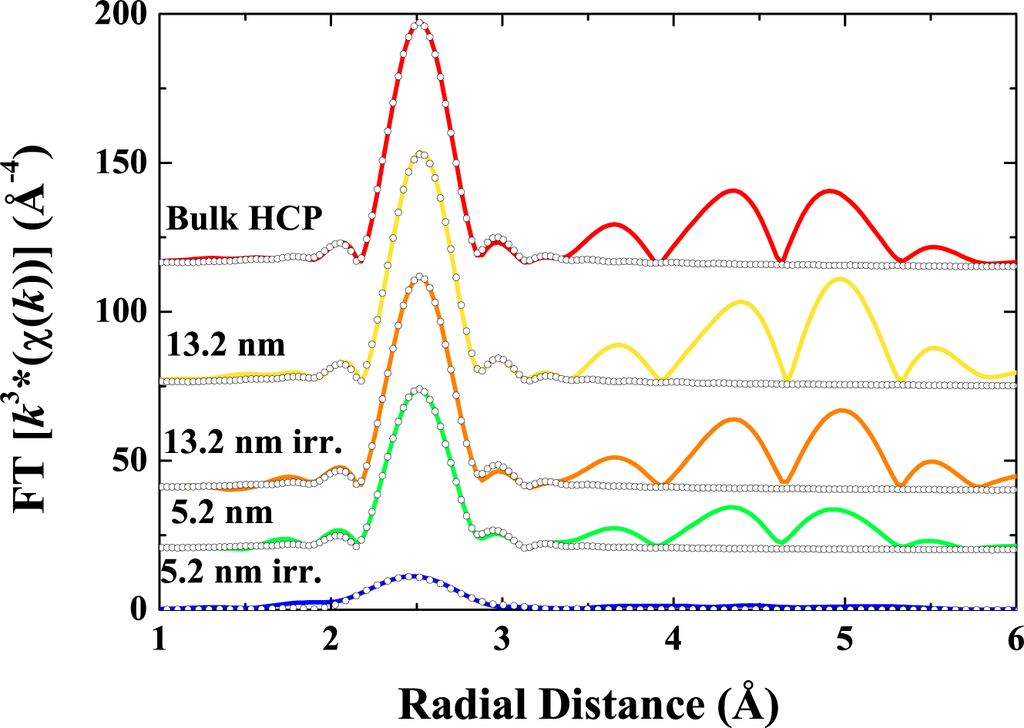
Figure 12.
FT EXAFS spectra for bulk HCP Co, 13.2 FCC and 5.2 nm HCP Co NPs prior to and after (labeled irr.) 9 MeV Au ion irradiation to a fluence of 2 × 10¹³/cm2. Open circles represent fits to experimental data.
The interatomic distance distributions shown in Figure 13 were reconstructed from the EXAFS-determined structural parameters. This figure best illustrates the irradiation-induced changes and also enables direct comparison with MD simulations. Results are shown for the latter with a quench rate of 1.0 K/fs, typical for the relaxation of a collision cascade [27]. A slower quench rate of 0.1 K/fs yielded a nominally higher amplitude consistent with a slightly less disordered, more crystalline-like structure. Clearly the MD simulation agrees exceedingly well with the experiment, reproducing the amplitude, width and positive asymmetry of the distribution. The simulations and experimental data are also consistent with the experimental results shown in reference [66].
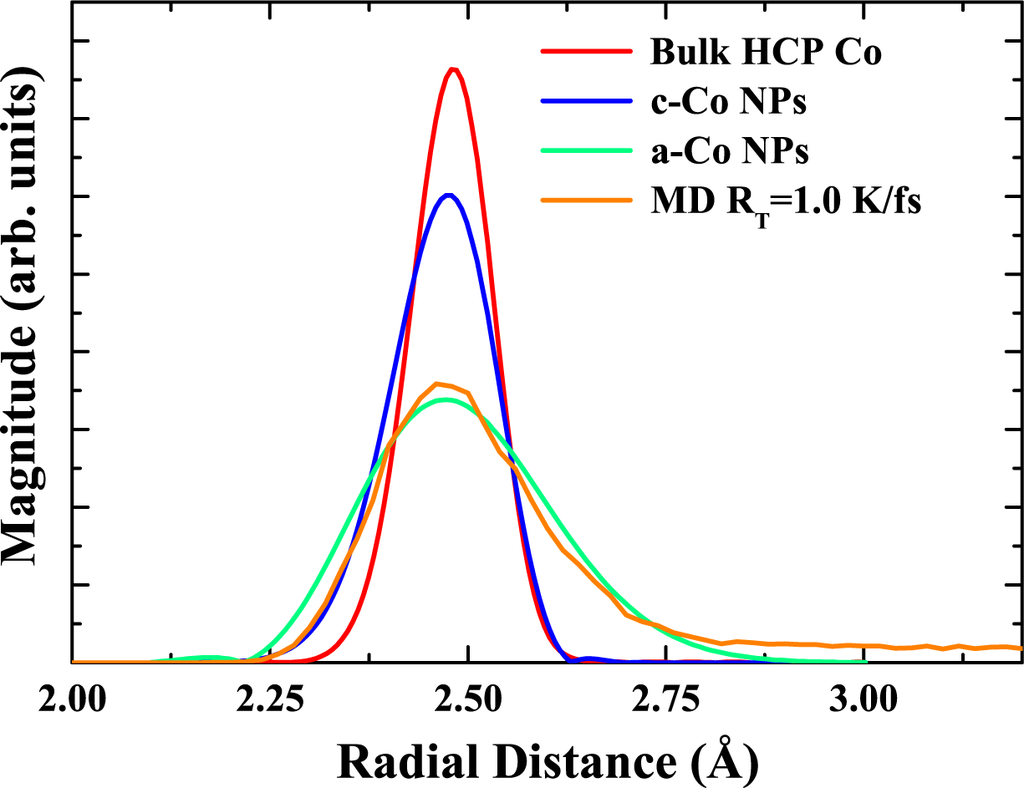
Figure 13.
Reconstructed interatomic distance distributions for the first NN shell of bulk HCP Co, 3.7 nm c-Co NPs and 3.6 nm a-Co NPs compared to the interatomic distance distribution for amorphous Co from MD simulations.
As anticipated, Au ion irradiation of bulk HCP and FCC Co standards yielded no change in the structural parameters of these crystalline metals, consistent with the general inability to form an irradiation-induced amorphous phase in an elemental metal. Finite-size effects in the form of inherent structural disorder clearly play a significant role in enhancing the sensitivity of embedded NPs to ion irradiation. Though the surrounding matrix may aid in stabilizing the amorphous NP structure, measurements with large c-Co NPs discussed above demonstrate that the presence of the matrix alone does not yield amorphous NPs for the given irradiation fluence.
The thermal stability of the a-Co NPs was investigated via exsitu annealing of the as-irradiated EXAFS sample at temperatures of 100–400 °C for 1 h. Annealing at 100 °C yielded no observable changes in the FT EXAFS spectra (or in the calculated structural parameters), as shown in Figure 14 and Table 5. Scattering contributions from beyond the first NN shell, as consistent with the onset of recrystallisation, were apparent at annealing temperatures of 200 °C and above. The spectrum following annealing at 400 °C is included in Figure 14 and structural parameters are included in Table 5. As expected, the thermally-induced amorphous-to-crystalline transformation yields an increase in CN, a decrease in BL and σ2 and a positive-to-negative change in value of C3. A component of residual disorder does however remain and thus higher annealing temperatures would be required to completely recover a structural state akin to unirradiated c-Co NPs (annealing of samples above 400 °C was not performed to maintain the integrity of the Kapton windows). Nonetheless, the ability to recrystallise the material further supports the assertion that the presence of recoiled impurities is not responsible for amorphous phase formation.
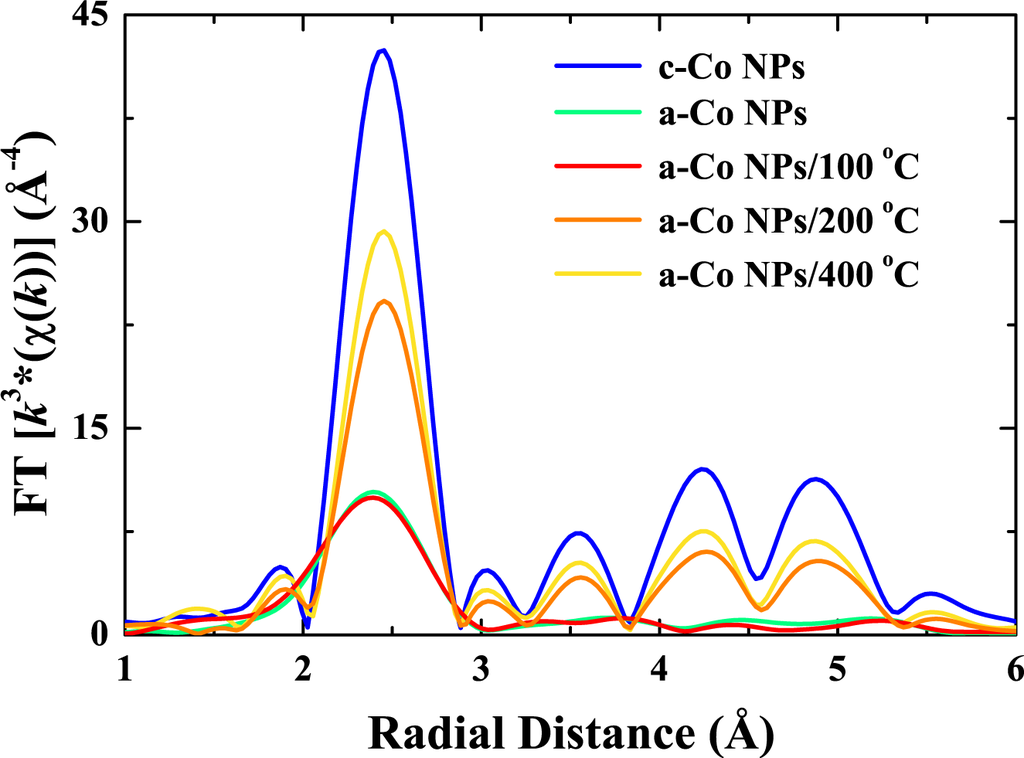
Figure 14.
FT EXAFS spectra for 3.7 nm c-Co NPs, as-irradiated 3.6 nm a-Co NPs and a-Co NPs annealed at 100, 200 and 400 °C for 1 h.
The result described above for annealing at 100 °C is of technological importance, demonstrating embedded a-Co NPs are stable at and above ambient conditions, in contrast to thin-film a-Co [66] that recrystallizes at −52 °C. As such, there is potential to exploit the possibly novel optical and/or magnetic properties associated with the amorphous phase in devices operating at room temperature. For the NP samples studied herein, the surrounding amorphous SiO2 matrix may well help to stabilize the amorphous phase. Furthermore, recrystallisation of the entire NP ensemble necessitates a nucleation event in each NP in contrast to a continuous thin film, where conceivably only a single nucleation event is required. Indeed, comparing the a-Co NP results here with those of thin-film a-Co suggests that the recrystallisation process of a-Co NPs is potentially nucleation limited.
Temperature-dependent FT EXAFS spectra are shown in Figure 15 for samples of bulk HCP Co, c-Co NPs and a-Co NPs. As discussed above, the EXAFS amplitude is influenced by σ2 which is comprised of static and thermal components. As the measurement temperature increases, so does the latter and as a consequence a decrease in amplitude is apparent in Figure 15. Thermally-induced damping of the amplitude is more pronounced in the bulk HCP Co and c-Co NPs compared to that of the a-Co NPs. As shown below, this trend is characteristic of a greater Einstein temperature for the a-Co NPs.
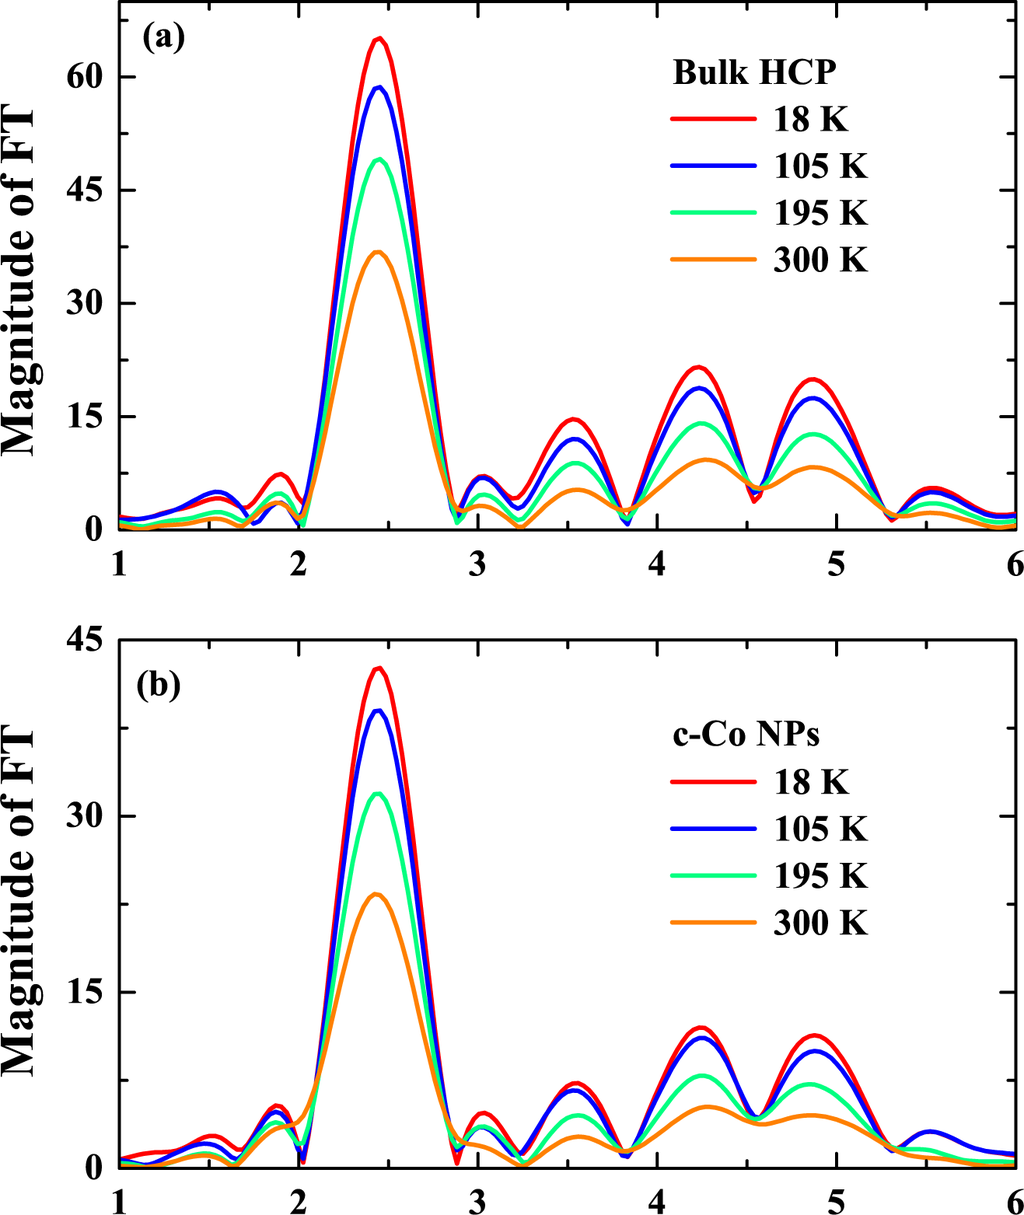
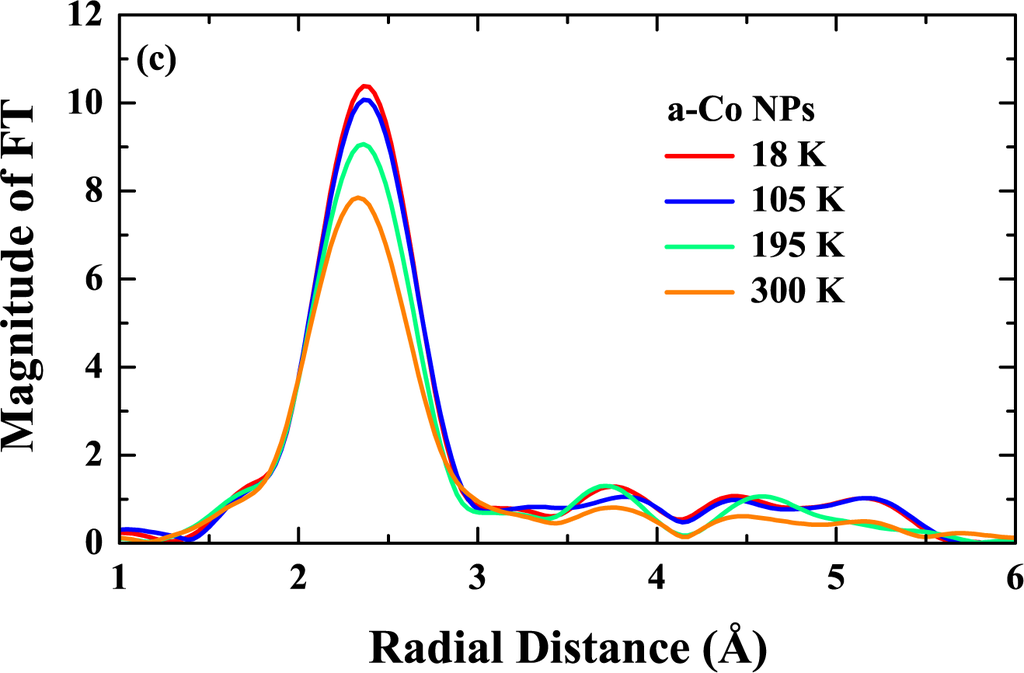
Figure 15.
FT EXAFS spectra for (a) bulk HCP Co, (b) 3.7 nm c-Co NPs and (c) 3.6 nm a-Co NPs as a function of measurement temperature.
Figure 16(a) shows the temperature dependence of the σ2, obtained from individual fits of the first NN shell for all samples. Values for both the c- and a-Co NPs are offset from those of bulk HCP Co due to greater static disorder
, assumed to be temperature-independent, while, for any given sample, the general increase in σ2 as a function of measurement temperature is due to an increase in thermal disorder. Also included in Figure 16(a) are fits to the Einstein model defined in the previous section (Equation (1)). Calculated parameters are listed in Table 6. Comparing the bulk HCP Co and c-Co NPs, the decrease in Einstein temperature (ΘE) for the latter indicates the mean vibrational frequency has shifted to lower values. Such behaviour was attributed to the dominant influence of loosely-bound surface/interfacial atoms as discussed in Section 3, consistent with theoretical predictions [55]. Surprisingly, a significant increase in ΘE was measurable for the a-Co NPs. Though similar observations for a-Cu NPs have been reported [74], intuitively one might expect the disorder inherent in the amorphous phase to produce a decrease in ΘE. (Compare, for example, bulk crystalline Ge (ΘE = 351 K) and amorphous Ge (ΘE = 343 K) [45]). An increase in ΘE implies bond stiffening, where the latter can result from an enhanced compressive state [75] or inhomogeneous internal strain [76]. The results presented herein may again reflect the influence of the embedding matrix. With the measurable decrease in CN and increase in BL, a decrease in atomic density and increase in NP volume should accompany the crystalline-to-amorphous phase transformation for a NP with a fixed number of atoms. While the loss of atoms via recoils can lessen this constraint, the results presented herein suggest that the rigid embedding SiO2 matrix may well impede NP volume expansion and as a consequence drive ΘE upward [77].
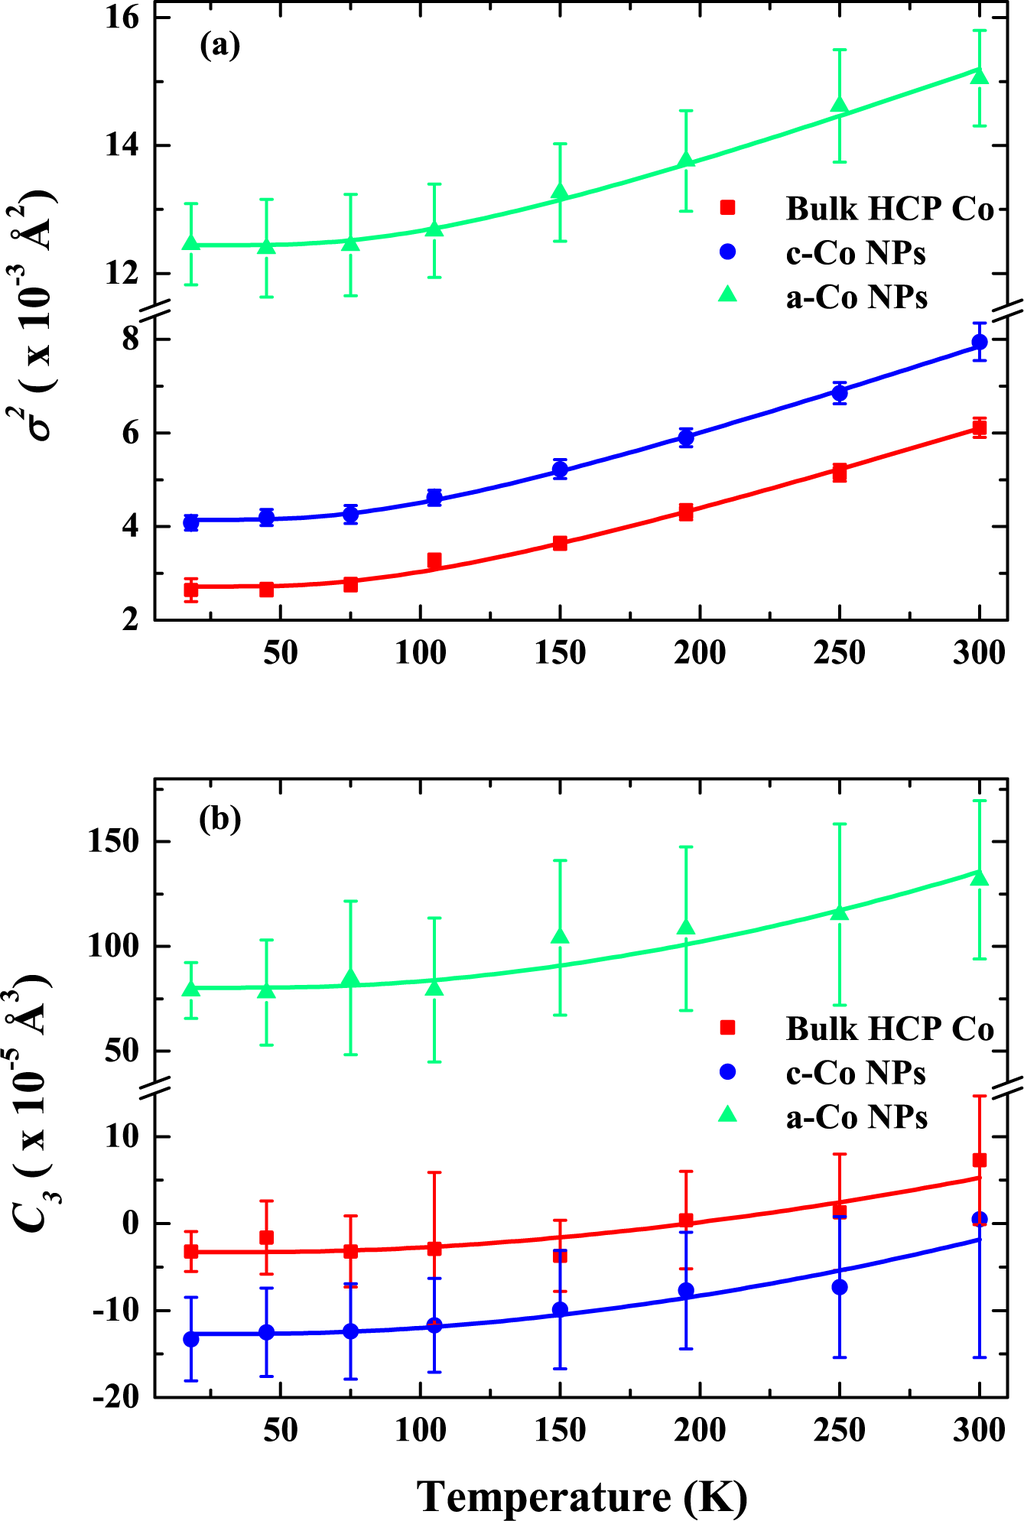
Figure 16.
Thermal evolution of the first NN (a) σ2 and (b) C3 for bulk HCP Co, 3.7 nm c-Co NPs and 3.6 nm a-Co NPs. Solid lines in (a) and (b) are fits with Equations (1) and (2), respectively.
Table 6.
Values obtained for the ΘE,
, β and C3S.
The temperature dependence of C3 is given in Figure 16(b) for all samples, obtained as above from individual fits to the first NN shell. Also included in Figure 16(b) are fits to Equation (2) with the structural contribution to the asymmetry (C3s) and cubic anharmonicity constant (β) values listed in Table 4. The values of C3s and β for the a-Co NPs are significantly enhanced relative to the bulk HCP Co and c-Co NPs. For C3s, such differences are attributed to the disorder-induced sampling of greater anharmonicity in the interatomic potential of the amorphous phase while for β the results simply indicate that the thermal evolution of the asymmetry in the interatomic distance distribution is more rapid relative to bulk HCP Co and c-Co NPs.
4.3. Summary
In summary, an amorphous phase stable at ambient conditions has been achieved in elemental Co through ion irradiation of small crystalline-Co NPs embedded in a SiO2 matrix. Larger NPs and bulk crystalline FCC and HCP standards did not exhibit the same sensitivity to ion irradiation. The perturbed pre-irradiation structural state of the crystalline NPs was responsible for the observed sensitivity to ion irradiation, potentially coupled with an embedding matrix to aid in stabilizing the amorphous phase. The results presented herein for Co clearly demonstrate an amorphous phase can be formed in elemental metals other than Cu and the structural and vibrational properties of this amorphous Co phase were measured. The former were entirely consistent with theoretical predictions and MD simulations while the latter were characterized by considerable bond stiffening as attributed to a compressive state induced by the rigid embedding matrix.
5. Swift Heavy Ion Irradiation-Induced FCC-to-HCP Phase Transformation in Cobalt Nanoparticles
5.1. Introduction
In this section we discuss the effects of SHII on the crystallographic phase of Co NPs embedded in SiO2. XAS is used in conjunction with ED to characterise the irradiation-induced evolution of the FCC-to-HCP phase transformation as functions of irradiation energy and fluence. The mechanisms potentially responsible for this change in phase are then discussed.
Large 13.2 ± 3.7 nm NPs (as determined by both TEM and SAXS) were prepared following the methods discussed in Section 2. The NP samples were irradiated at room temperature with Au ions at energies of 9, 27, 54, 89, 110 or 185 MeV, where the ion penetration depth was beyond that of the NP distribution. Au ion fluences ranged from 1 × 10¹⁰–2 × 10¹³/cm2.
5.2. Results
Figure 17 shows ED patterns (a) before and (b) after SHII with 89 MeV to a fluence of 2 × 10¹³/cm2 with (c) displaying the radially integrated intensity for each pattern in (a) and (b). The indexed lattice spacings (d) labelled (a)–(f) are listed in Table 7 and confirm the complete FCC-to-HCP phase transformation. No evidence of an oxide component was apparent in the ED data. Significant changes in the NP shape were also not apparent with TEM. At greater fluences (as discussed in the following section), the NP shape was progressively transformed from spherical to rod-like with a decrease in mean volume as a result of NP dissolution into the matrix, consistent with previous SHII studies of embedded Co NPs [78].
Figure 17.
ED patterns for (a) Co NPs unirradiated and (b) after SHII with 89 MeV Au ions to a fluence of 2 × 10¹³/cm2 and (c) corresponding radially integrated electron diffraction patterns. The lattice spacings are listed in Table 7.
Table 7.
Theoretical and experimental lattice spacing (d) determined from the ED patterns of Figure 17.
XANES spectra for bulk standards, unirradiated NPs and 185 MeV irradiations are shown in Figure 18(a) as a function of fluence. The smooth transformation from FCC to HCP Co is readily apparent. Circles represent the linear-combination fits to the experimental data and Figure 18(b) shows an example of the XANES fitting with separate FCC and HCP contributions to the spectrum for the 185 MeV, 1 × 10¹²/cm2 sample. The XANES spectrum for HCP Co agrees well with previous reports [79–82]. While multiple-scattering calculations for FCC Co predict the amplitude of the B feature should exceed that of the C feature [20,83], such a difference in relative amplitudes is not apparent in our XANES spectrum for FCC Co. However, the latter is consistent with XANES spectra for FCC Ni [84] and thin FCC Co films grown on (111) Cu substrates [85]. Figure 18(c) shows that the most obvious difference in the XANES spectra of our two standards is the more pronounced depression between features B and C for the FCC phase. Nonetheless, fitting to quantify the HCP and FCC fractions was performed over the entire 7690–7760 energy range and thus included the additional phase-dependent features. The fraction of Co atoms in an oxidized environment was also quantified using XANES with approximately 5% of the Co atoms in a Co3O4-like atomic configuration after the complete FCC-to-HCP phase transformation. Furthermore, modelling of the XANES spectra demonstrates that the changes observable upon irradiation cannot be the result of Co atoms in an oxidized environment only and stem from the FCC-to-HCP phase transformation [86].
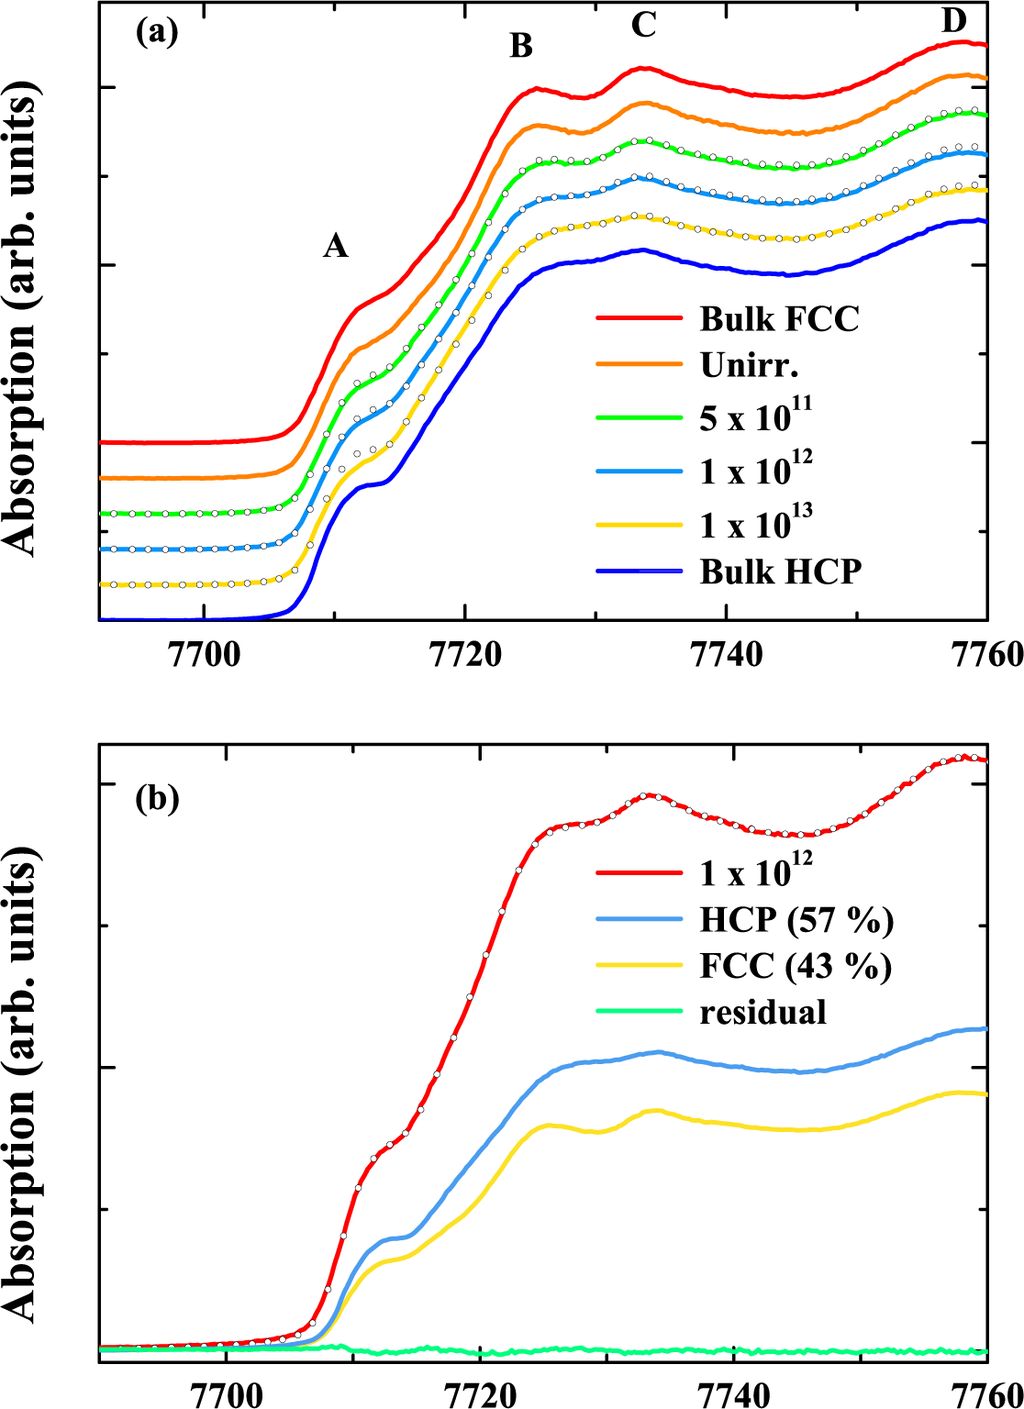
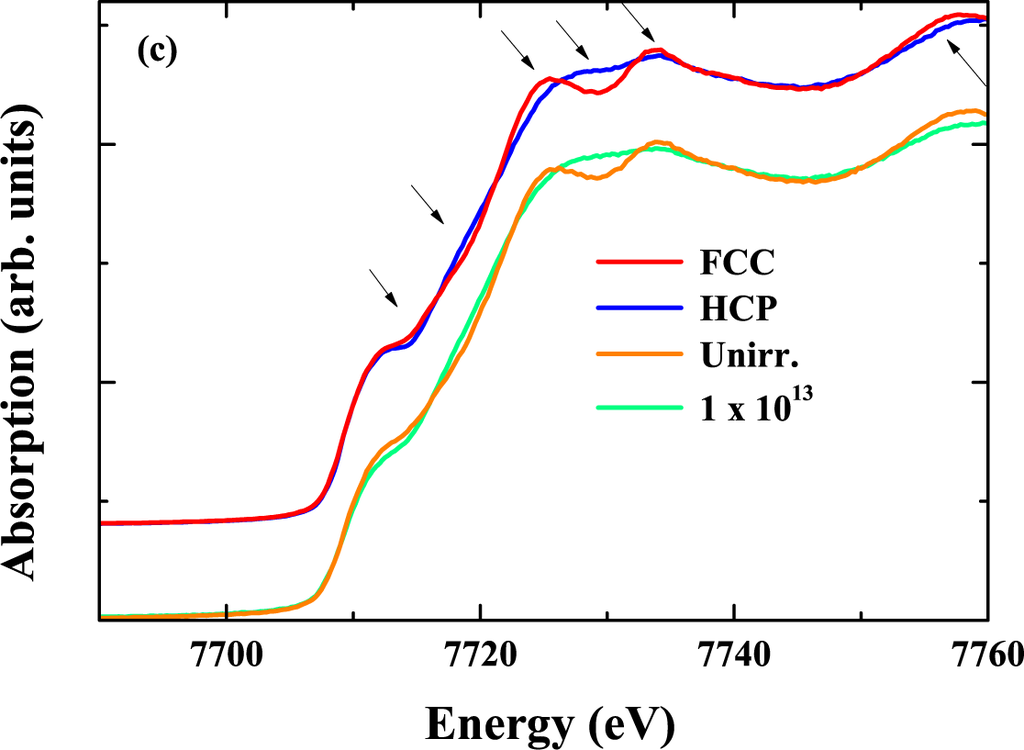
Figure 18.
(a) XANES spectra for bulk standards, unirradiated and swift heavy ion irradiated (185 MeV) NPs as a function of fluence (/cm2). Circles represent the linear-combination fits to the experimental data (spectra vertically offset for clarity); (b) The separate FCC and HCP contributions to the 1 × 10¹²/cm2 sample; (c) Comparison of bulk FCC vs. HCP standards and unirradiated vs. phase transformed NPs. Arrows indicate features characteristic of the FCC-to-HCP phase transformation.
Figure 19 shows the HCP fraction as a function of fluence over the given range of irradiation energies. The fitted lines were generated with the overlap model [87]:
where ΔC and Cs are the relative and total increase in concentration of the HCP phase, respectively, ϕ is the irradiation fluence and σ is the interaction cross section for the phase transformation. The best fit was achieved with n = 1 and thus a direct-impact mechanism appears operative. For irradiation energies of 9–54 MeV, the rate of transformation clearly increases with energy, demonstrating the process is governed by Se. Above 54 MeV, the rate saturates and is independent of irradiation energy. Irradiation of bulk Co HCP and FCC standards (of thickness 250 nm) yielded no change in crystallographic phase.
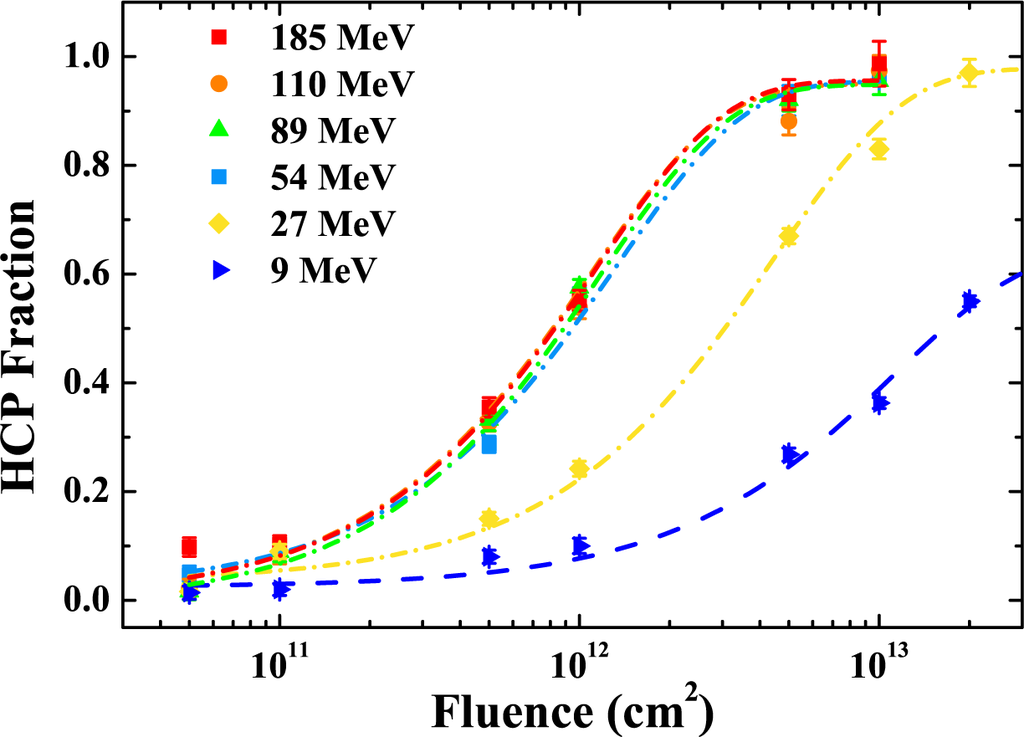
Figure 19.
HCP fraction in irradiated NPs as a function of fluence. Fitted lines were derived from the overlap model (Equation (3)).
The FT EXAFS spectra for the bulk HCP, FCC, unirradiated and transformed NPs are shown in Figure 20. Distinguishing between the FCC and HCP phase is difficult with EXAFS, as both have similar BL and CN in the first and second NN shells. One visible difference between the bulk HCP and FCC phases is an increase in amplitude for the fourth NN in FCC Co (Figure 20). This is a typical feature of FCC metals and is primarily due to the collinear multiple scattering of the photoelectron [88–90]. The slight decrease in amplitude of the first NN for the transformed NPs is due to a decrease in CN (10.8 compared to 11.3 for the unirradiated NPs) and increase in the static disorder
. The decrease in the CN is the result of the ∼5% oxide and correcting the CN for this small component results in an increase to 11.2.
Figure 20.
Phase corrected FT EXAFS spectra for bulk HCP and FCC Co, unirradiated FCC NPs and phase transformed HCP NPs with spectra offset for comparison. Open circles represent fits to experimental data.
As shown in Section 3, the FCC and HCP phases have different vibrational properties with Einstein temperatures (ΘE) that differ by ∼10 K. As such, a change in phase to HCP should also yield an increase in the ΘE for the phase transformed NPs. The temperature dependence of the σ2 is shown in Figure 21. The solid lines are the corresponding fits with Equation (1). The ΘE values and results form the EXAFS analysis are given in Table 8. The ΘE and
values for bulk HCP Co, bulk FCC Co and FCC NPs given in Table 8 agree with those previously calculated in Sections 3 and 4. After irradiation (185 MeV, 1 × 10¹³/cm2) the increase in the ΘE further validates the phase transformation quantified from the XANES analysis. The slight increase in
for the transformed NPs is similar to the value determined in Section 3 for 5.4 nm HCP NPs and is the result of a SHII-induced increase in disorder.
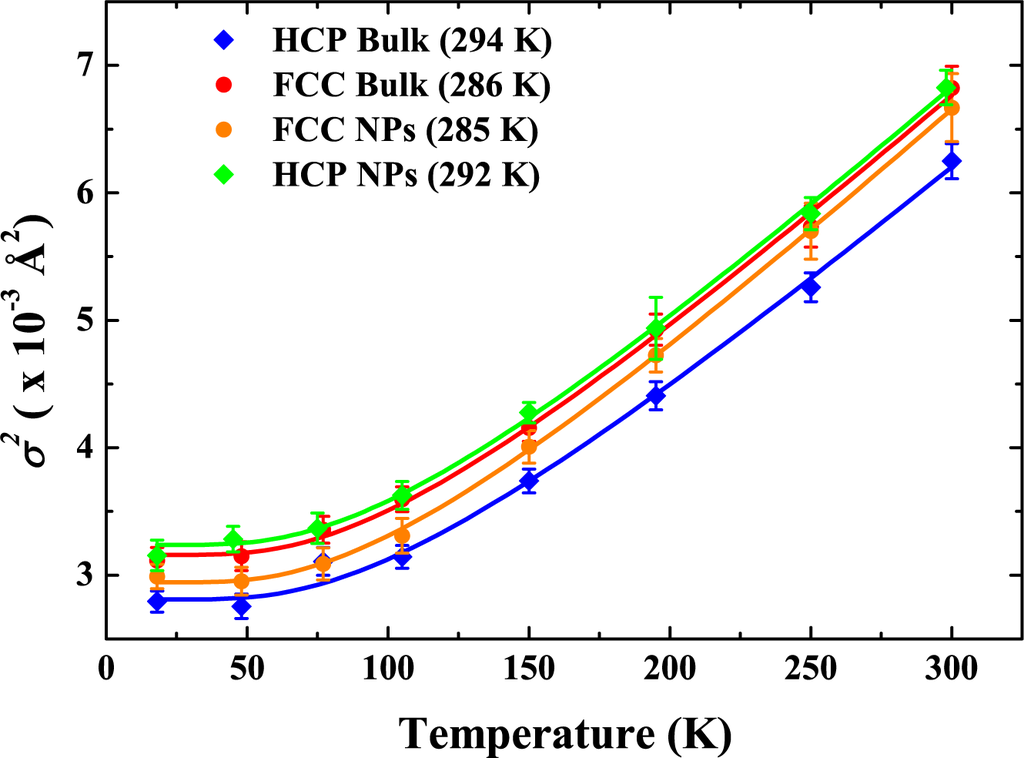
Figure 21.
Temperature dependence of the σ2 for HCP and FCC bulk standards, unirradiated FCC NPs and phase transformed HCP NPs. The lines represent the fits with the correlated anharmonic Einstein model (Equation (1)).
Table 8.
Structural parameters, Einstein temperature (ΘE) and structural disorder
for HCP and FCC bulk standards, unirradiated FCC NPs and phase transformed HCP NPs.
Earlier observations of swift heavy ion irradiation-induced phase transformations in bulk metals [91] and oxides [92,93] differ from the transformation reported herein. For example, Benyagoub et al. observed the transformation in zirconia and hafnia from a phase stable at ambient conditions to a high-temperature/high-pressure phase intuitively consistent with a rapid, post-thermal-spike quench [92,93]. In contrast, Figures 17–21 demonstrate the opposite for Co NPs where an irradiation-induced transformation from FCC (stable at high-temperature/high-pressure in bulk material) to HCP (stable at ambient conditions in bulk material) is apparent. The FCC-to-HCP transformation in bulk Co is martensitic and only proceeds when, in the presence of external forces, a critical shear energy is exceeded [24]. In free-standing Co NPs [24], this barrier (∼0.016 kJ/mol) can be overcome via the shear stress applied through mechanical grinding. In free standing SiO2 films irradiated with swift heavy ions, large shear stresses result from the rapid thermal expansion of the cylindrical ion track [94–96] and depending on the energy of the incident ion, the single-ion induced local stress can be in excess of 300 MPa. The effects of both LEII and SHII on the stress state of constrained SiO2 films have also been intensively studied [96–99]. Two opposite trends in the stress state have been measured and are dependent on the irradiation temperature, energy and fluence. Low fluence irradiation results in a transformation from compressive to tensile stress. This transformation is due to the structural changes that compact the SiO2 network. After a maximum tensile stress is reached, the stress relaxes back to a compressive state via Newtonian viscous flow and also saturates at a few hundred MPa. This saturation in compressive stress is a result of a dynamic competition between the generation of compressive anisotropic stress (with energy-dependent strain rate, or deformation yield) and stress relaxation due to Newtonian viscous flow. Thus, the shear stress in SiO2 resulting from the formation of an ion track or the macroscopic build-up of stresses in the constrained SiO2 host matrix may well drive the FCC-to-HCP phase transformation in Co NPs.
It was recently demonstrated that the radial density distribution of an ion track resulting from SHII is consistent with a frozen-in acoustic pressure wave [100]. Figure 22 compares the interaction cross section for the irradiation-induced FCC-to-HCP phase transformation for Co NPs in SiO2 (derived from Equation (3)) with the irradiation-induced latent ion-track cross-section in SiO2 (derived from SAXS measurements [100]) as a function of Se. The two are reasonably well correlated though, as noted above, the interaction cross-section appears to saturate at high Se, potentially the result of a similar rate of stress generation at these high energies. For the irradiation energies used in this section, Se exceeded that necessary for molten ion track formation in SiO2 (∼2 keV/nm [95,101,102]). The transformation model described above does not necessitate molten Co and, in fact, thermal spike calculations [31] predict the threshold Se for a molten track in bulk Co is ∼30 keV/nm and, referring to Table 1, melting is thus not anticipated at energies below 89 MeV for bulk Co.
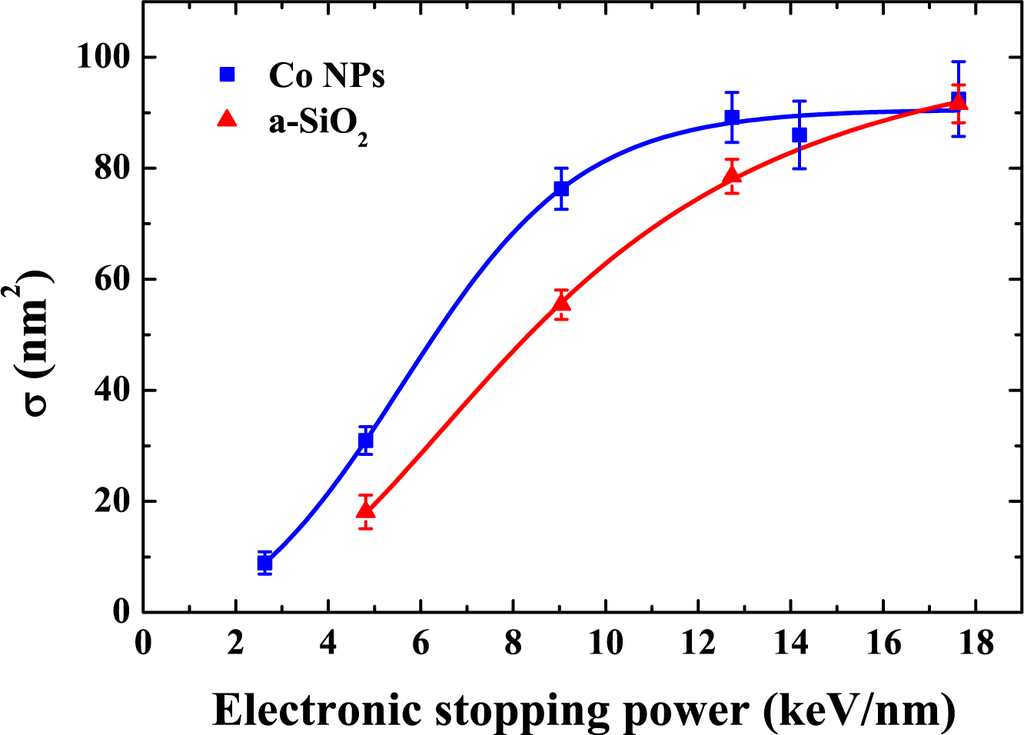
Figure 22.
Interaction cross section for the FCC-to-HCP phase transformation of Co NPs in SiO2 and the molten ion track cross section in SiO2 both as a function of electronic stopping power [100].
5.3. Summary
In summary, SHII energy-dependent changes in the crystallographic phase of Co NPs embedded in SiO2 were observed. Prior to SHII, the NPs were FCC in phase. The complete FCC-to-HCP phase transformation was observed after low fluence ion irradiation. SHII of bulk FCC and HCP Co resulted in no phase transformation. The evolution of the HCP and FCC crystallographic fractions was quantified by XANES. The vibrational properties of the phase-transformed NPs were probed with temperature-dependent EXAFS measurements. The Einstein temperatures determined from the EXAFS analysis further confirm the phase transformation quantified by ED and XANES analysis. The irradiation-induced FCC-to-HCP transformation in the Co NPs was the result of a direct-impact, electronic stopping-power-dependent process attributed to the SHII-induced shear stress associated with the rapid thermal expansion about a molten ion track in SiO2.
6. Swift Heavy Ion Irradiation-Induced Shape and Structural Changes in Cobalt Nanoparticles
6.1. Introduction
In this section, the effects of SHII on both the shape and structure of embedded Co NPs in SiO2 formed by ion implantation and thermal annealing are studied in detail. Results presented here also extend the previous work of D’Orléans et al. [78,103–105] with the demonstration of various Se-dependent shape and structural changes.
Large 12.0 ± 2.3 nm Co NPs (as determined by both TEM and SAXS shown below) were prepared by ion implantation and thermal annealing. Samples were subsequently irradiated at room temperature with 197Au ions at 27, 89 or 185 MeV over a wide fluence range of 1012–1014/cm2 at normal incidence.
6.2. Results
Figure 23 shows bright-field XTEM images and corresponding minor and major dimension distributions for the Co NPs before and after 89 MeV SHII. The figure also demonstrates the Co NPs transform into nanorods along the incident ion beam direction, consistent with previous studies [78,103]. The elongation process is clearly cumulative with samples requiring fluences of the order 1013/cm2 (or ∼200 overlapping impacts for an ion track of dimension 9.8 nm). Included in Figure 23(f) is a high resolution XTEM micrograph that shows a number of smaller spherical “satellite” NPs surrounding an elongated NP. Figure 23(d,f,h) also show that the minor dimension distributions determined from the XTEM analysis are narrow and Gaussian in shape. The major dimension distributions, however, are considerably broader and Log-Normal in form. The evolution of the nanorod aspect ratio calculated from the XTEM analysis for the 89 MeV sample set is shown in Figure 24. Each point in Figure 24 represents the mean value of the minor dimension for a given major dimension (±1 nm) and was determined by counting ∼600 NPs for each fluence. This figure demonstrates that there is a threshold (minimum) size for elongation of ∼6.5 nm for 89 MeV Au ion irradiation. NPs larger than this threshold elongate with ion fluence and the minor dimension saturates at approximately the same value as the threshold for shape transformation. The greatest aspect ratios were observed at intermediate fluences and with increasing fluence (>6 × 10¹³/cm2) the aspect ratio decreased due to NP dissolution indicated with an arrow in Figure 24.
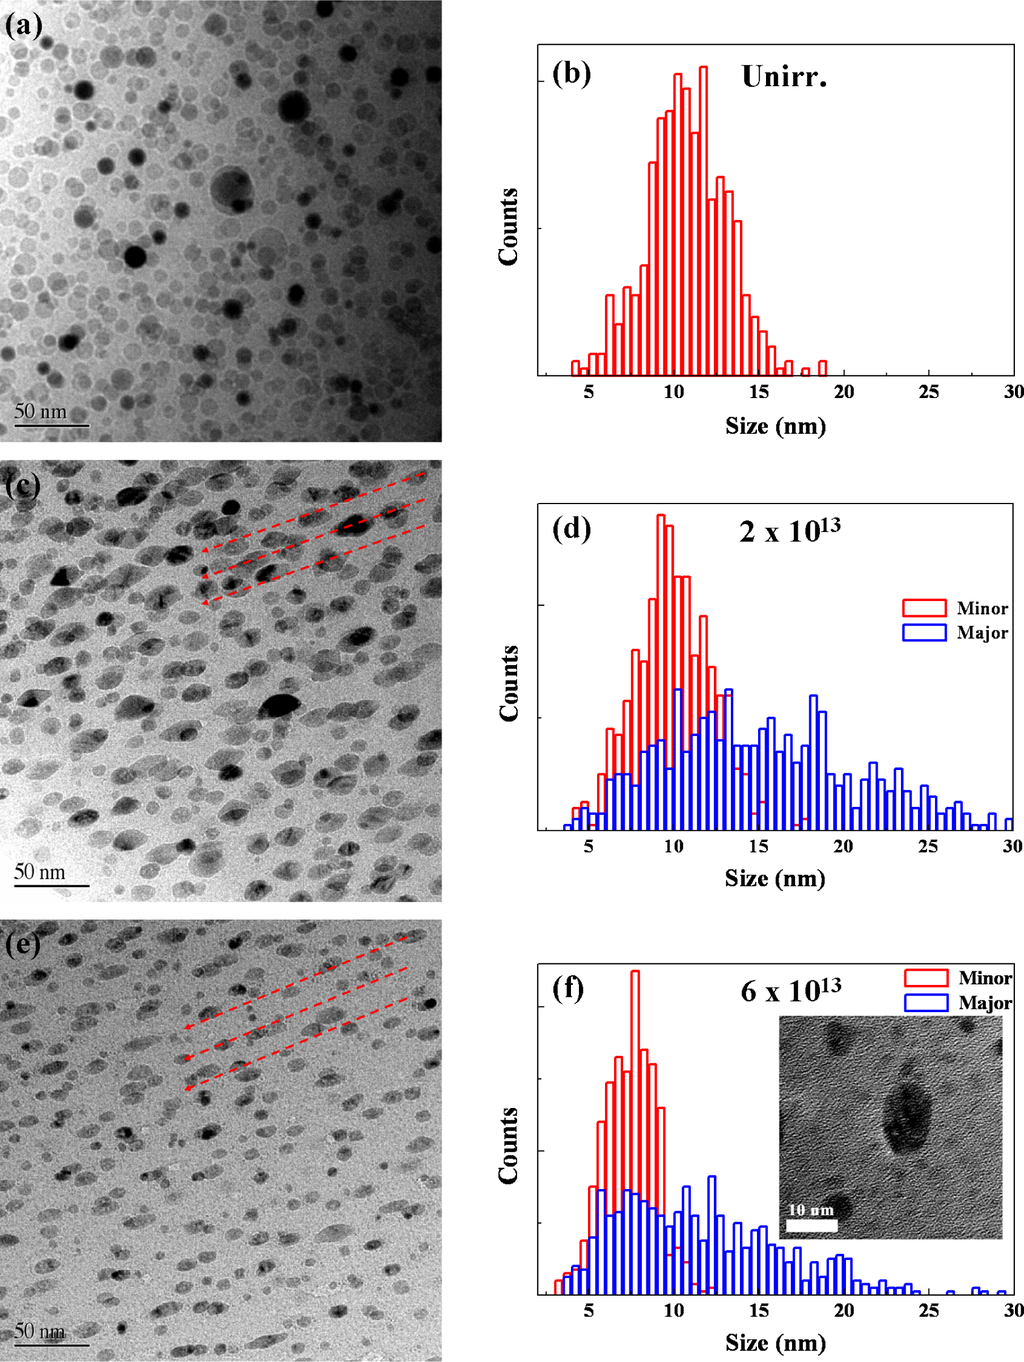
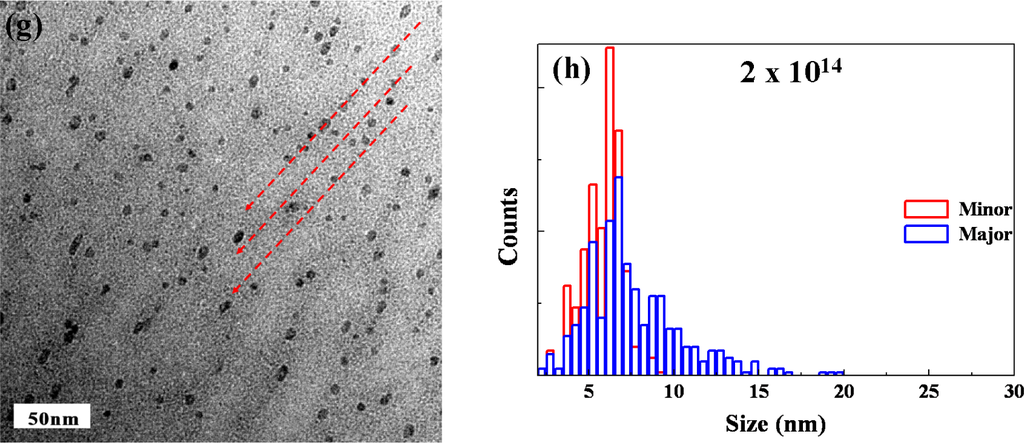
Figure 23.
Bright field XTEM micrographs (a), (c), (e), (g) and corresponding size distributions (b), (d), (f), (h) as a function of fluence for Co NPs under 89 MeV Au irradiation (/cm2). Red arrows indicate the direction of the ion beam.
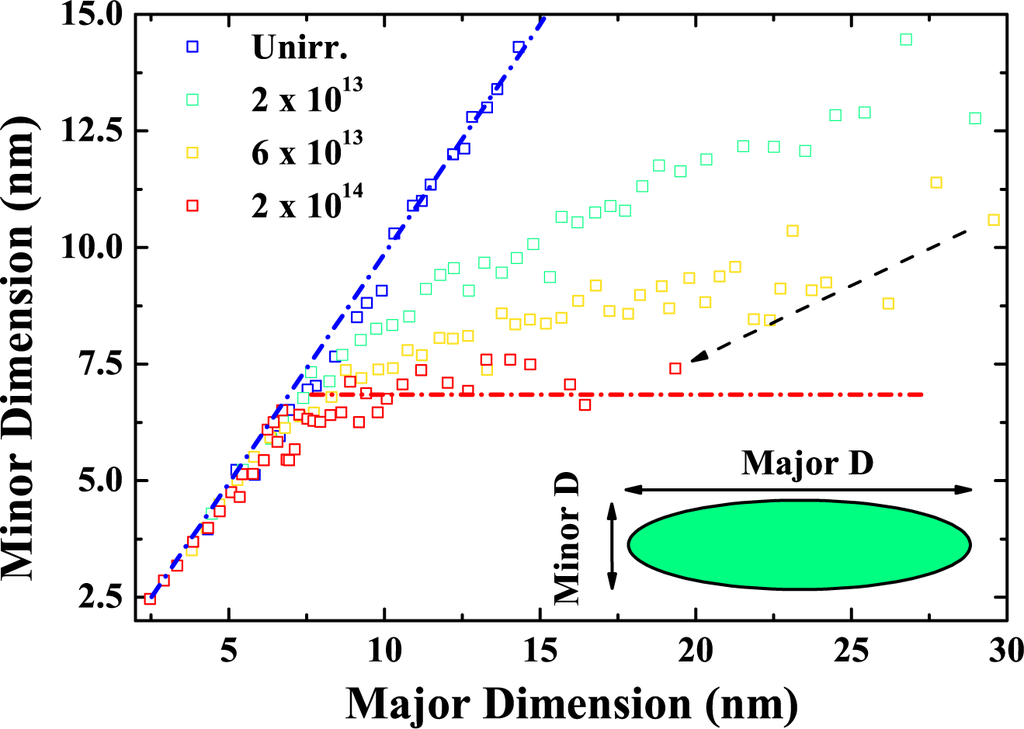
Figure 24.
NP minor dimension verses major dimension as a function of fluence (/cm2) for 89 MeV Au irradiation.
Complementary determinations of the nanorod minor dimensions and also the evolution of the small NPs were achieved via SAXS. The isotropic scattering from samples was analysed to determine the minor dimension. Figure 25(a) shows the background-corrected scattering intensity for the Co NPs as a function of Q following 89 MeV Au irradiation [106]. The oscillations in the scattering intensity at high fluences are indicative of a narrowing of the distribution. The reconstructed minor dimension distributions are shown in Figure 25(b). The size distributions determined from both XTEM and SAXS for the unirradiated sample are superimposed in the inset of Figure 25(b) for comparison and agreement between the two different techniques is apparent. A decrease in intensity is observed for the 2 × 10¹⁴/cm2 sample and is indicative of NP dissolution as discussed in the following section. Similar trends were observed for all irradiation energies. The narrowing of the minor dimension distributions with increasing ion fluence is in agreement with the XTEM results presented above. The population of NPs with diameters <5 nm is attributed to the small spherical “satellite” NPs, apparent in the XTEM images at high resolution (Figure 23(f)). Although the XTEM size distributions include satellite NPs, the bimodal shape, like that in Figure 25(b), is not apparent. Statistical limitations apply to the XTEM analysis with distributions generated by counting ∼600 NPs. SAXS, on the other hand, probes a much larger volume of NPs and is thus more reliable from a statistical viewpoint. The saturation in the minor dimension extracted from the XTEM analysis is plotted in Figure 26 as a function of Se in SiO2. The Au ion track widths determined for SiO2 from SAXS experiments [100] are also included for comparison and indicate that the elongation is confined by the molten ion track.
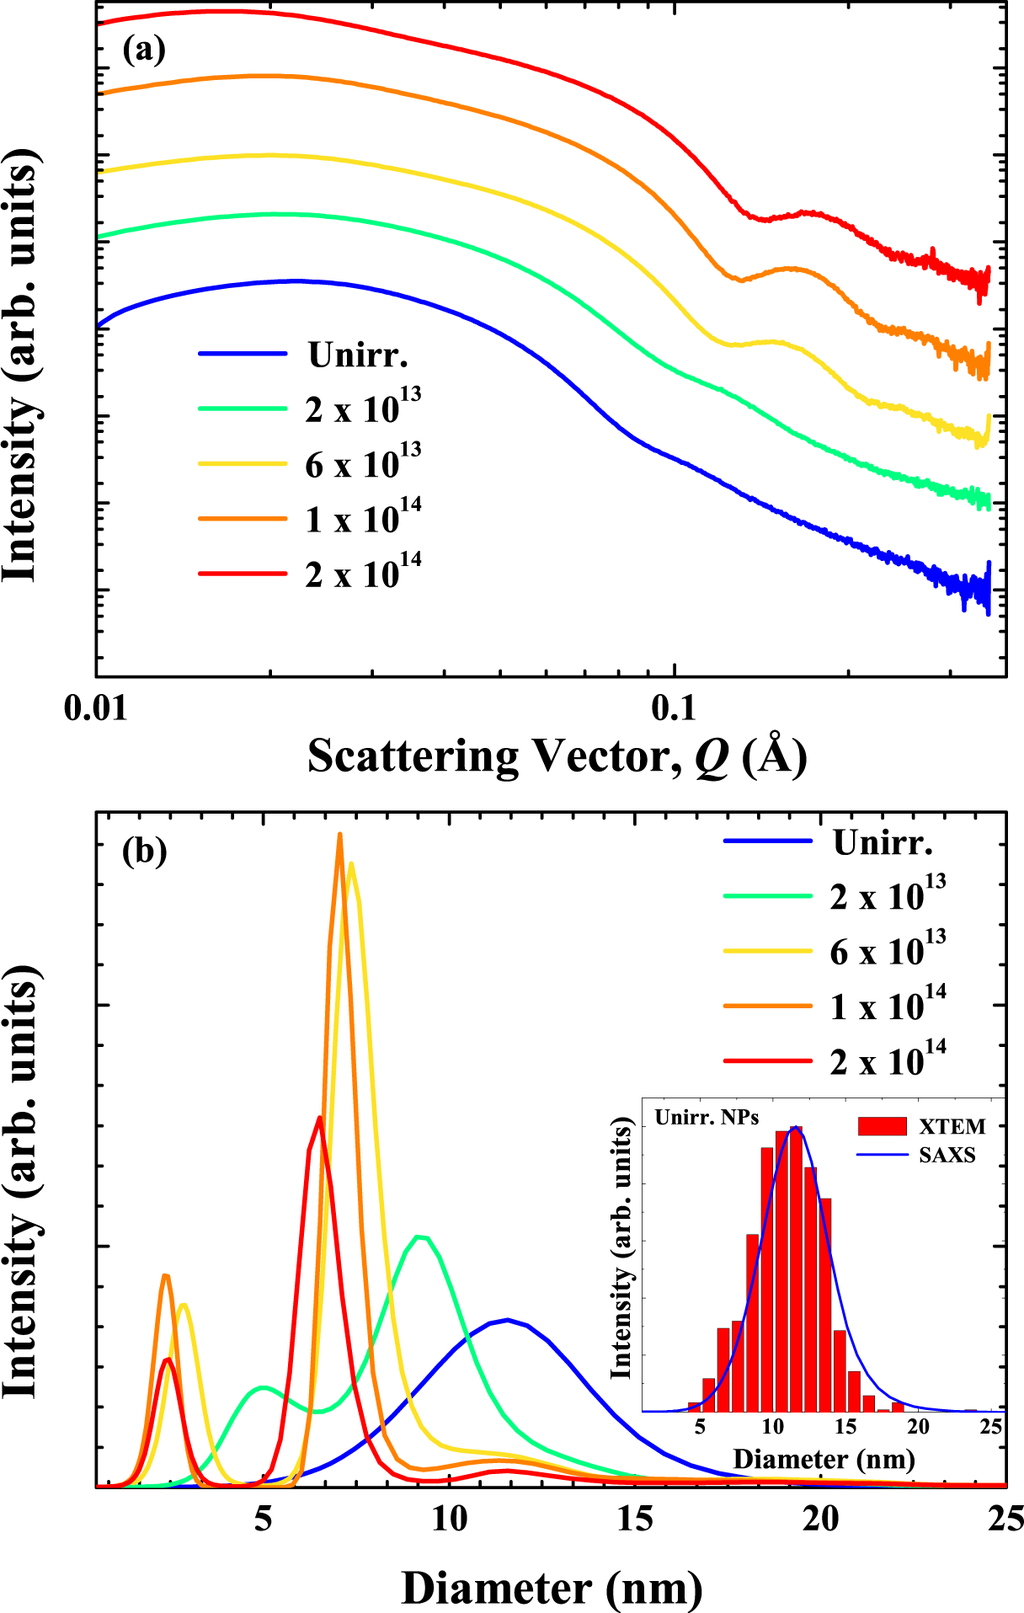
Figure 25.
a) Background corrected SAXS scattering intensity as a function of scattering vector Q and (b) the corresponding minor dimension distributions for Co NPs irradiated with 89 MeV Au ions at different fluences. The inset compares XTEM and SAXS distributions.
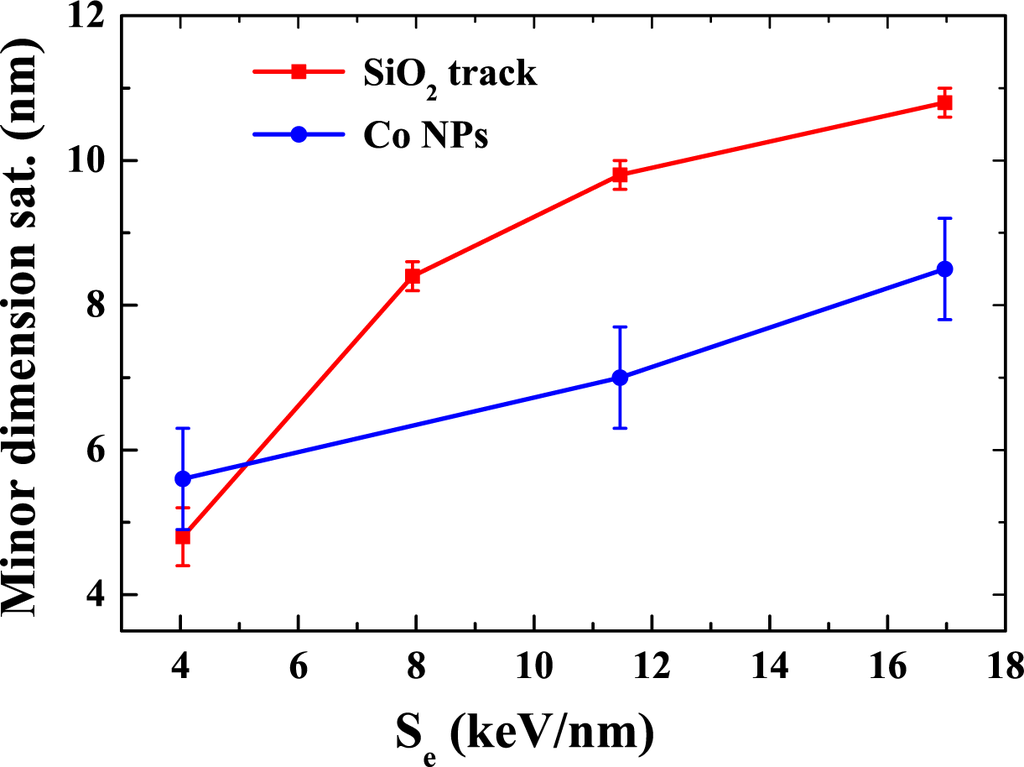
Figure 26.
Saturated minor dimension for Co NPs and SiO2 ion track diameter as a function of electronic energy loss in SiO2.
The SHII-induced shape transformation of Co NPs was first observed by D’Orléans et al. [78]. They attributed the elongation to NP melting and creep deformation induced by an overpressure due to differences in volume expansion and compressibility of the metallic NP and insulating host matrix. A stress-driven deformation of the SiO2 matrix due to SHII-induced in-plane strain perpendicular to the ion beam direction has also been suggested as a potential elongation mechanism [107]. The latter leads to the well known “ion hammering” effect [108,109] causing the anisotropic expansion of both bulk SiO2 [95,110] and colloidal SiO2 [111,112] perpendicular to the incident beam. The lack of NP elongation in the absence of a sufficiently thick surrounding matrix, as shown by Penninkhof et al. [113], supports this theory. Calculations using a viscoelastic model [114], however, show that the strain generated by the incident ions in the SiO2 matrix alone is insufficient to deform the Co NPs. Furthermore, the strain mechanism cannot explain the observed Se-dependent saturation of the NP width.
As discussed above, the correlation between the minor dimension and the molten ion track diameter shown in Figure 26 suggest that the elongation is confined by the ion track. We have recently reviewed the material-dependent saturation in the minor dimension for various metallic NPs and have shown that the energy deposited in the NPs also explicitly plays an active role in the elongation process (i.e., SHII-induced melting) [115]. Recently, thermal spike calculations have shown that Au NPs of certain sizes do in fact melt under SHII [116,117]. The Se-dependent elongation of Co NPs presented here are hence potentially the result of a combination of NP melting and in-plane strain where the elongation is potentially a means of relaxing such strain [118].
The atomic environment of the Co NPs, as a function of SHII energy and fluence, was determined from XANES analysis, an example of which is shown in Figure 27(a). Prior to SHII the NPs were FCC in phase. At low fluences, before any significant change in NP shape, the FCC-to-HCP phase transformation was observed, as presented in Section 5. Figure 27(a) shows that with increasing fluence the NPs undergo further changes relative to the unirradiated and bulk spectra, including a decrease in intensity of the edge feature at 7,710 eV, a “smearing” of the features at 7,726, 7,730 and 7,760 eV and a shift of the absorption-edge to higher energy. All such changes are characteristic of oxide formation [119]. A linear combination fit of the XANES region was performed to quantify the fraction of Co in metallic and oxidised phases. Examples of the fitting are included in Figure 27(a). The oxide phase is non-crystalline and has characteristic features of a “molecular oxide”. In fact, the oxide structure observed from the XANES is similar to the as-implanted, NP-free state (labelled “oxide” in Figure 27(a)). The metallic and oxide fractions are reported in Figure 27(b) as functions of SHII fluence and energy. After high fluence irradiation the fraction of Co atoms in the metallic phase decreases with a concomitant increase in the fraction of Co atoms in an oxidised state. The increase in the fraction of oxidised Co atoms is attributed to the dissolution of the Co NPs. Figure 27(b) also shows that the dissolution rate is enhanced with an increase in Se and thus the process is not ballistic.
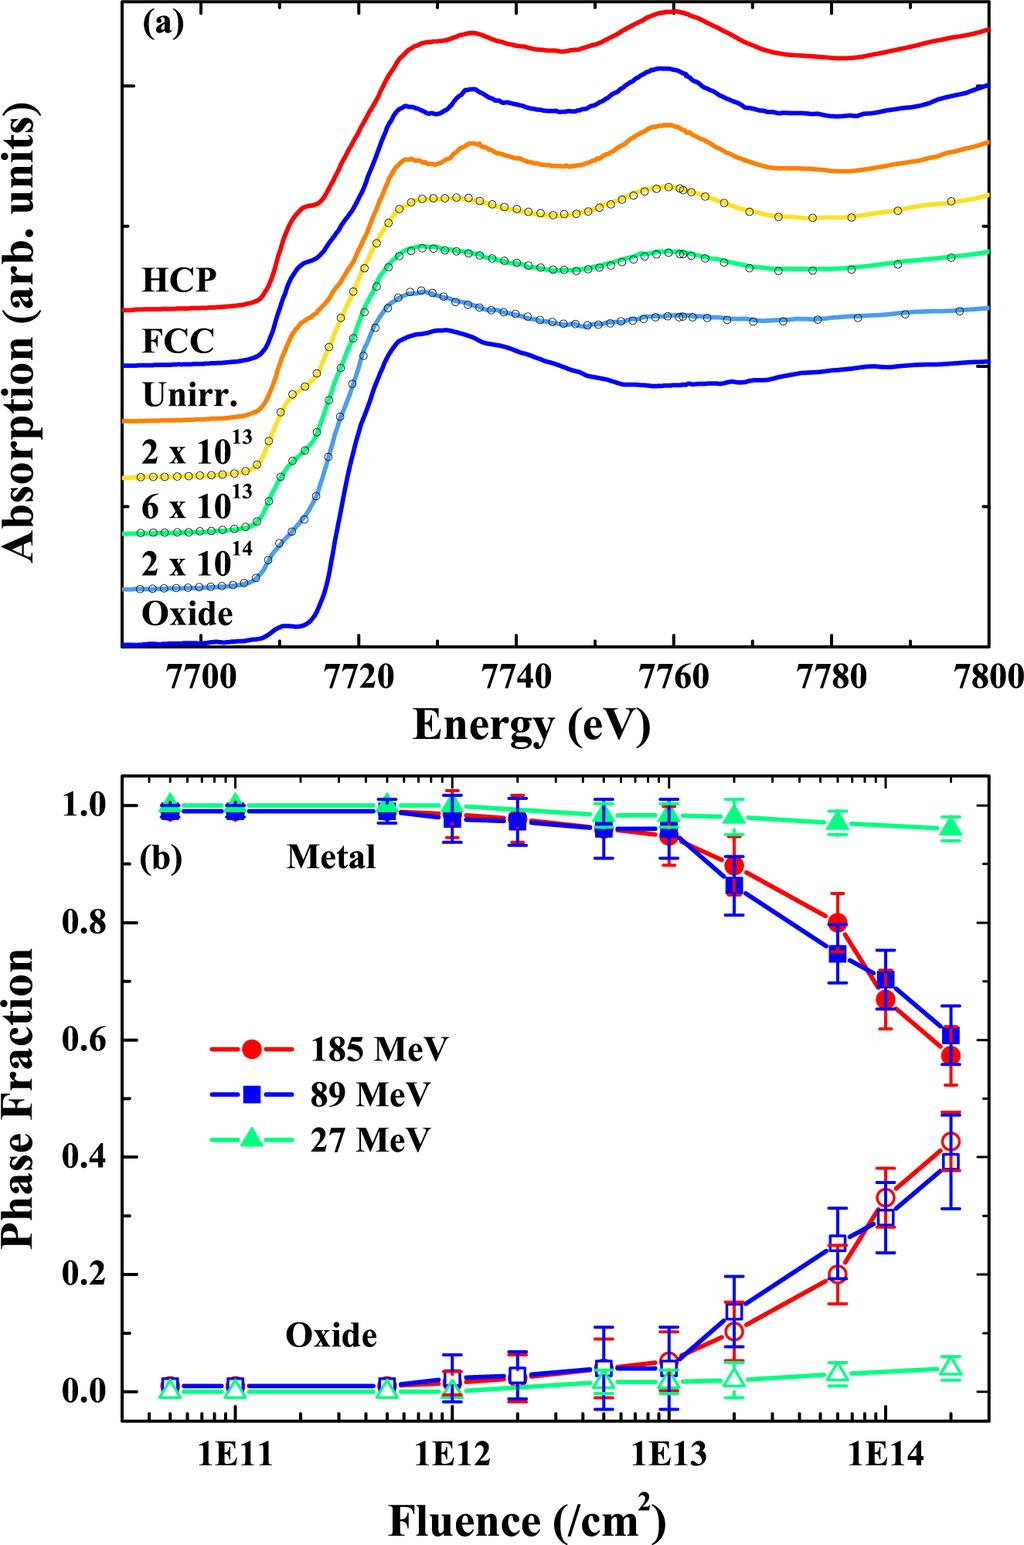
Figure 27.
(a) XANES spectra for bulk standards and NP samples irradiated at 185 MeV as a function of fluence (/cm2). Open circles in (a) represent linear combination fits to experimental data with oxide and metal standards; (b) The metallic and oxide fractions determined from the XANES analysis for the irradiated NP samples as a function of SHII energy and fluence.
The XTEM, SAXS and XANES results presented herein clearly demonstrate that the volume fraction of NPs embedded in the SiO2 is not conserved upon irradiation in contrast to previous reports [78,103–105]. Furthermore, SHII of thin 3d transition metal oxides and composite layers results in interface modification [120,121], phase formation [122] / transformation [123] and atomic mixing. In these studies, the interdiffusion / modification of the thin layers was found to be enhanced with an increase in Se and attributed to the interdiffusion of material within the molten ion track. The dissolution of the Co NPs quantified via the XANES analysis is also attributed to the molten state reactions within and around the molten ion track. The Se-dependent changes, specifically the increase in the dissolution rate for higher Se, are attributed to the Se-dependent temperature profile and molten ion track diameter leading to an increase in the dissolved fraction of Co in SiO2.
Structural parameters for the irradiated Co NPs were determined from EXAFS. Figure 28(a) displays the k3-weighted EXAFS for the bulk standards, unirradiated NPs, NPs irradiated at 185 MeV as a function of fluence and oxide standard (Co implanted, NP free SiO2). The amplitude of the EXAFS signal decreases as the ion fluence increases. Figure 28(b) shows the corresponding phase-corrected FT spectra. Prior to SHII, the NP spectrum is comparable to the FCC standard. Upon irradiation, changes in the amplitude are readily observable. No Co–O contribution at ∼1.8 Å is apparent in the spectra even for samples with ∼50% oxide fraction since O is a weak scatterer and the Co–O bonds are highly disordered. Note that different k-weights and different FT ranges did not enable a reliable fit to the experimental data. As such, no results have been reported for Co–O shell.
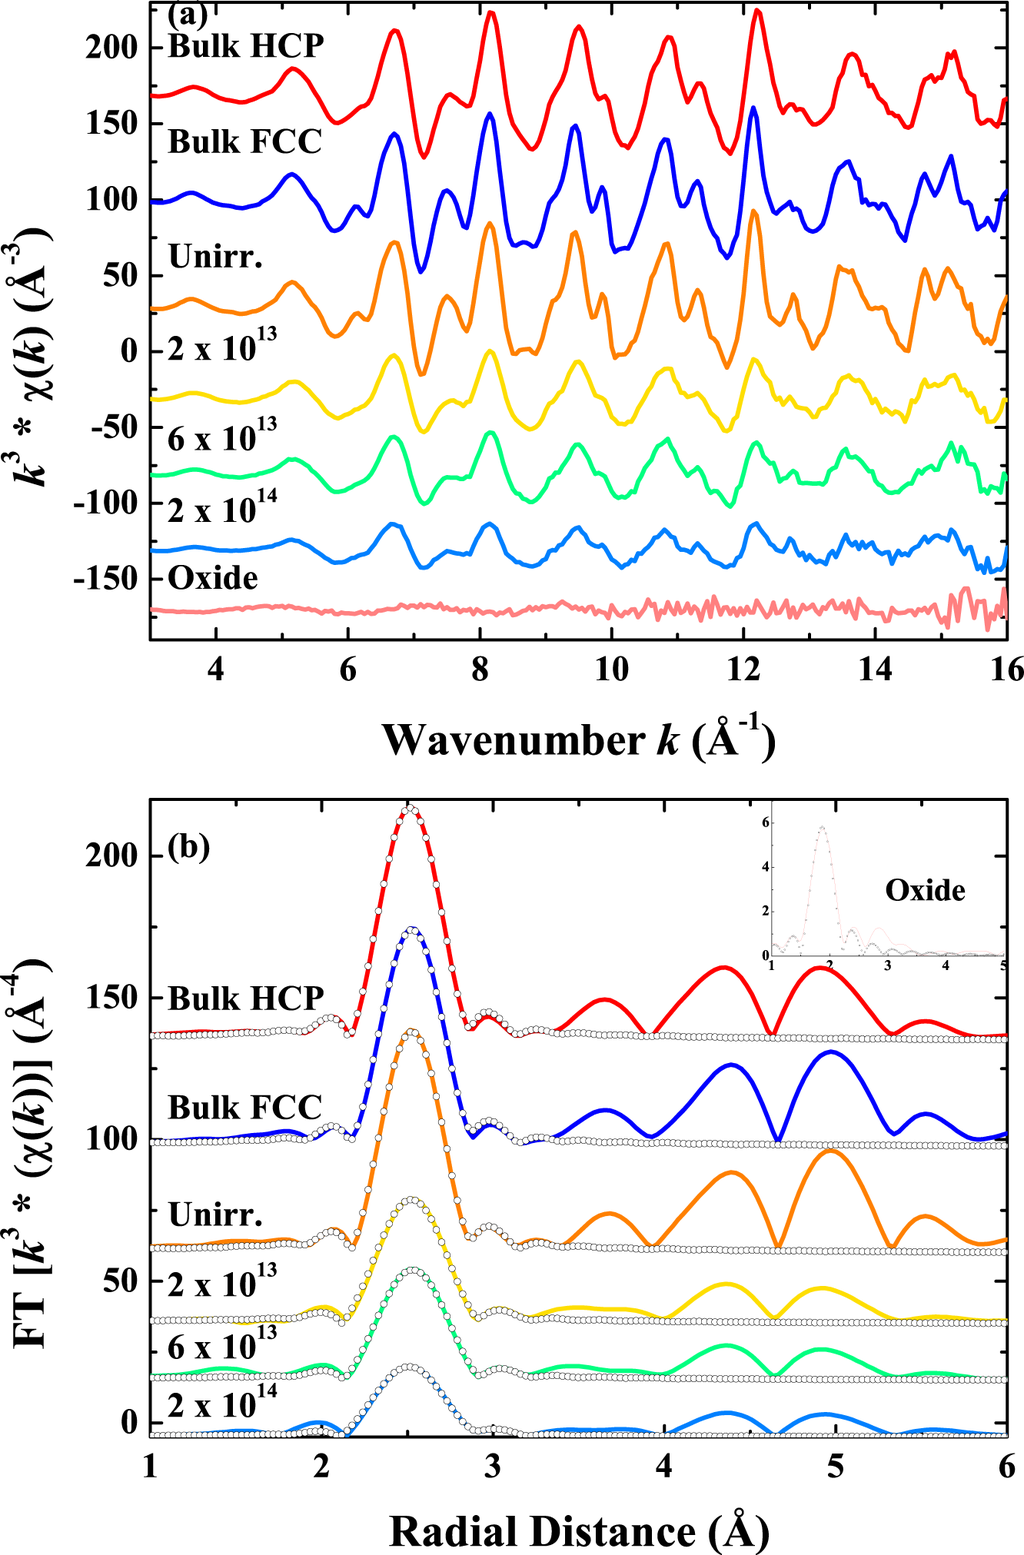
Figure 28.
(a) EXAFS spectra and (b) corresponding FTs for the bulk standards and NP samples irradiated at 185 MeV as a function of fluence (/cm2). Spectra are offset vertically for clarity. Open circles represent fits to experimental data.
The evolution of the σ2, BL, C3 and CN determined from the EXAFS analysis for the different SHII energy and fluence combinations is shown in Figure 29(a–d), respectively. Prior to SHII, the NP structural parameters are similar to bulk FCC Co as anticipated for these large NPs. Figure 29 readily shows Se-dependent structural modifications with higher Se values resulting in the rapid increase (σ2), or decrease (CN, BL, C3) in the structural properties of the Co NPs with increasing ion fluence.
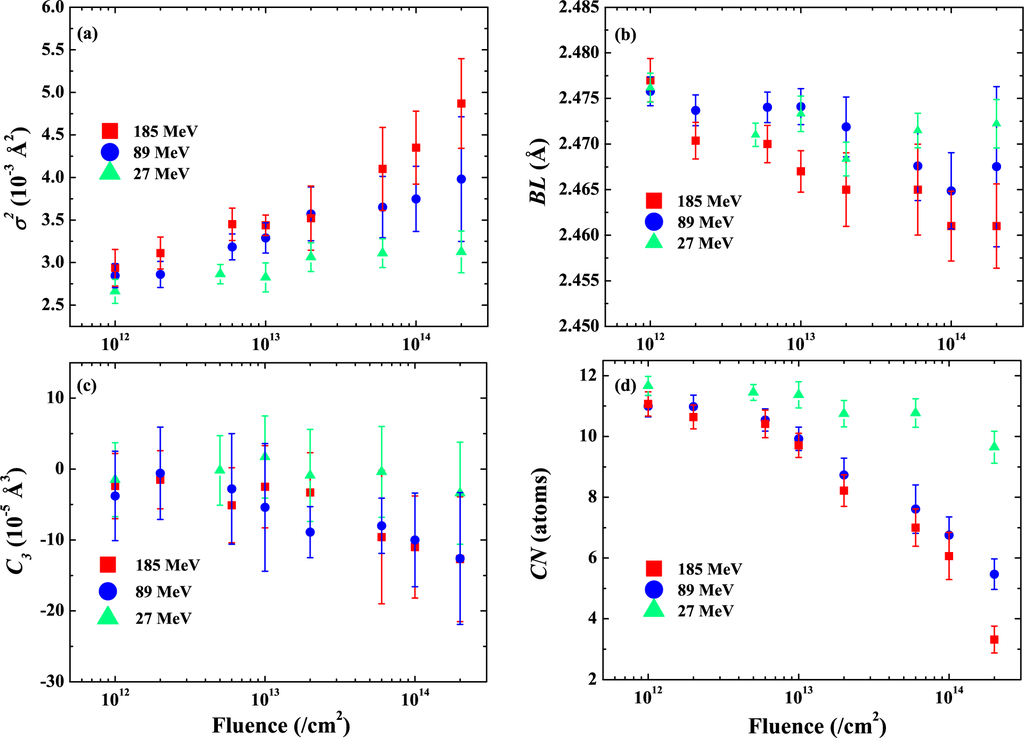
Figure 29.
Results from the EXAFS analysis for the first NN shell (a) σ2, (b) BL, (c) C3, and (d) CN for irradiated samples as a function of ion energy and fluence.
XAS, like SAXS, is sensitive to the volume fraction of the different absorber-scatter environments present in a sample. For the irradiated NP samples, two different Co atomic environments have been identified with XAS: (i) metallic Co atoms from the NPs (made up of both large elongated NPs and small spherical NPs) and (ii) Co atoms dissolved in the matrix and bonding at the NP surface that increase in fraction with ion fluence. As discussed above, (i) is the result of the SHII-induced shaping while (ii) is attributed to the dissolution of the NPs with ion fluence. As discussed in Section 3, the σ2, BL, CN and C3 are influenced by the Co NP size. The SHII-induced changes in these structural parameters with ion fluence are attributed to (i) and the increasing SBR for both the elongated and small NPs. Furthermore, the CN calculated from EXAFS is also sensitive to the fraction of atoms dispersed in the matrix as dimers/trimers [72] or in an oxidised state (ii) [46,124,125]. The fraction of oxidised atoms cannot be determined from the XTEM and SAXS analysis and are instead determined from the XANES analysis. The CN values shown in Figure 29(d) have not been corrected for the fraction of Co atoms in an oxidised environment or for the fraction of dimers/trimers, and are thus considerably low. In addition, the presence of the dimers/trimers may also contribute to the observed BL contraction and increasing negative C3 with ion fluence shown in Figure 29.
6.3. Summary
In summary, various Se-dependent shape and structural changes in Co NPs embedded in SiO2 were measured. XTEM and SAXS analysis revealed NPs below a threshold size remained spherical in shape and progressively dissolved in the matrix with increasing fluence. NPs above the threshold size transformed into nanorods with their major dimension parallel to the incident ion beam direction. The nanorod width saturates at a value that increases with Se and was directly correlated to the molten ion track in SiO2. The elongation mechanism was consistent with the elongation of a once-spherical molten NP confined to the diameter of the molten ion track in SiO2. The results demonstrate the usefulness of SHII as a technique for the fabrication of aligned, elongated NPs with specific dimensions.
The atomic-scale structure of the NPs as a function of SHII energy and fluence were determined by XAS. Prior to SHII, analysis of the XANES region demonstrated that all Co atoms were in a metallic environment. After SHII, however, two distinct environments gave rise to the observed changes in the XANES and EXAFS signals: Co atoms in a metallic environment attributed to the elongated and spherical NPs; and a non-crystalline fraction from oxidised Co atoms and clusters (dimers/trimers) dispersed in the matrix. Structural changes in the NP ensemble, including a decreasing BL and C3 and increasing σ2 with ion fluence, were attributed to the increasing SBR for the elongated and small spherical NPs while the reduction in the measured CN was attributed to the increase in the fraction of small Co clusters.
7. Conclusions
The results presented in this article represent a valuable contribution to understanding the relationship between the formation conditions and structural parameters of Co NPs formed by ion beam synthesis. Characterisation of the size and crystallographic phase-dependent trends has yielded further insight into the influence of finite size effects on the structural parameters like bondlength, coordination number and disorder, as well as the vibrational properties.
This work also contributes to a richer understanding of the mechanisms involved in ion-solid interactions on the nanoscale, with Co NPs showing a wealth of shape and structural transformations not observable in bulk. Highlighted examples discussed here include the size-dependent amorphous phase formation; the SHII-induced FCC-to-HCP phase transformation; and finally a multitude of SHII-induced shape and structural transformations. Our results demonstrate that the size, shape and structure of Co NPs can all be readily controlled by ion irradiation. Moreover, this methodology potentially represents an effective means of controlling the Co NP properties to best suit specific technological applications.
Acknowledgments
This work was financially supported by the Australian Synchrotron and the Australian Research Council. ChemMatCARS Sector 15 is principally supported by the National Science Foundation/Department of Energy under Grant No. NSF/CHE0822838. Use of the Advanced Photon Source was supported by the U.S. Department of Energy, Office of Science, Office of Basic Energy Sciences, under Contract No. DE-AC02-06CH11357. DJS wishes to extend thanks to H. Amekura and G. Rizza for stimulating scientific discussions.
References
- Kelly, K.L.; Coronado, E.; Zhao, L.L.; Schatz, G.C. The optical properties of metal nanoparticles: The influence of size, shape, and dielectric environment. J. Phys. Chem. B. 2003, 107, 668–677. [Google Scholar]
- Kreibig, U.; Vollmer, M. Optical Properties of Metal Clusters; Springer-Verlag: New York, NY, USA, 2010. [Google Scholar] [Green Version]
- Jensen, T.; Kelly, L.; Lazarides, A.; Schatz, G.C. Electrodynamics of noble metal nanoparticles and nanoparticle clusters. J. Clust. Sci. 1999, 10, 295–317. [Google Scholar]
- Daniel, M.C.; Astruc, D. Gold nanoparticles: Assembly, supramolecular chemistry, quantum-size-related properties, and applications toward biology, catalysis, and nanotechnology. Chem. Rev. 2004, 104, 293–346. [Google Scholar]
- Mulvaney, P. Surface plasmon spectroscopy of nanosized metal particles. Langmuir 1996, 12, 788–800. [Google Scholar]
- Murphy, C.J.; San, T.K.; Gole, A.M.; Orendorff, C.J.; Gao, J.X.; Gou, L.; Hunyadi, S.E.; Li, T. Anisotropic metal nanoparticles: Synthesis, assembly, and optical applications. J. Phys. Chem. B. 2005, 109, 13857–13870. [Google Scholar]
- Burda, C.; Chen, X.B.; Narayanan, R.; El-Sayed, M.A. Chemistry and properties of nanocrystals of different shapes. Chem. Rev. 2005, 105, 1025–1102. [Google Scholar]
- Meldrum, A.; Haglund, R.F.; Boatner, L.A.; White, C.W. Nanocomposite materials formed by ion implantation. Adv. Mater. 2001, 13, 1431–1444. [Google Scholar]
- Ercolessi, F.; Andreoni, W.; Tosatti, E. Melting of small gold particles: Mechanism and size effects. Phys. Rev. Lett. 1991, 66, 911–914. [Google Scholar]
- Lai, S.L.; Guo, J.Y.; Petrova, V.; Ramanath, G.; Allen, L.H. Size-dependent melting properties of small tin particles: Nanocalorimetric measurements. Phys. Rev. Lett. 1996, 77, 99–102. [Google Scholar]
- Olson, E.A.; Efremov, M.Y.; Zhang, M.; Zhang, Z.; Allen, L.H. Size-dependent melting of Bi nanoparticles. J. Appl. Phys. 2005, 97, 034304–034309. [Google Scholar]
- Frenkel, A.I.; Hills, C.W.; Nuzzo, R.G. A. View from the inside: Complexity in the atomic scale ordering of supported metal nanoparticles. J. Phys. Chem. B. 2001, 105, 12689–12703. [Google Scholar]
- Sun, S.; Murray, C.B. Synthesis of monodisperse cobalt nanocrystals and their assembly into magnetic superlattices. J. Appl. Phys. 1999, 85, 4325–4330. [Google Scholar]
- Puntes, V.F.; Krishnan, K.M.; Alivisatos, A.P. Colloidal nanocrystal shape and size control: The case of cobalt. Science 2001, 291, 2115–2117. [Google Scholar]
- Pankhurst, Q.A.; Connolly, J.; Jones, S.K.; Dobson, J. Applications of magnetic nanoparticles in biomedicine. J. Phys. D-Appl. Phys. 2003, 36, R167–R181. [Google Scholar]
- Ross, C. Patterned magnetic recording media. Ann. Rev. Mater. Res. 2001, 31, 203–235. [Google Scholar]
- Kitakami, O.; Sato, H.; Shimada, Y.; Sato, F.; Tanaka, M. Size effect on the crystal phase of cobalt fine particles. Phys. Rev. B. 1997, 56, 13849–13854. [Google Scholar]
- Mattei, G.; Maurizio, C.; Fernandez, C.D.; Mazzoldi, P.; Battaglin, G.; Canton, P.; Cattaruzza, E.; Scian, C. Nucl. Instrum. Methods Phys. Res. B. 2006, 250, 206–209. [Green Version]
- Sato, H.; Kitakami, O.; Sakurai, T.; Shimada, Y.; Otani, Y.; Fukamichi, K. Structure and magnetism of hcp-Co fine particles. J. Appl. Phys. 1997, 81, 1858–1862. [Google Scholar]
- Zhang, G.L.; Wu, Z.Y.; Li, A.G.; Wang, Y.S.; Zhang, J.; Abbas, M.I.; Hu, R.; Ni, X.B.; Tong, Y.P.; Hwu, Y.K. XANES investigation of the local structure of Co nanoclusters embedded in Ag. Phys. Rev. B. 2004, 69, 115405. [Google Scholar]
- Cezar, J.C.; Tolentino, H.C.N.; Knobel, M. Structural, magnetic, and transport properties of Co nanoparticles within a Cu matrix. Phys. Rev. B. 2003, 68, 054404. [Google Scholar]
- Meldrum, A.; Boatner, L.A.; Sorge, K. Microstructure and magnetic properties of Co nanoparticles in ion-implanted Al2O3. Nucl. Instrum. Methods Phys. Res. B. 2003, 207, 36–44. [Google Scholar]
- Jacobsohn, L.G.; Hawley, M.E.; Cooke, D.W.; Hundley, M.F.; Thompson, J.D.; Schulze, R.K.; Nastasi, M. Synthesis of cobalt nanoparticles by ion implantation and effects of postimplantation annealing. J. Appl. Phys. 2004, 96, 4444–4450. [Google Scholar]
- Zhao, X.Q.; Veintemillas-Verdaguer, S.; Bomati-Miguel, O.; Morales, M.P.; Xu, H.B. Thermal history dependence of the crystal structure of Co fine particles. Phys. Rev. B. 2005, 71, 024106. [Google Scholar]
- Song, Y.J.; Modrow, H.; Henry, L.L.; Saw, C.K.; Doomes, E.E.; Palshin, V.; Hormes, J.; Kumar, C.S.S.R. Microfluidic synthesis of cobalt nanoparticles. Chem. Mater. 2006, 18, 2817–2827. [Google Scholar]
- Zeng, H.; Zheng, M.; Skomski, R.; Sellmyer, D.J.; Liu, Y.; Menon, L.; Bandyopadhyay, S. Magnetic properties of self-assembled Co nanowires of varying length and diameter. J. Appl. Phys. 2000, 87, 4718–4720. [Google Scholar]
- Nordlund, K.; Ghaly, M.; Averback, R.S.; Caturla, M.; Diaz de la Rubia, T.; Tarus, J. Defect production in collision cascades in elemental semiconductors and fcc metals. Phys. Rev. B. 1998, 57, 7556–7570. [Google Scholar]
- Lesueur, D.; Dunlop, A. Damage creation via electronic excitations in metallic targets. 2. A theoretical model. Radiat. Eff. Defect. Solids. 1993, 126, 163–172. [Google Scholar]
- Fleischer, R.L.; Price, P.B.; Walker, R.M. Ion explosion spike mechanism for formation of charged-particle tracks in solids. J. Appl. Phys. 1965, 36, 3645–3652. [Google Scholar]
- Volkov, A.E.; Borodin, V.A. Heating of metals in swift heavy ion tracks by electron-ion energy exchange. Nucl. Instrum. Methods Phys. Res. B. 1998, 146, 137–141. [Google Scholar]
- Wang, Z.G.; Dufour, C.; Paumier, E.; Toulemonde, M. The Se sensitivity of metals under swift-heavy-ion irradiation: A transient thermal-process. J. Phys. Condens. Matter. 1994, 6, 6733–6750. [Google Scholar]
- Toulemonde, M.; Dufour, C.; Paumier, E. Transient thermal-process after a high-energy heavy-ion irradiation of amorphous metals and semiconductors. Phys. Rev. B. 1992, 46, 14362–14369. [Google Scholar]
- Ziegler, J.; Beirsack, J.P.; Littmark, U. The Stopping and Range of Ions in Matter; Pergamon Press: New York, NY, USA, 1985. [Google Scholar] [Green Version]
- Cheung, A.; Azevedo, G.D.; Glover, C.J.; Llewellyn, D.J.; Elliman, R.G.; Foran, G.J.; Ridgway, M.C. Structural perturbations within Ge nanocrystals in silica. Appl. Phys. Lett. 2004, 84, 278–280. [Google Scholar]
- Giulian, R.; Kluth, P.; Araujo, L.L.; Sprouster, D.J.; Byrne, A.P.; Cookson, D.J.; Ridgway, M.C. Shape transformation of Pt nanoparticles induced by swift heavy-ion irradiation. Phys. Rev. B. 2008, 78, 125413. [Google Scholar]
- Ravel, B.; Newville, M; Athena, Artemis. Hephaestus: Data analysis for X-ray absorption spectroscopy using IFEFFIT. J. Synchrotron Radiat 2005, 12, 537–541. [Google Scholar]
- Newville, M. IFEFFIT: Interactive XAFS analysis and FEFF fitting. J. Synchrotron Radiat 2001, 8, 322–324. [Google Scholar]
- Rehr, J.J.; Albers, R.C. Theoretical approaches to X-ray absorption fine structure. Rev. Mod. Phys. 2000, 72, 621–654. [Google Scholar]
- Tsao, C.S.; Lin, T.L. Analysis of small-angle scattering data from spherical particles by both the indirect transform method and the maximum-entropy method. J. Appl. Crystallogr. 1997, 30, 353–361. [Google Scholar]
- Ilavsky, J.; Jemian, P.R. Irena: Tool suite for modeling and analysis of small-angle scattering. J. Appl. Crystallogr. 2009, 42, 347–353. [Google Scholar]
- Sprouster, D.J.; Giulian, R.; Araujo, L.L.; Kluth, P.; Johannessen, B.; Cookson, D.J.; Foran, G.J.; Ridgway, M.C. Structural and vibrational properties of Co nanoparticles formed by ion implantation. J. Appl. Phys. 2010, 107, 014313. [Google Scholar]
- Dalba, G.; Fornasini, P. EXAFS Debye-Waller factor and thermal vibrations of crystals. J. Synchrotron Radiat 1997, 4, 243–255. [Google Scholar]
- Johannessen, B.; Kluth, P.; Llewellyn, D.J.; Foran, G.J.; Cookson, D.J.; Ridgway, M.C. Amorphization of embedded Cu nanocrystals by ion irradiation. Appl. Phys. Lett. 2007, 90, 073119. [Google Scholar]
- Djurabekova, F.; Nordlund, K. Atomistic simulation of the interface structure of Si nanocrystals embedded in amorphous silica. Phys. Rev. B. 2008, 77, 115325. [Google Scholar]
- Araujo, L.L.; Giulian, R.; Sprouster, D.J.; Schnohr, C.S.; Llewellyn, D.J.; Kluth, P.; Cookson, D.J.; Foran, G.J.; Ridgway, M.C. Size-dependent characterization of embedded Ge nanocrystals Structural and thermal properties. Phys. Rev. B. 2008, 78, 094112. [Google Scholar]
- Johannessen, B.; Kluth, P.; Glover, C.J.; Azevedo, G.D.; Llewellyn, D.J.; Foran, G.J.; Ridgway, M.C. Structural characterization of Cu nanocrystals formed in SiO2 by high-energy ion-beam synthesis. J. Appl. Phys. 2005, 98, 024307. [Google Scholar]
- Kluth, P.; Johannessen, B.; Giraud, V.; Cheung, A.; Glover, C.J.; Azevedo, G.D.; Foran, G.J.; Ridgway, M.C. Bond length contraction in Au nanocrystals formed by ion implantation into thin SiO2. Appl. Phys. Lett. 2004, 85, 3561–3563. [Google Scholar]
- Giulian, R.; Araujo, L.L.; Kluth, P.; Sprouster, D.J.; Schnohr, C.S.; Johannessen, B.; Foran, G.J.; Ridgway, M.C. The influence of annealing conditions on the growth and structure of embedded Pt nanocrystals. J. Appl. Phys. 2009, 105, 044303. [Google Scholar]
- Sprouster, D.J.; Giulian, R.; Araujo, L.L.; Kluth, P.; Johannessen, B.; Kirby, N.; Ridgway, M.C. Formation and structural characterization of Ni nanoparticles embedded in SiO2. J. Appl. Phys. 2011, 109, 113517. [Google Scholar]
- Frenkel, A.I.; Rehr, J.J. Thermal expansion and X-ray-absorption fine-structure cumulants. Phys. Rev. B. 1993, 48, 585–588. [Google Scholar]
- Sevillano, E.; Meuth, H.; Rehr, J.J. Extended X-ray absorption fine structure Debye-Waller factors. I. Monatomic crystals. Phys. Rev. B. 1979, 20, 4908–4911. [Google Scholar]
- Dalba, G.; Fornasini, P.; Grisenti, R.; Pasqualini, D.; Diop, D.; Monti, F. Anharmonicity effects on the extended X-ray-absorption fine structure: The case of cadmium selenide. Phys. Rev. B. 1998, 58, 4793–4802. [Google Scholar]
- Knapp, G.S.; Pan, H.K.; Tranquada, J.M. Extended X-ray-absorption fine-structure Einstein frequency and moments of the phonon spectrum: An experimental and theoretical study. Phys. Rev. B. 1985, 32, 2006–2009. [Google Scholar]
- Tröger, L.; Yokoyama, T.; Arvanitis, D.; Lederer, T.; Tischer, M.; Baberschke, K. Determination of bond lengths, atomic mean-square relative displacements, and local thermal expansion by means of soft-X-ray photoabsorption. Phys. Rev. B. 1994, 49, 888–903. [Google Scholar]
- Meyer, R.; Lewis, L.J.; Prakash, S.; Entel, P. Vibrational properties of nanoscale materials: From nanoparticles to nanocrystalline materials. Phys. Rev. B. 2003, 68, 104303. [Google Scholar]
- Kluth, P.; Johannessen, B.; Araujo, L.L.; Ridgway, M.C. Vibrational properties of Au and Cu nanocrystals formed by ion implantation. AIP Conf. Proc. 2006, 882, 731–733. [Google Scholar]
- Dalba, G.; Fornasini, P.; Grisenti, R.; Purans, J. Sensitivity of extended X-ray-absorption fine structure to thermal expansion. Phys. Rev. Lett. 1999, 82, 4240–4243. [Google Scholar]
- Giulian, R.; Araujo, L.L.; Kluth, P.; Sprouster, D.J.; Schnohr, C.S.; Foran, G.J.; Ridgway, M.C. Temperature-dependent EXAFS analysis of embedded Pt nanocrystals. J. Phys. Condens. Matter. 2009, 21, 155302. [Google Scholar]
- Gaskell, P.H. Thermal properties of silica. 2. Thermal expansion coefficient of vitreous silica. Trans. Faraday Soc. 1966, 62, 1505–1510. [Google Scholar]
- White, G.K. Thermal-expansion of reference materials—Copper, silica and silicon. J. Phys. D-Appl. Phys. 1973, 6, 2070–2078. [Google Scholar]
- Sprouster, D.J.; Giulian, R.; Araujo, L.L.; Kluth, P.; Johannessen, B.; Nordlund, K.; Kirby, N.; Ridgway, M.C. Ion irradiation induced amorphisation of cobalt nanoparticles. Phys. Rev. B. 2010, 81, 155414. [Google Scholar]
- Moller, W.; Eckstein, W. Tridyn—A TRIM simulation code including dynamic composition changes. Nucl. Instrum. Methods Phys. Res. B. 1984, 2, 814–818. [Google Scholar]
- Diaz, J.; Morales, R.; Valvidares, S.M.; Alameda, J.M. Phase separation in Fe-Si and Co-Si sputtered ferromagnetic alloys and the origin of their magnetic anisotropy. Phys. Rev. B. 2005, 72, 144413. [Google Scholar]
- Li, P.; Chen, I.W.; Pennerhahn, J.E. X-ray absorption studies of zirconia polymorphs. I. Characteristic local structures. Phys. Rev. B. 1993, 48, 10063–10073. [Google Scholar]
- Long, G.J.; Hautot, D.; Pankhurst, Q.A.; Vandormael, D.; Grandjean, F.; Gaspard, J.P.; Briois, V.; Hyeon, T.; Suslick, K.S. Mössbauer-effect and X-ray-absorption spectral study of sonochemically prepared amorphous iron. Phys. Rev. B. 1998, 57, 10716–10722. [Google Scholar]
- Magnan, H.; Chandesris, D.; Rossi, G.; Jezequel, G.; Hricovini, K.; Lecante, J. Determination of the local order in amorphous Cobalt films. Phys. Rev. B. 1989, 40, 9989–9992. [Google Scholar]
- Johannessen, B.; Kluth, P.; Llewellyn, D.J.; Foran, G.J.; Cookson, D.J.; Ridgway, M.C. Ion-irradiation-induced amorphization of Cu nanoparticles embedded in SiO2. Phys. Rev. B. 2007, 76, 184203. [Google Scholar]
- Ridgway, M.C.; Azevedo, G.D.; Glover, C.J.; Yu, K.M.; Foran, G.J. Common structure in amorphised compound semiconductors. Nucl. Instrum. Methods Phys. Res. B. 2002, 199, 235–239. [Google Scholar]
- Ridgway, M.C.; Glover, C.J.; Yu, K.M.; Foran, G.J.; Clerc, C.; Hansen, J.L.; Larsen, A.N. Ion-dose-dependent microstructure in amorphous Ge. Phys. Rev. B. 2000, 61, 12586–12589. [Google Scholar]
- Schnohr, C.S.; Kluth, P.; Araujo, L.L.; Sprouster, D.J.; Byrne, A.P.; Foran, G.J.; Ridgway, M.C. Anisotropic vibrations in crystalline and amorphous InP. Phys. Rev. B. 2009, 79, 195203. [Google Scholar]
- Heimendahl, L.V. Metallic glasses as relaxed bernal structures. J. Phys. F. 1975, 5, L141–L145. [Google Scholar]
- Kluth, P.; Johannessen, B.; Foran, G.J.; Cookson, D.J.; Kluth, S.M.; Ridgway, M.C. Disorder and cluster formation during ion irradiation of Au nanoparticles in SiO2. Phys. Rev. B. 2006, 74, 014202. [Google Scholar]
- Ridgway, M.C.; Glover, C.J.; Foran, G.J.; Yu, K.M. Characterization of the local structure of amorphous GaAs produced by ion implantation. J. Appl. Phys. 1998, 83, 4610–4614. [Google Scholar]
- Johannessen, B. Ion beam formation and modification of metallic nanoparticles Ph.D. Thesis, Australian National University, Canberra, Australia, 2008. [Green Version]
- Kara, A.; Rahman, T.S. Vibrational properties of metallic nanocrystals. Phys. Rev. Lett. 1998, 81, 1453–1456. [Google Scholar]
- Gilbert, B.; Huang, F.; Zhang, H.Z.; Waychunas, G.A.; Banfield, J.F. Nanoparticles: Strained and stiff. Science 2004, 305, 651–654. [Google Scholar]
- The validity of this suggestion can be tested by chemically dissolving the SiO2 matrix subsequent to irradiation to produce free-standing a-Co NPs.
- D’Orleans, C.; Stoquert, J.P.; Estournes, C.; Cerruti, C.; Grob, J.J.; Guille, J.L.; Haas, F.; Muller, D.; Richard-Plouet, M. Anisotropy of Co nanoparticles induced by swift heavy ions. Phys. Rev. B. 2003, 67, 220101. [Google Scholar]
- Fukumi, K.; Chayahara, A.; Kadono, K.; Kageyama, H.; Akai, T.; Mizoguchi, H.; Kitamura, N.; Makihara, M.; Horino, Y.; Fujii, K. Coordination structures of implanted Fe, Co, and Ni ions in silica glass by X-ray absorption fine structure spectroscopy. J. Mater. Res. 2001, 16, 155–162. [Google Scholar]
- Shirakawa, J.; Nakayama, M.; Uchimoto, Y.; Wakihara, M. Multiple scattering calculation for Co K-edge XANES spectra of nanometer-scale metal deposited during Li insertion into LiCoVO4. Electrochem. Solid State Lett 2006, 9, A200–A202. [Google Scholar]
- Song, C.; Zeng, F.; Shen, Y.X.; Geng, K.W.; Xie, Y.N.; Wu, Z.Y.; Pan, F. Local Co structure and ferromagnetism in ion-implanted Co-doped LiNbO3. Phys. Rev. B. 2006, 73, 172412. [Google Scholar]
- Watanabe, N.; Morais, J.; Accione, S.B.B.; Morrone, A.; Schmidt, J.E.; Alves, M.C.M. Electronic, structural, and magnetic properties of cobalt aggregates embedded in polypyrrole. J. Phys. Chem. B. 2004, 108, 4013–4017. [Google Scholar]
- Hormes, J.; Modrow, H.; Bonnemann, H.; Kumar, C. The influence of various coatings on the electronic, magnetic, and geometric properties of cobalt nanoparticles. J. Appl. Phys. 2005, 97, 10R102. [Google Scholar]
- Torchio, R.; Kvashnin, Y.O.; Pascarelli, S.; Mathon, O.; Marini, C.; Genovese, L.; Bruno, P.; Garbarino, G.; Dewaele, A.; Occelli, F.; Loubeyre, P. X-Ray magnetic circular dichroism measurements in Ni up to 200 GPa: Resistant ferromagnetism. Phys. Rev. Lett. 2011, 107, 237202. [Google Scholar]
- Lefevre, P.; Magnan, H.; Heckmann, O.; Briois, V.; Chandesris, D. Adsorpttion site, growth, and structure of Co on Cu(111) determined by multiple-scattering analysis of X-ray-absorption spectra. Phys. Rev. B. 1995, 52, 11462–11466. [Google Scholar]
- Sprouster, D.J. Ion beam formation and modification of Cobalt nanoparticles Ph.D. thesis; Australian National University: Canberra, Australia, 2010. [Google Scholar] [Green Version]
- Gibbons, J.F. Ion Implantation in semiconductors .2. Damage production and annealing. Proc. IEEE. 1972, 60, 1062–1096. [Google Scholar]
- Heckmann, O.; Magnan, H.; Lefevre, P.; Chandesris, D.; Rehr, J.J. Crystallographic structure of cobalt films on Cu(001)— Elastic-deformation to a tetragonal structure. Surf. Sci. 1994, 312, 62–72. [Google Scholar]
- Kemner, K.M.; Elam, W.T.; Idzerda, Y.U.; Wolf, J.A.; Prinz, G.A. Polarization-dependent extended X-ray absorption fine structure measurements of metastable fcc Co on (100) diamond. Appl. Phys. Lett. 1996, 68, 3389–3391. [Google Scholar]
- Kemner, K.M.; Elam, W.T.; Harris, V.G.; Idzerda, Y.U.; Wolf, J.A. Distinguishing the close-packed hexagonal and face centered cubic phases of the metallization of diamond by polarization-dependent extended X-ray absorption fine structure. J. Vac. Sci. Technol. B. 1996, 14, 3207–3209. [Google Scholar]
- Dammak, H.; Dunlop, A.; Lesueur, D. Phase transformation induced by swift heavy ion irradiation of pure metals. Nucl. Instrum. Methods Phys. Res. B. 1996, 107, 204–211. [Google Scholar]
- Benyagoub, A.; Levesque, F.; Couvreur, F.; Gibert-Mougel, C.; Dufour, C.; Paumier, E. Evidence of a phase transition induced in zirconia by high energy heavy ions. Appl. Phys. Lett. 2000, 77, 3197–3199. [Google Scholar]
- Benyagoub, A. Mechanism of the monoclinic-to-tetragonal phase transition induced in zirconia and hafnia by swift heavy ions. Phys. Rev. B. 2005, 72, 094114. [Google Scholar]
- Benyagoub, A.; Klaumünzer, S.; Toulemonde, M. Radiation-induced compaction and plastic flow of vitreous silica. Nucl. Instrum. Methods Phys. Res. B. 1998, 146, 449–454. [Google Scholar]
- Klaumünzer, S. Ion tracks in quartz and vitreous silica. Nucl. Instrum. Methods Phys. Res. B. 2004, 225, 136–153. [Google Scholar]
- van Dillen, T.; Polman, A.; Onck, P.R.; van der Giessen, E. Anisotropic plastic deformation by viscous flow in ion tracks. Phys. Rev. B. 2005, 71, 024103. [Google Scholar]
- van Dillen, T.; Siem, M.Y.S.; Polman, A. Stress map for ion irradiation: Depth-resolved dynamic competition between radiation-induced viscoelastic phenomena in SiO2. Appl. Phys. Lett. 2004, 85, 389–391. [Google Scholar]
- Snoeks, E.; Polman, A.; Volkert, C.A. Densification, anisotropic deformation, and plastic flow of SiO2 during MeV heavy ion irradiation. Appl. Phys. Lett. 1994, 65, 2487–2489. [Google Scholar]
- Brongersma, M.L.; Snoeks, E.; van Dillen, T.; Polman, A. Origin of MeV ion irradiation-induced stress changes in SiO2. J. Appl. Phys. 2000, 88, 59–64. [Google Scholar]
- Kluth, P.; Schnohr, C.S.; Pakarinen, O.H.; Djurabekova, F.; Sprouster, D.J.; Giulian, R.; Ridgway, M.C.; Byrne, A.P.; Trautmann, C.; Cookson, D.J.; Nordlund, K.; Toulemonde, M. Fine structure in swift heavy ion tracks in amorphous SiO2. Phys. Rev. Lett. 2008, 101, 175503. [Google Scholar]
- Dallanora, A.; Marcondes, T.L.; Bermudez, G.G.; Fichtner, P.F.P.; Trautmann, C.; Toulemonde, M.; Papaleo, R.M. Nanoporous SiO2/Si thin layers produced by ion track etching: Dependence on the ion energy and criterion for etchability. J. Appl. Phys. 2008, 104, 024307. [Google Scholar]
- Jensen, J.; Razpet, A.; Skupinski, M.; Possnert, G. Ion track formation below 1 MeV/u in thin films of amorphous SiO2. Nucl. Instrum. Methods Phys. Res. B. 2006, 243, 119–126. [Google Scholar]
- D’Orleans, C.; Cerruti, C.; Estournes, C.; Grob, J.J.; Guille, J.L.; Haas, F.; Muller, D.; Richard-Plouet, M.; Stoquert, J.P. Irradiations of implanted cobalt nanoparticles in silica layers. Nucl. Instrum. Methods Phys. Res. B. 2003, 209, 316–322. [Google Scholar]
- D’Orleans, C.; Stoquert, J.P.; Estournes, C.; Grob, J.J.; Muller, D.; Cerruti, C.; Haas, F. Deformation yield of Co nanoparticles in SiO2 irradiated with 200 MeV 127I ions. Nucl. Instrum. Methods Phys. Res. B. 2004, 225, 154–159. [Google Scholar]
- D’Orleans, C.; Stoquert, J.P.; Estournes, C.; Grob, J.J.; Muller, D.; Guille, J.L.; Richard-Plouet, M.; Cerruti, C.; Haas, F. Elongated Co nanoparticles induced by swift heavy ion irradiations. Nucl. Instrum. Methods Phys. Res. B. 2004, 216, 372–378. [Google Scholar]
- Sprouster, D.J.; Giulian, R.; Araujo, L.L.; Kluth, P.; Johannessen, B.; Cookson, D.J.; Ridgway, M.C. Swift heavy-ion irradiation-induced shape and structural transformation in cobalt nanoparticles. J. Appl. Phys. 2011, 109, 113504. [Google Scholar]
- Roorda, S.; van Dillen, T.; Polman, A.; Graf, C.; van Blaaderen, A.; Kooi, B.J. Aligned gold nanorods in silica made by ion irradiation of core-shell colloidal particles. Adv. Mater. 2004, 16, 235–127. [Google Scholar]
- Klaumünzer, S.; Hou, M.D.; Schumacher, G. Coulomb explosions in a metallic glass due to the passage of fast heavy ions? Phys. Rev. Lett. 1986, 57, 850–853. [Google Scholar]
- Hou, M.d.; Klaumünzer, S.; Schumacher, G. Dimensional changes of metallic glasses during bombardment with fast heavy ions. Phys. Rev. B. 1990, 41, 1144–1157. [Google Scholar]
- Benyagoub, A.; Löffler, S.; Rammensee, M.; Klaumünzer, S.; Saemann-Ischenko, G. Plastic deformation in SiO2 induced by heavy-ion irradiation. Nucl. Instrum. Methods Phys. Res. B. 1992, 65, 228–231. [Google Scholar]
- van Dillen, T.; Polman, A.; Fukarek, W.; van Blaaderen, A. Energy-dependent anisotropic deformation of colloidal silica particles under MeV Au irradiation. Appl. Phys. Lett. 2001, 78, 910–912. [Google Scholar]
- Van Dillen, T.; van der Giessen, E.; Onck, P.R.; Polman, A. Size-dependent ion-beam-induced anisotropic plastic deformation at the nanoscale by nonhydrostatic capillary stresses. Phys. Rev. B. 2006, 74, 132103. [Google Scholar]
- Penninkhof, J.J.; van Dillen, T.; Roorda, S.; Graf, C.; van Blaaderen, A.; Vredenberg, A.M.; Polman, A. Anisotropic deformation of metallo-dielectric core-shell colloids under MeV ion irradiation. Nucl. Instrum. Methods Phys. Res. B. 2006, 242, 523–529. [Google Scholar]
- Klaumü nzer, S. Modification of nanostructures by high-energy ion beams. Nucl. Instrum. Methods Phys. Res. B. 2006, 244, 1–7. [Google Scholar]
- Ridgway, M.C.; Giulian, R.; Sprouster, D.J.; Kluth, P.; Araujo, L.L.; Llewellyn, D.J.; Byrne, A.P.; Kremer, F.; Fichtner, P.F.P.; Rizza, G.; Amekura, H.; Toulemonde, M. Role of thermodynamics in the shape transformation of embedded metal nanoparticles induced by swift heavy-ion irradiation. Phys. Rev. Lett. 2011, 106, 095505. [Google Scholar]
- Awazu, K.; Wang, X.; Fujimaki, M.; Tominaga, J.; Aiba, H.; Ohki, Y.; Komatsubara, T. Elongation of gold nanoparticles in silica glass by irradiation with swift heavy ions. Phys. Rev. B. 2008, 78, 054102. [Google Scholar]
- Dufour, C.; Khomenkov, V.; Rizza, G.; Toulemonde, M. Ion-matter interaction: The three-dimensional version of the thermal spike model. Application to nanoparticle irradiation with swift heavy ions. J. Phys. D-Appl. Phys. 2012, 45, 065302. [Google Scholar]
- Kluth, P.; Giulian, R.; Sprouster, D.J.; Schnohr, C.S.; Byrne, A.P.; Cookson, D.J.; Ridgway, M.C. Energy dependent saturation width of swift heavy ion shaped embedded Au nanoparticles. Appl. Phys. Lett. 2009, 94, 113107. [Google Scholar]
- Jiang, T.; Ellis, D.E. X-ray absorption near edge structures in cobalt oxides. J. Mat. Res. 1996, 11, 2242–2256. [Google Scholar]
- Kraft, S.; Schattat, B.; Bolse, W.; Klaumünzer, S.; Harbsmeier, F.; Kulinska, A.; Loffl, A. Ion beam mixing of ZnO/SiO2 and Sb/Ni/Si interfaces under swift heavy ion irradiation. J. Appl. Phys. 2002, 91, 1129–1134. [Google Scholar]
- Schattat, B.; Bolse, W.; Klaumünzer, S.; Harbsmeier, F.; Jasenek, A. Atomic mixing of Ni2O3/SiO2, NiO/SiO2, and Ni/SiO2 interfaces induced by swift heavy ion irradiation. Appl. Phys. A-Mater. Sci. Process. 2003, 76, 165–169. [Google Scholar]
- Som, T.; Satpati, B.; Satyam, P.V.; Kabiraj, D.; Gupta, A.; Mishra, N.C. Interface modification in Co/Ge bilayer using swift heavy ions. J. Appl. Phys. 2004, 96, 7141–7146. [Google Scholar]
- Kumar, R.; Khan, M.W.; Srivastava, J.P.; Arora, S.K.; Sofin, R.G.S.; Choudhary, R.J.; Shvets, I.V. Swift heavy ion irradiation-induced modifications in structural, magnetic and electrical transport properties of epitaxial magnetite thin films. J. Appl. Phys. 2006, 100, 033703. [Google Scholar]
- Spiga, S.; Mantovan, R.; Fanciulli, M.; Ferretti, N.; Boscherini, F.; d’Acapito, F.; Schmidt, B.; Grotzschel, R.; Mucklich, A. Local structure of Sn implanted in thin SiO2 films. Phys. Rev. B. 2003, 68, 205419. [Google Scholar]
- d’Acapito, F.; Mobilio, S.; Battaglin, G.; Cattaruzza, E.; Gonella, F.; Caccavale, F.; Mazzoldi, P.; Regnard, J.R. Valence state and local atomic structure of copper in Cu-implanted silica glass. J. Appl. Phys. 2000, 87, 1819–1824. [Google Scholar]
© 2012 by the authors; licensee MDPI, Basel, Switzerland This article is an open access article distributed under the terms and conditions of the Creative Commons Attribution license (http://creativecommons.org/licenses/by/3.0/).