Early Results of Three-Year Monitoring of Red Wood Ants’ Behavioral Changes and Their Possible Correlation with Earthquake Events

 ,
,
Simple Summary
Abstract
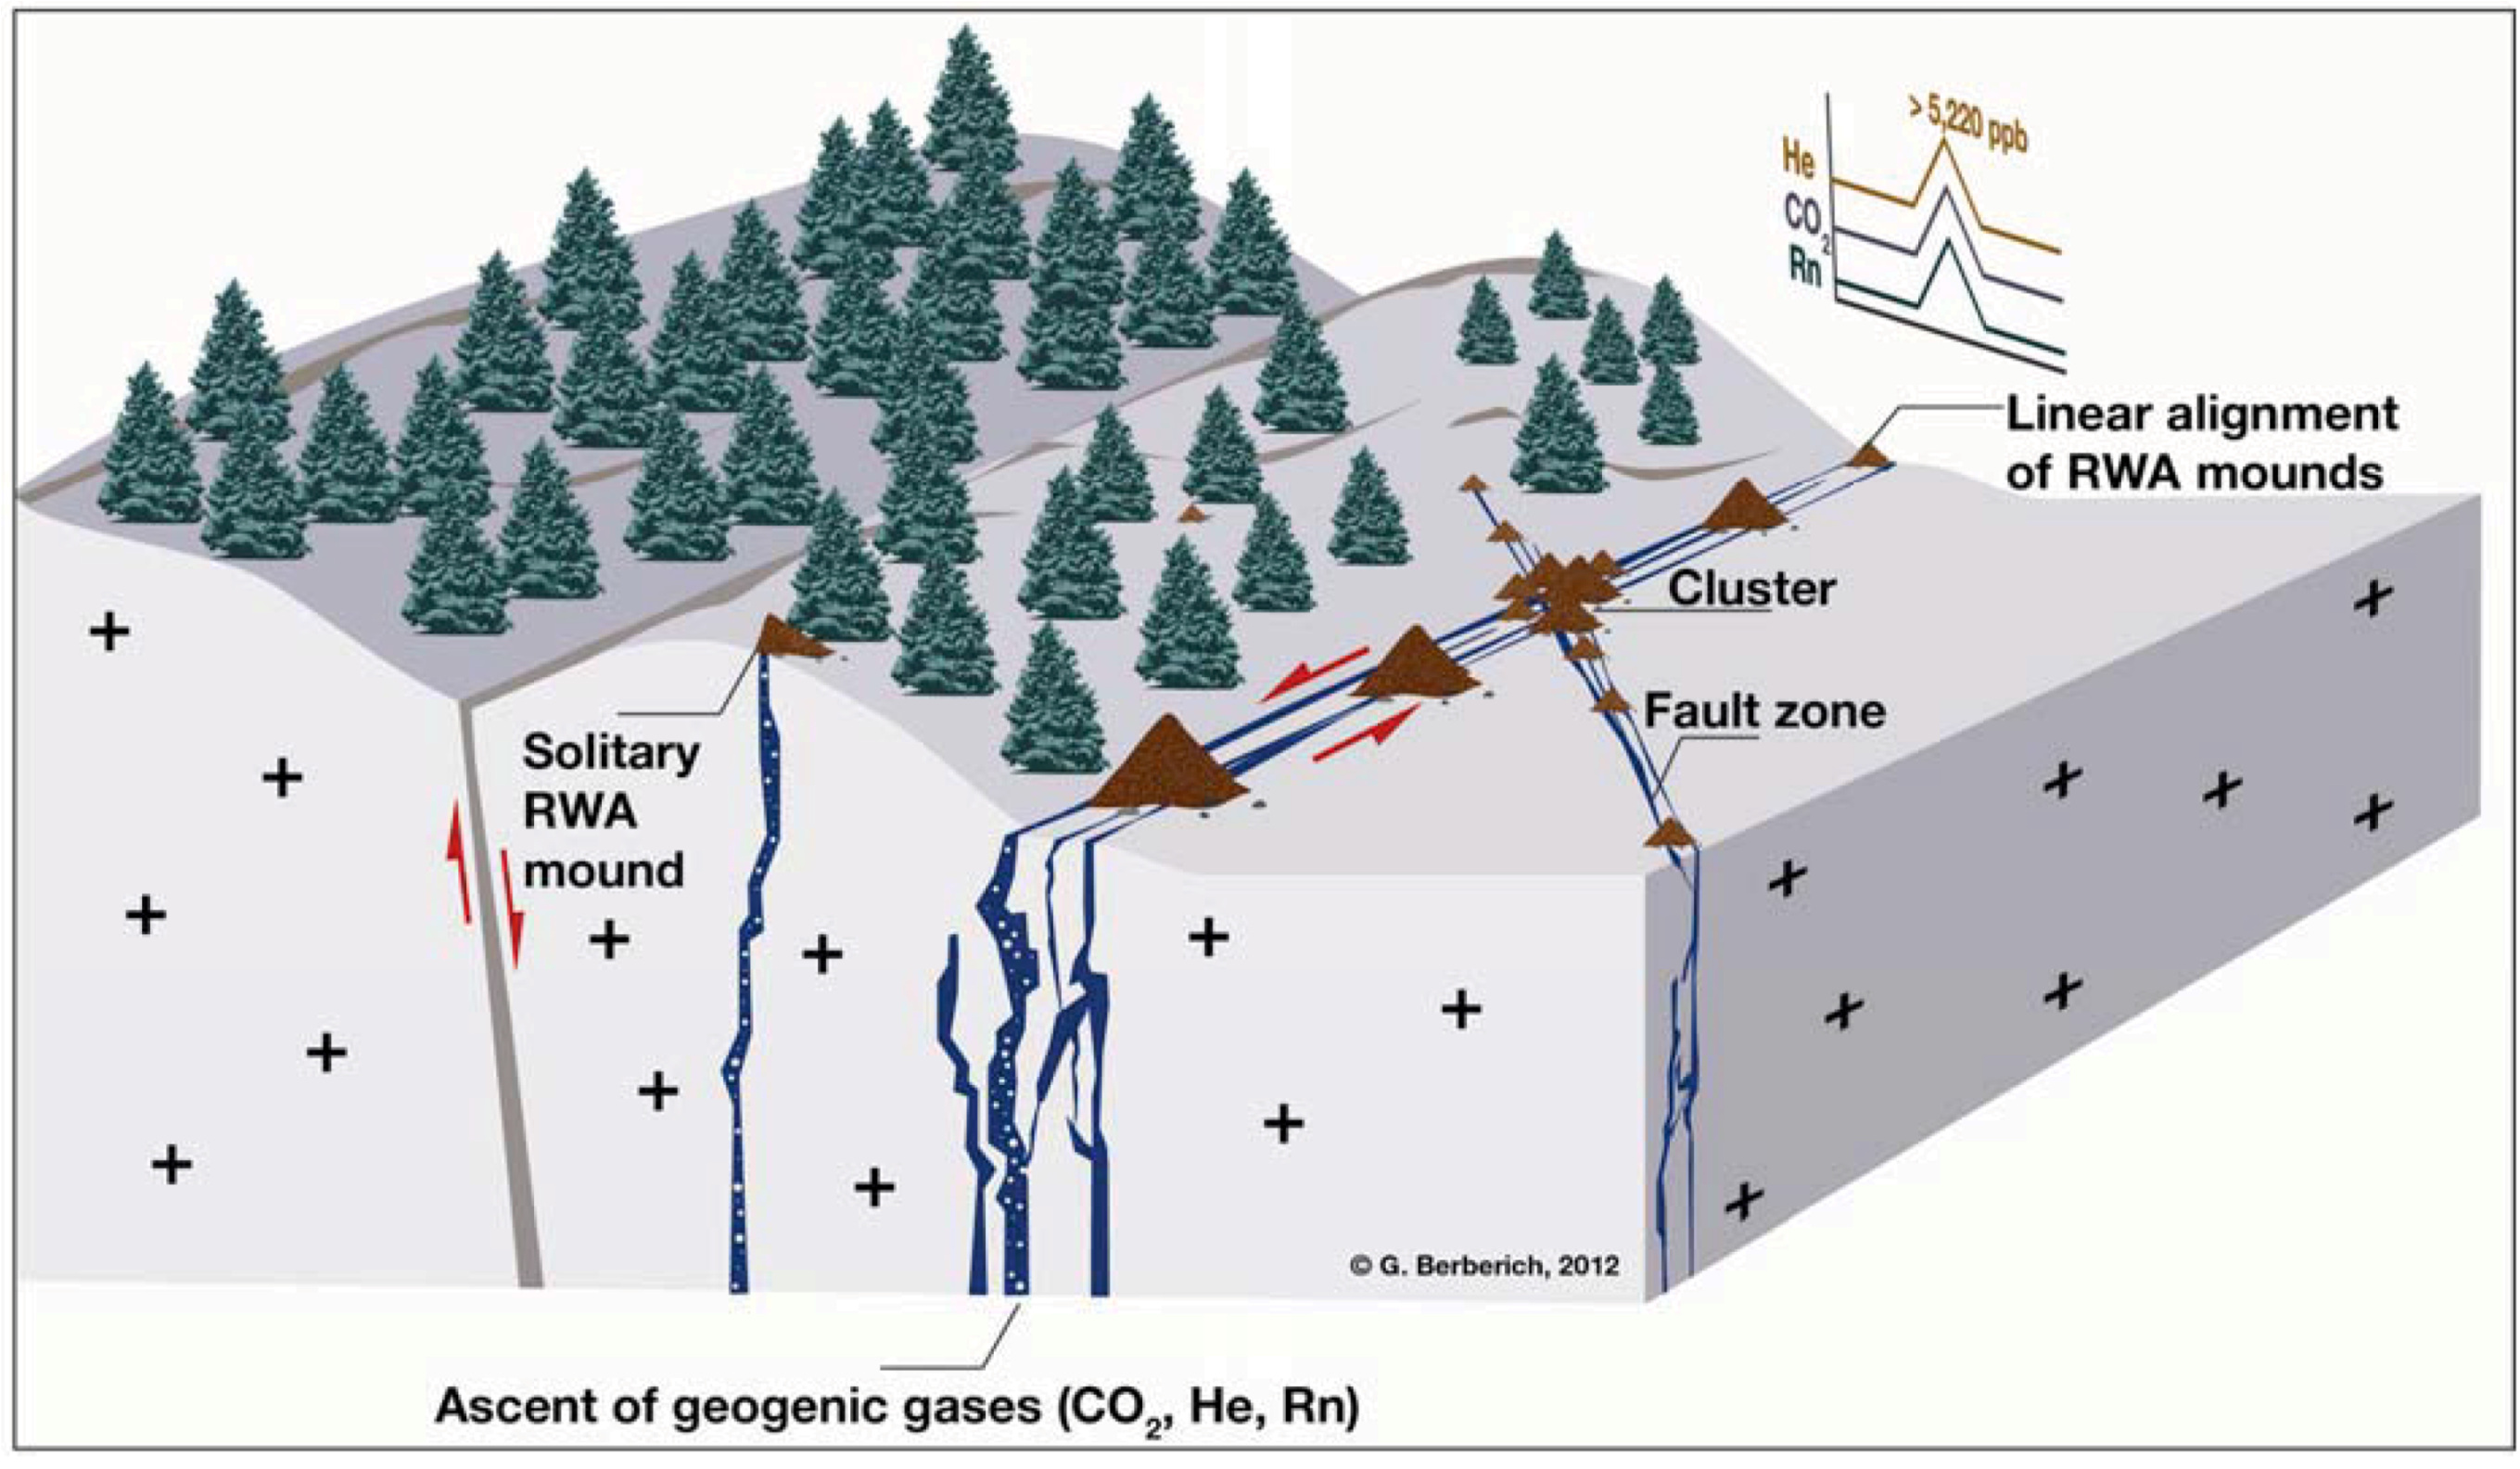
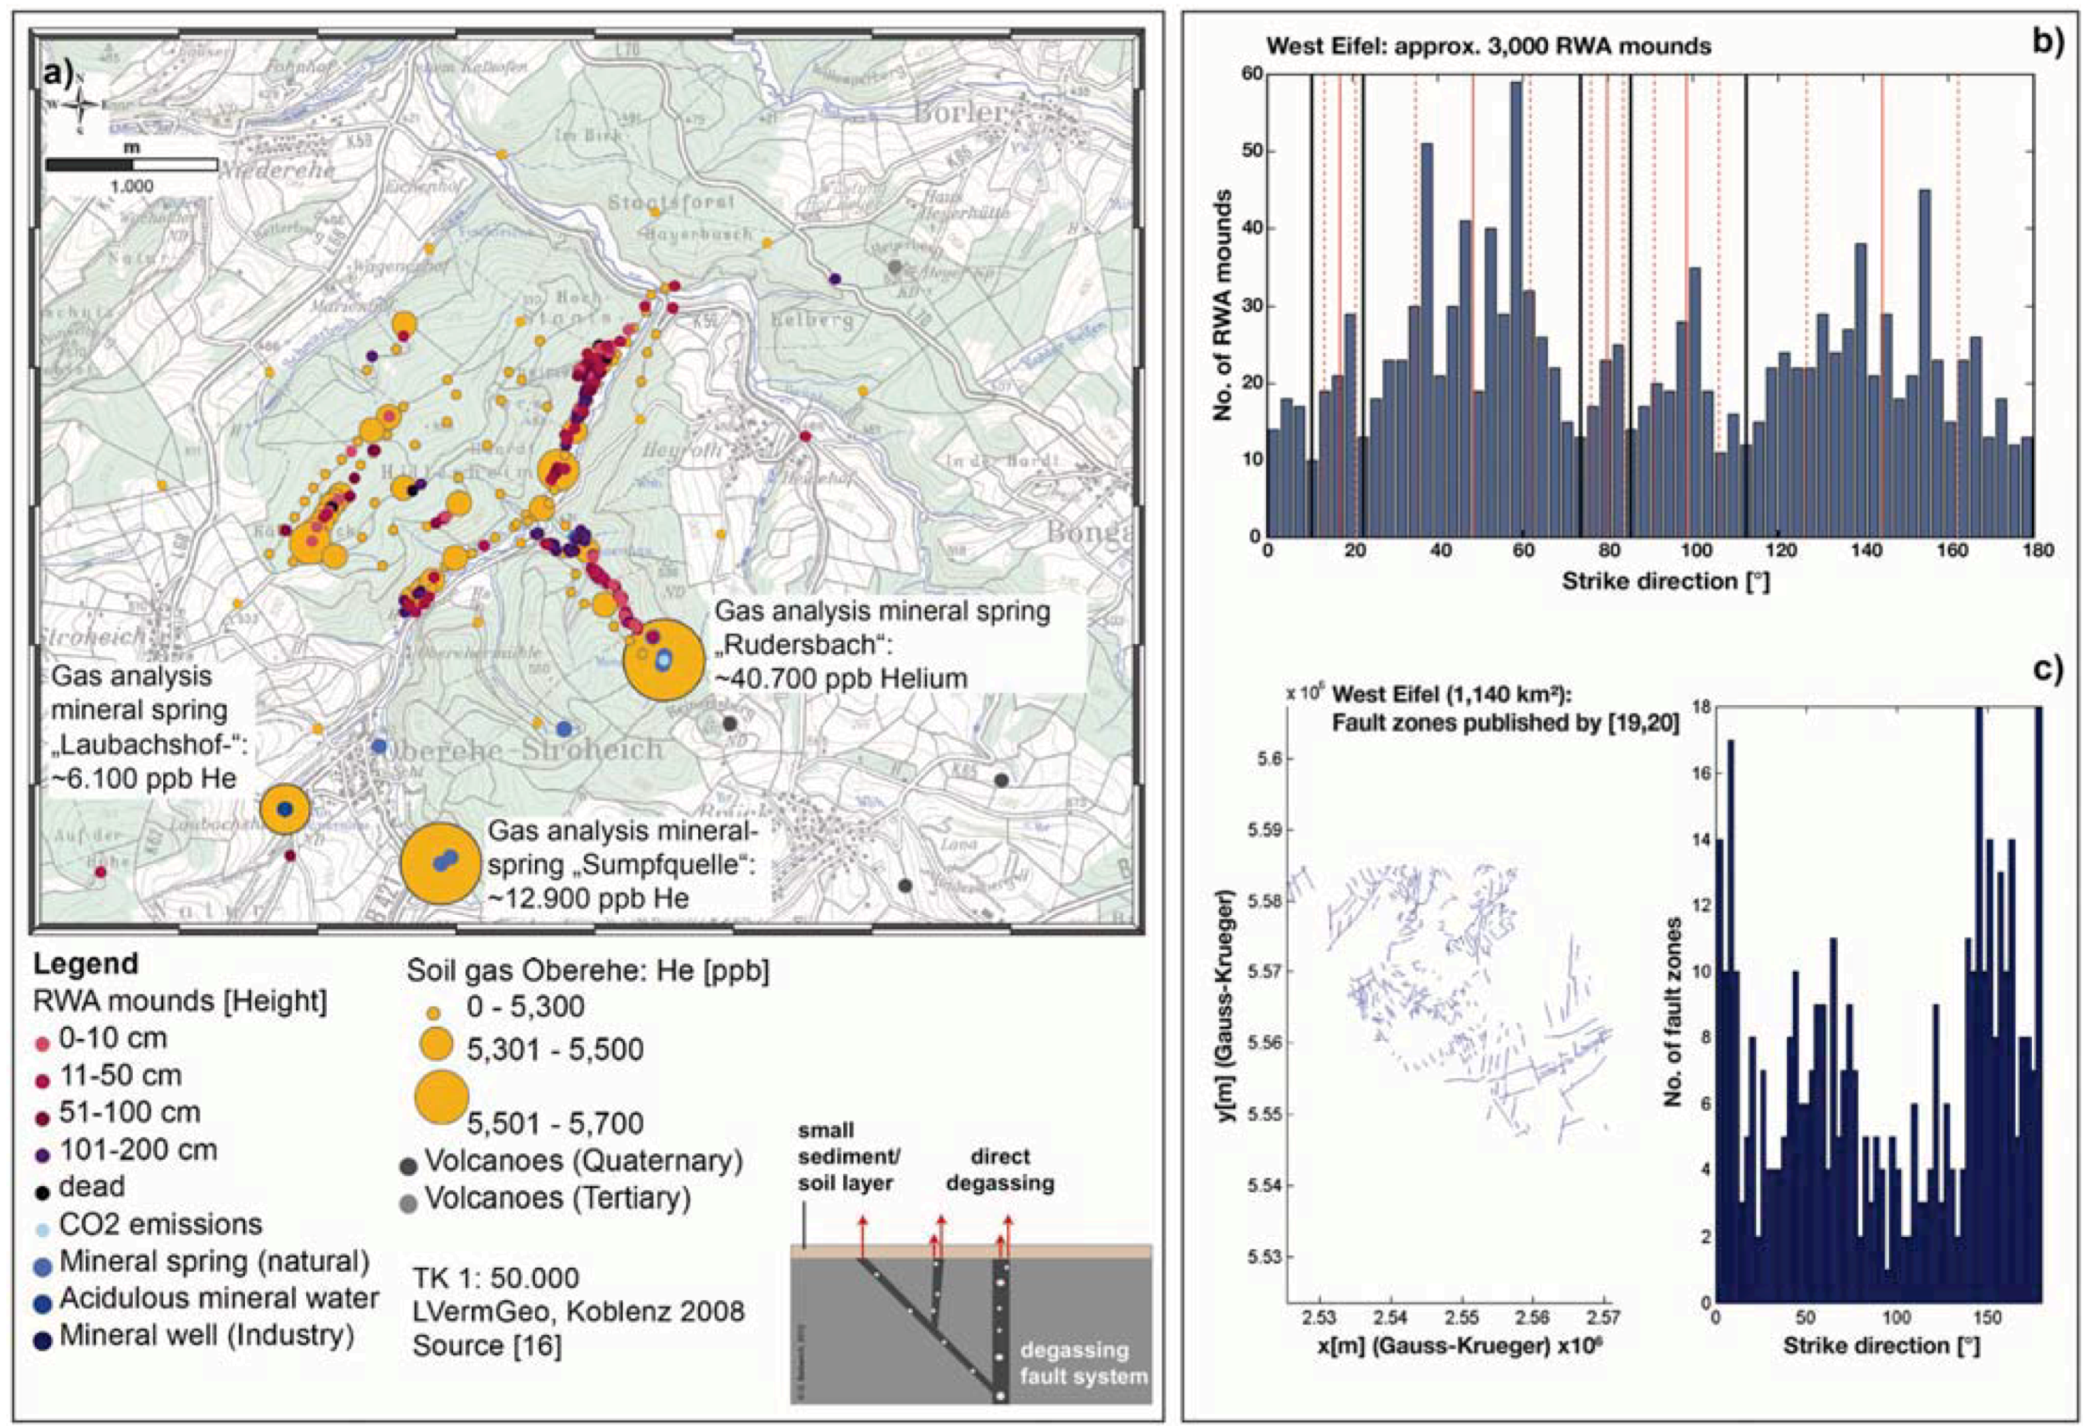
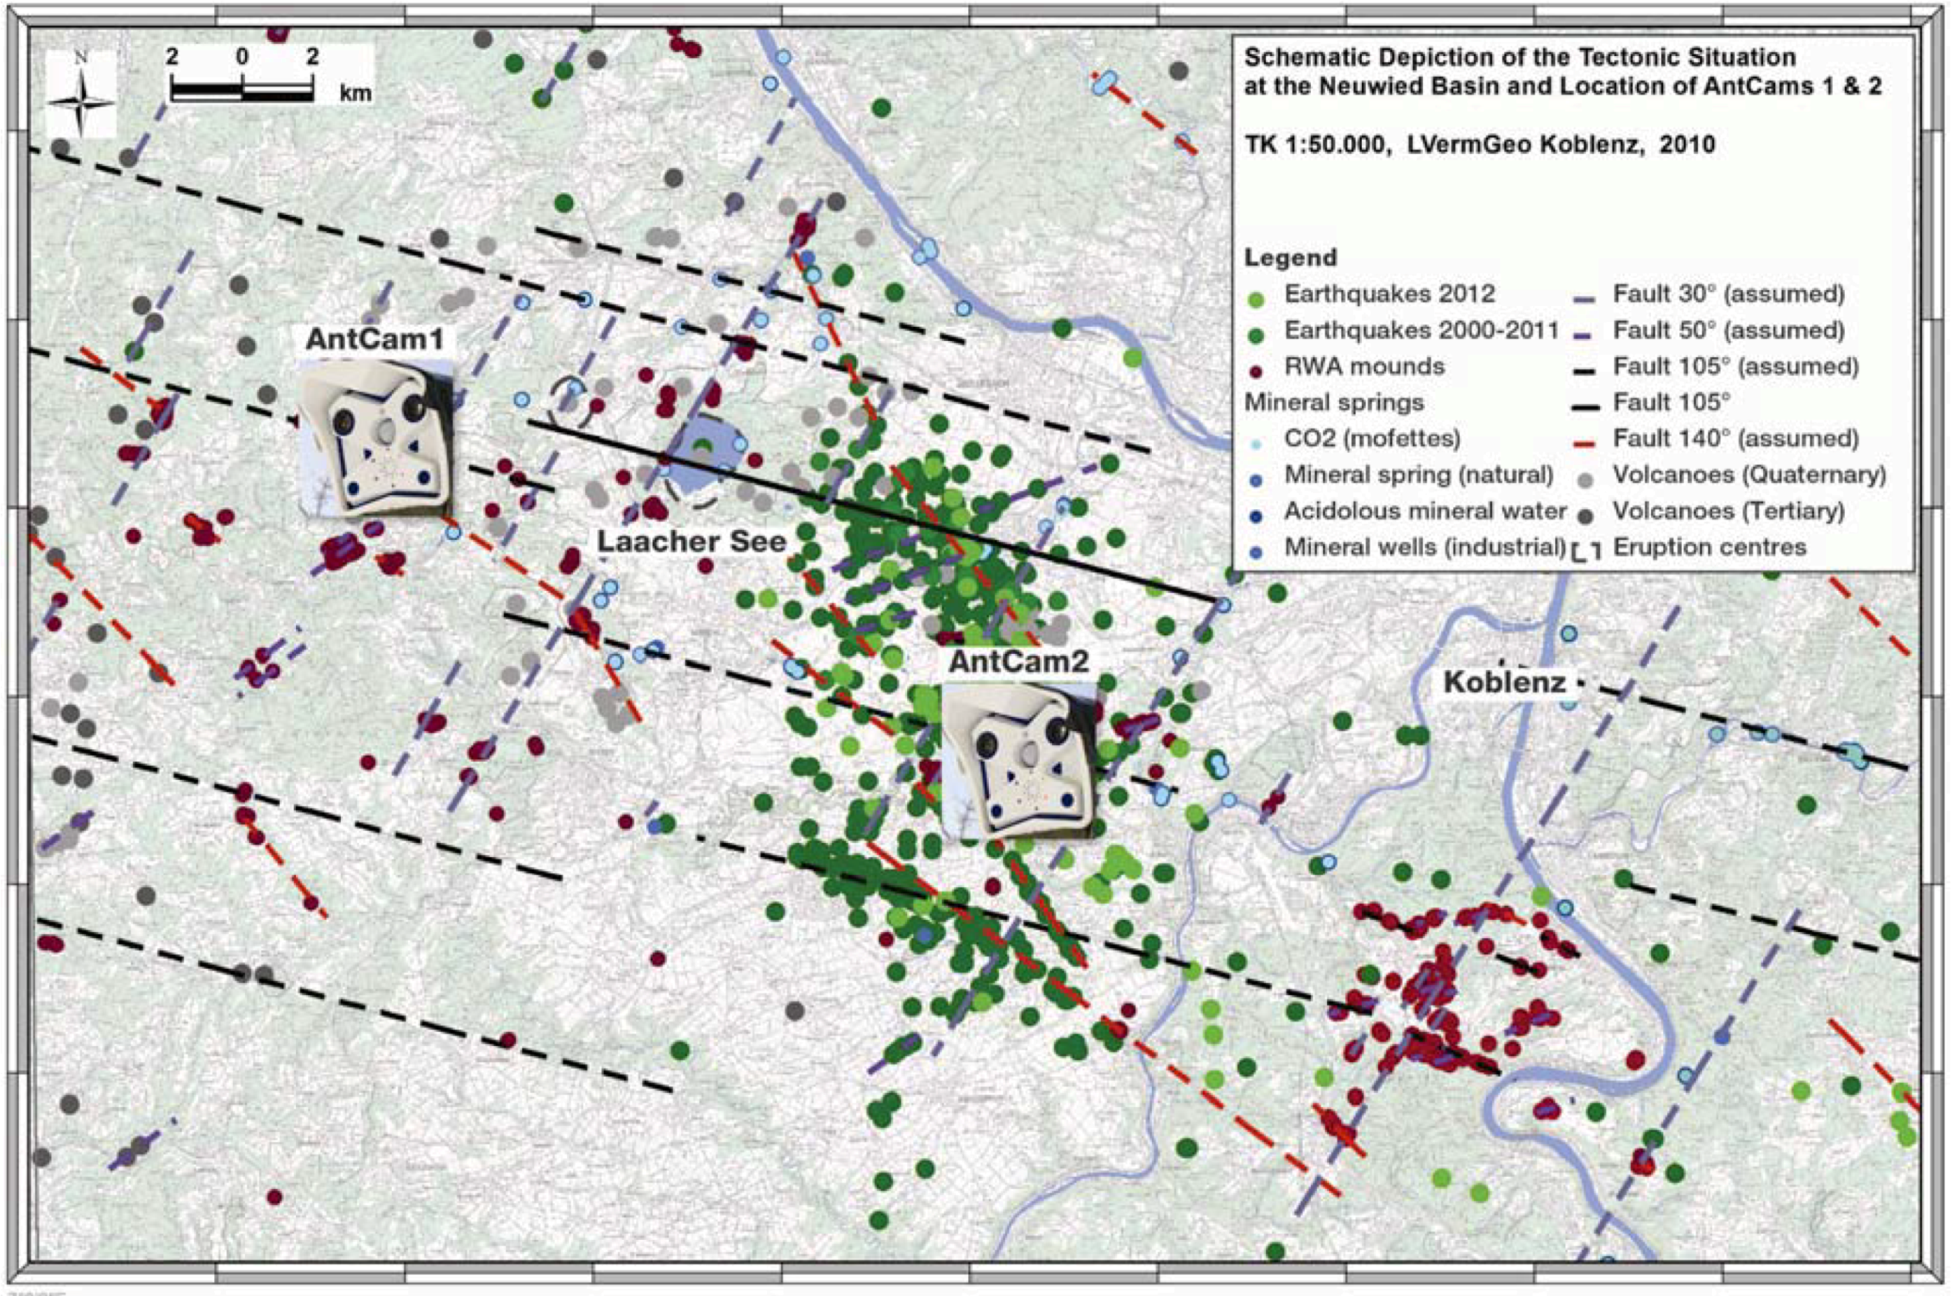
1. Introduction


| Epicenter | Date | Time (UTC) | Focal Depth (km) | Magnitude (M) | Longitude (°) | Latitude (°) | Linear distance (km) of AntCam 1 and 2 to epicenter | |
|---|---|---|---|---|---|---|---|---|
| AntCam 1 | AntCam 2 | |||||||
| Bad Ems | 09/10/2009 | 12:36:21.70 | 5 * | 3.2 | 7.72 | 50.40 | 40 | 22 |
| Kruft | 04/11/2010 | 11:16:16.50 | 10 * | 2.9 | 7.34 | 50.40 | 14 | 10 |
| Ochtendung | 08/05/2011 | 09:29:37.05 | 10 * | 2.3 | 7.38 | 50.36 | 15 | 8 |
| Plaidt | 02/21/2012 | 02:34:57.62 | 11 | 2.5 | 7.38 | 50.38 | 17 | 6 |
| Kobern | 03/12/2012 | 19:00:42.66 | 12 | 2.7 | 7.43 | 50.33 | 22 | 1 |
| Ochtendung | 03/29/2012 | 01:23:41.06 | 10 * | 2.2 | 7.41 | 50.34 | 20 | 2 |
| Plaidt | 05/22/2012 | 00:08:47.98 | 10 * | 2.3 | 7.37 | 50.37 | 17 | 6 |
| Lonnig | 11/15/2012 | 16:40:24.62 | 10 * | 2.4 | 7.41 | 50.32 | 21 | 4 |
| Lonnig | 11/22/2012 | 15:43:15.90 | 10 * | 2.8 | 7.41 | 50.32 | 21 | 4 |
| Winningen | 12/16/2012 | 05:54:35.40 | 6.9 | 2.2 | 7.53 | 50.30 | 30 | 8 |

2. Methods
2.1. Technical Equipment of the Monitoring Stations (AntCams)
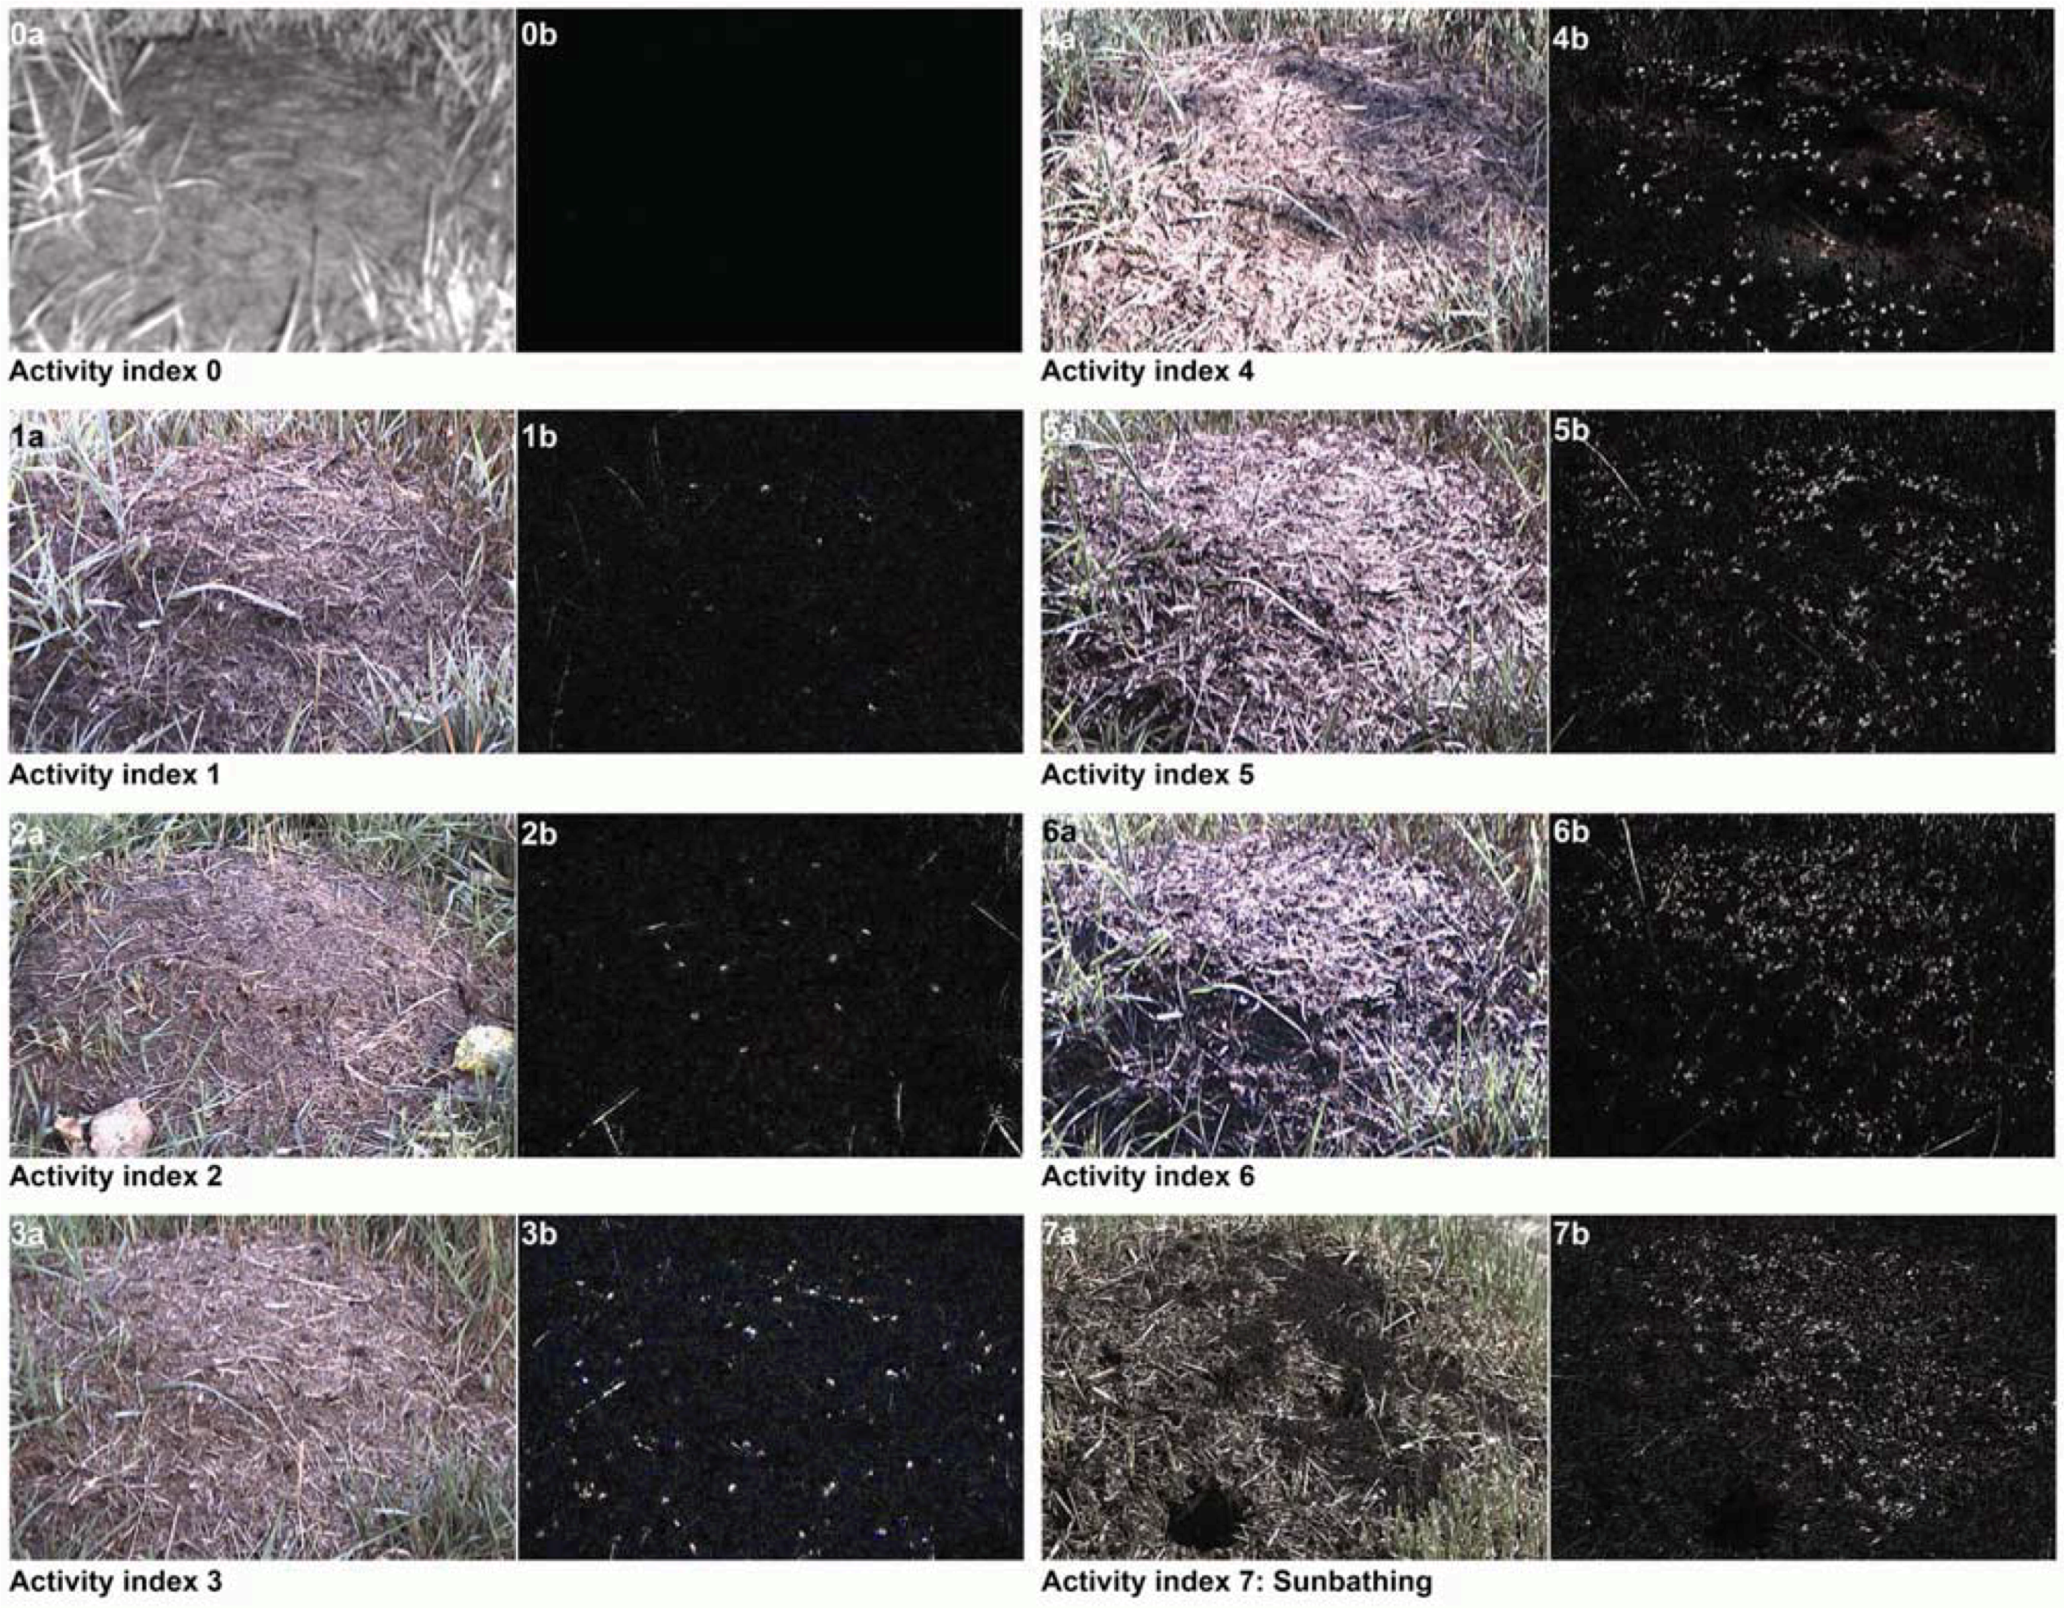
2.2. Manual Analyses of Video Streams

| Epicenter | Date | Time (UTC) | Focal Depth (km) | Magnitude (M) | Longitude (°) | Latitude (°) | Linear distance (km) of AntCam 1 to epicenter |
|---|---|---|---|---|---|---|---|
| Bad Ems | 09/10/2009 | 12:36:21.70 | 5.0 * | 3.2 | 7.72 | 50.40 | 40 |
| Polch | 09/12/2009 | 04:26:57.8 | 3.2 | 0.9 | 7.33 | 50.31 | 17 |
| Nickenich | 09/12/2009 | 22:57:19.2 | 2.8 | 0.4 | 7.32 | 50.42 | 13 |
| Ochtendung | 09/15/2009 | 23:06:23.0 | 3.0 | 0.6 | 7.41 | 50.36 | 20 |
| Plaidt | 09/29/2009 | 04:38:26.4 | 2.1 | 0.5 | 7.38 | 50.38 | 17 |
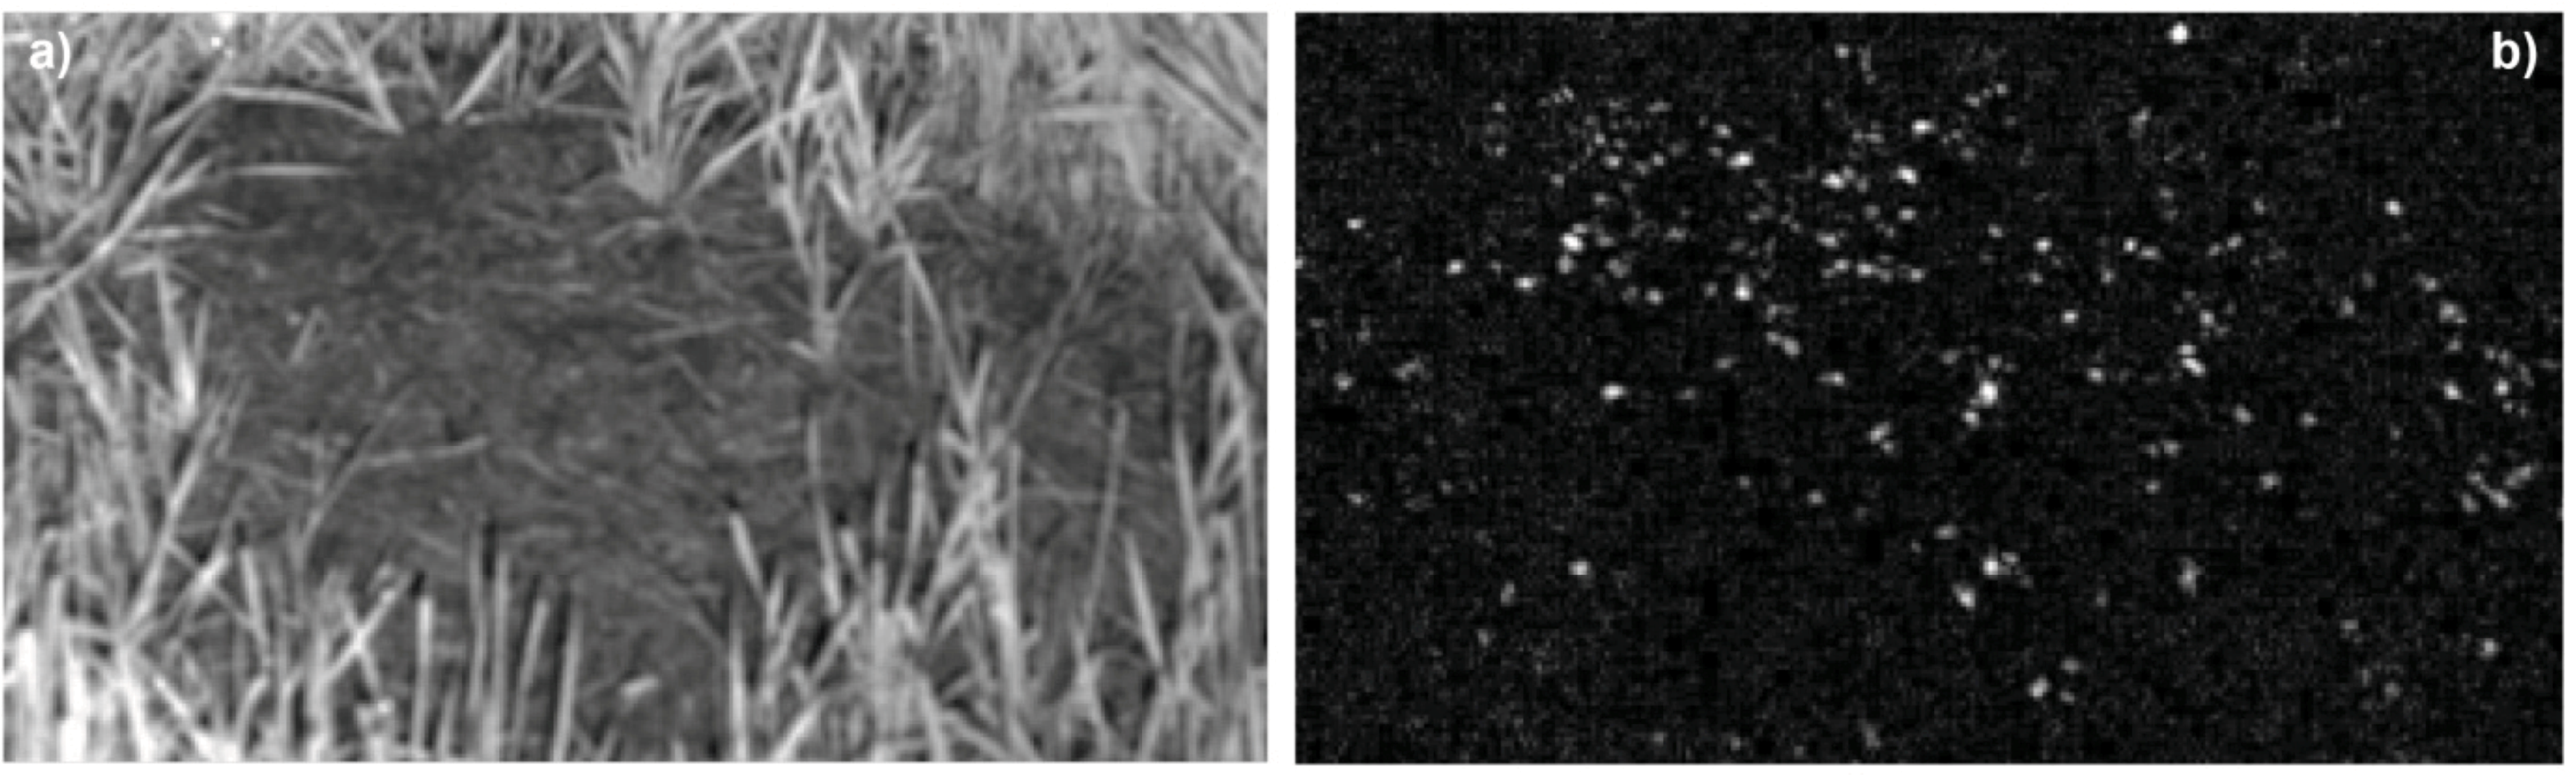
2.3. Automated Image Analysis


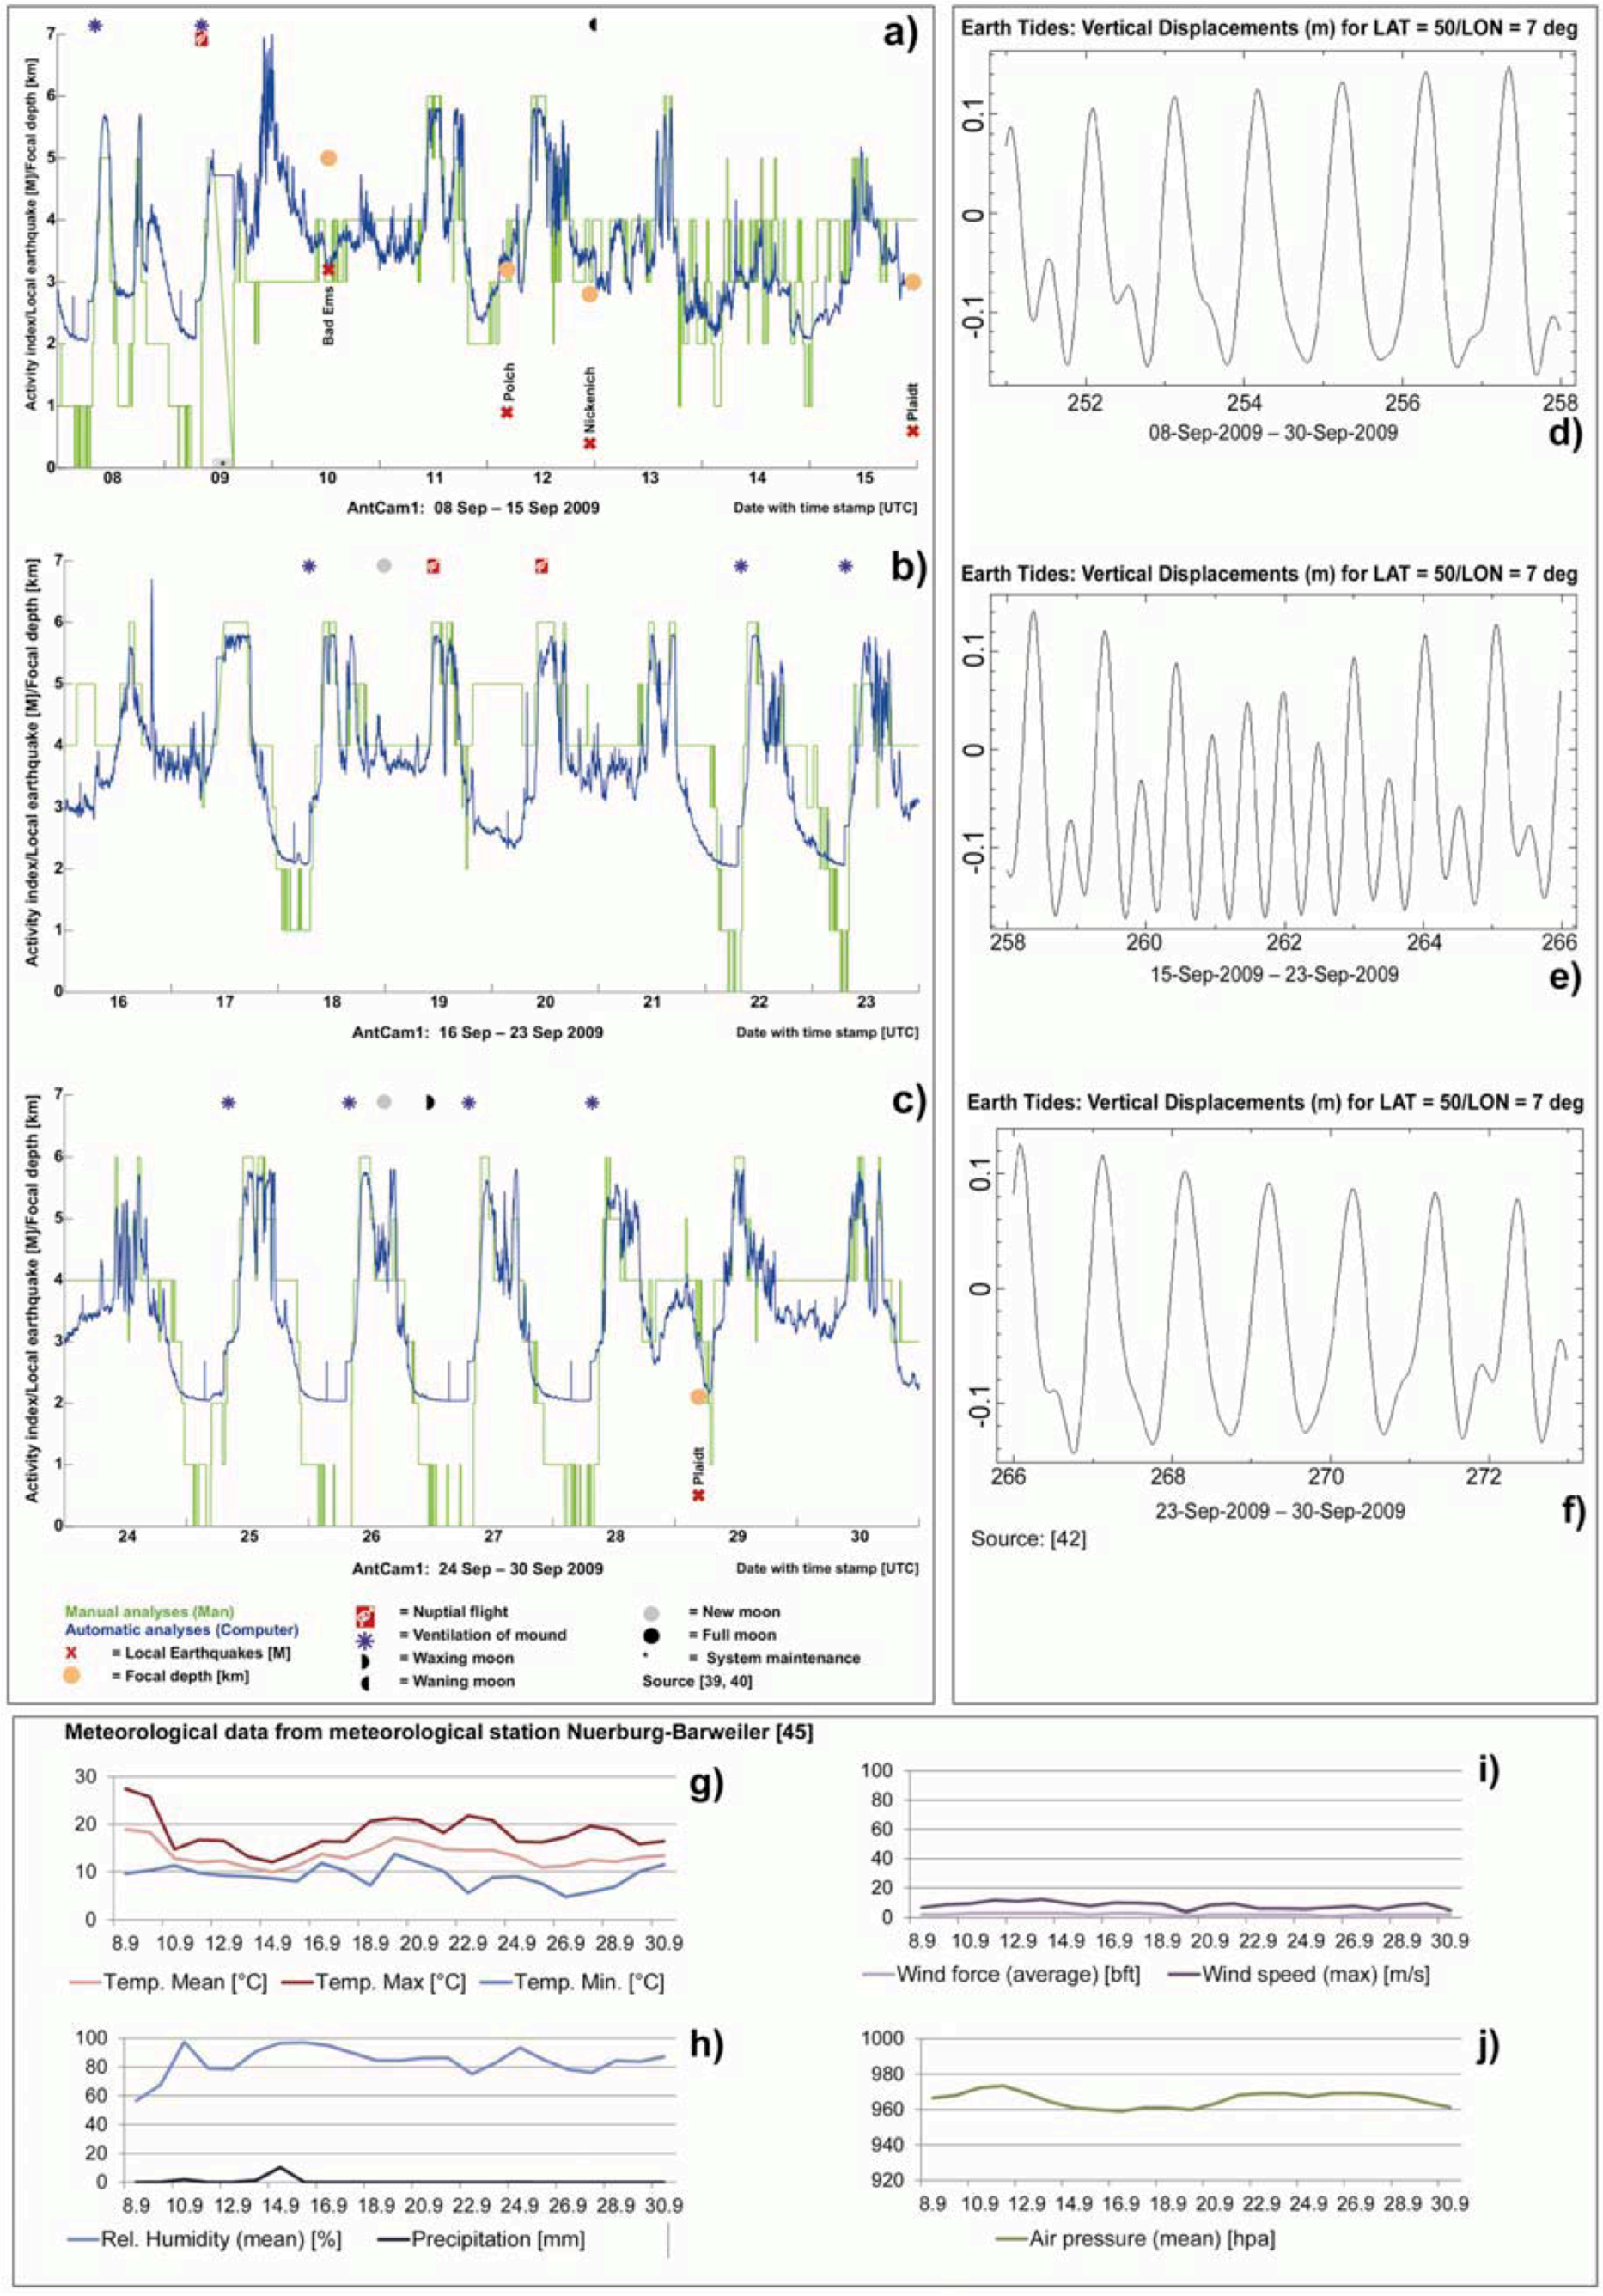
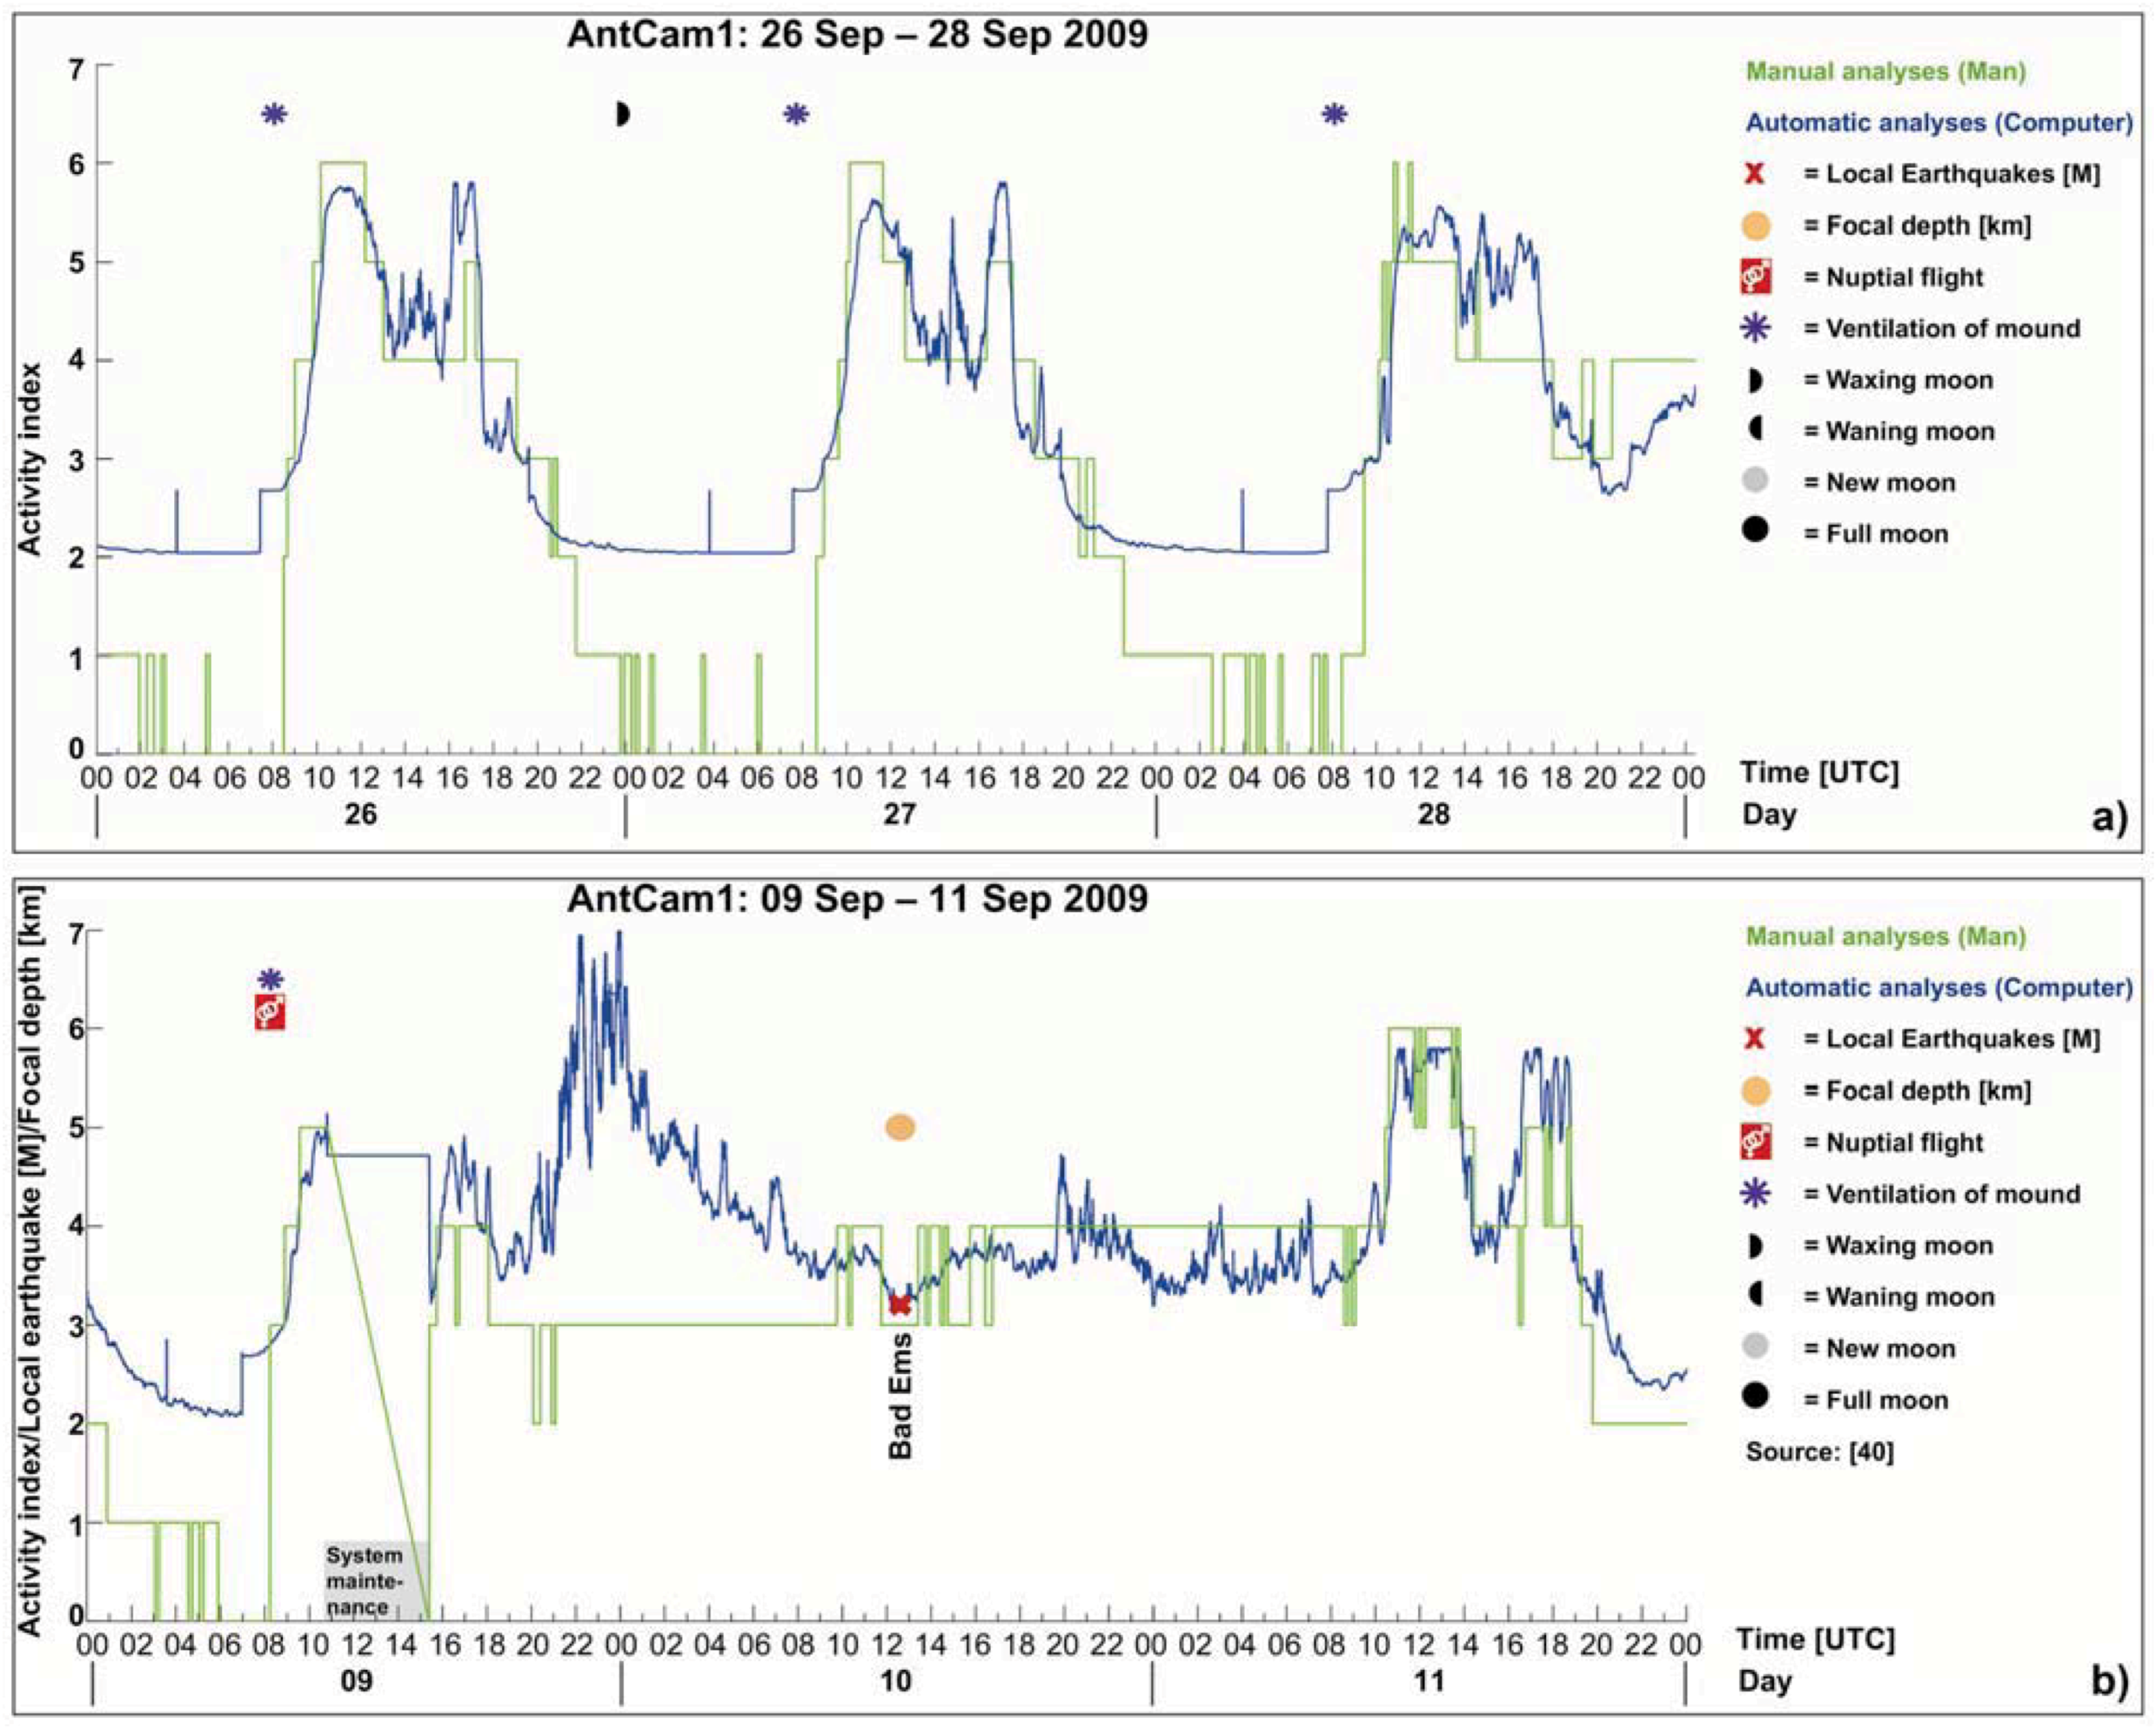
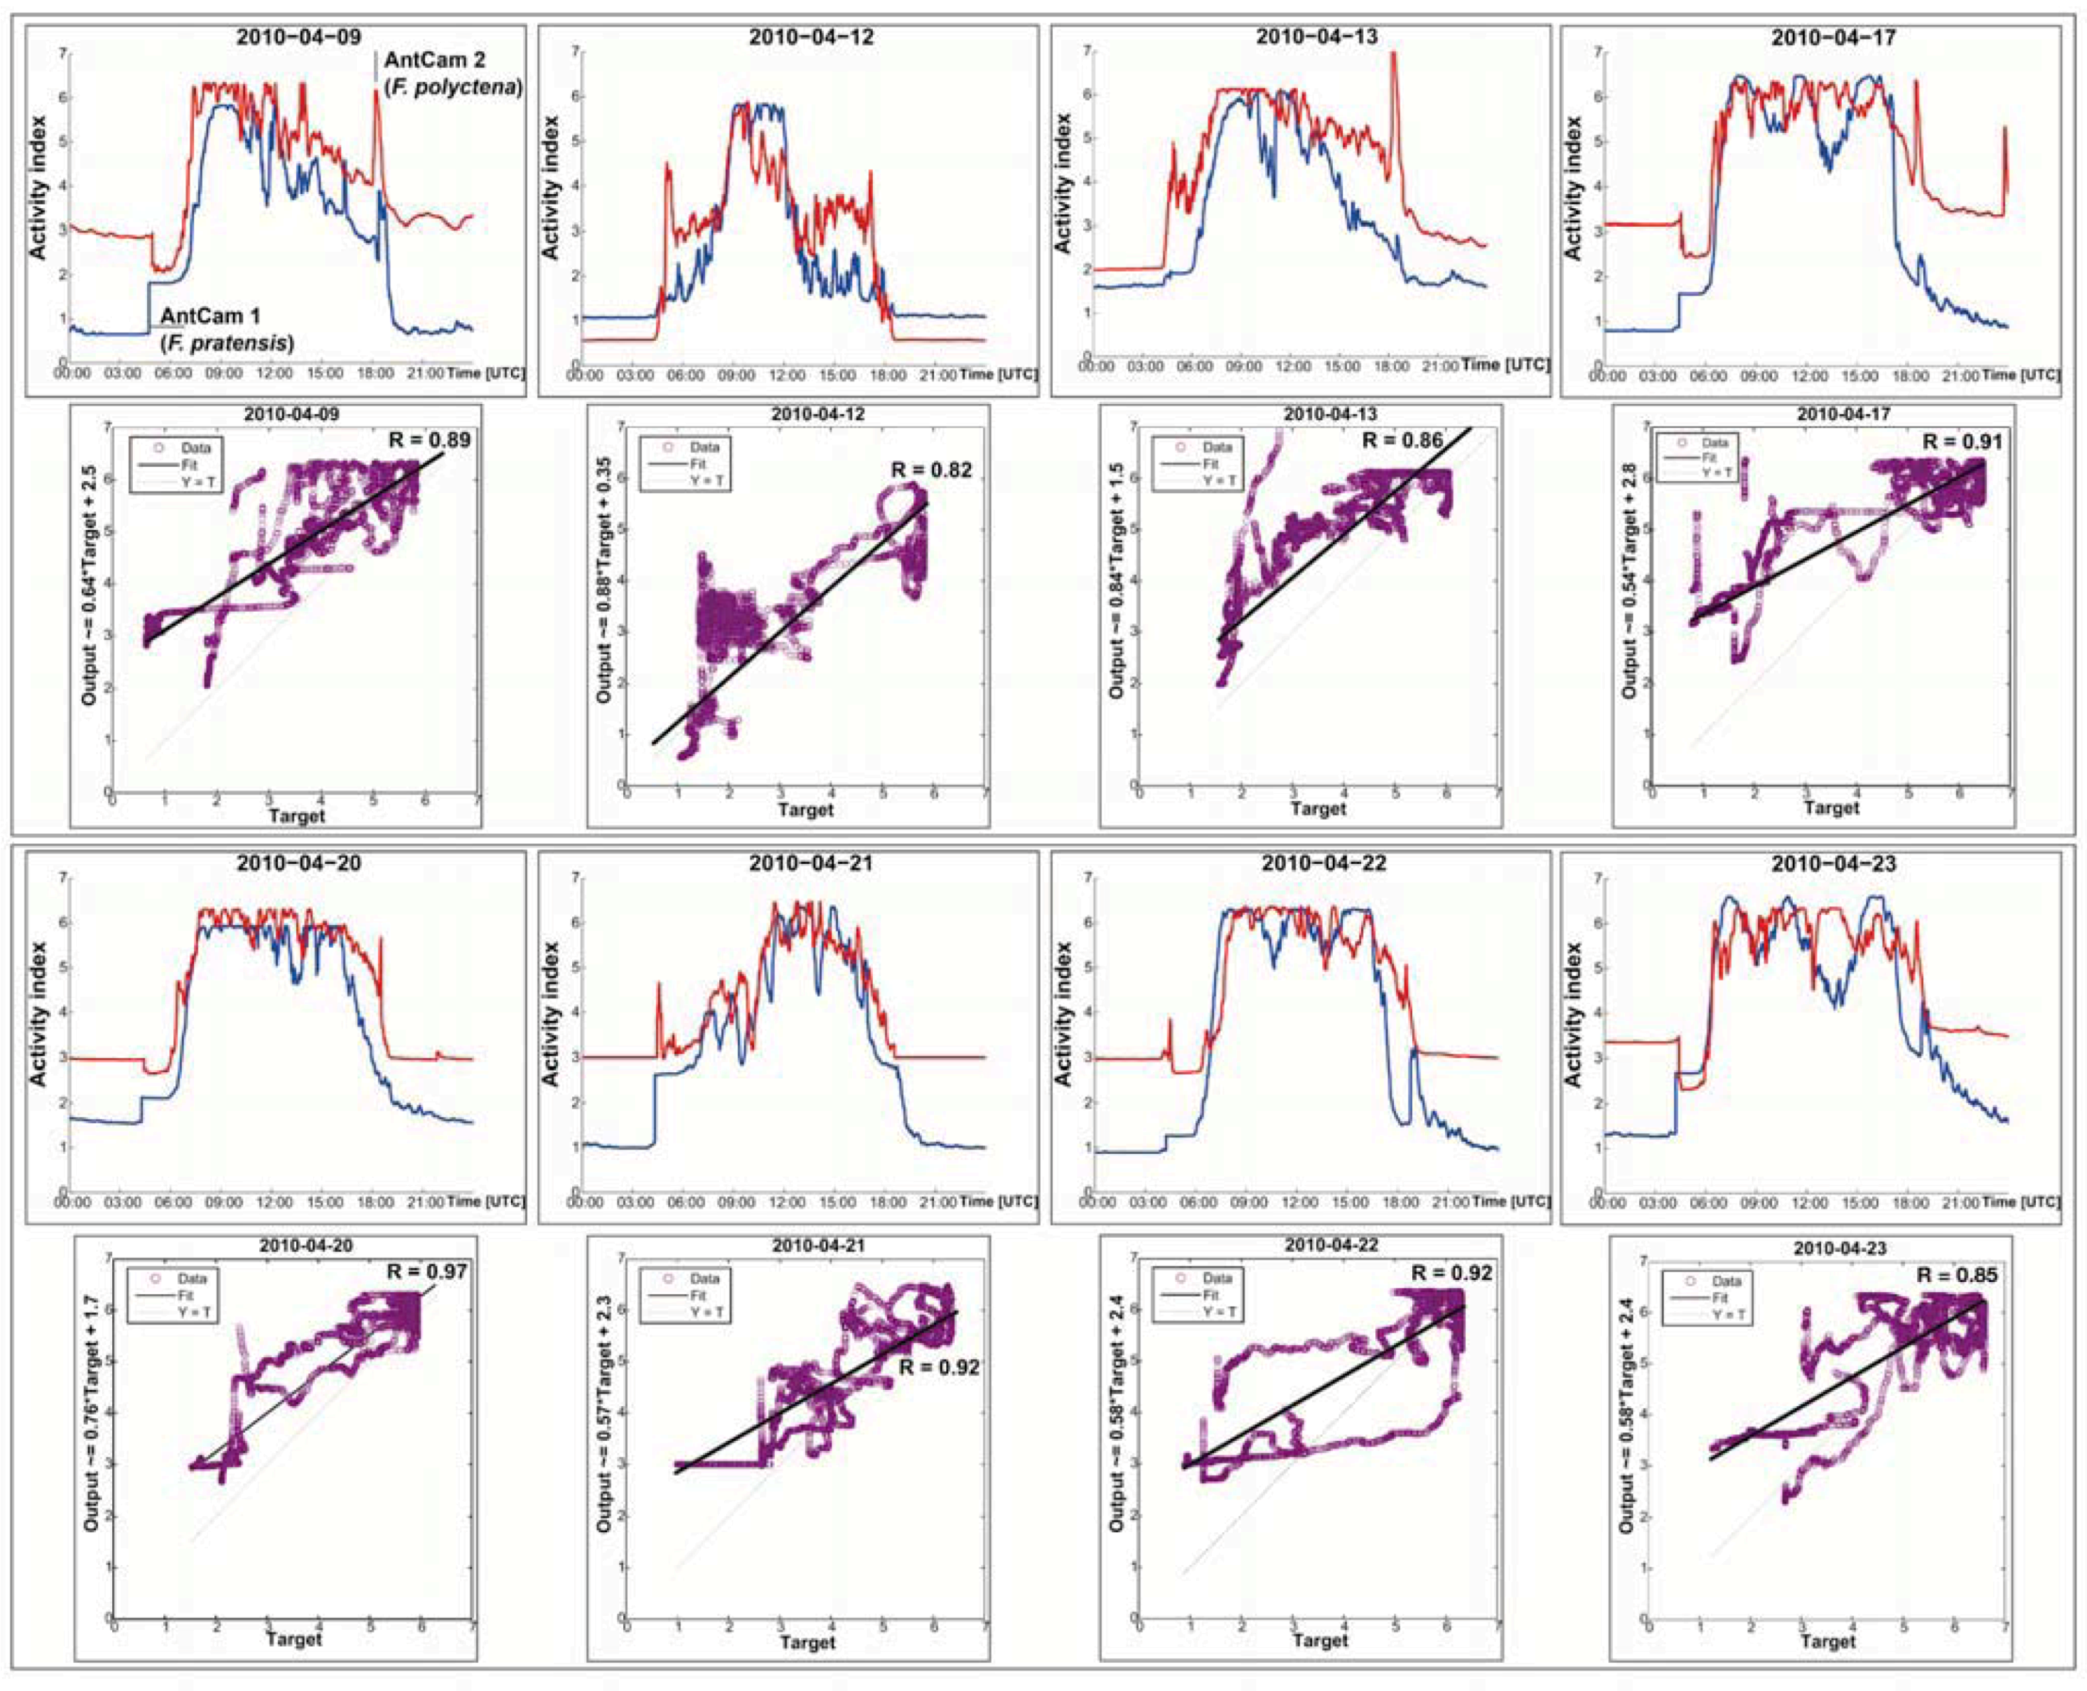
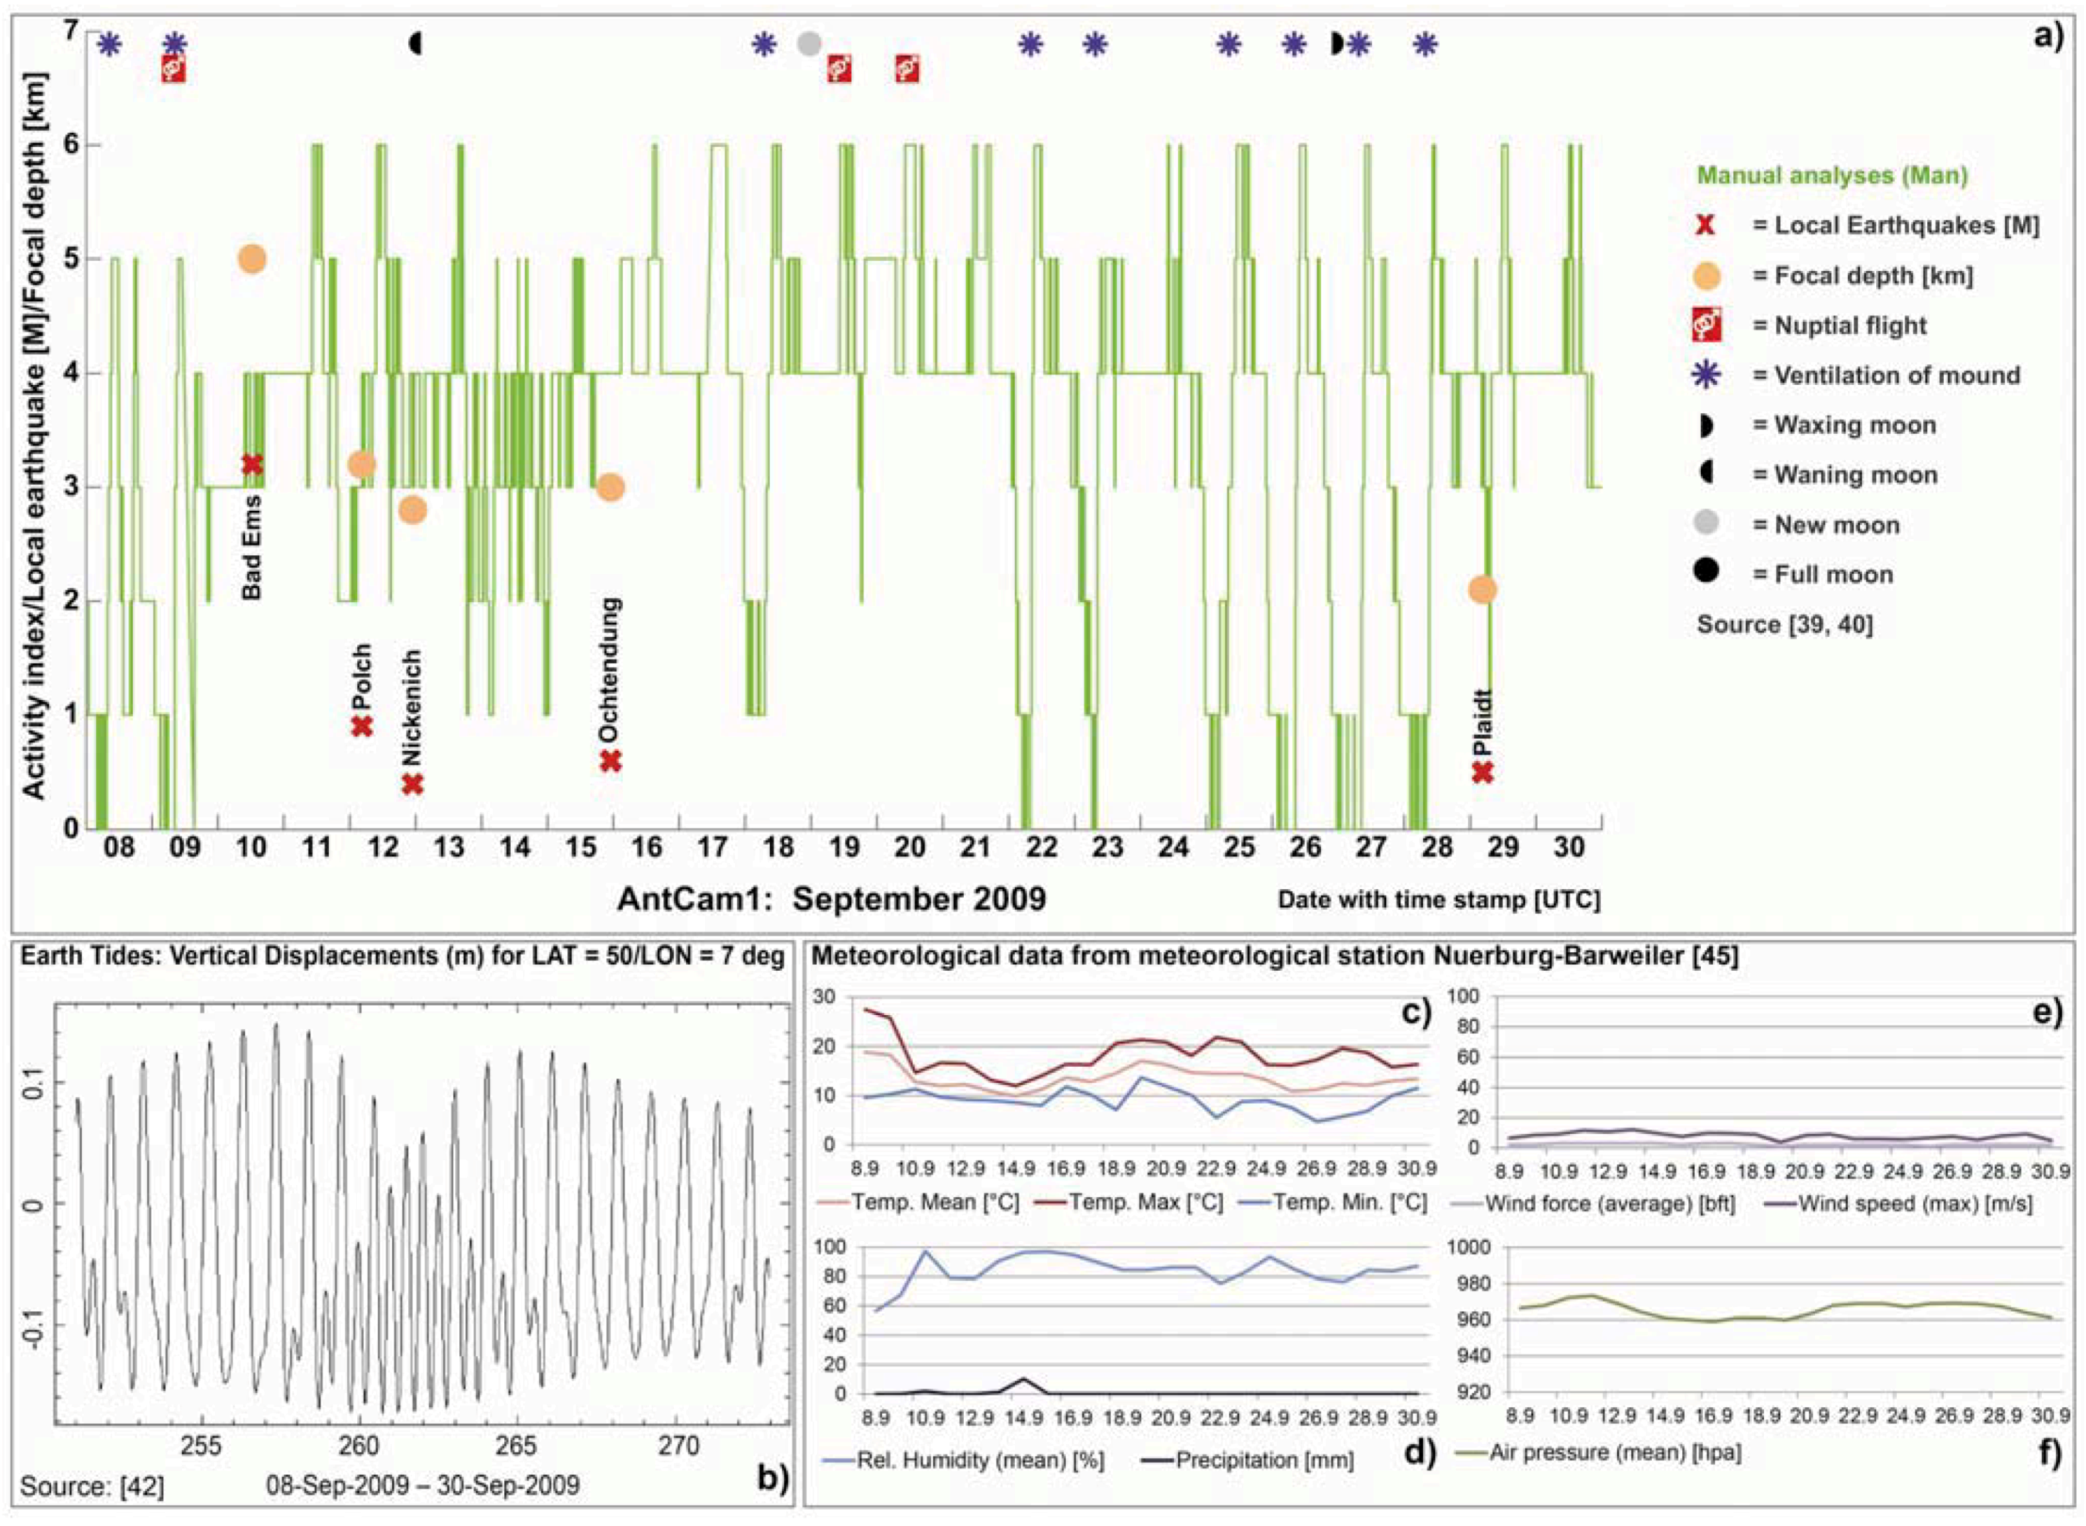
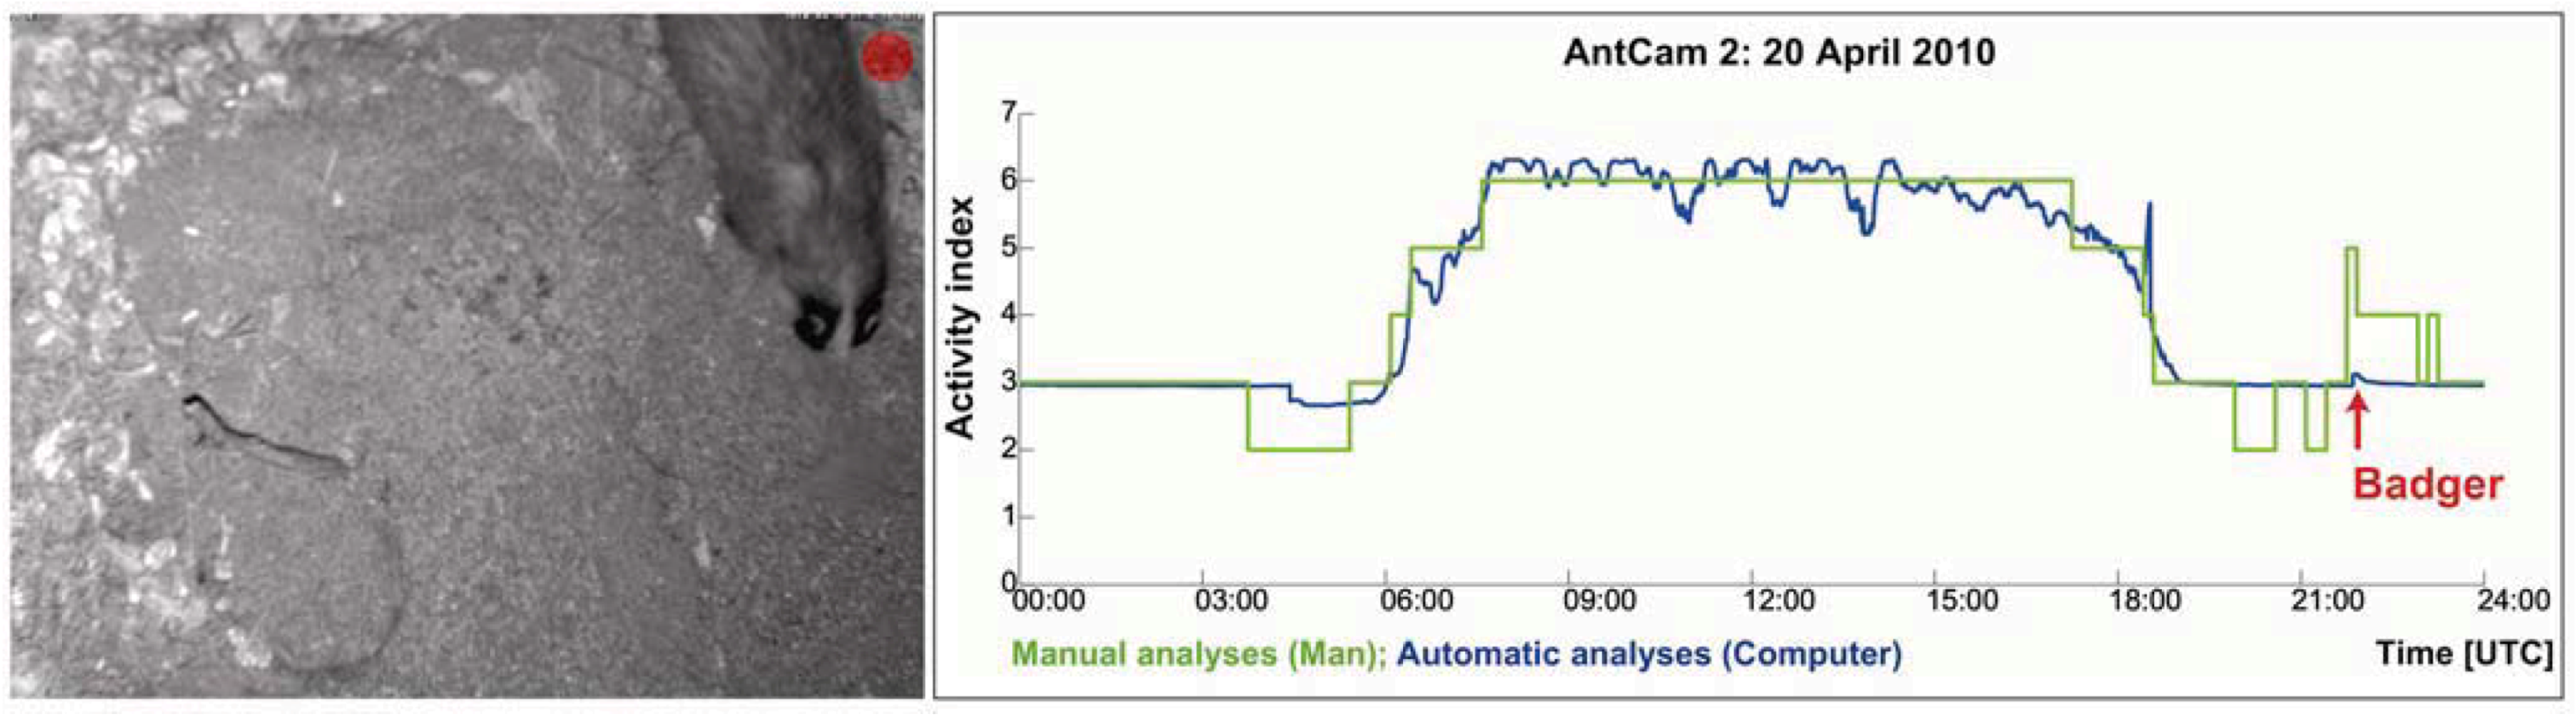
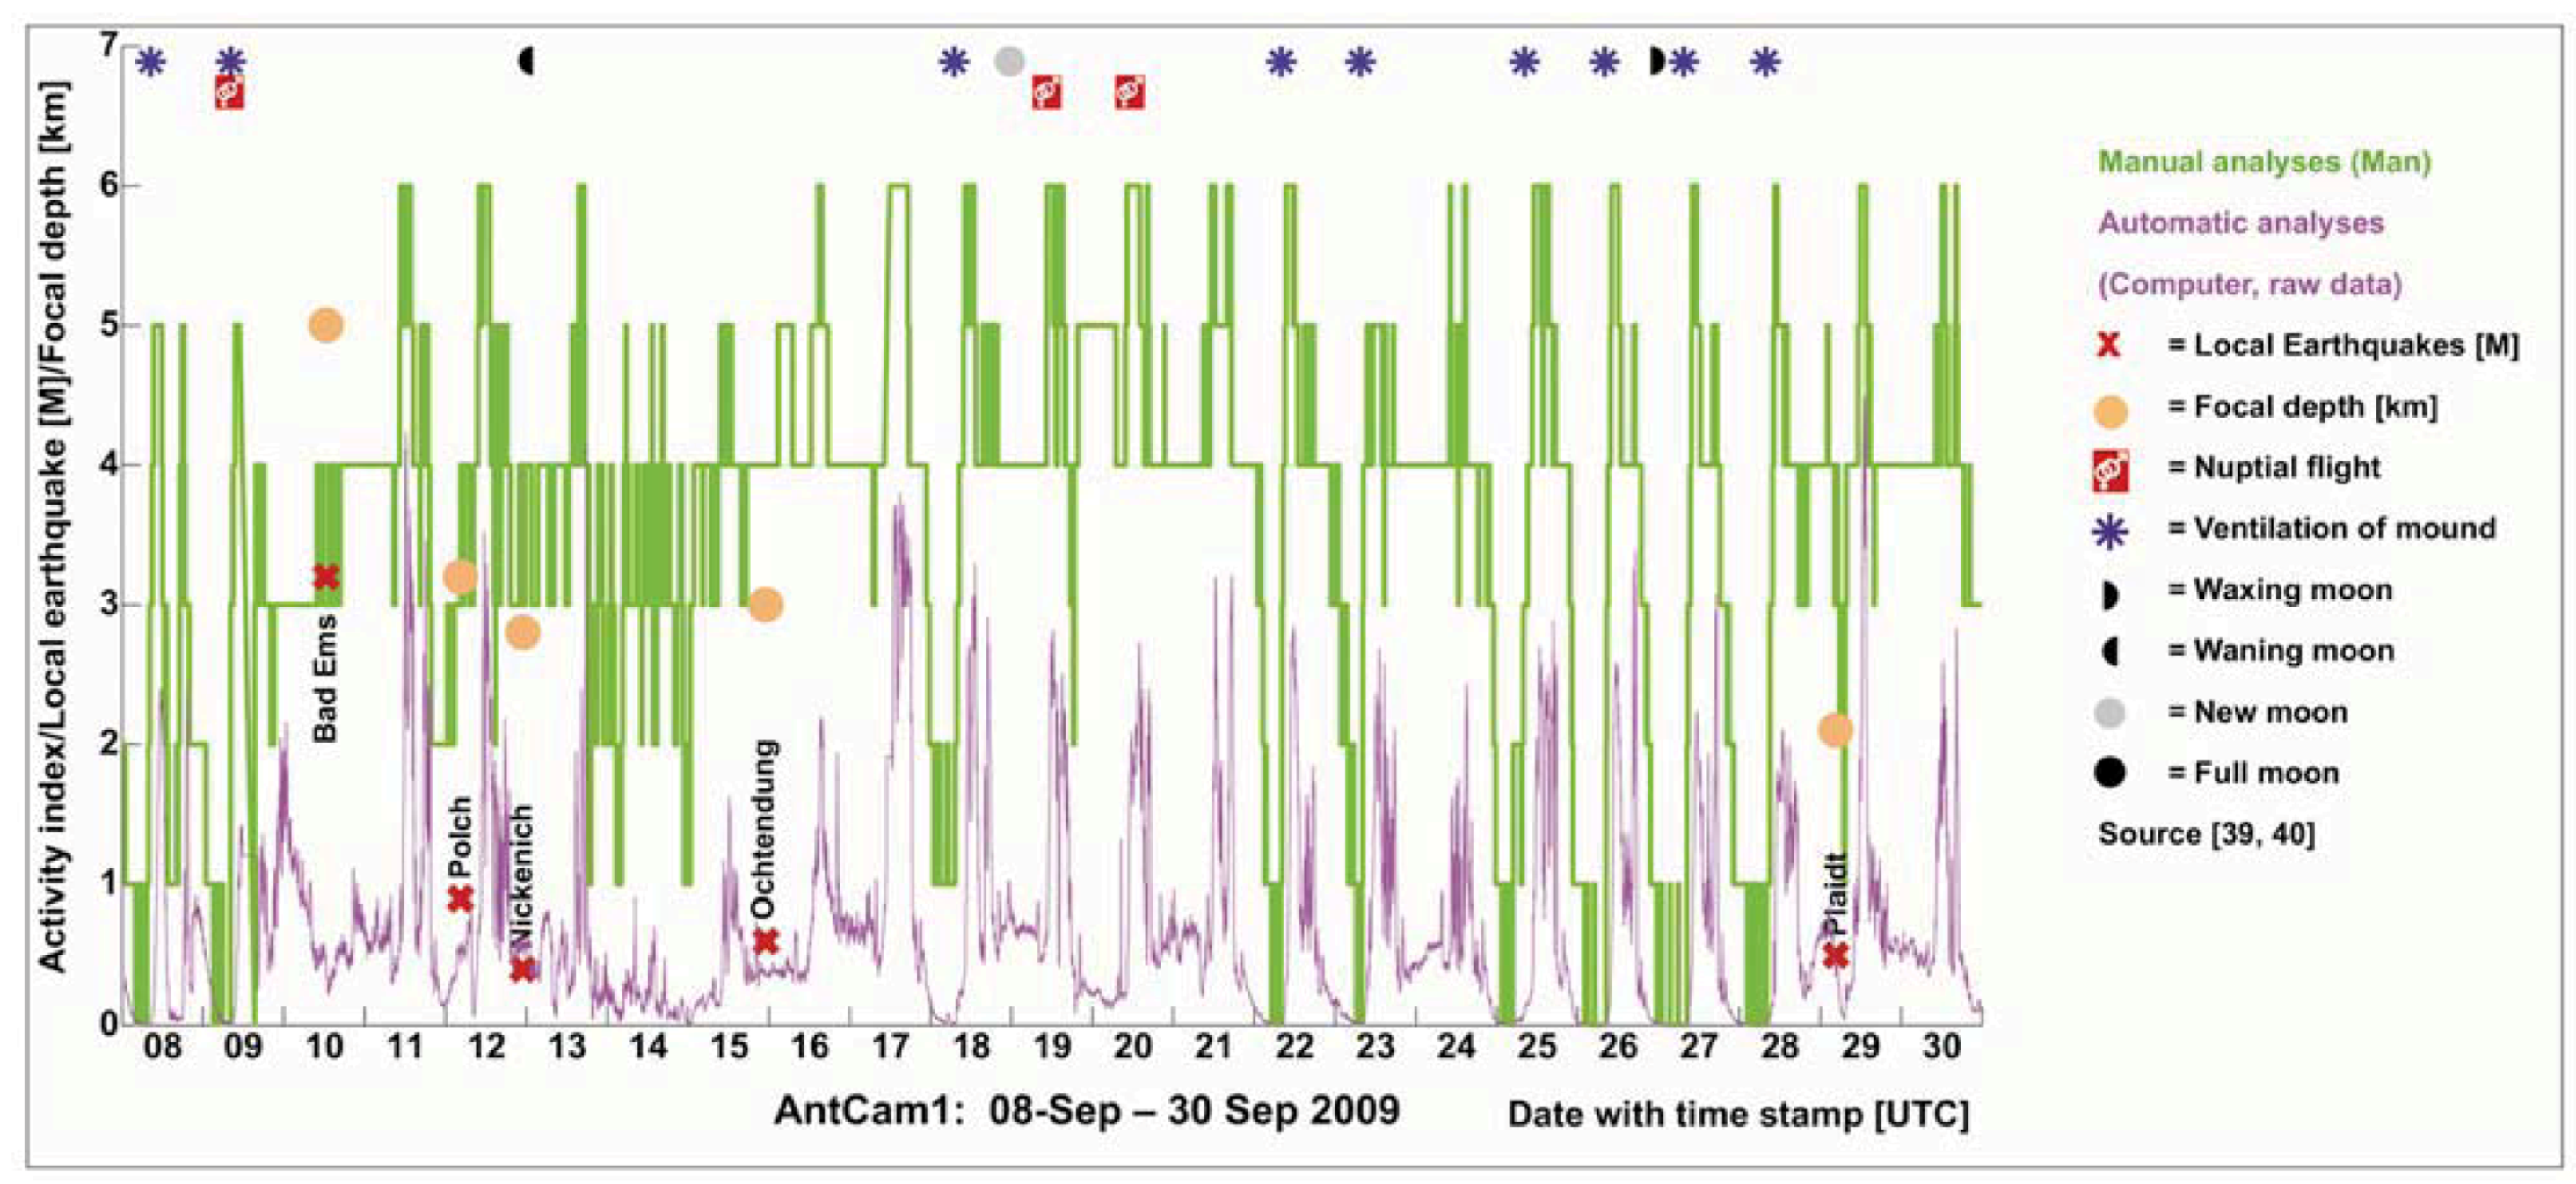
3. Results and Discussion


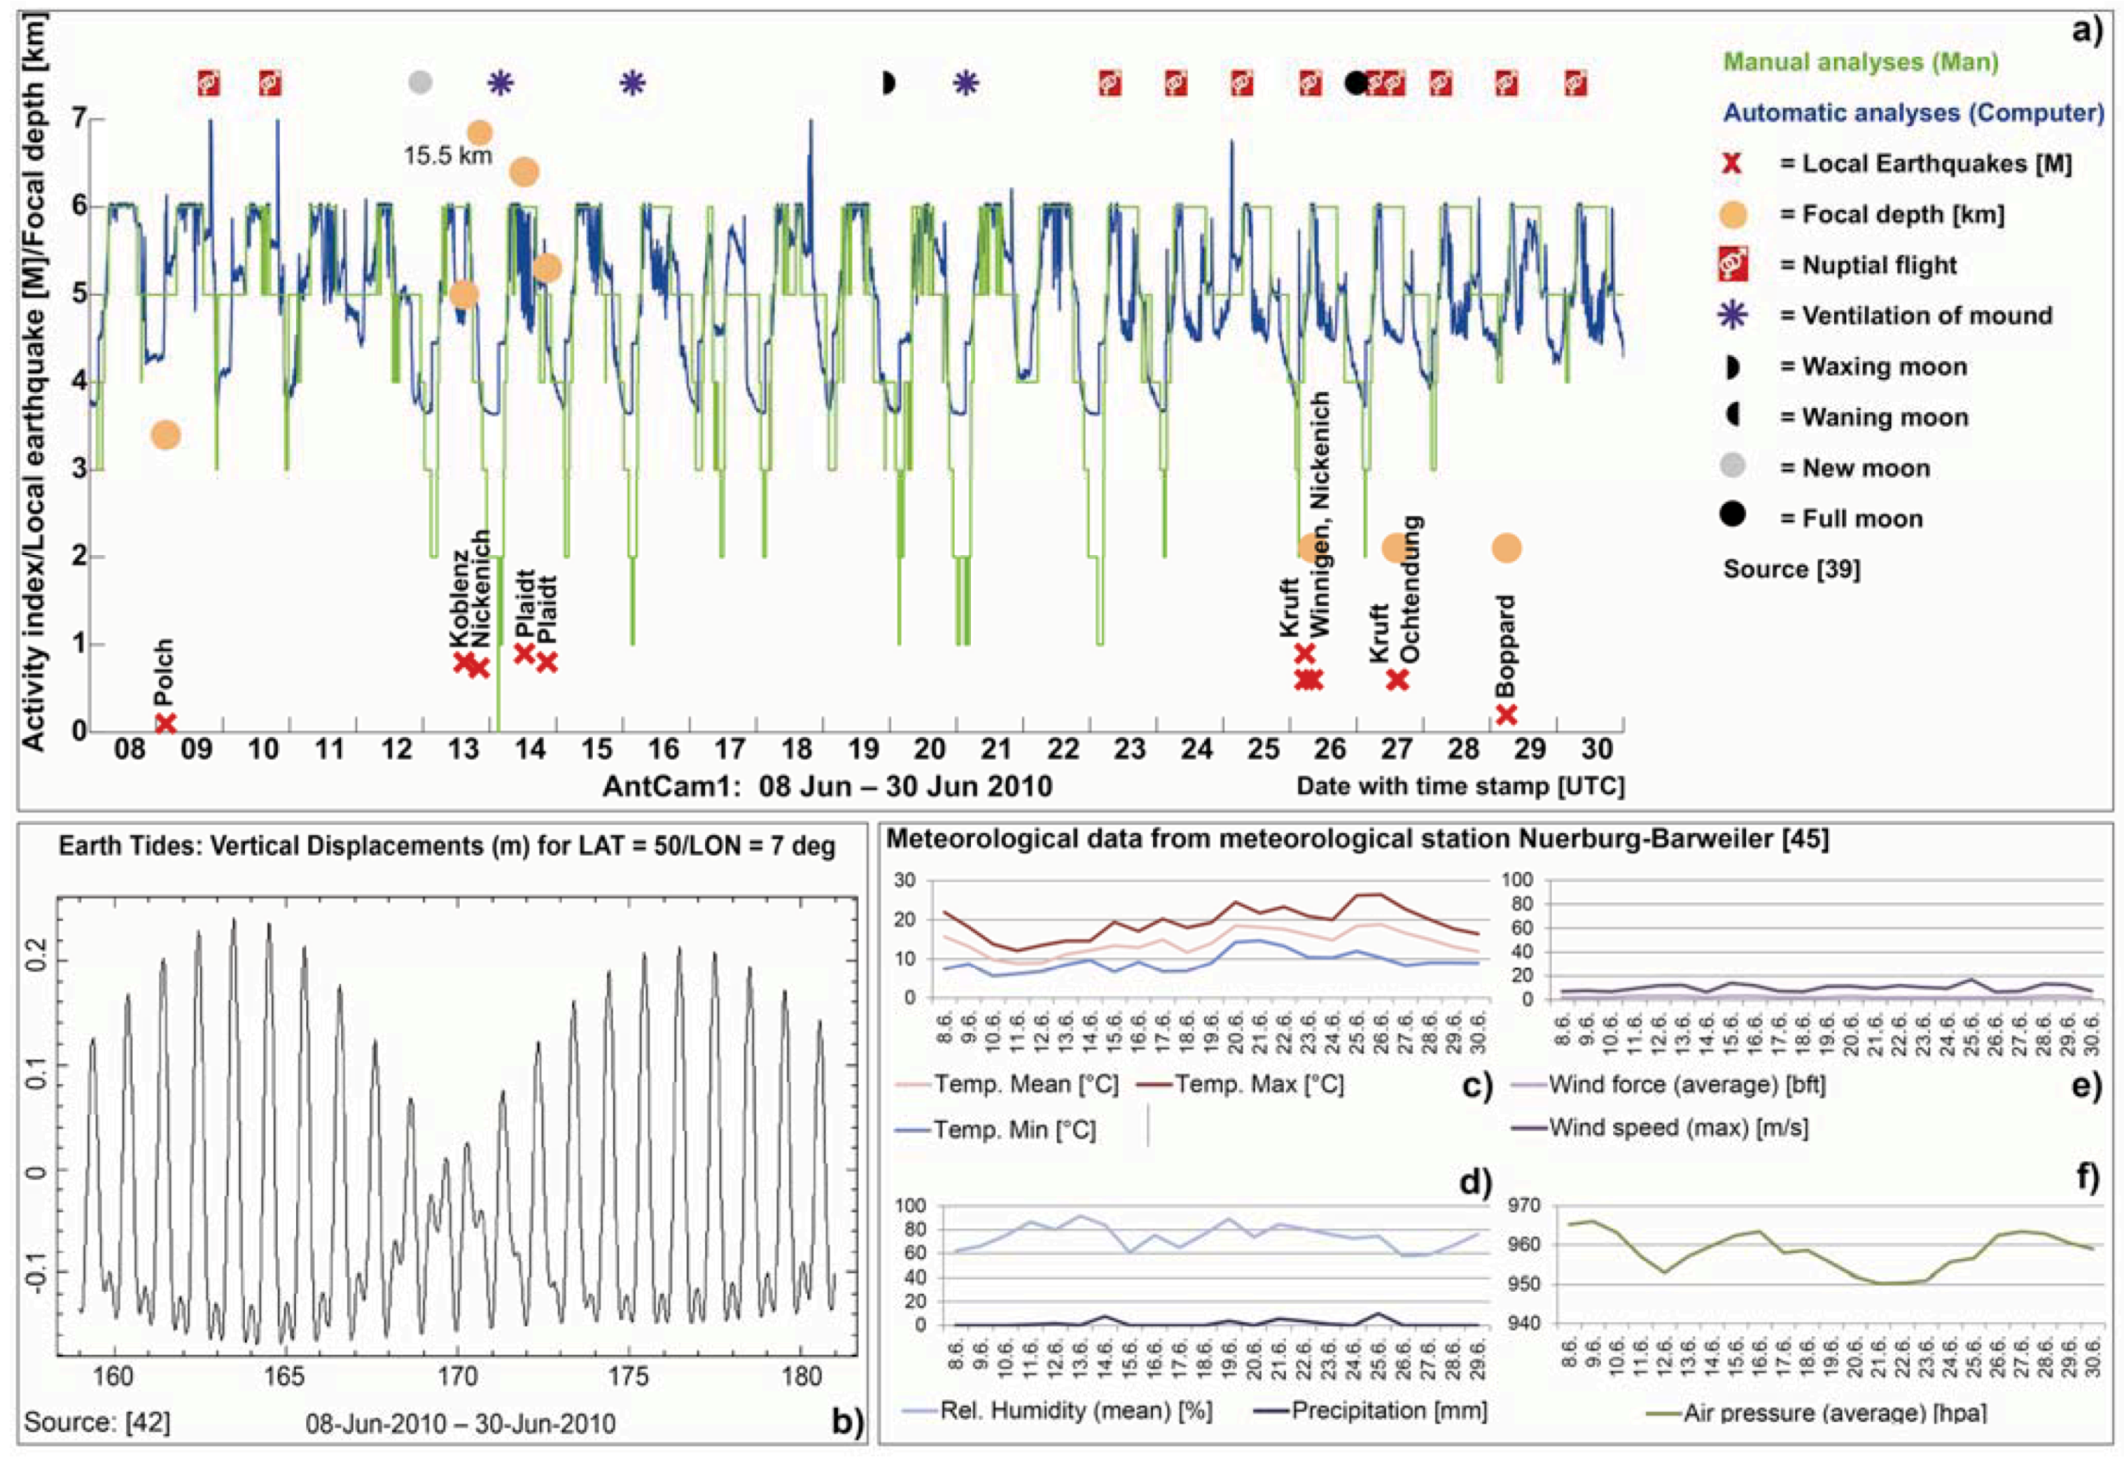
| Epicenter | Date | Time (UTC) | Focal Depth (km) | Magnitude (M) | Longitude (°) | Latitude (°) | Linear distance (km) of AntCam 1 to epicenter |
|---|---|---|---|---|---|---|---|
| Polch | 06/09/2010 | 03:31:25.0 | 3.4 | 0.1 | 7.33 | 50.30 | 18 |
| Koblenz | 06/13/2010 | 14:46:34.7 | 5.0 * | 0.8 | 7.56 | 50.34 | 30 |
| Nickenich | 06/13/2010 | 20:40:15.2 | 15.5 | 0.7 | 7.32 | 50.39 | 18 |
| Plaidt | 06/14/2010 | 12:32:30.9 | 6.4 | 0.9 | 7.34 | 50.40 | 14 |
| Plaidt | 06/14/2010 | 20:41:47.4 | 5.3 | 0.8 | 7.35 | 50.39 | 15 |
| Kruft | 06/26/2010 | 05:23:34.7 | 29.8 | 0.9 | 7.36 | 50.39 | 15 |
| S. Nickenich | 06/26/2010 | 05:24:18.6 | 15.2 | 0.6 | 7.32 | 50.39 | 13 |
| Winningen | 06/26/2010 | 08:15:56.3 | 2.1 | 0.6 | 7.51 | 50.32 | 28 |
| N. Ochtendung | 06/27/2010 | 14:27:27.1 | 2.1 | 0.6 | 7.39 | 50.37 | 18 |
| E. Kruft | 06/27/2010 | 15:04:37.7 | 2.1 | 0.6 | 7.35 | 50.38 | 15 |
| Boppard | 06/29/2010 | 05:59:34.0 | 2.1 | 0.2 | 7.62 | 50.23 | 39 |
4. Conclusions
Acknowledgments
Conflict of Interest
References and Notes
- Fletcher, L.E.; Christensen, I.A.; Liberda, J.J.; Rojas, J.I.; Borrero del Pino, C. Methods of Multivariable Earthquake Precursor Analysis and a Proposed Prototype Earthquake Early Warning System. In Proceeding of the International Space University Summer Session Program, Beijing, China, 25 June–24 August 2007; pp. 1–11.
- van Dam, J.W.; Horton, W.; Tsintsadze, N.L.; Kaladze, T.D.; Garner, T.W.; Tsamalashvili, L.V. Some physical mechanisms of precursors to earthquakes. J. Plasma Fusion Res. 2009, 8, 199–202. [Google Scholar]
- Yasuokaa, Y.; Igarashib, G.; Ishikawac, T.; Tokonamic, S.; Shinogia, M. Evidence of precursor phenomena in the Kobe earthquake obtained from atmospheric radon concentration. Appl. Geochem. 2006, 21, 1064–1072. [Google Scholar] [CrossRef]
- Schaal, R.B. An evaluation of the animal-behavior theory for earthquake prediction. Calif. Geol. 1988, 41, 41–45. [Google Scholar]
- Kirschvink, J.L. Earthquake prediction by animals: Evolution and sensory perception. Bull. Seism. Soc. Am. 2000, 90, 312–323. [Google Scholar] [CrossRef]
- Ikeya, M.; Yamanaka, C.; Mattsuda, T.; Sasaoka, H.; Ochiai, H.; Huang, Q.H.; Ohtani, N.; Komuranani, T.; Ohta, M.; Ohno, Y.; Nakagawa, T. Electromagnetic pulses generated by compression of granitic rocks and animal behaviour. Episodes 2000, 23, 262–265. [Google Scholar]
- Bhargava, N.; Katiyar, V.K.; Sharma, M.L.; Pradhan, P. Earthquake prediction through animal behavior: A review. Indian J. Biomech. 2009, 7-8, 159–165. [Google Scholar]
- Schreiber, U.; Brennholt, N.; Simon, J. Gas permeable deep reaching fracture zones encourage site selection of ants. Ecol. Ind. 2009, 9, 508–517. [Google Scholar] [CrossRef]
- Berberich, G.; Schreiber, U. First Results of 1 Year Monitoring of Red Wood Ant Behaviour as Short-Term (>1 h) Indicators for Earthquake Prediction. In Proceedings of the EGU General Assembly, Vienna, Austria, 4–8 April 2011.
- Erpenbeck, A.; Kirchner, W. Zur Kälteresistenz der Kleinen Roten Waldameise Formica polyctena Foerst. (Hymenoptera, Formicidae). Z Angew. Entomol. 1983, 96, 271–281. [Google Scholar] [CrossRef]
- Hetz, S.K.; Bradley, T.J. Insects breathe discontinuously to avoid oxygen toxicity. Nature 2005, 433, 516–519. [Google Scholar]
- Hölldobler, B.; Wilson, E.O. Der Superorganismus—Der Erfolg von Ameisen, Bienen, Wespen und Termiten; Springer: Berlin, Germany, 2010. [Google Scholar]
- Camlitepe, Y.; Stradling, D.J. Wood ants orient to magnetic fields. Proc. Roy. Soc. Lond. 1995, 261, 37–41. [Google Scholar] [CrossRef]
- Camlitepe, Y.; Aksoy, V.; Uren, N.; Yilmaz, A.; Becenen, I. An experimental analysis on the magnetic field sensitivity of the black-meadow ant formica pratensis retzius (Hymenoptera: Formicidae). Acta Biol. Hungarica 2005, 56, 215–224. [Google Scholar] [CrossRef]
- de Oliveira, J.F.; Wajnberg, E.; de Souza Esquivel, D.M.; Weinkauf, S.; Winklhofer, M.; Hanzlik, M. Ant antennae: Are they sites for magnetoreception? J. Roy. Soc. Interface 2010, 7, 143–152. [Google Scholar] [CrossRef]
- Berberich, G. Identifikation junger gasführender Störungszonen in der West- und Hocheifel mit Hilfe von Bioindikatoren. Ph.D. Thesis, 2010. [Google Scholar]
- Berberich, G.; Klimetzek, D.; Wöhler, C.; Grumpe, A. Statistical Correlation between Red Wood Ant Sites and Neotectonic Strike-Slip Faults. In Proceedings of the EGU General Assembly, Vienna, Austria, 22–27 April 2012.
- Jähne, B. Digitale Bildverarbeitung, 6th ed.; Springer: Berlin, Germany, 2005. [Google Scholar]
- Geologische Übersichtskarte von Deutschland 1:200 000; Digitale Ausgabe, Blatt Trier CC 6302; Bundesanstalt für Geowissenschaften und Rohstoffe (BGR): Hanover, Germany, 2010.
- Erläuterungen zu Blatt C 5502 Aachen; Geologisches Landesamt Nordrhein-Westfalen (GLA-NRW): Krefeld, Germany, 1992; p. 84.
- Schreiber, U.; Berberich, G. Red Wood Ant Mounds as Biological Indicators for Earthquake-bearing Fault Systems. In Proceedings of the EGU General Assembly, Vienna, Austria, 4–8 April 2011.
- Grant, R.A.; Halliday, T.; Bladerer, W.P.; Leuenberger, F.; Newcomer, M.; Cyr, G.; Freund, F.T. Ground water chemistry changes before major earthquakes and possible effects on animals. Int. J. Environ. Res. Public Health 2011, 8, 1936–1956. [Google Scholar]
- Dologlou, E. Recent aspects on possible interrelation between precursory electric signals and anomalous bioeffects. Nat. Hazards Earth Syst. Sci. 2010, 10, 1951–1955. [Google Scholar] [CrossRef]
- Weaver, J.C.; Vaughan, T.E.; Astumian, R.D. Biological sensing of small field differences by magnetically sensitive chemical reactions. Nature 2000, 405, 707–709. [Google Scholar]
- Weaver, J.C. Understanding conditions for which biological effects of nonionizing electromagnetic fields can be expected. Bioelectrochemistry 2002, 56, 207–209. [Google Scholar] [CrossRef]
- Ouzounov, D.; Freund, F.T. Mid-infrared emission prior to strong earthquakes analyzed by remote sensing data. Adv. Pace Res. 2004, 33, 268–273. [Google Scholar]
- Freund, F.T. Toward a unified solid state theory for pre-earthquake signals. Acta Geophys. 2010, 58, 719–766. [Google Scholar] [CrossRef]
- Carreno, E.; Capote, R.; Yague, A. Observations of Thermal Anomaly Associated to Seismic Activity from Remote Sensing. In Proceedings of General Assembly of European Seismology Commission, Lisbon, Portugal, 10–15 September 2001; pp. 265–269.
- Hinzen, K.G. Stress field in the Northern Rhine area, Central Europe, from earthquake fault plane solutions. Tectonophysics 2003, 377, 325–356. [Google Scholar] [CrossRef]
- Illies, J.; Baumann, H. Crustal dynamics and morphodynamics of the Western European Rift System. Z. f. Geomorph. 1982, 42 (Suppl.), 135–165. [Google Scholar]
- Rummel, F.; Baumgärtner, J. Hydraulic Fracturing in-situ stress and permeability measurements in the research borehole Konzen, Hohes Venn (West Germany). N. Jb. Geol. Paläont. Abh. 1985, 171, 183–195. [Google Scholar]
- Schreiber, U.; Rotsch, S. Cenozoic block rotation according to a conjugate shear system in central Europe—Indications form paleomagnetic measurements. Tectonophysics 1998, 299, 111–142. [Google Scholar] [CrossRef]
- Walker, K.T.; Bokelmann, G.H.R.; Klemperer, S.L.; Bock, G. Shear-wave splitting around the Eifel hotspot: Evidence for a mantle upwelling. Geophys. J. Int. 2005, 163, 962–980. [Google Scholar] [CrossRef]
- Tesauro, M.; Hollenstein, C.; Egli, R.; Geiger, A.; Kahle, H.-G. Analysis of central western Europe deformation using GPS and seismic data. J. Geodynam. 2006, 42, 194–209. [Google Scholar] [CrossRef]
- Weisser, D. Tektonik und Barytgänge in der SE-Eifel. Zeitschrift der deutschen geologischen Gesellschaft 1963, 115, 33–68. [Google Scholar]
- Redecke, P. Zur Geochemie und Genese variszischer und postvariszischer Buntmetallmineralisation in der Nordeifel und der Niederrheinischen Bucht. Ph.D. Thesis, RWTH Aachen, Aachen, Germany, 1992. [Google Scholar]
- Campbell, J.; Kümpel, H.‐J.; Fabian, M.; Fischer, D.; Görres, B.; Keysers, C.J.; Lehmann, K. Recent movement pattern of the Lower Rhine Embayement from tilt, gravity and GPS data. Netherlands J. Geosci. 2002, 81, 223–230. [Google Scholar]
- Ahorner, L. Present-day stress field and seismotectonic block movements along major faults in Western Europe. Tectonophysics 1975, 29, 233–249. [Google Scholar] [CrossRef]
- Earthquake Data Catalogue. Department of Earthquake Geology of Cologne University. Available online: http://www.seismo.uni-koeln.de/catalog/index.htm (accessed on 9 November 2012).
- Earthquake Catalogue. Landesamt für Geologie und Bergbau Rheinland-Pfalz. Available online: http://www.lgb-rlp.de/erdbeben.htm (accessed on 10 September 2009).
- Schreiber, U.; Berberich, G. Why does the Size of the Laacher See Magma Chamber and its Caldera Size not go together?—New Findings with regard to Active Tectonics in the East Eifel Volcanic Field. In Proceedings of the EGU General Assembly, Vienna, Austria, 7–12 April 2013.
- Earth Tides Vertical Displacements. Astronomisches Institut, University of Bern. Available online: http://www.aiub.unibe.ch/content/services/earth_tides/index_eng.html (accessed on 1 September 2009).
- Earth Tides and Volcano Monitoring. Hawaian Volcano Observatory. USGS. Available online: http://hvo.wr.usgs.gov/volcanowatch/98_05_28.html (accessed on 28 November 2012).
- Agnew, D.C. Earth Tides. In Treatise on Geophysics; Schubert, G., Herring, T., Eds.; Elsevier: Oxford, UK, 2007; Volume 3, pp. 163–195. [Google Scholar]
- Wetter und Klima. Deutscher Wetterdienst. Freie Met. Infos. Available online: http://www.dwd.de/...202758871200642573928&_urlType=action&_pageLabel=_dwdwww_menu2_leistungen_a-z_freiemetinfos (accessed on 1 September 2009).
- Hsu, Y.Z.; Nagel, H.H.; Rekers, G. New likelihood test methods for change detection in image sequences. Comput. Vision Graph. Image Process. 1984, 26, 73–106. [Google Scholar] [CrossRef]
- Rosin, P.; Ellis, T. Image Difference Threshold Strategies and Shadow Detection. In Proceedings of the Sixth British Machine Vision Conference, Birmingham, UK, 11–14 September 1995; pp. 347–356.
- Brown, L.G. A Survey of image registration techniques. ACM Comput. Surv. 1992, 24, 325–376. [Google Scholar] [CrossRef]
- Lighton, J.R.B.; Duncan, F.D. Shaken, not stirred: A serendipitous study of ants and earthquakes. J. Exp. Biol. 2005, 208, 3103–3107. [Google Scholar] [CrossRef]
- Gößwald, K. Artunterschiede der Waldameisen in Aussehen, Lebensweise, Organisation, Verhalten, Nest- und Straßenbau, Ökologie und Verbreitung. Waldhygiene 1982, 14, 161–192. [Google Scholar]
- Goropashnaya, A. Phylogeographic Structure and Genetic Variation in Formica Ants. Ph.D. Thesis, Uppsala University, Uppsala, Sweden, 2003. [Google Scholar]
© 2013 by the authors; licensee MDPI, Basel, Switzerland. This article is an open access article distributed under the terms and conditions of the Creative Commons Attribution license (http://creativecommons.org/licenses/by/3.0/).
Share and Cite
Berberich, G.; Berberich, M.; Grumpe, A.; Wöhler, C.; Schreiber, U. Early Results of Three-Year Monitoring of Red Wood Ants’ Behavioral Changes and Their Possible Correlation with Earthquake Events. Animals 2013, 3, 63-84. https://doi.org/10.3390/ani3010063
Berberich G, Berberich M, Grumpe A, Wöhler C, Schreiber U. Early Results of Three-Year Monitoring of Red Wood Ants’ Behavioral Changes and Their Possible Correlation with Earthquake Events. Animals. 2013; 3(1):63-84. https://doi.org/10.3390/ani3010063
Chicago/Turabian StyleBerberich, Gabriele, Martin Berberich, Arne Grumpe, Christian Wöhler, and Ulrich Schreiber. 2013. "Early Results of Three-Year Monitoring of Red Wood Ants’ Behavioral Changes and Their Possible Correlation with Earthquake Events" Animals 3, no. 1: 63-84. https://doi.org/10.3390/ani3010063
APA StyleBerberich, G., Berberich, M., Grumpe, A., Wöhler, C., & Schreiber, U. (2013). Early Results of Three-Year Monitoring of Red Wood Ants’ Behavioral Changes and Their Possible Correlation with Earthquake Events. Animals, 3(1), 63-84. https://doi.org/10.3390/ani3010063