Article

Characteristics of Thermal Comfort Conditions in Cold Rural Areas of China: A Case study of Stone Dwellings in a Tibetan Village

1
College of Civil Engineering and Architecture, Southwest University of Science and Technology, Mianyang 621010, Sichuan, China
2
School of Engineering and Built Environment, Griffith University, Gold Coast, QLD 4215, Australia
3
Faculty of Society and Design, Mirvac School of Sustainable Development, Bond University, Robina, QLD 4226, Australia
*
Author to whom correspondence should be addressed.
Buildings 2018, 8(4), 49; https://doi.org/10.3390/buildings8040049
Submission received: 2 March 2018 / Revised: 20 March 2018 / Accepted: 20 March 2018 / Published: 26 March 2018
(This article belongs to the Special Issue Human Factors in Green Building)

Abstract

:
This paper focuses on thermal environmental conditions in the stone dwellings of a Tibetan village in Danba County, Sichuan, China, in winter. During the study, field measurements and subjective survey studies were collected, simultaneously, to provide a comprehensive understanding of the thermal comfort conditions that were experienced by residents in cold rural areas of Sichuan. Subjective surveys involved questions about thermal comfort perceptions and acceptability in cold conditions. The status of thermal comfort and characteristics of indoor environmental qualities were investigated in the study. The majority of survey participants (47% and 74%) voted as “slightly cool” for temperature, and “slightly dry” for humidity in the studied typical winter days, respectively. The available adaptive opportunities for the residents were investigated through the survey studies. Adjusting clothing, drinking hot beverages, blocking air infiltration through windows, and changing activities were the most common adaptive measures. An adaptive coefficient ( λ ) was determined based on adaptive predicted mean votes (aPMV) models using least square methods to assess the different adaptation measures in the region. Findings of this study provided a valuable reference for thermal comfort adaptations in cold climates, where limited adaptive opportunities were available due to the low standard of living.

1. Introduction

Thermal comfort is an important aspect of residential buildings because it strongly influences occupant health and wellbeing [1]. In the past, research has focused on non-residential buildings [2,3,4,5,6,7], and occupant thermal perceptions and comfort in residential buildings have been largely overlooked. In thermal comfort studies, two methods were employed: chamber studies, and real building experiments [8,9]. Based on chamber experiments, Fanger developed a heat balance model of thermal comfort for air-conditioned buildings, which estimates predicted mean votes (PMV) and the percentage of predicted dissatisfaction (PPD) [10]. Fanger was one of the first who studied parameter affecting indoor environmental qualities [11]. The PMV model of thermal comfort established the theoretical basis for thermal comfort studies of interactions between a human body and physical parameters. The PMV model became the benchmark for the International Organization for Standardization (ISO) for thermal comfort [12,13,14,15]. The PMV model was originally developed based on air conditioning buildings. Several researchers attempted to verify the applicability of the PMV model in naturally ventilated buildings [16,17,18]. Field measurements, as one assessment tool for post occupancy evaluations [19], indicated that a large deviation exists in the application of the PMV model in the early stage of indoor climate.
Later, De Dear and Brager [20] collected large sample data from a series of field studies in naturally ventilated buildings in the global climate region, and established an adaptive thermal comfort model. The adaptive thermal comfort model showed that occupants exhibit a wider acceptable temperature range in naturally ventilated buildings and in the presence of adaptive measures. Adaptive opportunities, such as changing clothing or air movement helped occupants to make physiological and psychological adjustments [21].
However, research has shown that cultural, social, and climate factors have a strong influence on human thermal comfort [22]. Human bodies respond to thermal environments by physiological adaptations through thermoregulatory systems and create a heat balance [8]. Behavioural adaptations are performed when humans feel thermally dissatisfied with their environment. As shown by De Dear and Brager [23], psychologically adaptive behaviours plays a significant role in determining thermal sensation votes [18,24]. Based on this discussion, occupant psychological and behavioural adaptations in different environmental conditions and their influence on thermal comfort is essential. Yao et al. [8] proposed a theoretical aPMV that considered psychological, physiological, and behavioural adaptability and other influencing factors on thermal comfort sensations. As literature suggests, the aPMV seems to be the most appropriate model for the assessment of cultural, social and climatic impacts on thermal comfort status in rural non-air-conditioned residential buildings [25].
With its diverse culture and climate, China has attracted the attention of many researchers working to develop thermal comfort models with respect to climate, and social and cultural differences in cities such as Guangzhou, Zhejiang, Shanghai, Changsha, Chongqing, Xi’an, Beijing and Harbin [26,27,28,29,30,31,32,33,34,35]. Chinese rural residential buildings have also attracted the attention of many scholars who have examined thermal comfort status in various climatic zones in China. Zhou [36] investigated the thermal comfort of rural houses in western Hunan with its hot summer and cold winters, and estimated the adaptive coefficient (λ) of 0.49 for the region. Wang [37] adopted the aPMV model and predicted the average thermal sensation of primary and middle school classrooms in Qinghai rural areas with their severe cold winter seasons. Li [38] studied the Chongqing rural area with its hot summers and cold winters, and simulated the indoor thermal environment. Yang [39] employed the aPMV model to evaluate the indoor thermal environment in timber residential buildings in the Chongqing mountains, and showed that timber houses possess a strong climate adaptability. Zheng [40] conducted field thermal comfort studies in Xi’an’s cold climate, and examined the thermal comfort status in four different seasons in the region.
Some researchers have worked on thermal comfort characteristics in the harsh climate of high altitude areas. Wang [41] studied the indoor temperature and humidity conditions of indoor environments in houses at high altitude in the Tibet region, and estimated the comfortable temperature range and the adaptive coefficient in the area. He Q [42] conducted research on the assessment of indoor thermal conditions in Tibetan residences on the West Sichuan Plateau, and suggested a number of design strategies to improve indoor thermal environmental conditions for the residents. Ouyang [43] examined Tibetan dwellings on the Western Sichuan Plateau during winter, and recommended the use of solar energy resources to improve indoor environmental qualities for the residents. Chen [44] measured indoor temperature and humidity levels in Tibetan Danba in transitional seasons, and compared the indoor environmental conditions between spring and summer in the stone houses.
This research aims to show the adaptive level of the human body in the naturally ventilated stone dwellings in the cold climate zone of Sichuan, China, in a winter season. The objective of the research is to examine the effect of the natural environment on occupant thermal comfort status and characteristics. The important issues of housing environment and the needs of residents, particularly in low-income groups, have been raised by many researchers [45]. Due to the harsh climate, and impoverished villagers, a comfortable and healthy indoor environment is difficult to guarantee. Therefore, the study of the thermal environment inside stone dwellings of a Tibetan village in the winter season provides an opportunity to study the lowest acceptable temperature in buildings that have limited heating systems available for residents. This paper offers an opportunity to understand occupant physiological and psychological adaptability to cold climates.

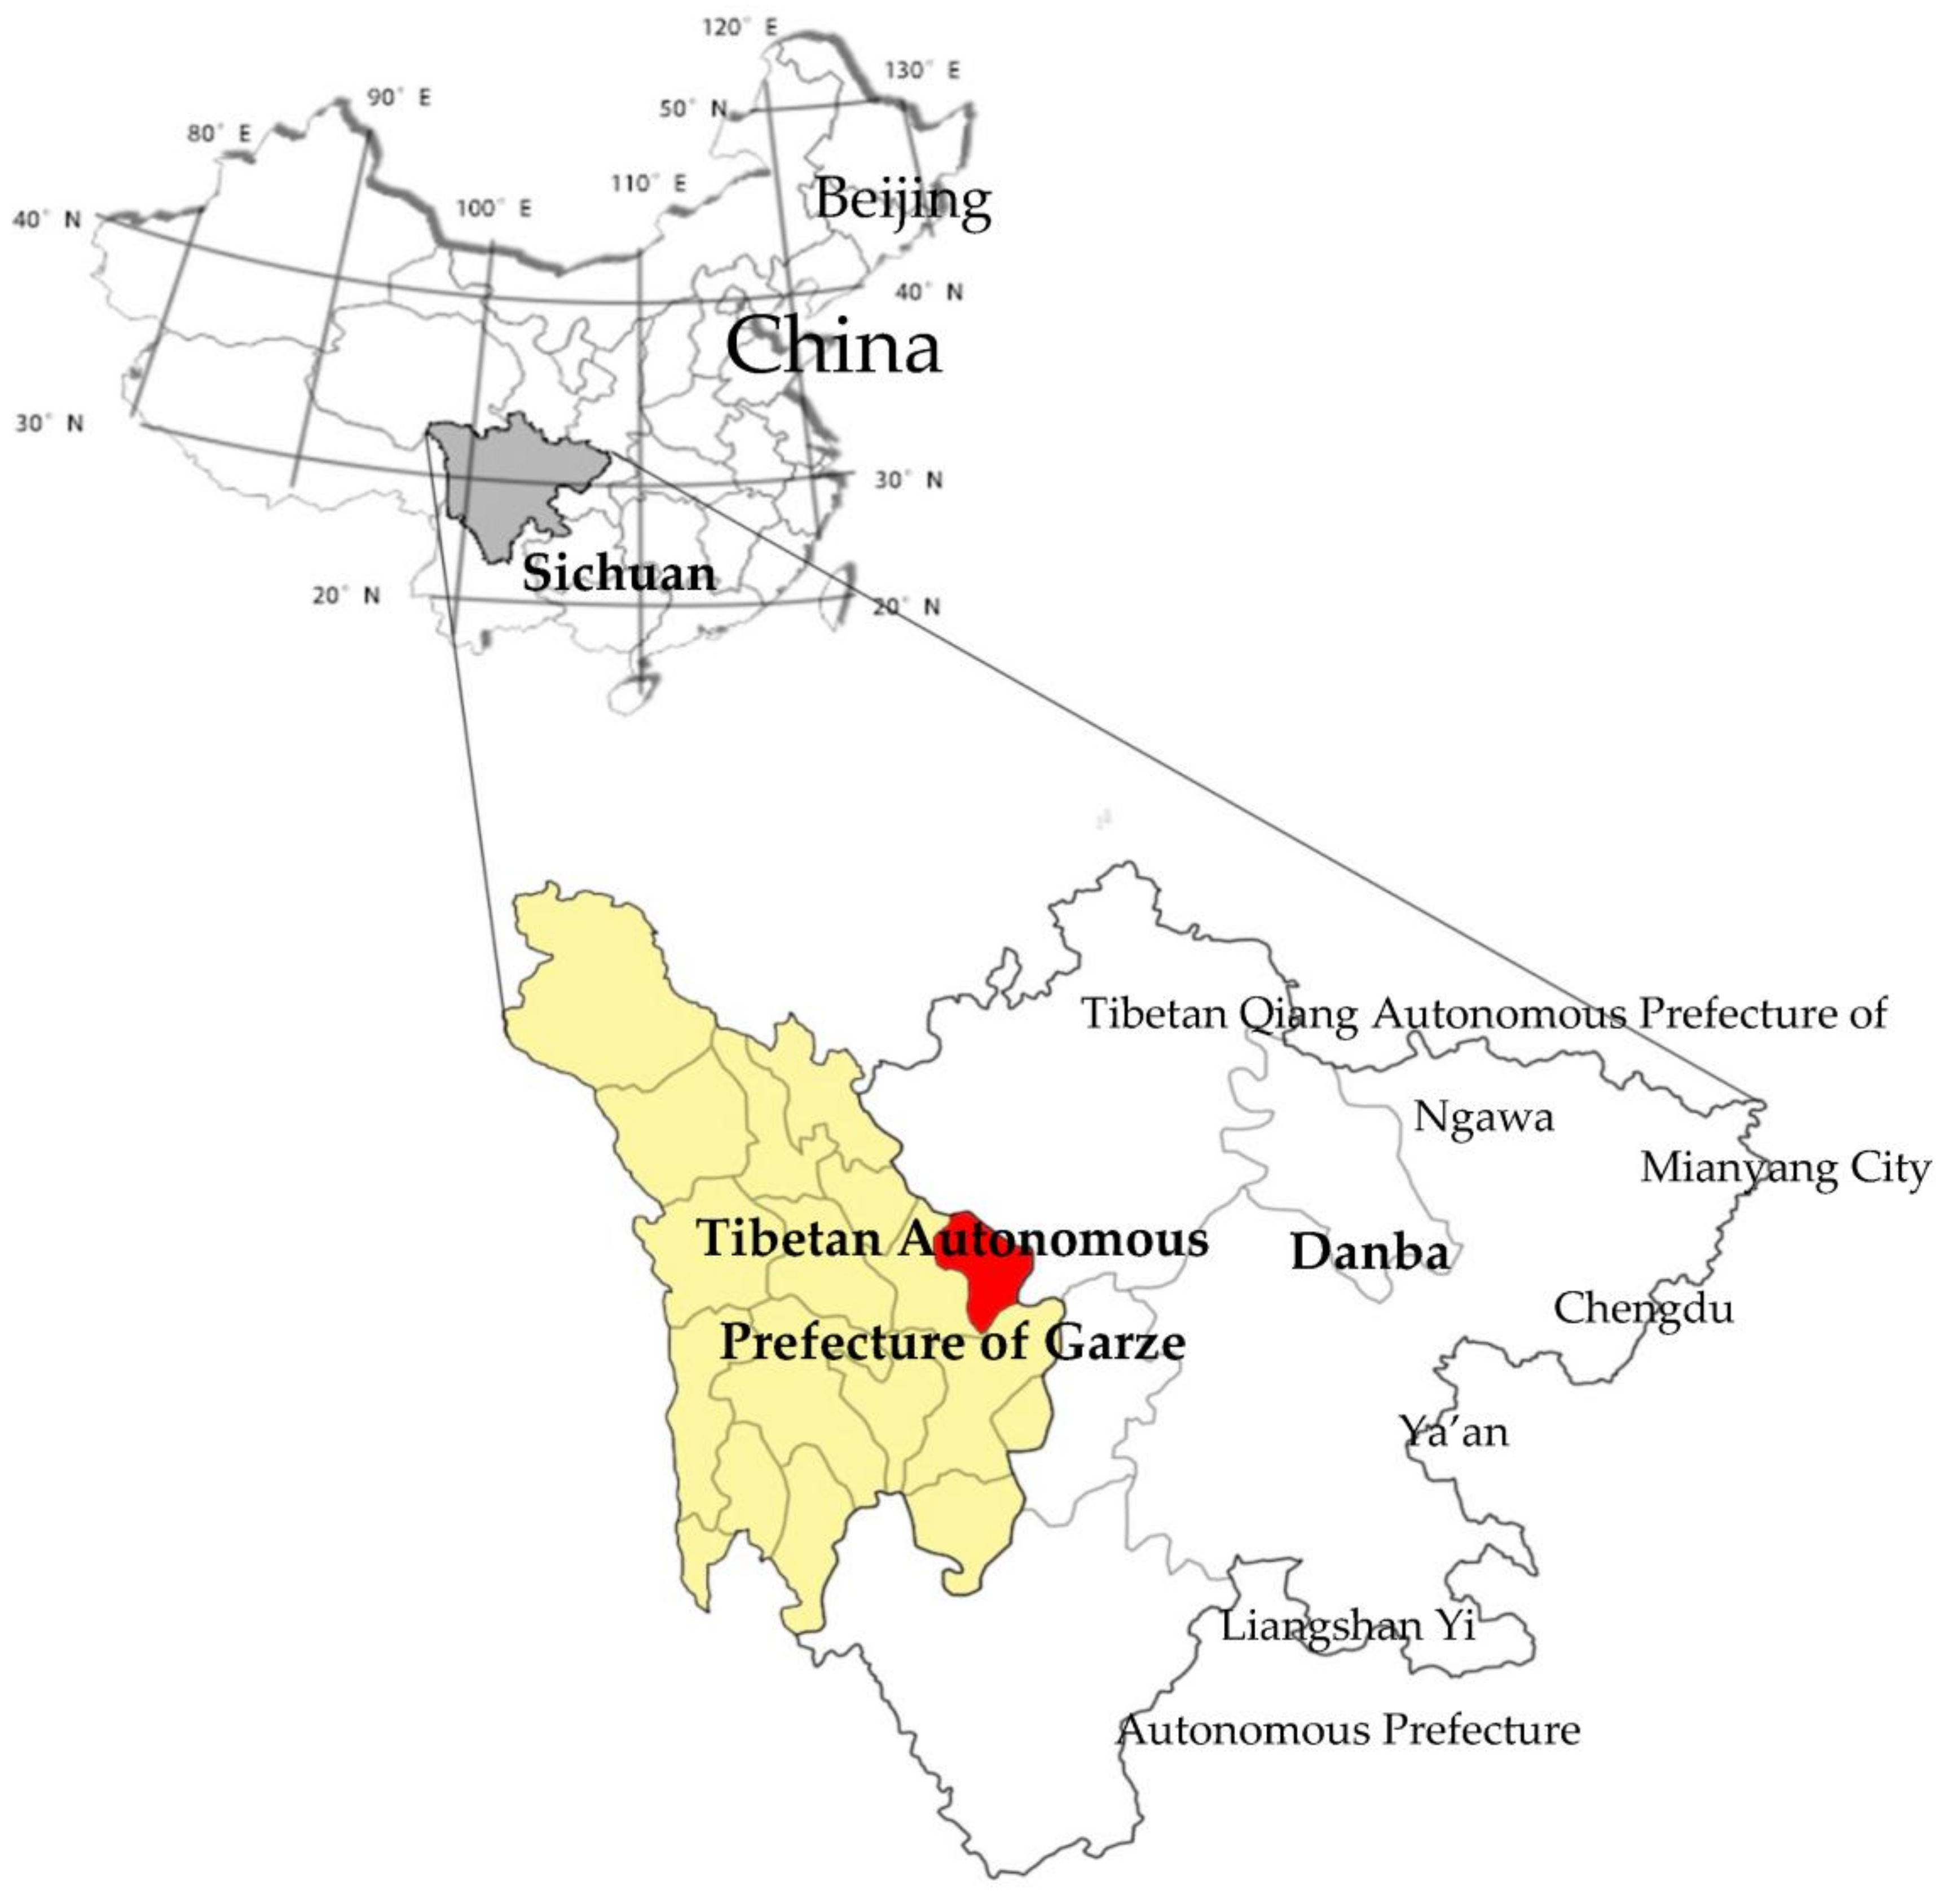
2. Background Information

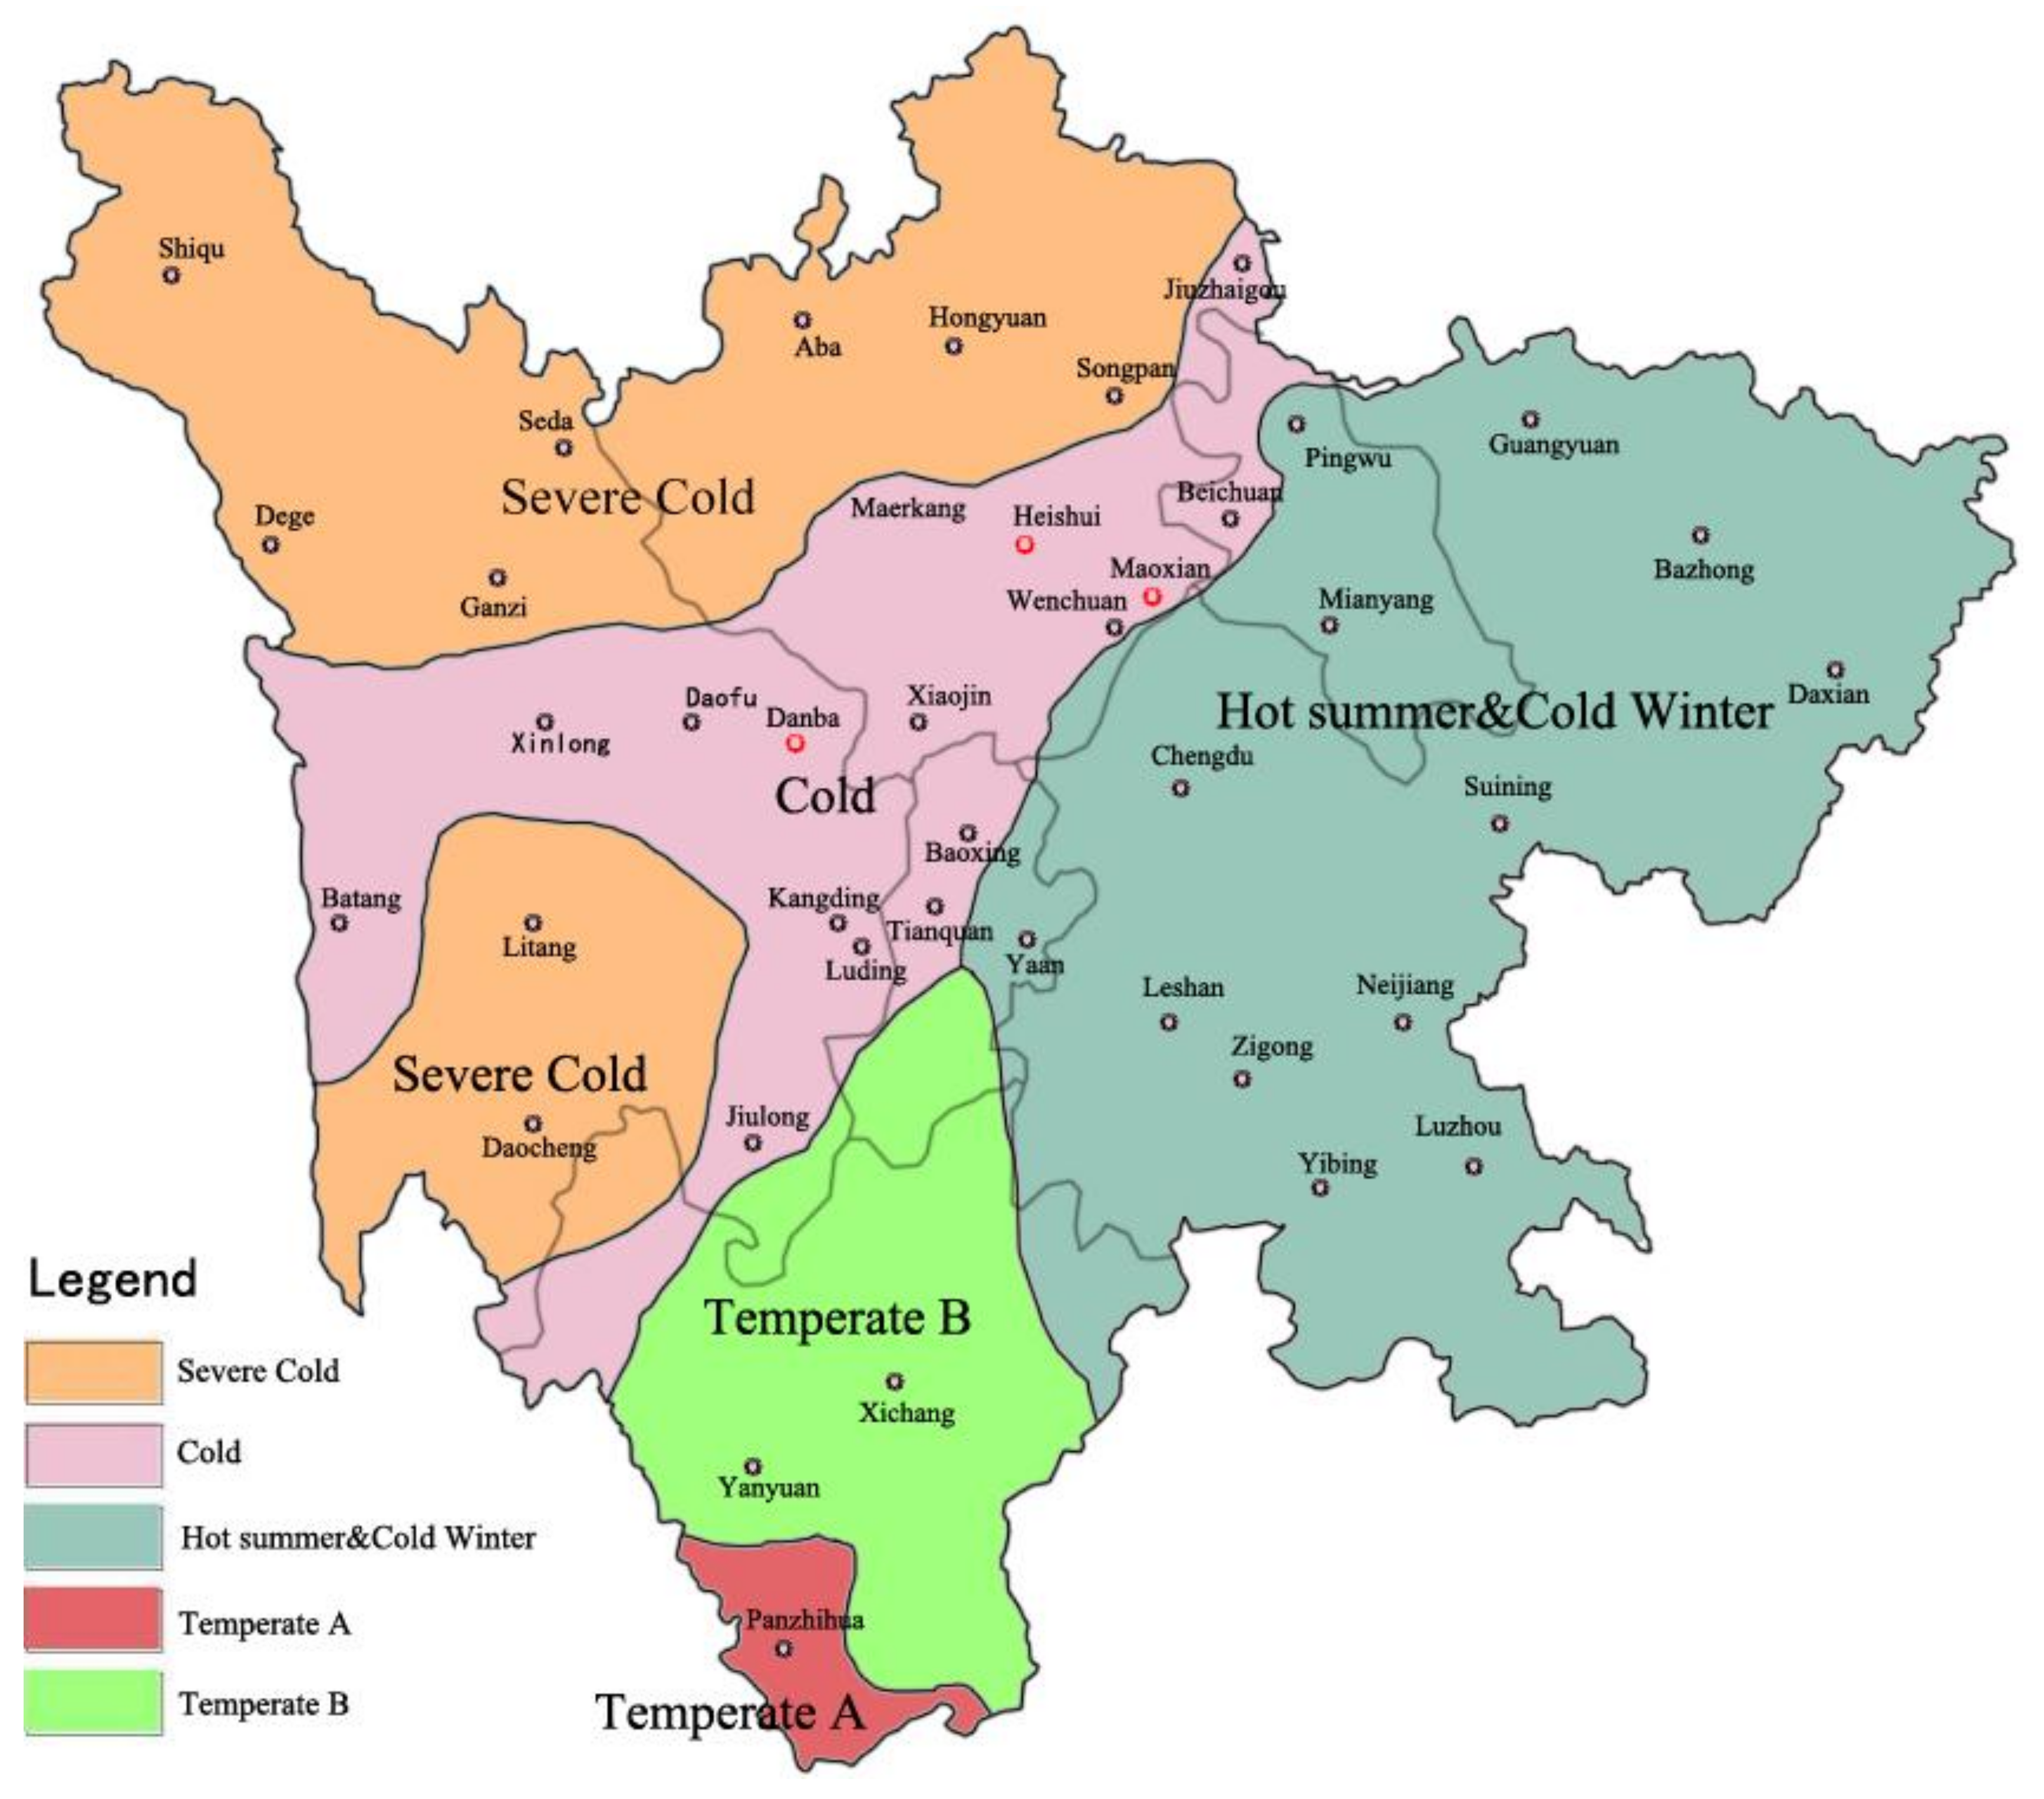
2.1. Climate Characteristics
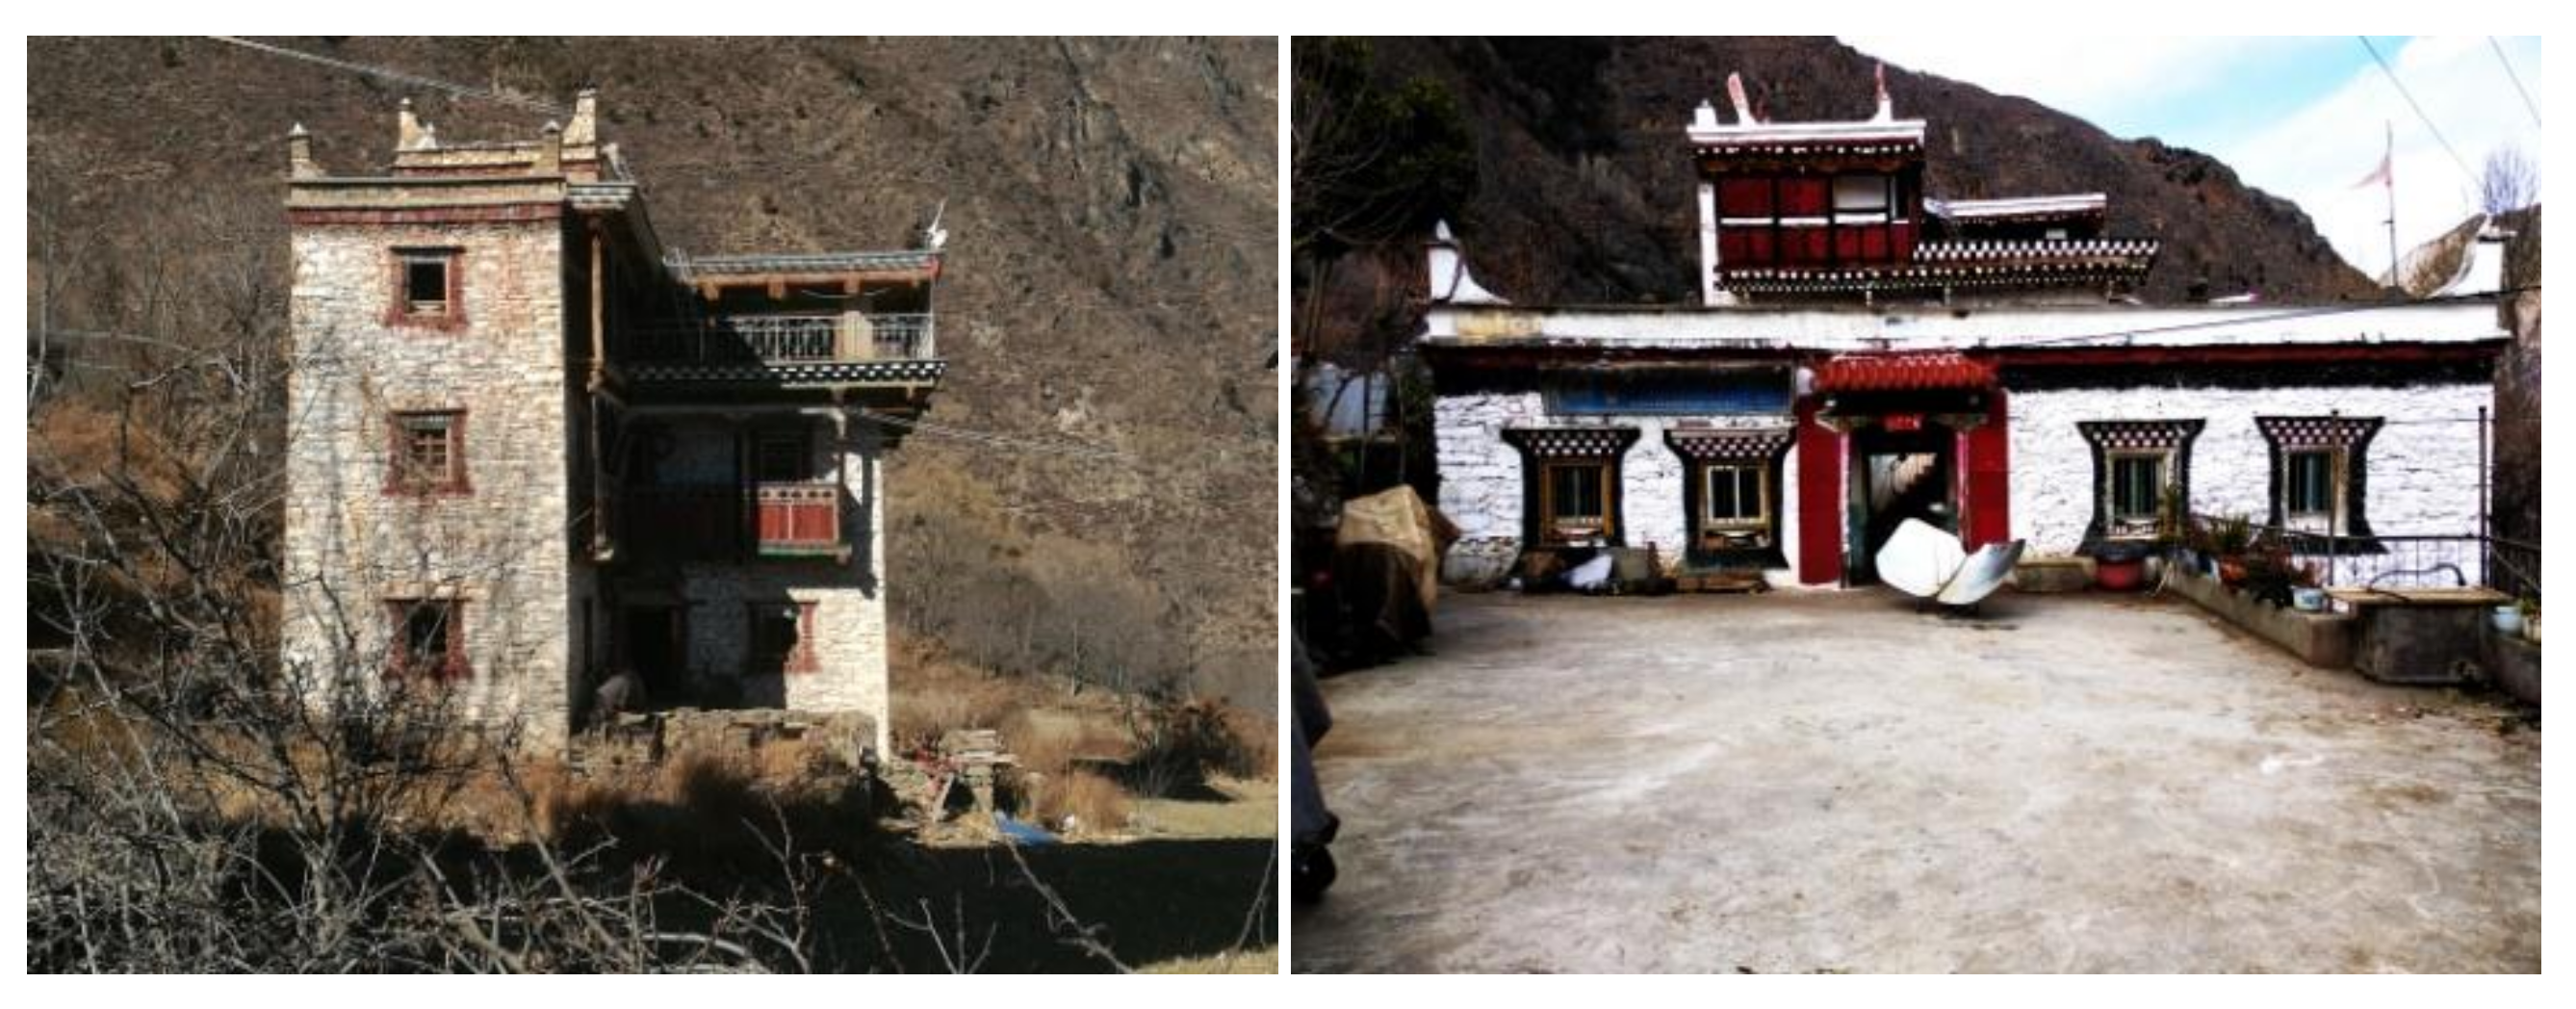
The Tibetan Plateau is known as “the roof of the world” with an average altitude of 4950 m above the sea, and its exposure to unobstructed freezing arctic air from the north. The air is severely dry for the majority of the year, with an average annual snowfall of only 46 cm. The studied buildings are located in a Tibetan village in Danba County of Sichuan Province, China. The location of Danba County is illustrated in Figure 1. The climate is characterised by a strong variation in the length of day during different seasons of the year.
Based on the Köppen climate classification, Sichuan Province is divided into five classes, from temperate to severely cold, all with different climate characteristics. However, cold rural areas of Sichuan include the central region of Garze, the southern part of Aba, and the northwest edge of Mianyang and Yaan (see Figure 2). Due to the high altitude, Tibetan villages in the cold rural area of Sichuan have higher solar radiation and lower annual average air temperature compared to the other cities in the same building climate zone. Table 1 shows the meteorological parameter of a typical county in the cold rural area of Sichuan. The average annual air temperature of these typical cities in the country is less than 15 °C. In the hottest month, the highest average temperature is below 25 °C. The average sunshine duration is more than 1800 h per year, which shows rich solar energy availability in these areas.

2.2. Buildings

The studied stone dwellings are typically three to five storeys high. External walls are constructed from shale stone or rammed earth, with load-bearing walls measuring 60 cm in thickness. Partition walls are also composed of shale Stone. Floors are covered by timber boards, while roofs are composed of stone and clay. The timber framed windows are single-glazed with an orientation towards the south. No particular patterns in the orientation of the buildings were identified. However, to maximise solar gains, buildings are built on the sunny side of the mountain. No central heating systems are available for residents to keep their houses warm in winter. Typical Tibetan stone dwellings in Danba County are presented in Figure 3.

3. Methodology

The methodology for this study consisted of both subjective and objective evaluations. The subjective study was conducted by administering questionnaires to occupants of the studied buildings. The objective evaluations were performed by measuring indoor and outdoor environmental qualities. The studied period represents the typical winter climate in Danba County. Both subjective and objective evaluations were performed every 1-h from 8:00 a.m. and 9:00 p.m. for the period from 5 January through 10 January in 2018. Statistical techniques were used for data analysis.

3.1. Subjective Questionnaire

Subjective evaluations are one of the most important aspects of thermal comfort studies. The survey of this study aimed to investigate thermal comfort sensations, acceptability, and thermal preferences. The questionnaires were divided into two sections concerning: general demographic information, and occupant comfort sensation. The first section asked about participant basic demographic information: namely, age, gender, town of origin, clothing, and activity. ASHRAE Standard 55-1981 was used to calculate occupant clothing insulation (clo) and metabolic activity (met) [46]. The questions about comfort in the second section of the questionnaire asked participants about their real-time sensation regarding (1) temperature, (2) humidity, and (3) air velocity.
The thermal comfort sensation (TSV) question was designed based on the recommendation by the ASHRAE seven-point scale of thermal sensations (−3 cold, −2 cool, −1 slightly cool, 0 neutral, +1 slightly warm, +2 warm, +3 hot) [47]. Similarly, the other two sensation questions about humidity and air velocity were design based on ASHRAE 7-point scale answers. For humidity, participants were asked to vote as 0 for neutral feeling, +3 for very humid sensations, and −3 for very dry sensations. For air velocity, participants were asked to express their sensation about air movement by scoring 0 for neutral feeling, +3 for very still, and −3 for very breezy. More details of the scale point divisions for the three comfort sensation questions are presented in Table 2.

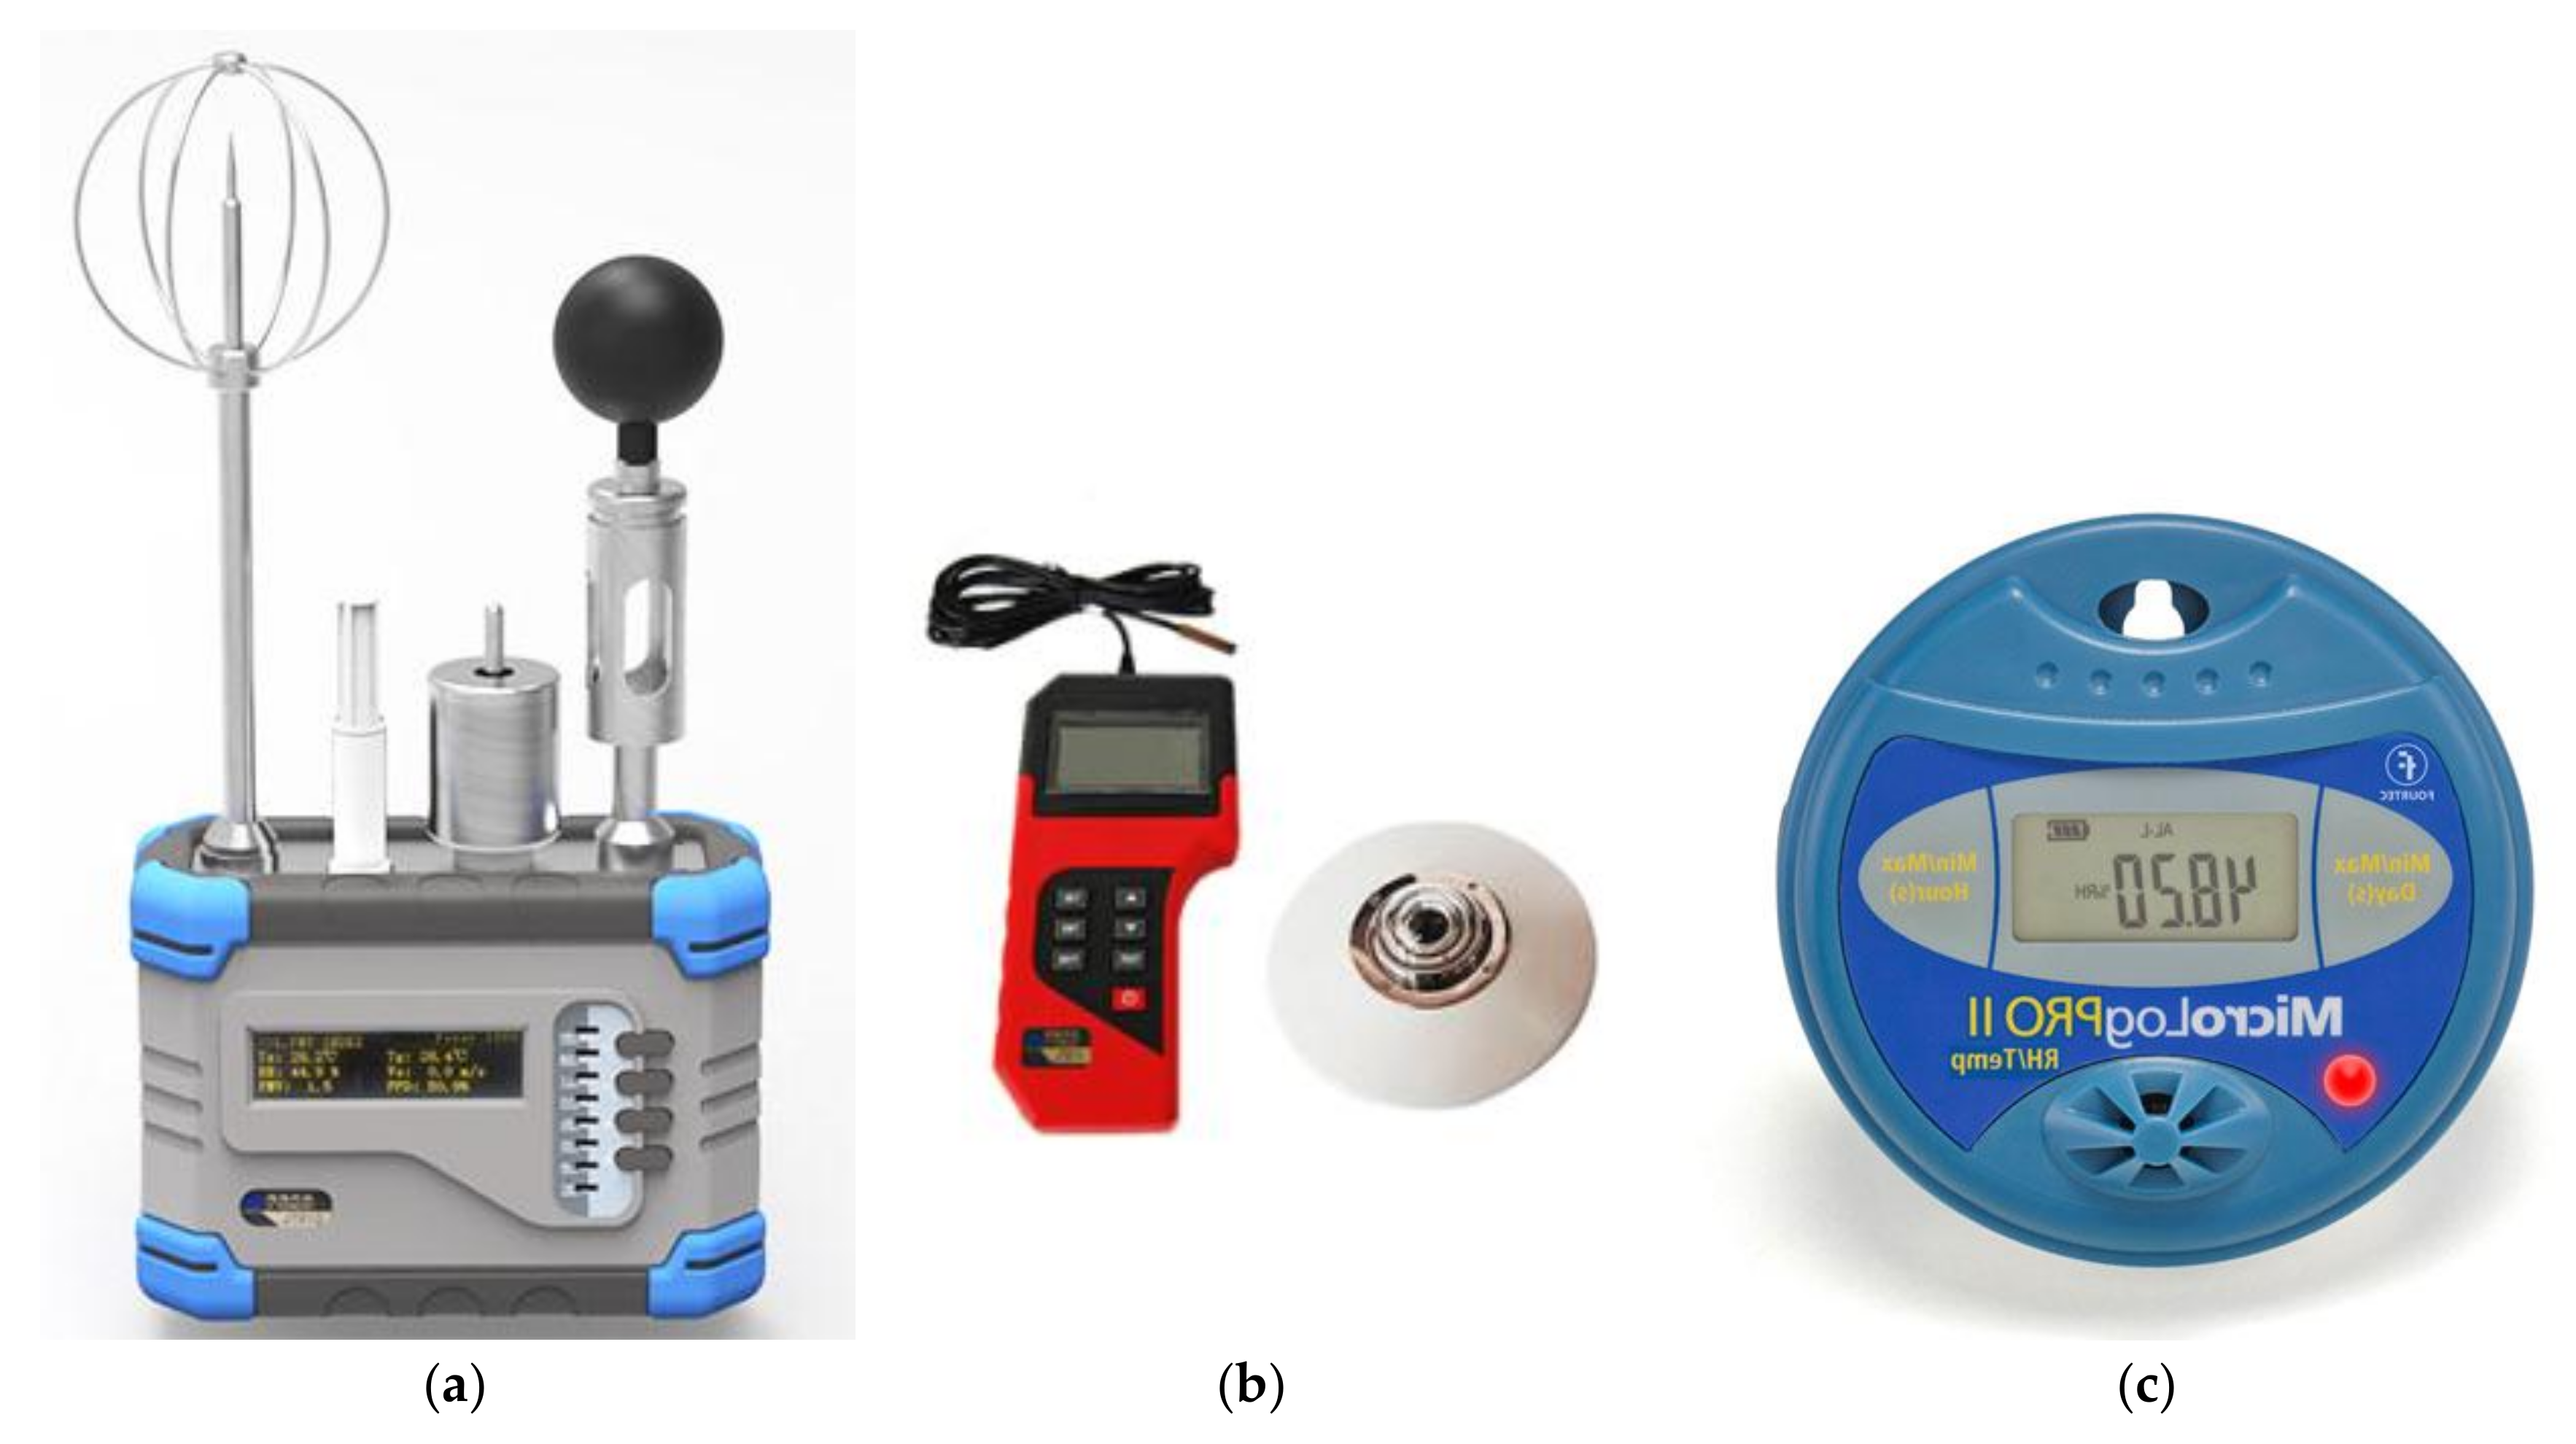
3.2. Environmental Parameter Measurements

Indoor thermal environment field surveys in this study were conducted in the stone dwellings of Danba County in a typical week in winter (from 01/05 to 01/10). The indoor thermal environment was analysed by measuring indoor and outdoor air temperature, globe temperature, humidity, and air velocity. Some information about the measuring equipment, valid range, and accuracy of the devices is summarized in Table 3. Research has shown that the accuracy of measurement tools can significantly influence thermal environment assessments [48]. The recommended accuracy levels by ISO 7726 are included in Table 3. The accuracy of the tools is according to the recommendations by ISO 7726 [28]. Figure 4 illustrates the picture of the instruments which were used in the measurement campaign. In total three measurement instruments were used for measuring air temperature, globe temperature, air velocity, and relative humidity. Air temperatures were measured by an air thermometer using JTR05. Globe temperatures and air velocity were measured using JTSOFI-IAQ with an embedded Globe thermometer and an anemometer. Relative humidity levels were measured with a hygrometer using a Micro Log.
For most of the subjects, the measuring instruments were positioned at 1.1 m above the floor for sitting positions, while for a few participants in standing positions, the measuring instruments were positioned at 1.6 m above the floor. In addition, outside air temperature was measured using the same measuring instruments.

3.3. Subjects

A total of 350 copies of a questionnaire were distributed in Danba County during winter, of which 327 were valid. The collected sample of survey participants included 138 male volunteers and 189 female volunteers. The age distribution of the participants ranged from 14 to 80 years of age. Most of the respondents were residents who had adapted to the living style and the local climate of the Danba County. The distribution of participant gender and age are presented in Table 4.

3.4. Thermal Comfort Model

3.4.1. PMV Index

PMV and PPD (predicted percentage of dissatisfied) assess thermal environments in air-conditioned buildings. The PMV index predicts comfort sensations on the ASHRAE’s 7-point scale, while the PPD predicts the percentage of dissatisfaction about thermal environments. The PMV index is calculated with the following Equation [50]:
PMV = (0.303 e−2100∗M + 0.028) ∗ ((MW) − HEcCresEres),
where M is the metabolic rate, in Watt per square meter (W/m2); W is the effective mechanical power, in Watt per square meter (W/m2); H is the sensitive heat losses; Ec—the heat exchange by evaporation on the skin; Cres—heat exchange by convection in breathing; Eres—the evaporative heat exchange in breathing. In Equation (1), the terms H, Ec, Cres, and Hres, correspond to the heat exchange between human body and surrounding environments.
As research indicates, there are two ways to calculate PMV values: tables and computer software tools [51]. In this study, particular, for the calculation of PMV index, ASHRAE Thermal Comfort Tool [52] was used, which determines PMV values based on ASHRAE-55 Standards. The input values for ASHRAE Thermal Comfort Tool include factors such as air temperature, mean radiant temperature, air speed, humidity, metabolic rate, and clothing level.

3.4.2. Operative Temperature

Binned indoor operative temperatures were determined for every 1°C, and were used to establish linear regression models and to determine the relationship between thermal comfort sensations and indoor temperatures. Regression coefficients and R square values were calculated and used to assess the power of linear regression equations. A confidence level of 95% was adopted in the statistical analysis in this paper to examine the strength of regression models. The calculation method of operative and the aPMV model is described in the following sections in more detail.
The indoor operating temperature (Top) is calculated based on the average value of indoor air temperature (Ta) and indoor mean radiation temperature (Tr) assuming that occupant metabolic rates are between 1.0 met and 1.3 met, and air velocities are less than 0.20 m/s [53]. Investigation of the survey results showed that the indoor environmental conditions in the studied dwellings are suitable for calculating indoor operative temperatures with the above assumptions. Therefore, the indoor operative temperatures is determined using the following equation [54]:
Top = (Ta + Tr)/2,
where Top is indoor operative temperature, Ta is indoor mean air temperature, and Tr is indoor mean radiant temperature.

3.4.3. Adaptive Predicted Mean Votes (aPMV)

The PMV model of prediction of thermal sensations has been widely used in the past for the evaluation of thermal comfort conditions in buildings [55]. However, some discrepancies between PMV and actual mean votes (AMV) were observed in recent studies [56]. In fact, occupants tend to tolerate a broader temperature range than the range predicted by PMV models [57]. Accordingly, aPMV models based on black box methods have been developed by Yao et al. [8] to examine the relationship of PMV and AMV models in real environments considering occupant psychological and behavioural adaptations. The aPMV model is calculated as follows [8]:
aPMV = PMV 1 + λ PMV ,
where λ   is the adaptive coefficient that can be determined by actual field measurements affected by several factors, such as climate and culture. The Equation (3) can be called as the Adaptive Predicted Mean Vote model or aPMV model.
Research has shown that the body adapts to the local climate and environment [20]. The adaptation level can be measured by the adaptive coefficient λ obtained from Equation (3). The “ λ ” is the “adaptive coefficient” which was defined by Yao et al. [8]. In order to determine the λ , Equation (3) was rewritten as the following:
λ = y x ,
where x = 1 PMV ; and y = 1 aPMV , in which x and y represent individual samples in the dataset (xi and yi). This indicates that the λ can be determined by least square methods using the following equation:
= i = 1 n   [ y i f ( x i ) ] 2 = i = 1 n   [ y i ( x i + λ ) ] 2 = minimum
where yi = f(xi); xi and yi represent ith data sample. In order to solve the above equation, the following equation could be used instead [54]:
Q a = 2 ( y i x i λ ) = 0 ,
Therefore
λ = i = 1 n [ y i x i ] n ,

4. Results and Discussion

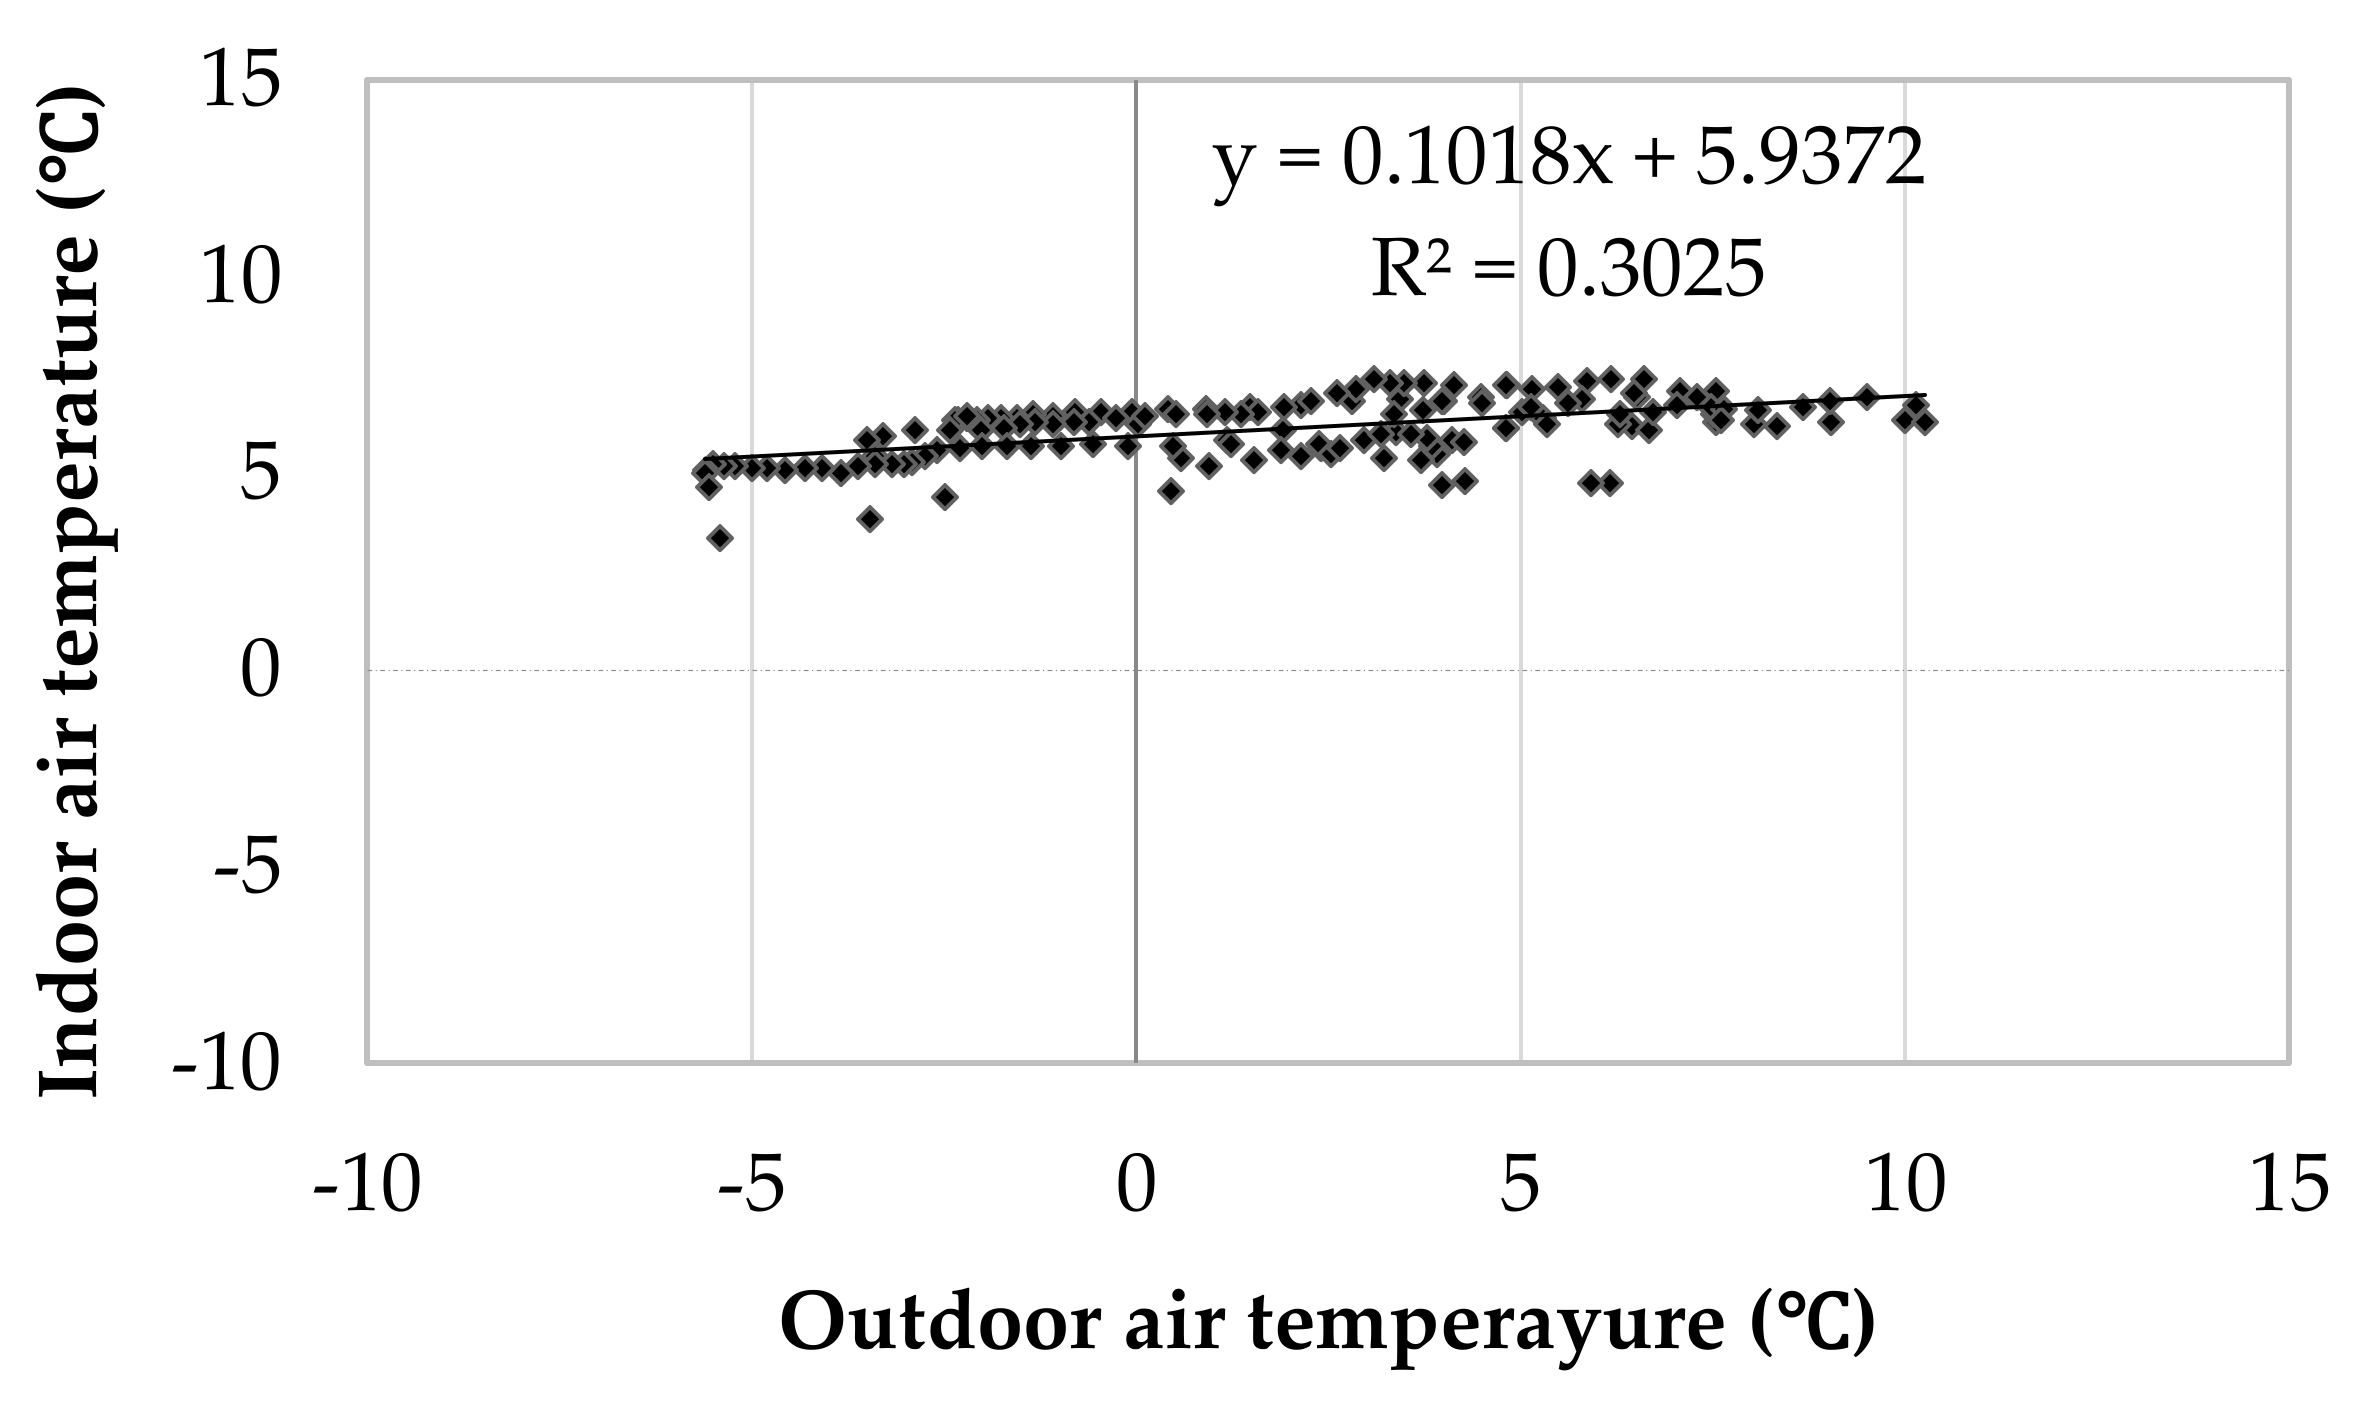
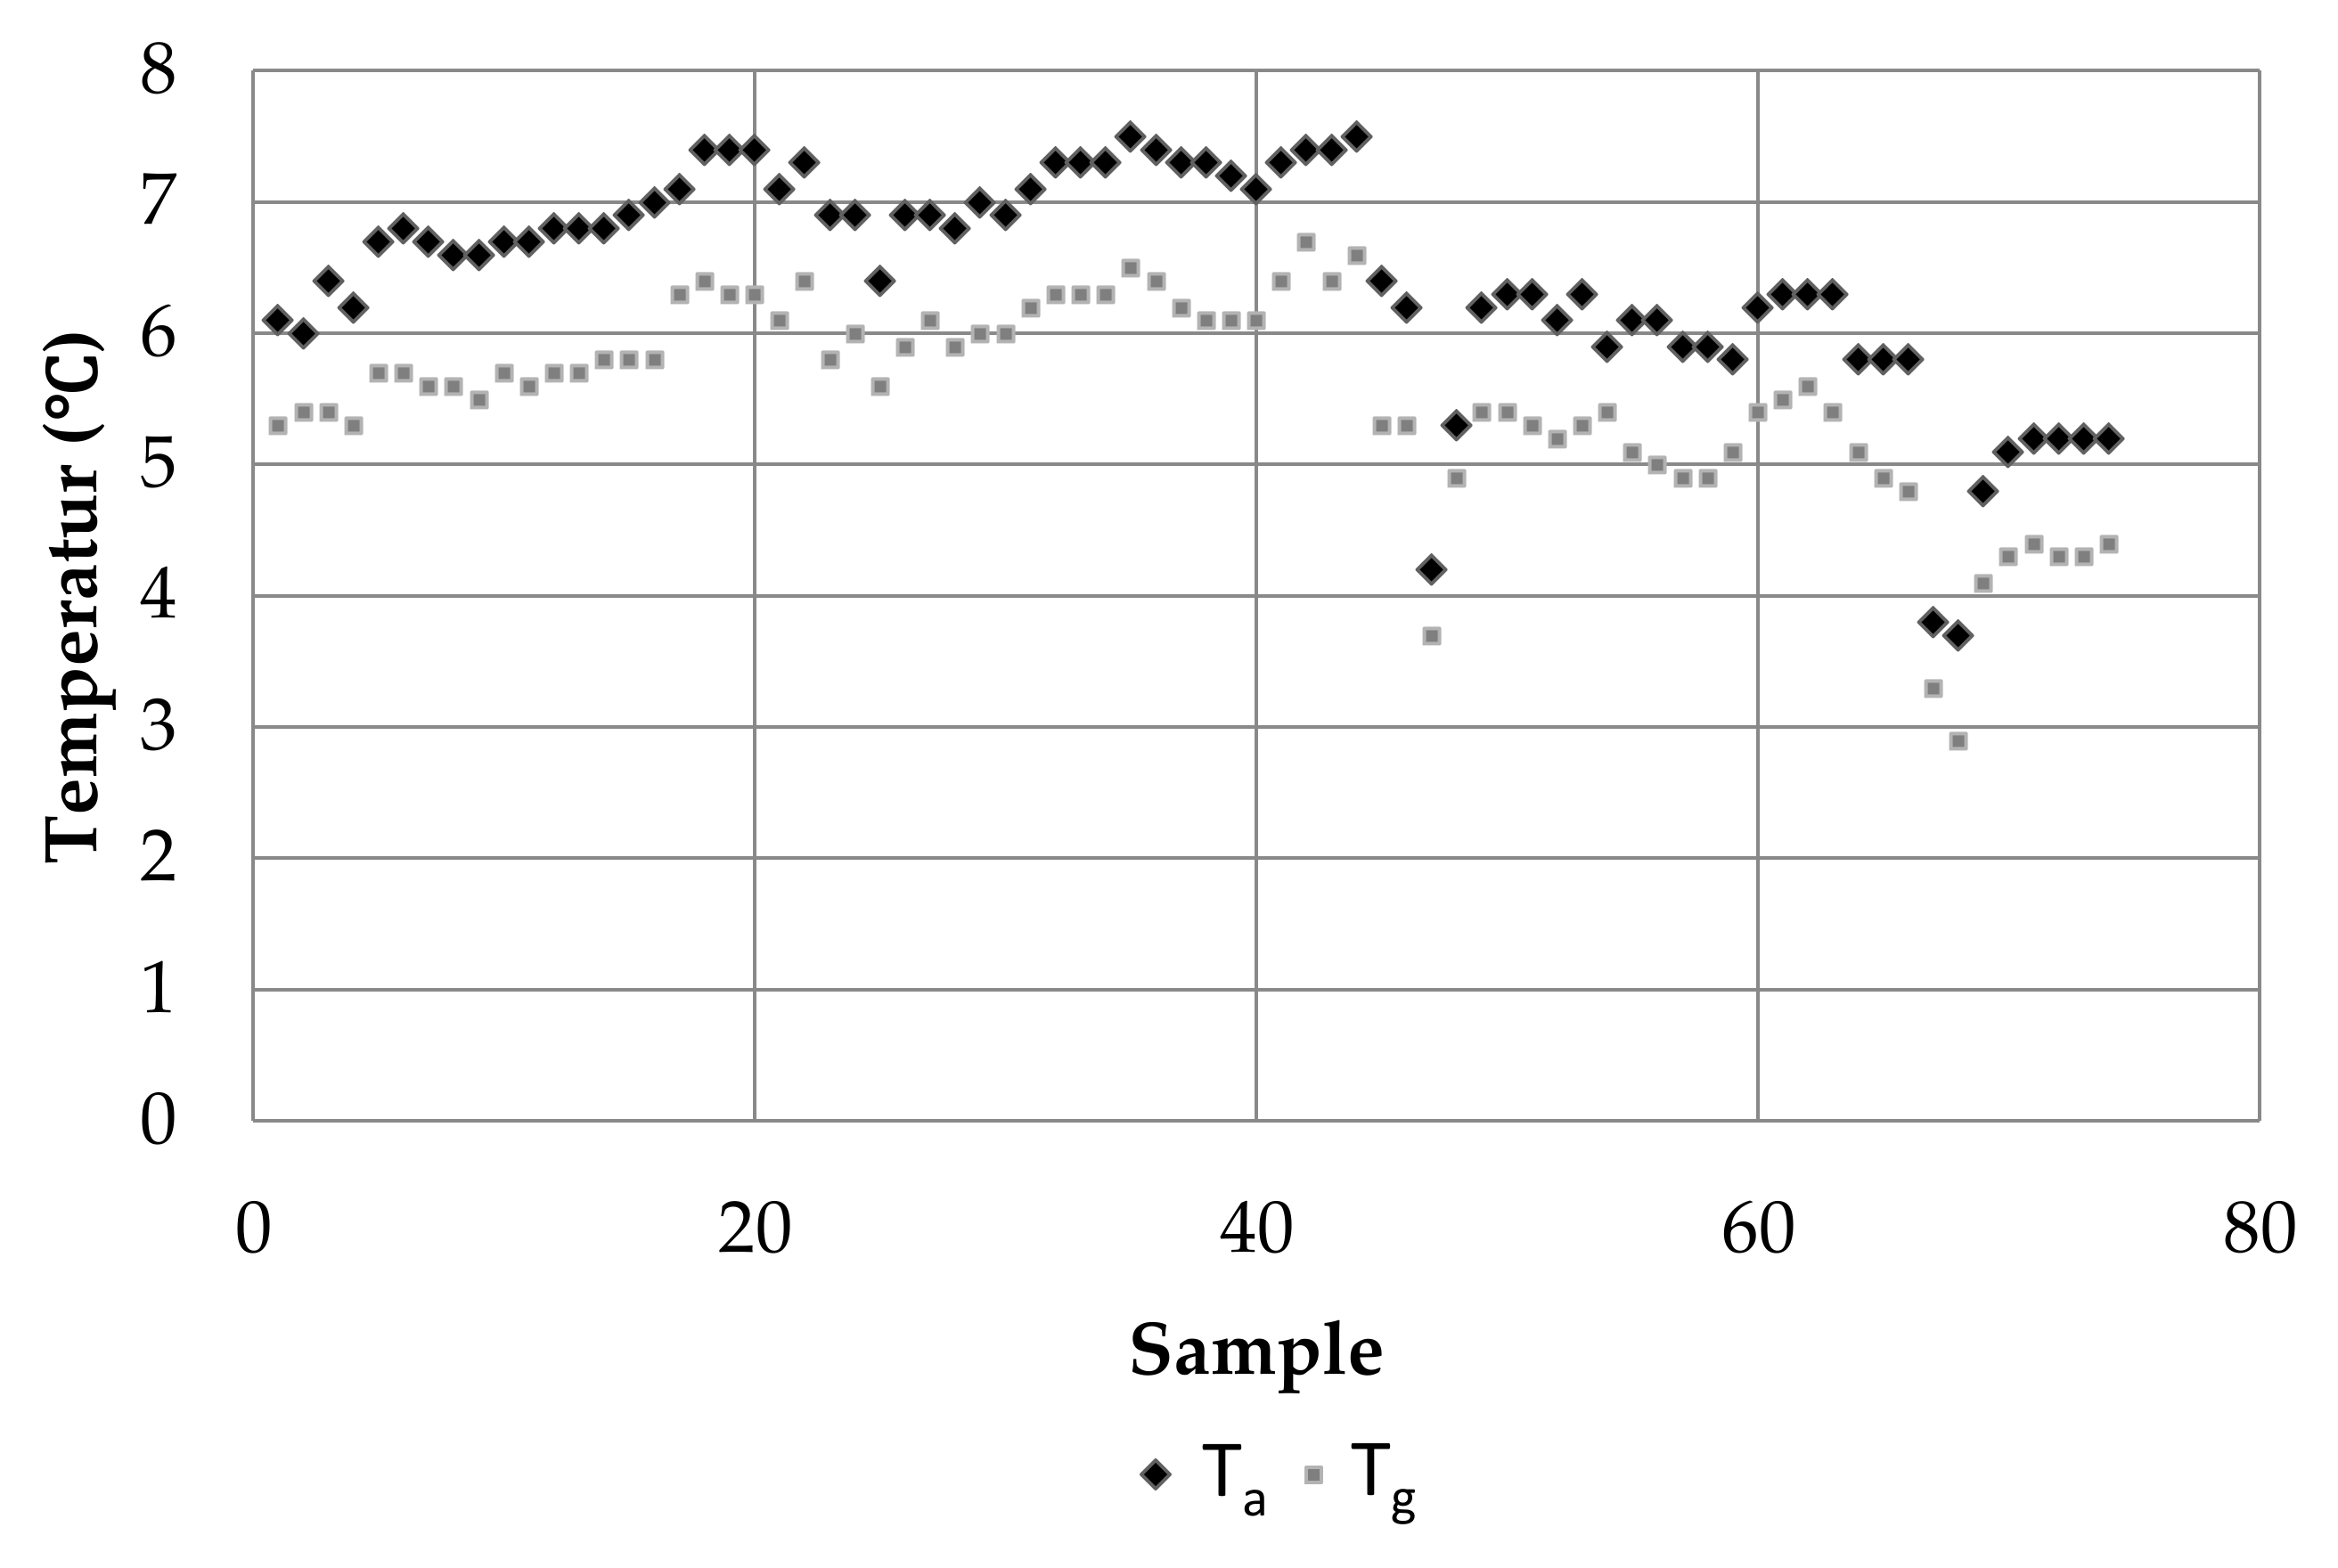
4.1. Annual Indoor Environmental Parameters

The relationship between the globe temperature (Tg) and air temperature (Ta) is presented in Figure 5. Air temperature is higher than the globe temperature for the studied period in winter. The average value of the difference between the globe temperature and air temperature is 0.95 °C, which can be explained by small window sizes and low lighting levels. Moreover, temperature ranges were less than 4 °C for both Tg and Ta. As mentioned in Section 3.4.1, the operative temperature is used instead of Tg and Ta in this study.
The outdoor air temperature ranged between −5.61 and 10.26 °C, and the indoor air temperature between 3.3 and 7.4 °C during the studied period in January. The relationship between the indoor and outdoor air temperatures is plotted in Figure 6. The trend-line of the outdoor and indoor temperature plot is shown in the Figure. The intercept of the equation is 5.93, which indicates that indoor air temperatures are almost 5.93 °C higher than the outdoor air temperatures. This is because the building envelope plays the principal role in preventing the heat escape from the building through building skin.
The distribution of binned Ta is presented in Figure 7. From the figure, it can be observed that the frequency of the temperature between 6 and 7 °C is about 52%. Temperatures under 4 °C are only 1.3%. The distribution of the frequency of relative humidity (RH) is presented in Figure 8. As can be seen from the figure, the most frequent RH ranges were 47% to 55% with the value of 84% of the studied period.

4.2. Adaptive Behaviours

The investigation of the adaptive behaviour question from the survey results revealed that Tibetan residents have a unique traditional lifestyle that adapts to their thermal environments. In the studied period, wearing more clothes, drinking hot high-calorie teas, and using a brazier were the most common adaptive behaviours that participants reported as their adaptive behaviours in winter (see Figure 9).
Particularly, drinking milk or buttered tea as high-calorie drinks, helps Tibetan residents not only to restore energy needs for the demanding Tibetan lifestyle but it also keeps them warm on cold winter days. The other popular adaptive behaviour was adjusting and adding clothing layers to minimise heat loss through an increased thermal resistance of clothing. Based on the survey results of adaptive behaviours, the most popular adaptive measure was adjusting clothing. The traditional Han clothing of warm jacket and cotton-padded shoes are popular outfits worn by Tibetan residents. Blocking house windows against cold air infiltration was the third most popular adaptive behaviour. Another observed adaptive measure in the stone dwellings was activity. Residents tended to increase their metabolism rate by increasing their activities. A linear correlation between clothing insulations and indoor temperature in winter is presented in Figure 10.
It was observed that clothing insulation levels were inversely proportional to the indoor air temperatures. When the indoor temperature was lower than 5 °C, there was a less significant linear relationship between clothing insulations and indoor air temperatures. When the indoor air temperature ranged between 5 and 7 °C, the fluctuation of clothing levels was more significant within the range between 2.0 clo to 2.2 clo.

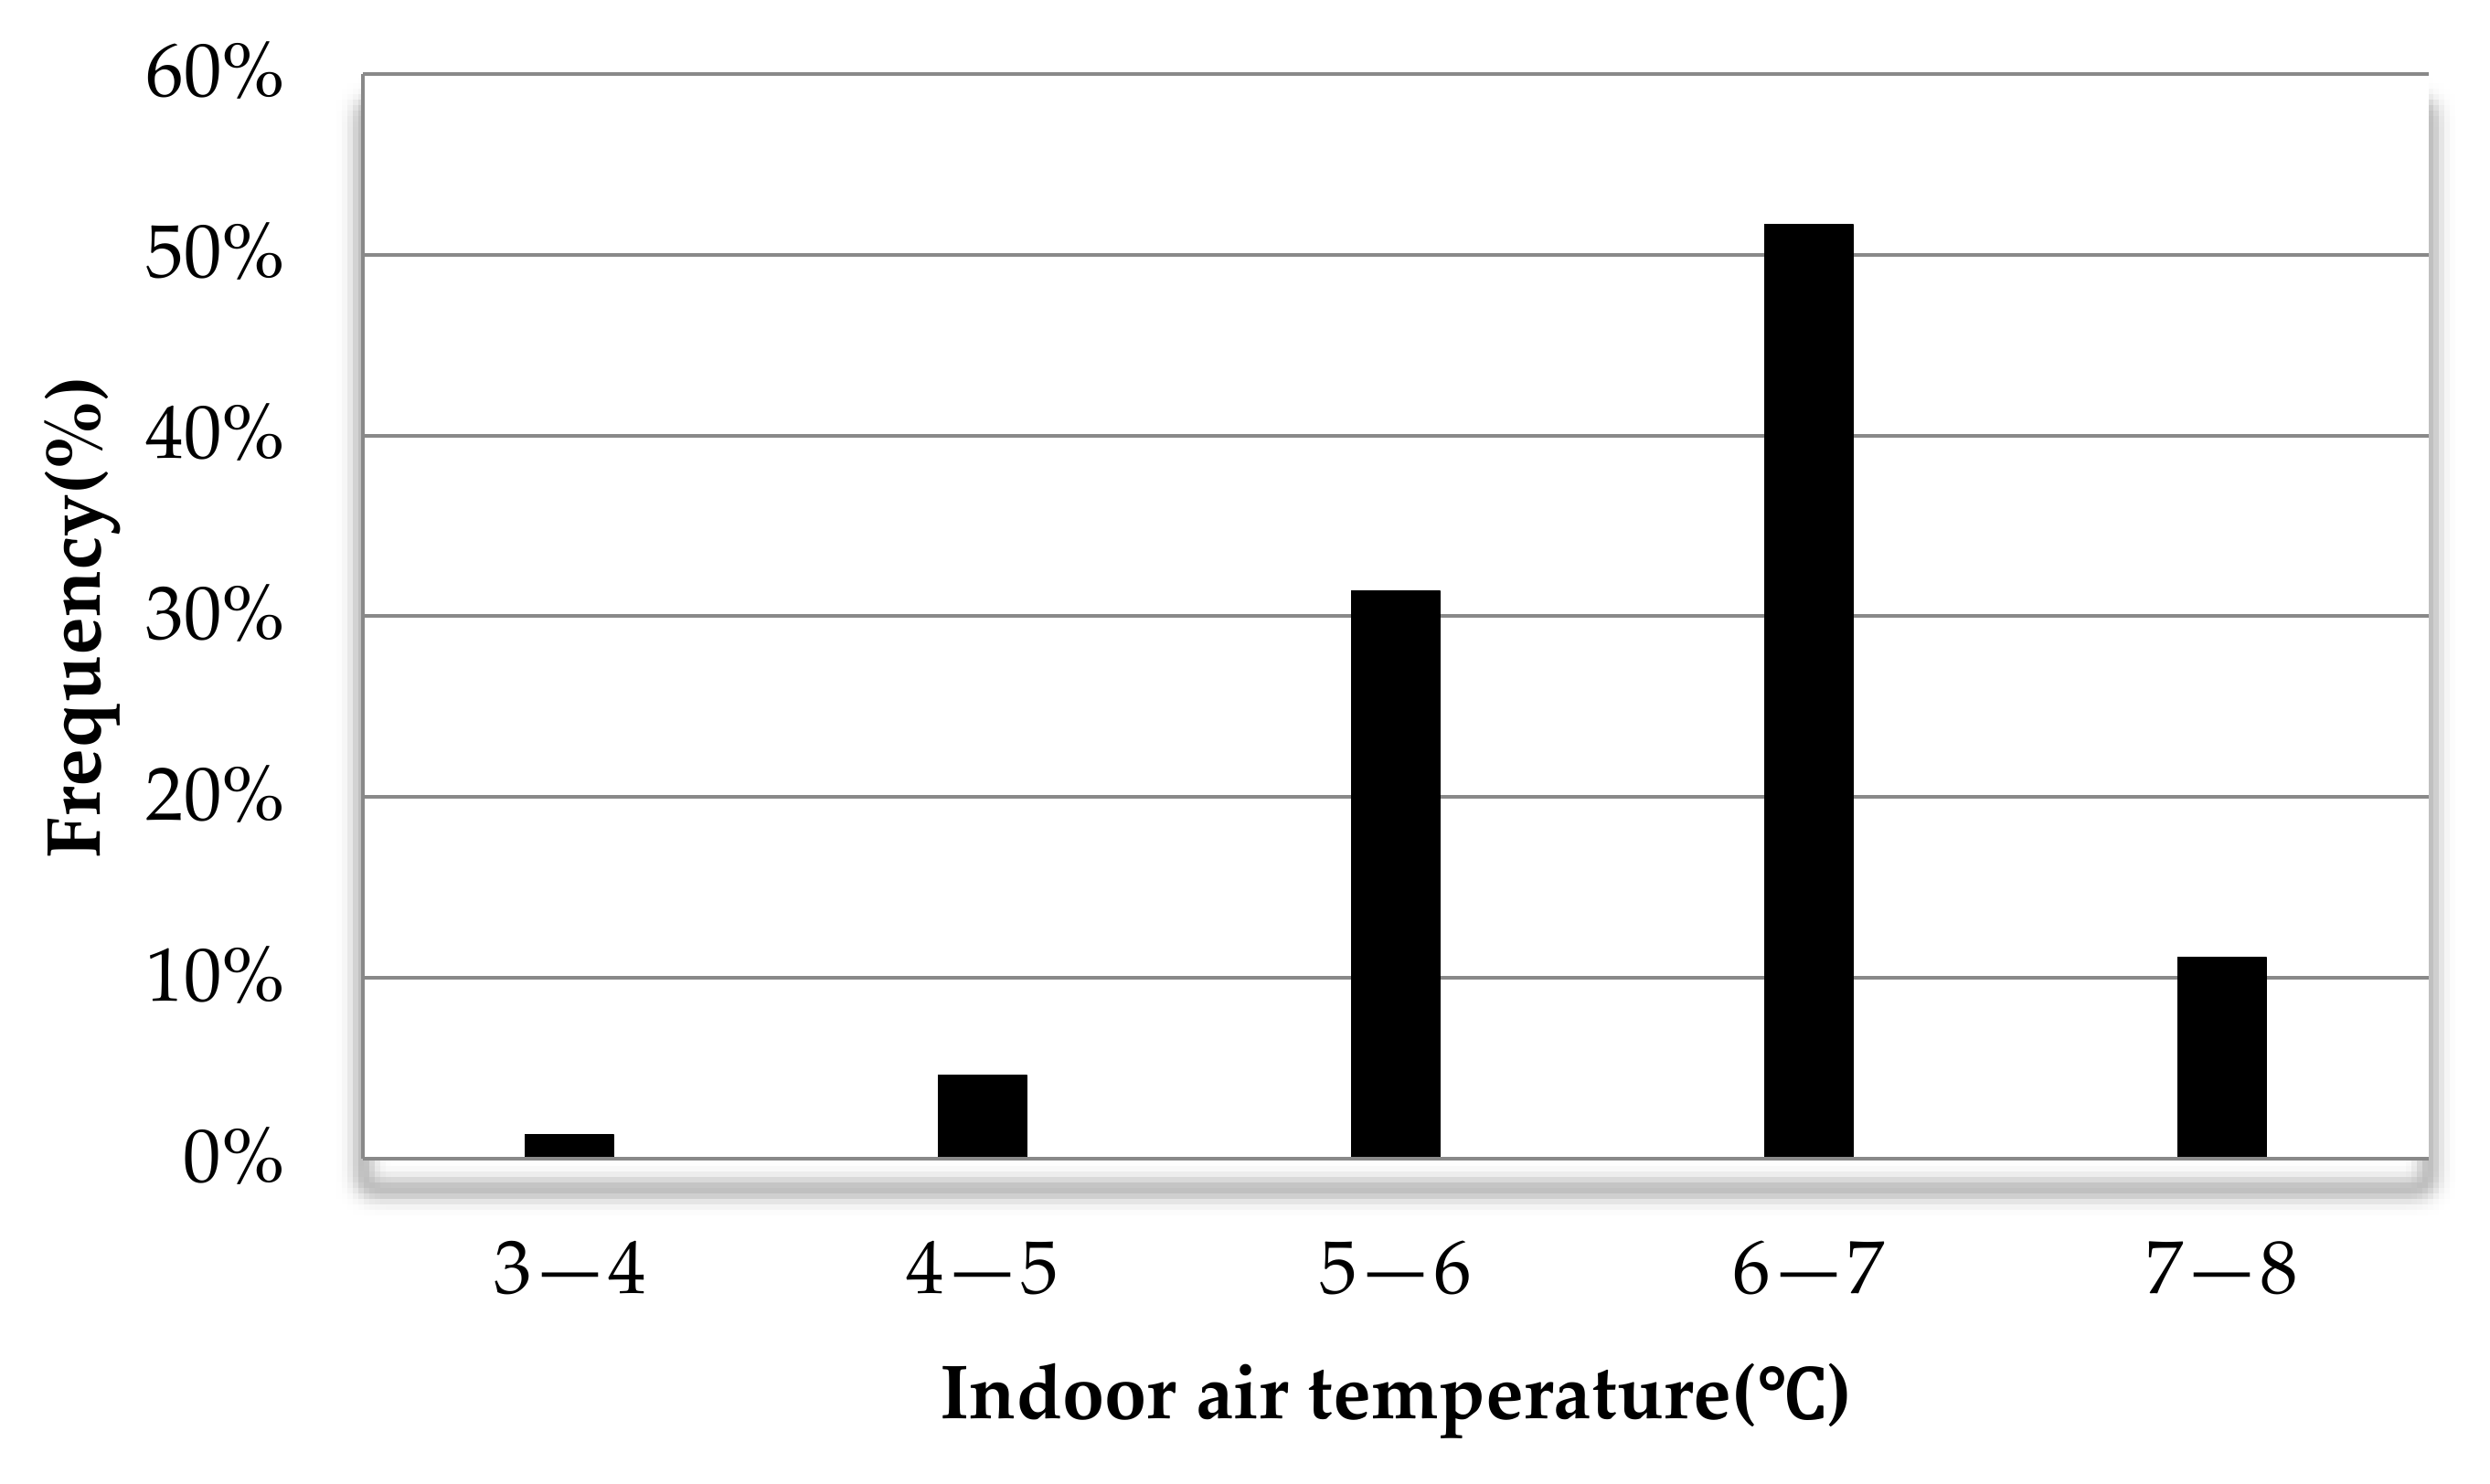
4.3. Indoor Thermal Environment

The thermal sensation votes (TSV), humid sensation votes (HSV), and draft sensation votes (DSV) are shown in Figure 11. The percentage of votes for “neutral” and “slightly cooler” was 76%. The votes for “neutral” accounted for 29% (TSV = 0) and the votes for “slightly cool” accounted for 47% (TSV = −1). The proportion of people who experienced an acceptable humid sensation (HSV = −1, 0 or 1) was 91.01%, while the majority of participants (74%) felt slightly dry (HSV = −1). The percentage of people who experienced an acceptable draft sensation accounted for 93% (−1 to 1), and among those 64% felt neutral (DSV = 0). As a result, the indoor temperature scored only slightly cool and the air slightly dry in typical winter days.

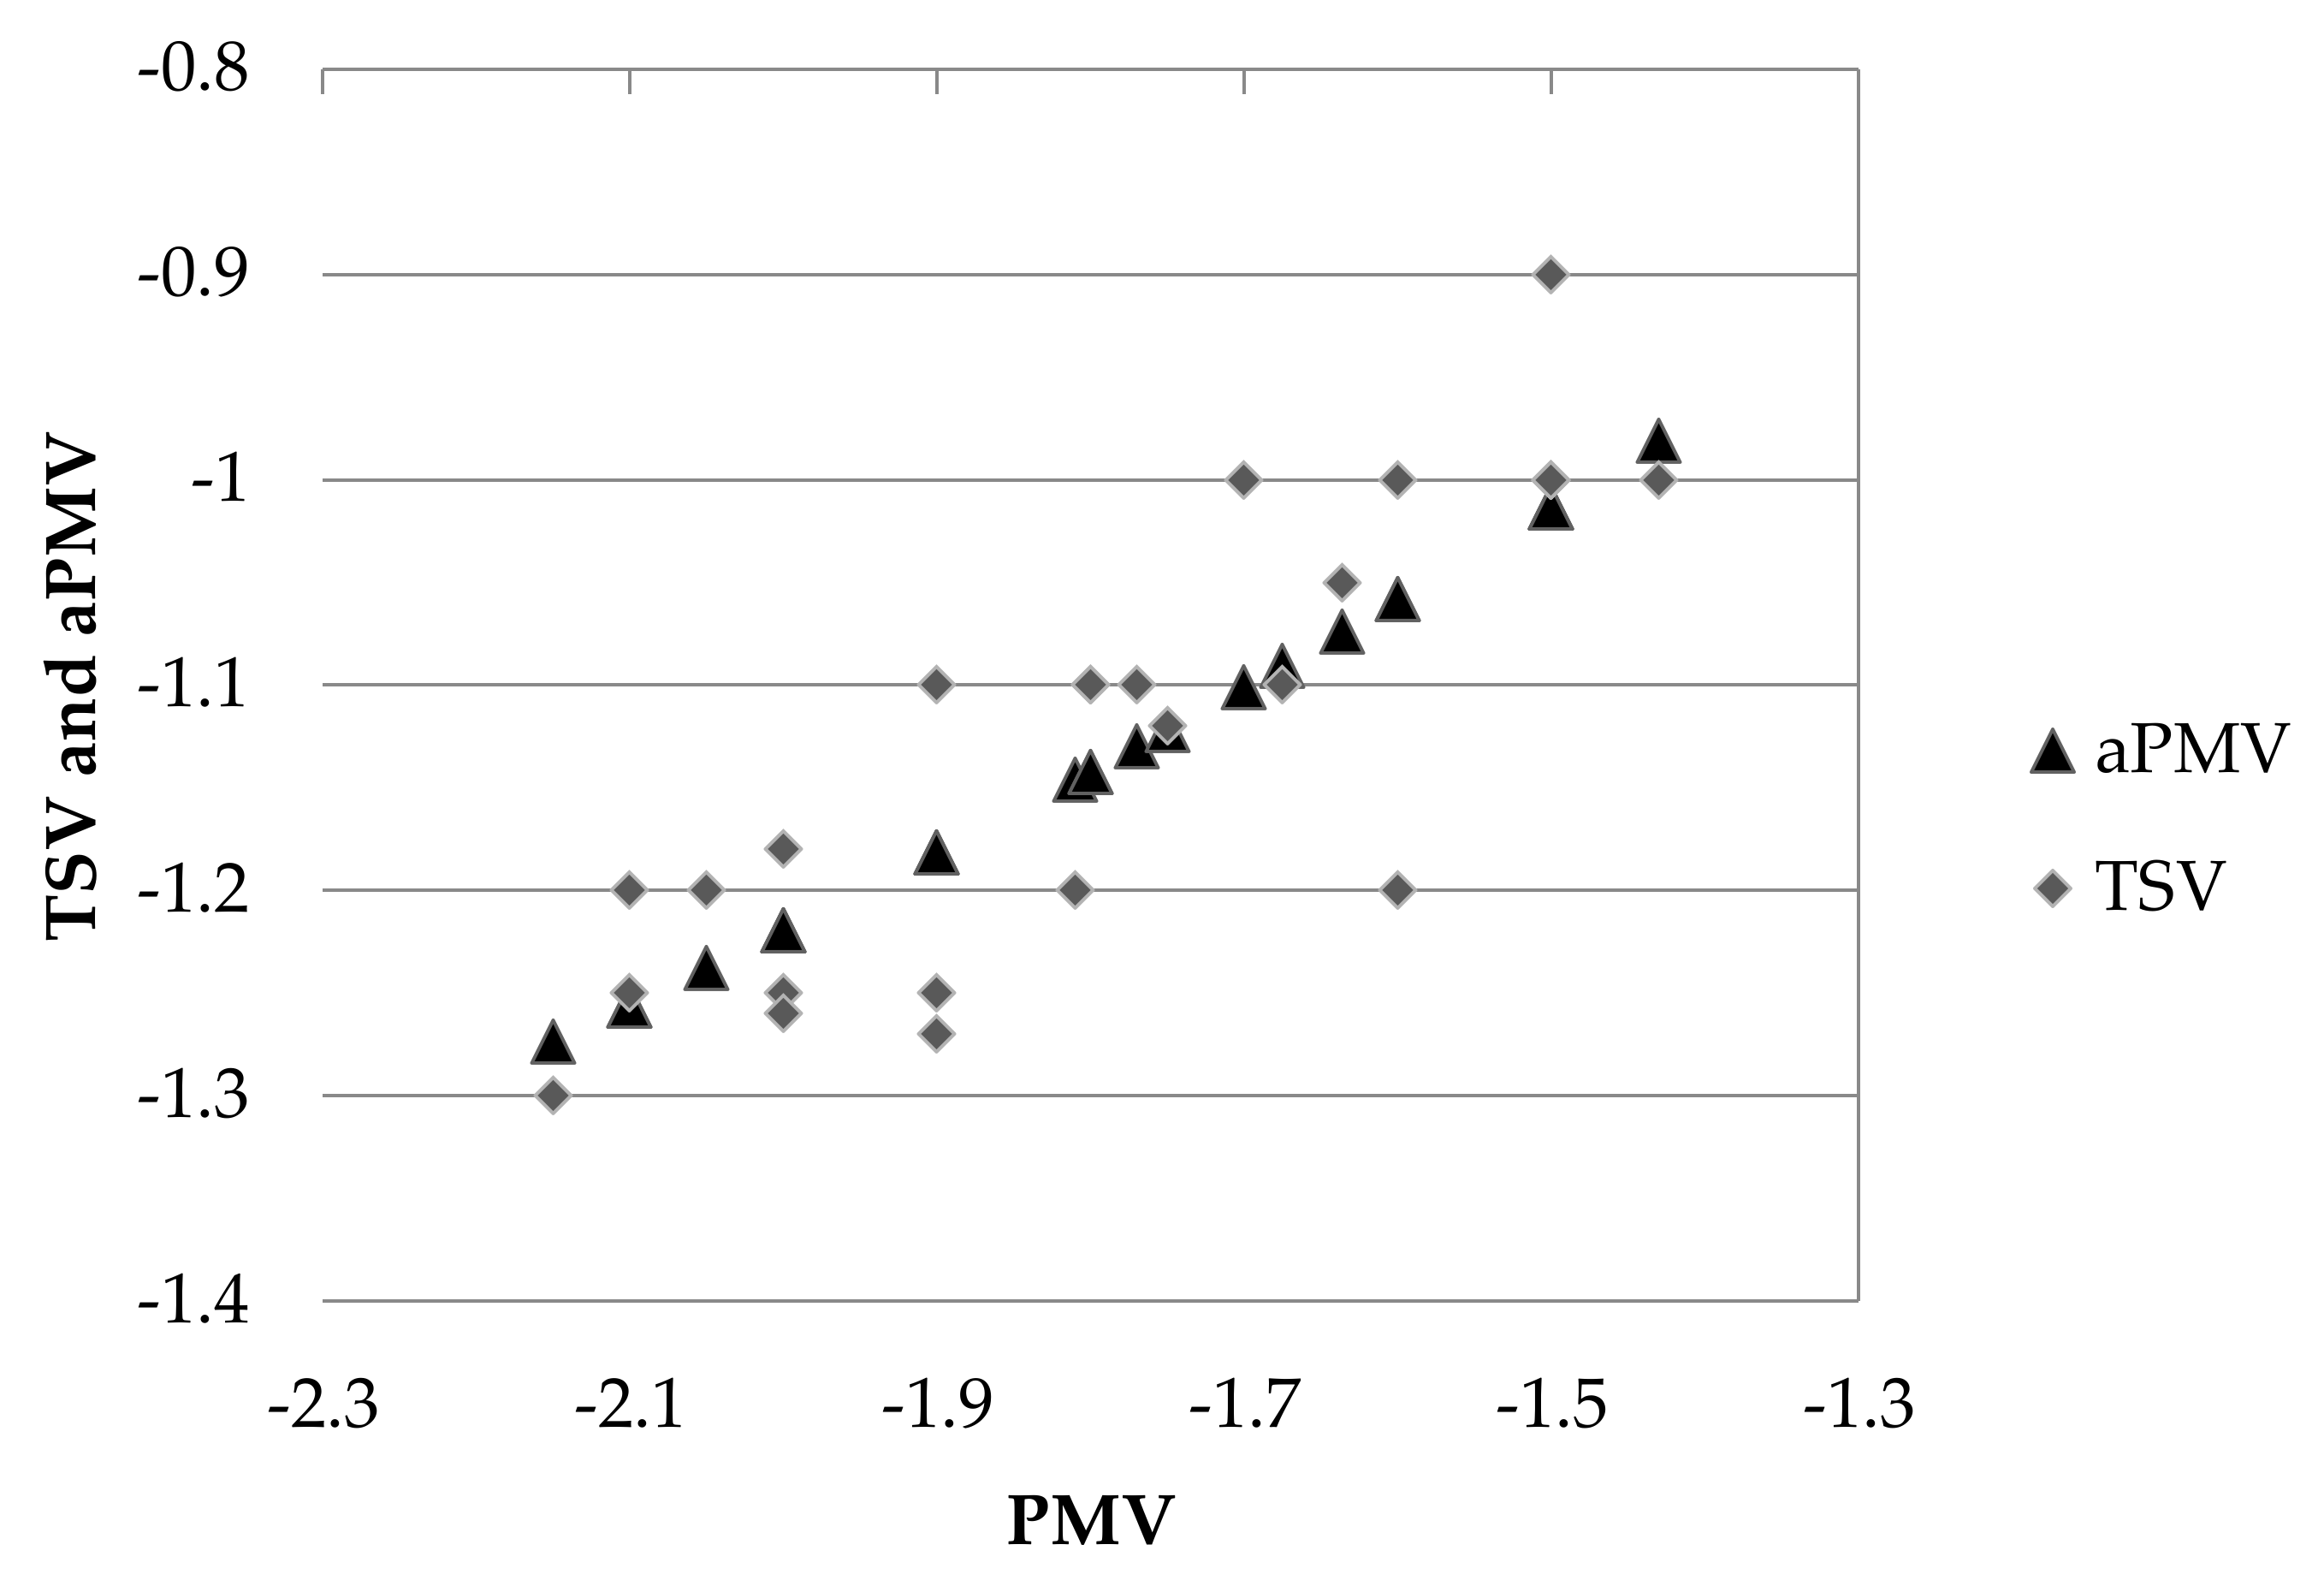
4.4. Comparative Analysis of PMV and AMV

By using regression analysis, the correlation of actual mean vote (AMV) and PMV with indoor operative temperature in winter was determined as follows:
AMV = 0.2018Top − 2.606, (R2 = 0.918)
where Top is indoor operative temperature, which is determined based on Equation (2); AMV is the actual mean vote (see Figure 12). The neutral temperature (Tn) can be regarded as the temperature at which thermal sensation votes are “neutral”. From Equation (8), the Tn from the AMV model in winter is 12.92 °C. The heat balance model of PMV equations for the studied period is as follows:
PMV = 0.1472Top − 2.615, (R2 = 0.984)
The neutral temperature calculated based on the PMV model of Equation (9) is 17.76 °C, which is almost 5 °C higher than the neutral temperature of AMV model of actual sensation votes. This indicates that the actual neutral thermal sensations were much higher than the predicted thermal sensation by the PMV model. As Table 5 presents, the predicted thermal neutral temperature and the measured thermal neutral temperature have a deviation from the average operating temperature, and the average operating temperature is lower than that of the neutral thermal temperature in winter.

5. Adaptive Thermal Comfort

5.1. Obtaining the Adaptive Coefficient λ

In the studied samples, 25 groups were obtained with PMV value of less than 0 using the Bin method. Therefore λ can be determined by the following equation:
λ = 1 25 ( y x ) 25 = 0.32 ,
Thus, the aPMV model for a stone dwelling in Danba can be written as the following:
aPMV = PMV 1 0.32 PMV   ( winter ) ,
In order to compare the actual Predicted Mean Vote derived from the aPMV model and the actual thermal sensation vote (TSV), the aPMV and TSV were plotted in Figure 13. The aPMV model showed a stronger agreement with the PMV model than with the TSV model.

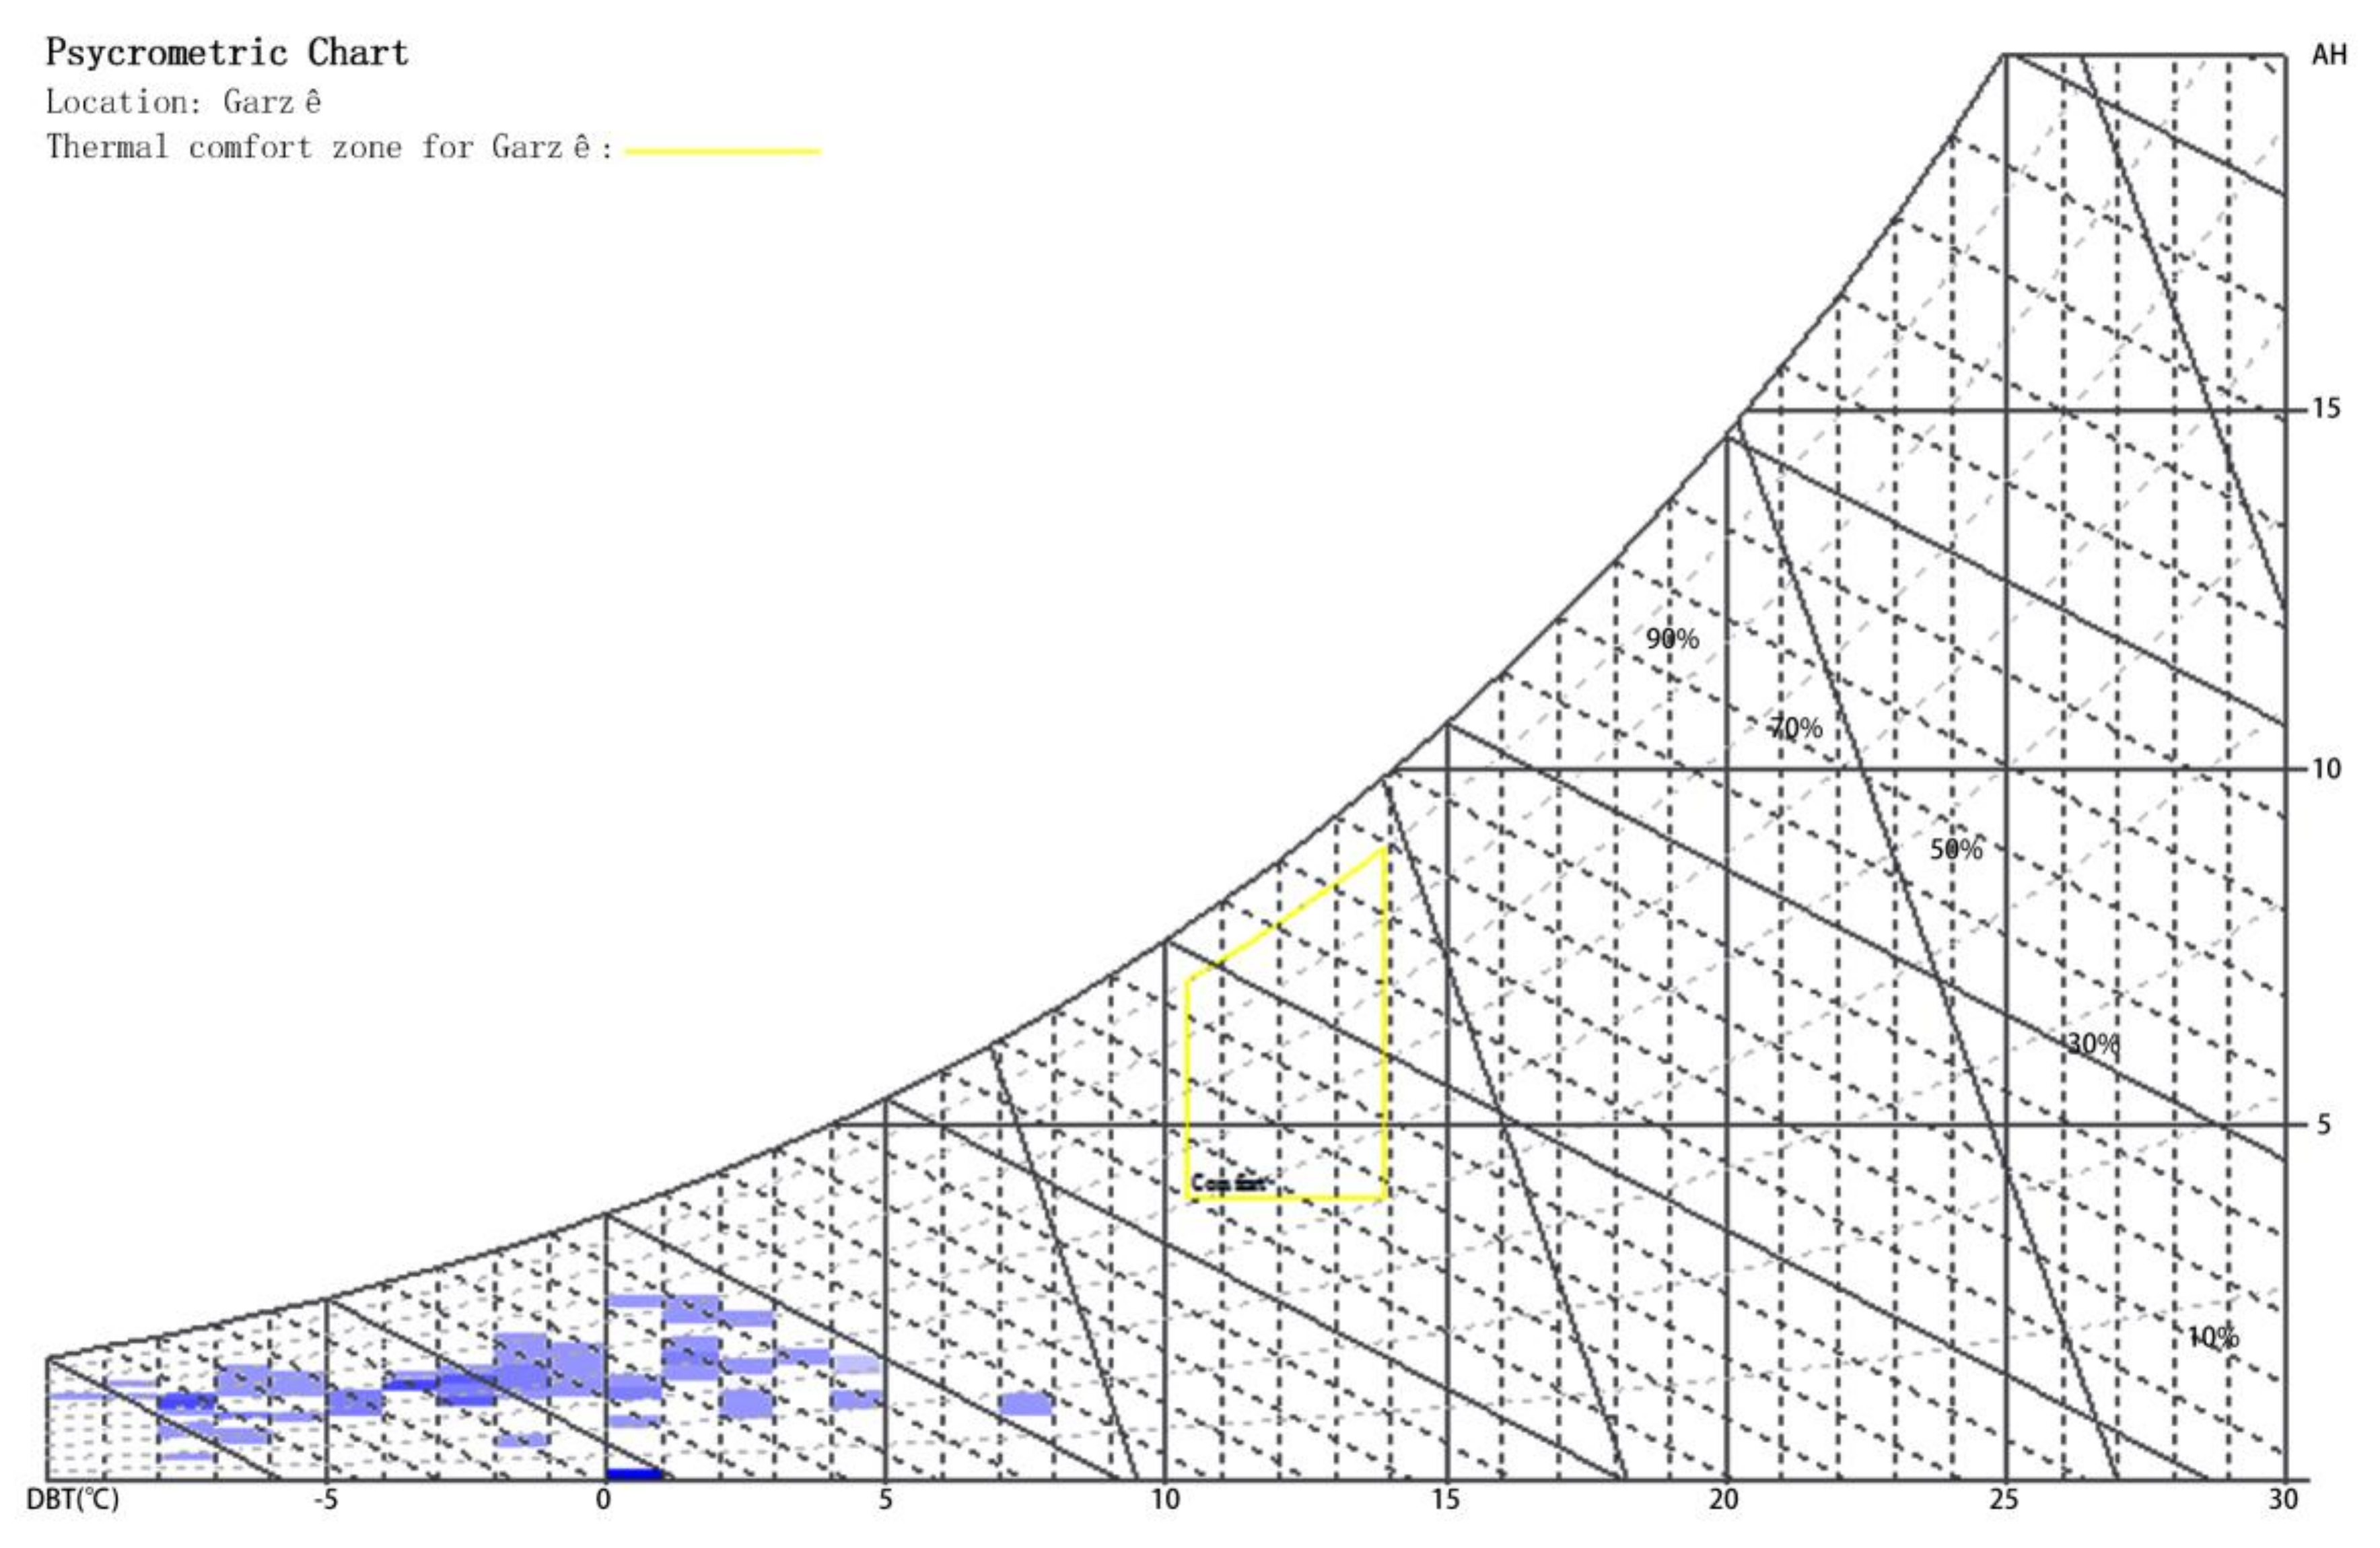
5.2. Thermal Comfort Zone

Indoor air temperature, air humidity, air velocity, and radiation temperature are important factors that constitute indoor environmental conditions. These factors affect the health and body comfort of occupants. Based on the local weather data, the comfort zone is determined on the psychometric chart. The psychometric chart can also determine the heating or cooling potential of the passive design of a building based on local weather data.
The thermal comfort zone for residential buildings in Danba during winter is plotted in Figure 14 using the Climate Consultant Tool for the studied period. The abscissa represents the dry-bulb temperature (°C), the ordinate represents absolute humidity (g/kg), and the arc represents relative humidity (%). The enclosed area (yellow rectangle) in the figure represents the comfort zone, while the blue dots represent the data-points of environmental conditions during the survey period. As shown in the figure, none of the blue dots fall within the comfort zone, while in our survey, the majority of residents (76%) voted for an acceptable comfort sensation during typical winter days. This finding indicates that a revision of the comfort zone for Danba is needed with a reference to the local adaptive coefficient, which was calculated in this study. The Climate Consultant Tool assumes that the average radiant temperature is close to the air temperature and that the airflow velocity is within a comfortable range.

6. Conclusions

This study is based on subjective responses of 327 occupants in the cold climatic zones of Sichuan, China. The experiments were conducted in winter to evaluate the local residential levels of adaptations in cold conditions. The research findings are summarised as follows:
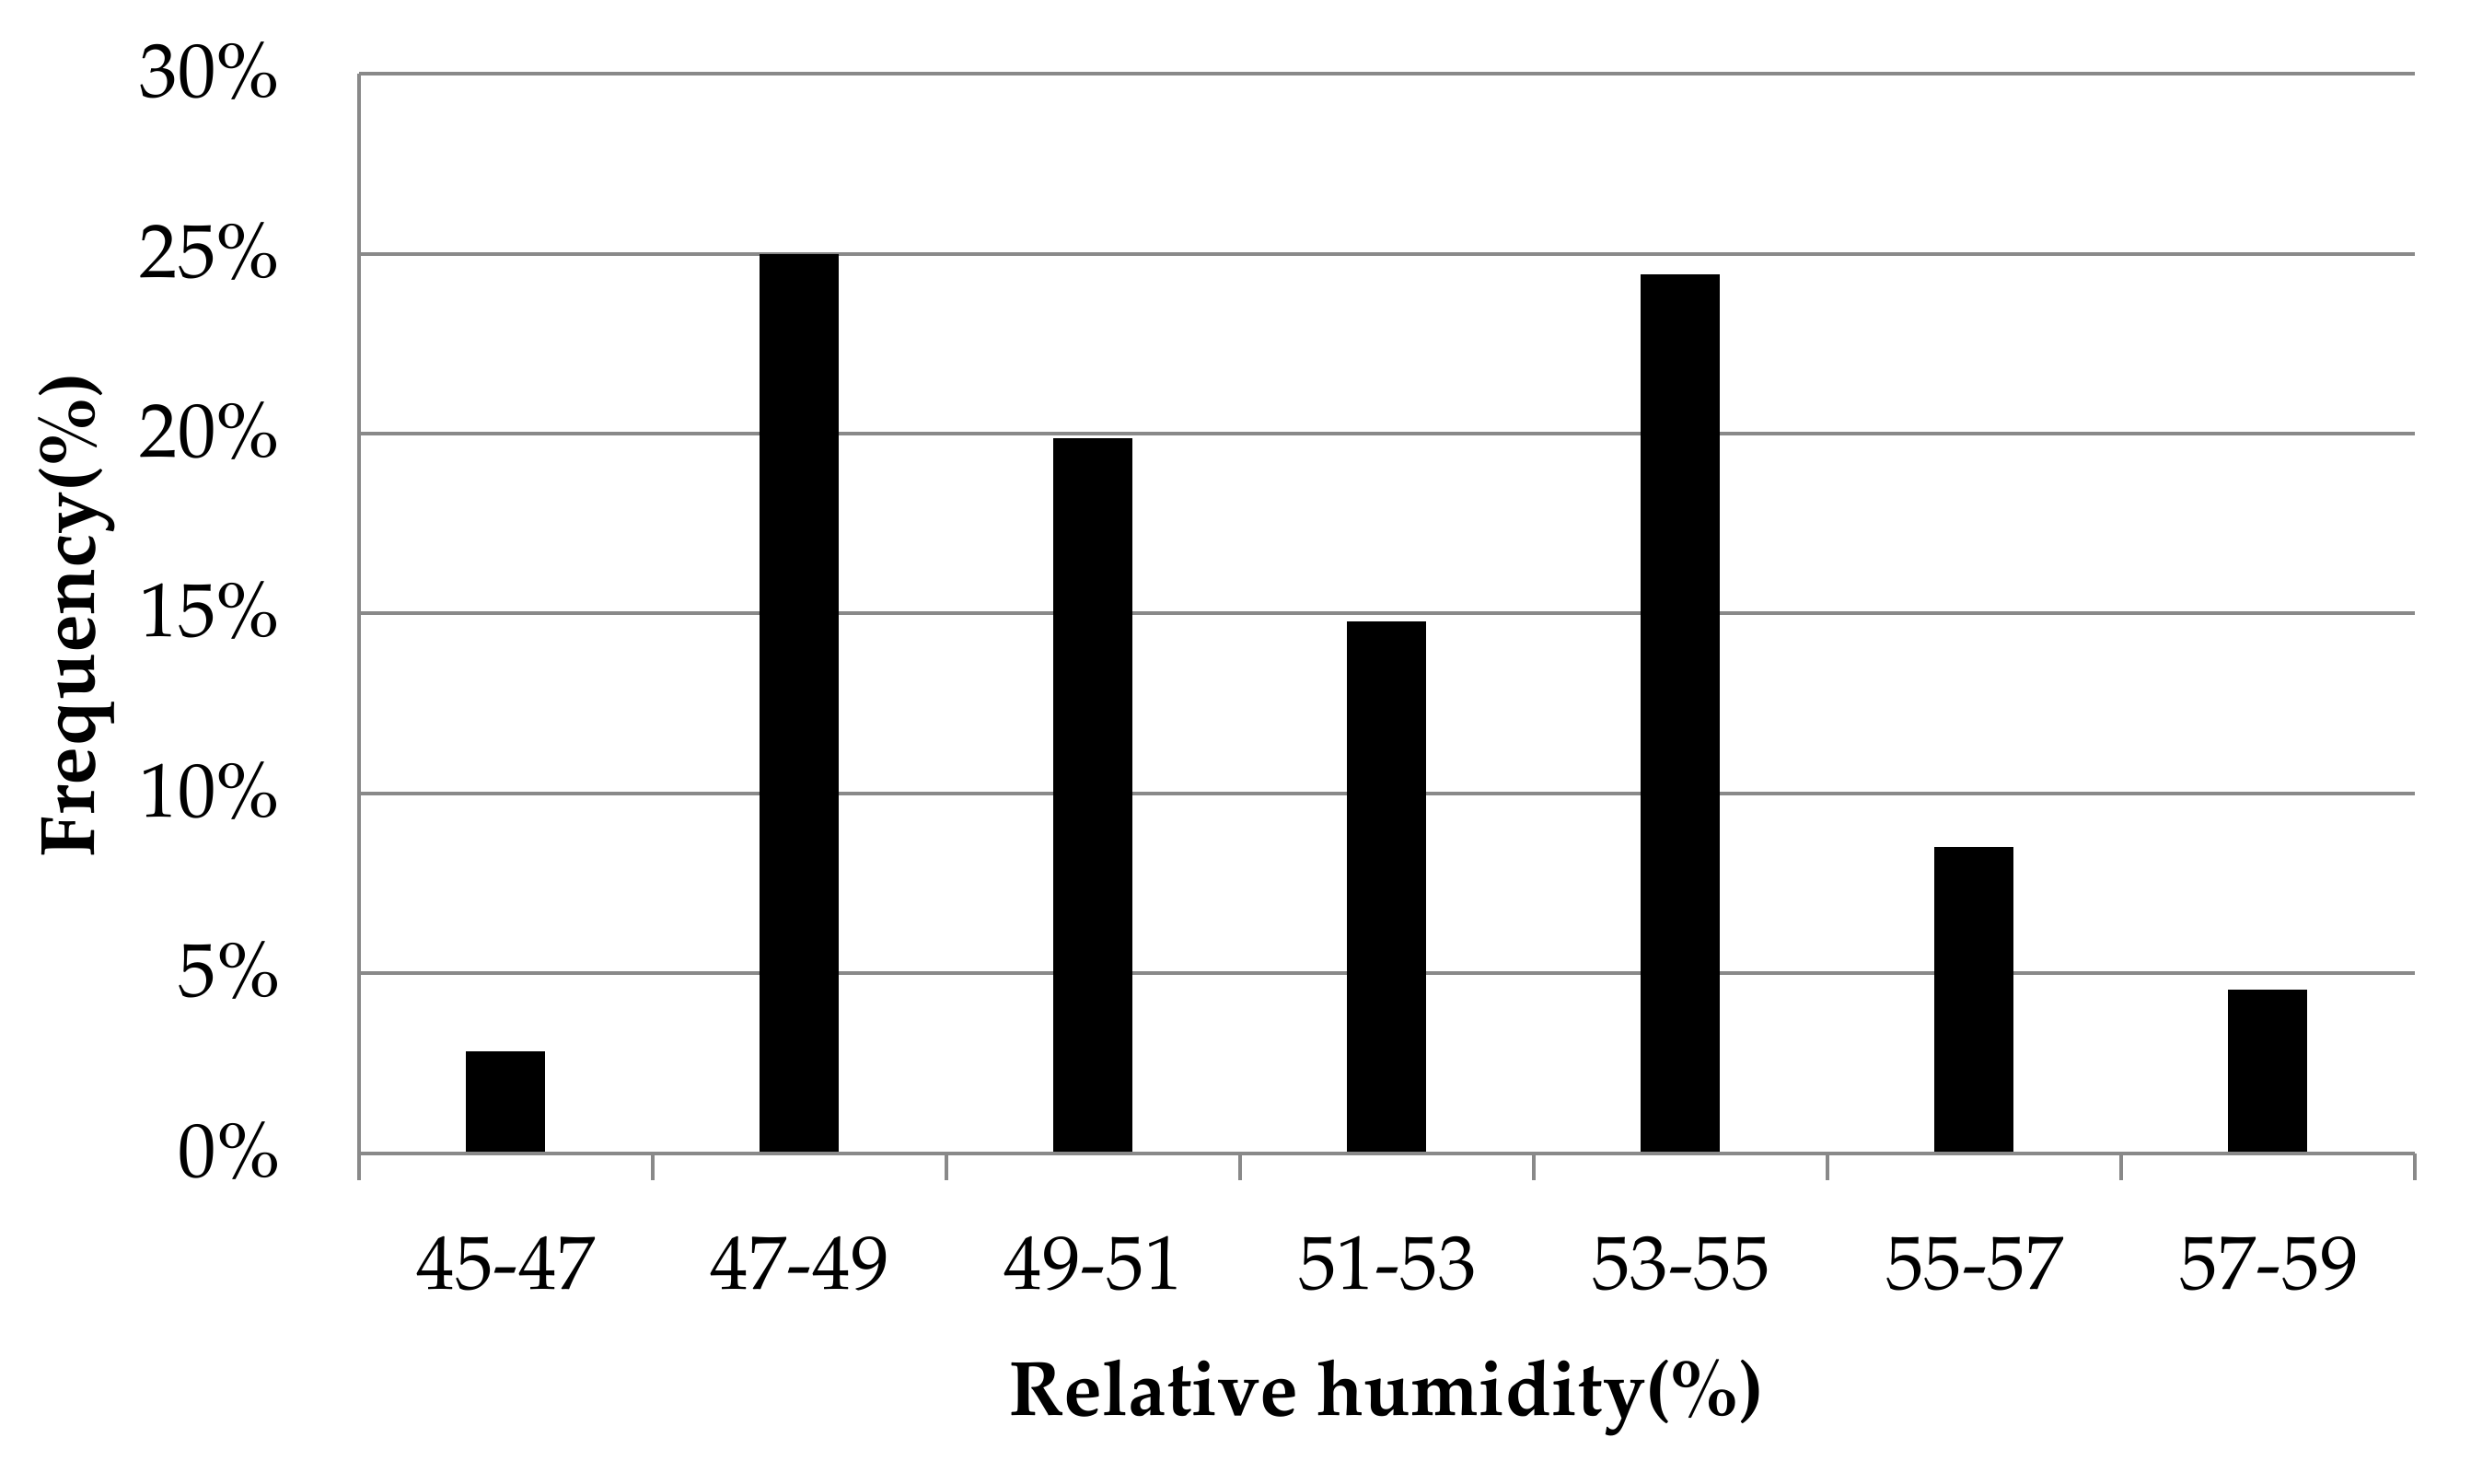
  • In winter, indoor air temperature in residential buildings fluctuates greatly from 3.1 to 8.1 °C, and the outdoor temperatures fluctuates between −5.61 and 10.26 °C, while the indoor relative humidity ranges from 54.3% to 70.8%. The indoor temperatures were higher than the outdoor temperature during the studied period.
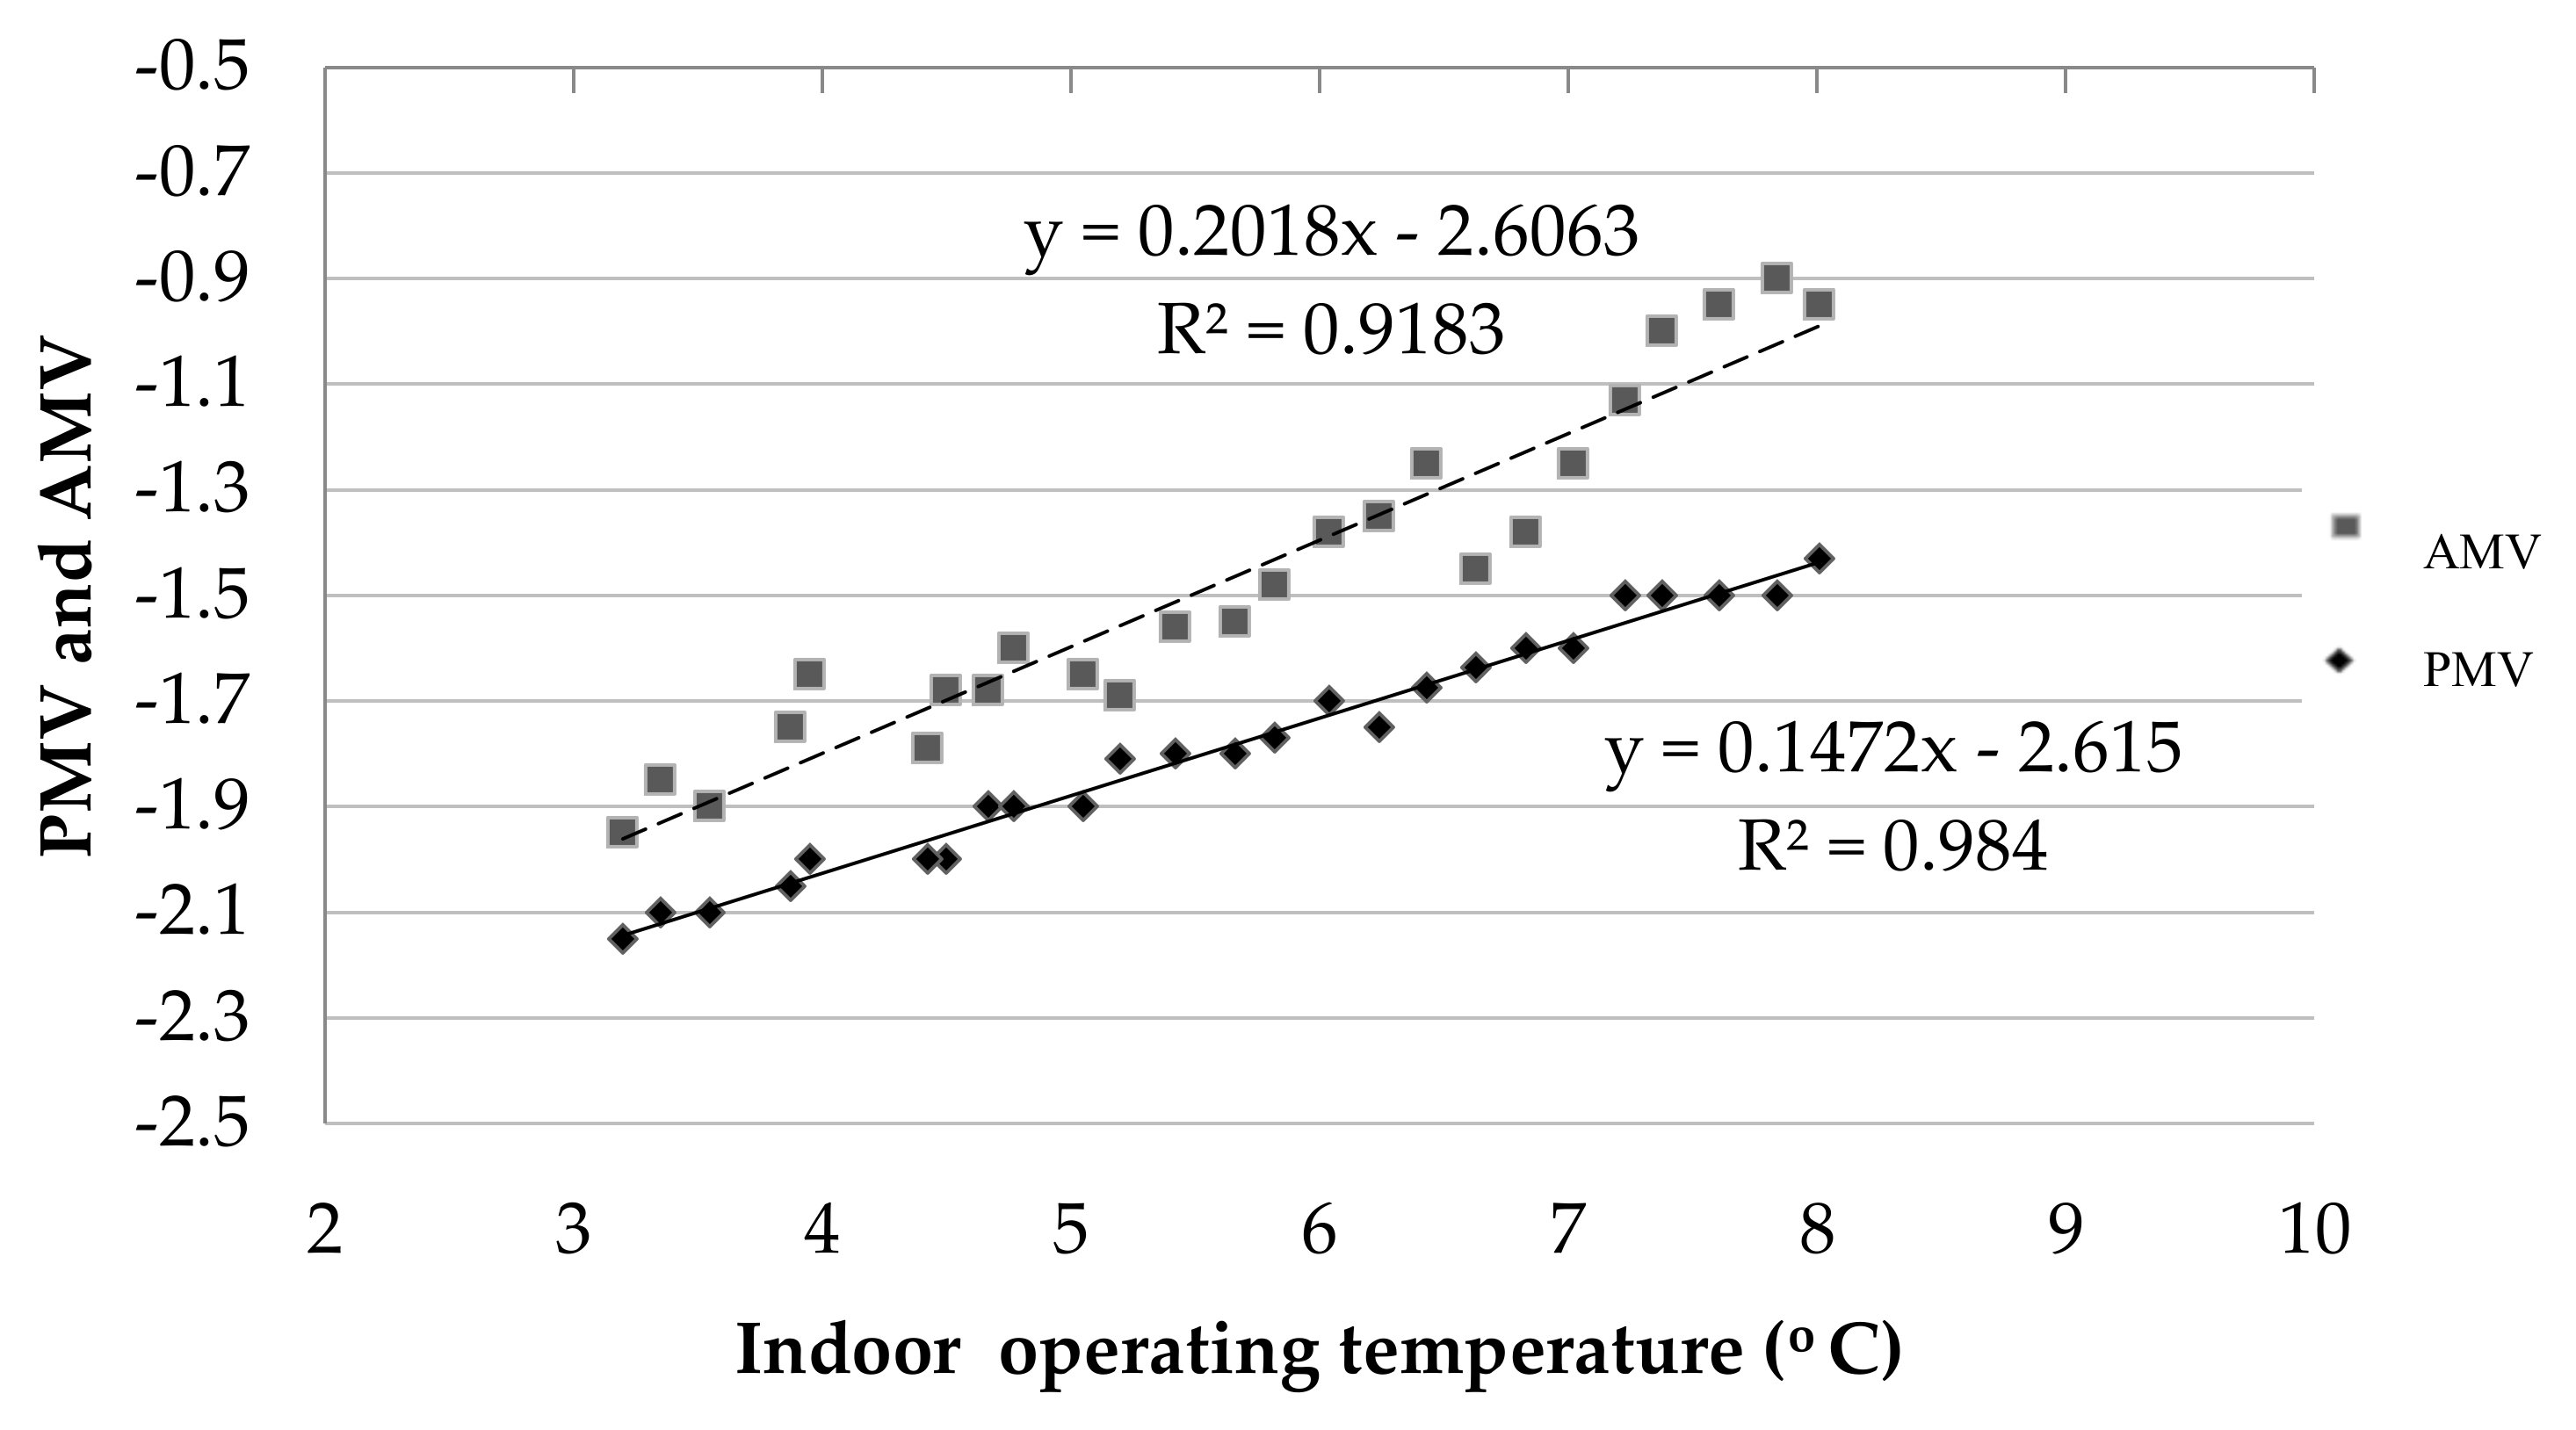
  • The thermal neutral temperature (Tn) determined by the PMV model was almost 5 °C higher than the Tn observed based on the actual Mean Vote (AMV) model determined by the survey results. When AMV is equal to 0, the indoor thermal neutral temperature in winter was 12.92 °C, which was lower than the predicted thermal neutral temperature of 17.76 °C in this region.
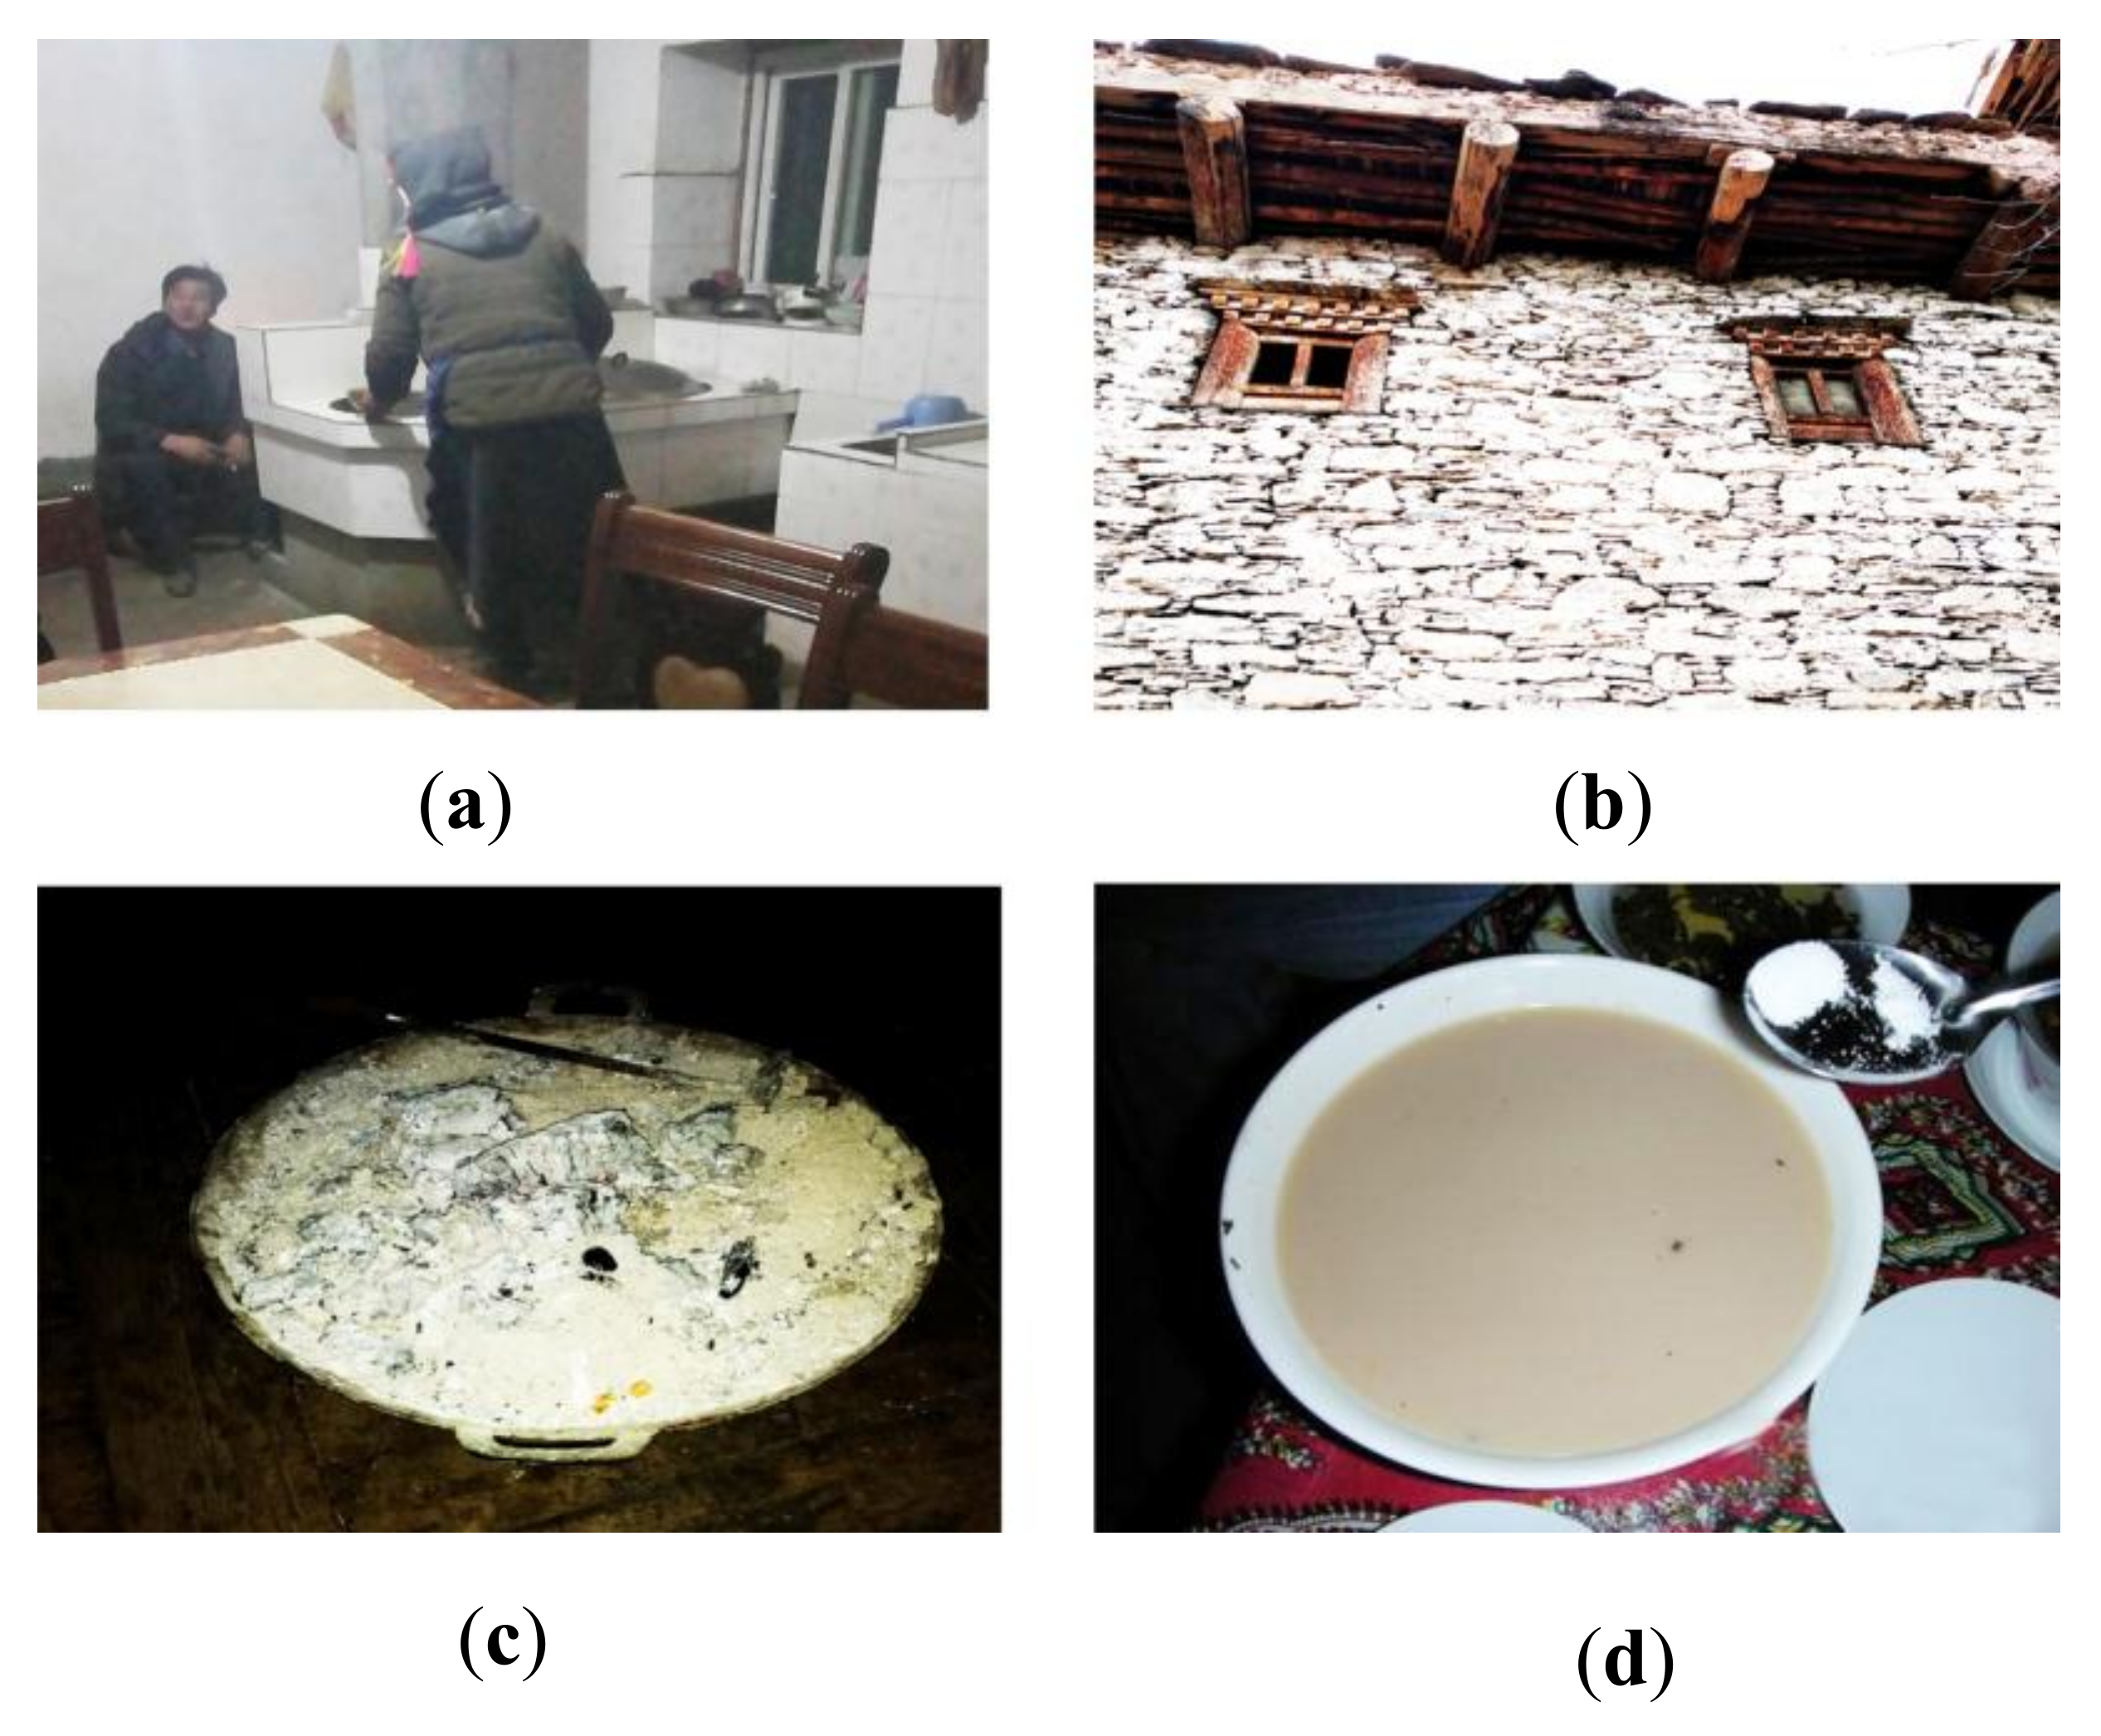
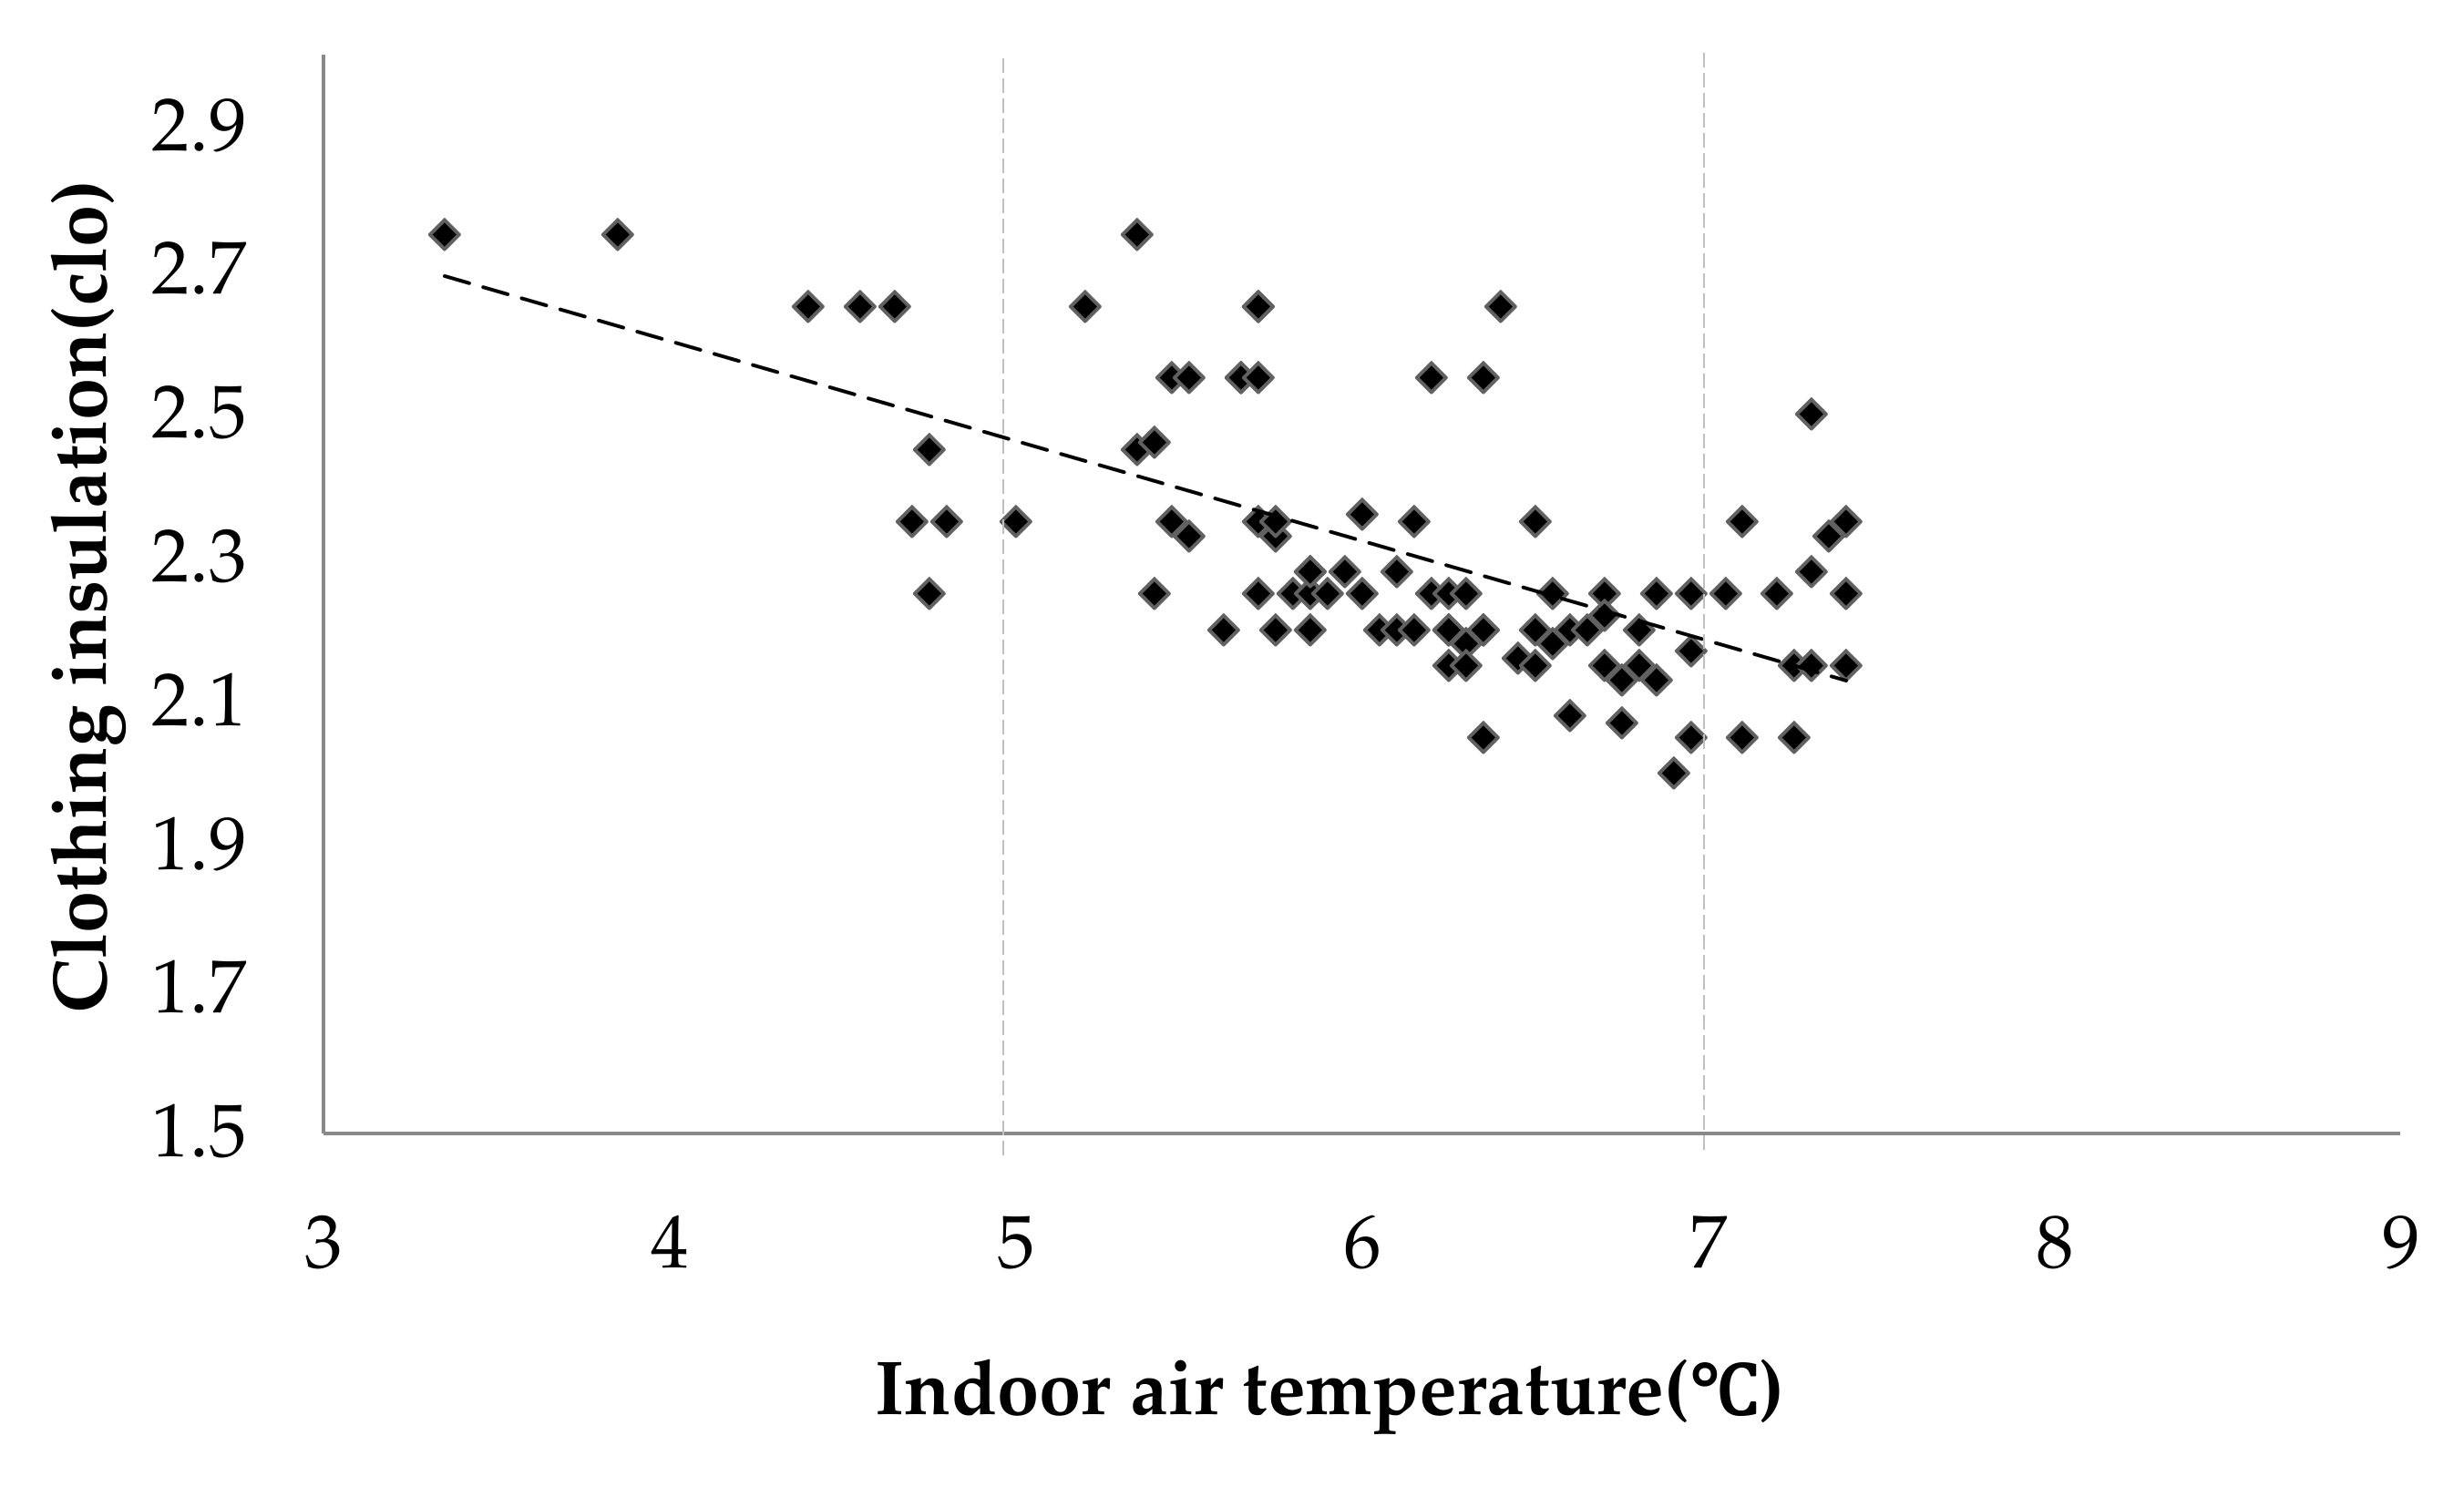
  • The residents maintain a unique lifestyle in terms of thermal adaptation. They wear heavy clothing (2.0 to 2.2 clo) and drink milk or buttered tea to protect themselves from the cold winter. Another two popular adaptive behaviours are blocking windows against from draughts, and increasing activity.
  • It was observed that the PMV model underestimated the comfort sensations of the occupants in cold climates. Theoretical thermal comfort models have been developed that explain the deviation in the PMV and AMV plots.
  • An aPMV model and adaptive coefficient was developed for winter season in cold regions of China in Tibet.
  • By applying the adaptive thermal comfort model (aPMV model), the adaptive thermal comfort coefficient λ value of −0.32 has been obtained and validated for residential buildings in Danba.
This research also showed that the perception of thermal comfort depends on physiological and non-physiological factors influenced by culture, the availability of adaptive opportunities and culture. The developed adaptive coefficient could be used as a reference for thermal comfort evaluations in the cold regions with low-income residents.

Acknowledgments

This study has been funded by the Southwest University of Science and Technology PhD project “Research on green renewal of stone-built dwellings in Sichuan Tibetan Area” (grant number 16zx7133). Special thanks go to those who were involved and who helped in the field survey.

Author Contributions

All authors contributed equally to this paper.

Conflicts of Interest

The authors declare that there is no conflict of interest regarding the publication of this manuscript.

References

  1. Mahdavi, A.; Kumar, S. Implications of indoor climate control for comfort, energy and environment. Energy Build. 1996, 24, 167–177. [Google Scholar] [CrossRef]
  2. Gou, Z.; Lau, S.S.-Y.; Shen, J. Indoor environmental satisfaction in two LEED offices and its implications in green interior design. Indoor Built Environ. 2012, 21, 503–514. [Google Scholar] [CrossRef]
  3. Gou, Z.; Lau, S.S.-Y.; Chen, F. Subjective and objective evaluation of the thermal environment in a three-star green office building in China. Indoor Built Environ. 2012, 21, 412–422. [Google Scholar] [CrossRef]
  4. Khoshbakht, M.; Gou, Z.; Lu, Y.; Xie, X.; Zhang, J. Are green buildings more satisfactory? A review of global evidence. Early warning and assessment report series. Habitat Int. 2018, in press. [Google Scholar] [CrossRef]
  5. Khoshbakht, M.; Gou, Z.; Dupre, K. Energy use characteristics and benchmarking for higher education buildings. Energy Build. 2018, 164, 61–76. [Google Scholar] [CrossRef]
  6. Khoshbakht, M.; Gou, Z.; Dupre, K. Cost-benefit prediction of green buildings: SWOT analysis of research methods and recent applications. Procedia Eng. 2017, 180, 167–178. [Google Scholar] [CrossRef]
  7. Sun, X.; Gou, Z.; Lau, S.S.-Y. Cost-effectiveness of active and passive design strategies in existing building retrofits in tropical climate: Case study of a zero energy building. J. Clean. Prod. 2018, 183, 35–45. [Google Scholar] [CrossRef]
  8. Yao, R.; Li, B.; Liu, J. A theoretical adaptive model of thermal comfort–Adaptive Predicted Mean Vote (aPMV). Build. Environ. 2009, 44, 2089–2096. [Google Scholar] [CrossRef]
  9. De Dear, R.; Akimoto, T.; Arens, E.; Brager, G.; Candido, C.; Cheong, K.; Li, B.; Nishihara, N.; Sekhar, S.; Tanabe, S. Progress in thermal comfort research over the last twenty years. Indoor Air 2013, 23, 442–461. [Google Scholar] [CrossRef] [PubMed]
  10. Fanger, P.O. Thermal Comfort: Analysis and Applications in Environmental Engineering; Danish Technical Press: Copenhagen, Denmark, 1970. [Google Scholar]
  11. Alfano, F.R.A.; Olesen, B.W.; Palella, B.I. Povl Ole Fanger’s impact ten years later. Energy Build. 2017, 152, 243–249. [Google Scholar] [CrossRef]
  12. Xiong, Z.; Yang, K. Theoretical model of infrared radiation of dressed human body indoors. In Proceedings of the International Symposium on Photoelectronic Detection and Imaging 2007: Photoelectronic Imaging and Detection, Beijing, China, 3 March 2008; International Society for Optics and Photonics: Bellingham, WA, USA, 2008. [Google Scholar]
  13. ISO 8996. Ergonomics of the Thermal Environment e Determination of Metabolic Rate; International Standardization Organization: Geneva, Switzerland, 2004.
  14. ISO 7726. Ergonomics of the Thermal Environment—Instruments for Measuring Physical Quantities; International Standardization Organization: Geneva, Switzerland, 1998.
  15. ISO 10551. Ergonomics of the Thermal Environment e Assessment of the Influence of the Thermal Environment Using Subjective Judgement Scales; International Standardization Organization: Geneva, Switzerland, 1995.
  16. Fanger, P.O.; Toftum, J. Extension of the PMV model to non-air-conditioned buildings in warm climates. Energy Build. 2002, 34, 533–536. [Google Scholar] [CrossRef]
  17. Alfano, F.R.A.; Ianniello, E.; Palella, B.I. PMV–PPD and acceptability in naturally ventilated schools. Build. Environ. 2013, 67, 129–137. [Google Scholar] [CrossRef]
  18. Alfano, F.R.A.; Bellia, L.; Boerstra, A.; Van Dijken, F.; Ianniello, E.; Lopardo, G.; Minichiello, F.; Romagnoni, P.; da Silva, M.G. REHVA-Indoor Environment and Energy Efficiency in Schools—Part 1; REHVA: Brussels, Belgium, 2010; Volume 2010, pp. 1–121. [Google Scholar]
  19. Dušan, K.; Miloslav, B.; Marián, V.; Anna, V.; Martin, K.; Maros, N. Analysis of an indoor environment in year-round operation. Adv. Mater. Res. 2013, 649, 37–40. [Google Scholar]
  20. De Dear, R.J.; Brager, G.S.; Reardon, J.; Nicol, F. Developing an adaptive model of thermal comfort and preference/discussion. ASHRAE Trans. 1998, 104, 145. [Google Scholar]
  21. Humphreys, M.A.; Nicol, J.F.; Raja, I.A. Field studies of indoor thermal comfort and the progress of the adaptive approach. Adv. Build. Energy Res. 2007, 1, 55–88. [Google Scholar] [CrossRef]
  22. Brager, G.S.; De Dear, R.J. Thermal adaptation in the built environment: A literature review. Energy Build. 1998, 27, 83–96. [Google Scholar] [CrossRef]
  23. De Dear, R.J.; Brager, G.S. Thermal comfort in naturally ventilated buildings: Revisions to ASHRAE Standard 55. Energy Build. 2002, 34, 549–561. [Google Scholar] [CrossRef]
  24. Arif, M.; Katafygiotou, M.; Mazroei, A.; Kaushik, A.; Elsarrag, E. Impact of indoor environmental quality on occupant well-being and comfort: A review of the literature. Int. J. Sustain. Built Environ. 2016, 5, 1–11. [Google Scholar]
  25. Yao, R. Indoor Climate Simulation and Thermal Comfort Research. Ph.D. Thesis, Chongqing University, Chongqing, China, 1997. [Google Scholar]
  26. Cao, B.; Zhu, Y.; Ouyang, Q.; Zhou, X.; Huang, L. Field study of human thermal comfort and thermal adaptability during the summer and winter in Beijing. Energy Build. 2011, 43, 1051–1056. [Google Scholar] [CrossRef]
  27. Han, J.; Zhang, G.; Zhang, Q.; Zhang, J.; Liu, J.; Tian, L.; Zheng, C.; Hao, J.; Lin, J.; Liu, Y. Field study on occupants’ thermal comfort and residential thermal environment in a hot-humid climate of China. Build. Environ. 2007, 42, 4043–4050. [Google Scholar] [CrossRef]
  28. Yang, L.; Yan, H.; Xu, Y.; Lam, J.C. Residential thermal environment in cold climates at high altitudes and building energy use implications. Energy Build. 2013, 62, 139–145. [Google Scholar] [CrossRef]
  29. Zhang, Y.; Chen, H.; Meng, Q. Thermal comfort in buildings with split air-conditioners in hot-humid area of China. Build. Environ. 2013, 64, 213–224. [Google Scholar] [CrossRef]
  30. Zhang, Y.; Wang, J.; Chen, H.; Zhang, J.; Meng, Q. Thermal comfort in naturally ventilated buildings in hot-humid area of China. Build. Environ. 2010, 45, 2562–2570. [Google Scholar] [CrossRef]
  31. Wang, Z.J.; Wang, G.; Lian, L.-M. A field study of the thermal environment in residential buildings in Harbin. Trans. Am. Soc. Heat. Refrigerating Air Cond. Eng. 2003, 109, 350–355. [Google Scholar]
  32. Zou, M.; Yang, L.; Yan, H. Investigation of summer thermal comfort in village and town house in Hanzhoung. Build. Sci. Res. Sichuan 2013, 39, 341–345. [Google Scholar]
  33. Yan, H.; Yan, L.; Zhou, B. Field research on indoor thermal comfort of residential buildings in Jiaozuo in winter. J. HV&AC 2011, 41, 119–125. [Google Scholar]
  34. Yang, L.; Yang, Q.; Yan, H.; Liu, J. Investigation and Study on indoor thermal comfort of rural residential buildings in Guanzhong, Shaanxi. J. Xi’an Univ. Archit. Technol. 2011, 43, 551–556. [Google Scholar]
  35. Li, B.; Zheng, J.; Yao, R.; Jing, S. Indoor Thermal Environment and Human Thermal Comfort; Chongqing University Press: Chongqing, China, 2012. [Google Scholar]
  36. Zhou, L.; He, Y.; Li, N.; Zhang, W. Investigation on thermal comfort of rural residential buildings in winter in Xiangxi. Build. Sci. 2016, 32, 29–33. [Google Scholar]
  37. Wang, J.; Wang, H.; Liu, Y. The thermal comfort of the students in the primary and secondary schools in Qinghai. J. Civ. Archit. Environ. Eng. 2017, 39, 32–37. [Google Scholar]
  38. Li, K. Evaluation of Indoor Thermal Environment in Rural Housing in Chongqing. Ph.D. Thesis, Chongqing Univercity, Chongqing, China, 2015. [Google Scholar]
  39. Yang, Z.; Xu, Y.; Peng, M. Adaptability of wood wall dwellings to hot and humid climate. J. Civ. Archit. Environ. Eng. 2016, 38, 1–6. [Google Scholar]
  40. Zheng, W.; Yang, L.; Song, X. Climatic seasonal changes of adaptive level of human body in cold regions. J. HV AC 2015, 2015, 80–85. [Google Scholar]
  41. Wang, Y. Study on the Characteristics of Indoor Thermal and Wet Environment in Tibet. Ph.D. Thesis, Chongqing University, Chongqing, China, 2015. [Google Scholar]
  42. He, Q.; Liu, D.; Zhu, X. Test and study on the indoor thermal environment of Tibetan folk dwellings in Western Sichuan Plateau. J. Xi’an Archit. Technol. 2015, 3, 402–406. [Google Scholar]
  43. Ou, J.; Wang, C.; Li, Q. Investigation and measurement of the heat environment of the winter ledger in the pastoral area of Western Sichuan Plateau. Build. Sci. 2016, 6, 39–44. [Google Scholar]
  44. Chen, Y.; Chen, B.; Gao, M. Indoor thermal and wet environment test of a Tibetan stone dwelling in Danba during the transition season. Sichuan Archit. 2017, 37, 63–64. [Google Scholar]
  45. Gou, Z.; Xie, X.; Lu, Y.; Khoshbakht, M. Quality of Life (QoL) Survey in Hong Kong: Understanding the Importance of Housing Environment and Needs of Residents from Different Housing Sectors. Int. J. Environ. Res. Public Health 2018, 15, 219. [Google Scholar] [CrossRef] [PubMed]
  46. McCullough, E.A.; Jones, B.W.; Huck, J. A comprehensive data base for estimating clothing insulation. ASHRAE Trans. 1985, 91, 29–47. [Google Scholar]
  47. ASHRAE Standard 2004. Thermal Environmental Conditions for Human Occupancy; American Society of Heating, Refrigerating and Air-Conditioning Engineers: New York, NY, USA, 2004.
  48. Alfano, F.R.A.; Palella, B.I.; Riccio, G. The role of measurement accuracy on the thermal environment assessment by means of PMV index. Build. Environ. 2011, 46, 1361–1369. [Google Scholar] [CrossRef]
  49. Cao, B.; Luo, M.; Li, M.; Zhu, Y. Too cold or too warm? A winter thermal comfort study in different climate zones in China. Energy Build. 2016, 133, 469–477. [Google Scholar] [CrossRef]
  50. da Silva, M.C.G.; Pires, J.N.; Loureiro, A.; Pereira, L.D.; Neto, P.; Gaspar, A.; Viegas, D.X.; Soares, N.; Oliveira, M.; Costa, J. Spreadsheets for the calculation of Thermal Comfort Indices PMV and PPD. Renew. Sustain. Energy Rev. 2014, 40, 911–922. [Google Scholar]
  51. Alfano, F.R.A.; Palella, B.I.; Riccio, G. Notes on the Calculation of the PMV Index by Means of Apps. Energy Procedia 2016, 101, 249–256. [Google Scholar] [CrossRef]
  52. Fountain, M.; Huizenga, C. A Thermal Sensation Prediction Software Tool for Use by the Profession; American Society of Heating, Refrigerating and Air-Conditioning Engineers: New York, NY, USA, 1997. [Google Scholar]
  53. International Organization for Standardization. Ergonomics of the Thermal Environment: Analytical Determination and Interpretation of Thermal Comfort Using Calculation of the PMV and PPD Indices and Local Thermal Comfort Criteria; International Organization for Standardization: Geneva, Switzerland, 2005. [Google Scholar]
  54. Yu, W.; Li, B.; Yao, R.; Wang, D.; Li, K. A study of thermal comfort in residential buildings on the Tibetan Plateau, China. Build. Environ. 2017, 119, 71–86. [Google Scholar] [CrossRef]
  55. Kim, J.T.; Lim, J.H.; Cho, S.H.; Yun, G.Y. Development of the adaptive PMV model for improving prediction performances. Energy Build. 2015, 98, 100–105. [Google Scholar] [CrossRef]
  56. Nicol, J.F.; Humphreys, M.A. Adaptive thermal comfort and sustainable thermal standards for buildings. Energy Build. 2002, 34, 563–572. [Google Scholar] [CrossRef]
  57. Xu, W.; Chen, X.; Zhao, J. An adaptive Predicted Mean Vote (aPMV) model in office. In Proceedings of the Mechanic Automation and Control Engineering (MACE), Wuhan, China, 26–28 June 2010. [Google Scholar]
Figure 1. Map of location of the studied area.
Buildings 08 00049 g001
Figure 2. Building climate demarcation of Sichuan province.
Buildings 08 00049 g002
Figure 3. Typical Tibetan stone dwellings in Danba County.
Buildings 08 00049 g003
Figure 4. The measurement used during the study (a) JTSOFI-IAQ; (b) JTR05; and (c) Micro Log series.
Buildings 08 00049 g004
Figure 5. Comparison between globe temperature (Tg) and air temperatures (Ta).
Buildings 08 00049 g005
Figure 6. Relationship between indoor and outdoor temperatures in Danba.
Buildings 08 00049 g006
Figure 7. Frequency of the indoor air temperature in winter.
Buildings 08 00049 g007
Figure 8. Frequency of the indoor air relative humidity in winter.
Buildings 08 00049 g008
Figure 9. Adaptive behaviours in winter: (a) Dressing example in winter; (b) Small windows in stone houses; (c) Brazier; (d) Drinking milk or buttered tea.
Buildings 08 00049 g009
Figure 10. Correlation between resident clothing insulation and indoor air temperature in winter.
Buildings 08 00049 g010
Figure 11. TSV, HSV, DSV in winter.
Buildings 08 00049 g011
Figure 12. The linear relations between AMV, PMV, and indoor operating temperature (Top) in winter.
Buildings 08 00049 g012
Figure 13. Correlation between aPMV and TSV.
Buildings 08 00049 g013
Figure 14. Thermal comfort zone for residential buildings in Danba during winter.
Buildings 08 00049 g014
Table 1. Comparison of the meteorological parameters of typical county in cold rural area of Sichuan.
CountyNorth Latitude 1East Longitude 1Annual Average Air Temperature (°C)Average Temperature of the Coldest Month (°C)Average Temperature of the Hottest Month (°C)Annual Average Sunshine Duration (h)Annual Altitude (m)
Danba County30°52′101°53′14.24.422.42106.91800
Heishui County32°03′102°59′95.410.924172350
Mao County31°41′103°51′11.10.820.41549.41580
1 Observatory site.
Table 2. The scale of thermal, humidity and air velocity.
Scale PointsComfort Sensation
TemperatureHumidityAir Velocity
+3HotVery humidVery still
+2WarmHumidStill
+1Slightly warmSlightly humidSlightly still
0NeutralNeutralNeutral
−1Slightly coolSlightly drySlightly breezy
−2CoolDryBreezy
−3ColdVery dryVery breezy
Table 3. Monitoring parameters and specification of equipment.
Monitoring ParametersInstrument/SensorTrade NameValid RangeAccuracyRequired Accuracy by Standards
Air temperature Air ThermometerJTR05−20~+120 °C±0.3 °C ± 0.5 °C [14]
Globe temperatureGlobe thermometer JTSOFI-IAQ−20~+50 °C±0.3 °C±0.4 °C [49]
Air velocityAnemometerJTSOFI-IAQ0.05~2 m/s±0.03 m/s±0.05 m/s [14]
Relative humidity (RH)HygrometerMicro Log 0~100%±2%±3% [49]
Table 4. Participant demographic information.
SampleTypeNumber (Percentage %)
GenderMale138 (42%)
Female189 (58%)
Total327
Age 14–26 years(58) 17.74%
27–38 years(65) 19.88%
39–51 years(134) 40.98%
52–80 years(70) 21.40%
Average42 years
Table 5. Thermal neutral temperature statistics during winter.
ClassificationPredictionTemperature (°C)
Average operating temperature (°C)-6.29
Neutral temperature (°C)Forecast 17.76
Actual measurement12.92

