1. Introduction
Most earthquake-induced casualties are the direct result of structural collapses. Structural collapse implies that the structural system is unable to withstand its own gravity loads. Seismic code criteria for structural systems in the United States (U.S.) focus primarily on performance targets related to collapse prevention and life safety. These performance targets are associated with mapped 5%-damped pseudo-spectral acceleration (
Sa) values that are used as the basis for design. However, the collapse of buildings during past earthquakes around the world has raised questions regarding the effectiveness of seismic provisions to prevent a partial or total collapse. Challenges associated with our ability to reliably estimate and predict building collapse have driven numerous studies to better evaluate and mitigate the collapse potential of buildings [
1,
2,
3,
4,
5,
6,
7,
8,
9,
10,
11,
12,
13]. Seismic criteria documents such as ASCE 7 (Minimum Design Loads for Buildings and Other Structures) [
14] and the AISC (American Institute of Steel Construction) Seismic Provisions [
15] for steel structures are continuously updated to address these challenges.
Editions of ASCE 7 prior to 2010 utilized hazard-based Sa values corresponding to a 2% probability of exceedance in 50 years as the basis for seismic design (i.e., MCE—Maximum Considered Earthquake). However, designs based on these Sa values did not provide a uniform probability of collapse for structures located in different regions of the United States, i.e., the seismic collapse risk was inconsistent and region-dependent. Conceptually, a uniform probability of collapse would be obtained if one assumed that the variability in the collapse capacity and the uncertainty in the site-specific ground motion hazard curve were negligible. In this context, the term collapse capacity refers to the ground motion intensity (i.e., spectral acceleration at the fundamental period of the structure) at which the system approaches the limit state of collapse. The collapse capacity will normally depend on other characteristics of the entire waveform of the ground motion (the acceleration time history) too. The fact that the waveform is uncertain means the corresponding spectral acceleration that the structure can resist without collapsing is also uncertain. This variability is referred to as aleatory. Furthermore, the collapse capacity will also depend on the level of conservatism of the design, the construction details of the structure, and other structural characteristics that are influenced by subjective design decisions. This uncertainty is referred to as epistemic uncertainty.
If the variability in collapse capacity is ignored, the collapse capacity becomes equal to the hazard-based
Sa for which the structure is designed. Therefore, the collapse fragility of the structure would resemble a step function of the type shown in
Figure 1a. The term
collapse fragility refers to the probability of collapse conditioned on
Sa at the fundamental period of the structure. This approach implies that when a structure is designed based on the MCE ground motion and the uncertainty in the site-specific ground motion hazard is ignored, the structure would be expected to have a 2% probability of collapse in 50 years, which is identical to the hazard associated with the MCE ground motion. It is evident that designing for uniform-hazard ground motions does not result in structures with uniform collapse probability when it is recognized that there is uncertainty in collapse capacity [
16].
Figure 1.
(a) Collapse fragility based on ASCE 7-05 ignoring the uncertainty in collapse capacity; (b) Modified collapse fragility based on ASCE 7-10.
Figure 1.
(a) Collapse fragility based on ASCE 7-05 ignoring the uncertainty in collapse capacity; (b) Modified collapse fragility based on ASCE 7-10.
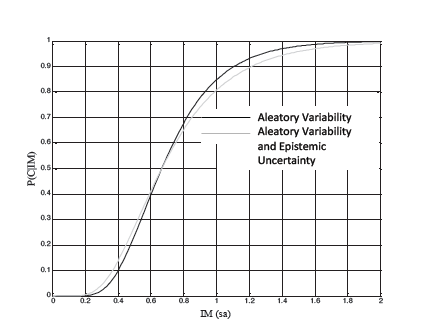
The 2010 edition of ASCE 7 introduces risk-targeted spectral acceleration values as the basis for the estimation of seismic design loads. The main goal is to achieve a uniform probability of collapse throughout the United States. A study was conducted with several archetypical code-compliant lateral systems to determine the probability of collapse of these systems. Based on this numerical study, an average probability of collapse was found to be roughly 1% in 50 years for most typical structures (non-essential facilities) across the United States. In addition, at the MCE level (2% probability of exceedance in 50 years), the average probability of collapse given the ground motion intensity was approximately 10%. Standard/generic collapse fragilities were developed across the United States via an iterative back calculation so that a target probability of collapse of 1% in 50 years was approximately obtained when combined with site-specific ground motion hazard curves for all locations in the country. These collapse fragilities now account for the variability in collapse capacity via a lognormal distribution as seen in
Figure 1b. This iterative process produced collapse fragility curves in which
Sa values with a probability collapse of 10% were denoted as risk-targeted MCE values or MCE
R. Thus, these risk-targeted spectral accelerations are different from the hazard-based
Sa values (MCE) used in previous editions of ASCE 7. The work by Luco
et al. [
16] provides a comprehensive summary of the fundamentals behind changes to seismic design maps to incorporate risk-targeted ground motions.
The main goal of this study is to evaluate whether the design of a typical steel moment-frame structure based on risk-targeted spectral accelerations fulfills the target design collapse risk level of 1% probability of collapse in 50 years for a location in Century City, CA, USA. In addition, this study provides insight into the quantification and understanding of the collapse potential of a tall steel structure designed based on the most current U.S. seismic code provisions. Careful consideration is given to critical issues such as structural modeling and ground motion selection to reasonably quantify the collapse potential of the structural system.
2. Design and Modeling of a 20-Story Steel Moment Resisting Frame
2.1. Seismic Design
The case-study structure under consideration consists of a 20-story steel moment resisting frame (SMRF) structure located in Century City, CA, USA (34.056°−118.417°) with MCE
R spectral response acceleration at short periods,
Ss, and at 1 s period,
S1, equal to 2.22 g and 0.82 g, respectively, based on ASCE 7-10. The structure is an office building with a SMRF chosen as the structural system because this lateral-load resisting system is common in seismic-prone areas. The structure is designed according to Load and Resistance Factor Design (LRFD) based on ASCE/SEI 7-10 [
14], ANSI/AISC 341-10 [
15], and ANSI/AISC 360-10 [
17]. The value of the response modification coefficient, R, for special steel special moment frames was considered as 8 and the deflection amplification factor,
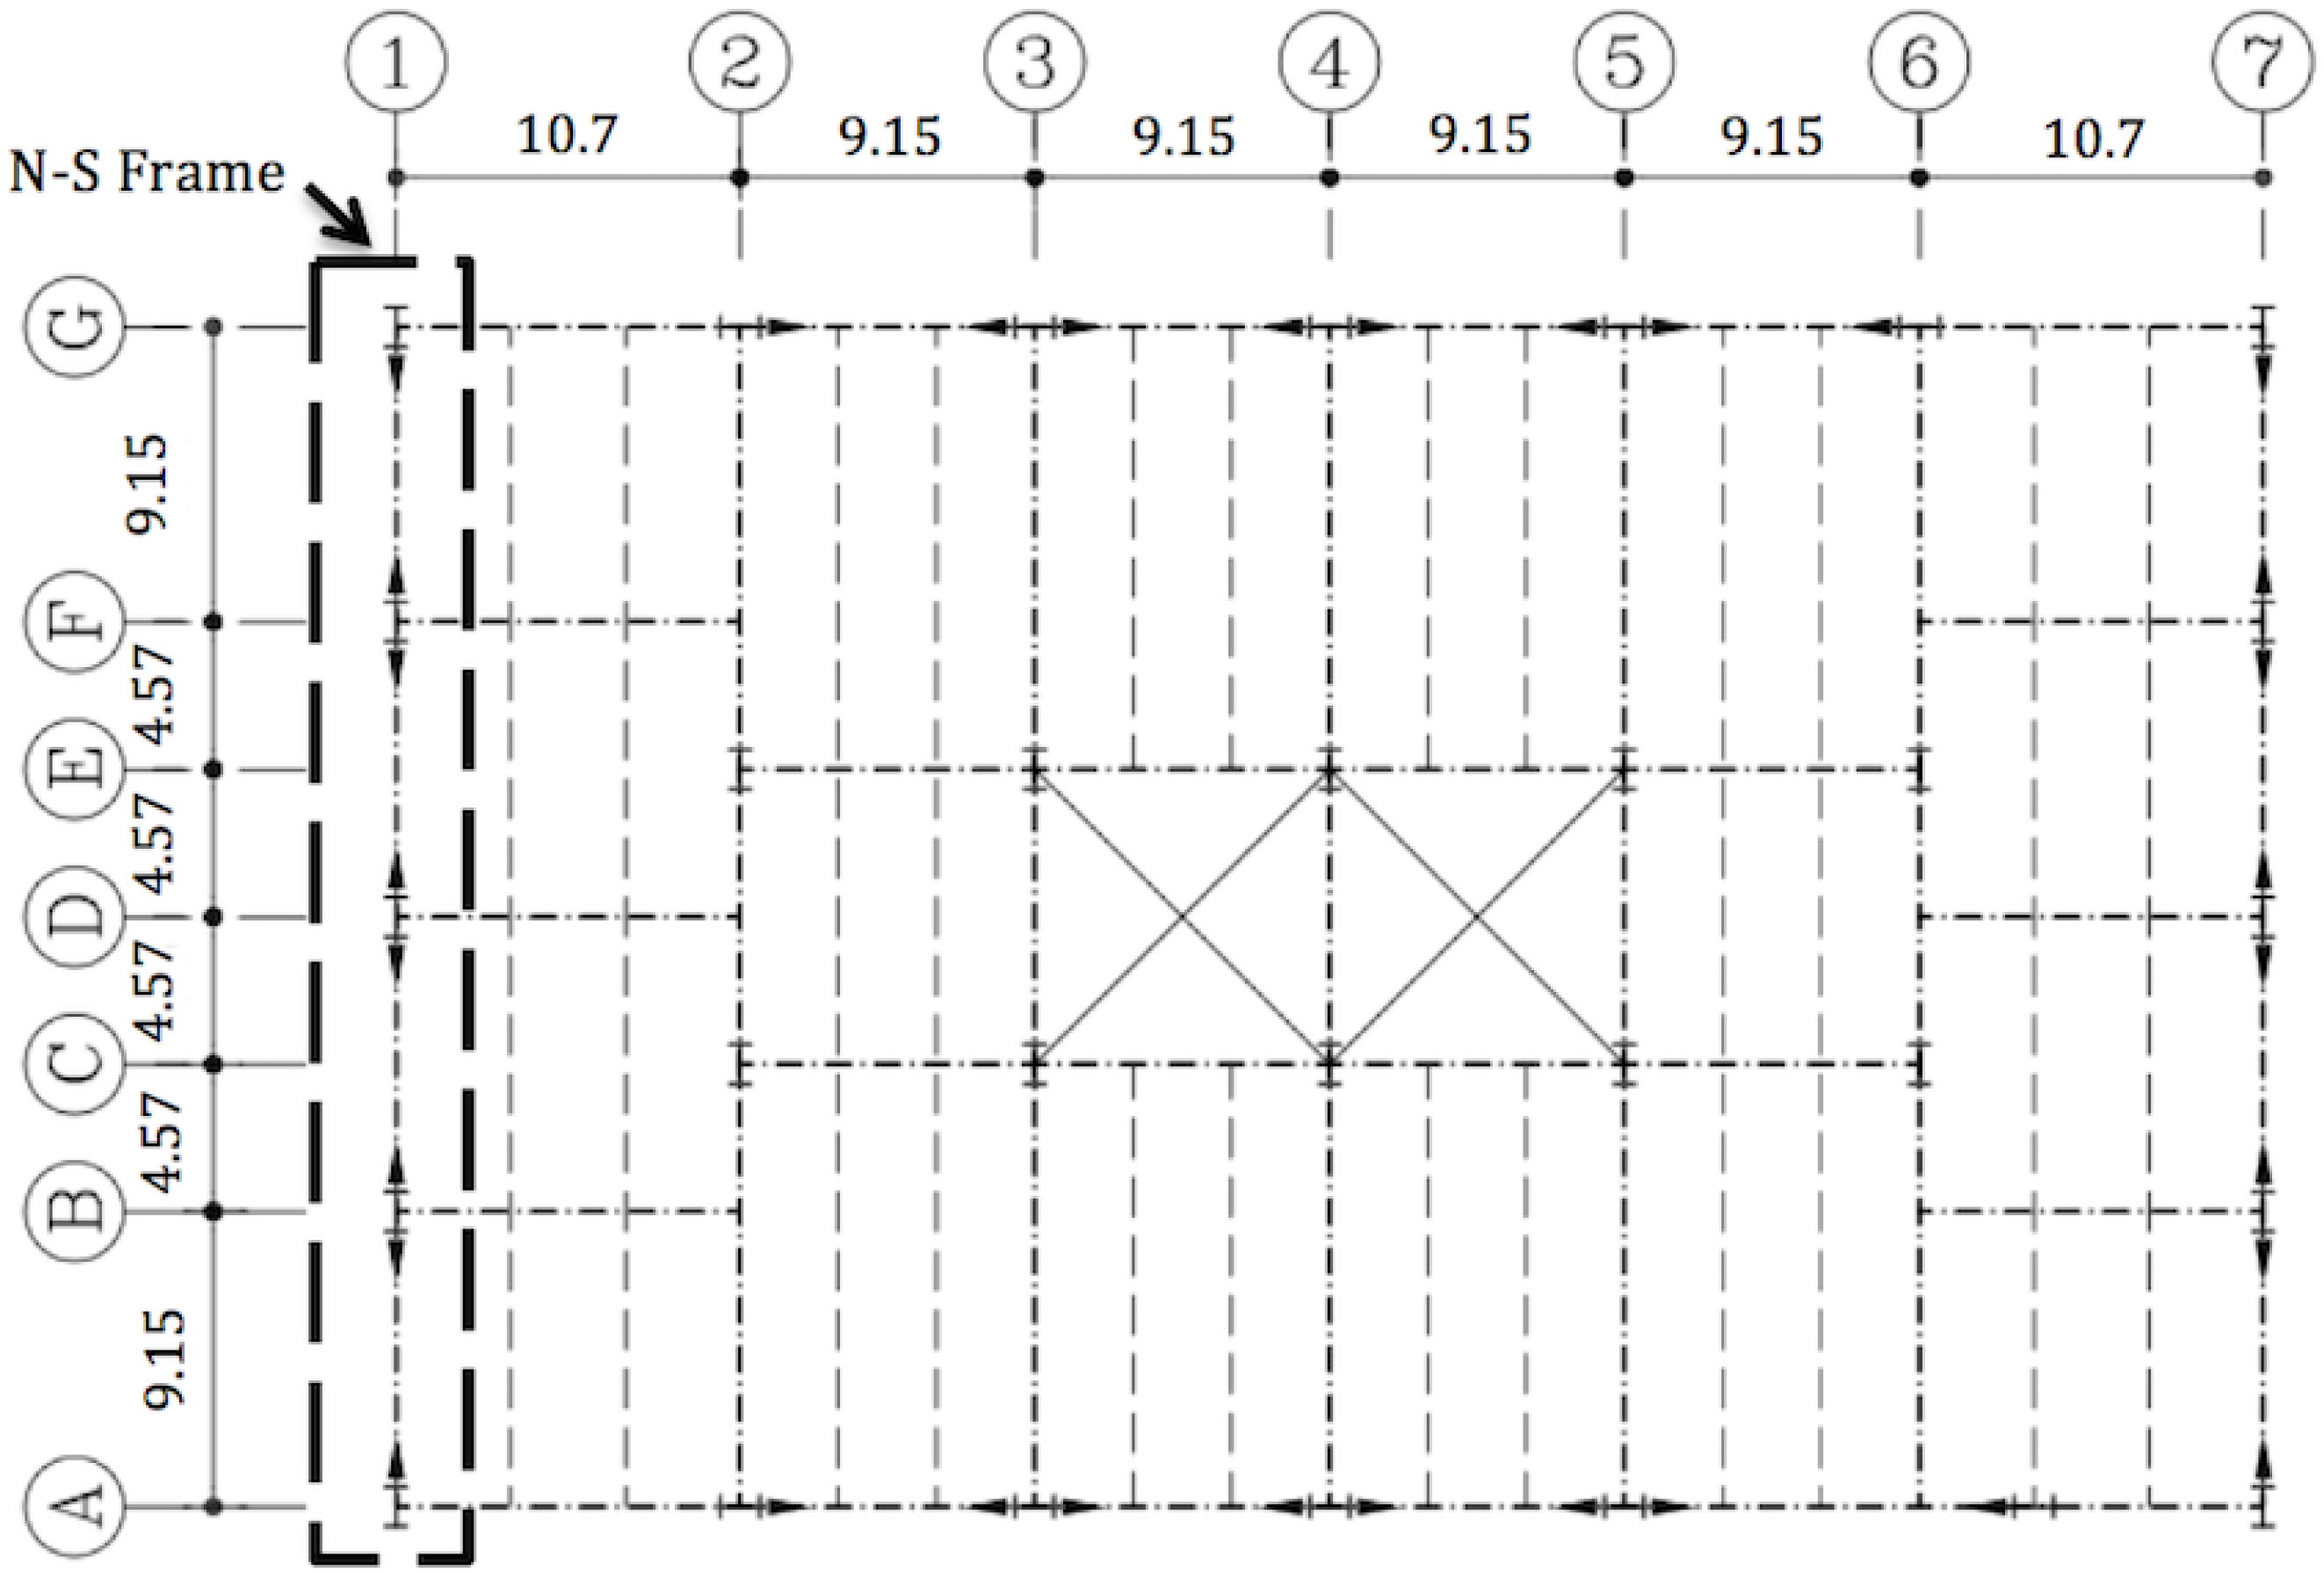
Cd, as 5.5. The allowable story drift was in this case equal to 0.02. The modal response spectrum analysis procedure including second order P-delta effects was used for the design. The lateral-load resisting system in both directions corresponds to a pair of SMRF with reduced beam sections (RBS). Building plans for mid-rise structures located in Century City, CA, USA were reviewed and used to generate a design consistent with current practice in the area. The same floor plan is used at all levels as portrayed in
Figure 2. Typical floor live load values of 2.39 kN/m
2 (50 psf), 0.72 kN/m
2 (15 psf), 0.96 kN/m
2 (20 psf), were used as office, partition and roof live loads, respectively. The corridor, library/file rooms, and restrooms were considered with a 4.79 kN/m
2 (100 psf) live load. The N-S moment resisting frame was selected for the current study and is shown in
Figure 3.
Figure 2.
Typical floor plan (in meters).
Figure 2.
Typical floor plan (in meters).
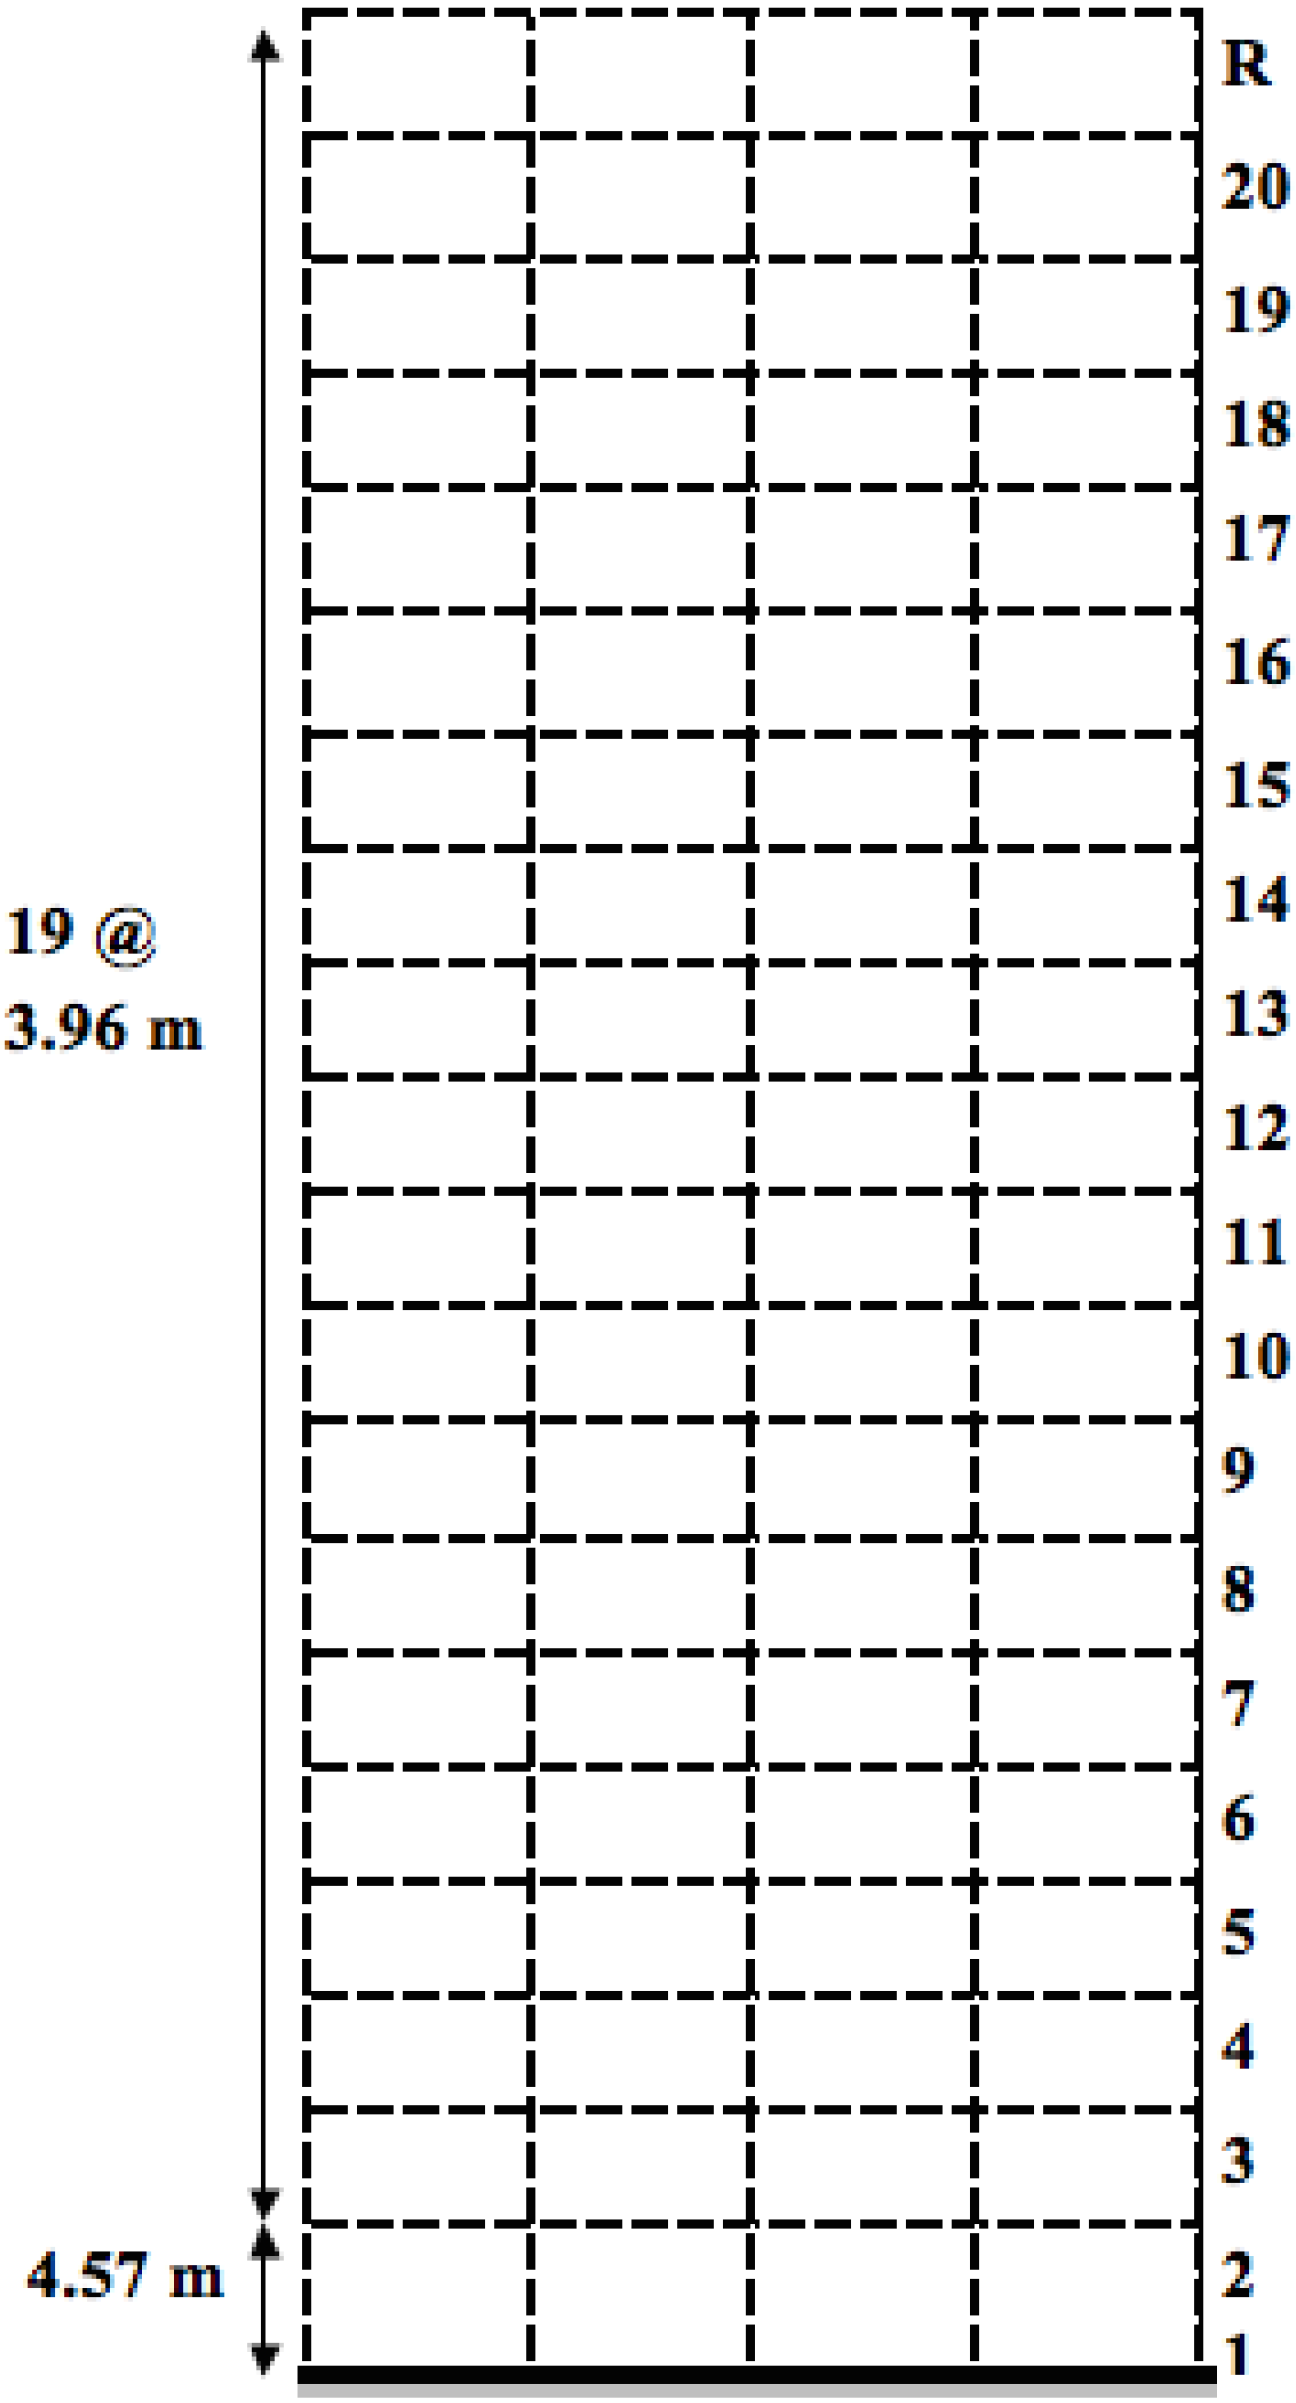
The first-story height is 4.57 m (15 ft) and all other story heights are 3.96 m (13 ft) for a total building height of 79.8 m (262 ft). There are four bays each with a width of 9.15 m (30 ft). The sections used in the design are displayed in
Table 1. The columns are considered fixed at the base. The columns are spliced above the 3rd, 5th, 7th, 9th, 11th, 13th, 15th, 17th, and 19th floor. The splices in the building are 1.22 m (4 ft) from the top of the girder. All columns are designed as W36 sections. Typically, W14 sections are used for corner/exterior steel columns in SMRF in the United States because of their ability to stack on top of one another and their significant plastic rotation capacity. However, there is an increasing trend by architects toward using corner/exterior column sections consistent with the sizes used for interior columns. In addition, limited information is available on the plastic rotation capacity and seismic behavior to collapse of W36 sections, which was another consideration for using this section in the design. This design was used as part of a larger study on the collapse potential of SMRFs designed with deep steel wide flange sections for columns.
Figure 3.
N-S frame elevation (vertical dimensions in meters).
Figure 3.
N-S frame elevation (vertical dimensions in meters).
Table 1.
W-sections of N-S frame.
Table 1.
W-sections of N-S frame.
| Floor | Story | Girders | Interior columns | Exterior columns | Seismically effective weight (kN) |
|---|
| R | 20 | W24X94 | W36X231 | W36X231 | 7340 |
| 20 | 19 | W24X103 | W36X231 | W36X231 | 8834 |
| 19 | 18 | W30X148 | W36X231 | W36X231 | 8950 |
| 18 | 17 | W30X148 | W36X231 | W36X231 | 8950 |
| 17 | 16 | W36X182 | W36X247 | W36X231 | 9030 |
| 16 | 15 | W36X182 | W36X247 | W36X231 | 9038 |
| 15 | 14 | W36X194 | W36X302 | W36X262 | 9118 |
| 14 | 13 | W36X194 | W36X302 | W36X262 | 9128 |
| 13 | 12 | W36X232 | W36X330 | W36X302 | 9244 |
| 12 | 11 | W36X232 | W36X330 | W36X302 | 9252 |
| 11 | 10 | W36X256 | W36X395 | W36X361 | 9360 |
| 10 | 9 | W36X256 | W36X395 | W36X361 | 9376 |
| 9 | 8 | W36X256 | W36X395 | W36X395 | 9448 |
| 8 | 7 | W36X256 | W36X395 | W36X395 | 9456 |
| 7 | 6 | W36X262 | W36X441 | W36X487 | 9536 |
| 6 | 5 | W36X262 | W36X441 | W36X487 | 9546 |
| 5 | 4 | W36X282 | W36X487 | W36X529 | 9634 |
| 4 | 3 | W36X282 | W36X487 | W36X529 | 9652 |
| 3 | 2 | W36X282 | W36X487 | W36X652 | 9688 |
| 2 | 1 | W36X282 | W36X487 | W36X652 | 9812 |
2.2. Numerical Modeling
The N-S frame of the 20-story SMRF structure was modeled using the Open System for Earthquake Engineering Simulation platform, OpenSees 2.4.0 (Pacific Earthquake Engineering Research Center, Berkeley, CA, USA) [
18]. Beams and columns were modeled as elastic elements with inelastic rotational springs at their ends. A modulus of elasticity of 200 GPa (29,000 ksi) and yield strength of 345 MPa (55 ksi) were used. The bi-linear spring hysteretic response was based on the modified Ibarra-Medina-Krawinkler (IMK) deterioration model [
4,
5]. This model incorporates relevant strength and stiffness deterioration parameters for structural response characterization as the building approaches collapse. For beams, nonlinear springs were added at the location of the reduced beam sections (RBS). An analytical modeling approach based on studies by Zareian and Medina [
19] for implementing Rayleigh-type damping in structures was used. 5% modal damping ratio was assigned to the first and fifth modes (
i.e., five modes were required for a cumulative mass of 95% of the total mass). Panel zones were modeled with eight elastic link elements and one rotational spring to represent the strength and stiffness of the panel zone. A pinned leaning column with gravity loads was linked with rigid beams to simulate P-delta effects.
2.2.1. Modeling Cyclic Deterioration
Modeling monotonic and cyclic deterioration is a critical component of reliable seismic collapse prediction. Seismic collapse assessment requires analytical models that can capture component deterioration in strength and stiffness. As discussed before, the modified IMK model is used herein for this purpose.
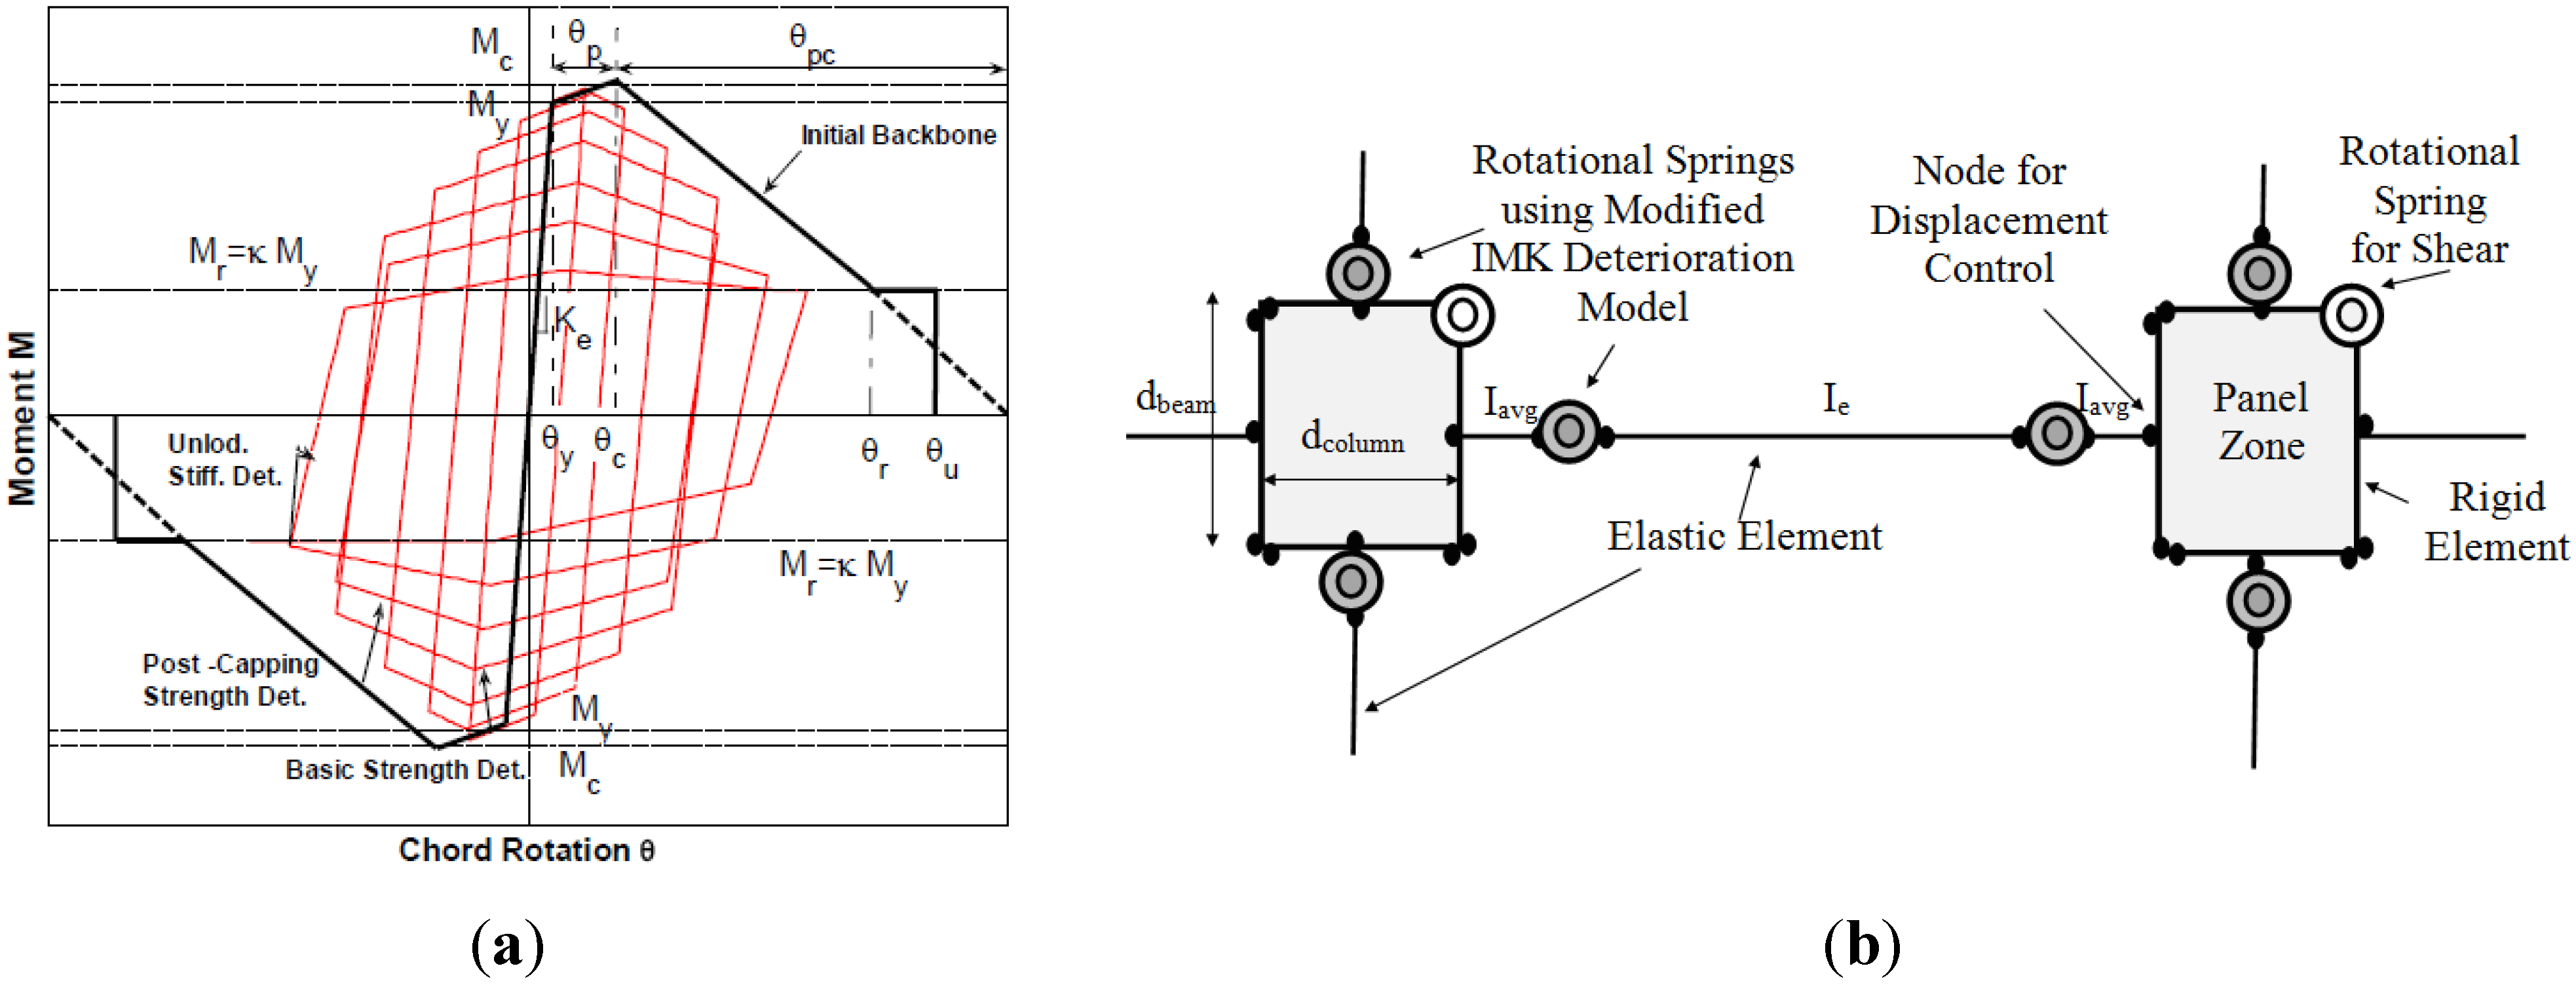
Figure 4a shows the backbone curve of the modified IMK model in the moment-rotation domain. The cyclic response in grey portrays that strength and stiffness deteriorate with amplitude and the number of cycles. Rotational springs using the IMK model are incorporated into this model as seen in
Figure 4b.
In order to calibrate and validate a deterioration model such as the IMK, a large set of experimental data is required. A study by Lignos and Krawinkler [
20] created a steel database of over 300 specimens whose experimental responses were used to validate and improve the IMK model for collapse assessment. Statistical evaluations conducted by Lignos and Krawinkler with this data set were used to develop empirical equations that predict the various deterioration modeling parameters: plastic rotational capacity, θ
p, post capping rotational capacity, θ
pc, and cyclic deterioration parameter, Λ, of steel W sections with and without RBS (see
Figure 4a). It can be seen that the backbone curve can be divided into elastic, post-yielding pre-capping (θ
p), and post capping regions (θ
pc). The cyclic deterioration parameter is based on a reference energy dissipation capacity of the defined W section in the form of Λ·
My·θ
y, where
My and θ
y are the estimated yield moment and yield rotation, respectively, and Λ is a scalar that that is used to quantify the total energy dissipation capacity of the component as a multiple of the product
My·θ
y. The monotonic and cyclic deterioration modeling parameters for beam and column nonlinear springs are shown in
Figure 4. These parameters were estimated using regression equations developed by Lignos and Krawinkler [
20] based on experimental results included in their steel database for component deterioration. A detailed list of all modeling parameters and their respective values is included in Mathiasson [
21].
Figure 4.
(
a) Modified Ibarra-Medina-Krawinkler (IMK) model (after [
20], Copyright 2010 John Wiley & Sons, Ltd., USA ); and (
b) Rotational springs used in the structural model.
Figure 4.
(
a) Modified Ibarra-Medina-Krawinkler (IMK) model (after [
20], Copyright 2010 John Wiley & Sons, Ltd., USA ); and (
b) Rotational springs used in the structural model.
2.2.2. Reduction in Column Rotational Spring Capacity
A study by Newell and Uang [
22] demonstrated that heavy W14 sections have a large plastic rotation capacity and that reduced bending strength in the presence of an axial load is well represented by the column P-M interaction equations in AISC/ANSI 360-05 [
23]. However, experimental data on the plastic hinging of deep wide-flange steel columns with high axial loads are scarce. Until more tests on columns become available, the equations from Lignos and Krawinkler [
20], which are primarily based on beam elements, constitute important resources for modeling deep column sections. To account for the effect of axial force on column bending strength, the bending moment capacity in the columns springs obtained using the Lignos and Krawinkler relationships was reduced in accordance with the AISC P-M interaction equations and Federal Emergency Management Agency Publication 695 (FEMA P695) [
24]. This document recommends accounting for the effect of axial force on column bending strength at a representative axial force level taken as:
where
Pgrav is the factored gravity axial load (1.05
D + 0.25
L; where
D and
L are the design dead and live loads, respectively) and
PE,max is the maximum axial load experienced by the column during a nonlinear static (pushover) analysis. This implies that although the variation of axial loads during response history analyses is quantified, the effect of this variation on the bending moment capacity of column springs is not included.
2.2.3. Structure P-Delta Effect
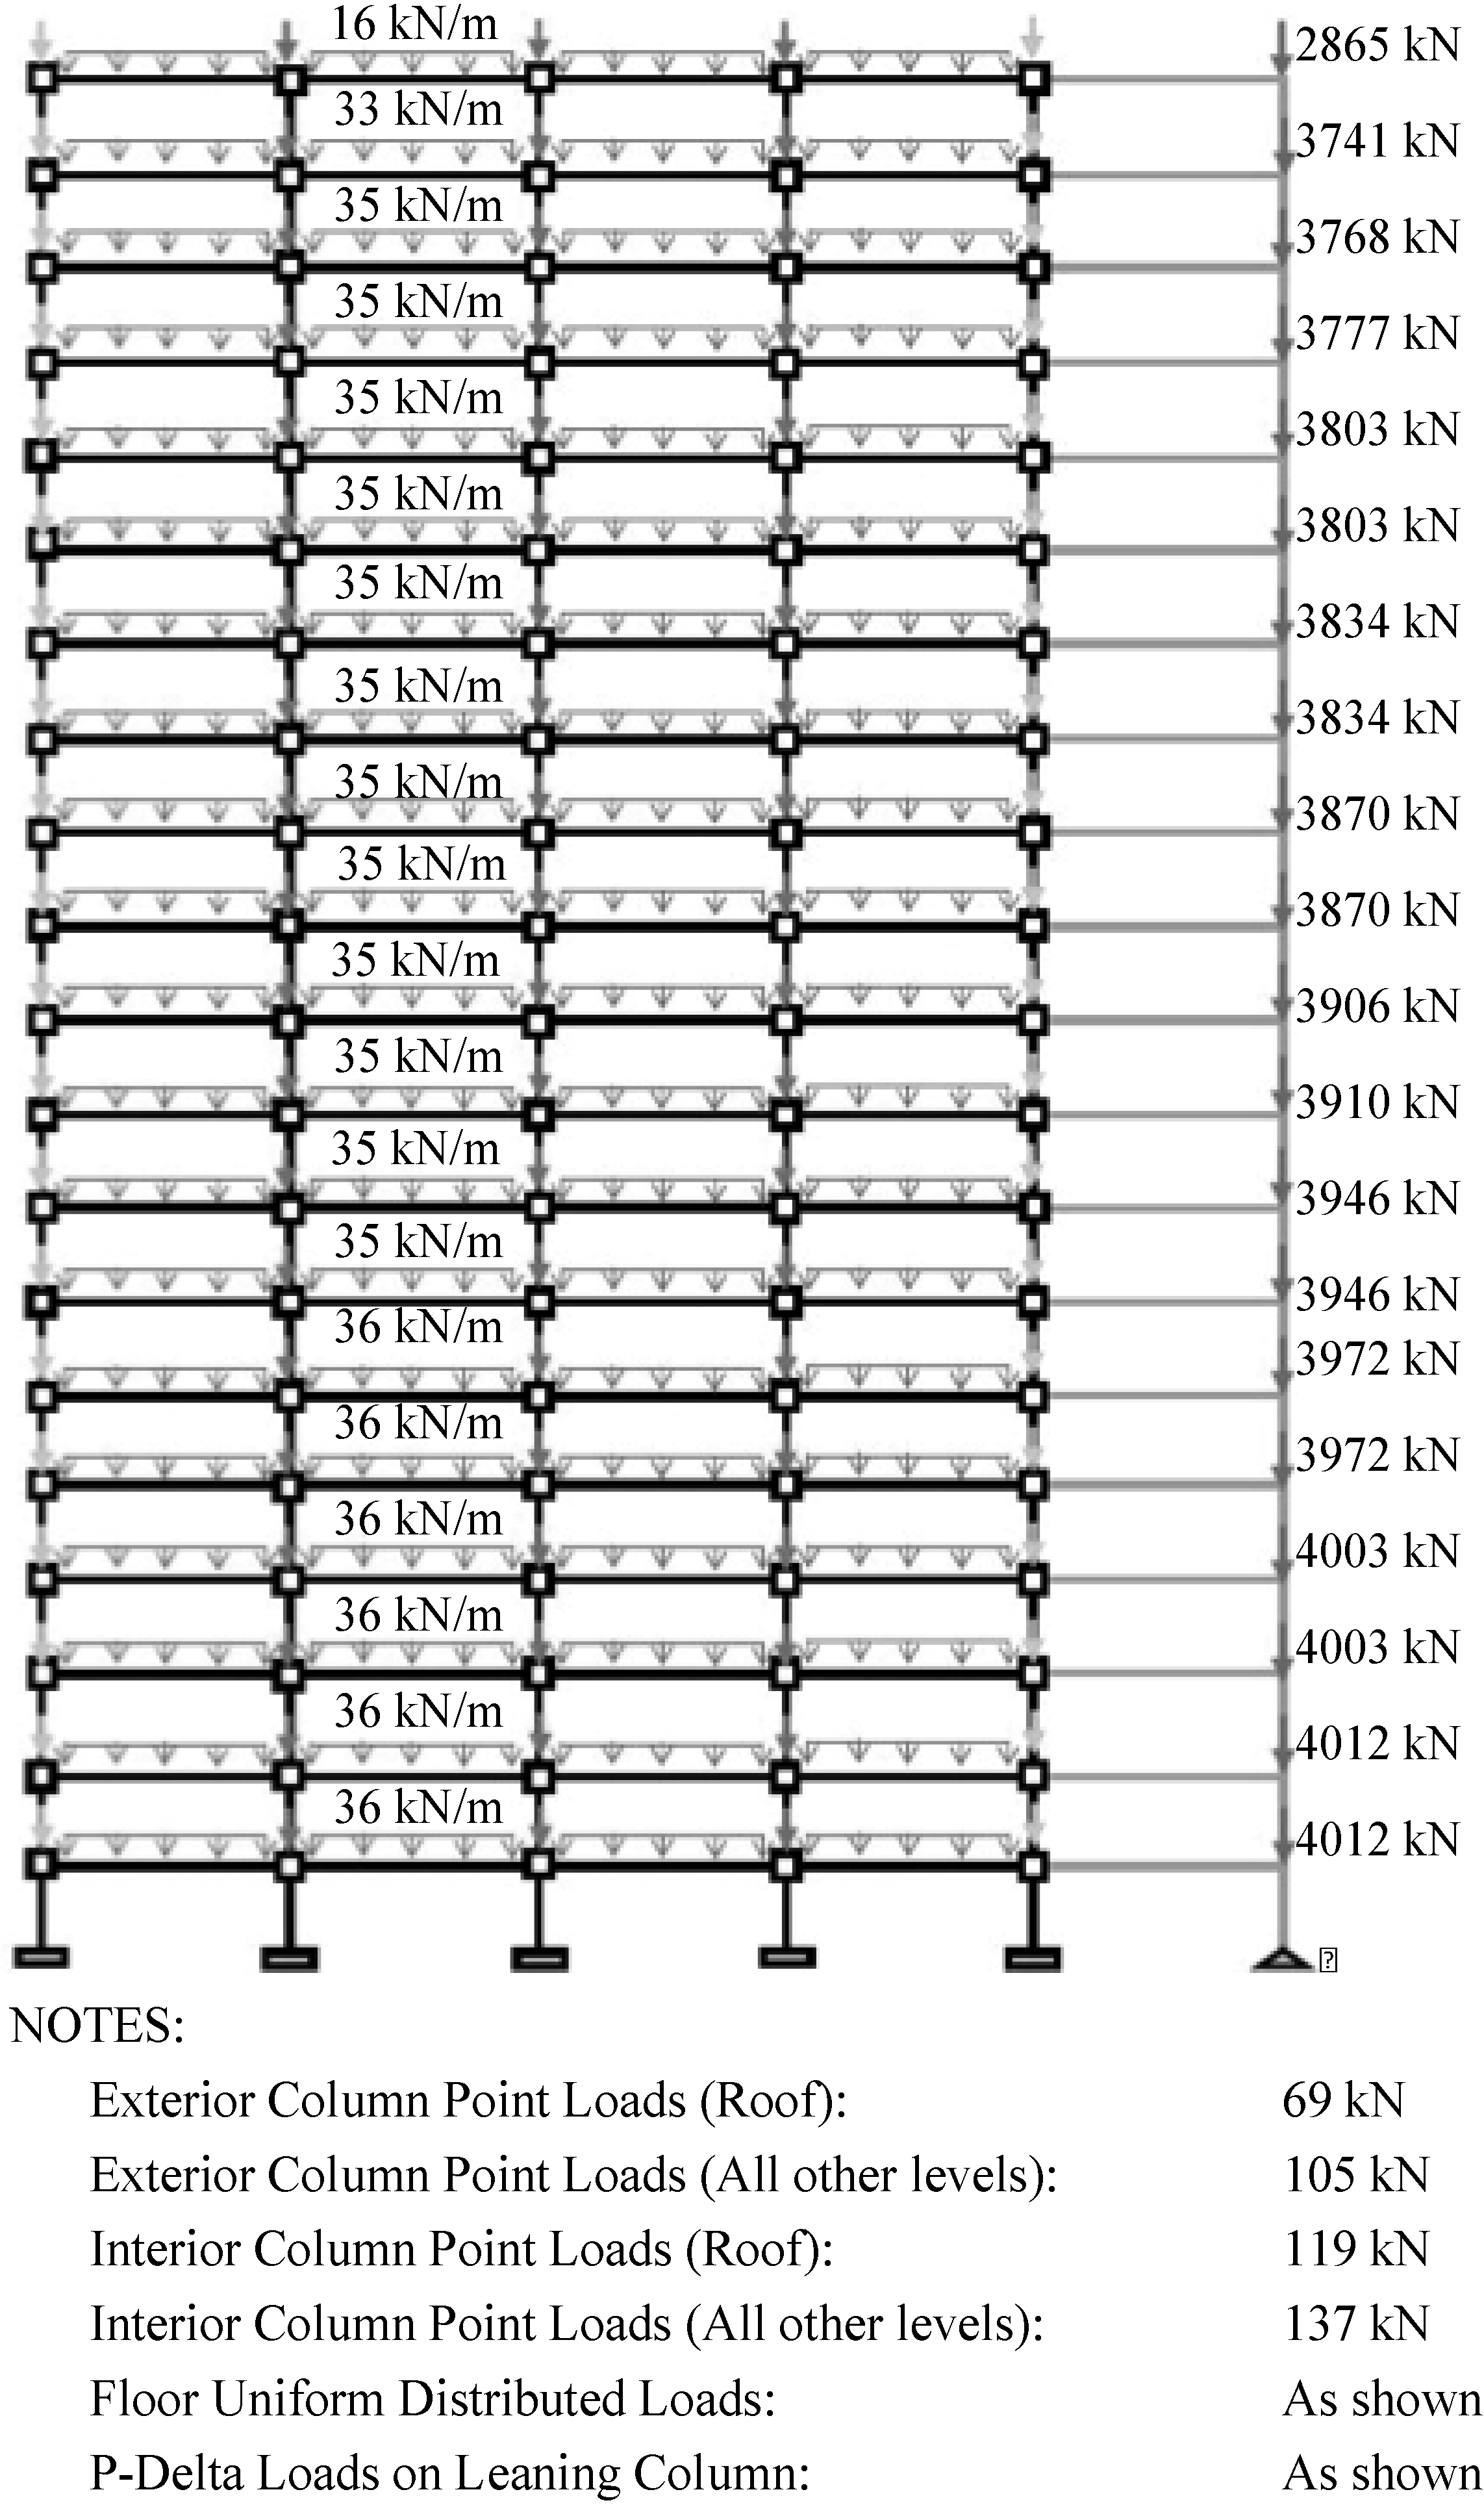
The two-dimensional numerical model of the 20-story SMRF takes into account only one perimeter frame and does not explicitly consider the interior frames. However, the structure P-delta effects caused by the vertical loads tributary to the interior frames cannot be ignored.
Therefore, structure P-delta was modeled via a leaning column that is pinned at the base and connected to the frame at floor levels using axially rigid links. The gravity load for analysis (including those applied to the leaning column) was based on the following load combination: 1.05
D + 0.25
L. The application of gravity loads to the model of the frame is shown in
Figure 5.
Figure 5.
Application of gravity loads to model of frame.
Figure 5.
Application of gravity loads to model of frame.
3. Modal and Nonlinear Static Analysis of 20-Story Steel Moment Resisting Frame Structure
3.1. Modal Analysis
An eigenvalue analysis was performed to determine the modal periods and the mode shapes of the structure. The first five modal periods were: 2.96, 1.08, 0.63, 0.43, and 0.31 s.
3.2. Nonlinear Static Analysis
A nonlinear static (pushover) analysis was conducted using a lateral load pattern corresponding to a FEMA P-750 [
25] distribution with
k = 2.
Figure 6a shows the normalized base shear (base shear divided by the structure’s seismic weight)
versus roof drift ratio (lateral roof displacement divided by the total height) of the structure's response. A small strength plateau is shown after yielding followed by a steep negative slope that is primarily a result of the P-delta effect. Global yielding occurs at a roof drift ratio of approximately 0.7%, which is relatively small when compared to a typical value of 1% observed for SMRF designed based on previous editions of ASCE 7. Moreover, the overstrength factor is estimated as 4.3 (normalized base shear/normalized design base shear = 0.13/0.03 = 4.3). This structure’s increased stiffness and overstrength with respect to that of similar frames designed based on previous editions of ASCE 7 can be explained by accounting for some of the changes included in the latest editions of ASCE 7 and AISC 341. For instance, in this design, story drifts based on the modal response spectrum analysis needed to be multiplied by a factor equal to 0.85(
Cs·
W)/
Vt given that the base shear from the response spectrum analysis was less than 85% of the design base shear based on the equivalent lateral load procedure. Herein, (
Cs·
W) is the design base shear and
Vt the base shear from the modal response spectrum analysis. This modification to the previous seismic provisions had the effect of increasing the stiffness of elements, especially girders, to mitigate this amplification in story drifts. Furthermore, the global strength of the building increased due to bigger member sizes needed to meet the modified strong-column/weak-girder criteria. In the new steel seismic provisions, the column plastic moment capacity needs to be reduced by the presence of a column axial load demand that incorporates the effect of global overstrength in the structural system. In the past, the column axial load demand corresponded to the design axial load demand without accounting for global overstrength.
Figure 6.
(a) Global pushover curve; (b) Deflected shapes at key points of pushover curve; and (c) Distribution of plastic hinges corresponding to deflected shape #8 shown in (b).
Figure 6.
(a) Global pushover curve; (b) Deflected shapes at key points of pushover curve; and (c) Distribution of plastic hinges corresponding to deflected shape #8 shown in (b).
The deflected shape of the frame structure at various points of the nonlinear static pushover analysis is shown in
Figure 6b. The effect of P-delta is clearly shown at roof drift ratios greater than 3.5% at which the effect of gravity loads acting on the deformed configuration of the frame produces an amplification of story drifts at the bottom of the frame. This behavior is of paramount importance when the structural system is approaching global instability in its response. At this point, story drifts are expected to concentrate at the bottom stories due to this second-order effect. Moreover, the location of plastic hinges corresponding to the last deflected shape shown in
Figure 6b demonstrates that the structure developed primarily a beam-hinge mechanism. However, yielding also occurred in some panel zones (
i.e., floors 2, 4, 6–8), and column yielding not only occurred at the base but also at the end of some columns belonging to stories 4–7. This behavior is consistent with the amplification of story drifts at the bottom seven stories toward the end of the pushover analysis (see deflected shape #8 in
Figure 6b).
4. Ground Motion Selection
Rigorous evaluation of the probability of collapse of a structural system is computationally intensive since the number of ground motions selected needs to be sufficiently large to provide reliable statistical results. In order to accomplish this objective, two different ground motion selection processes were used in this study. Ground motions records were selected from the Next Generation Attenuation (NGA) Models Ground Motion Database [
26] for (National Earthquake Hazards Reduction Program (NEHRP) site classification D (shear wave velocity between 183 and 365 m/s).
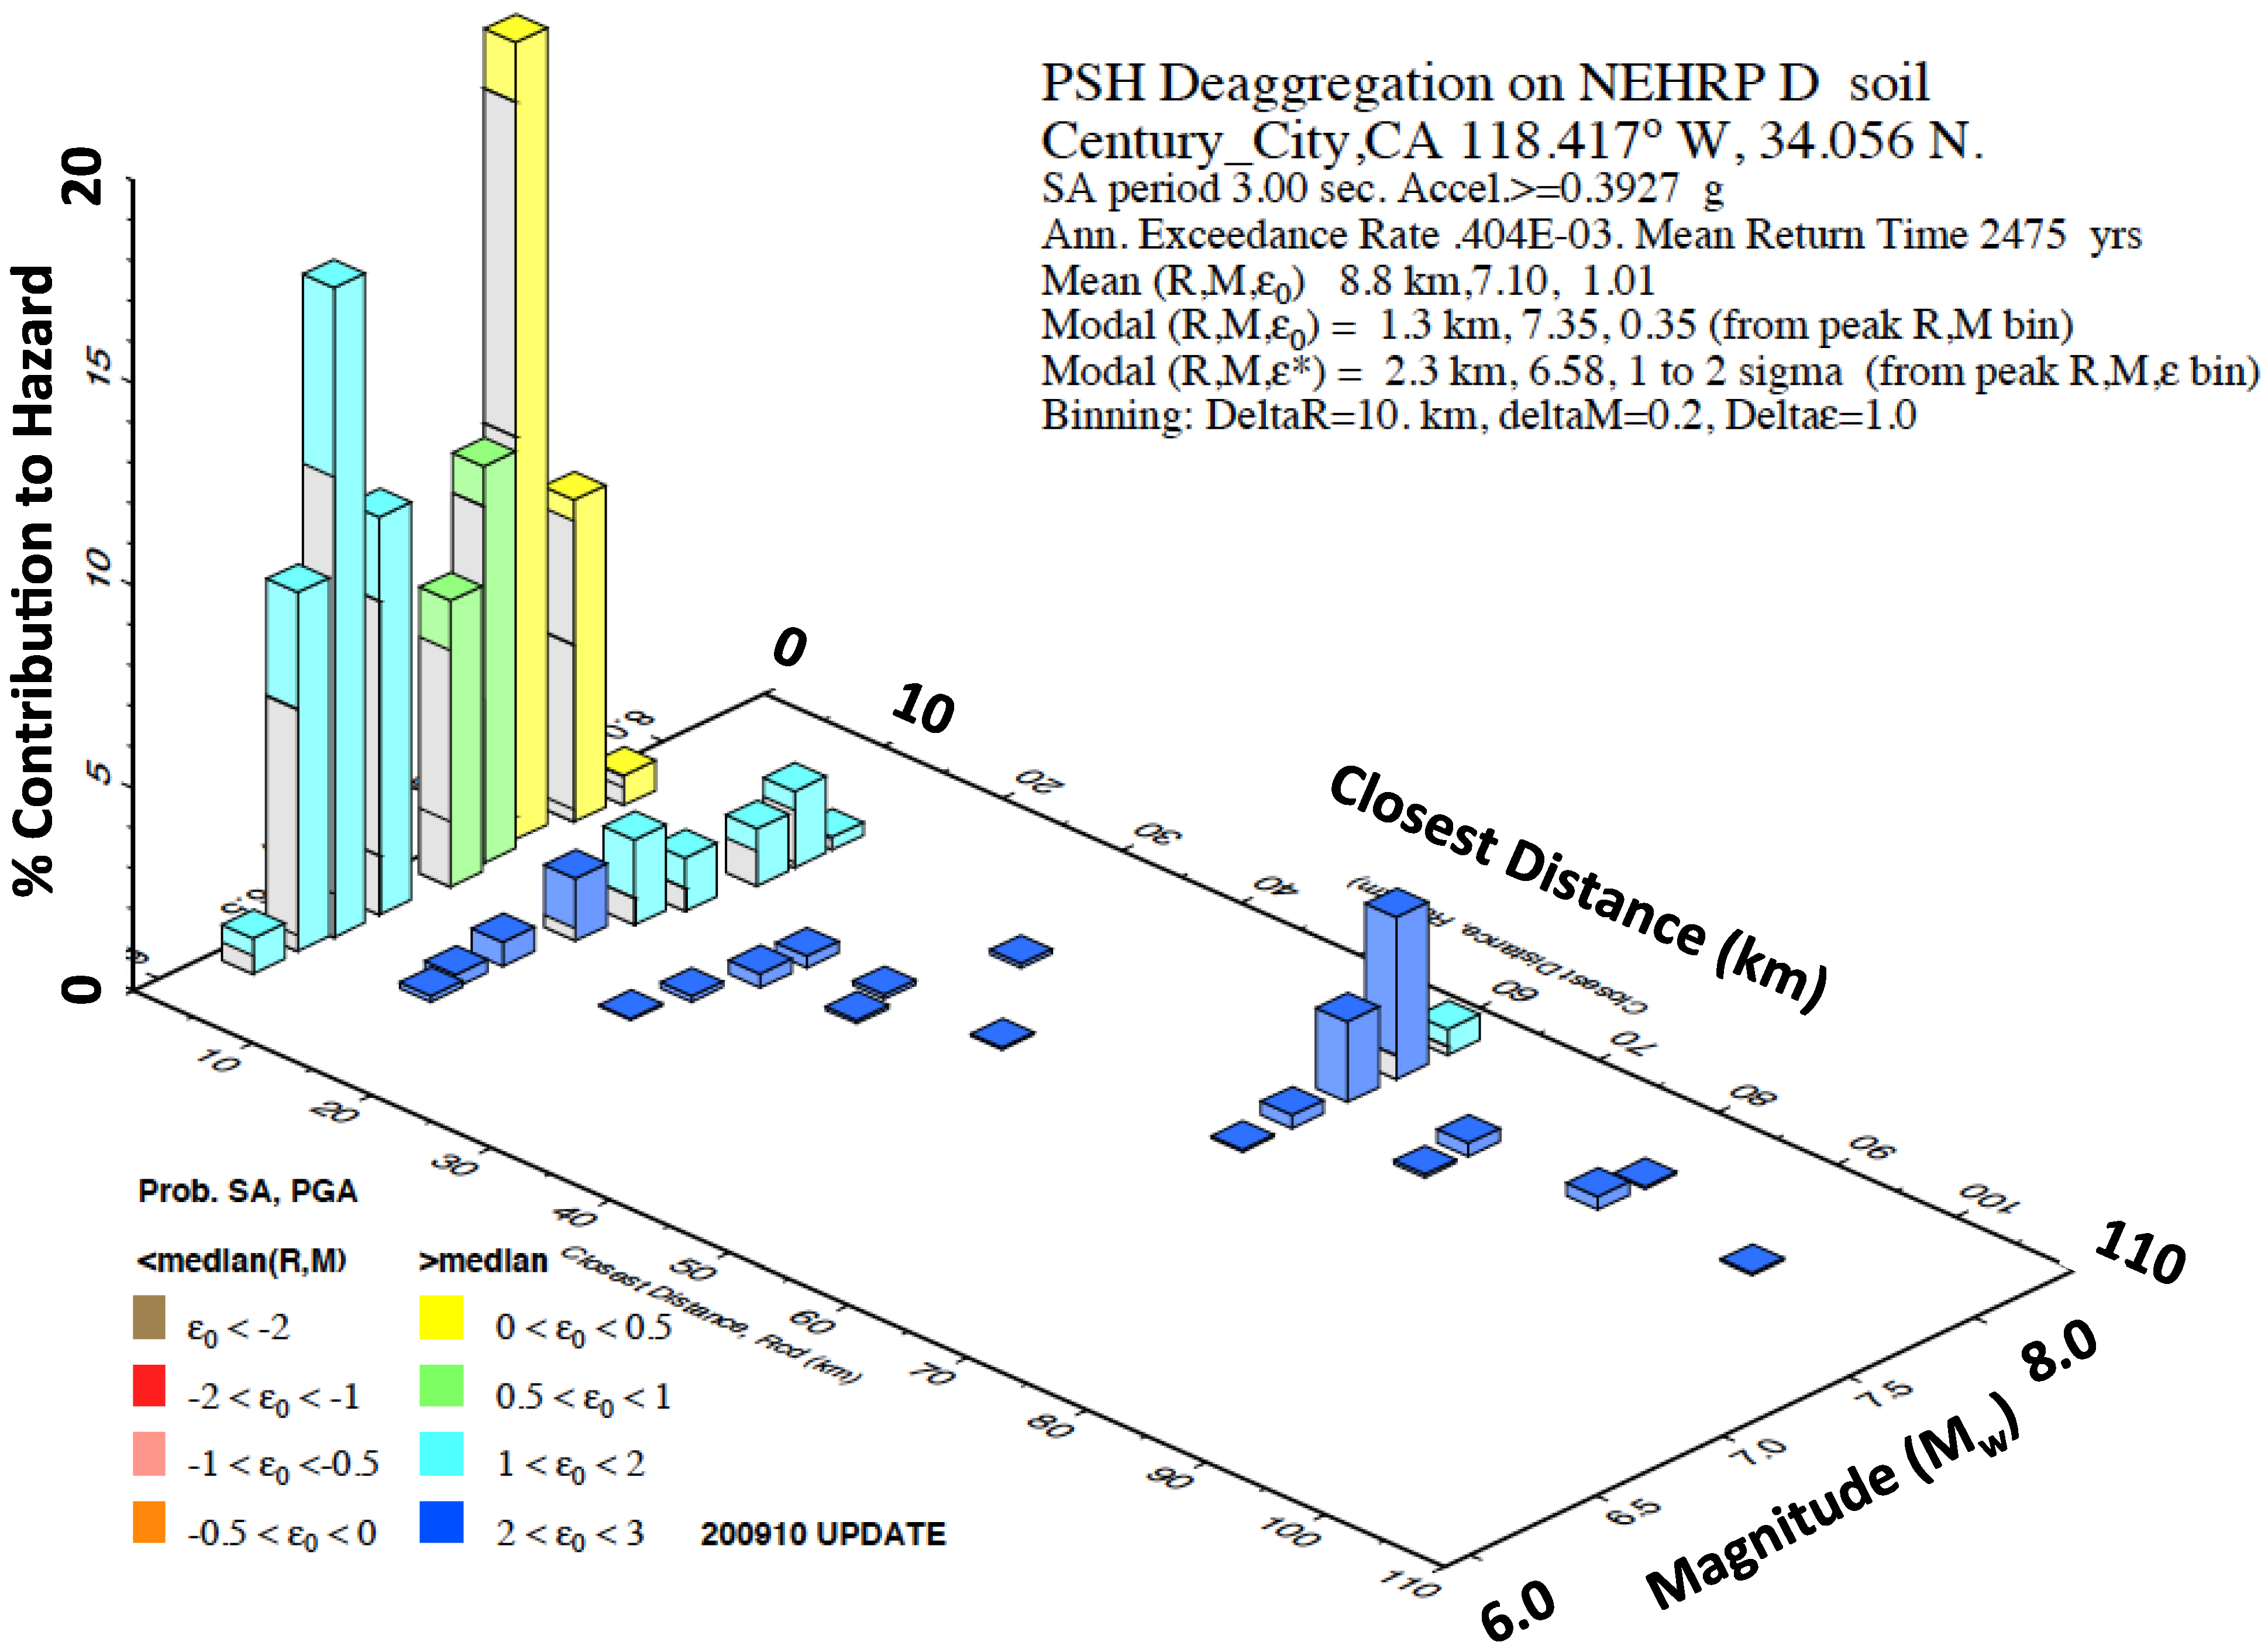
4.1. Site-Specific Seismic Hazard Deaggregation
A site-specific seismic hazard deaggregation was performed by the U.S. Geological Survey Earthquake Hazards Program [
27] for a period of 3 s in Century City, CA, USA. It is seen through the probabilistic seismic hazard deaggregation that there is not a controlling earthquake magnitude-distance bin; however, there is a controlling range (
Figure 7). The ground motion selection is based on all ground motions records, excluding dam abutments, with a magnitude range from 6.5 to 8, a closest distance to the fault rupture zone of up to 15 km, and NEHRP site classification D. These ground motion set consists of 104 acceleration records and it is denoted from here on as GMSet1. Further information on these records can be seen in Mathiasson [
21].
Figure 7.
United States Geological Survey (USGS) seismic-hazard deaggregation for Century City, CA, USA, National Earthquake Hazards Reduction Program (NEHRP) site class D,
T = 3 s [
27] (Copyright 2014 United States Geological Survey, USA).
Figure 7.
United States Geological Survey (USGS) seismic-hazard deaggregation for Century City, CA, USA, National Earthquake Hazards Reduction Program (NEHRP) site class D,
T = 3 s [
27] (Copyright 2014 United States Geological Survey, USA).
4.2. Predetermined Magnitude-Distance Range
The second ground motion selection approach did not incorporate a seismic-hazard deaggregation but was solely based on selecting ground motions from a predetermined magnitude-distance range. The selection includes all ground motions records, excluding dam abutments, with a magnitude range from 6.5 to 8, a closest distance to the fault rupture area of up to 30 km, and NEHRP site classification D. The ground motion set consists of 224 acceleration records and it is denoted from here on as GMSet2. All of the records from the first ground motion selection approach are included in this set. Further information the ground motions records can be found in Mathiasson [
21].
5. Seismic Collapse Risk Assessment
Probabilistic seismic collapse assessment requires the estimation of the mean annual frequency of collapse, which is then used to estimate the probability of collapse in 50 years. The mean annual frequency of collapse is estimated based on the convolution of a site-specific ground motion hazard curve with a collapse fragility curve from nonlinear response history analysis.
5.1. Collapse Fragility Curve
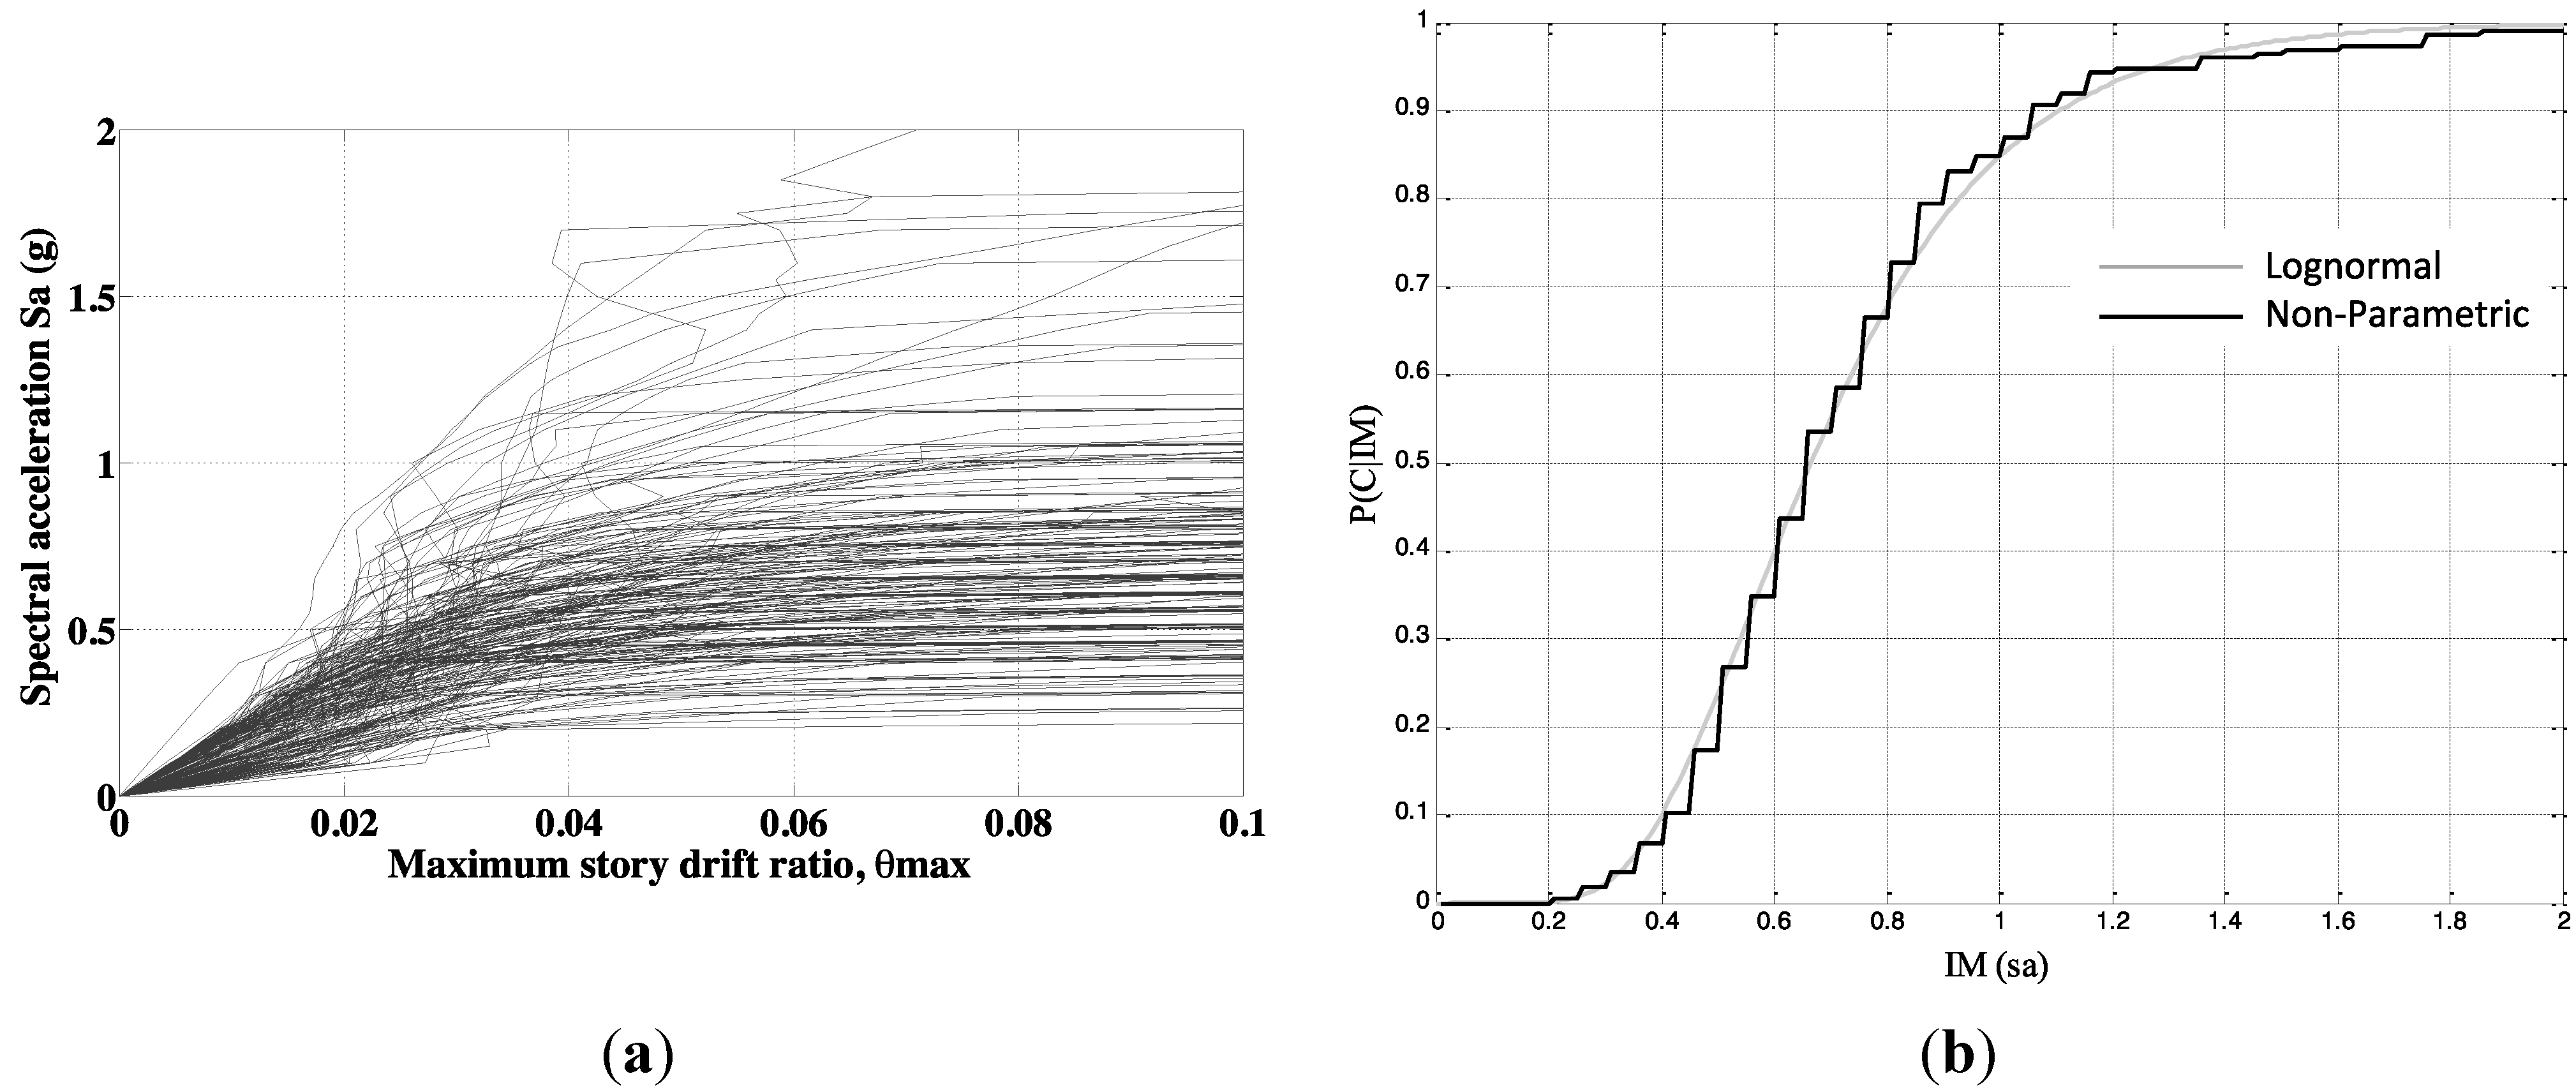
The first step in the development of the collapse fragility curve for the 20-story SMRF is the determination of the collapse capacity of the structure when exposed to an individual ground motion. Once these collapse capacities are quantified, the collapse fragility curve for the structure that accounts only for record-to-record variability can be constructed. The basic process to estimate collapse capacity in this study is an incremental dynamic analysis (IDA) of the system. In this section, this process is illustrated using the ground motions corresponding to GMSet2. Only final results are included for the ground motions of the GMSet1. IDAs of the 224 records are shown in
Figure 8a, where the largest
Sa value per ground motion corresponds to the collapse capacity. The collapse fragility curve is estimated using two approaches. The first one assumes that collapse capacities are lognormally distributed while the second one does not assign a specified probabilistic distribution to the collapse capacity. Both curves can be observed in
Figure 8b. The 20-story SMRF has a median collapse capacity
Sa of 0.65 g and a logarithmic standard deviation, β
R, of 0.40 that only considers record-to-record variability when collapse capacities are assumed to be lognormally distributed. This β
R value is consistent with the ones obtained by Eads
et al. [
8]. This collapse fragility curve was then modified to include the effect of epistemic uncertainty by specifying a β
U value of 0.25, which was selected in accordance with FEMA-351 [
28] for high-rise SMRF structures (see
Figure 9). This value resulted in a composite β of 0.47.
Figure 8.
(a) Incremental dynamic analysis (IDAs) for GMSet2; and (b) Collapse fragility curves for GMSet2.
Figure 8.
(a) Incremental dynamic analysis (IDAs) for GMSet2; and (b) Collapse fragility curves for GMSet2.
Figure 9.
Effect of epistemic uncertainty on collapse fragility curve.
Figure 9.
Effect of epistemic uncertainty on collapse fragility curve.
5.2. Mean Annual Frequency of Collapse
The mean annual frequency of collapse, λ
c, is estimated through the computed collapse fragility curve combined with the site-specific ground motion hazard curve. The process can be represented through the summation shown in the Equation (2):
where
represents the probability the structure will collapse given sa.
is the mean annual frequency of
Sa exceeding a value
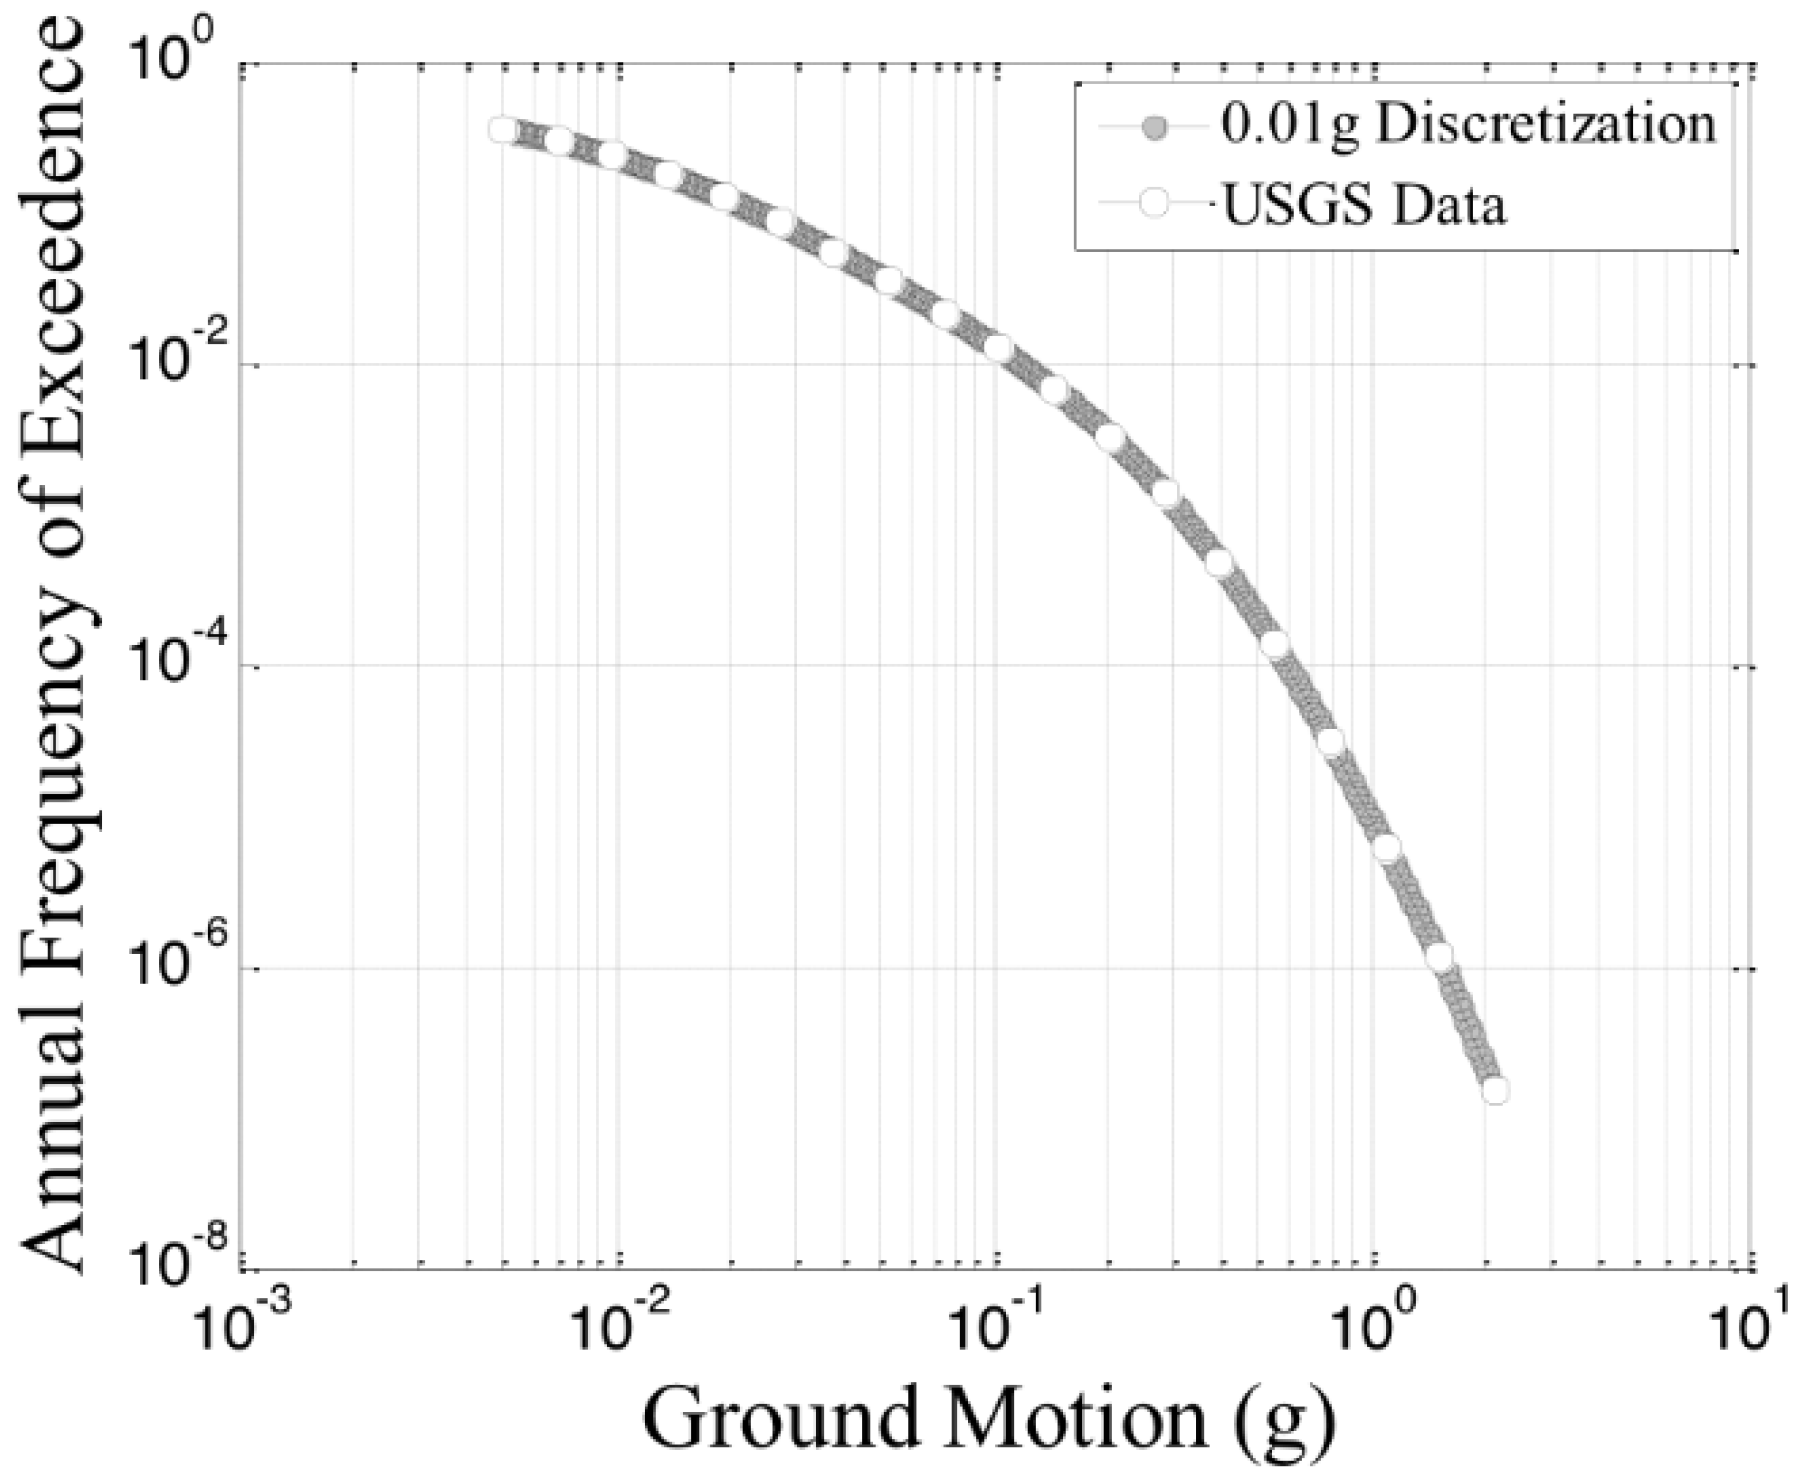
sa (ground motion hazard). The ground motion hazard curve was obtained from the USGS hazard curve web application which provides access to hazard curves generated for the 2008 National Seismic Hazard Mapping Project (NSHMP) [
27]. The ground motion hazard curve was selected at Century City, CA, USA for NEHRP site classification D and a period of 3.0 s (
Figure 10). In order to compute λ
c, the hazard curve data provided from the USGS was used along with the appropriate collapse fragility curve to evaluate Equation (2) numerically with a discretization of Δ
Sa equal to 0.01 g.
The mean annual frequencies of collapse were computed through numerical integration taking into account aleatory variability (record-to-record variability), as well as the combined aleatory variability and epistemic uncertainty of both ground motion data sets (see
Table 2).
Figure 10.
Ground motion hazard curve (mean annual frequency of exceedance of spectral acceleration value at a period of 3 s) for Century City, CA, USA.
Figure 10.
Ground motion hazard curve (mean annual frequency of exceedance of spectral acceleration value at a period of 3 s) for Century City, CA, USA.
Table 2.
Mean annual frequency of collapse (λc) values.
Table 2.
Mean annual frequency of collapse (λc) values.
| Uncertainty | GMSet1 | GMSet2 |
|---|
| Aleatory variability only | 1.61 × 10⁻⁴ | 1.79 × 10⁻⁴ |
| Aleatory var. + epistemic uncert. | 2.18 × 10⁻⁴ | 2.41 × 10⁻⁴ |
5.3. Probability of Collapse in 50 Years
The mean annual frequency of collapse, λ
c, is then used to calculate the probability of collapse using the following equation:
where
t is the number of years when at least one collapse can occur. When λ
c is small the probability of collapse is approximately equal to the mean annual frequency of collapse multiplied by
t years. The computed probabilities of collapse are shown in
Table 3.
Table 3.
Probability of collapse in 50 years.
Table 3.
Probability of collapse in 50 years.
| Uncertainty | GMSet1 | GMSet2 |
|---|
| Aleatory variability only | 0.80% | 0.89% |
| Aleatory var. + epistemic uncert. | 1.1% | 1.2% |
These values are obtained based on an assumed lognormal data fit for the fragility curve. As stated in previous sections, in order to verify the adequacy of the fit and verify the lognormal assumption, the fragility curve for both ground motions sets were recalculated without assuming lognormality,
i.e., non-parametric fragilities (see
Figure 8b for an example). When the non-parametric collapse fragility curves were used, the estimated probability of collapse value for both ground motion sets equaled 0.92%, which is within 13% of the values obtained when a lognormal distribution considering only the aleatory variability is assumed.
6. Conclusions
Seismic code criteria focuses primarily on performance targets related to collapse prevention and life safety. ASCE 7-10 introduces risk-targeted spectral acceleration values as the basis for design. For the majority of building structures, these spectral accelerations correspond to 1% probability of collapse in 50 years and are different from the hazard-based design values used in previous editions of ASCE 7. The main objective of this study are to (a) evaluate whether the design of a typical steel moment-frame structure based on risk-targeted spectral accelerations fulfills the target design collapse risk level of 1% probability of collapse in 50 years; and (b) quantify and understand the collapse potential of a tall steel structure designed based on the most current U.S. seismic code provisions.
The objectives were evaluated through an individual case study with a 20-story steel moment resisting frame structure located in Century City, CA, USA. Careful consideration was given to critical modeling issues such as damping modeling, deterioration modeling, and P-delta effects. A probabilistic seismic collapse assessment was conducted which was quantified herein in terms of the mean annual frequency of collapse, which was then used to estimate the probability of collapse in 50 years for two sets of ground motions with 224 and 104 ground motion records, respectively. A numerical integration approach was carried out to estimate the mean annual frequency of collapse assuming that collapse capacities were lognormally distributed. This assumption was confirmed to be adequate for this study with estimated probability of collapse values in 50 years within 13% of the values predicted assuming a lognormal distribution of collapse capacity. More importantly, estimates of the probability of collapse including aleatory variability and epistemic uncertainty were within 20% of the design target of 1% in 50 years.
Overall, the prescribed performance target was reasonably met through the implementation of rigorous numerical integration to estimate the probability of collapse of the system. For this individual case study, the new seismic design requirements provide a probability of collapse in 50 years reasonably close to the 1% target value. This information can provide confidence in current design requirements; however, future studies with other types of designed facilities are recommended to provide a comprehensive evaluation. These results are limited to a two-dimensional concentrated plasticity model of a single structural system exposed to a single components of ground motion with ground motion characteristics similar to those used in this study. These conclusions should be interpreted based on the assumptions for structural modeling and ground motion selection described in this paper.
Acknowledgments
This work was partially supported by the National Science Foundation as part of the Network for Earthquake Engineering Simulation (NEES) program (NSF Award CMMI-0936633), as well as by the Department of Civil Engineering at the University of New Hampshire. This financial support is gratefully acknowledged.
Author Contributions
This paper is based on Annika Mathiasson’s Master of Science Thesis at the University of New Hampshire that was developed under the academic supervision of Ricardo Medina.
Conflicts of Interest
The authors declare no conflict of interest.
References
- Villaverde, R. Methods to assess the seismic collapse capacity of building structures: State of the art. ASCE J. Struct. Eng. 2007, 133, 57–66. [Google Scholar] [CrossRef]
- Krawinkler, H. Van Nuys Hotel Building Testbed Report: Exercising Seismic Performance Assessment; PEER Report 2005/11; Pacific Earthquake Engineering Research Center: Berkeley, CA, USA, 2005. [Google Scholar]
- Krawinkler, H.; Zareian, F.; Medina, R.A.; Ibarra, L.F. Decision support for conceptual performance-based design. Earthq. Eng. Struct. Dyn. 2006, 35, 115–133. [Google Scholar] [CrossRef]
- Ibarra, L.F.; Medina, R.A.; Krawinkler, H. Hysteretic models that incorporate strength and stiffness deterioration. Earthq. Eng. Struct. Dyn. 2005, 34, 1489–1511. [Google Scholar] [CrossRef]
- Lignos, D. Sidesway Collapse of Deteriorating Structural Systems under Seismic Excitation. Ph.D. Thesis, Department of Civil and Environmental Engineering, Stanford University, Stanford, CA, USA, 2008. [Google Scholar]
- Suita, K.; Yamada, S.; Tada, M.; Kasai, K.; Matsuoka, Y.; Shimada, Y. Collapse Experiment on 4-Story Steel Moment Frame: Part 2 Detail of Collapse Behavior. In Proceedings of the 14th World Conference on Earthquake Engineering, Beijing, China, 12–17 October 2008.
- Elwood, K.J. Shake Table Tests and Analytical Studies on the Gravity Load Collapse of Reinforced Concrete Frames. Ph.D. Thesis, Department of Civil and Environmental Engineering, University of California, Berkeley, CA, USA, 2002. [Google Scholar]
- Eads, L.; Miranda, E.; Krawinkler, H.; Lignos, D. An efficient method for estimating the collapse risk of structures in seismic regions. Earthq. Eng. Struct. Dyn. 2013, 42, 25–41. [Google Scholar] [CrossRef]
- Ibarra, L.F.; Krawinkler, H. Global Collapse of Frame Structures under Seismic Excitations; The John A. Blume Earthquake Engineering Center Report No. 152; Department of Civil and Environmental Engineering, Stanford University: Stanford, CA, USA, 2005. [Google Scholar]
- Medina, R.A.; Krawinkler, H. Seismic Demands for Nondeteriorating Frame Structures and Their Dependence on Ground Motions; The John A. Blume Earthquake Engineering Center Report No. 144; Department of Civil and Environmental Engineering, Stanford University: Stanford, CA, USA, 2003. [Google Scholar]
- Giugliano, M.T.; Longo, A.; Montuori, R.; Piluso, V. Seismic reliability of traditional and innovative concentrically braced frames. Earthq. Eng. Struct. Dyn. 2011, 40, 1455–1474. [Google Scholar] [CrossRef]
- Longo, A.; Montuori, R.; Piluso, V. Seismic reliability of V-braced frames: Influence of design methodologies. Earthq. Eng. Struct. Dyn. 2009, 38, 1587–1608. [Google Scholar] [CrossRef]
- Piluso, V.; Rizzano, G.; Tolone, I. Seismic reliability assessment of a two-story steel-concrete composite frame designed according to Eurocode 8. Struct. Saf. 2009, 31, 383–395. [Google Scholar] [CrossRef]
- Minimum Design Loads for Buildings and Other Structures; ASCE 7-10; American Society of Civil Engineers: Reston, VA, USA, 2010.
- Seismic Provisions for Structural Steel Buildings; ANSI/AISC 341-10; American Institute of Steel Construction: Chicago, IL, USA, 2010.
- Luco, N.; Ellingwood, B.R.; Hamburger, R.O.; Hooper, J.D.; Kimball, J.K.; Kircher, C.A. Risk-Targeted versus Current Seismic Design Maps for the Conterminous United States. In Proceedings of the Structural Engineers Association of California 2007 Convention, Squaw Creek, CA, USA, 26–29 September 2007.
- Specification for Structural Steel Buildings; ANSI/AISC 360-10; American Institute of Steel Construction: Chicago, IL, USA, 2010.
- Open System for Earthquake Engineering Simulation (OpenSees), OpenSees Version 2.4.0; Pacific Earthquake Engineering Research Center: Berkeley, CA, USA, 2009.
- Zareian, F.; Medina, R.A. A practical method for proper modeling of structural damping in inelastic plane structural systems. Comput. Struct. 2010, 88, 45–53. [Google Scholar] [CrossRef]
- Lignos, D.; Krawinkler, H.; Whittaker, A.S. Prediction and validation of sidesway collapse of two scale models of a 4-story steel moment frame. Earthq. Eng. Struct. Dyn. 2011, 40, 807–825. [Google Scholar] [CrossRef]
- Mathiasson, A. Seismic Collapse Assessment of a 20-Story Steel Moment-Resisting Frame Structure. Master’s Thesis, Department of Civil Engineering, University of New Hampshire, Durham, NH, USA, 2013. [Google Scholar]
- Newell, J.D.; Uang, C. Cyclic behavior of steel wide-flange columns subjected to large drift. ASCE J. Struct. Eng. 2008, 134, 1334–1342. [Google Scholar] [CrossRef]
- Seismic Provisions for Structural Steel Buildings; ANSI/AISC 341-05; American Institute of Steel Construction: Chicago, IL, USA, 2005.
- Quantification of Building Seismic Performance Factors: FEMA P695; Federal Emergency Management Agency: Washington, DC, USA, 2009.
- NEHRP Recommended Seismic Provisions for New Buildings and Other Structures: FEMA P-750/2009 Edition; Federal Emergency Management Agency: Washington, DC, USA, 2009.
- Chiou, B.; Darragh, R.; Gregor, N.; Silva, W. NGA project strong-motion database. Earthq. Spectra 2008, 24, 23–44. [Google Scholar] [CrossRef]
- U.S. Geological Survey (USGS) Earthquake Hazards Program, 2013. Available online: http://earthquake.usgs.gov/hazards/ (accessed on 29 May 2014).
- Recommended Seismic Evaluation And Upgrade Criteria for Welded Steel Moment Frame Buildings; Report No. FEMA 351; Federal Emergency Management Agency: Washington, DC, USA, 2000.
© 2014 by the authors; licensee MDPI, Basel, Switzerland. This article is an open access article distributed under the terms and conditions of the Creative Commons Attribution license (http://creativecommons.org/licenses/by/4.0/).


