Article

Valuing Indoor Air Quality Benefits in a Healthcare Construction Project with Real Option Analysis

Department of Real Estate, Planning and Geoinformatics, School of Engineering, Aalto University, P.O. Box 15800, FI-00076 Aalto, Finland
*
Author to whom correspondence should be addressed.
Buildings 2014, 4(4), 785-805; https://doi.org/10.3390/buildings4040785
Submission received: 14 August 2014 / Revised: 15 October 2014 / Accepted: 16 October 2014 / Published: 24 October 2014
(This article belongs to the Special Issue The Impacts of the Building Environment on Health and Well-Being)

Abstract

:
Indoor air quality (IAQ) can produce significant economic benefits for the tenant during the use of the building. However, currently the potential economic benefits on a tenant’s employees’ health and performance are not considered in feasibility studies for IAQ investments. Here, the economic value refers to benefits that can be expressed numerically in terms of money such as cost savings and increased revenues and that which impacts the building user organization’s financial profitability. This paper is one of the first known studies to explore real option analysis (ROA) as a potential approach to evaluate the life-cycle profitability of investments in IAQ. The research is carried out as a case study, which is a healthcare construction project in Finland. The main finding of this paper is that ROA seems to provide a viable method for the evaluation of investments in IAQ. In the case study, the economic benefits of IAQ to the tenant are noticeable. The real option value of the economic benefits of better IAQ is almost 4 million euros and the real option pay-off of the IAQ investment exceeds 0.5 million euros. The results are indicative only but imply that ROA is a promising method to evaluate investments in IAQ.

Graphical Abstract

1. Introduction

Good indoor air quality (IAQ) is beneficial for human health and performance. Potential benefits of an improved IAQ include lower healthcare costs, reduced sick leaves of occupants, better performance in work, lower turnover of employees, and lower cost of building maintenance due to fewer complaints about indoor air quality. The projected financial gains of these benefits are substantial, as the most important asset and largest cost item of most organizations is the personnel. The gains can be more than 10 times greater than workplace related costs particularly in the case of efficient use of space and high value work. For example, the net financial gains associated with minor improvements in the IAQ of U.S. office buildings are estimated to have a net worth of 20 billion USD annually [1]. According to recent research [2], numerous existing technologies and procedures can improve IAQ in a manner that increases health and performance. In particular, a number of studies [1,3,4,5,6,7] suggest that increase in building ventilation rates (L/s/person) can reduce the number of occupant sick leaves; for example, according to Fisk et al. [3], doubling the ventilation rates reduces sick leave by 10%.
Paradoxically, it is not so much the benefits but the problems associated with IAQ that are among the key issues for building users and owners in many countries. In fact, the overall costs of the bad IAQ are often higher than, for example, the cost of energy used in the same buildings [2]. In spite of this, the willingness of tenants to pay extra rent for better IAQ and the willingness of building owners to invest in IAQ is still low particularly in the public sector. Moreover, it is exceptional that building investment feasibility studies and project briefs contain quantitative analysis or measurable targets for life-cycle economic benefits and costs of IAQ [8,9]. As a matter of fact, potential economic benefits are not typically considered. Often, for example, the selection of ventilation system is based on a consideration of initial investment costs, energy and maintenance costs. This may lead in adverse selection and low investment profitability, if the economic impact of IAQ on user processes is not accounted for. In practice, there is an urgent need to take the best available IAQ technologies and procedures into practice. An important step towards this is to make the economic benefits of IAQ visible to steer construction sector investment decision-making and design management.
While the effects of IAQ on human health and performance have been the subjects of study for several decades, the number of studies focusing on quantitative analysis of the economic benefits is still very limited. Leading scholars [1,7,10] have recently pointed this out calling for new approaches to estimate the economic benefits of IAQ investments under uncertainty. Uncertainty is defined here as “anything affecting the future performance of an engineering system” [11] (p. 18). For example, according to Seppänen and Fisk [12], “There is an obvious need to develop tools so that economic outcomes of health and productivity can be integrated in cost benefit calculations with initial, energy and maintenance costs.
Fisk et al. [1] underline the importance of accounting for uncertainty in the analysis of IAQ benefits. Two main uncertainties stand out. First source of uncertainty is the approximate understanding of how IAQ parameters affect health, performance, and absence particularly in a specific type of building. Second uncertainty is related to the typically limited data concerning the actual IAQ conditions of buildings. Moreover, when the assessment of economic benefits deals with several simultaneous IAQ improvements one cannot simply add the benefits of each separate IAQ improvement measure as their effects may overlap [12]. In addition, from both the investor and user perspective, the uncertainty on the capitalization of IAQ investment can be substantial and principal-agent problems similar to building energy efficiency [13] investments may arise. In effect, the IAQ investment cost is accrued by the investor and the potential IAQ benefits are basically benefits to the building users, the carrier of increased utility costs depends on the type of lease. In practice, it may be difficult for the building owner to pass on IAQ investments in the form of higher rents. It may be difficult for the owner to effectively communicate about the characteristics of IAQ and for tenants to evaluate these claims because most tenants are not experts in evaluating the level of IAQ. Given the large uncertainties associated with the estimation of the economic benefits of IAQ, the traditional investment analysis approaches, in particular the discounted cash flow (DCF) that focuses on risk assessment instead of uncertainty, do not work very well in evaluating investments in IAQ and may lead to adverse selection.
This exploratory article investigates real option analysis (ROA) as a potential new approach to evaluate the economic benefits and profitability of investments in IAQ under major uncertainties. The aim of this study is to demonstrate ROA for the evaluation of IAQ investments and develop a research process for evaluating IAQ investments in the early stages of a real life construction project. ROA is an application of option pricing theory into real assets, where embedded options in a real capital investment is valued using an option pricing techniques which have been originally used in the financial world. ROA approach emphasizes uncertainty rather than adjusting financial variables such as the discount rate. The research is carried out as a case study, which is a healthcare construction project in Finland aiming to produce new facilities for over 280 healthcare professionals. The case study demonstrates how ROA can be used to quantify the economic benefits of IAQ and evaluate the investment pay-off under uncertainty in a real life construction project. In the case study, the economic benefits are measured as tenant’s cost savings from reduced sick leaves. The main sources of data used in this case study consist of tenants’ strategic plans, case projects’ feasibility study reports, articles and briefing, and expert workshops.
The empirical contribution of the paper is in the identification of economic benefits of a better IAQ with ROA in a real life construction project. By examining the economic benefits of IAQ, this study increases understanding of how the profitability of IAQ investments can be evaluated by the building owner in building project feasibility studies and target setting.
This article is organized as follows: Section 2 describes the research design; following that, the case study is presented. The article ends with discussion and conclusions, and suggestions for future research.

2. Research Design

The aim of the empirical analysis is to demonstrate how ROA can be used to quantify the economic benefits and evaluate the profitability of modifiable IAQ capacity in a new healthcare building.
The methodology of research is an embedded case study [14]. In the case study, ROA is applied to the tenant’s decision-making process according to real options process developed by Greden et al. [15], who studied the market value of an innovative naturally ventilated building with an embedded option to install mechanical cooling in the future. In the process, sources of uncertainty are identified and then the current building brief or design is benchmarked against these sources. Then, investments that help to manage the uncertainty are determined and costs are calculated. After that, the benefits and profitability of these investments are quantified with real options valuation. Finally, results are utilized in setting design target values.
ROA is an approach that is often considered to complement the popular DCF analysis when evaluating investments in real assets. In ROA embedded options in real asset investments are valued using option pricing techniques originating from the financial world. ROA approach emphasizes uncertainty rather than adjusting financial variables such as the discount rate that often result in myopic decisions. The most widely known techniques to solve the option value are the Black-Scholes equation, binomial option pricing model and the Monte Carlo method [16]. In all of the methods, the option value is calculated by determining the range of values of the underlying asset. The key component in determining the range is finding out the volatility of the asset. This has been relatively straightforward in the original applications of finance where detailed historical data has been available. However, with real assets this is often very challenging and ROA has received criticism [17,18] for this exact reason, even though the practical applicability of the approach has been well acknowledged.
In this study, the selected technique for real options valuation is the fuzzy pay-off method (FPOM) [19]. FPOM was originally developed on the basis of the Datar-Mathews method [20], which calculates the real options value from the pay-off distribution of net present values (NPV) generated by Monte-Carlo simulations. Collan et al. [19] realized that the probabilistic theory used in the Datar-Mathews method (and in other mainstream ROA methods) to treat for uncertainty can be replaced with fuzzy set theory [21]. In the fuzzy set theory, different propositions have a degree of membership in a set, i.e., membership is 0 (complete non-membership), 1 (complete membership) or a value between 0 and 1 (an intermediate degree of membership). This realization allowed a simplification of the projection of uncertainty into three NPV scenarios: minimum, best guess (i.e., the most likely scenario, which is normally drawn up in investment analysis) and maximum. These three scenarios are treated as triangular fuzzy numbers that form a triangular pay-off distribution where the best guess scenario has complete membership, the minimum and maximum scenarios have complete non-membership, and other scenarios in-between have intermediate degrees of membership. This asymmetrical information is used as the basis to form a triangular pay-off distribution that is “a graphical presentation of the range of possible future pay-offs the investment can take” [19], which is illustrated in Figure 1.
Figure 1. A triangular pay-off distribution describing the net present values (NPV) of prospective project; percentages 20% and 80% are for illustration purposes only [19]. Reproduced with permission from Mikael Collan. Copyright 2009 Finland.
Buildings 04 00785 g001
Collan [22] defines real option value as “the possibilistic mean of the positive side of the value terrain weighted by the positive area of the pay-off distribution over the whole area of the pay-off distribution.” The real option value is calculated as follows:
R e a l   o p t i o n   v a l u e =   0 A ( x ) d x A ( x ) d x × E ( A + )
where: 0 A ( x ) d x   :   positive area of the pay-off distribution;
A ( x ) d x   : whole area of the pay-off distribution;
E ( A + )   :   possible mean of the positive side of the pay-off distribution.
According to Collan [22], the possibilistic mean can be calculated in four different ways, depending on the shape of the pay-off distribution (Figure 1).
1)
When the whole pay-off distribution is above zero; when 0 < (a – α), then E ( A + ) =   a + β  α 6 ;
2)
When the pay-off distribution is partly above zero, so that zero is between the minimum possible NPV and the best guess NPV; when (a – α) < 0 < a, then E ( A + ) =   a + β   α 6 + ( α a ) 3 6 a 2 ;
3)
When the pay-off distribution is partly above zero, so that zero is equal to the best guess NPV or between the best guess NPV and the maximum possible NPV; when a is below zero, but a + β is above zero (a < 0 < a + β), then E ( A + ) = ( a + β ) 3 6 β 2 ;
4)
When the whole pay-off distribution is below zero, then E ( A + ) = 0 .
For a more detailed description of the method and mathematical formulas, please see Collan et al. [19] and Collan [22]. The FPOM is selected for this study because of its practical applicability, i.e., only three scenarios (minimum, best guess, and maximum) are needed for the analysis. In contrast, other suitable option valuation models, such as Monte Carlo simulation, requires relatively detailed information for example on the design solution that is not normally available at the initial stages of typical construction projects.

3. Case Study

In the case study, the economic benefits and pay-off of an IAQ investment in a new healthcare center are examined with ROA from tenant organizations perspective. Specifically, the aim is to demonstrate ROA for the modifiable ventilation capacity investment, which enables adding more ventilation capacity and increase ventilation rate. Based on the results from the earlier empirical studies (see Subsection 3.3), the starting premise in the case study is that a higher ventilation capacity can potentially lead to a reduction in tenant’s sick leave rate, holding other things equal. The economic benefits are measured as cost savings from sick leave rate reductions for the tenant organization. The main sources of data used in this case study consist of the literature review results, tenants’ strategic plans, case projects’ feasibility study reports, articles and briefing, and expert workshops.
The case study in this paper is a 40 million euro healthcare construction project in Finland. A short summary of the project brief of the healthcare center is presented in Table 1. The tenant and investor is a Finnish city of Järvenpää with a population of nearly 40,000 inhabitants. The case project, new healthcare center with gross area of 13,500 square meter (SQM), will offer the basic health and social services to the inhabitants. The tenant and the investor have together set four main objectives for the new healthcare center;
1)
The new healthcare center must enable the city of the Järvenpää to generate health benefits for the inhabitants via new healthcare processes and methods;
2)
The new healthcare center must support the healthcare functions performed and adapt to function changes;
3)
The new healthcare center must be conformable to the budget and enrich the townscape;
4)
The facilities must be put on use in October 2016.
The case was selected because it aims to create a new user benefit driven construction management model for the public sector. In fact, the project is a national benchmark project for new practices in public healthcare construction and it is in part funded by the Finnish Funding Agency for Innovation, Tekes [23]. In addition, the severity of IAQ problems on healthcare buildings in general is large. For example, in Finland national authorities and experts [24] estimate based on national and building level data that the prevalence of severe IAQ problems in existing healthcare buildings is 20%–26% of total room space. This case selection provided us also with the necessary data to apply ROA to evaluate the profitability of IAQ investments.
Table 1. Facility attributes. Data from [25]. Copyright 2013 Finland. SQM: square meter.
Facility attributesNew facilitiesMetrics
LocationCity of Järvenpää, Finland
Facility completed2016 (planned)
Gross area13,500SQM
Facility ownerA subsidiary company owned 100% by city of Järvenpää
TenantCity’s social and healthcare service organization
Estimated gross rent in 201722.72eur/month/SQM
Type of ventilation systemMechanical supply and exhaust
Ventilation rate 15L/s/person
Building modifiability for additional ventilation capacityYes, modifiability option to increase ventilation capacity later on to 24 L/s/person

3.1. Case History

The tenant, the city’s social and healthcare services organization, recognized the need for new healthcare facilities in 2008. The need was imminent due to two major reasons brought about by changes in tenants’ operations and attributes of the present facility and personnel (Table 2 and Table 3). First, the present healthcare facilities do not support the tenants’ new healthcare processes and personnel well-being. The current facilities were built in the 1970s offering few options to adapt to the major changes in user functions by 2030. Moreover, based on employee complaints and frequent respiratory infections the tenant suspects that the IAQ of the building contributes to the personnel sick leave rate (12.4 days per person per year [26]), which is higher than the estimated average sick leave rate in Finland (8.4) [27] for municipal workers, but not exceptional in comparison to the sick leave rates of healthcare employees in Finnish benchmark cities (e.g., Kirkkonummi 8.3 [28], and Hyvinkää 17.8 [29]). Ventilation rate in the present facilities is 8 L/s/person [30]. Second, the demand for healthcare services is increasing due to the rapidly ageing population. For example, the number of people over 75 years of age is expected to triple by 2030 in Järvenpää [31], which in particular requires additional ward capacity and personnel.
Table 2. Background information on tenant’s operations. Data from [30]. Copyright 2013 Finland.
Tenant attributesCurrent operationsOperations in 2030
Aim of operationsPerform basic healthcare and social services for the inhabitants of JärvenpääGenerate health benefits to the inhabitants of Järvenpää
Basic healthcare visits per year88,761112,385
Healthcare staff286347
Table 3. Tenant personnel attributes. Data from [26]. Copyright 2013 Finland.
Tenant personnel attributesCurrent situationMetrics
Average age of employees47.3years
Annual turnover of employees24.1% of total workforce
Number of sick leaves3,546.0days per year
Sick leave rate per employee12.4days per year
Top three reported reasons for sick leavesRespiratory infections, skeletal and muscle systems diseases, mental problems
Consequently, the tenant organization has decided to relocate and is motivated to investigate the economic benefits of operating in the new facilities. In particular, the tenant wants to investigate whether it is worthwhile in the economic sense to pay a higher rent in the new premises in the long-term. As personnel are the tenants’ most valuable resource and largest cost item, a key issue is to evaluate the potential economic benefits related to IAQ in the new facilities. In the following, ROA is demonstrated as a tool to evaluate these economic benefits.

3.2. Key Uncertainties and Investment Opportunities for the Tenant

As a first step of ROA, an expert workshop was organized to identify the key uncertainties for tenant’s operations in the new facility and investments to manage the identified uncertainties. Workshop participants were tenant’s executive director, investor organization’s managing director, two IAQ experts and five construction management professionals. First, the workshop participants reviewed the tenant’s current state of operations and long-term strategic targets and case projects’ feasibility studies and briefing report. Following that, relevant uncertainties were described and categorized. Future personnel well-being and utilization rate were rated as the key source of uncertainty for the tenant in the new facility. After that, the potential investments to manage the uncertainty of personnel well-being and utilization rate were shortlisted and heuristically evaluated against the uncertainties.
As a result of the workshop, the improvement of IAQ was set as a key investment and design theme, and a specific investment opportunity was assigned for ROA to evaluate its economic benefits and profitability.
The investment is modifiable ventilation capacity in the new facility, which represents a potentially valuable option to the tenant. Modifiability enables adding more ventilation capacity (from 15–24 L/s/person) and increase ventilation rates to capture the potential health and economic benefits of higher ventilation rates through lower sick leave rates. Thus, it is an additional and performance enhancing investment to the originally planned ventilation system of the new building with a ventilation capacity of 15 L/s/person. Physically, this means that the building design accommodates future installation additional ventilation units. In the workshop, modifiability of the ventilation capacity was seen to be particularly interesting and important, as the uncertainty on the actual reasons and interactions behind sick leave rates and the magnitude of potential economic benefits is large. The investment period is 20 years.

3.3. Estimation of the Economic Benefits of the Investment with Real Option Analysis

In the following analysis, the economic benefits and pay-off of the IAQ investment are analyzed with ROA. The focus is on analyzing the benefits of better IAQ through increasing the ventilation rates. The examination of economic benefits related to the option to wait and optimal timing of the investment is outside the scope of this study. The measure for the economic benefits of the investment is the savings from reduces personnel sick leaves during investment life-cycle. Sick leave is selected as a measure based on the evidence from earlier literature on the positive association between higher ventilation rates and sick leave rates. Moreover, in this case, the reduction of sick leaves is a high priority for the tenant and sick leave data availability is better than, for example, personnel productivity data. The cash flow scenarios required for calculating the real options value (i.e., the value of the economic benefits of the investments) are drawn from the tenant, building and research information available.
The research process, i.e., valuation of the potential economic benefits of the investment proceeded in seven steps:
1)
Documenting the current state of tenants’ personnel sick leave rate and annual costs and estimating yearly personnel reduction/growth (i.e., the percentage of personnel per year) and the distribution of the sick leave rate during the investment period;
2)
Assessing the potential effect of increased ventilation rates on sick leave rate based on the findings from earlier literature and expert workshop;
3)
Comprising three different scenarios of annual sick leave rate reductions by connecting the findings from phases 1 and 2;
4)
Converting the scenarios into potential the cost savings scenarios achievable with increased ventilation rates;
5)
Calculating the real option value of the economic benefits using the potential cost saving scenarios;
6)
Calculating the costs of investments;
7)
Calculating investment pay-off, i.e., real option pay-off for the investment by converting the cost savings scenarios to net pay-off scenarios by taking account the costs of investments.
Besides the potential connection between ventilation rates and sick leave, the magnitude of cost savings from reduced sick leave depends particularly on the level of the tenants’ sick leave rate in the beginning of the investment period and the anticipated development during the investment period, as well as the estimated number of employees during the investment period. Therefore, the first step of the quantitative analysis was to document the current situation of personnel and sick leave rates in the tenant organization. Currently, the tenant has 286 employees, mainly basic healthcare nurses and physicians, who will transfer to work in the new building in 2016. The sick leave rate is 12.4 days per employee per year, and the total annual cost of the organization’s entire sick leave is 1,064,000 euros for the city assuming that the total cost of a sick leave day for a municipal employee is 300 euros in accordance with the recommendation of the Ministry of Finance in Finland [32]. To estimate the distribution of sick leave rate during the investment period, the standard deviation of the annual sick leave rate (0.504 percentage points) was calculated based on city’s sick leave rate data available in 2005–2013. The standard deviation was used in scenario formulation to assess and account for the natural variation in the sick leave rate. In addition, the tenant organization’s number of personnel development during 2014–2035 was modeled according to the estimated increase in demand for health care services in the region. The estimation of the demand for health care services was based on a demographic model on Järvenpää region population growth and change in age structure, which in this case both have a significant positive impact on the demand for health care services. Following that, the increase in the number of tenants’ employees was estimated to increase in proportion to the expected increase in demand for healthcare services. The number of employees is estimated to increase from 286 to 355 employees by 2035.
In the second step of the research process, earlier literature was reviewed to find evidence-based inputs on the magnitude of the potential effect of ventilation rates on occupant sick leaves for the estimation of the economic benefits. Table 4 presents a summary of the earlier studies that address the link between ventilation rates and sick leaves. The recently emerged literature contains very little evidence on how ventilation rates affect sick leave rate. The studies focus on analyzing and comparing the sick leave rates of office workers in independently ventilated facilities and different working spaces, and in schools. Earlier studies that examine the topic in healthcare settings were not found. However, the relevance of the findings in office buildings for this case study is relatively high as office space and appointment rooms represent nearly 50% of the gross area of the new healthcare building [25].
In a path-breaking study, Milton et al. [4] examine the possible link between occupant short-term sick leave and increased ventilation rates. The authors use poisson regression to analyze 1994 sick leaves for 3720 hourly office workers of a company located in Massachusetts USA, in 40 buildings with 115 independently ventilated work areas. The study documented that short-term sick leave rates were reduced by 35% at an outside air ventilation rate of 24 L/s/person compared to 12 L/s/person. According to Milton et al. [4], there are two likely mechanisms for a causal association of ventilation with sick leaves, i.e., irritant and allergic reactions, or increased respiratory illness due to either airborne spread of infection or an increase in susceptibility. The reduction in sick leave rates associated with increased ventilation is similar to the reduction in sick leave observed during the flu season with influenza vaccination of a healthy population. Fisk et al. [3] estimate that doubling the outdoor air supply rate can reduce sick leave prevalence by 10% in open plan offices or when the air is recirculated within the office building. The study uses published field data and a theoretical model of airborne transmission of respiratory infections, and studies in which sick leave or short-term illness were the outcomes.
Table 4. Earlier studies on ventilation rates and sick leaves.
Study/AuthorsMethod CountryProperty typeVentilation rate in studied facilities High/Low, L/s/personReported %/L/s/person Difference in annual sick leave rate, +/−
Milton et al. [4]Empirical case studyUSAOffice 24/12−35 (−2.9)
Myatt [33]Empirical case studyUSAOffice45/400 (0)
Mendell et al. [7]Empirical case studyUSASchool20/2−1 to −1.5
Fisk et al. [3]Empirical analysis and theoretical modelingUSAOpen plan office
Saari et al. [5]SimulationFinlandCell office45.2/28.6−32.7(−2.0)
Open plan office27.8/12.4−43.6 (−2.8)
Fisk et al. [1]Theoretical estimation USAOffice24/12−2.9
Recently, Mendell et al. [7] examined the impact of classroom ventilation rates and illness absence in 28 elementary schools in California, USA. The results suggest that the absence rate is lower in the facilities with higher ventilation rates. In effect, a 1 L/s/person increase in ventilation rate in the range of 2–20 L/s/person is associated with a 1.0%–1.5% decrease in annual illness absences. The associations found between ventilation rates and illness absence is fairly consistent across school districts, climate zones, and ventilation types.
Myatt et al. [33] investigate whether a positive association exists between very high ventilation rates and sick leaves. The case study was executed in two office buildings occupied by Polaroid Corporation’s workers and located in Boston, USA. The authors did not find a consistent positive relationship between sick leave and the ventilation rate difference between 40 L/s/person and 45 L/s/person [33]. This finding is backed by a recent review of scientific literature through 2005 on the effects of ventilation rates on health by Sundell et al. [6] and an international expert panel. Higher ventilation rates, up to about 25 L/s/person, are associated with reduced prevalence of short-term sick leaves, sick building syndrome symptoms, inflammation, respiratory infections, asthma symptoms compared to lower ventilation rates [6].
The results from very few earlier studies suggest that a positive association would seem to exist between higher ventilation rates and lower sick leave rates. Based on the only previous study [3] that uses both empirical data and theoretical modeling it seems that doubling the ventilation rates reduces the sick leave rate by 10%, which is considered to be the best estimate of the relationship between ventilation rates and sick leave [34]. Other earlier empirical studies have observed smaller (0%) and higher effects (35%). Most empirical observations for the positive association exist in the ventilation rate range of 12–24 L/s/person.
After the literature review, an expert workshop was organized to review the findings from earlier empirical studies to assess the tenant’s sick leave reduction potential of modifiable ventilation capacity in the new building. In the workshop, the reduction potential was assessed relative to the standard ventilation system in two phases. First, the expert group reviewed the tenant’s status and planned investments were benchmarked relative to the uncertain empirical findings from the literature. The preliminary expert observations on reduction potential were heuristically evaluated against recent findings concerning the state-of-the-art of IAQ problems in existing healthcare buildings in Finland. For example, the prevalence of severe IAQ problems in existing healthcare buildings is estimated to be 20%–26% of total room space and recently 23% of all healthcare employees in Finland reported smell of mold in their workplace in a national survey [24]. In addition, based on collected clinical experiences of physicians in Finland, the emergence of IAQ problems in a building is anticipated to result in a 50% increase in short-term sick leave for user organizations [24]. However, direct numerical comparison of the Järvenpää case to benchmark municipalities in Finland was not possible as there are no earlier publications, databases or even standardized measures currently available concerning sick leaves, ventilation rates and construction projects of the public sector in Finland. Second, the experts were asked to estimate the sick leave reduction potential in three scenarios: minimum, best guess and maximum. Following that, an average of expert estimation was calculated to derive the values for reduction potential in minimum, best guess and maximum scenarios. Consequently, three scenarios were established for the reduction of tenant organization’s sick leaves during 2016–2035 by the expert group, which consisted of two leading IAQ experts in Finland and five construction management professionals. After the workshop, the scenarios were reviewed and validated in a meeting of the healthcare construction project’s steering group, which comprises the management team of the tenant organization and investor representatives.
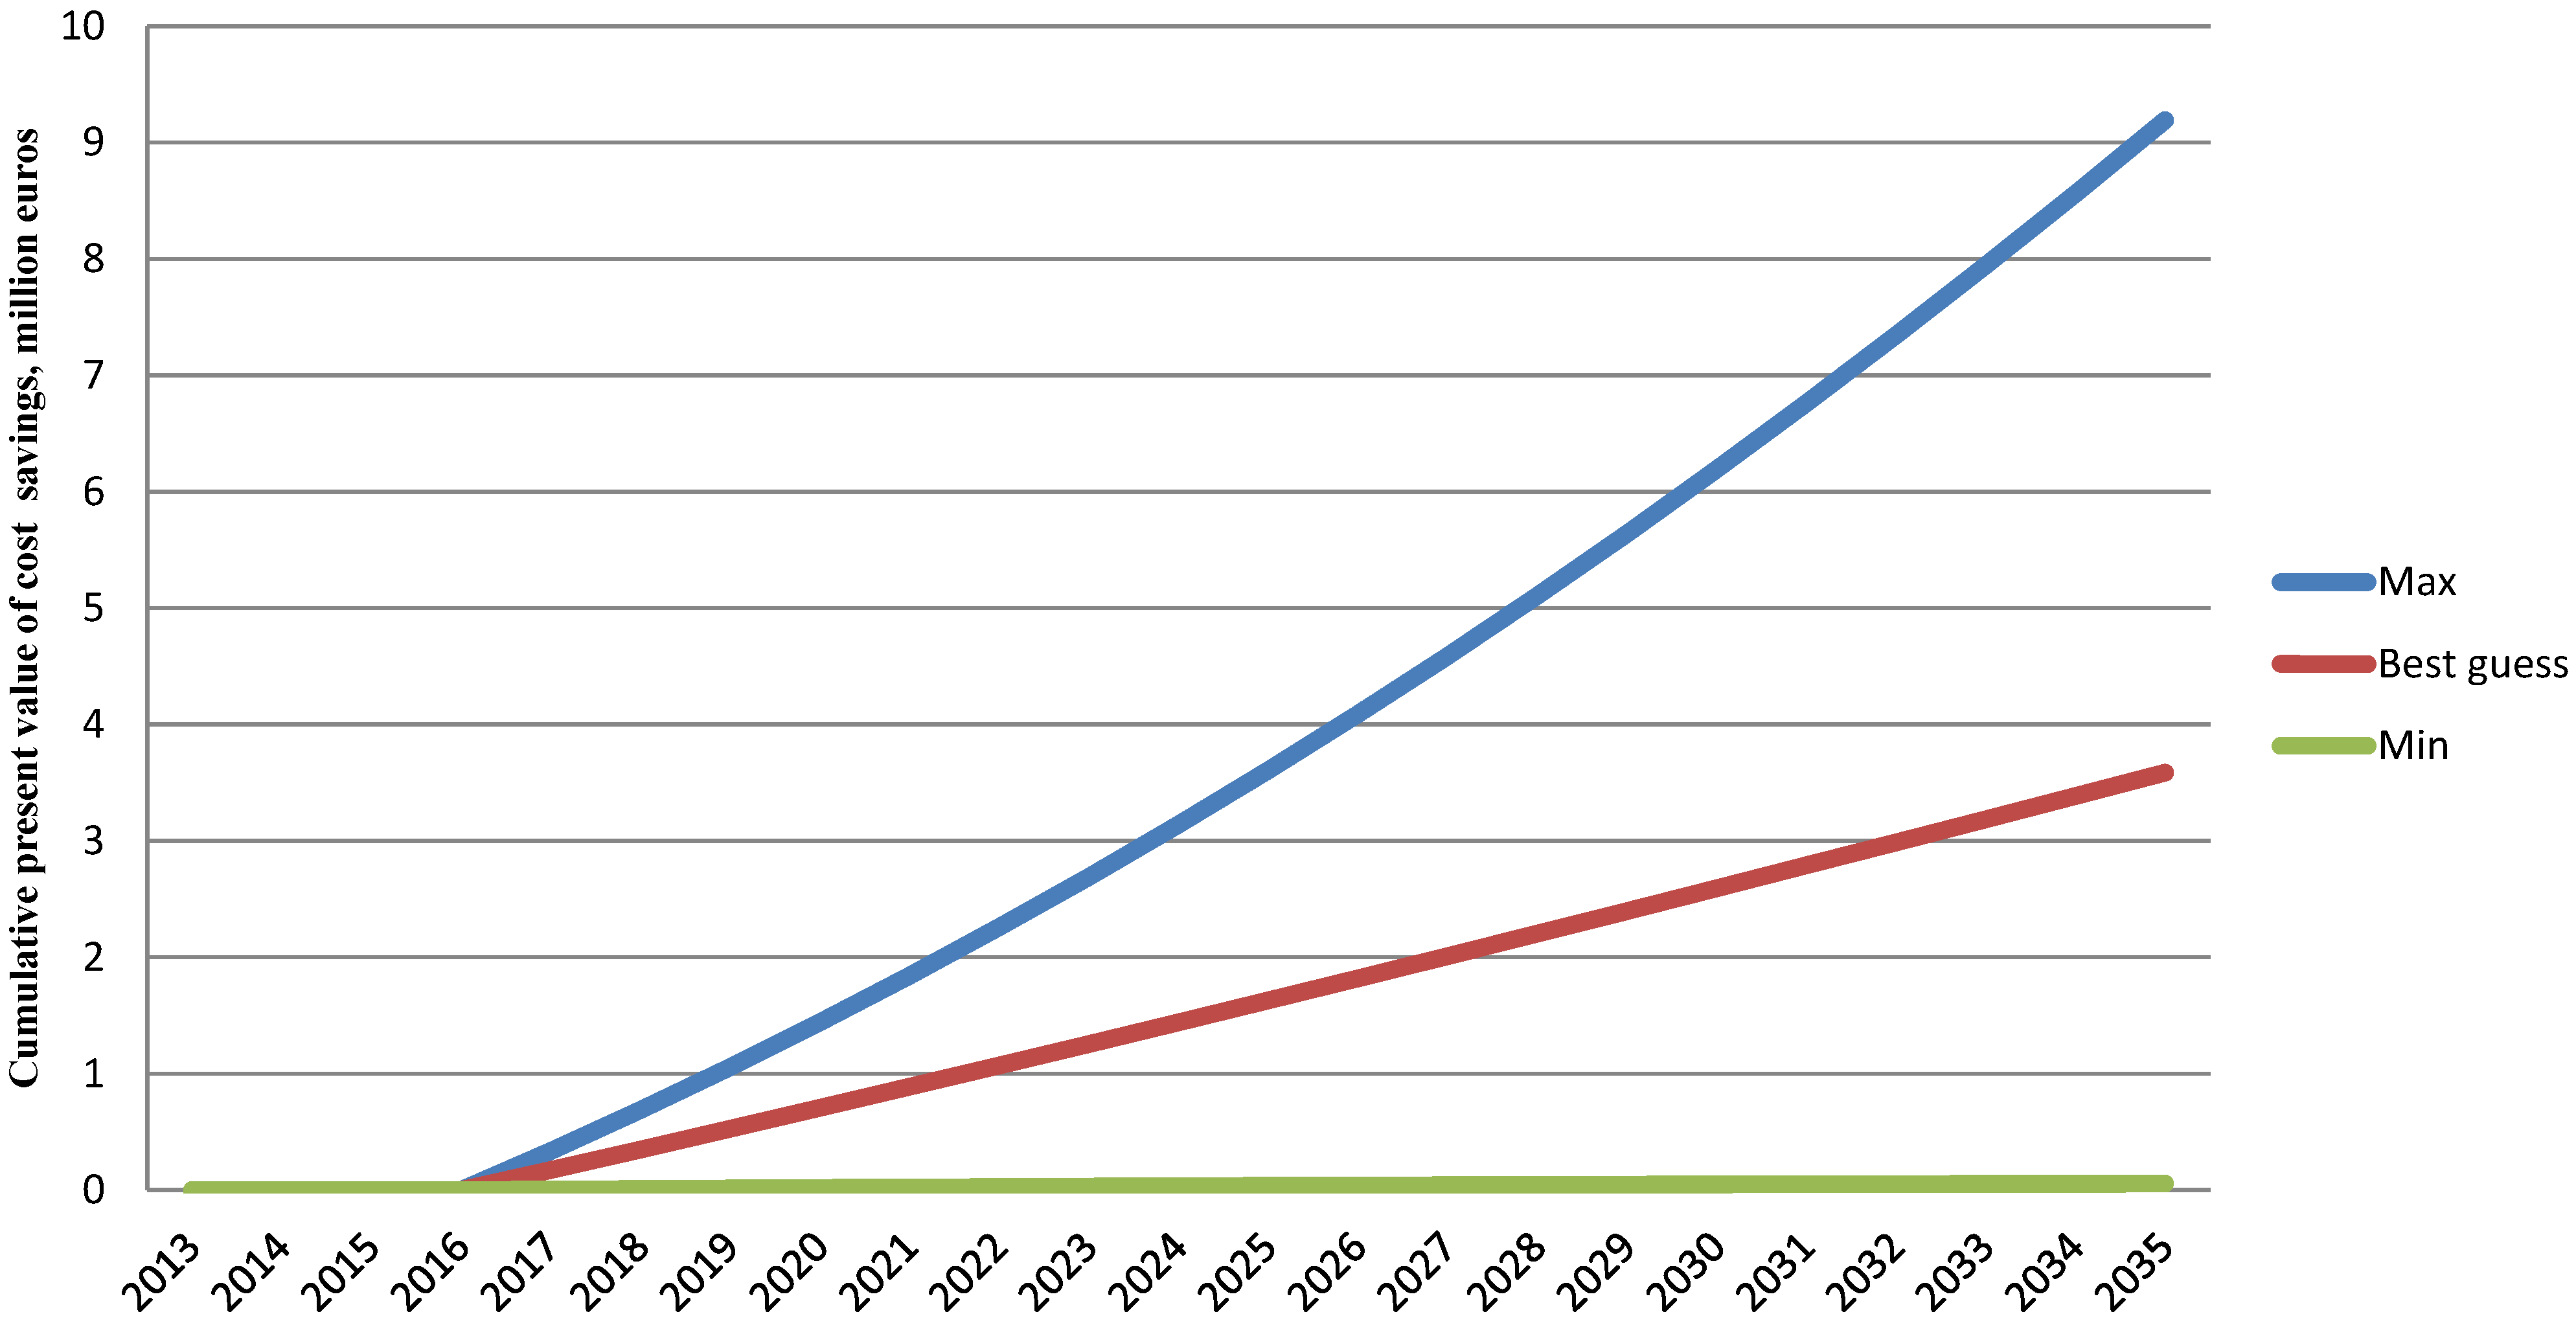
The three validated scenarios and the respective cumulative present value of the cost savings for ROA are illustrated in Figure 2. In the expert evaluation scenarios, modifiable ventilation capacity’s reduction potential in the tenant’s annual sick leave rate was estimated relative to the standard design of the building (15 L/s/person). In the case of the standard design, ventilation rates were assumed not to have an effect on the development of sick leave rate. In the best guess scenario, the reduction potential is 15% compared to the standard design starting from the year 2017. In the minimum scenario (min), the reduction potential is 0.5%. In the maximum scenario (max), the reduction potential in sick leave rate reaches 25% annually. The distribution of the three scenarios reflects the uncertainty in reduction potential taking into account the possible future events that the sick leave reduction may turn out to be virtually non-existent or considerable. The maximum and best guess scenarios are optimistic in comparison to the expected reduction potential (less than 10%) for the range of 15–24 L/s/person implied by earlier studies [3]. However, the sick leave reduction potential in all scenarios is below reduction potential implied by highest empirical observation (2.9 L/s/person and a total 26.1% for the range of 15–24 L/s/person [4]) of earlier empirical studies. Moreover, in this case it could be that a considerable increase in ventilation rates may have a larger than expected effect on sick leave due to the low level of ventilation rates (8 L/s/person) in the present facilities.
Figure 2. Present value of cumulative cost savings in three scenarios (max, best guess, min).
Buildings 04 00785 g002
The key input parameters for scenarios are described in Table 5. All expert evaluation scenarios take into account the tenant sick leave rate variability, estimated growth in the number of employees and the increase in healthcare personnel costs of 2.9% per year according to the official price index for Finnish municipalities’ healthcare costs [35]. In terms of tenant sick leave rate natural variability, the minimum scenario has a negative trend and the maximum scenario a positive trend for sick leave rate development due to other factors than ventilation rates. The discount rate is 3% in all scenarios, which is equivalent to the cost of financing for the tenant organization.
Table 5. Key input parameters for three scenarios.
ScenarioMinBest guessMaxSource
Tenant’s current sick leave rate (days per employee per year)12.412.412.4City of Järvenpää [26]
Estimated reduction in tenant’s annual sick leave rate due to increase in ventilation rates (% )0.515.025.0Literature review and expert workshop
Annual natural variation in tenant’s sick leave rate due to other factors (percentage points)−0.5040+0.504City of Järvenpää [26], authors calculations
Cost of sick leave day (eur)300300300Ministry of Finance [32]
Total increase in the number of tenant’s employees during investment period696969City of Järvenpää, project feasibility study [30]
Annual increase in healthcare personnel costs (%)2.92.92.9Finnish Local and Regional Authorities [35]
Discount rate (%)333City of Järvenpää

3.4. Real Option Value of Economic Benefits of the Indoor Air Quality Investment

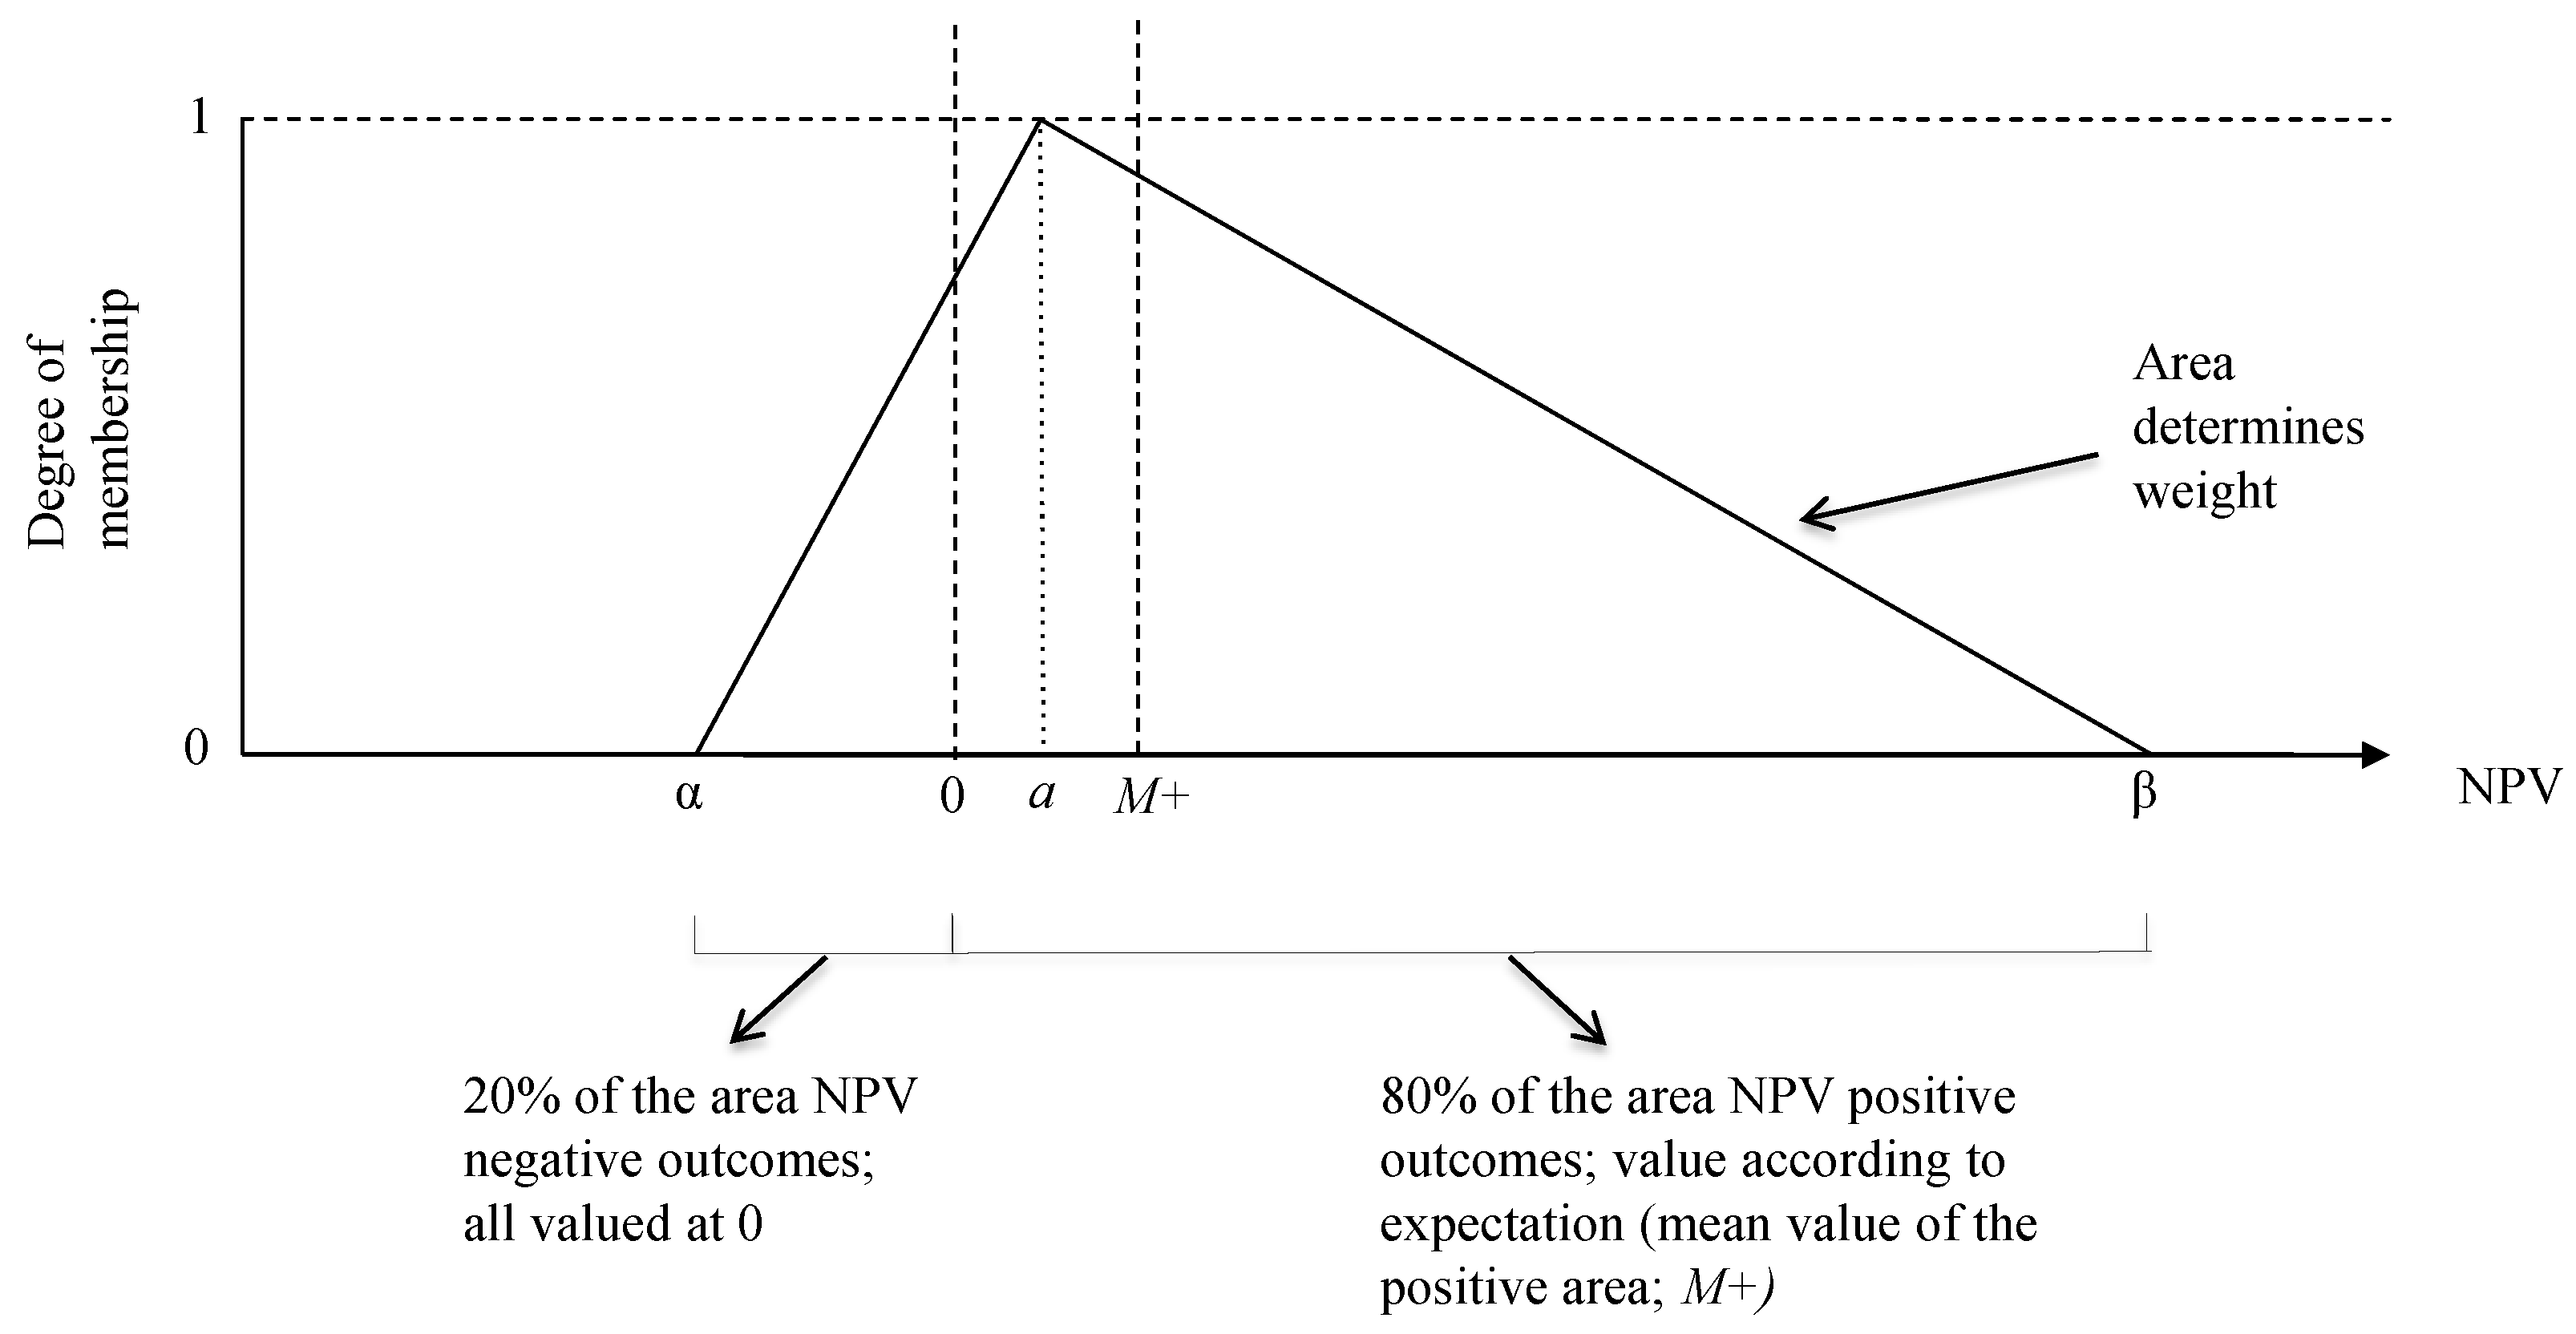
The input parameters for fuzzy pay-off method (FPOM) calculation are the cumulative present values of the three scenarios, which are 9,191,332 (max), 3,585,374 (best guess) and 55,198 (min), depicted in Figure 2 and representing the triangular pay-off distribution for the investment. In this case, the whole pay-off distribution is above zero and thus the formula E ( A + ) =   a + β  α 6 is applied. When the formula is applied to the input parameters, the real option value of 3, 931,338 euros is calculated. As the level of IAQ improves through an increase in ventilation rate from 15 to 24 L/s/person, it reduces the number of short-term sick leaves, which results in considerable cost savings to the tenant. The value represents the total value of these cost savings to the tenant under uncertainty during the whole investment period. However, the result is indicative only due to the extent of incomplete information on sick leave and ventilation rates in health care settings.
The cost savings are considerable from the tenant’s perspective totaling a present value of 291.2 euros per SQM for the 20-year investment period. Moreover, the cost savings are substantial (19.6%) relative to the tenant’s annual budget (20 Meur) and reach 13,746 eur per employee. The comparison of the cost savings relative to the rent level reveals interesting information to the tenant. The discounted 20-year gross rent level in the new building is 22.72 eur/SQM/month. The gross rent calculation takes into account the capital costs, maintenance costs including the ventilation investment costs of presented in Section 3.5, the retrofit cost of physical deterioration of the building and fixtures, investor yield target of 5.5%, and a discount rate of 3%. On the other hand, the real option value eur/SQM/month is 1.21 for the 20-year period. From the tenant’s perspective, this means that the economic benefits related to better IAQ represent 5.3% of the gross rent in the new building.

3.5. Investment, Operations and Maintenance Costs

This section presents the cost the structure of the ventilation system investment in the new building to build a basis for investment pay-off analysis with ROA. The calculations cover investment costs and operation and maintenance costs, which includes both running and preventive costs according Federation of European Heating and Air-Conditioning Associations (REHVA) guidelines [34]. The ventilation system investment includes the standard ventilation system and modifiable capacity. The investment and maintenance costs for the standard ventilation system and modifiable ventilation capacity are elaborated in Table 6 and Table 7. The standard system with a ventilation capacity of 15 L/s/person requires investments in plantroom space, supply and exhaust air and handling units, terminals and ducts, exhaust air heat recovery system and cost allocation from the ground heat system of the building. It is assumed that the standard ventilation system is installed in those spaces of the building that accommodate user, i.e., appointment spaces, dental treatment spaces, patient rooms, group meeting rooms, personnel space, restaurants, service lobby, corridors and other public spaces. Modifiable ventilation capacity assumes additional investments in a new building’s room space and shaft space reservations that enable the installation of new ventilation units later on and increasing the ventilation rate from 15 to 24 L/s/person. The additional ventilation units are installed in spaces where the standard system is not capable of maintaining a ventilation rate of 24 L/s/person, which is the case concerning appointment spaces, dental treatment spaces and patient rooms. Operation and maintenance costs include energy use for ventilation (42% of total), maintenance and running costs of the ventilation system (34%), replacement costs (15%), and allocation of the electricity for ground heat system (9%) that is used to cool supply air. Investment and operations and maintenance costs are calculated using the target price procedure of the Finnish construction cost software Haahtela (at Haahtela cost index level 82), which is the most widely used software for calculating construction costs in Finland. The investment period is 20 years and maintenance costs are expected to increase 3% per year, which is in line with the Finnish real estate maintenance cost index development during the past 5 years [36].
Table 6. Investment cost structure for the standard ventilation system (15 L/s/person). Investment item data from [30], authors cost calculations based on Haahtela software (Haahtela-yhtiöt, Helsinki, Finland). Copyright 2013 Finland.
Investment categoryInvestment itemInvestment cost (eur) Operation and maintenance (both running and preventive) Cost per Year (eur)
Space and ventilationPlantroom space of 300 m2 for ventilation units300,00040,000
Supply and exhaust air units270,000
Supply and exhaust air terminals and ducts203,000
Supply and exhaust air handling units121,000
Energy efficiencyExhaust air heat recovery system108,000
Energy productionGround heat system, cost allocation to ventilation400,000
Design and managementDesign and construction management of the ventilation system600,000
Total 2,002,00040,000
Table 7. Investment cost structure for modifiable ventilation capacity (24 L/s/person). Investment item data from [30], authors cost calculations based on Haahtela software. Copyright 2013 Finland.
Investment categoryInvestment itemInvestment cost (eur)Operation and maintenance Cost Increase per year (eur)
Additional design for modifiabilitySystem design50,0005,000
Building modifiability for additional ventilation units300 SQM room space for additional ventilation units Shaft space reservations for air ducts200,000
Implementation of additional ventilation capacity later onNew ventilation units200,000
Total450,0005,000

3.6. Real Option Pay-Off of the Indoor Air Quality Investment

In this section, the economic benefits of modifiable ventilation capacity are compared to the costs of the ventilation system, i.e., standard system and modifiable ventilation capacity. The real option pay-off of the IAQ investment is analyzed by incorporating the investment and maintenance costs in Table 6 and Table 7 to the three scenarios presented in 
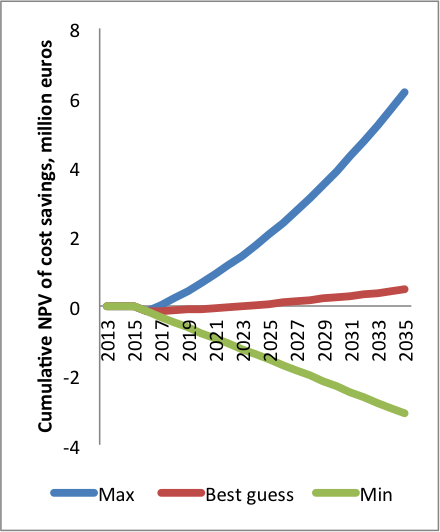
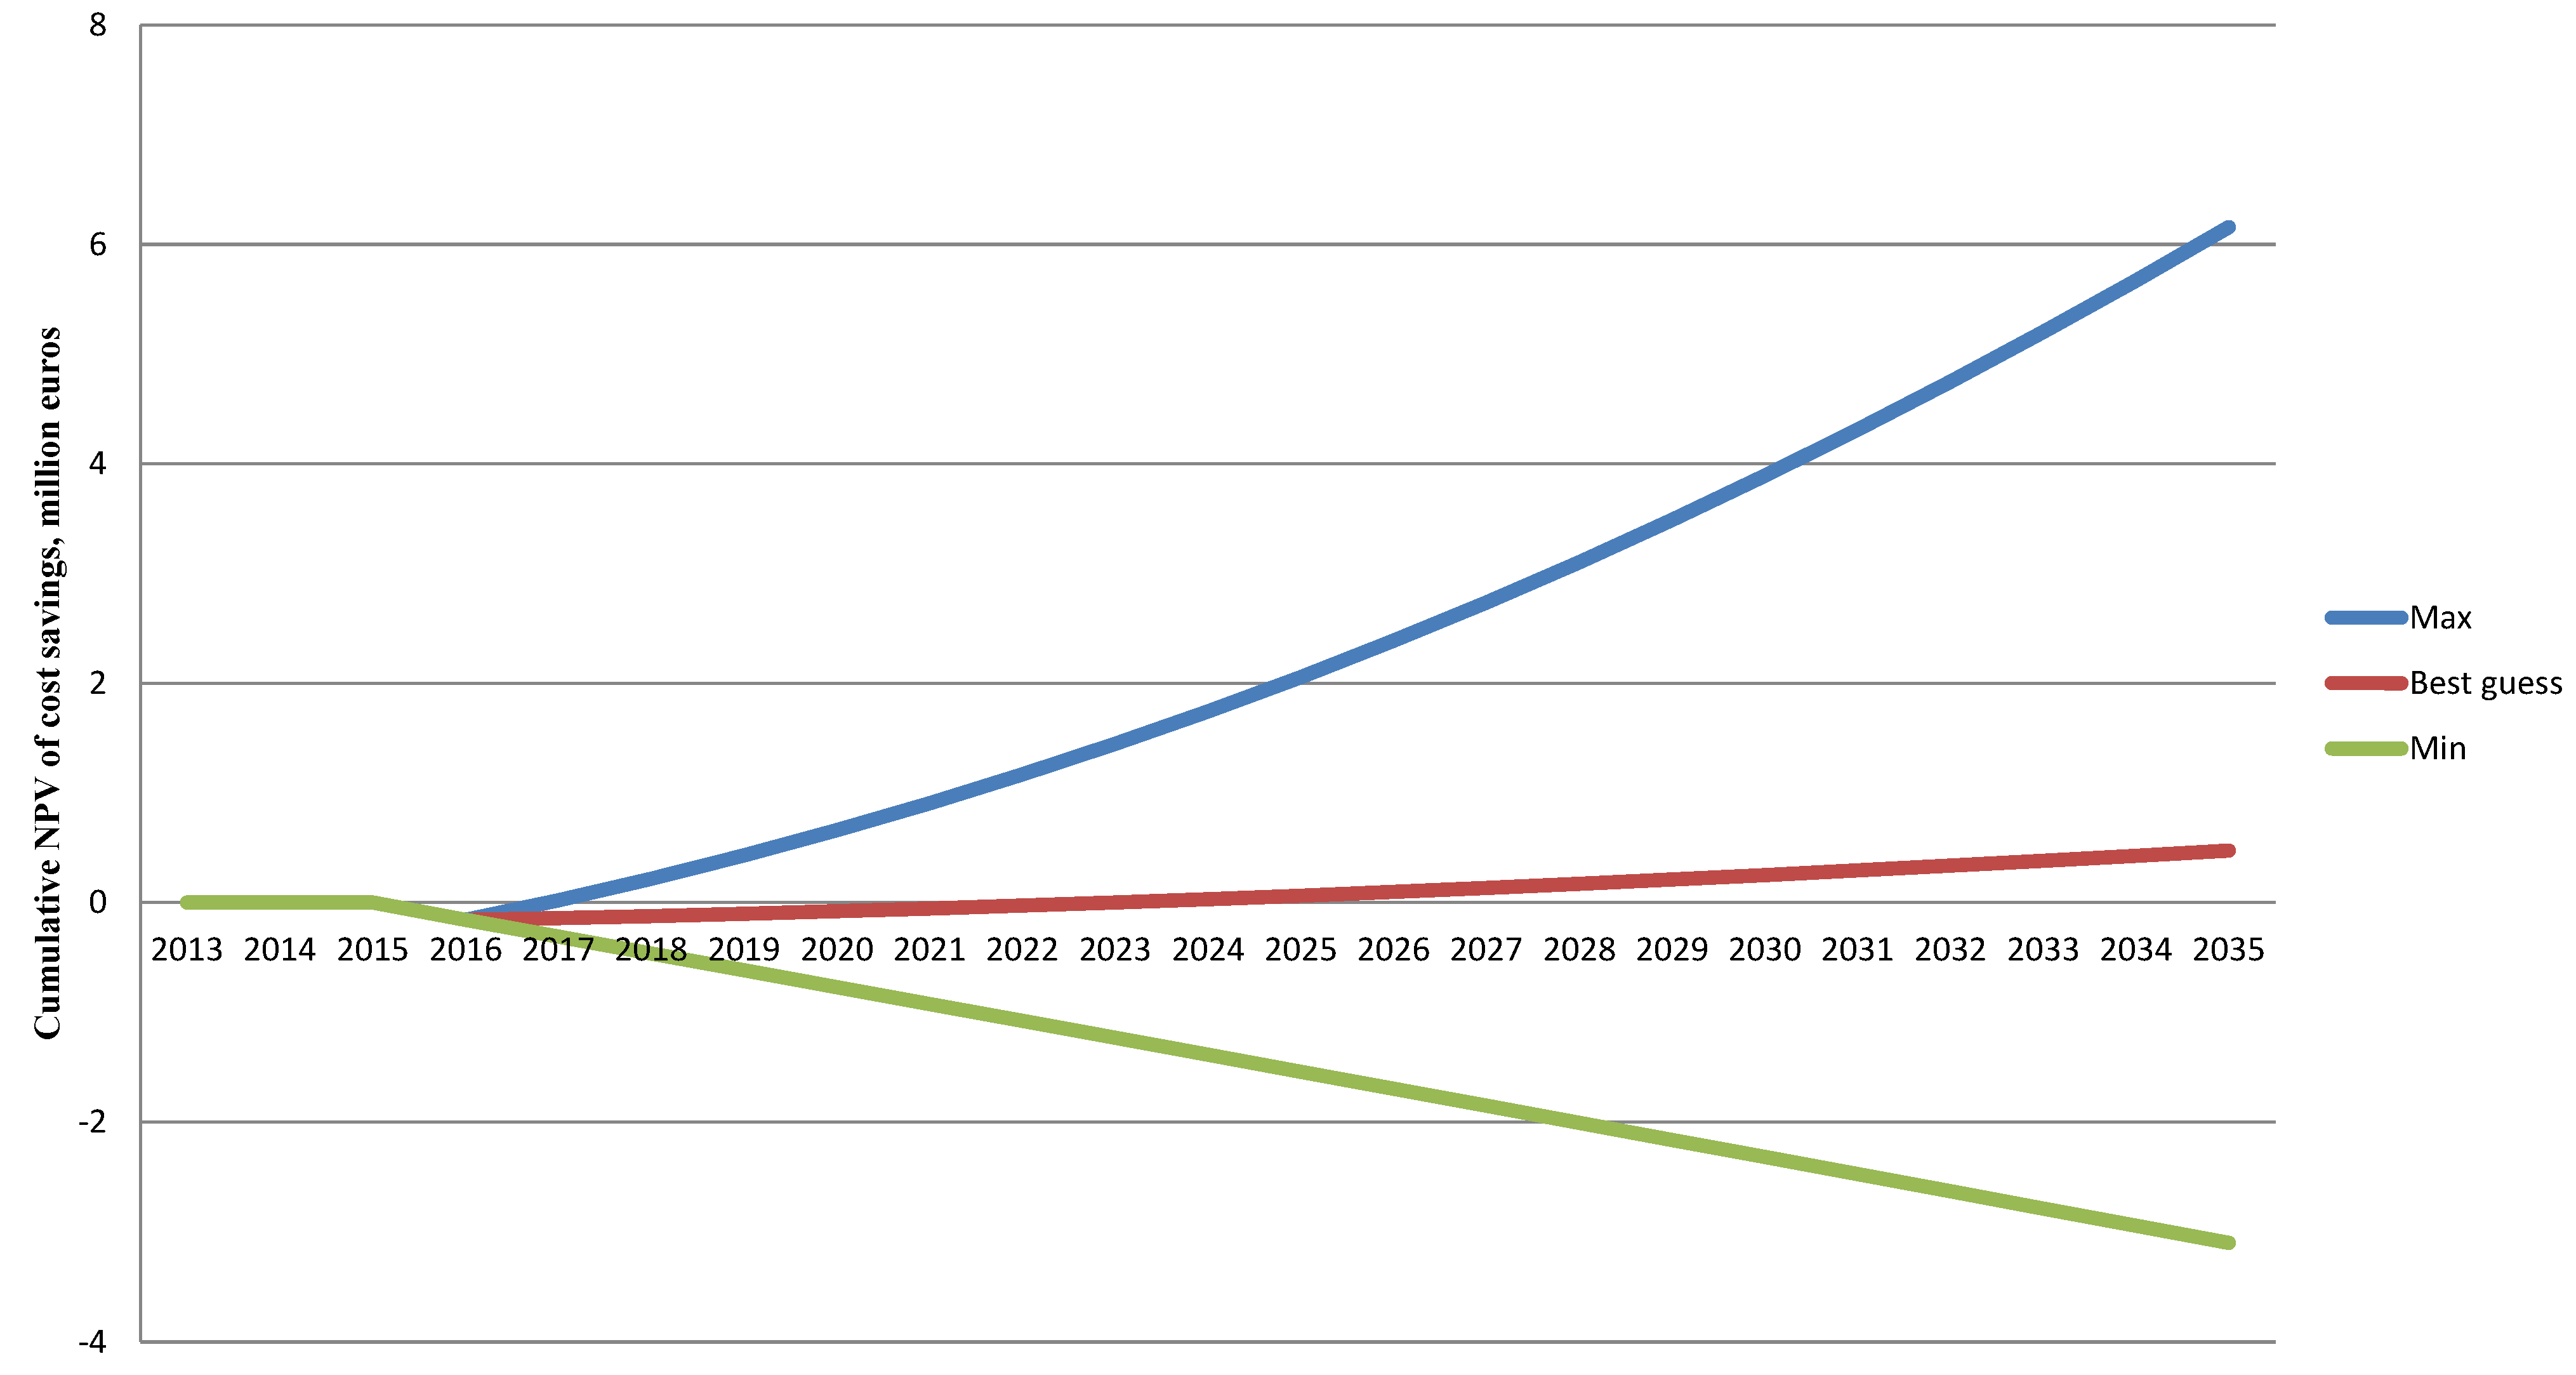
Figure 2. In the analysis, the investment in the standard ventilation system with the embedded modifiability option is completed by the end of 2015 with the deployment of the new building, and additional capacity is implemented after one year of deployment at the end of 2016. The three net pay-off scenarios are presented in Figure 3.
Figure 3. Net present value of net cumulative cost savings in three net pay-off scenarios (max, best guess, min).
Buildings 04 00785 g003
The input parameters from the three net pay-off scenarios for FPOM calculation are presented in Table 8. In this case, the pay-off distribution is partly above zero and thus the formula E ( A + ) =   a + β  α 6 + ( α a ) 3 6 a 2 is applied. When the formula is applied to the input parameters, a real option pay-off of 599,544 euros is calculated.
Table 8. Real option pay-off of the IAQ investment.
Investment pay-offValue Metrics
Max scenario6,157,970eur
Best guess scenario472,251eur
Min scenario−3,103,810eur
Real option pay-off599,544eur
The positive real option pay-off means that the pay-off of the investment is positive and the investment is profitable. The total pay-off per SQM for the investment period is 44.4 euros. In the best guess scenario, the NPV is 0.15 eur/SQM/month and 1.90 in the maximum scenario. However, in the minimum scenario, the pay-off is negative at −0.96 eur/SQM/month.
In addition, the tenant and investor could further evaluate the attractiveness of the investment compared to other investment alternatives by computing the success ratio of the investment, which is for illustration purposes presented in Table 9. The success ratio is calculated by dividing the negative area of the pay-off triangle by the positive area of the pay-off triangle [22]. The success ratio (in this case 71%) is a measure of the uncertainty on reaching a positive pay-off. The higher the number, the lower the uncertainty on reaching a positive investment pay-off.
Table 9. Success ratio of the IAQ investment.
CalculationValueMetrics
Positive area of the pay-off triangle3,283,928eur
Negative area the pay-off triangle1,346,962eur
Success ratio71%

3.7. Sensitivity Analysis

The estimated economic benefits are indicative only and particularly sensitive to changes in the scenarios concerning assumptions on the reduction potential in the tenant’s annual sick leave rate. Therefore, it is also worthwhile to consider the situation that for some reason the positive effects of higher ventilation rates on the sick leave rate would turn out to be virtually non-existent, in contrast to the findings from earlier literature and expert workshop evaluation. For example, let us assume that the maximum scenario is in fact the estimated minimum 0.5%, and the best guess is 0.1% and minimum 0%. In this case, the real option value of the economic benefits is only 46,573 euros and all investment net pay-off scenarios have a negative value (max −2,815,251, best guess −2,977,390, min −3,001,602). This highlights the importance of a systematic scenario formulation process for ROA. Moreover, the minimum reduction potential needed to reach the breakeven point of the IAQ investment is 16.03% under the assumptions of the best guess scenario. This magnitude is higher than the expected effect (less than 10%) implied by earlier studies. However, the breakeven calculation does not account for the upside potential (max scenario) or downside potential (min scenario) of the IAQ investment in this case.

4. Discussion and Conclusions

The main finding of this article is that ROA seems to be a viable method to evaluate investments in IAQ, which have several option characteristics such as high uncertainty and long investment period. ROA takes the uncertainty of into account through three pay-off scenarios: minimum, best guess and maximum. This is also the major difference between ROA and DCF investment calculations as DCF accounts only for one pay-off scenario and the discount rate is adjusted to account for uncertainty. Compressing the uncertainty of an IAQ investment into a single percentage number is not very intuitive and comprehensible. While the results of this study are only indicative, the economic benefits associated with better IAQ seem to be substantial from the tenant’s perspective. The real option value of the economic benefits of better IAQ is almost 4 million euros and the IAQ investment has a positive real option pay-off exceeding 0.5 million euros. It appears that for the tenant it is profitable to pay up to 5.3% (1.6 eur/SQM/month) higher rent for the building with modifiable ventilation capacity compared to a similar building in the same location with only a standard ventilation system, holding other things equal. The results from this quantitative analysis reveal interesting insights also to the investor. In effect, in case the tenant is willing to pay such a premium for the better IAQ through modifiable ventilation capacity in the new building, better IAQ can also be seen as a rental upside for the building owner.
The magnitude of the economic benefits of IAQ investments documented in this article is in line with findings from earlier studies on the increased rental income of eco-certified buildings. Currently, most certification systems, for example Leadership in Energy and Environmental Design (LEED), the MINERGIE standard and Energy Star, for buildings include in the evaluation criteria both energy use and the quality of the indoor environment. For example, Fuerst and McAllister [37] documented that eco-certified buildings obtain a rental and an asset price premium. The authors found that there is a rental premium of approximately 5% for LEED certification and 4% for Energy Star. In addition, according to the review by Sivunen et al. [38], building certification seems to have a positive and relatively widely distributed effect to rent level, i.e., 4.8%–17% rental income premium.
Increasing number of studies apply ROA to evaluate the economic benefits and profitability of sustainable building investments. In the field of ventilation systems, Greden et al. [15] applied ROA to evaluate the profitability of an innovative heating, ventilating, and air conditioning (HVAC) system, which gives the building owner the right to upgrade natural ventilation into mechanical ventilation. In addition, recent ROA studies have examined the profitability of solar collectors [39], space flexibility and modifiability [40,41,42], and green building certificates [43]. Real options literature, especially in the construction sector, has called for new applications of real options analysis in a practical setting. This paper adds to that call with an example of evaluating the economic benefits of investments in IAQ in a construction project. To the author’s knowledge, this paper is the first study to apply ROA to analyze the economic benefits of IAQ to the building tenant in a real life project.
When generalizing from the results, this study has some important limitations. In terms of the scenario formulation, the availability of full sick leave records and number of local benchmark studies was limited for conducting an in-depth analysis on the actual reasons behind tenants’ sick leave. It could be that several unidentified psychological factors affect the sick leave rate; for example, in the case study, the estimated increase in the number of employees may reduce the workload of some employees having a significant positive effect on sick leave rate. In addition, the earlier studies investigating the ventilation rates and sick leaves focus on office buildings and schools. The relationship between ventilation rates and sick leave in healthcare facilities may differ to some extent from these facility types. In this study, the expected effect of ventilation rates on sick leave is also higher in the best guess and maximum scenarios of ROA than the expected effect implied by earlier literature. Moreover, the empirical analysis of this study focuses only on demonstrating ROA as tool to estimate the economic benefits of better IAQ related to the option to increase capacity. In practice, the modifiable ventilation capacity offers another potentially valuable option—the option to wait—which is outside the scope of this study, but relevant for investment decision-making. In this case, deferring the investment in additional ventilation capacity can be valuable as the actual reasons and interactions behind high sick leave rates can be very complex, and the uncertainty on the magnitude of expected economic benefits is large. For example, in the new building the effects of the new atmosphere, new interior materials and new ways of working on the sick leave rate may be significant. Therefore, it would seem to be worthwhile for the tenant and investor to wait and observe new relevant decision-making information—for example, on the development of the sick leave rate after building deployment, the emergence of evidence on IAQ and sick leave rates, new ventilation technologies and updated guidelines for healthcare ventilation rates—and base the decision to exercise the modifiability option based on updated ROA.
The managerial construction of this analysis, i.e., the ROA process and output presented in this study was used as an investment feasibility analysis document in the actual investment decision-making process by the tenant’s management team and investors’ board of directors. The tenant’s management team and investors’ board of directors appreciated particularly the systematic ROA process that brings experts together to incorporate the sources of uncertainty and numerical presentation of the life-cycle economic benefits and costs related to IAQ investments. Later on in the building briefing process, the results of this analysis were used in setting the target value of design for the ventilation system. Moreover, the ROA approach was also used for the optimization of building service flexibility and adaptability in the project.
The results have practical implications for the investors, designers and building users. ROA is a promising approach to analyze the feasibility of IAQ investments. In fact, IAQ investments have several option characteristics. The realization of the economic benefits is highly uncertain, the investment period is long and the investments typically require substantial upfront investment. Moreover, ROA may help to alleviate the potential principal-agent and asymmetric information problems in IAQ investment. In practice, it may assist owners and tenant to effectively and transparently communicate the characteristics, uncertainties and benefits of IAQ investments. The empirical analysis produced in this paper was perceived valuable by case study tenant and investor and can be used as a guidance and motivation for further applications of analyzing the economic benefits of and setting targets for indoor environment investments.
This paper sets forth several leads for future research. In particular, it would be important to conduct a follow up study in 2018 when the building is operational and sick leave data is available to provide more evidence on whether the assumptions and results of this study were valid and reliable. Moreover, it would be interesting to study further the applicability of ROA for evaluation of IAQ investments in other empirical settings. In addition, an examination of the realized economic benefits over time would shed more light on the potential correlation between ventilation rates and sick leave over a longer period.

Acknowledgments

The authors want to thank Kiinteistö Oy Järvenpään Terveystalo for the ROA case study setting and data.

Author Contributions

Juho-Kusti Kajander is responsible for initiating, executing and writing the paper. Matti Sivunen participated in executing the paper and carried out the investment cost analysis. Seppo Junnila provided comments and suggestions on the paper.

Conflicts of Interest

The authors declare no conflict of interest.

References

  1. Fisk, W.J.; Black, D.; Brunner, G. Benefits and costs of improved IEQ in U.S. offices. Indoor Air 2007, 21, 357–367. [Google Scholar] [CrossRef]
  2. Seppänen, O.; Kurnitski, J. Target Values for Indoor Environment in Energy-Efficient Design. In Cost Optimal and Nearly Zero-Energy Buildings (nZEB), Definitions, Calculation Principles and Case Studies; Kurnitski, J., Ed.; Springer: London, UK, 2013; pp. 57–78. [Google Scholar]
  3. Fisk, W.J.; Seppänen, O.; Faulkner, D.; Huang, J. Cost benefit analysis of ventilation control strategies in an office building. Proc. Healthy Build. 2003, 3, 361–366. [Google Scholar]
  4. Milton, D.K.; Glencross, P.M.; Walters, M.D. Risk of sick leave associated with outdoor air supply rate, humidification, and occupant complaints. Indoor Air 2000, 10, 212–221. [Google Scholar] [CrossRef] [PubMed]
  5. Saari, A.; Tissari, T.; Valkama, E.; Seppänen, O. The effect of a redesigned floor plan, occupant density and the quality of indoor climate on the cost of space, productivity and sick leave in an office building—A case study. Build. Environ. 2006, 41, 1961–1972. [Google Scholar] [CrossRef]
  6. Sundell, J.; Levin, H.; Nazaroff, W.W.; Cain, W.S.; Fisk, W.J.; Grimsrud, D.T.; Gyntelberg, F.; Li, Y.; Persily, A.K.; Pickering, A.C.; et al. Ventilation rates and health: Multidisciplinary review of the scientific literature. Indoor Air 2011, 21, 191–204. [Google Scholar] [CrossRef] [PubMed]
  7. Mendell, M.J.; Eliseeva, E.A.; Davies, M.M.; Spears, M.; Lobscheid, A.; Fisk, W.J.; Apte, M.G. Association of classroom ventilation with reduced illness absence: A prospective study in California elementary schools. Indoor Air 2013, 23, 515–528. [Google Scholar] [CrossRef] [PubMed]
  8. Elf, M.; Malmqvist, I. An audit of the content and quality in briefs for Swedish healthcare spaces. J. Facil. Manag. 2009, 7, 198–211. [Google Scholar] [CrossRef]
  9. Zimina, D.; Ballard, G.; Pasquire, C. Target value design: Using collaboration and a lean approach to reduce construction cost. Constr. Manag. Econ. 2012, 30, 383–339. [Google Scholar] [CrossRef]
  10. Seppänen, O.A.; Fisk, W.J. Some quantitative relations between indoor environmental quality and work performance or health. HVAC R Res. 2006, 12, 957–973. [Google Scholar] [CrossRef]
  11. Cardin, M.A. Quantitative Performance-Based Evaluation of a Procedure for Flexible Design Concept Generation. Ph.D. Thesis, Massachusetts Institute of Technology, Boston, MA, USA, 7 January 2011. [Google Scholar]
  12. Seppänen, O.A.; Fisk, W.J. A Model to Estimate the Cost Effectiveness of the Indoor Environment Improvements in Office Work; LBNL-55447; Lawrence Berkeley National Laboratory: Berkeley, CA, USA, 2004. [Google Scholar]
  13. Davis, L.W. Evaluating the Slow Adoption of Energy Efficient Investments: Are Renters Less Likely to Have Energy Efficient Appliances? Working Paper No. w16114; National Bureau of Economic Research: Cambridge, MA, USA, 2010. [Google Scholar]
  14. Yin, R.K. Case Study Research: Design and Methods, 3rd ed.; Sage Publications: Thousand Oaks, CA, USA, 2002. [Google Scholar]
  15. Greden, L.V.; Glicksman, L.R.; Lopez-Betanzos, G. A real options methodology for evaluating risk and opportunity of natural ventilation. J. Sol. Energy Eng. 2006, 128, 204–212. [Google Scholar] [CrossRef]
  16. Amram, M.; Kulatilaka, N. Real Options: Managing Strategic Investment in an Uncertain World; Harvard Business School Press: Boston, MA, USA, 1999. [Google Scholar]
  17. Lander, D.; Pinches, G. Challenges to the practical implementation of modeling and valuing real options. Q. Rev. Econ. Financ. 1998, 38, 537–567. [Google Scholar] [CrossRef]
  18. Oppenheimer, P.H. A critique of using real options pricing models in valuing real estate project and contracts. Brief. Real Estate Financ. 2002, 2, 221–233. [Google Scholar] [CrossRef]
  19. Collan, M.; Fullér, R.; Mezei, J. A fuzzy pay-off method for real option valuation. J. Appl. Math. Decis. Sci. 2009, 2009, 238196:1–238196:14. [Google Scholar] [CrossRef]
  20. Datar, V.; Mathews, S. European real options: An intuitive algorithm for the black-scholes formula. J. Appl. Financ. 2004, 14, 45. [Google Scholar]
  21. Zadeh, L.A. Fuzzy sets. Inf. Control 1965, 8, 338–353. [Google Scholar] [CrossRef]
  22. Collan, M. The Pay-Off Method: Re-Inventing Investment Analysis: With Numerical Application Examples from Different Industries; CreateSpace Independent Publishing Platform: Charleston, SC, USA, 2012. [Google Scholar]
  23. Tekes. The Finnish Funding Agency for Innovation. Available online: http://www.tekes.fi/tekes/tulokset-ja-vaikutukset/caset/2014/jarvenpaa-uudenlainen-kansallinen-malli-julkisiin-rakennushankintoihin/ (accessed on 23 June 2014).
  24. Reijula, K.; Ahonen, G.; Alenius, H.; Holopainen, R.; Lappalainen, S.; Palomäki, E.; Reiman, M. Rakennusten kosteus-ja homeongelmat; Audit Committee’s publications. Parliament of Finland: Helsinki, Finland. Available online: http://web.eduskunta.fi/dman/Document.phx?documentId=er28612160849612 (accessed on 9 October 2013).
  25. New Healthcare Center Project Brief; Kiinteistö Oy Järvenpään Terveystalo: Järvenpää, Finland, 2013.
  26. Järvenpää. Review of Human Resources; Website of City of Järvenpää. Available online: http://www.jarvenpaa.fi/--Henkilöstö--/sivu.tmpl?sivu_id=391 (accessed on 10 November 2013).
  27. The Centre for Occupational Safety. Kunta-alan Työolobarometri 2012. Finland, 2013. Available online: http://www.tyoturva.fi/files/2983/Kunta-alan_tyolobarometri_2012.pdf (accessed on 24 September 2014).
  28. Kirkkonummi, Review of Human Resources; City of Kirkkonummi, Finland. Available online: http://kirkkonummi01.hosting.documenta.fi/kokous/20131383–16–1.PDF (accessed on 24 September 2014).
  29. Hyvinkää, Review of Human Resources; City of Hyvinkää, Finland. Available online: http://www.hyvinkaa.fi/Tiedostot/Hankkeet%20ja%20raportit/henkilostokertomus2013.pdf (accessed on 24 September 2014).
  30. New Healthcare Center Project Feasibility Analysis; Kiinteistö Oy Järvenpään Terveystalo: Järvenpää, Finland, 2013.
  31. Statistics of Population; Statistics Finland: Helsinki, Finland, 2013; Available online: http://www.stat.fi/tup/kunnat/index.html (accessed on 9 October 2013).
  32. Lehtonen, V.-M. Miten hallita sairauspoissaoloja? Ministry of Finance publication: Helsinki, Finland, 2010. Available online: http://www.vm.fi/vm/fi/04_julkaisut_ja_asiakirjat/01_julkaisut/06_valtion_tyomarkkinalaitos/miten_hallita_sairauspoissaoloja.pdf (accessed on 15 November 2013).
  33. Myatt, T.A.; Staudenmayer, J.; Adams, K.; Walters, M.; Wand, M.; Rudnick, S.; Milton, D.K. An intervention study of outdoor air supply rates and sick leave among office workers. Indoor Air 2002, 2002, 778–783. [Google Scholar]
  34. Andersson, J.; Clements-Croome, D.; Fitzner, K.; Hanssen, S.O. Indoor Climate and Productivity in Offices; Wargocki, P., Seppänen, O., Eds.; Federation of European Heating and Air-Conditioning Associations (REHVA) Guidebook: Brussels, Belgium, 2006. [Google Scholar]
  35. Finnish Local and Regional Authorities. Price Index for Finnish Municipalities Health Care Costs; Finnish Local and Regional Authorities: Helsinki, Finland, 2013. Available online: http://www.kunnat.net/fi/tietopankit/tilastot/kuntatalous/indeksit/Sivut/default.aspx (accessed on 3 January 2014).
  36. Statistics Finland. Index of Real Estate Maintenance Costs; Statistics Finland: Helsinki, Finland. Available online: http://www.stat.fi/til/kyki/index_en.html (accessed on 2 March 2014).
  37. Fuerst, F.; McAllister, P.M. Green Noise or Green Value? Measuring the Price Effects of Environmental Certification in Commercial Buildings; University of Reading: Reading, UK, 2008. [Google Scholar]
  38. Sivunen, M.; Kajander, J.-K.; Kosonen, R. Good indoor environment and energy efficiency increase monetary value of buildings. REHVA J. 2014, 4, 6–9. [Google Scholar]
  39. Van der Maaten, E. Uncertainty, real option valuation, and policies toward a sustainable built environment. J. Sustain. Real Estate 2010, 2, 161–181. [Google Scholar]
  40. De Neufville, R. Real options: Dealing with uncertainty in systems planning and design. Integr. Assess. 2003, 4, 26–34. [Google Scholar] [CrossRef]
  41. Greden, L.; Glicksman, L. A real options model for valuing flexible space. J. Corp. Real Estate 2005, 7, 34–48. [Google Scholar] [CrossRef]
  42. Vimpari, J.; Kajander, J.-K.; Junnila, S. Valuing flexibility in a retrofit investment. J. Corp. Real Estate 2014, 16, 3–21. [Google Scholar] [CrossRef]
  43. Vimpari, J.; Junnila, S. Valuing green building certificates as real options. J. Eur. Real Estate Res. 2014, 7, 181–198. [Google Scholar] [CrossRef]

