
Effects of Solution Treatment on Microstructure and High-Cycle Fatigue Properties of 7075 Aluminum Alloy

1
College of Mechanical and Electrical Engineering, Central South University, Changsha 410083, China
2
Light Alloy Research Institute, Central South University, Changsha 410083, China
3
School of Mechanical Engineering, Hebei University of Architecture, Zhangjiakou 075051, China
*
Author to whom correspondence should be addressed.
Metals 2017, 7(6), 193; https://doi.org/10.3390/met7060193
Submission received: 28 March 2017
/
Revised: 19 May 2017
/
Accepted: 22 May 2017
/
Published: 26 May 2017
(This article belongs to the Special Issue Fatigue Damage)
Abstract
:This research mainly focused on the effects of solution treatment on high-cycle fatigue properties, microstructure evolution, and fatigue fracture morphology of the high strength aluminum alloy (7075 aluminum alloy). The S-N curves and fatigue performance parameters of the alloy were obtained. We found that longer solution treatment time significantly influences the high-cycle (N ≥ 105) fatigue properties of the Al-Zn-Mg-Cu alloy. Under the loading stress of 240 MPa, and the solution treatment of 2 h compared to 1.5 h, 1 h, and 0.5 h, the fatigue life was respectively improved by about 95.7%, 149%, and 359%. The microstructure observations conducted with a scanning electron microscope (SEM) and transmission electron microscope (TEM) are as follows: recrystallization occurs in the grains of the 7075 aluminum alloy under solution treatment, and the grains become large with the length of the solution treatment time. Cracks mainly initiate from the undissolved large phases, and prolonging the solution time can effectively promote the dissolution of the T phase and S phase, decrease the number of dislocations, and lower the rate of the initiation of fatigue cracks at the undissolved large phases due to dislocation glide and dislocation pile-up. In the second stage of crack propagation, the secondary cracks reduce the driving force and the rate of crack propagation, promoting the fatigue properties of the 7075 aluminum alloy, which can be verified by the observation result that fatigue striation widths become narrower with longer solution treatment times.
1. Introduction
Solution treatment refers to the process of dissolving the coarse second phase in the alloy at a certain temperature and time, and then using rapid cooling to obtain a supersaturated solid solution [1]. In solution treatment, the time and the temperature are the core parameters [2], which have direct influences on the degree of the solid solution and the quality of the subsequent precipitated phase during the ageing and strengthening stage.
The effect of solution treatment on the microstructure and the performance of the 7050 aluminum alloy has been discussed in the literature [3,4,5,6]. The results show that solution treatment can have a significant effect on the grain size and the morphology of the second phase. While the second phases are dissolving into the base, the proportion of recrystallization and the size of the sub-grain increase, causing the weakening of the mechanical properties of the alloy [3]. In these studies, Li [4] found that the ideal solution treatment for the 7050 high strength aluminum is 470 °C × 1 h; the results of Deng [5] showed that the hardening layer of the 7050 aluminum alloy with a heat preservation solution under 490 °C tended to be 1.36 times deeper than that under 475 °C. In addition, Wang [6] pointed out that the ideal solution treatment for casting-rolling 7050 high strength aluminum is 480 °C × 1 h; References [7,8,9] obtained similar conclusions for the 7050 high strength aluminum alloy. Senkov et al. focused on the effect of parameter changes of the solution treatment on the micromorphology and volume fraction of the Al3Sc phases and Al3Zr phases [9]. Davies et al. [10] found that in the solution treatment, the second phase would dissolve in the solid solution, and the recrystallization occurred simultaneously. The recrystallized grain and the remaining large second phase significantly influenced the fracture toughness properties of the aluminum alloy. After the solution treatment, the second phase of the aluminum alloy, the recrystallization fraction, and the change of the grain morphology also have a great influence on the material’s fatigue property [11,12,13,14,15]. The dissolution of the large second phase is beneficial to the increase of the supersaturation degree of a supersaturated solid solution before ageing, thus reducing the source of micro-cracks and promoting the fatigue performance of the alloy [16]. Fan et al. [17,18] found that grain boundaries inhibit the propagation of the fatigue cracks. The smaller the aluminum alloy grains are, the more boundaries exist and the more severe the inhibition is, correspondingly leading to a higher fatigue life.
However, the current studies mostly focus on the effect of solution treatment on the structure and mechanical properties, rather than on the fatigue properties of materials, especially the high-cycle fatigue properties. In practical applications, aluminum alloy materials usually work under relatively low cyclic stress loads, and the fracture patterns are often high-cycle fatigue fractures [19,20], in which there is usually no obvious plastic deformation, and which is difficult to detect and prevent. In this paper, the aviation-used 7075-T651 high strength aluminum alloy is taken as the object of study. Under a certain solution temperature—480 °C, the materials are solution treated with different times, and then the effects of the solution treatment time on the high-cycle fatigue properties are observed. According to the rules of alloy microstructure evolution and the analysis of fracture morphology, the influence mechanism is discussed in order to provide a theoretical guidance for the optimization of parameters in solution treatment and for the enhancement of the fatigue properties of aluminum alloys.
2. Material and Experiments
The material used in this study is a typical Al-Zn-Mg-Cu alloy (7075 aluminum alloy). The heat treatment processing for this material is T651, which means conducting the solution treatment at 470 °C for 1 h, quenching in cold water, artificial aging treatment at 120 °C for 24 h, and then 5% pre-stretching to release residual stress. The measured chemical composition of the studied aluminum alloy is listed in Table 1.
Metallographic samples (with the dimensions 14 mm × 14 mm × 4 mm) and fatigue samples were prepared from the 7075 aluminum alloy plate (Southwest Aluminum Group Co., Ltd., Chongqing, China). The fatigue samples were cut with wire electrical discharge machining (WEDM) to reduce the residual stress and tissue damage [21], the shape and dimensions of which are shown in Figure 1, which met American society for testing and materials standard ASTM E466-2007. In order to avoid notches and micro-cracks in the specimens’ surface that may form during the machining processing [22], surfaces were polished to an average surface roughness of less than 0.4 mm with metallographic abrasive paper (1600#) and nylon cloth.
The solution treatment was conducted in a SX-12-10 resistance furnace (Cangyue Company, Shanghai, China), in which the solution temperature was 480 °C and the solution treatment times were 0.5 h, 1.0 h, 1.5 h, and 2.0 h, respectively. After quenching in the water at 25 °C, the artificial aging was performed at 120 °C for 24 h.
The fatigue test was conducted on a MTS810 fatigue machine (MTS Systems Corporation, Eden Prairie, MN, USA). The stress levels for axial stress fatigue performance were set between 240 MPa and 320 MPa, with a loading frequency of 40 Hz and a stress ratio of 0.1. Three horizontal samples were taken for each stress level. In order to study the initiation and propagation of the cracks, the fatigue fractures were fully cut off and observed under a TESCAN scanning electron microscope (SEM) (Tescan Company, Brno, Czech Republic). Micrographs of the precipitated phase characteristics were observed under a TecnaiG220 transmission electron microscope (TEM) (United States FEI limited liability company, Hillsboro, OR, USA). Samples were cut from the solution treatment specimens, and first thinned to 0.8 mm, and then thinned again on a TenuPol-5 electro-polished double spraying thinner machine (Struers, Copenhagen, Denmark). The solution was a mixed liquid of 30% hydrogen nitrate and 70% methanol, with a double spraying temperature between −35 °C to −25 °C, and a voltage of 20 kV.
3. Results and Discussion
3.1. Effects of Solution Treatment on the Microstructure
The microstructure of the 7075 aluminum alloy after solution treatment under the same temperature (480 °C) and for different times (0.5 h, 1.0 h, 1.5 h and 2.0 h) are shown in Figure 2.
In Figure 2, it can be seen that varying degrees of recrystallization and grain growth occur with the increase of the solution treatment time. When the solution treatment time is 0.5 h (Figure 2a) the average size of the alloy grains are relatively small, due to the short time. Among these grains, some are isometric crystals. When the solution treatment time is increased to 1 h (Figure 2b), the recrystallization and grain growth continue because of grain boundary migration. When the solution treatment time increases to 1.5 h (Figure 2c), the grains after recrystallization merge and extend out, and the boundaries become straight. When the solution treatment time is increased to 2 h (Figure 2d), due to the long solution holding time, there is enough time for the grains to grow. With the interruption and the vanishing of the boundaries among the grains, the recrystallization becomes highly visible, and the average size of the grain is relatively the largest.
3.2. Effects of Solution Treatment on the Second Phase
The distributions and the appearances of the large phases of the 7075 aluminum alloy, solution treated at 480 °C and for different times (0.5 h, 1.0 h, 1.5 h, and 2.0 h), are listed in Figure 3. In the dark grey Al-base, there are a large number of undissolved large-phase particles distributed along the rolling direction, which are mostly grey and black, and non-uniform in distribution and size. Some of the particles are broken in the rolling process, and separated from the Al base due to plastic deformation.
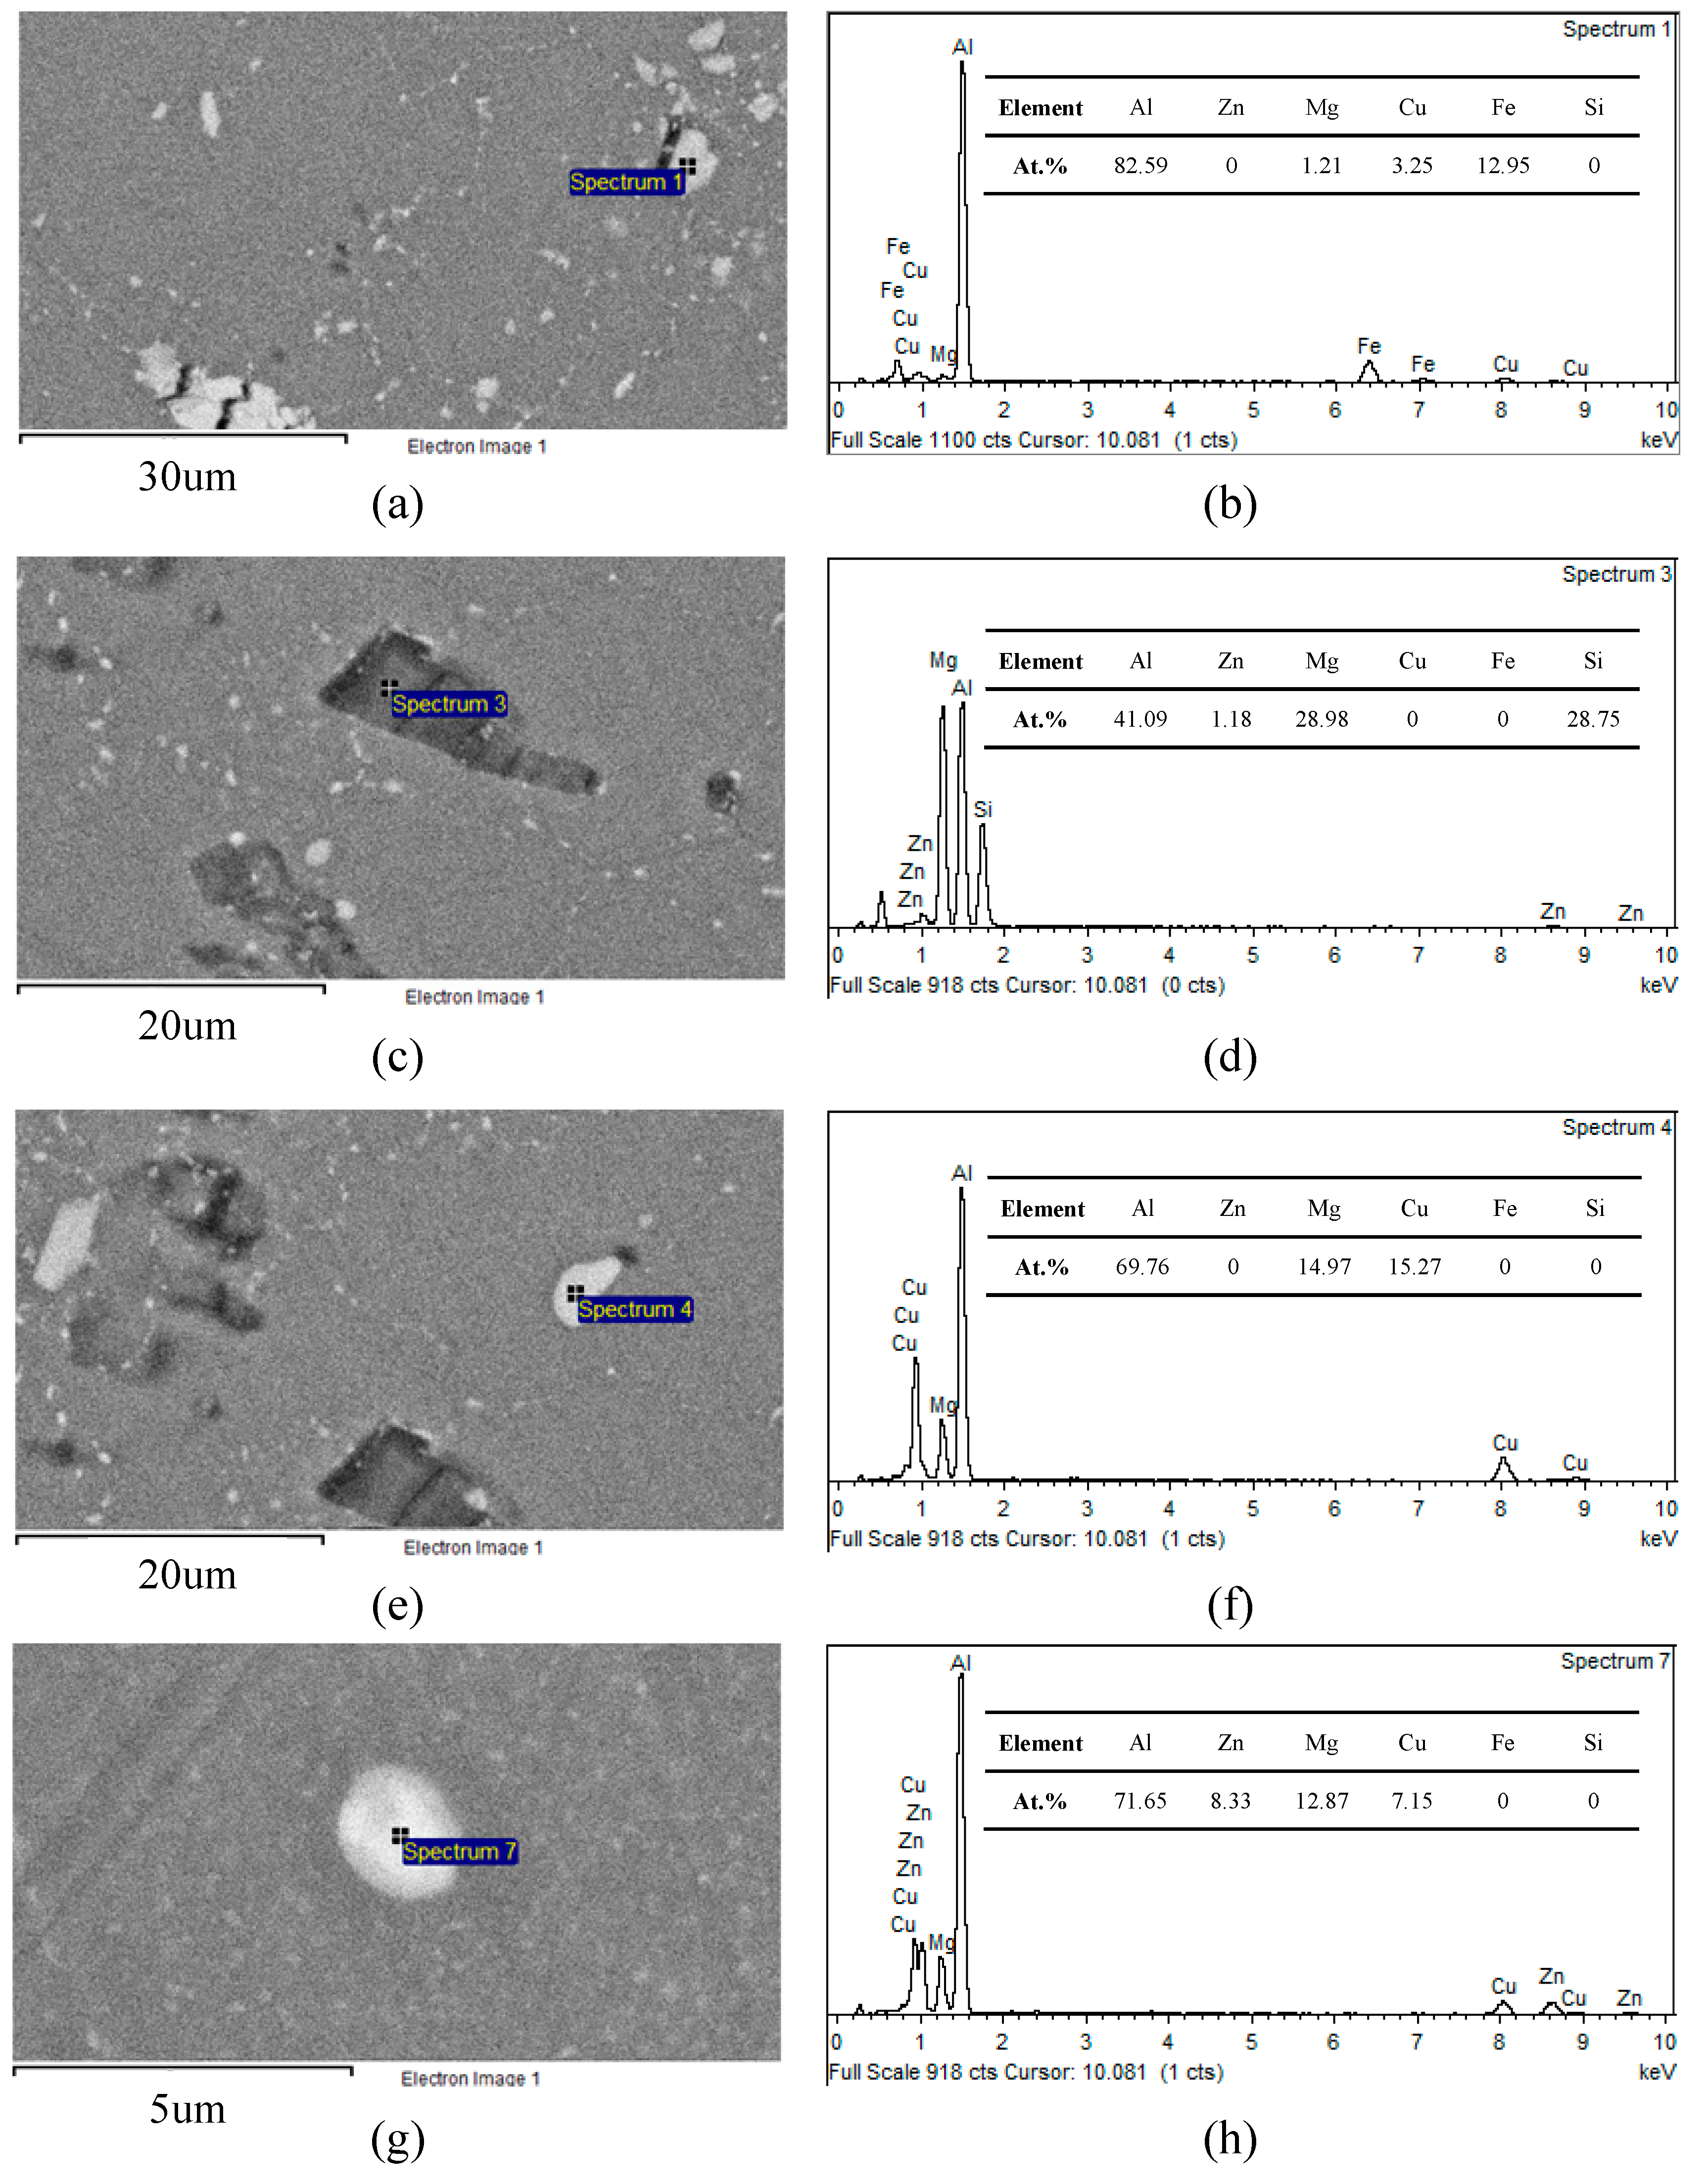
In Figure 4, the grey and black large particles are analyzed by EDS (Energy Dispersive Spectrometer). The results show that there are four kinds of large second phases in the 7075 aluminum alloy after solution treatment: Fe-rich (Al7Cu4Fe) phase (Figure 4a), Si-rich (MgSi) phase (Figure 4c), S (Al2CuMg) phase (Figure 4e), and T (AlZnMgCu) phase (Figure 4g). The Fe-rich phase, Si-rich phase, and S phase are larger primary phases of about 5–20 µm which are along the rolling direction, while the T phase is a dispersively distributed phase of about 0.5–3 µm.
In order to quantitatively express the effects of the solution time on the large second phase, the number and average size of the large second phases were measured and calculated by Image J software (Version 1.49, National Institutes of Health, Bethesda, MD, USA, 2015). Figure 5 shows the volume fraction of the large second phase with different solution times.
In Figure 5, under the 480 °C solution temperature, the volume fraction of the large second phase in the base decreases with the increase of the solution time, indicating that most of the remaining large second phases have dissolved in the base but not completely, and the undissolved phases with large size (Figure 4a,c,e) distribute along the rolling direction. After 0.5 h of solution time, the remaining phases are mostly large T phases, S phases, Fe-rich phases, and Si-rich phases. At that time, the volume fraction of the large second phases is about 1.27%. After 1.5 h, most of the T phases have dissolved in the base, and the volume fraction of the large second phases decreases to 0.86%, but still leaves a small portion of S phases, large Fe-rich phases, and large Si-rich phases. After 2 h, there are only impure phases such as large Fe-rich phases and large Si-rich phases in the base, and few T phases and S phases can be observed. At this time, the second phase is dissolved adequately, and the volume fraction is 0.54%, much less than before. Hence, the long solution time helps the dissolution of the second phases.
3.3. Effects of Solution Treatment on the Precipitated Phases
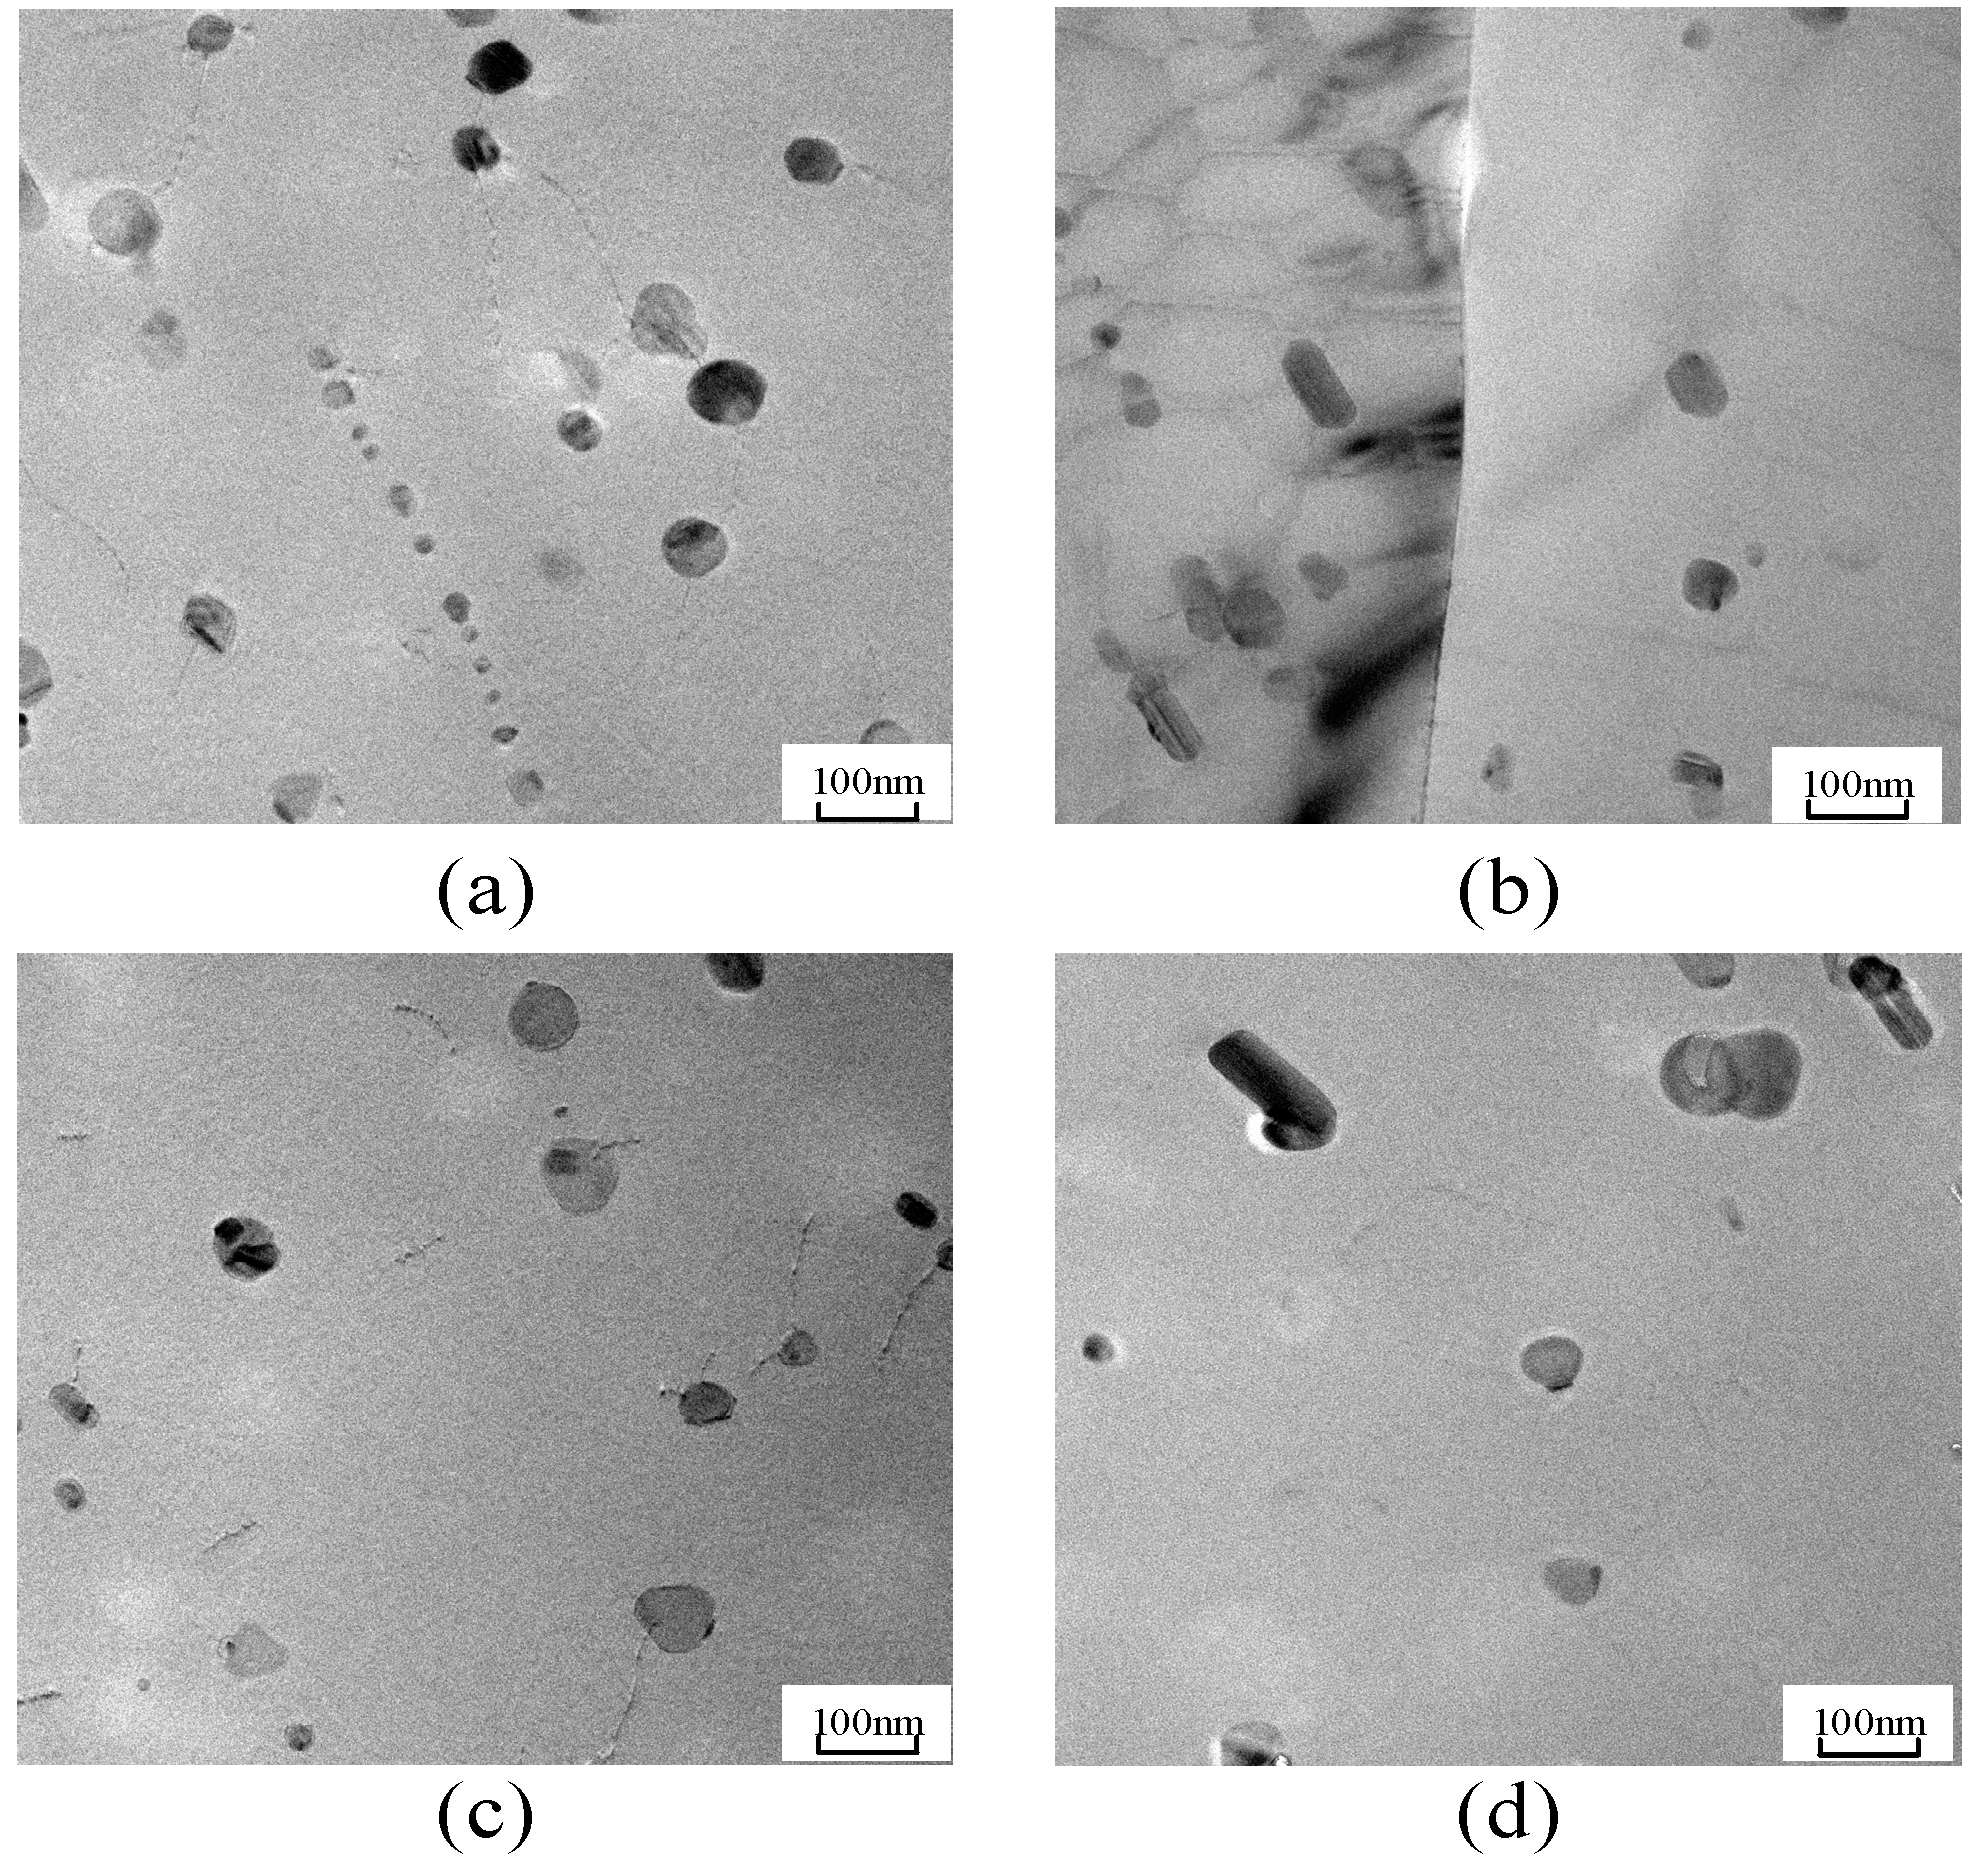
Figure 6 shows the results of the precipitated phases using TEM analysis of the 7075 aluminum alloy, that were solution treated with different times (0.5 h, 1.0 h, 1.5 h, and 2.0 h). After solution treatment, the dislocations in the base vanish in every picture. In Figure 6b, most of the precipitated phases dissolve in the base, and only a few second phases are left in the grains. With the increase of the solution treatment time, the density of the second phase decreases.
3.4. Effects of Solution Treatment on the High-Cycle Fatigue Life
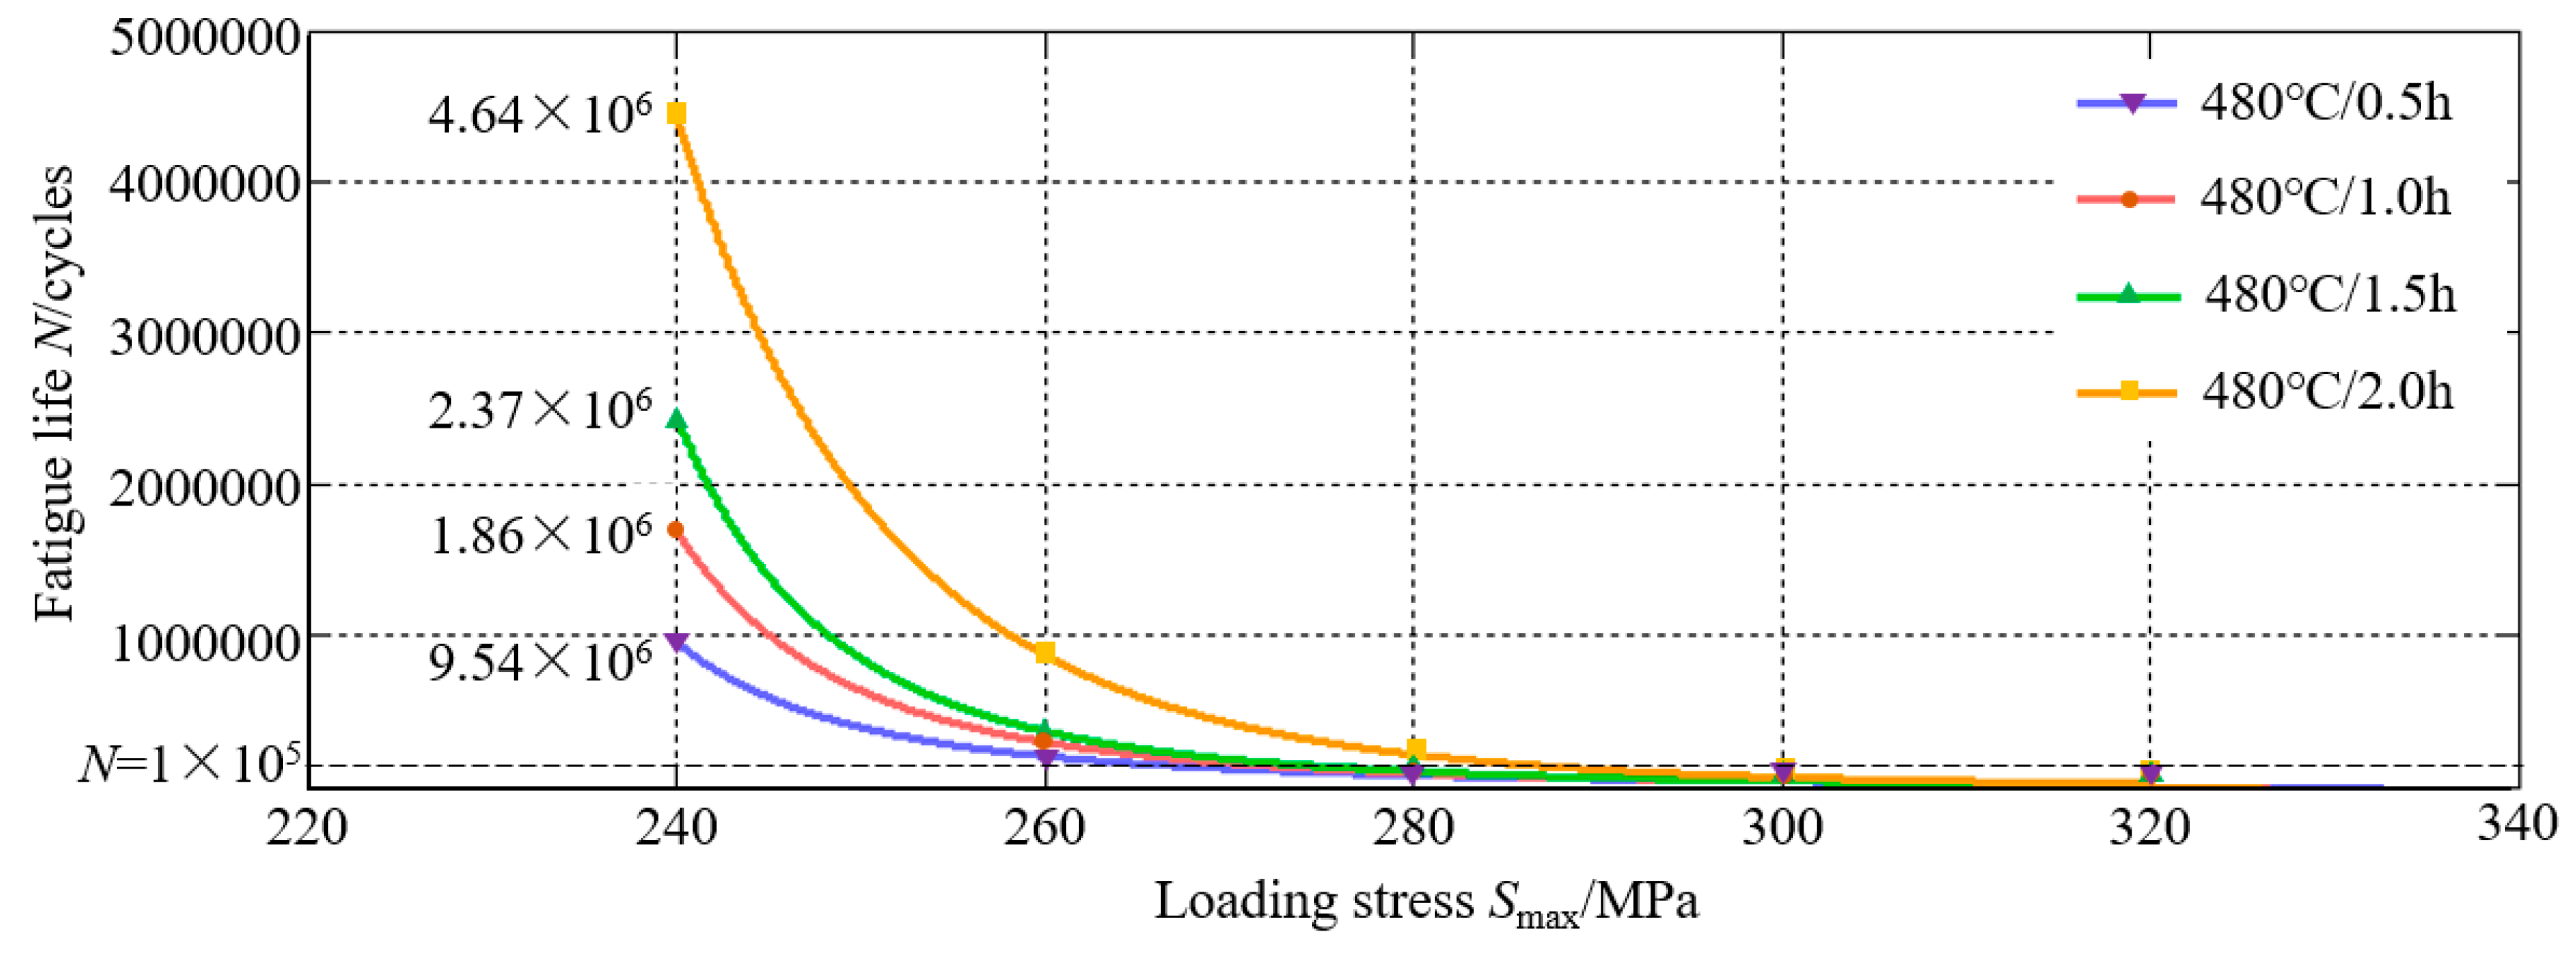
The data of the uniaxial fatigue life of the 7075 aluminum alloy, solution treated in 480 °C for different times, are listed in Table 2. As is shown in Table 2, when the axial loading stress is between 280 MPa and 320 MPa, most of samples’ fatigue life—N—is on the level of 104, while only the fatigue life of Case 4 (480 °C/2.0 h), at the stress level of 280 MPa, reaches the level of 105. When the axial loading stress decreases to 240 MPa, the fatigue life of most samples reach the level of 106. Only the fatigue life of the samples in Case 1 (480 °C/0.5 h) stays at the level of 105.
In addition, when the axial load stress is at a high stress level, greater than 300 MPa, the fatigue life of the specimens under the same loading stress is almost the same, less than 105 cycles. However, when the axial load stress is at a low stress level, less than 280 MPa, the high-cycle fatigue life is significantly different. For the average fatigue life data, see Figure 7.
When the high-cycle fatigue life exceeds 105 cycles, it is significantly improved with the prolongation of the solution time. Under the loading stress of 240 MPa, compared to that of 1.5 h, 1 h, and 0.5 h, the fatigue life with the solution time of 2 h was respectively improved about 95.7%, 149%, and 359%.
In order to obtain the S-N curves of the 7075 aluminum alloy, the Weibull equation (Equation (1)) is used to fit the data:
where a, b, and A are material constants, N is the fatigue life, and Smax is the maximum test stress. The fitting results are shown in Table 3.
Figure 8 shows the S-N curves of the 7075 aluminum alloy with different solution times. All the S-N curves have no horizontal asymptote, indicating that the 7075 aluminum alloy has no real fatigue limit. The fatigue life increases with the decrease of the stress level. Even though the stresses are at the same level, the fatigue life under different solution treatment times differs. As can be seen from the variation tendency of the S-N curve, when the stress is below a certain level, the fatigue life of all the samples can reach about 107 cycles. The data indicated by the arrows in Figure 8 illustrate that at those stress levels, when the loading cycles reached 107, the fatigue tests were stopped, while the specimens had not been fractured.
Table 4 shows the fatigue endurance of 7075-T651 and 7075 Al alloys after different solution treatments. and describe the fatigue endurance, which are equal to the maximum stress σmax at fatigue life N = 1 × 10⁶ and N = 1 × 10⁶, respectively [23]. From 0 to 2 h, the fatigue endurance at 0.5 h is 200 MPa, and at 2.0 h it is 231 MPa, indicating that an appropriate lengthening of the solution time is beneficial for the improvement of the fatigue properties of the 7075 aluminum alloy.
In addition, the experimental results were compared with the fatigue endurance of 7075-T651 in references [24,25,26], and the effects of the stress ratio R were taken into account with the Walker equation (Equation (2)) [27].
where M is the intercept constant at 1 cycle for a stress-life curve, γ is the fitting constant for the Walker method, and n is the exponent constant for a stress-life curve.
The value of and in references [24,25,26] are about 250 MPa and 200 MPa. The results show that there is a certain deviation in the value, which may be due to the machine conditions, fitting model, specimen surface treatment process differences, but the values are relatively close to our result, which also verifies the reliability of the fatigue test results.
3.5. Analysis of the Morphology of High-Cycle Fatigue Fractures
In Figure 7, at the applied stress level of 260 MPa, the fracture belongs to high-cycle fatigue fracture, with the fatigue life of all the samples exceeding 105. Therefore, the fatigue fracture under the applied stress of 260 MPa was observed using scanning electron microscopy.
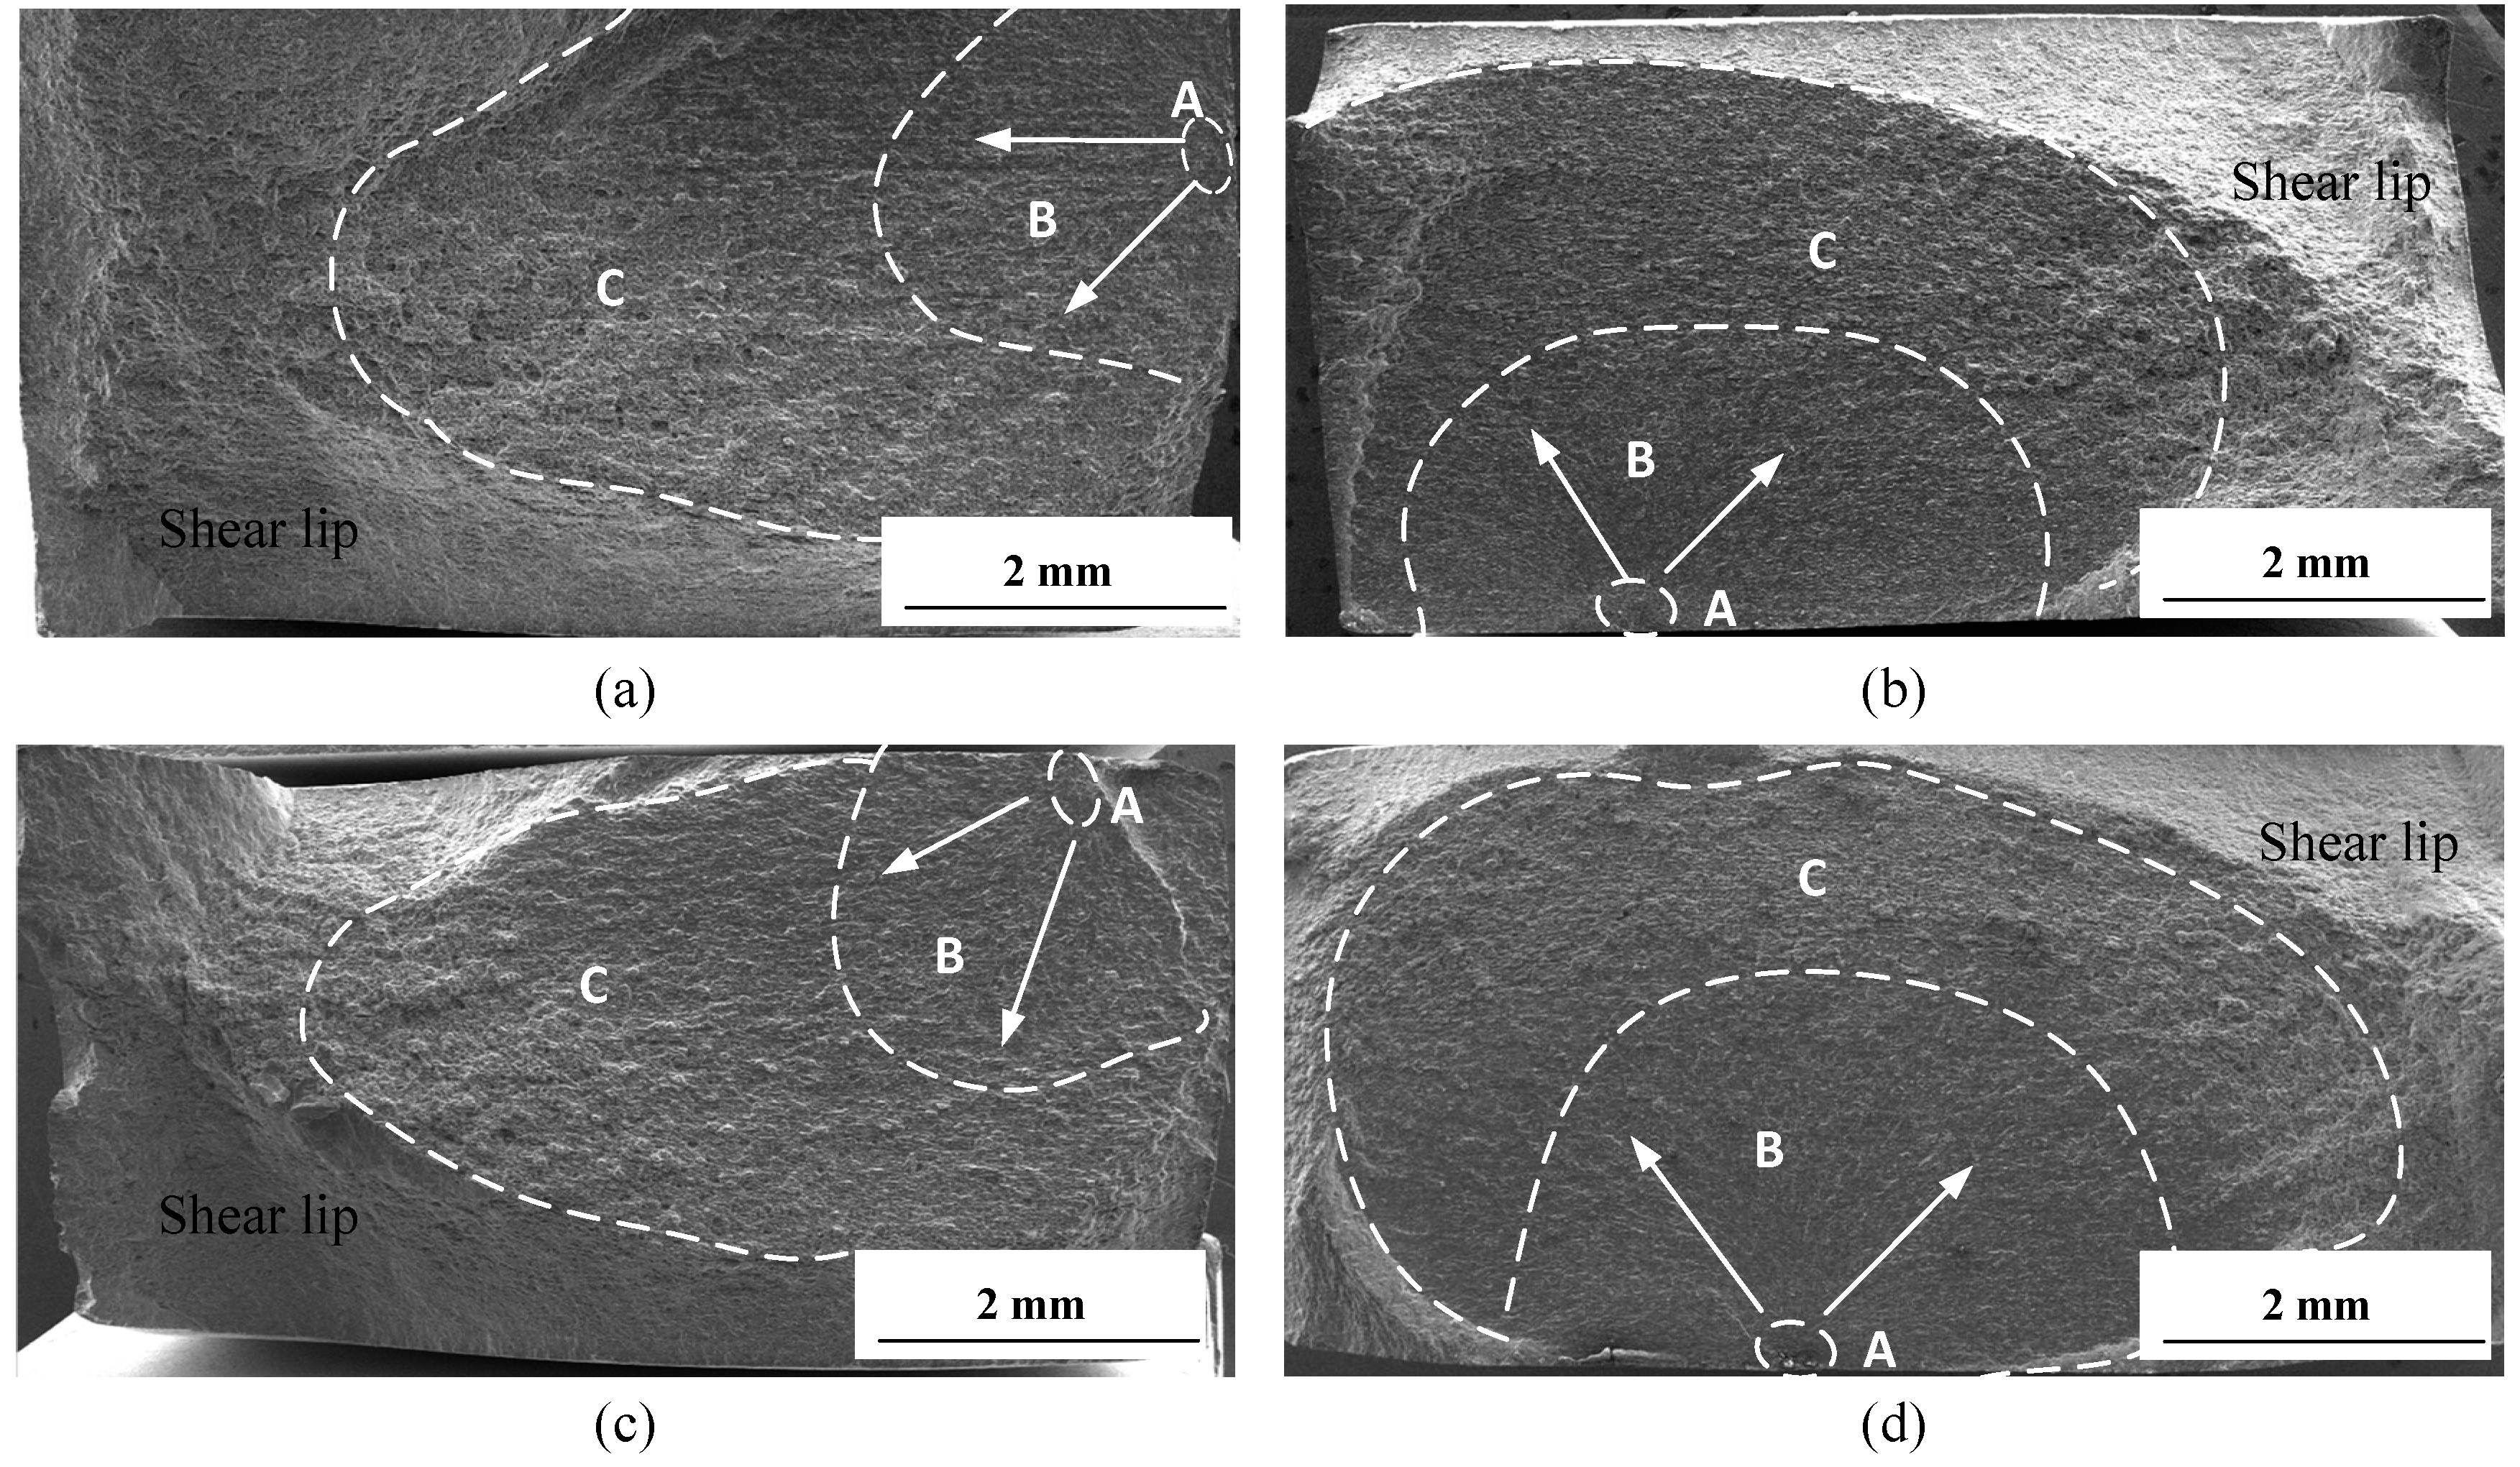
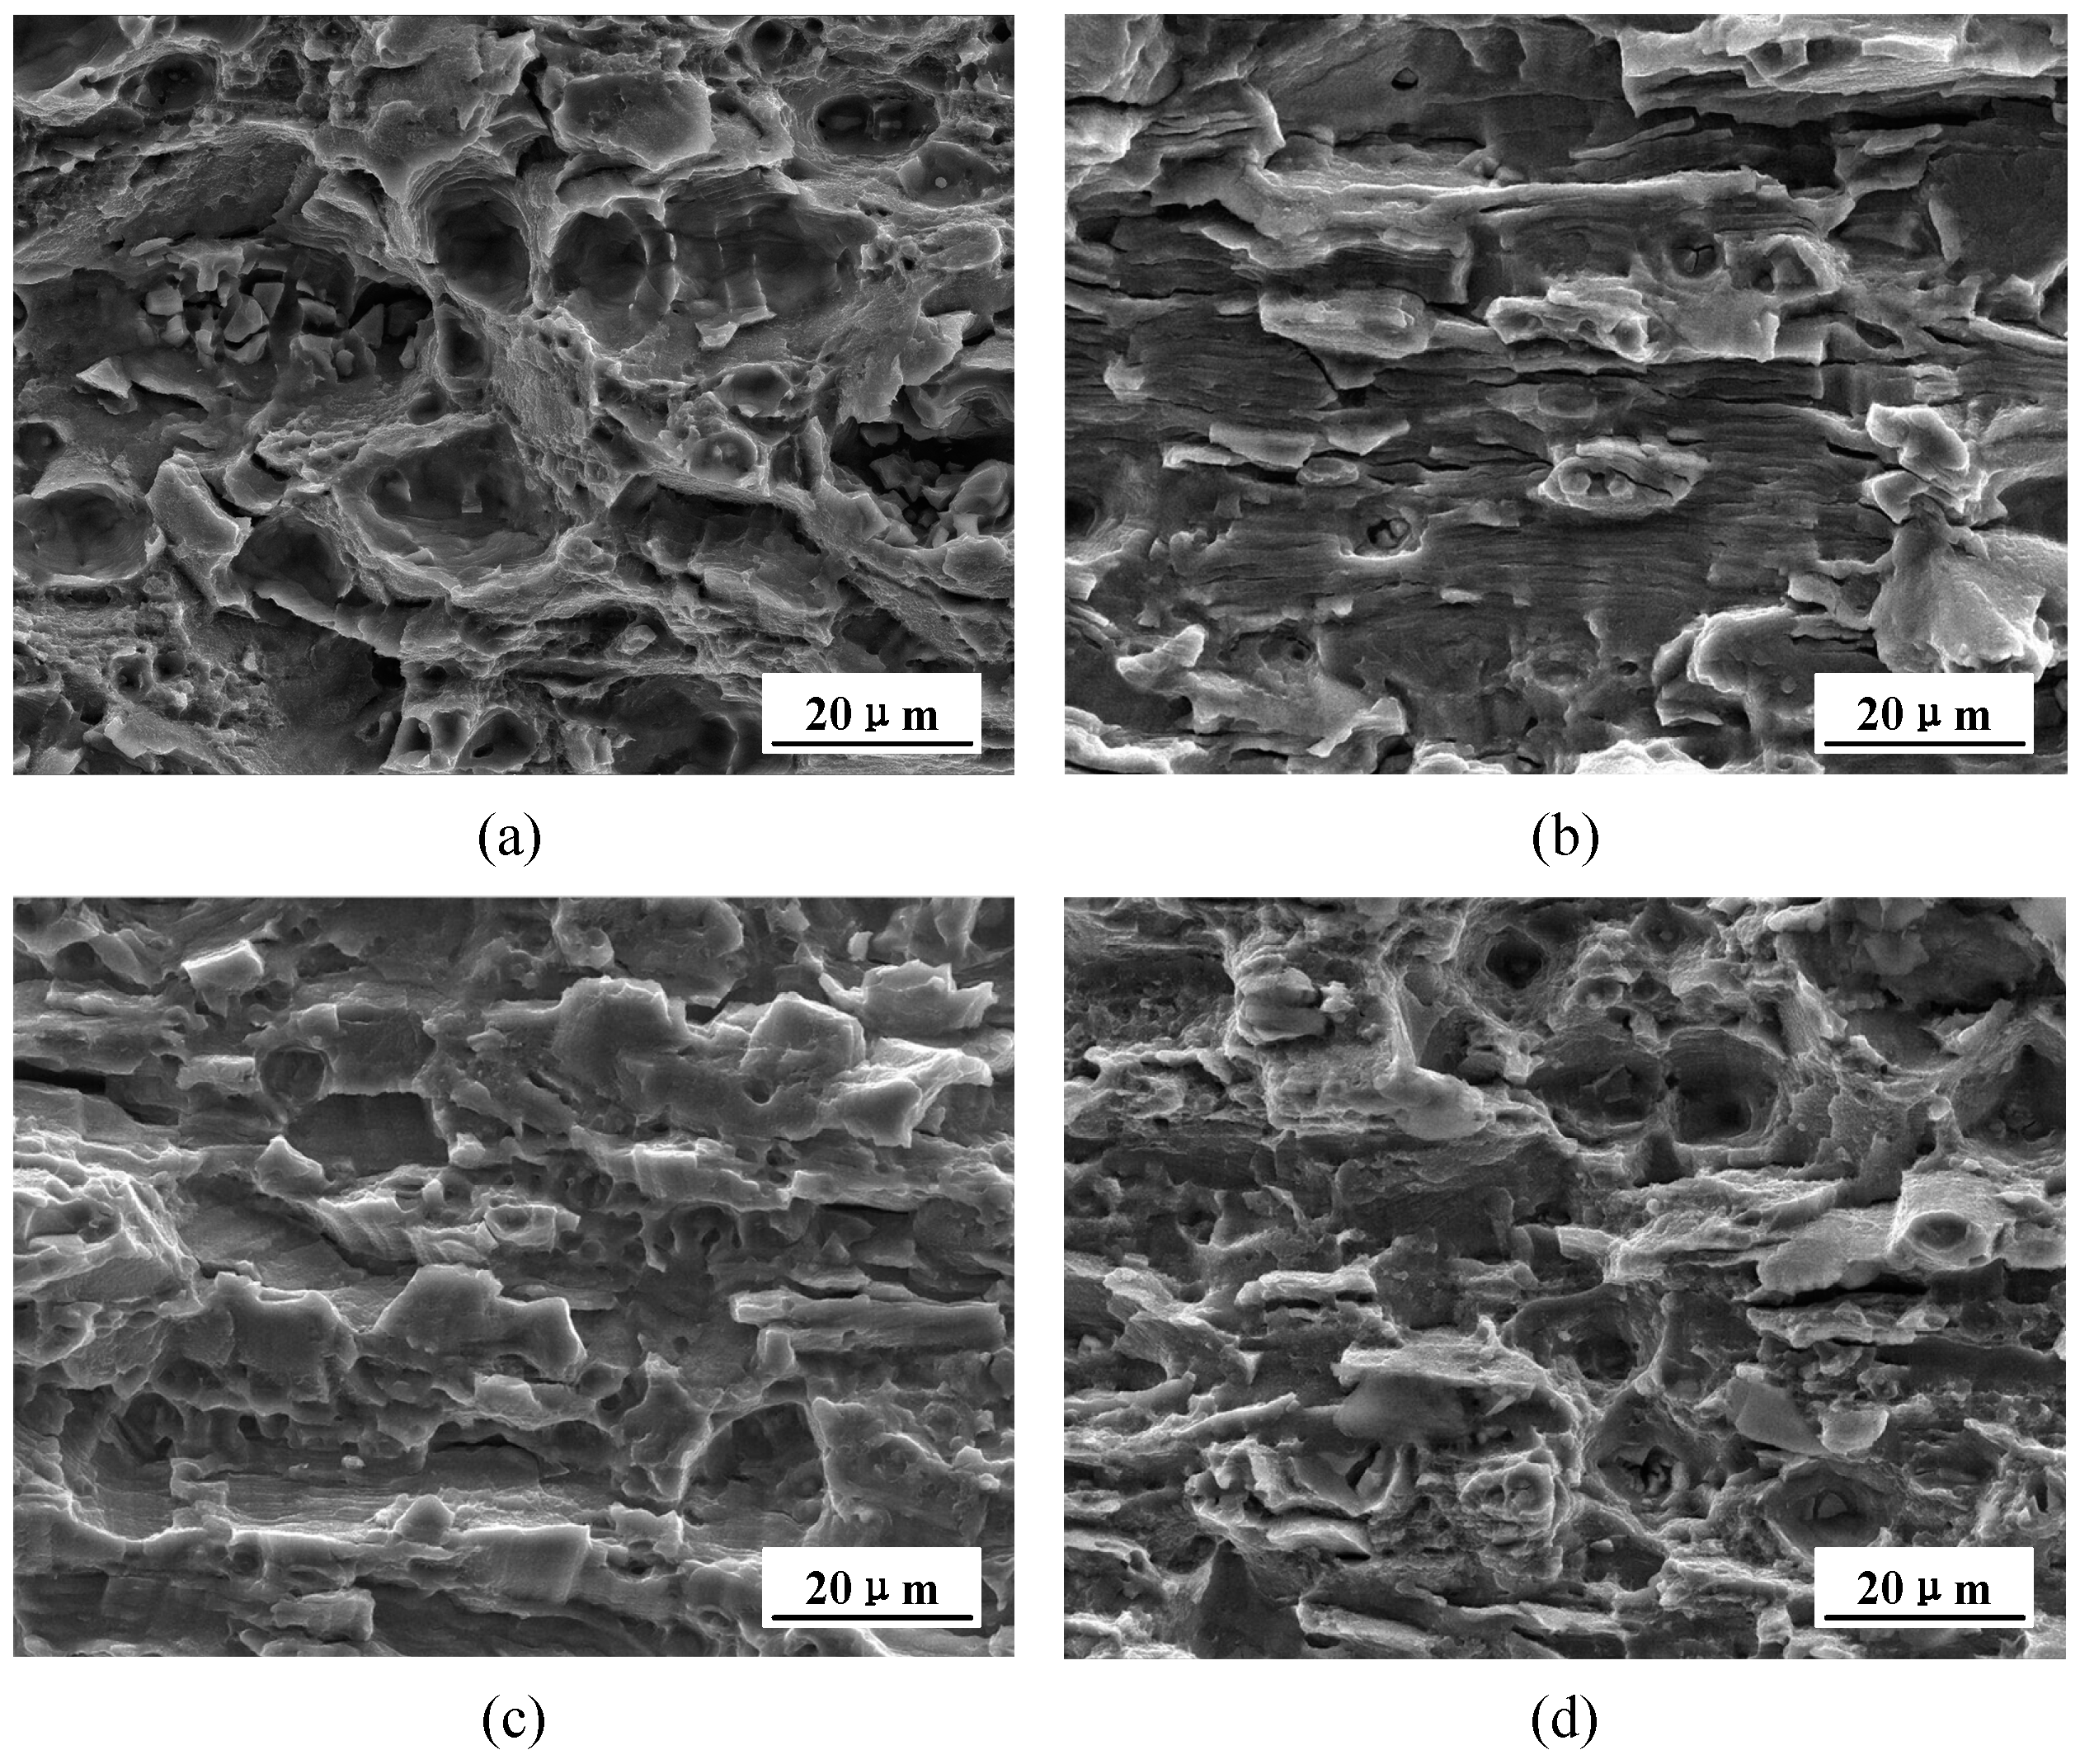
Figure 9 shows the overall morphology of the high-cycle fatigue fractures. The fatigue fracture is made up of three regions, i.e., fatigue crack initiation region (A), crack propagation region (B), and fatigue final rupture region (C). The fatigue crack initiation region (A) is the smallest region near the surfaces of the samples. The crack propagation region (B), close to region (A), and with obvious characteristics of “radial cracks”, is a smooth region. The arrows in the figure indicate the direction of crack propagation. With the continuous extension of fatigue cracks, the extension area constantly expands, the “radial cracks” gradually become sparse, and the crack propagation speed is also gradually accelerated. When exceeding the critical crack value, the specimen is broken simultaneously, forming a rupture region (C). The final rupture region (C) is a rough region, granulated and surrounded by shear lips of various sizes.
Figure 10 shows the SEM morphologies of the fatigue crack initiation region. The fatigue cracks in Figure 10a–c all initiate near the surfaces of the samples. The initiation of the cracks is the result of local shear stress. Under the cyclic loads, small slip bands are generated due to the dislocation movement of the alloy surface, and hence the initiation of the cracks in the slip band occurs. In Figure 10d, the cracks stem from the impure phases close to the alloy surface. Studies show that the large remaining phases in the 7075 aluminum alloy are mainly made up of undissolved T phases, S phases, Fe-rich phases, and Si-rich phases. The fatigue cyclic loads make dislocations slip to impure phases and pile up, and stress concentration is thus formed. When the stress is larger than the fracture strength and bonding strength with the base, the impure phases will be broken or separated from the bonding phases with the base, hence forming the cracks. Figure 10 also shows that the radial lines are centered around the fatigue initiation area (A). This is because in the process of expansion, the crack front is deviated in the direction of expansion due to the difference resistance, so that the crack begins to expand along a series of planes with a height difference, and the different fracture surfaces intersect to form a step. These steps constitute the characteristic morphology of the radial lines on the fatigue fracture.
The process of crack propagation is divided into two stages [14]. In the first stage, the cracks propagate along the direction with the maximum shear stress, extending to the depth of one or several grains. In the second stage, due to the principal stress on the crack tips, the cracks propagate in the plane perpendicular to the maximum normal stress. This propagation plane is a large one with obvious fatigue striations.
Figure 11 shows the SEM morphologies of the first stage of crack propagation. The fracture in this stage presents a zigzag plane [28]; with no obvious fatigue striations, it belongs to the shear fracture. Additionally, around the shear zone there are some micro-voids which are formed by the undissolved phases and bases under the fatigue loads.
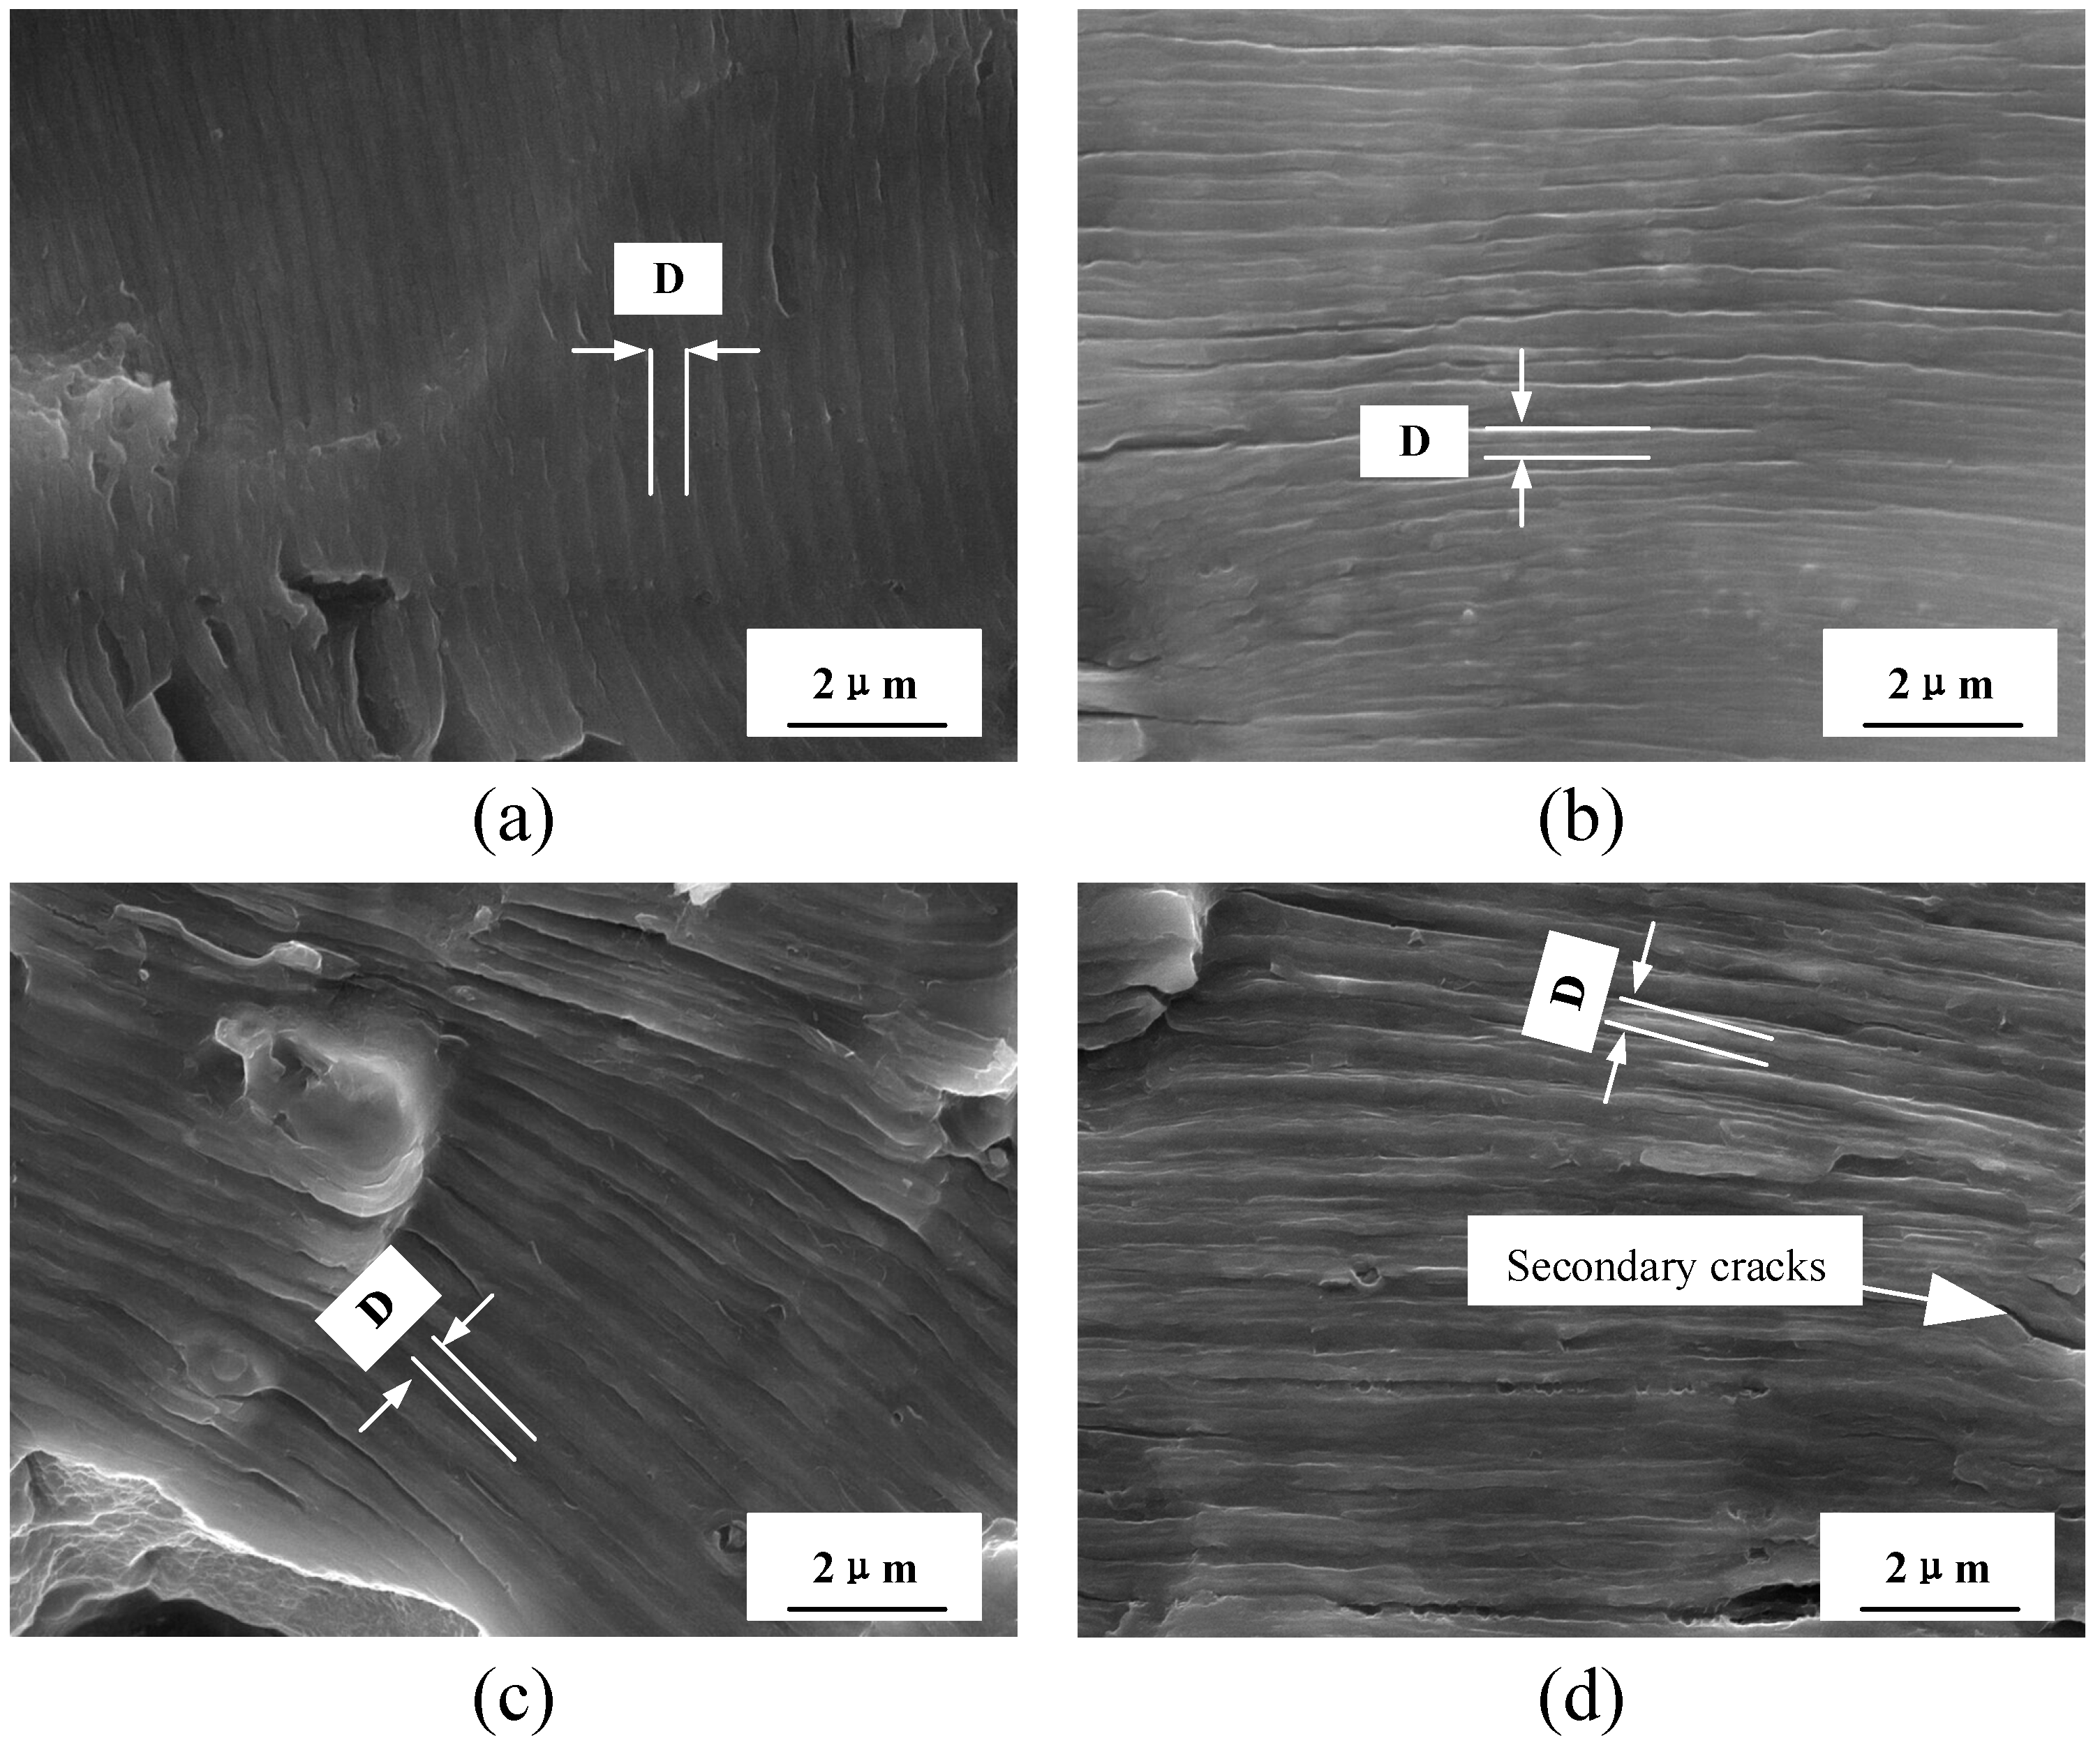
Figure 12 shows the SEM morphologies of the second stage of crack propagation. Distinct fatigue striations are highly visible. The intervals of the fatigue striations are stable, indicating a stable propagation of the cracks. Meanwhile, in the direction parallel to the fatigue striations, there are a number of secondary cracks propagating from the surface of the fracture to the interior, appearing in an interrupted distribution. The depth of the cracks is much longer than that on the fracture. Due to the secondary cracks, the paths of the crack propagation become more complex. The secondary cracks are able to lower the drivers of propagation and promote the resistance to propagation. With the 2 h solution treatment, there are more secondary cracks on the fracture, decreasing the crack propagation rate, and the fatigue life and fatigue limit are thus promoted.
In Figure 13, L is the distance from the fatigue crack initiation region to the observation point. At the observation point, five adjacent striation spacings were measured, and then the average value of these adjacent striation spacings were regarded as the width of the fatigue striation—D. Figure 13 shows that the interval of fatigue striations increases following the growth of the cracks, indicating a steady growth of the cracks in this region; the interval decreases with the increase of the solution treatment time. At the same position of 1.5 mm and 2.0 mm, the fatigue striation at a solution time of 2 h is only 0.38 μm and 0.24 μm, respectively, which were relatively small. Under the same conditions, the smaller the fatigue striations are, the higher the fatigue life is. The changing trends are consistent with the data shown in Figure 7.
Figure 14 presents the SEM images of the final rupture region. The fractures are mainly made up of dimples. In addition, in the fatigue final rupture region, there are a lot of tearing ridges tearing ridges similar to the fracture characteristics under static tension. With the 2 h solution treatment time, the distribution of the dimples is more uniform than the other fractures.
4. Conclusions
The effect on the high-cycle fatigue properties and the microstructure of a typical Al-Zn-Mg-Cu alloy after different solution treatments are discussed in this paper. Some important conclusions can be made as follows:
- As the solution treatment time increases, different levels of recrystallization and grain growth occur in the studied alloy. The recrystallized grains merge and extend outward, flattening the crystal boundaries. When the solution treatment time is 2 h, most boundaries of adjacent grains disappear, becoming continuous rather than interrupted. Recrystallization is obvious and the average grain sizes are large.
- The large secondary phases in the Al-Zn-Mg-Cu alloy are mainly undissolved T phase, S phase, Fe-rich phase, and Si-rich phase. Appropriate extension of the solution time can promote the dissolution of the second phase particles, reduce the number and size of the second phase particles, and improve the degree of solid solution of the alloy, so that the alloy microstructure is more uniform.
- The solution time has a significant influence on the high-cycle fatigue properties of the Al-Zn-Mg-Cu alloy, especially when the fatigue life exceeds the 105 level at low stress levels. The large second phases gradually dissolve with the increase of the solution time, which can lower the probability of crack initiation. In the second stage of crack propagation, fatigue striations and secondary cracks are obviously observed. The number of secondary cracks increases with extending the solution time, which can reduce the drive force and crack propagation growth rate, promoting the high-cycle fatigue properties of the Al-Zn-Mg-Cu alloy. The changing trend of the fatigue striation interval validated this conclusion.
Acknowledgments
This work was supported by the National Natural Science Foundation of China (No. 51375500), the Fundamental Research Funds for the Central Universities of Central South University (No. 2015zzts038x), and Science and Technology Research Projects of Universities in Hebei China (No. ZC2016030).
Author Contributions
Chi Liu and Yilun Liu conceived and designed the experiment; Chi Liu and Liyong Ma performed the experiments; Chi Liu and Jiuhuo Yi analyzed the data; Jiuhuo Yi contributed reagents, materials, and analysis tools; Chi Liu wrote the paper.
Conflicts of Interest
The authors declare no conflicts of interest.
References
- Andreatta, F.; Terryn, H.; de Wit, J.H.W. Effect of solution heat treatment on galvanic coupling between intermetallics and matrix in AA7075-T6. Corros. Sci. 2003, 45, 1733–1746. [Google Scholar] [CrossRef]
- Fernandez Gutierrez, R.; Sket, F.; Maire, E.; Wilde, F.; Boller, E.; Requena, G. Effect of solution heat treatment on microstructure and damage accumulation in cast Al-Cu alloys. J. Alloys Compd. 2017, 697, 341–352. [Google Scholar] [CrossRef]
- Xiong, C.X.; Deng, Y.L.; Wan, L.; Zhang, X.M. Evolutions of microstructures and textures of 7050 Al alloy plate during solution heat treatment. Chin. J. Nonferr. Met. 2010, 20, 427–434. [Google Scholar]
- Jie, L.I.; Song, R.; Chen, X. Study on strengthening solution treatment for 7050 high strength aluminum alloy. Hot Work. Technol. 2009, 38, 125–128. [Google Scholar]
- Deng, Y.L.; Wan, L.; Zhang, Y.; Zhang, X.R. Effect of solution treatment on quenched depth of 7050-T6 aluminum alloy. Heat Treat. Met. 2009, 34, 44–47. [Google Scholar]
- Wang, H.B.; Meng, F.L.; Zhao, H.Y.; Cai, Y.H.; Zhang, J.S. Effects of solid solution treatment on microstructure and properties of cast-rolled 7050 aluminum alloy. Trans. Mater. Heat Treat. 2013, 34, 99–103. [Google Scholar]
- Zeng, Z.; Peng, B.; Zeng, S.; Jiang, H.; Ning, A. Effects of progressive solution treatment on microstructure and mechanical properties of 7055 aluminum. Spec. Cast. Nonferr. Alloys 2009, 29, 672–674. [Google Scholar]
- Chen, K.; Liu, H.; Zhang, Z.; Li, S.; Todd, R.I. The improvement of constituent dissolution and mechanical properties of 7055 aluminum alloy by stepped heat treatments. J. Mater. Process. Technol. 2003, 142, 190–196. [Google Scholar] [CrossRef]
- Senkov, O.N.; Shagiev, M.R.; Senkova, S.V.; Miracle, D.B. Precipitation of Al3(Sc, Zr) particles in an Al-Zn-Mg-Cu-Sc-Zr alloy during conventional solution heat treatment and its effect on tensile properties. Acta Mater. 2008, 56, 3723–3738. [Google Scholar] [CrossRef]
- Davies, R.K.; Randle, V.; Marshall, G.J. Continuous recrystallization related phenomena in a commercial Al-Fe-Si alloy. Acta Mater. 1998, 46, 6021–6032. [Google Scholar] [CrossRef]
- Hailin, Y.; Shouxun, J.; Zhongyun, F. Effect of heat treatment and Fe content on the microstructure and mechanical properties of die-cast Al-Si-Cu alloys. Mater. Des. 2015, 85, 823–832. [Google Scholar]
- Nayak, I.K.; Rao, S.V.R.; Kapoor, K. Effect of heat treatment and surface condition on inter-granular corrosion of alloy 800. Mater. Perform. Charact. 2016, 5, 239–252. [Google Scholar] [CrossRef]
- Lazaro, J.; Solorzano, E.; Escudero, J.; de Saja, J.A.; Rodriguez-Perez, M.A. Applicability of solid solution heat treatments to aluminum foams. Metals 2012, 2, 508–528. [Google Scholar] [CrossRef]
- Gang, L.; Jun, S.; Ce-Wen, N.; Kang-Hua, C. Experiment and multiscale modeling of the coupled influence of constituents and precipitates on the ductile fracture of heat-treatable aluminum alloys. Acta Mater. 2005, 53, 3459–3468. [Google Scholar]
- Song, F.X.; Zhang, X.M.; Liu, S.D.; Bai, T.; Han, N.M.; Tan, J.B. Effects of solution heat treatment on microstructure and corrosion properties of 7050 Al alloy. J. Aeronaut. Mater. 2013, 33, 14–21. [Google Scholar]
- Yan, L.; Du, F.S.; Dai, S.L.; Yang, S.J. Effect of microstructures on fatigue crack propagation in 2E12 aluminum alloy. Chin. J. Nonferr. Met. 2010, 20, 1275–1281. [Google Scholar]
- Fan, X.; Jiang, D.; Zhong, L.; Wang, T.; Ren, S. Influence of microstructure on the crack propagation and corrosion resistance of Al-Zn-Mg-Cu alloy 7150. Mater. Charact. 2007, 58, 24–28. [Google Scholar] [CrossRef]
- Zhao, T.; Zhang, J.; Jiang, Y. A study of fatigue crack growth of 7075-T651 aluminum alloy. Int. J. Fatigue 2008, 30, 1169–1180. [Google Scholar] [CrossRef]
- Rong, L.; Yingping, J.; Shijie, W.; Shuzhen, L. Effect of microstructure on fracture toughness and fatigue crack growth behavior of Ti17 alloy. Metals 2016, 6, 186. [Google Scholar] [CrossRef]
- Okazaki, Y. Comparison of fatigue properties and fatigue crack growth rates of various implantable metals. Materials 2012, 5, 2981–3005. [Google Scholar] [CrossRef]
- Krahmer, D.M.; Polvorosa, R.; López de Lacalle, L.N.; Alonso-Pinillos, U.; Abate, G.; Riu, F. Alternatives for specimen manufacturing in tensile testing of steel plates. Exp. Tech. 2016, 40, 1555–1565. [Google Scholar] [CrossRef]
- Avilés, R.; Albizuri, J.; Rodríguez, A.; López de Lacalle, L.N. Influence of low-plasticity ball burnishing on the high-cycle fatigue strength of medium carbon aisi 1045 steel. Int. J. Fatigue 2013, 55, 230–244. [Google Scholar] [CrossRef]
- Benedetti, M.; Fontanari, V.; Bandini, M.; Taylor, D. Multiaxial fatigue resistance of shot peened high-strength aluminum alloys. Int. J. Fatigue 2014, 61, 271–282. [Google Scholar] [CrossRef]
- Han, J.; Dai, Q.-X.; Zhao, Y.-T.; Li, G.-R. Study on fatigue performance of 7075-T651 aluminum alloys. J. Aeronaut. Mater. 2010, 30, 92–96. [Google Scholar]
- Trško, L.; Guagliano, M.; Bokůvka, O.; Nový, F. Fatigue life of AW 7075 aluminium alloy after severe shot peening treatment with different intensities. Procedia Eng. 2014, 74, 246–252. [Google Scholar] [CrossRef]
- Oskouei, R.H.; Ibrahim, R.N. The effect of a heat treatment on improving the fatigue properties of aluminium alloy 7075-T6 coated with TiN by PVD. Procedia Eng. 2011, 10, 1936–1942. [Google Scholar] [CrossRef]
- Dowling, N.E.; Calhoun, C.A.; Arcari, A. Mean stress effects in stress-life fatigue and the walker equation. Fatigue Fract. Eng. Mater. Struct. 2009, 32, 163–179. [Google Scholar] [CrossRef]
- Le Jolu, T.; Morgeneyer, T.F.; Denquin, A.; Gourgues-Lorenzon, A.F. Fatigue lifetime and tearing resistance of AA2198 Al-Cu-Li alloy friction stir welds: Effect of defects. Int. J. Fatigue 2015, 70, 463–472. [Google Scholar] [CrossRef]
Figure 1.
Smooth rectangular specimen of the fatigue sample (mm).
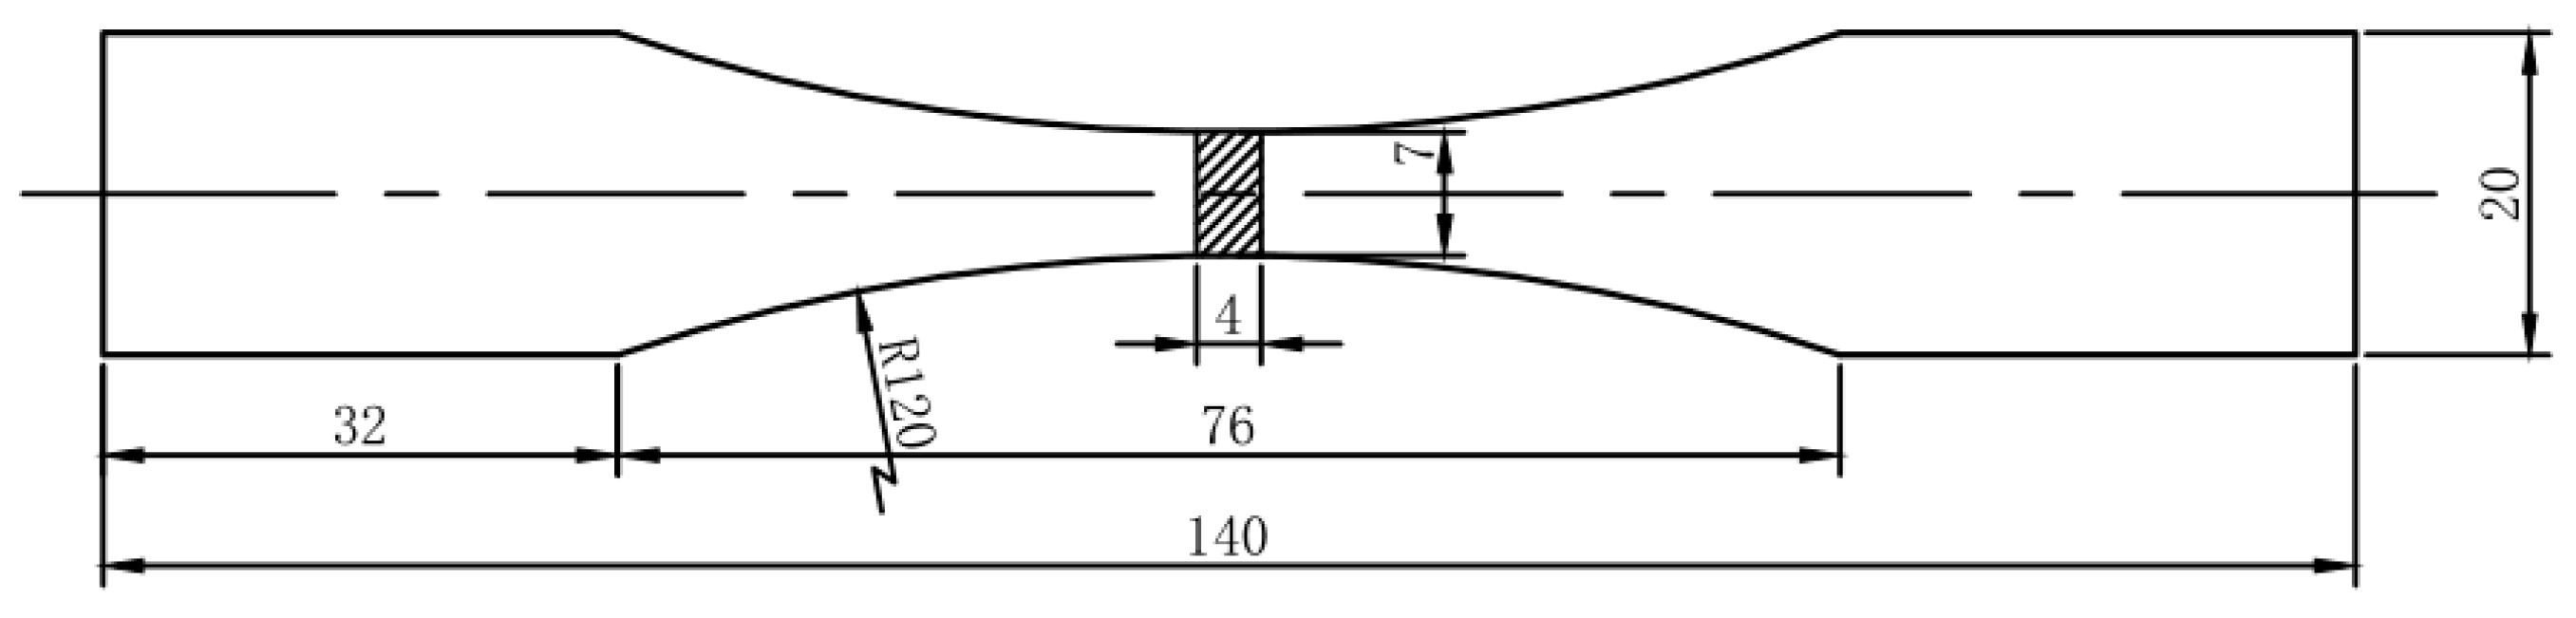
Figure 2.
Microstructure of the 7075 aluminum alloy with a solution time of (a) 0.5 h; (b) 1.0 h; (c) 1.5 h; (d) 2.0 h.
Figure 2.
Microstructure of the 7075 aluminum alloy with a solution time of (a) 0.5 h; (b) 1.0 h; (c) 1.5 h; (d) 2.0 h.
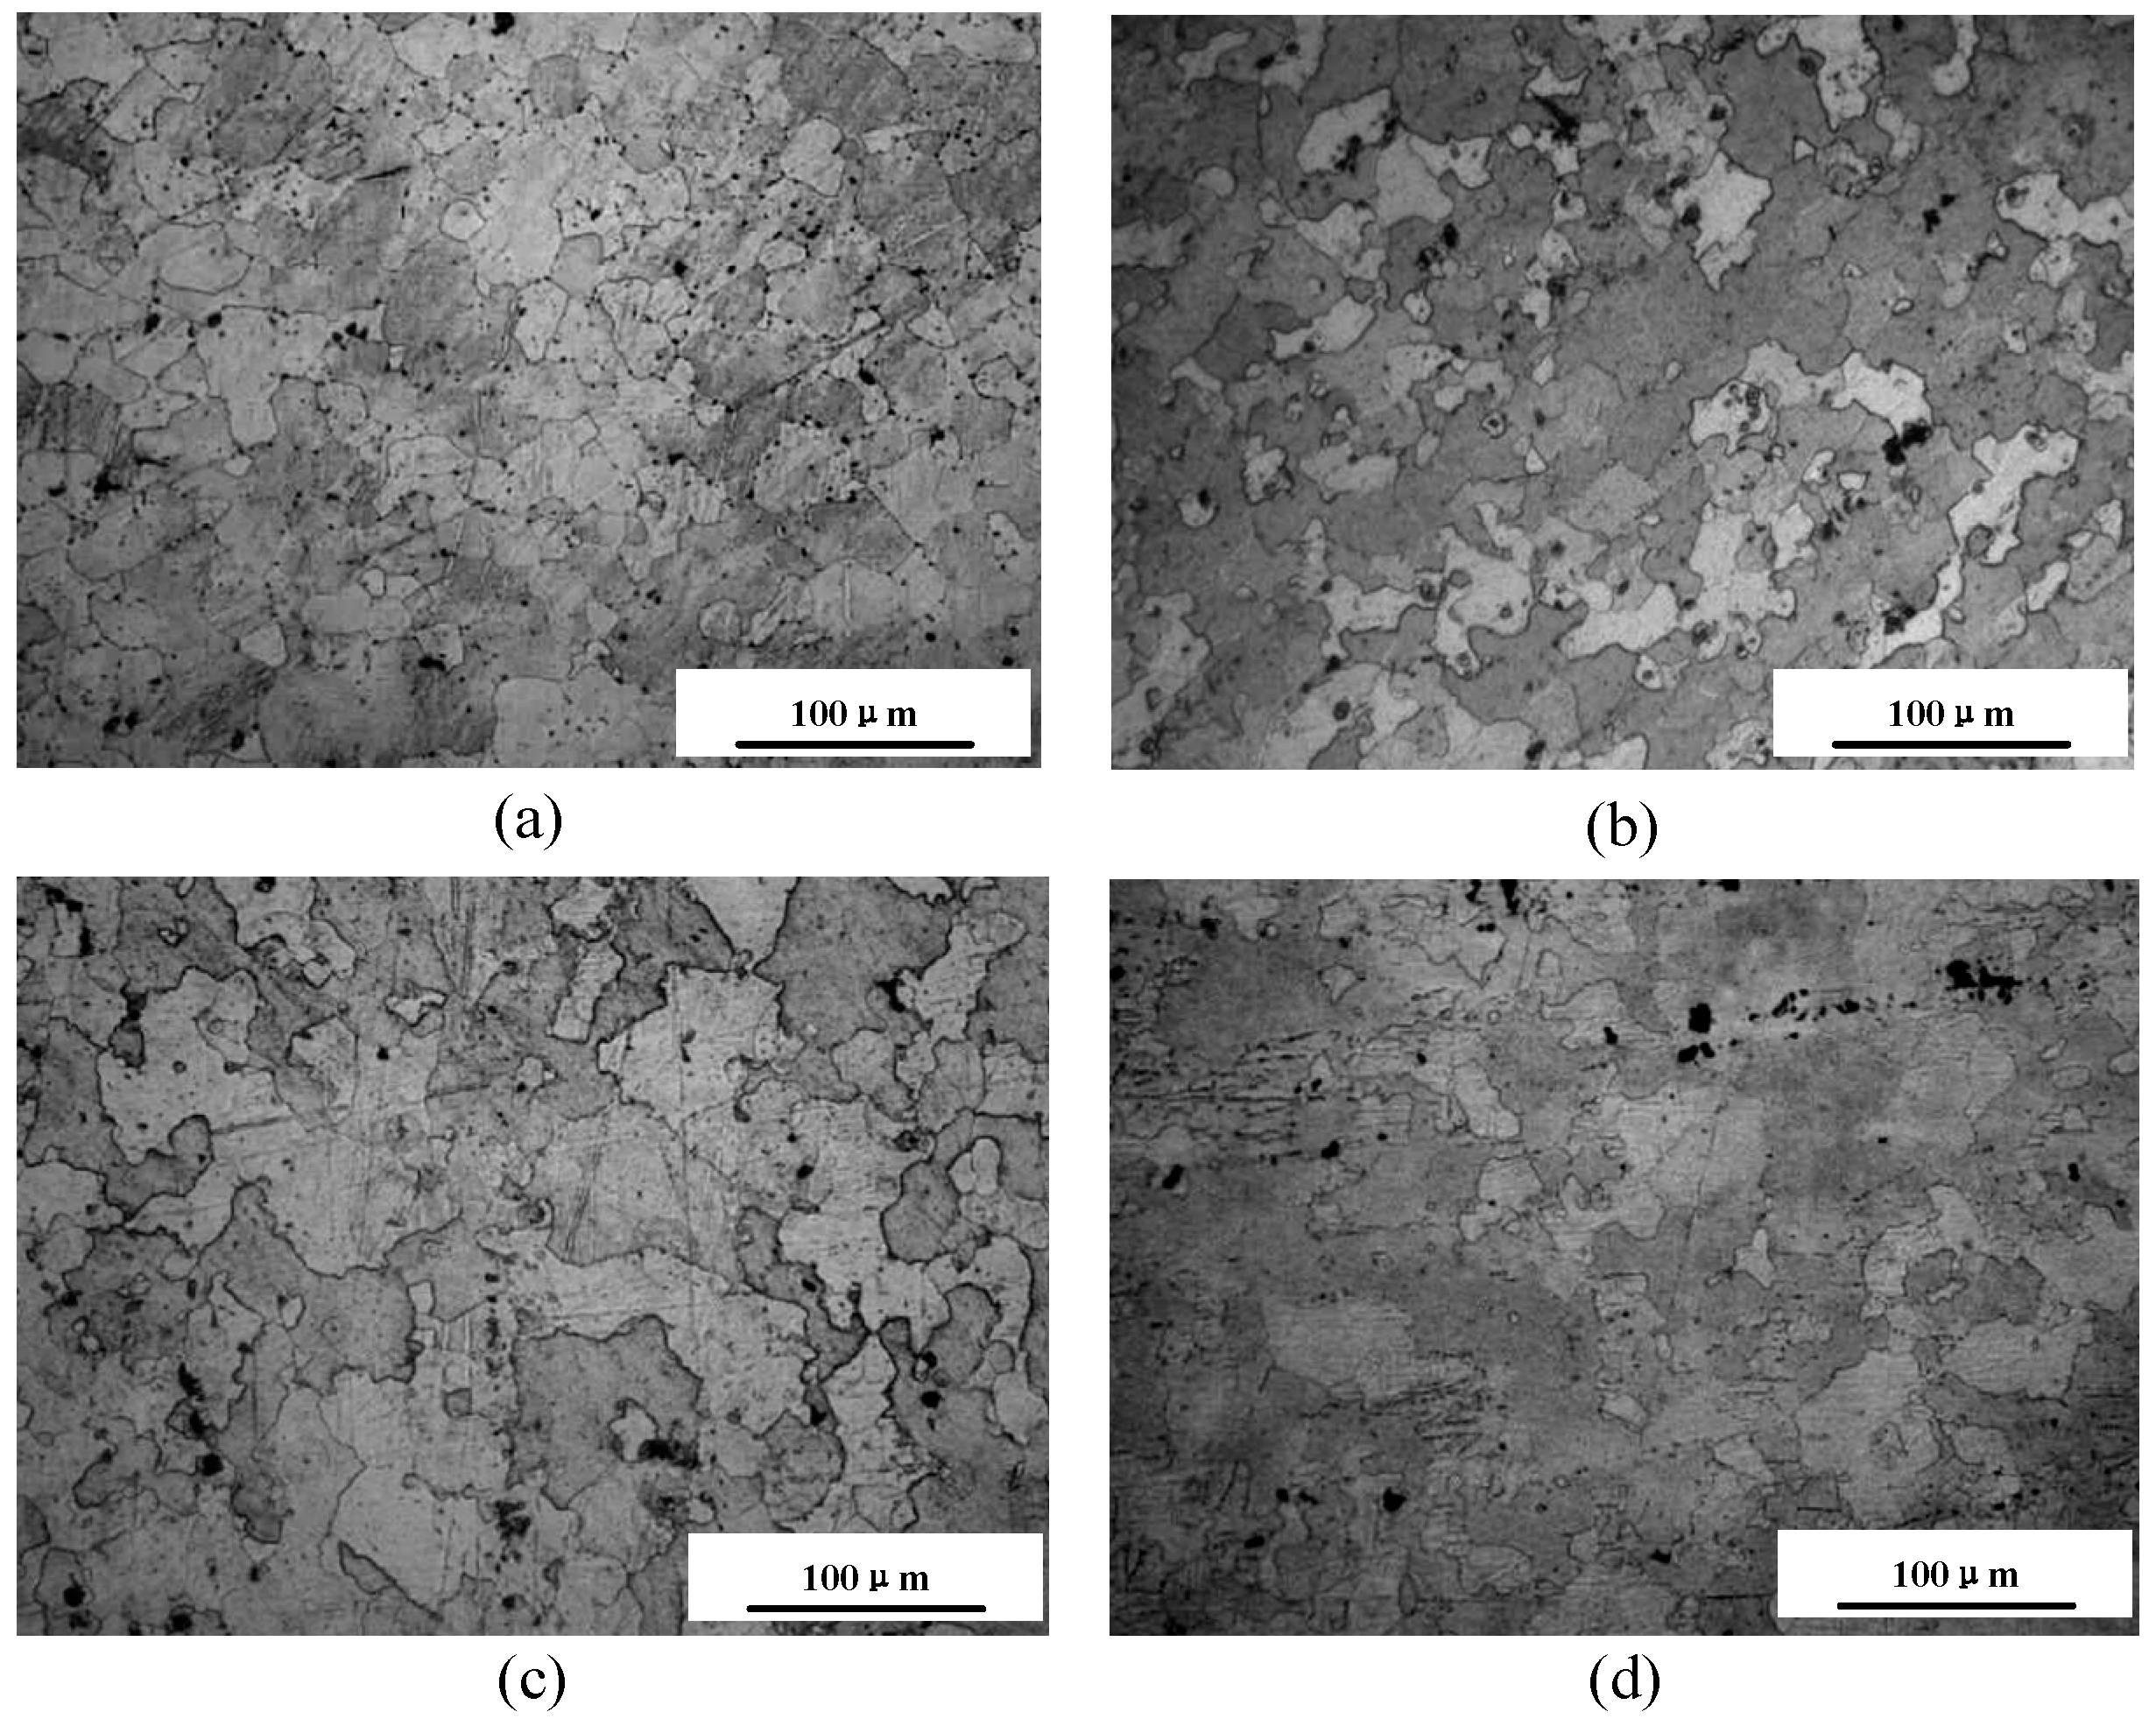
Figure 3.
Distribution of the second phase in the 7075 aluminum alloy with a solution time of (a) 0.5 h; (b) 1.0 h; (c) 1.5 h; (d) 2.0 h.
Figure 3.
Distribution of the second phase in the 7075 aluminum alloy with a solution time of (a) 0.5 h; (b) 1.0 h; (c) 1.5 h; (d) 2.0 h.
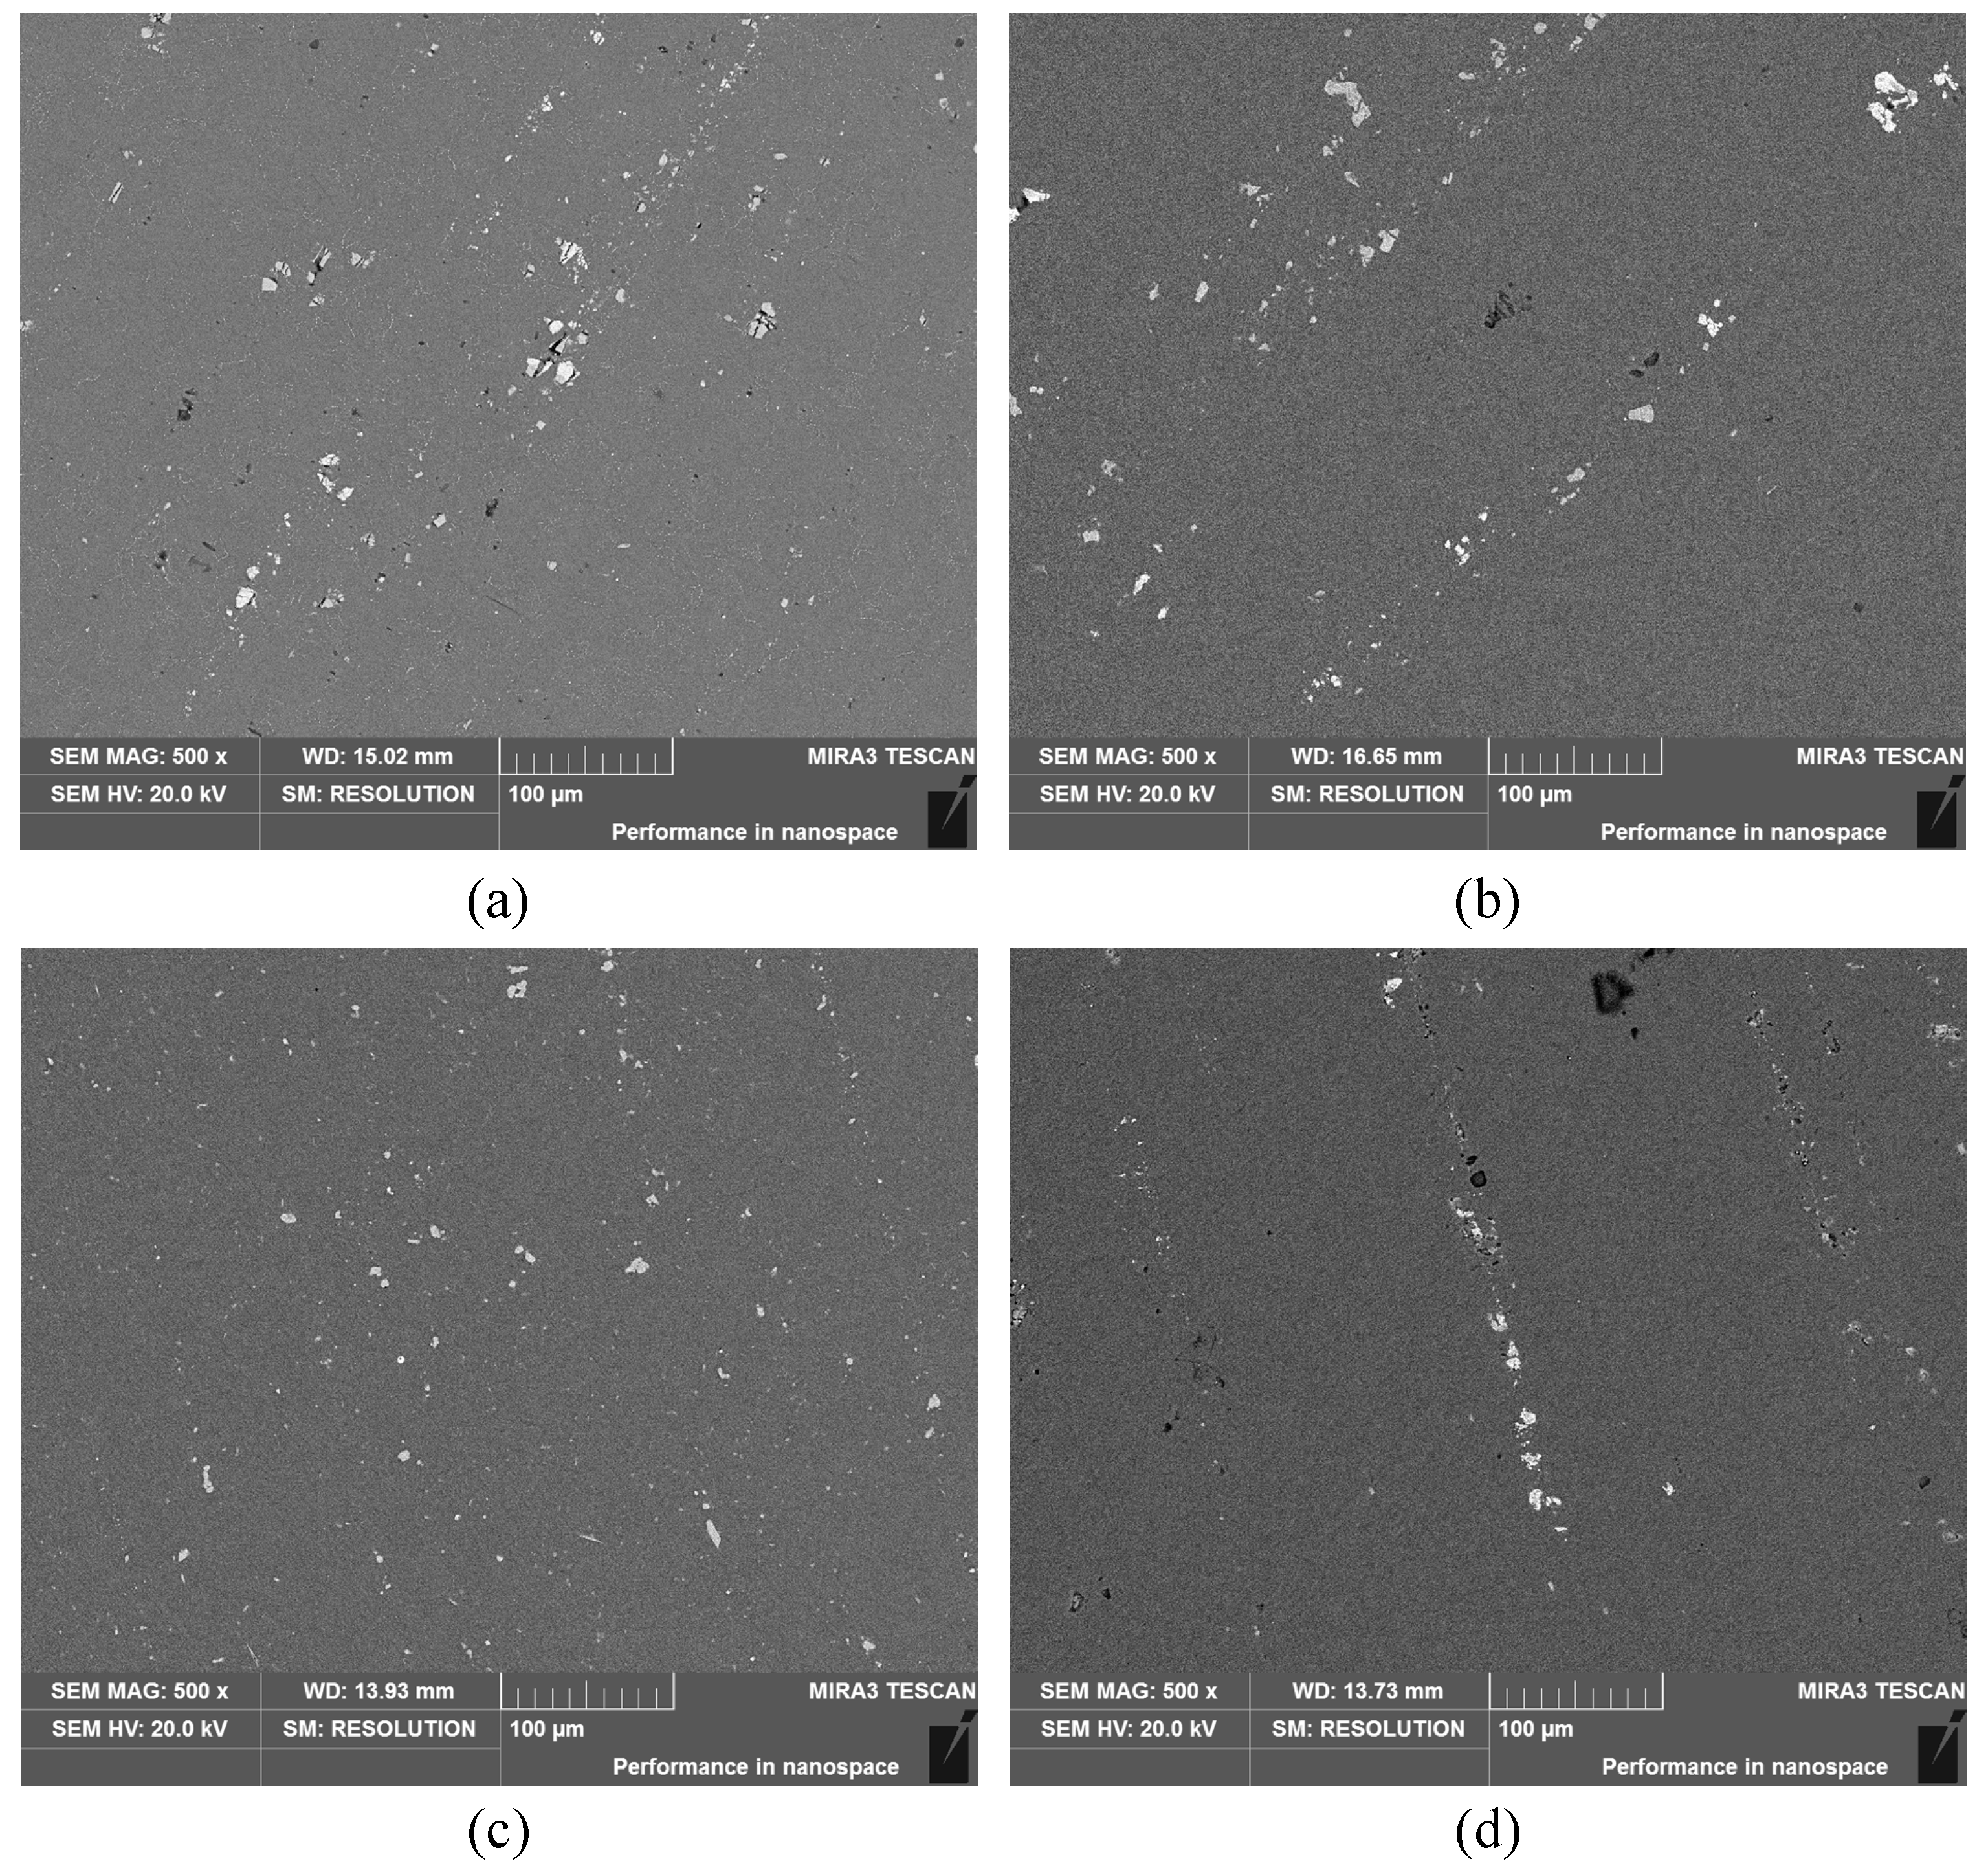
Figure 4.
SEM (scanning electron microscope) images and EDS (Energy Dispersive Spectrometer) analysis results of the large second phase in the 7075 alloys with different solution times. (a,b) Fe-rich phase and its EDS spectrogram; (c,d) Si-rich phase and its EDS spectrogram; (e,f) S (Al2CuMg) phase and its EDS spectrogram; (g,h) T (AlZnMgCu) phase and its EDS spectrogram.

Figure 5.
Volume fraction of the second phase with different solution times.
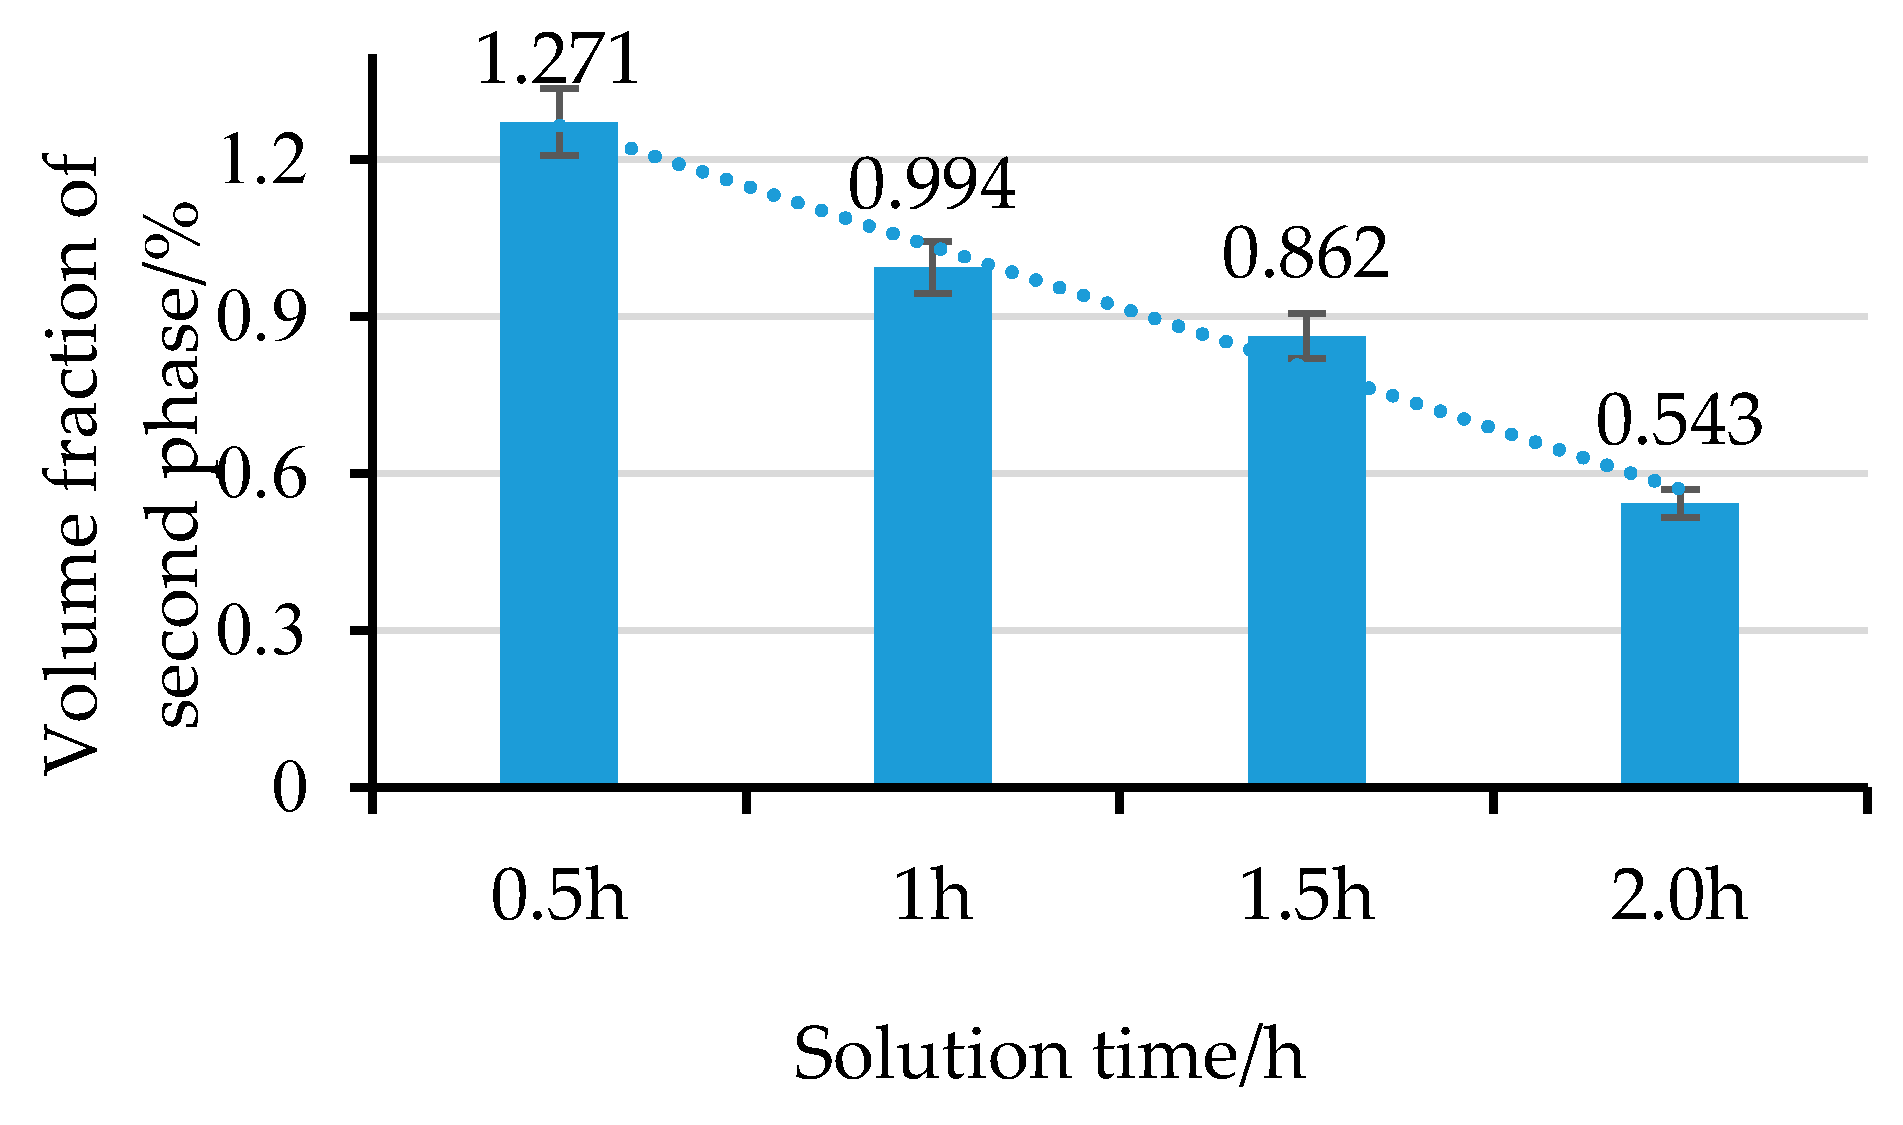
Figure 6.
TEM micrographs of the precipitation characteristics of the 7075 aluminum alloy with solution times of (a) 0.5 h; (b) 1.0 h; (c) 1.5 h; (d) 2.0 h.
Figure 6.
TEM micrographs of the precipitation characteristics of the 7075 aluminum alloy with solution times of (a) 0.5 h; (b) 1.0 h; (c) 1.5 h; (d) 2.0 h.

Figure 7.
Fatigue life of the 7075 aluminum alloy under different solution times and loading stresses.
Figure 7.
Fatigue life of the 7075 aluminum alloy under different solution times and loading stresses.

Figure 8.
S-N curves of the 7075 aluminum alloy under different solution times.
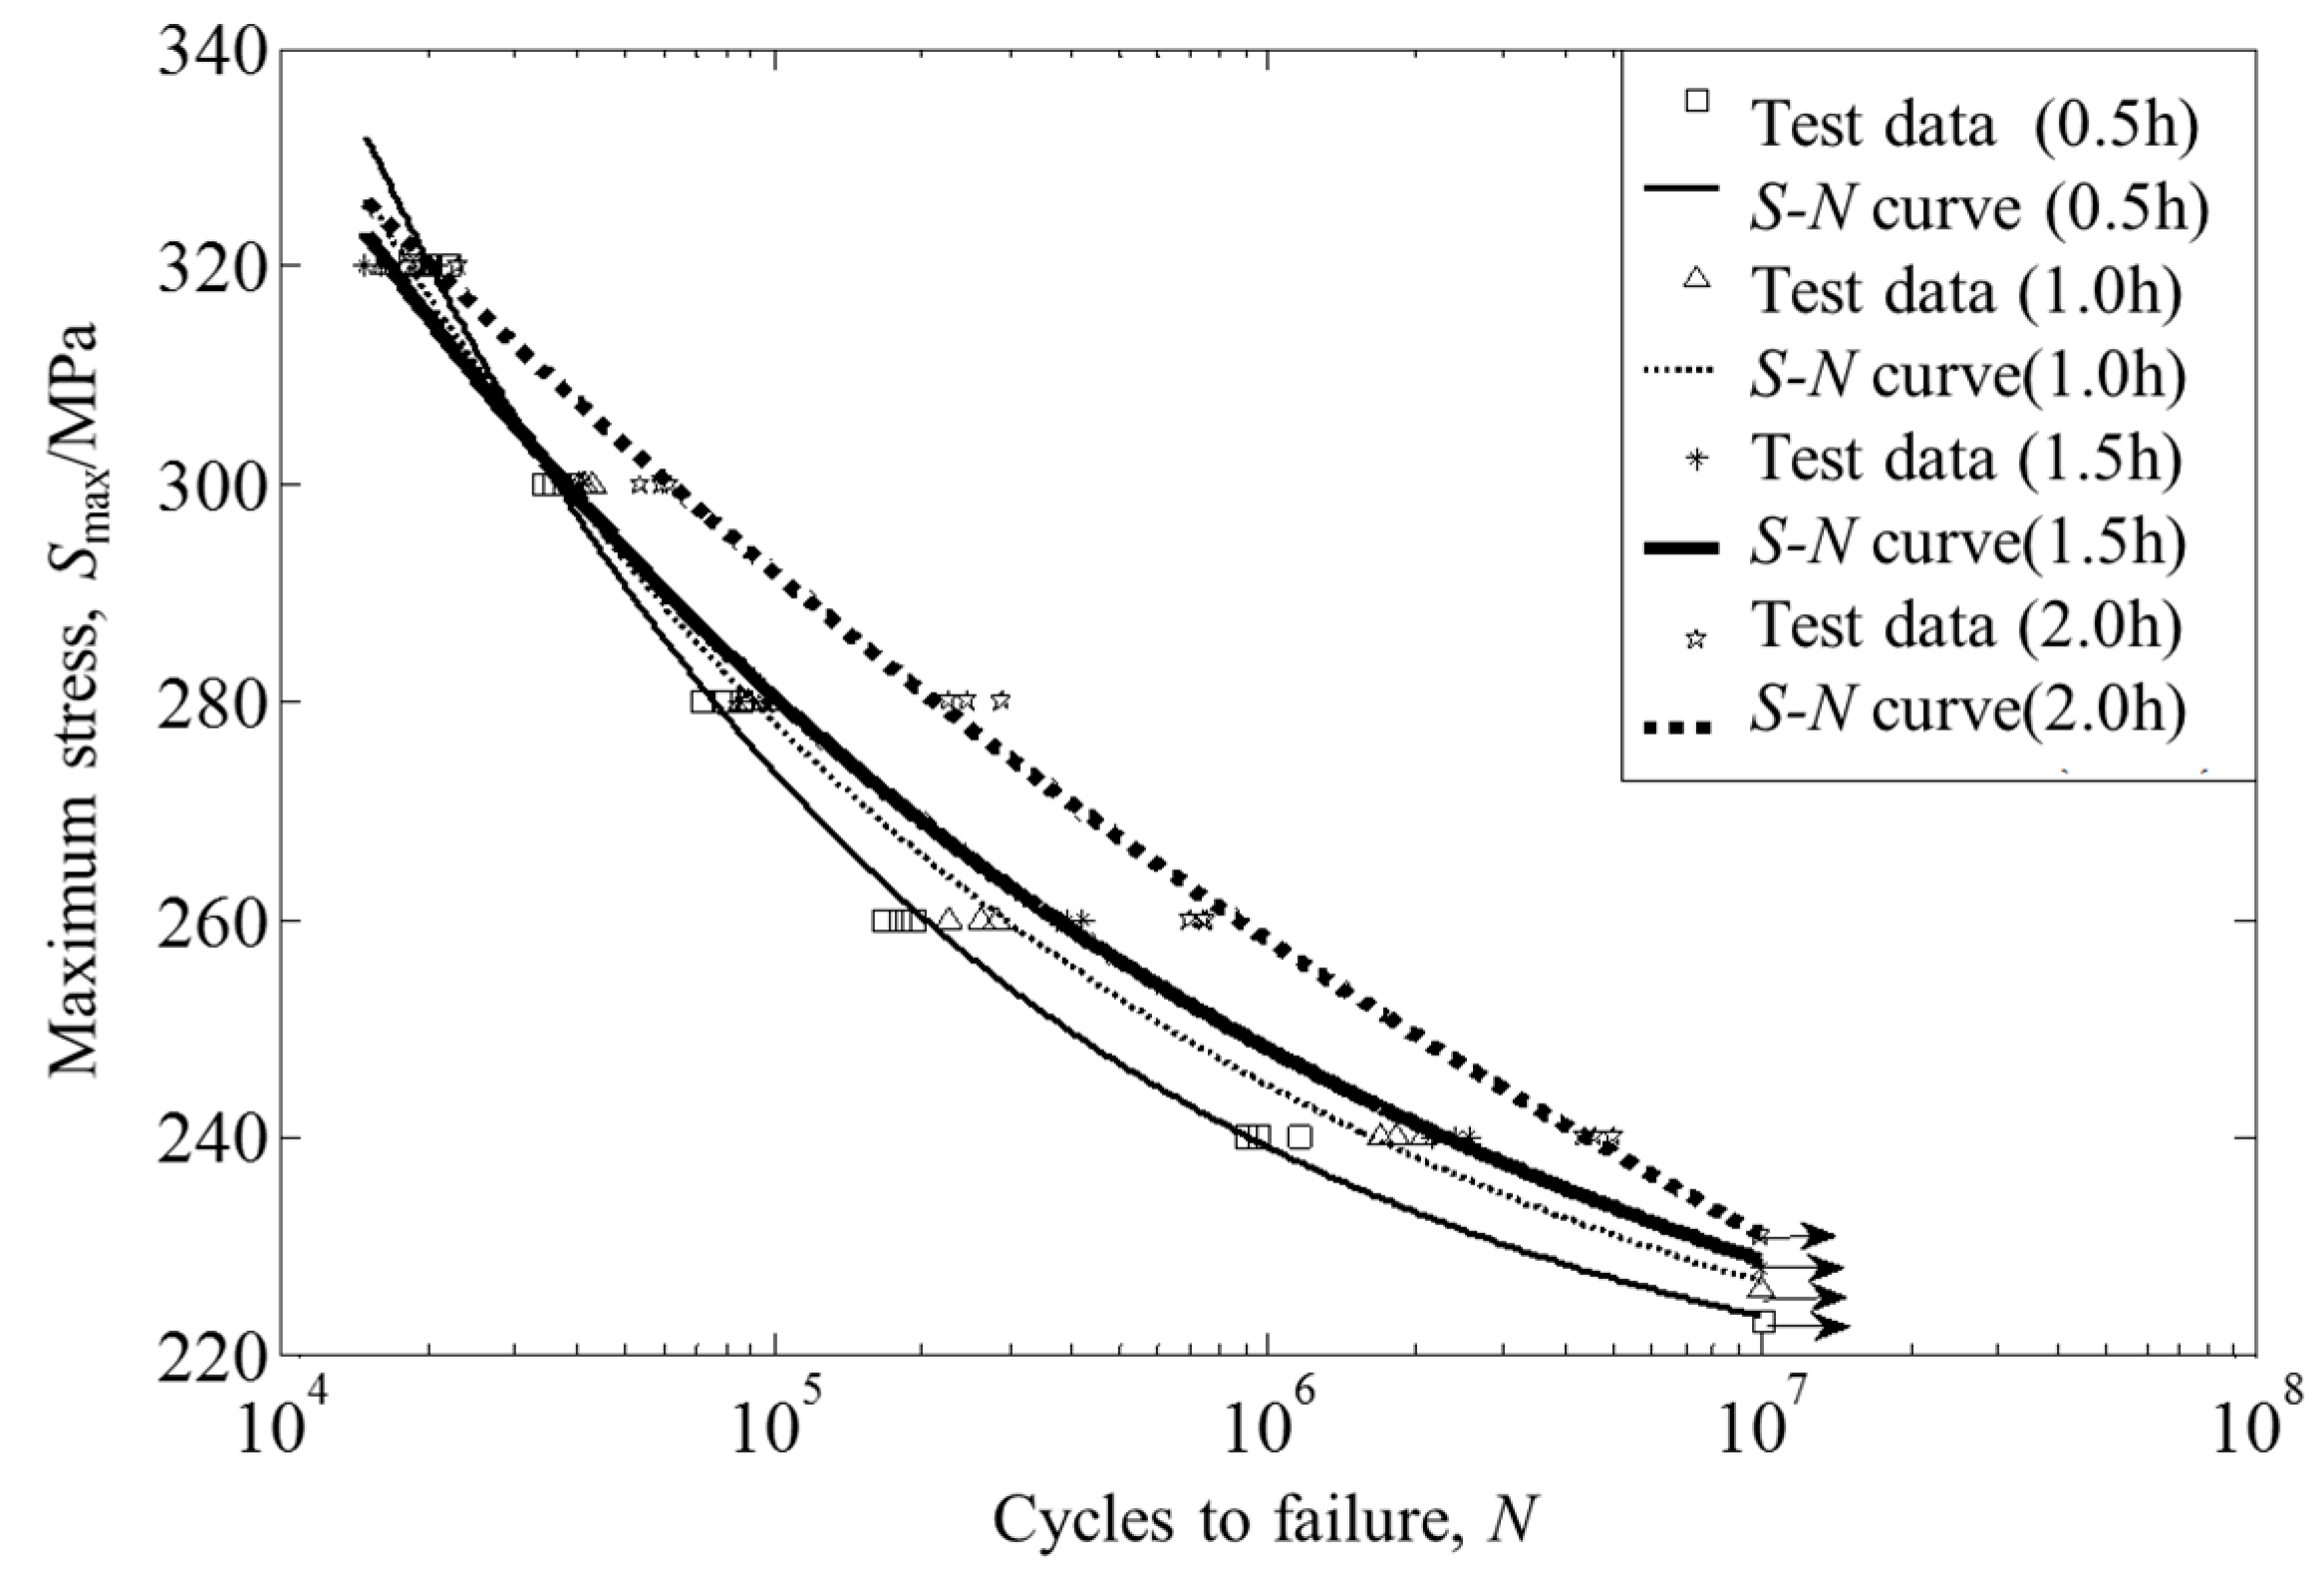
Figure 9.
Fatigue fracture of the 7075 aluminum alloy under applied stresses of 260 MPa and solution times of (a) 0.5 h; (b) 1.0 h; (c) 1.5 h; (d) 2.0 h.
Figure 9.
Fatigue fracture of the 7075 aluminum alloy under applied stresses of 260 MPa and solution times of (a) 0.5 h; (b) 1.0 h; (c) 1.5 h; (d) 2.0 h.

Figure 10.
Fatigue crack initiation regions of the 7075 aluminum alloy under applied stresses of 260 MPa and solution times of (a) 0.5 h; (b) 1.0 h; (c) 1.5 h; (d) 2.0 h.
Figure 10.
Fatigue crack initiation regions of the 7075 aluminum alloy under applied stresses of 260 MPa and solution times of (a) 0.5 h; (b) 1.0 h; (c) 1.5 h; (d) 2.0 h.
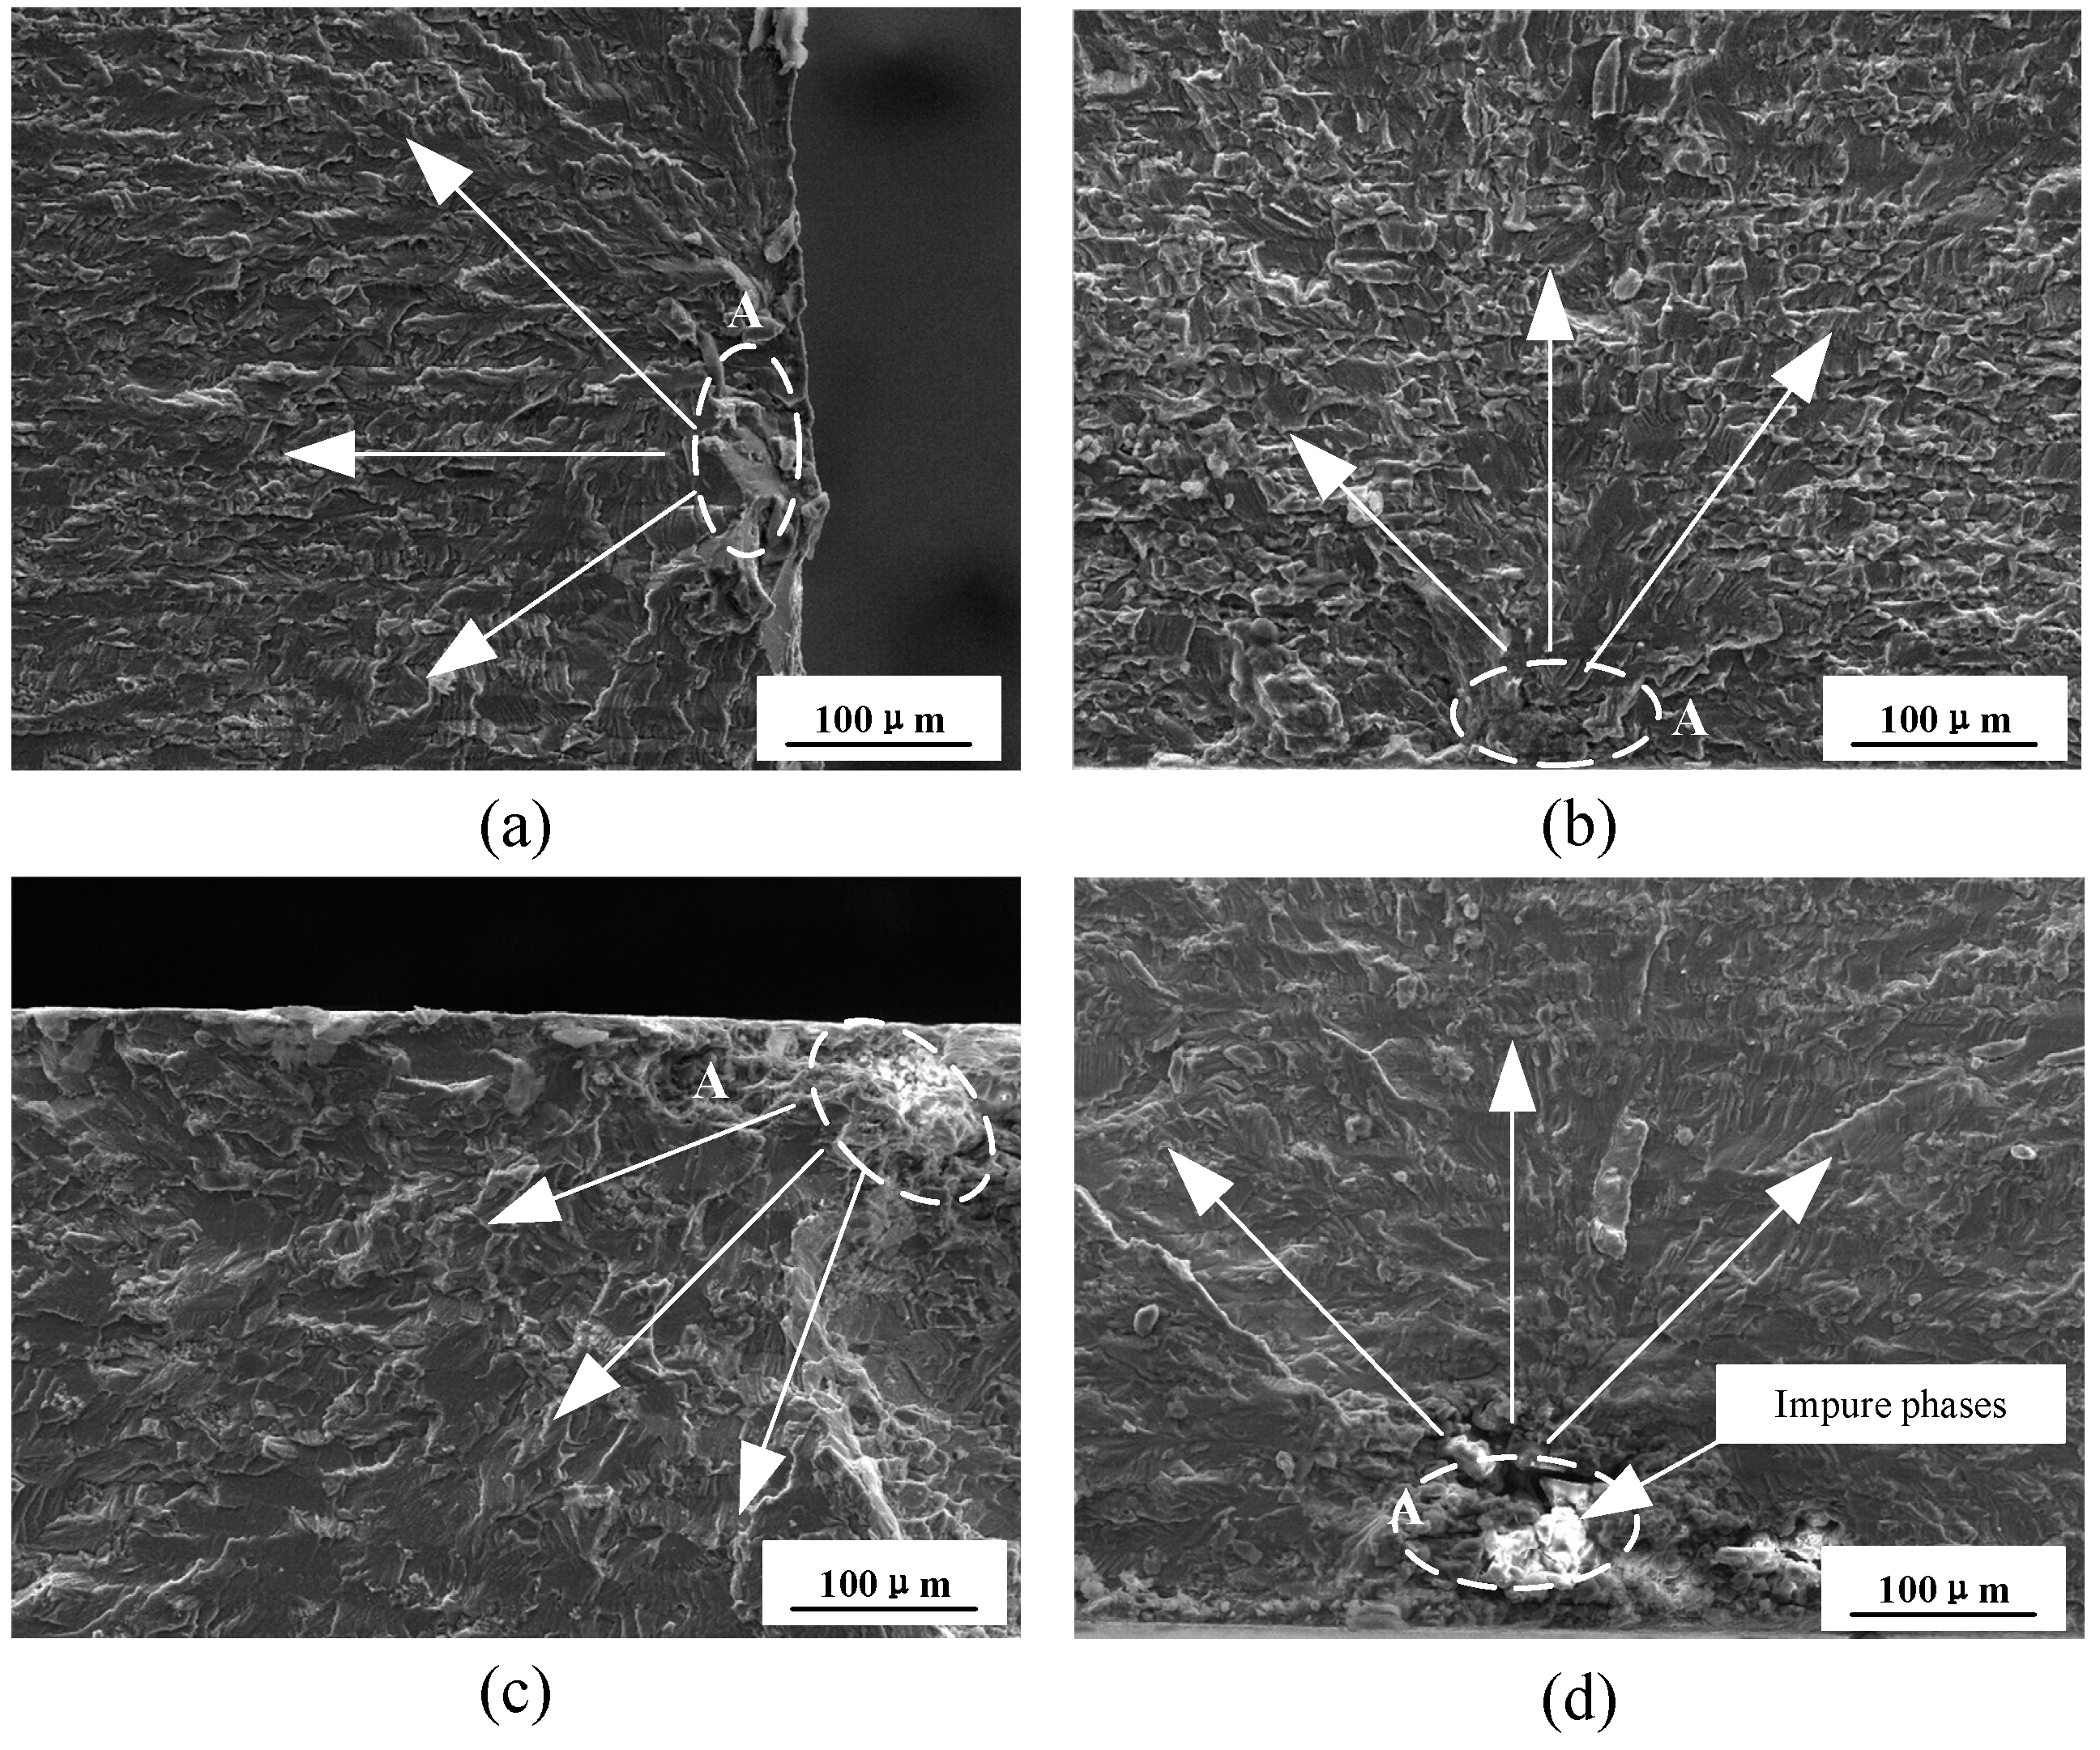
Figure 11.
SEM morphologies of fatigue crack propagation (first stage) of the 7075 aluminum alloy under applied stresses of 260 MPa and solution times of (a) 0.5 h; (b) 1.0 h; (c) 1.5 h; (d) 2.0 h.
Figure 11.
SEM morphologies of fatigue crack propagation (first stage) of the 7075 aluminum alloy under applied stresses of 260 MPa and solution times of (a) 0.5 h; (b) 1.0 h; (c) 1.5 h; (d) 2.0 h.
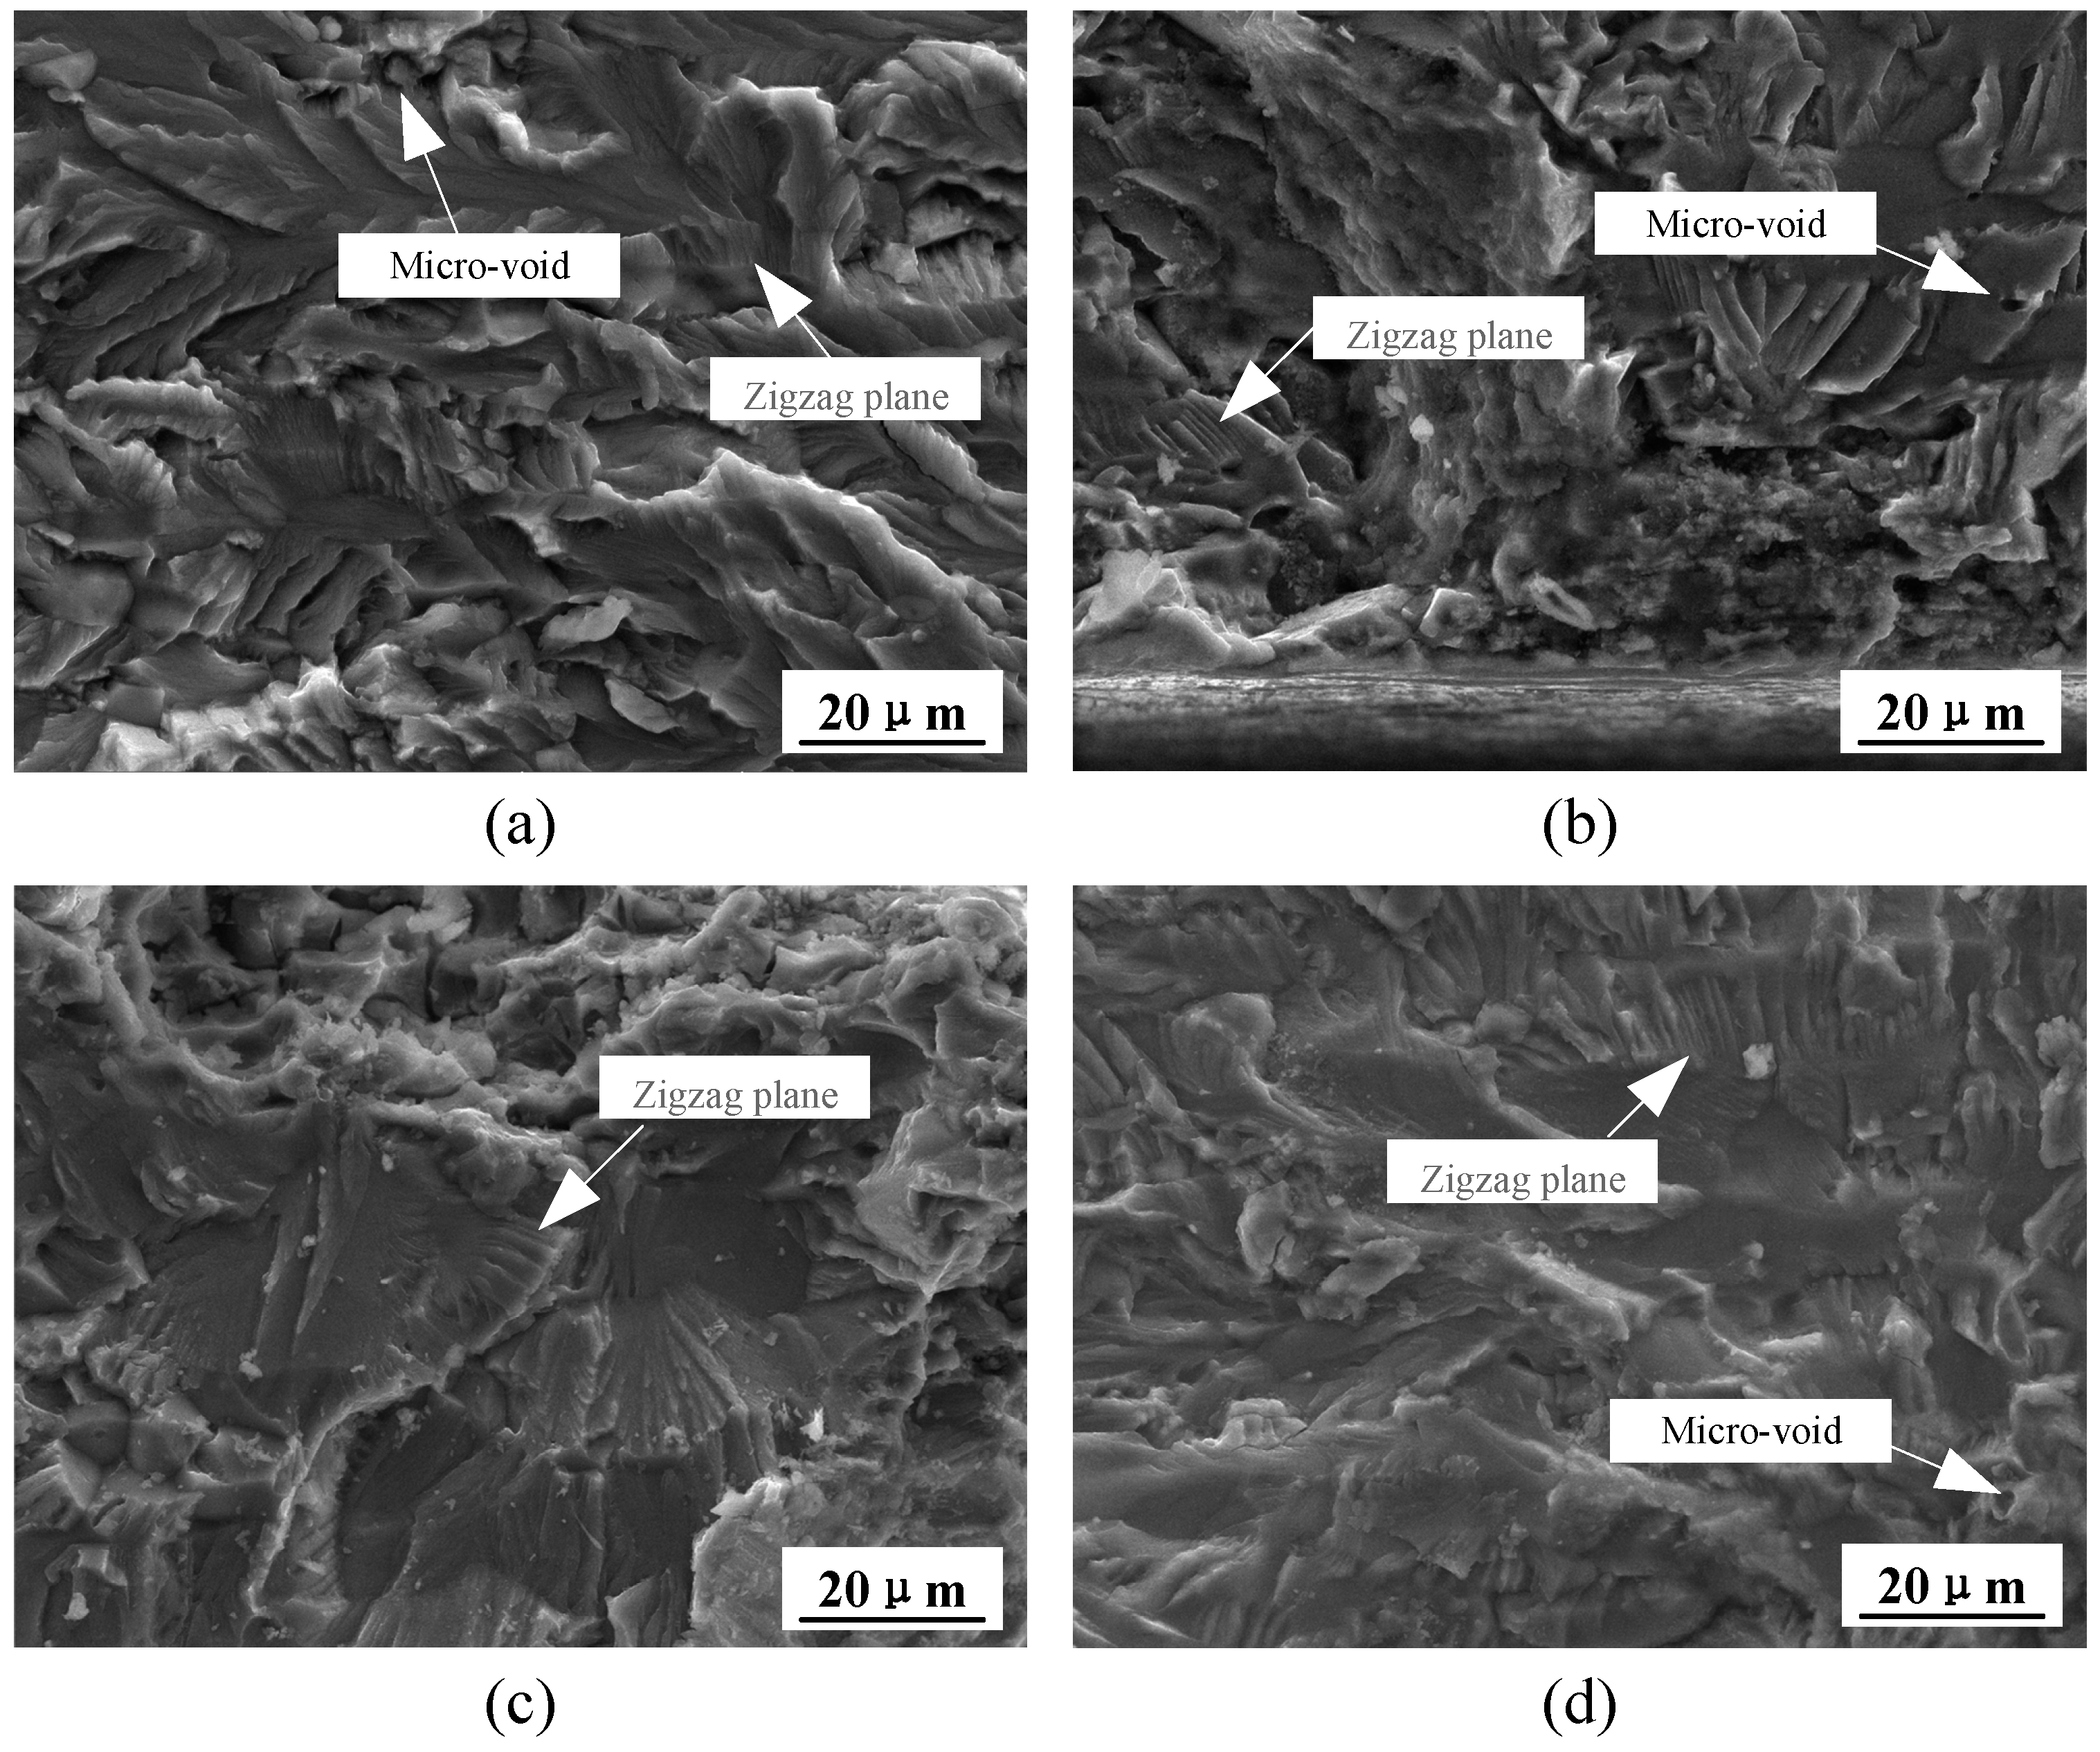
Figure 12.
SEM morphologies of fatigue crack propagation (second stage) of the 7075 aluminum alloy under applied stresses of 260 MPa and solution times of (a) 0.5 h; (b) 1.0 h; (c) 1.5 h; (d) 2.0 h.
Figure 12.
SEM morphologies of fatigue crack propagation (second stage) of the 7075 aluminum alloy under applied stresses of 260 MPa and solution times of (a) 0.5 h; (b) 1.0 h; (c) 1.5 h; (d) 2.0 h.

Figure 13.
Intervals of fatigue striation—D in locations L = 1.5 mm/2.0 mm with different solution times.
Figure 13.
Intervals of fatigue striation—D in locations L = 1.5 mm/2.0 mm with different solution times.
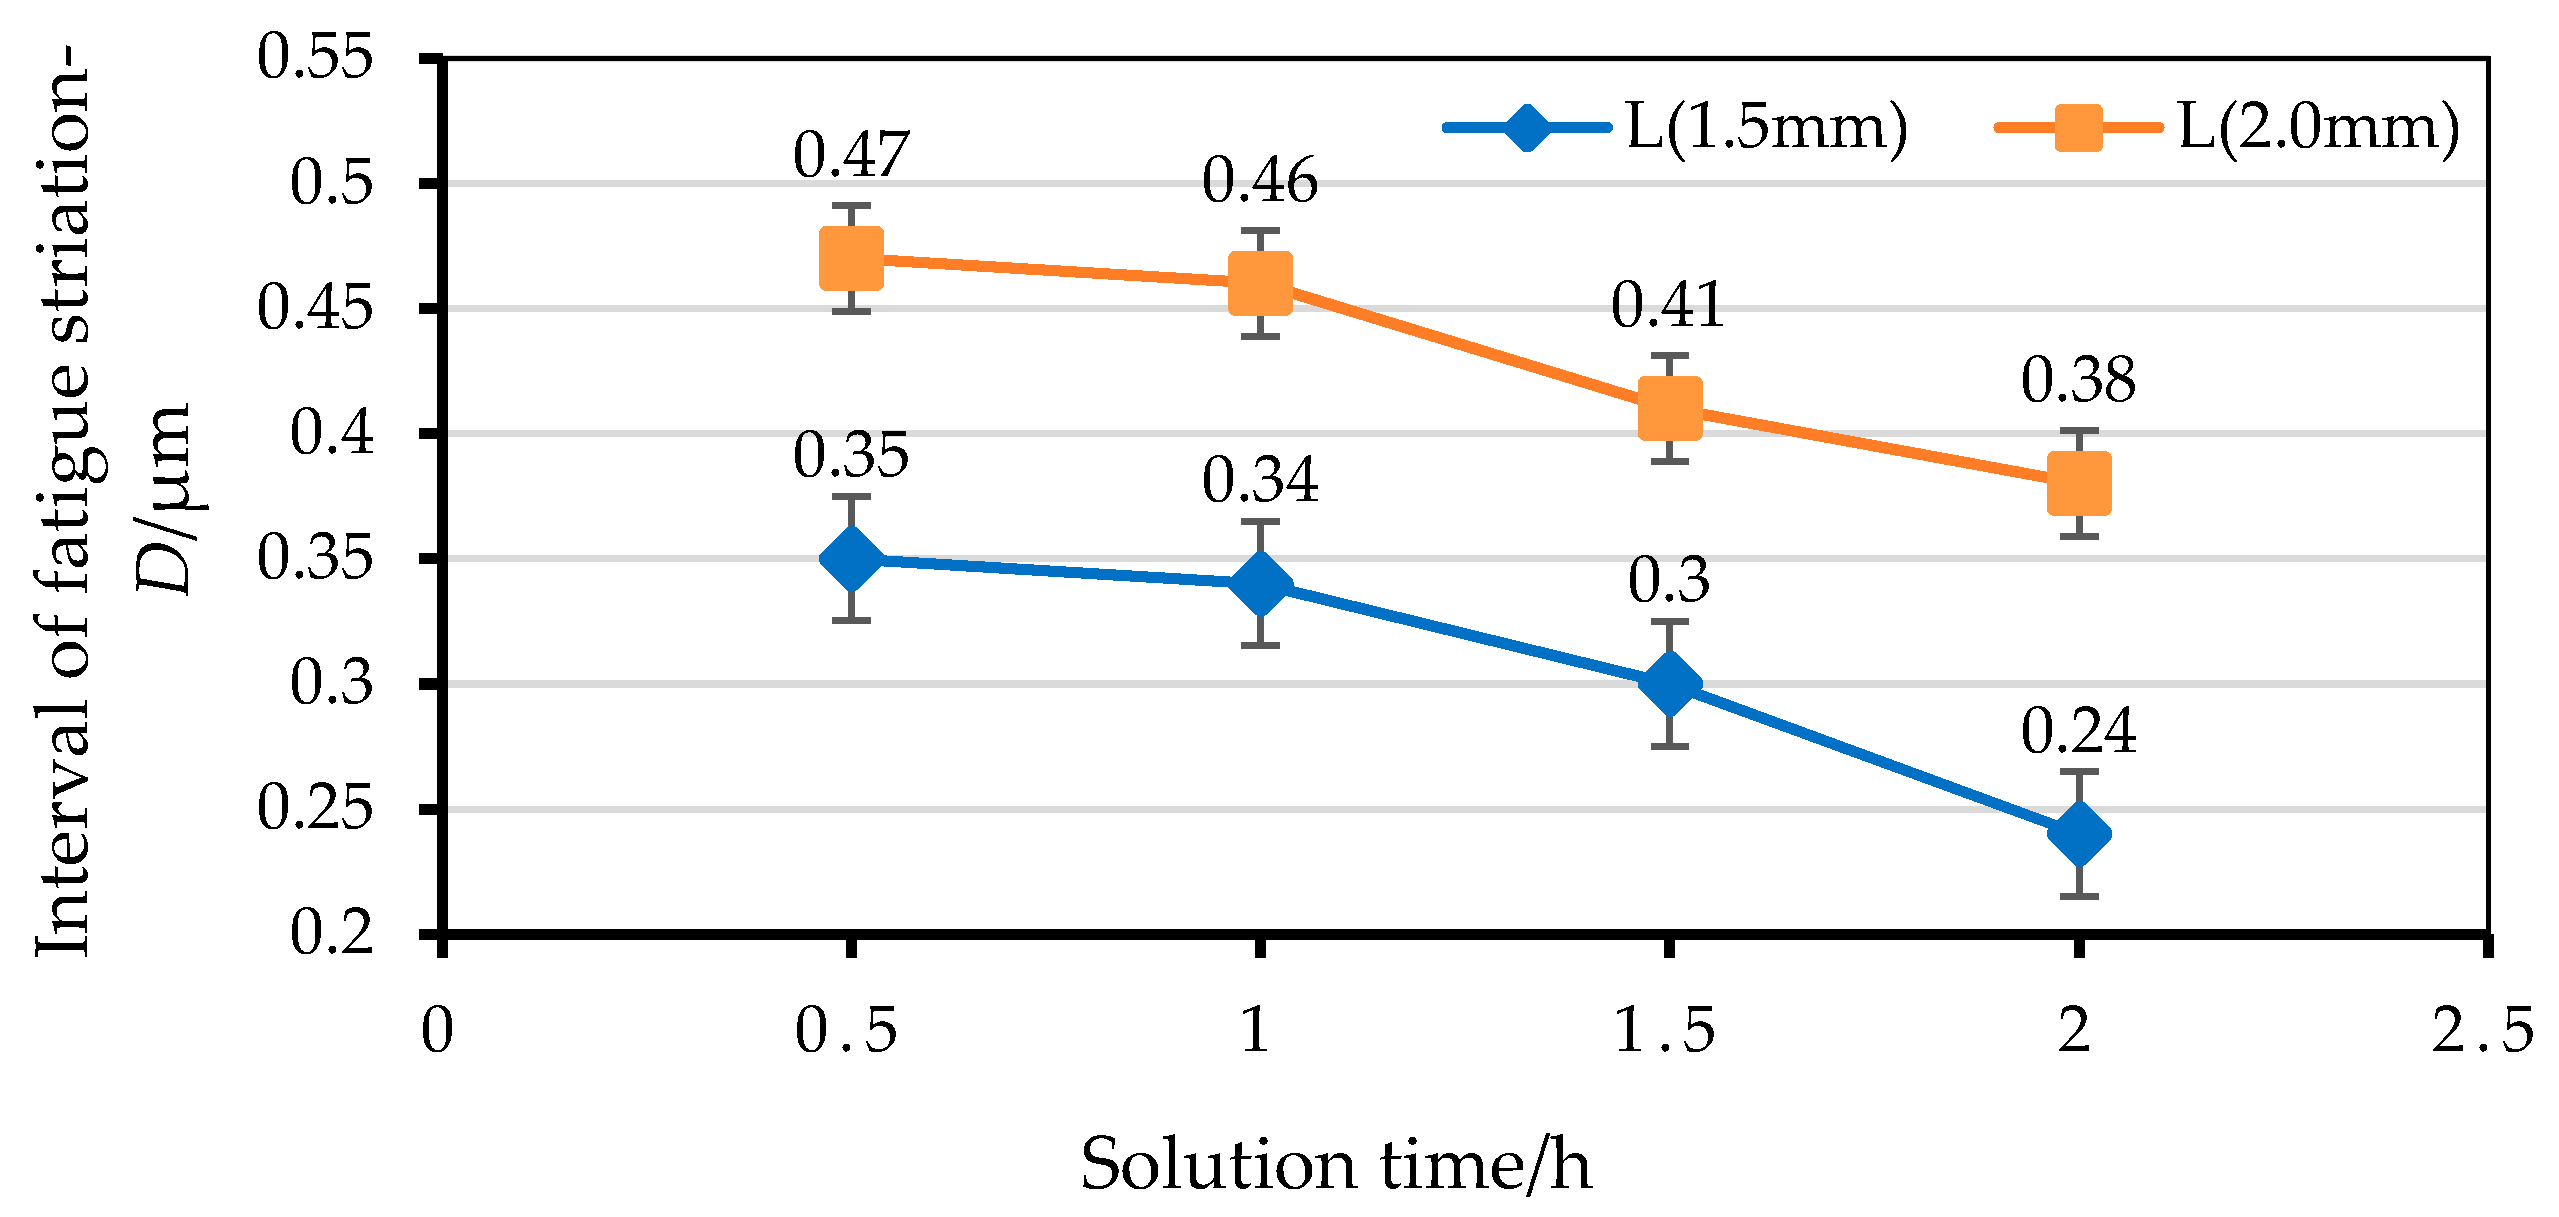
Figure 14.
SEM morphologies of fatigue final rupture regions of the 7075 aluminum alloy under applied stresses of 260 MPa and solution times of (a) 0.5 h; (b) 1.0 h; (c) 1.5 h; (d) 2.0 h.
Figure 14.
SEM morphologies of fatigue final rupture regions of the 7075 aluminum alloy under applied stresses of 260 MPa and solution times of (a) 0.5 h; (b) 1.0 h; (c) 1.5 h; (d) 2.0 h.


Table 1.
Chemical composition of the 7075 alloy (wt %).
| Zn | Mg | Cu | Cr | Fe | Si | Mn | Ti | Al |
|---|---|---|---|---|---|---|---|---|
| 5.71 | 2.45 | 1.5 | 0.18 | 0.17 | 0.06 | 0.034 | 0.019 | Bal. |
Table 2.
Data of the uniaxial fatigue life of the 7075 aluminum alloy for different solution treatment times.
Table 2.
Data of the uniaxial fatigue life of the 7075 aluminum alloy for different solution treatment times.
| Spec No. | Smax (MPa) | Fatigue Life—N (Cycles) | |||
|---|---|---|---|---|---|
| Case 1 (480 °C/0.5 h) | Case 2 (480 °C/1 h) | Case 3 (480 °C/1.5 h) | Case 4 (480 °C/2 h) | ||
| 1# | 320 | 20,210 | 16,151 | 20,790 | 19,245 |
| 2# | 18,410 | 18,050 | 15,990 | 20,095 | |
| 3# | 22,141 | 19,151 | 14,790 | 22,945 | |
| 4# | 300 | 34,157 | 41,151 | 37,956 | 59,410 |
| 5# | 36,141 | 40,040 | 38,990 | 61,945 | |
| 6# | 39,520 | 42,642 | 40,247 | 53,921 | |
| 7# | 280 | 80,241 | 95,356 | 99,036 | 246,569 |
| 8# | 71,451 | 86,547 | 95,701 | 226,569 | |
| 9# | 86,584 | 88,470 | 84,943 | 291,016 | |
| 10# | 260 | 193,039 | 261,477 | 372,882 | 699,403 |
| 11# | 168,320 | 284,757 | 392,414 | 738,941 | |
| 12# | 181,241 | 224,646 | 420,440 | 751,814 | |
| 13# | 240 | 966,022 | 2,059,221 | 2,394,939 | 4,353,010 |
| 14# | 904,514 | 1,824,641 | 2,560,780 | 4,568,122 | |
| 15# | 1,155,842 | 1,700,578 | 2,149,401 | 5,004,514 | |
Table 3.
The fitting results of the 7075 aluminum alloy with different solution times.
| Solution Time/h | Fitting Parameters | Fitting Formula | ||
|---|---|---|---|---|
| a | b | A | ||
| 0.5 | 10.22 | −2.90 | 210.7 | |
| 1.0 | 11.99 | −3.75 | 205.4 | |
| 1.5 | 13.64 | −4.53 | 199.4 | |
| 2.0 | 28.35 | 10.46 | 121.1 | |
© 2017 by the authors. Licensee MDPI, Basel, Switzerland. This article is an open access article distributed under the terms and conditions of the Creative Commons Attribution (CC BY) license (http://creativecommons.org/licenses/by/4.0/).
Share and Cite
MDPI and ACS Style
Liu, C.; Liu, Y.; Ma, L.; Yi, J. Effects of Solution Treatment on Microstructure and High-Cycle Fatigue Properties of 7075 Aluminum Alloy. Metals 2017, 7, 193. https://doi.org/10.3390/met7060193
AMA Style
Liu C, Liu Y, Ma L, Yi J. Effects of Solution Treatment on Microstructure and High-Cycle Fatigue Properties of 7075 Aluminum Alloy. Metals. 2017; 7(6):193. https://doi.org/10.3390/met7060193
Chicago/Turabian StyleLiu, Chi, Yilun Liu, Liyong Ma, and Jiuhuo Yi. 2017. "Effects of Solution Treatment on Microstructure and High-Cycle Fatigue Properties of 7075 Aluminum Alloy" Metals 7, no. 6: 193. https://doi.org/10.3390/met7060193
Note that from the first issue of 2016, this journal uses article numbers instead of page numbers. See further details here.