Article

Water Droplet Erosion Performance of Laser Shock Peened Ti-6Al-4V

1
Department of Mechanical and Industrial Engineering, Concordia University, 1455 De Maisonneuve Boulevard West, Montreal, QC H3G 1M8, Canada
2
Metal Improvement Company—A Business Unit of Curtiss Wright Corporation, 7655 Longard Rd, Livermore, CA 94551, USA
3
Department of Mechanical and Materials Engineering, Masdar Institute, Masdar City P.O. Box 54224, Abu Dhabi, UAE
*
Author to whom correspondence should be addressed.
Metals 2016, 6(11), 262; https://doi.org/10.3390/met6110262
Submission received: 20 August 2016 / Revised: 27 September 2016 / Accepted: 24 October 2016 / Published: 3 November 2016
(This article belongs to the Special Issue Laser Shock Processing on Metal)

Abstract

:
The water droplet erosion (WDE) performance of laser shock peened (LSP) Ti-6Al-4V was investigated. LSP condition using two or three peening impacts per unit area induced compressive residual stresses. However, LSP treatment showed a mild increase in microhardness and no observable changes in the microstructure. The effect of LSP and its associated attributes on the WDE performance was studied according to the American Society for Testing and Materials Standard (ASTM G73). Influence of the impact speed between 150 and 350 m/s on the WDE performance was explored. Two sample geometries, T-shaped flat and airfoil, were used for the WDE tests. For the flat samples, LSP showed little or no beneficial effect in enhancing the WDE performances at all tested speeds. The peened and unpeened flat samples showed similar erosion initiation and maximum erosion rate (ERmax). The LSP airfoil samples showed mild improvement in the WDE performance at 300 m/s during the advanced erosion stage compared to the as-machined (As-M) condition. However, at 350 m/s, no improved WDE performance was observed for the LSP airfoil condition at all stages of the erosion. It was concluded that compressive residual stresses alone are not enough to mitigate WDE. Hence, the notion that the fatigue mechanism is dominating in WDE damage is unlikely.

Graphical Abstract

1. Introduction

Gas turbine efficiency in the power generation industry is affected by changes in temperature [1]. This is mostly experienced during summer when ambient temperature increases. In order to increase the gas turbine efficiency, cost effective techniques are employed to keep the temperature at the inlet of the gas turbine compressor as low as possible. Among these techniques, the fog cooling technique has been used successfully. In this technique, water droplets are sprayed into the gas turbine compressor to cool down the intake air, thus increasing the intake mass. This approach reduces the temperature and increases the power output [2]. A major setback of this method is the erosion damage caused to the leading edge of the rotating blades during service. This is due to the combined effect of the rotating blades and the injected liquid droplets during fog cooling [3]. This damage causes further fatigue damage for the entire gas turbine. The erosion damage is known as “water droplet erosion (WDE)”, which is the progressive loss of material from a solid surface due to continuous impacts by liquid droplets [4]. The high pressure exerted by the liquid droplets and the radial outflow (lateral jetting) of the droplets along the surface are the main driving forces of the erosion damage [5,6]. Despite the known causes of the erosion damage, the erosion process of materials is considered to be a complex phenomenon. This is due to the many parameters involved such as impact speed, impact angle, droplet size, and mechanical properties and conditions of the target material. To fully understand the erosion process, the effect of these parameters on the WDE behaviour must be understood. However, the task becomes more cumbersome especially when considering the interactions between these parameters such as impact speed and droplet size. Also, due to the variation of erosion rate with exposure time, predicting the erosion behaviour becomes difficult. Therefore, WDE experimental investigations are essential to understand the WDE behaviour of materials. A typical material prone to this type of erosion damage is Ti-6Al-4V alloy, used for compressor blades in gas turbines. Surface coatings [7,8] and laser surface treatments [9,10] have been employed to mitigate WDE damage on Ti-6Al-4V. However, WDE is accelerated due to the presence of surface defects, interface defects, and microcracks after such treatments. Recently, there has been considerable interest in understanding the effectiveness of mechanical treatments in combating erosion damage. This is due to the deep levels of induced compressive residual stresses after mechanical processing. The WDE behaviour of mechanical surface treatments such as deep rolling (DR) [11] and ultrasonic nanocrystalline surface modification (UNSM) [12] have recently being studied. This work explores another mechanical surface treatment, laser shock peening (LSP). LSP is a cold working process where pulses hit the surface through high power intensity, generating shock waves. As the shock wave stress exceeds the dynamic yield strength of the material, plastic deformation occurs [13]. These waves deform the top surface and compressive residual stresses are extended into the material [13]. More information on LSP in relation to shock wave generation, process parameters, residual stress profile, surface quality, and material properties can be found in [13]. In most of the literature, LSP was usually employed to enhance the fatigue life [14,15,16,17] and fretting fatigue life [18] of materials such as Ti-6Al-4V. These enhancements have been attributed mainly to the significant depth of the induced compressive residual stresses after LSP processing [19]. So far, the effect of LSP and its associated attributes on the WDE performance of Ti-6Al-4V or other alloys could not be found in the literature. Reports [20,21,22] have shown that WDE damage mechanisms are influenced significantly by crack initiation and propagation. Also, due to the continuous liquid impingements in a cyclic fashion, researchers [11,20,21] have associated WDE to fatigue. Moreover, it is well known that LSP retards crack initiation and propagation as well as enhances fatigue life [13]. At this point, one would expect LSP to mitigate the WDE damage to a certain degree. For these reasons, studying WDE performance of laser peened Ti-6Al-4V is worthwhile. This work attempts to explore this research gap for the first time. The WDE performance is discussed based on the observed residual stresses, microhardness, and microstructure. Much attention was given to the influence of impact speed on the WDE performance. Another factor that can influence WDE behavior is the sample geometry, however only flat sample geometry has been studied extensively in the literature [7,8,9,10,11]. Only recently, a study [12] by the current authors investigated the effect of sample geometry on the WDE behavior of Ti-6Al-4V. In the study [12], ultrasonic nanocrystalline surface modification was employed on two sample geometries, T-shaped flat and airfoil. The current study also explores similar sample geometries (T-shaped flat and airfoil), however a different surface treatment (LSP) is employed. In this paper, the influence of sample geometry and the effectiveness of LSP and its attributes on the WDE performance of Ti-6Al-4V are addressed. To achieve this objective, a systematic approach is followed in carrying out this investigation.

2. Experimental Procedure

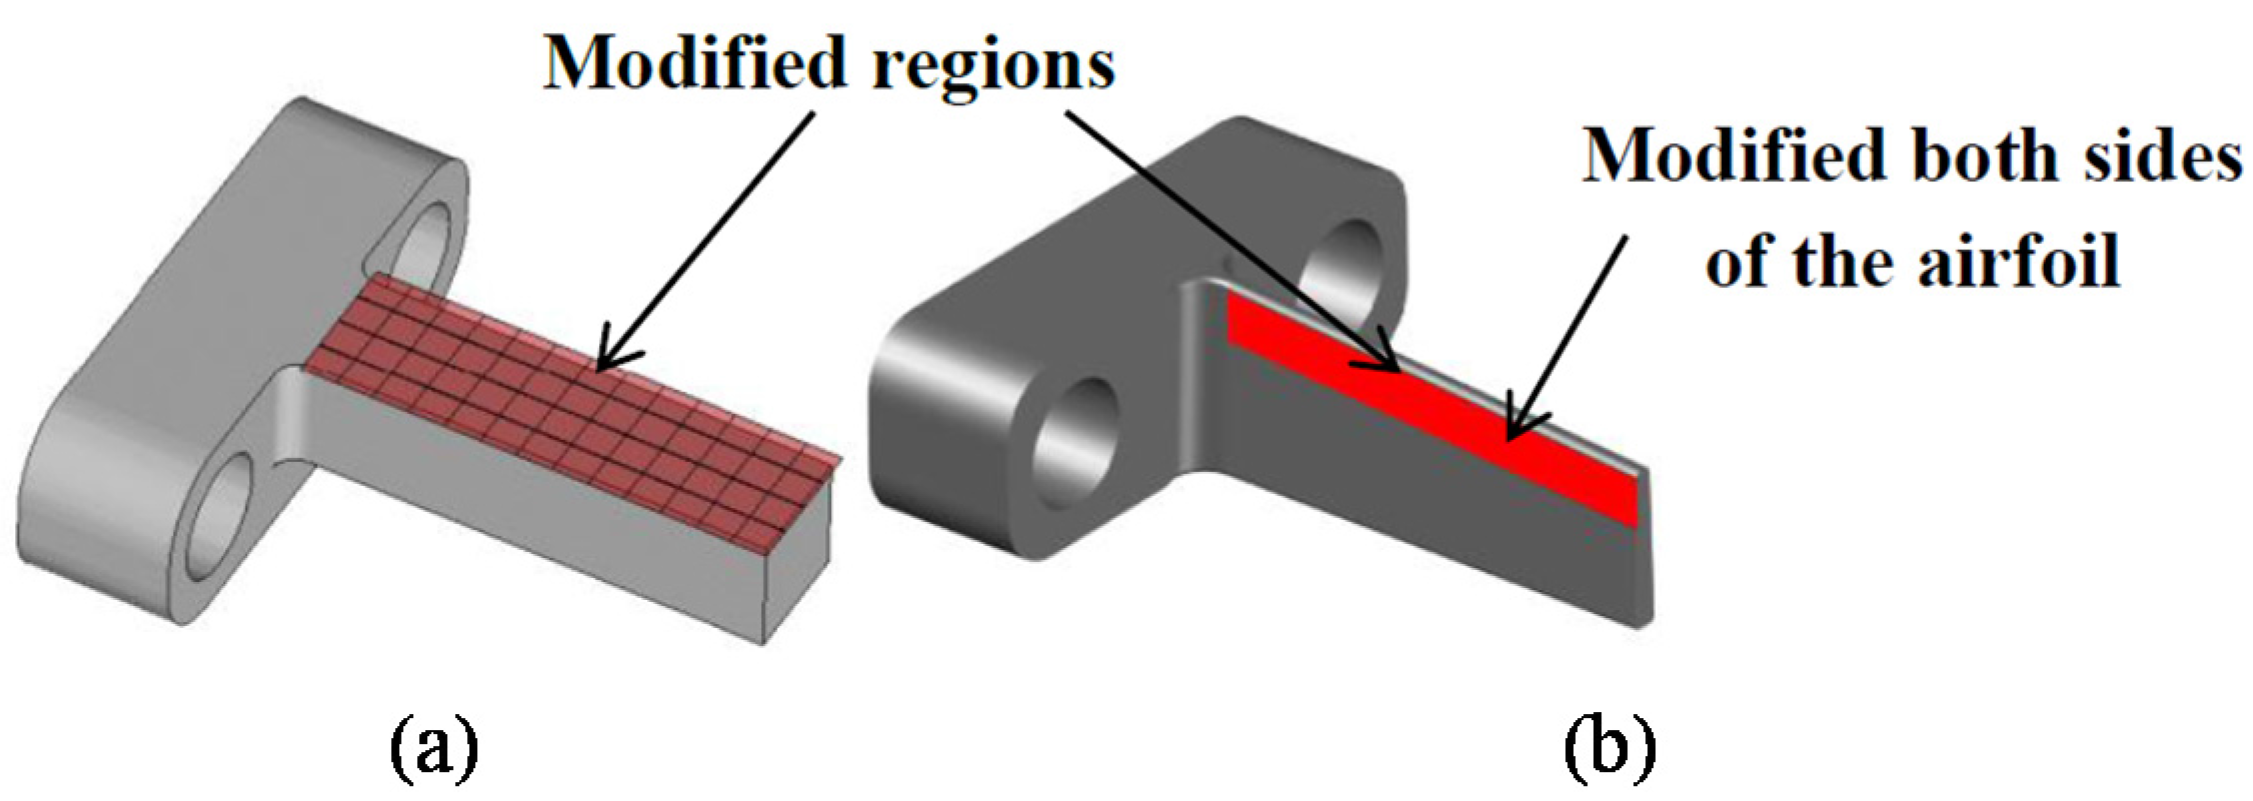
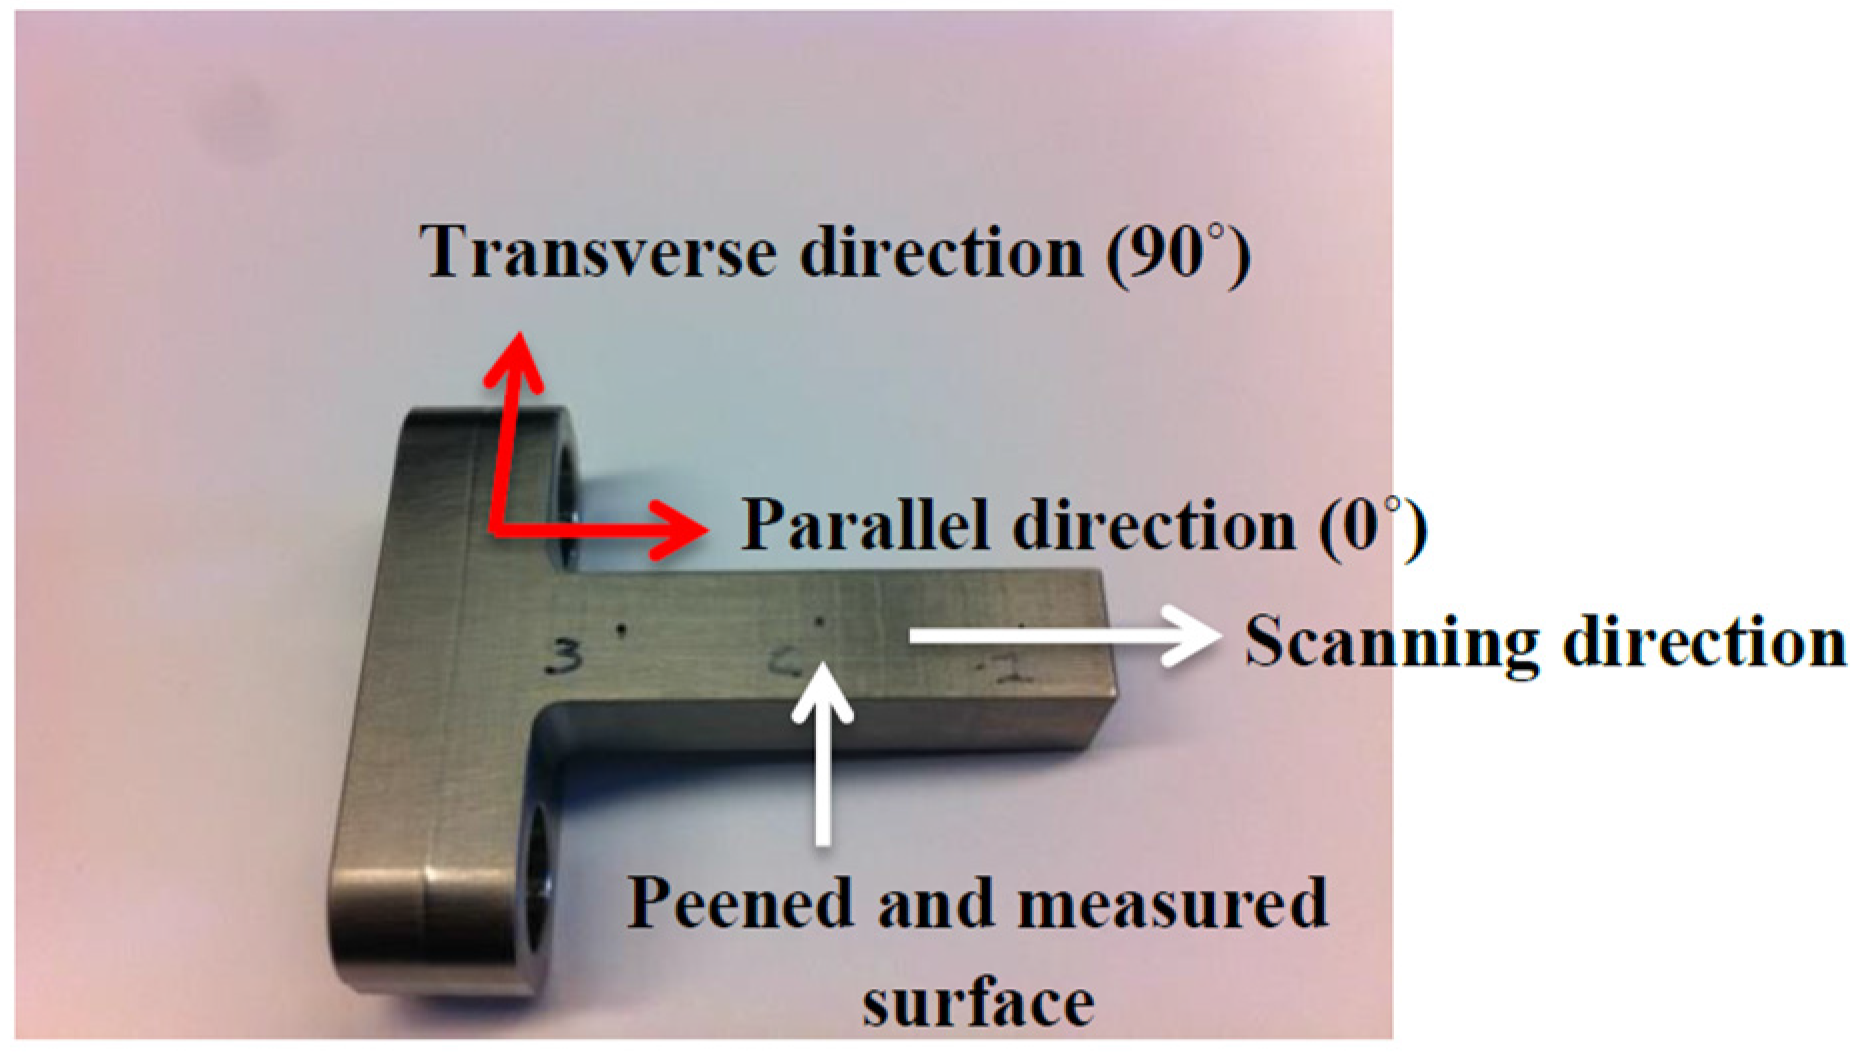
2.1. Material and Sample Geometries

For this study, Ti-6Al-4V (American Society for Testing and Materials (ASTM) B265, Grade 5) alloy [23], used for compressor blades in gas turbines, was investigated. Figure 1 shows the starting microstructure of the Ti-6Al-4V alloy which contains α- and β-phases. T-shaped and airfoil samples, as shown in Figure 2, were machined using a computer numerical control (CNC) Haas machine (Haas Automation Inc., Oxnard, CA, USA) under flood coolant in accordance to the sample’s geometrical requirement of the WDE testing rig. The T-shaped sample represents the typical flat surfaces commonly explored in the literature [7,8,9,10,11]. Moreover, in an industrial gas turbine compressor blade where damage is caused by droplet impacts, the airfoil geometry represents the leading edge of the compressor blade. For this reason, the airfoil geometry is employed in this study.

2.2. LSP Processing and Characterizations

Untreated samples were used as the baseline reference material in this work. Unless otherwise stated, the untreated condition in this work is also referred to as as-machined (As-M) condition. For LSP processing, the next section describes the process. Also, to observe the effectiveness of the LSP processing, several techniques were used to characterize the untreated and treated samples.

2.2.1. LSP Processing

For the LSP processing, an Nd:Glass laser at Metal Improvement Company (MIC), Livermore Laser Peening Division, CA, USA, was used. Table 1 shows the LSP processing parameters used in this work. In the first layer during peening, a 3% spot overlay was used, whereas a 50% spot overlay was used for subsequent layers. Figure 2 also shows the LSP modified regions on both sample geometries. For the airfoil geometry, it is a common practice to peen both sides of the sample in order to avoid distortion as reported in [15,24,25,26,27,28]. This approach has been adopted in this work.

2.2.2. X-ray Diffraction (XRD) Pattern and Residual Stress Measurement

X-ray diffraction patterns for the untreated and LSP treated surfaces were acquired inorder to observe any induced strains during LSP. It has been reported that X-ray diffraction peak broadening is associated with induced strains [29]. In this work, variations in the peak intensity and peak broadening are monitored for the first three peaks. The top surface compressive residual stresses before and after LSP processing were also measured using the XRD sin2Φ technique at Proto Manufacturing Inc., Taylor, MI, USA. The crystallographic plane of {213} and Bragg’s angle (2θ = 142°) obtained by Cu Kα radiation were employed for this purpose. For the LSP condition, residual stresses were measured relative to the peening (scanning) directions, i.e., parallel (0°) and transverse (90°). Figure 3 shows a peened sample and the 0° and 90° directions used for measurements are indicated. For comparison, the top surface residual stresses for the As-M condition were also measured using these two directions.

2.2.3. Microhardness

Prior to the hardness measurements, the samples (LSP and As-M) were cut perpendicular to the surface using a diamond cutter (Buehler (Isomet) low speed saw, Lake Bluff, IL, USA). Under cooling and lubricating fluid conditions, low speed and moderate load were applied in order to minimize undesired surface modifications during cutting. After mounting, SiC papers from 400 to 800 grits were used for grinding and vibratory polishing with 1 µm diamond paste was employed to remove scratches and other undesired debris. Microhardness measurements were carried out at Ecole de technologie superieure (ETS), Montreal, QC, Canada on the top surface and cross-section of the LSP and As-M samples. A 50 gf load and a 15 s dwell time were used during measurements. Microhardness at 7–8 locations were obtained across the depth of the LSP and As-M samples. At each location, the average and standard deviation of 4–5 readings were calculated.

2.2.4. Microscopy

To observe any surface features, the as-treated top surface was observed under scanning electron microscope (S-3400N, Hitachi, Tokyo, Japan). For surface and in-depth microstructure investigations, Kroll’s reagent containing 2 mL HF + 5 mL HNO3 + 100 mL H2O was used to etch the vibratory polished samples. As recommended by Gammon et al. [30], an etching time of 15 s was chosen to have a balance between details and contrast. SEM images of the polished-etched top surface and cross-sections for both LSP and As-M samples were taken at different magnifications.

2.3. Water Droplet Erosion (WDE) Testing and Damage Analysis
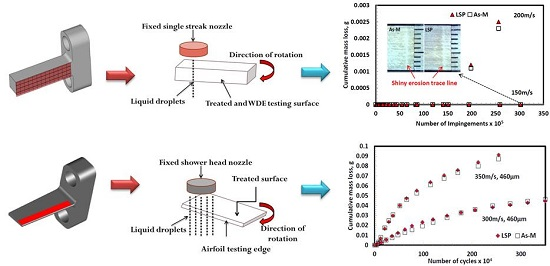
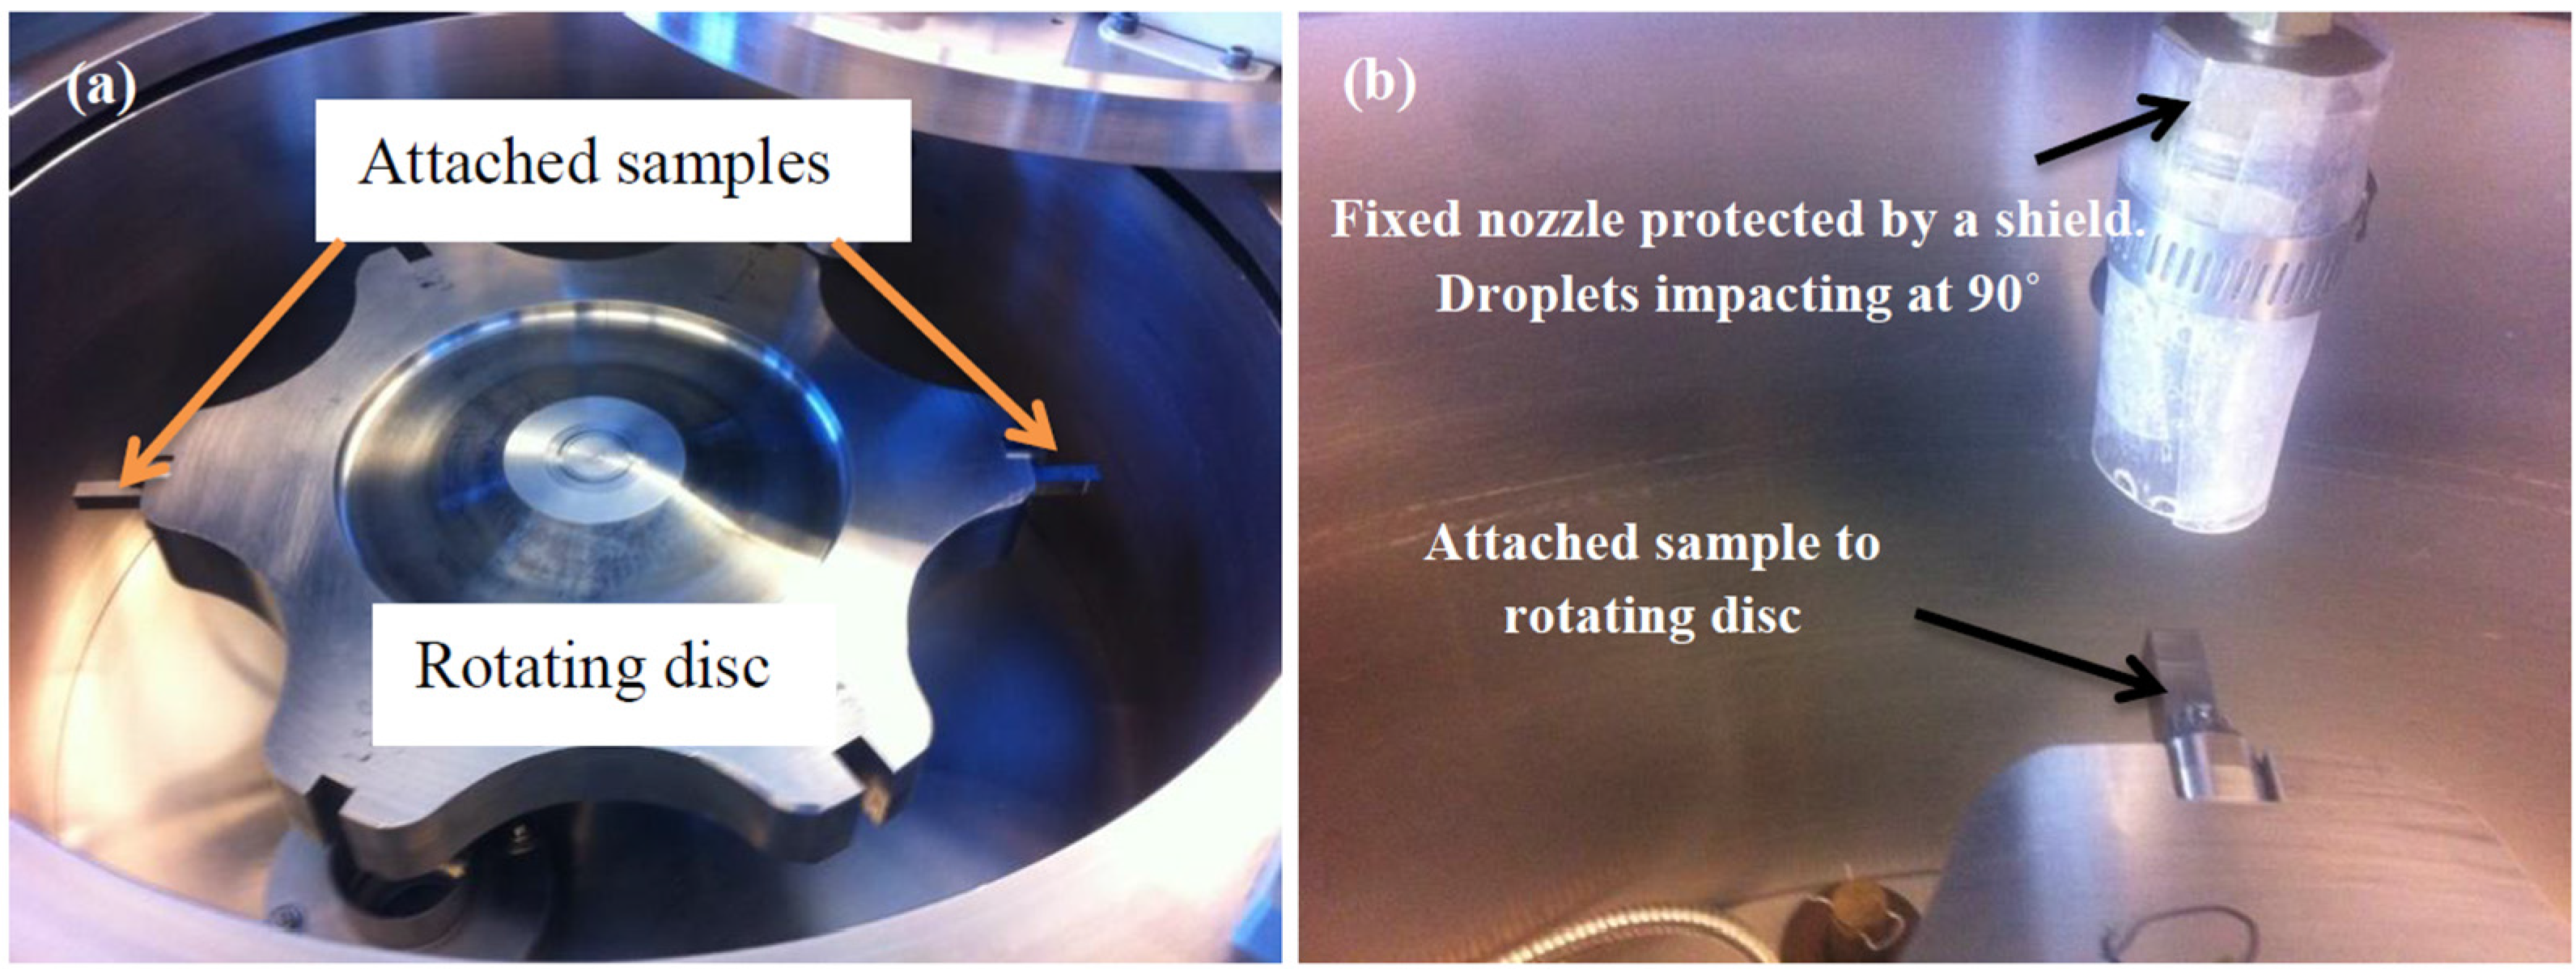
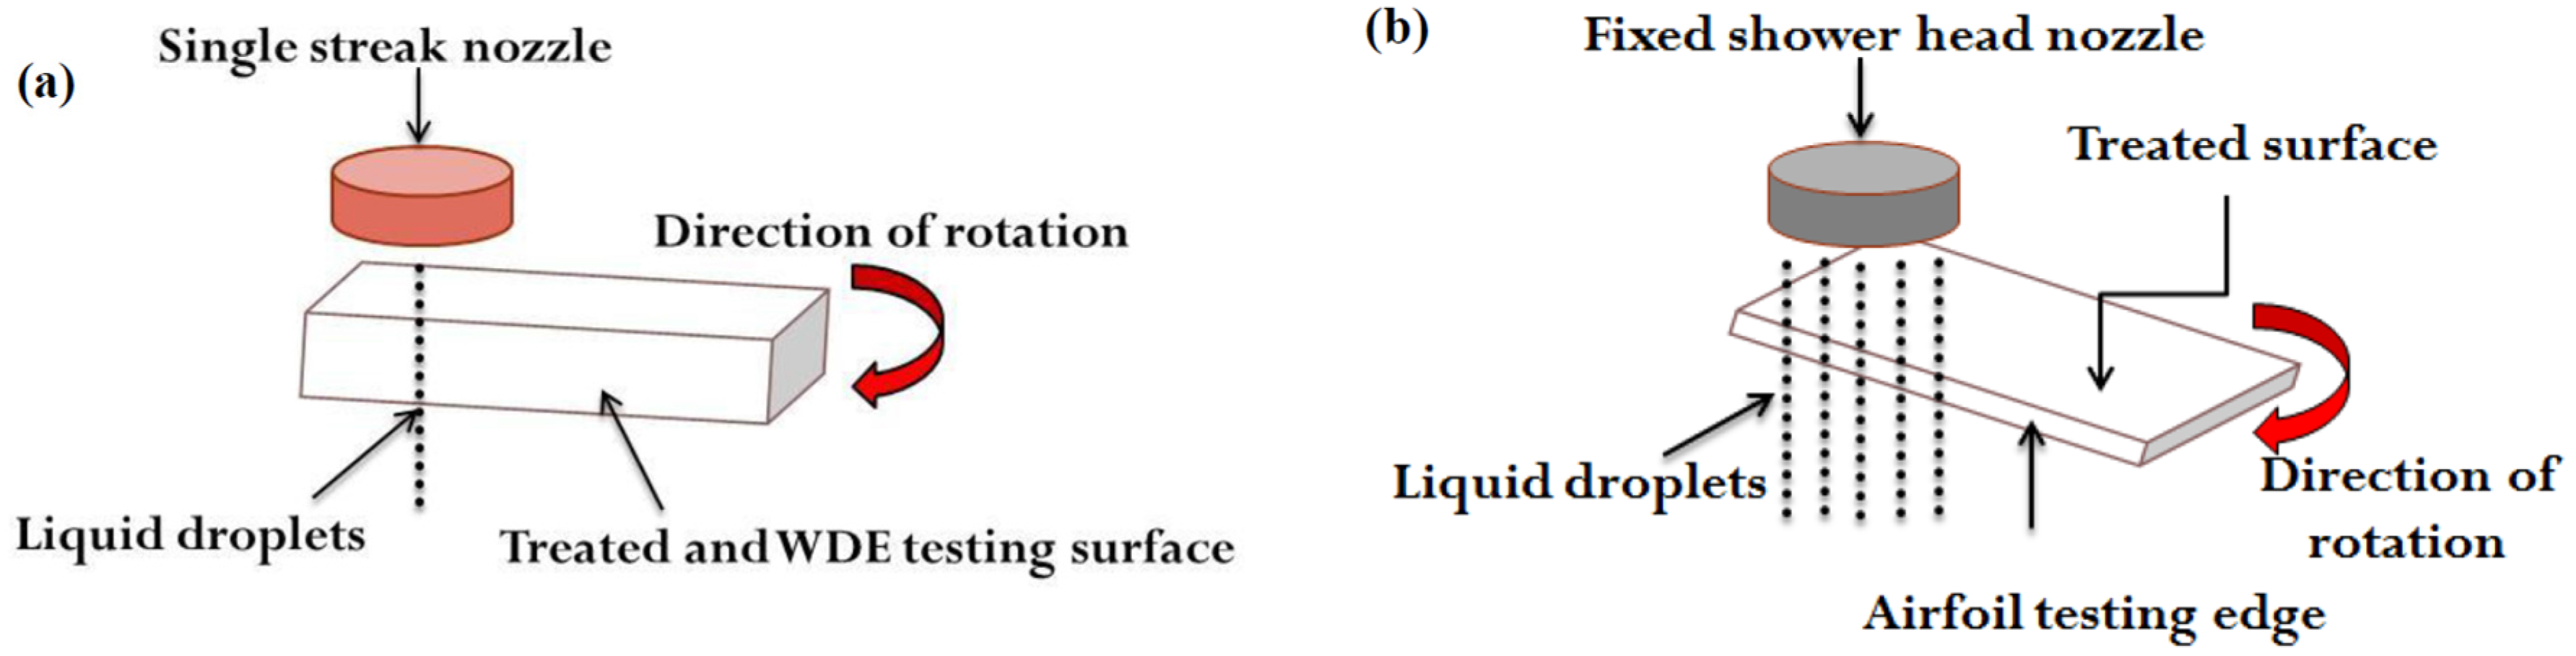
2.3.1. WDE Tests

A rotating disc rig (Barbour Stockwell, Inc. (BSI), Woburn, MA, USA) at Concordia University, Montreal, QC, Canada, shown in Figure 4a, was used for studying the WDE performances of LSP and As-M Ti-6Al-4V. The test was conducted in accordance with the ASTM G73 standard [31]. In this rig, the As-M and LSP samples are fixed at diametrically opposite ends of the rotating disc as shown in Figure 4a. To avoid vibrations during testing, the difference in sample weight not exceeding 0.05 g was maintained. It is worth noting that prior to testing, the surface roughness of both LSP and As-M samples were made similar. The nozzles are fixed and protected by a shield, as shown in Figure 4b, to prevent the droplets from drifting away during testing.
Two types of nozzles were employed for the WDE tests depending on the sample geometry. A shower head nozzle (Simulent Inc., Toronto, ON, Canada) was used for testing the airfoil samples; whereas, a single streak nozzle (Simulent Inc., Toronto, ON, Canada) was used for testing the T-shaped flat samples. Figure 5a,b show a schematic illustration of the WDE testing direction with respect to the T-shaped flat and airfoil treated surface, respectively. Typical WDE testing parameters are summarized in Table 2. Reaching the desired impact (rotational) speed, de-ionized water droplets were introduced at a controlled flow rate. The impact angle of 90° which causes the most severe water erosion damage was used [32]. The erosion exposure time depends on the impact speed, nozzle type, sample geometry, and erosion stage. For instance, shorter exposure times were used in order to capture the early stages of the erosion process (initiation stage). Whereas, longer times were employed as the test progressed to the advanced stages of erosion.

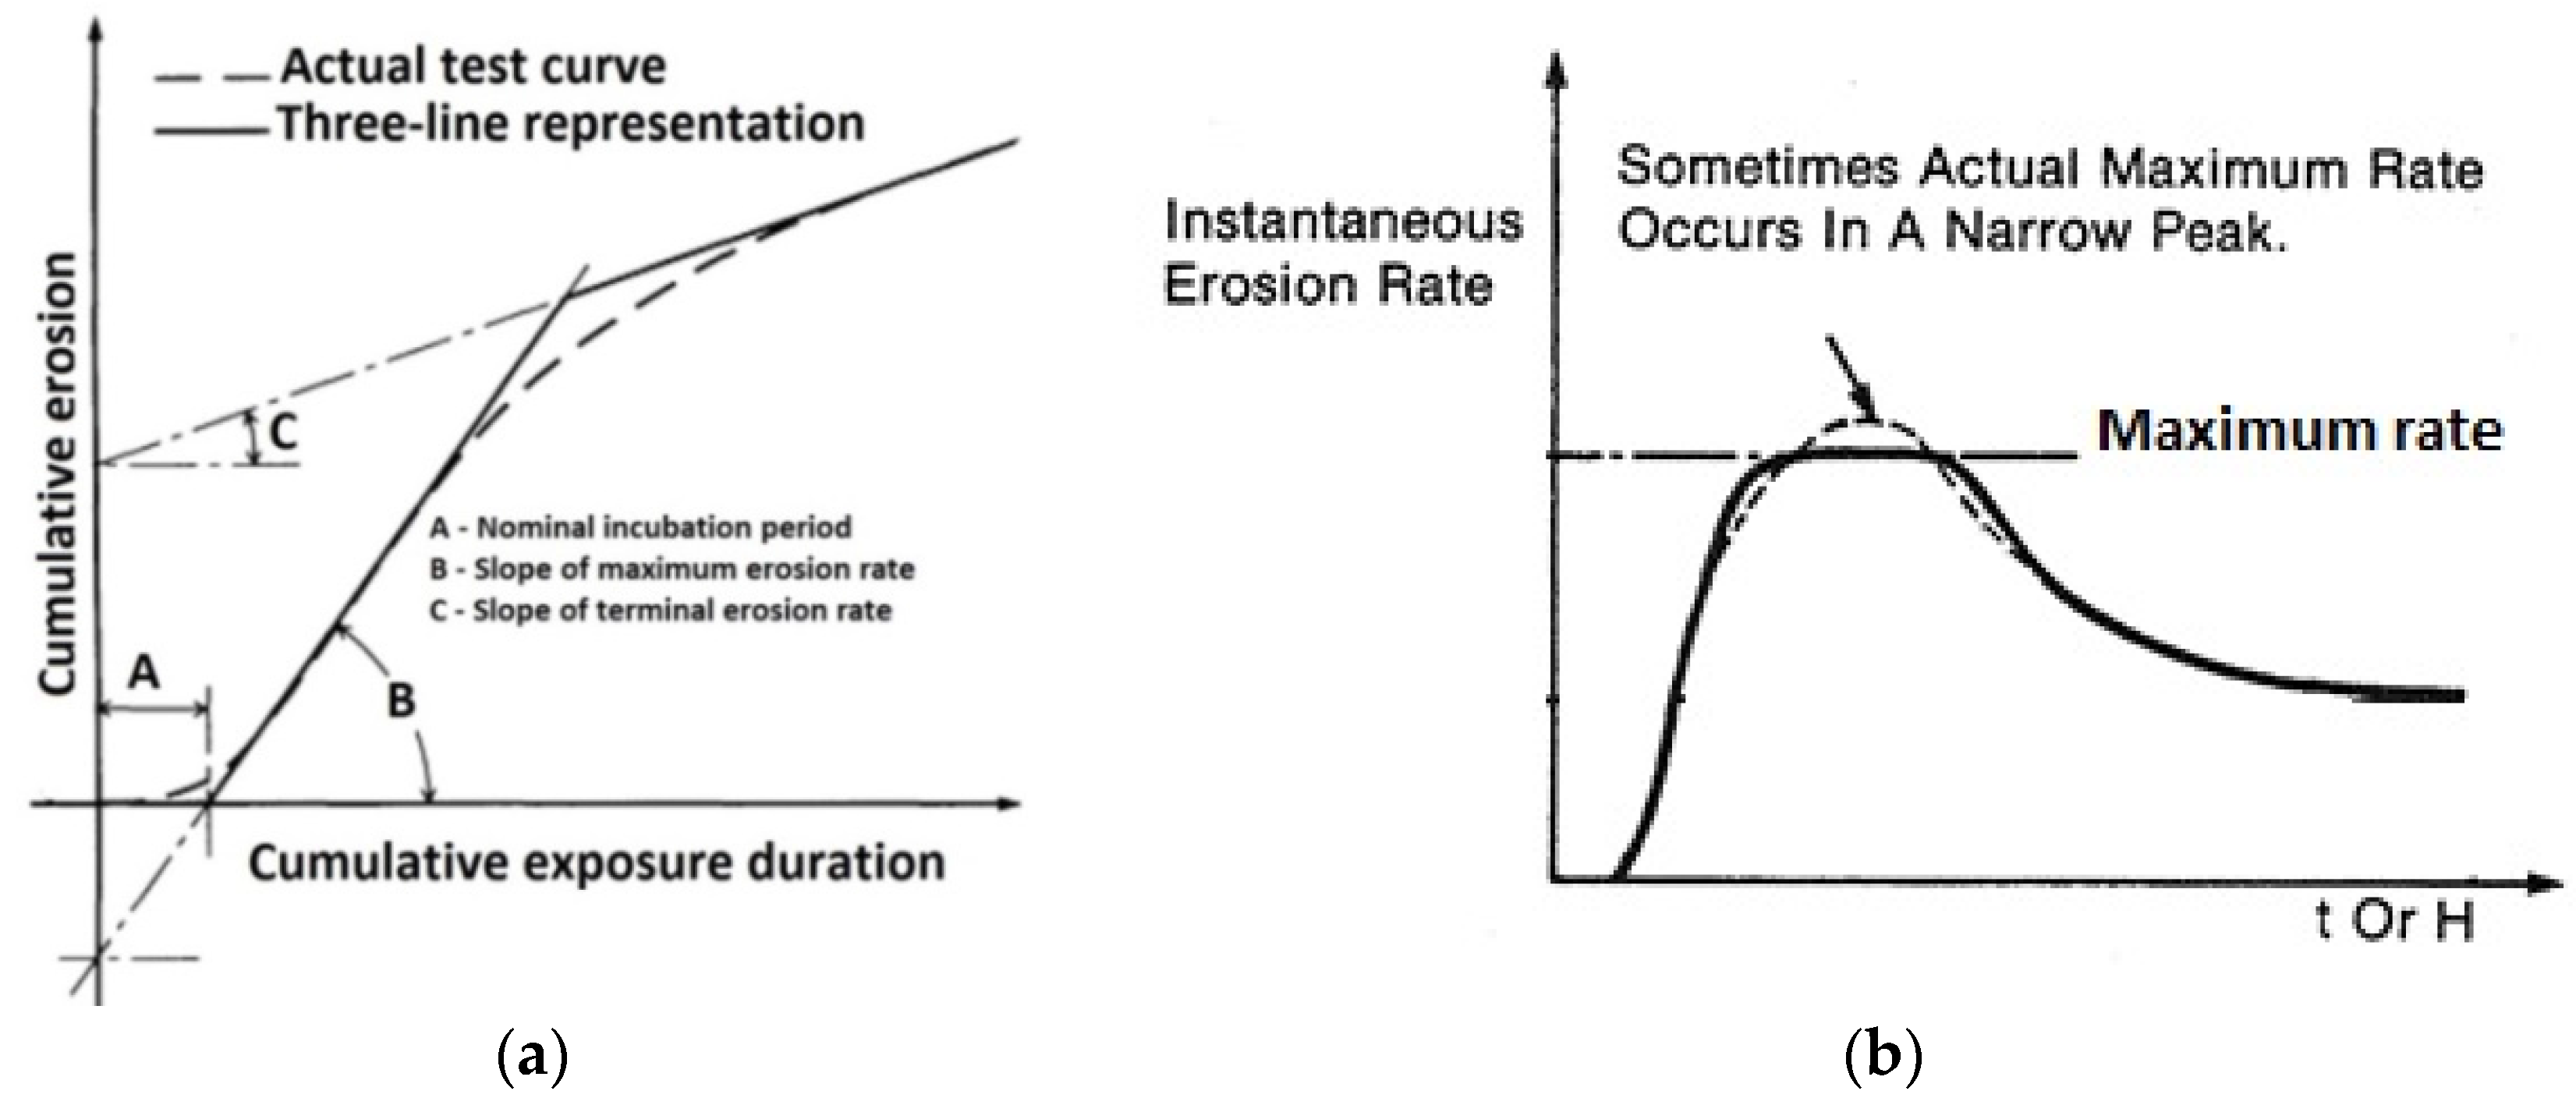
2.3.2. Damage Analysis and WDE Curves Characterizations

During the WDE tests, experiments were halted at certain intervals and eroded samples were weighed using a balance that had ±0.2 mg accuracy. Also, to understand how the erosion process evolved and progressed, images were taken using a standard stereo optical microscope (Ningbo Yaki Optical Instrument Co., Ltd., Zhejiang, China) at the intervals during which the mass loss was measured. Typical erosion curves such as cumulative mass loss versus number of impingements, maximum erosion rate (ERmax) versus impact speed, and number of impingements to erosion initiation versus impact speed were plotted. The cumulative mass loss is the sum of material loss due to exposure to an erosive medium at a particular time. The number of impingements was determined using Equation (1).
N imp = R × E t ×   N droplets
where N imp is the cumulative number of impingements during an exposure period, R is the rotational speed (rpm), E t is the erosion exposure time (minutes) and N droplets is the number of droplets impacting the sample per revolution. For the flat sample geometry, N droplets   has been determined as six. The detailed procedure on the droplet generation, droplet size distribution, and number of droplets impacting the sample has been reported by the current authors in reference [22]. Contrary to the flat sample geometry, there is a challenge of quantifying the number of droplets impacting the airfoil sample. This is due to the shower head nozzle used during testing. Hence, graphs of cumulative mass loss versus number of cycles are plotted. The number of cycles is simply R × E t . For satisfactory determination of the incubation period and ERmax, a three line representation method [33] demonstrated in Figure 6a is used. In Figure 6a, the ERmax denoted as “B” is the slope of the data points in the maximum erosion stage, whereas the incubation period denoted as “A” is the intersection of the straight line with the x-axis (time axis) [31]. To determine the relationship between impact speed and ERmax, the power law relationship given in Equation (2) is used.
E R m a x   V n
where E R m a x   is the maximum erosion rate, V is the impact speed, and n is the speed exponent. To observe the erosion rate as the erosion test progressed, the instantaneous erosion rate (ERinst) which is the slope between two consecutive points on the erosion-time graphs is plotted, similar to that shown in Figure 6b. Hence, in this study the incubation period, ERmax, and ERinst are analyzed.

3. Results and Discussion

3.1. Effect of LSP on Surface and In-Depth Characteristics

The effects of LSP and its associated attributes on the surface and in-depth characteristics of Ti-6Al-4V alloy have been investigated. This section reports the effect of the LSP process on the observed XRD pattern, compressive residual stress, microstructure, and microhardness.

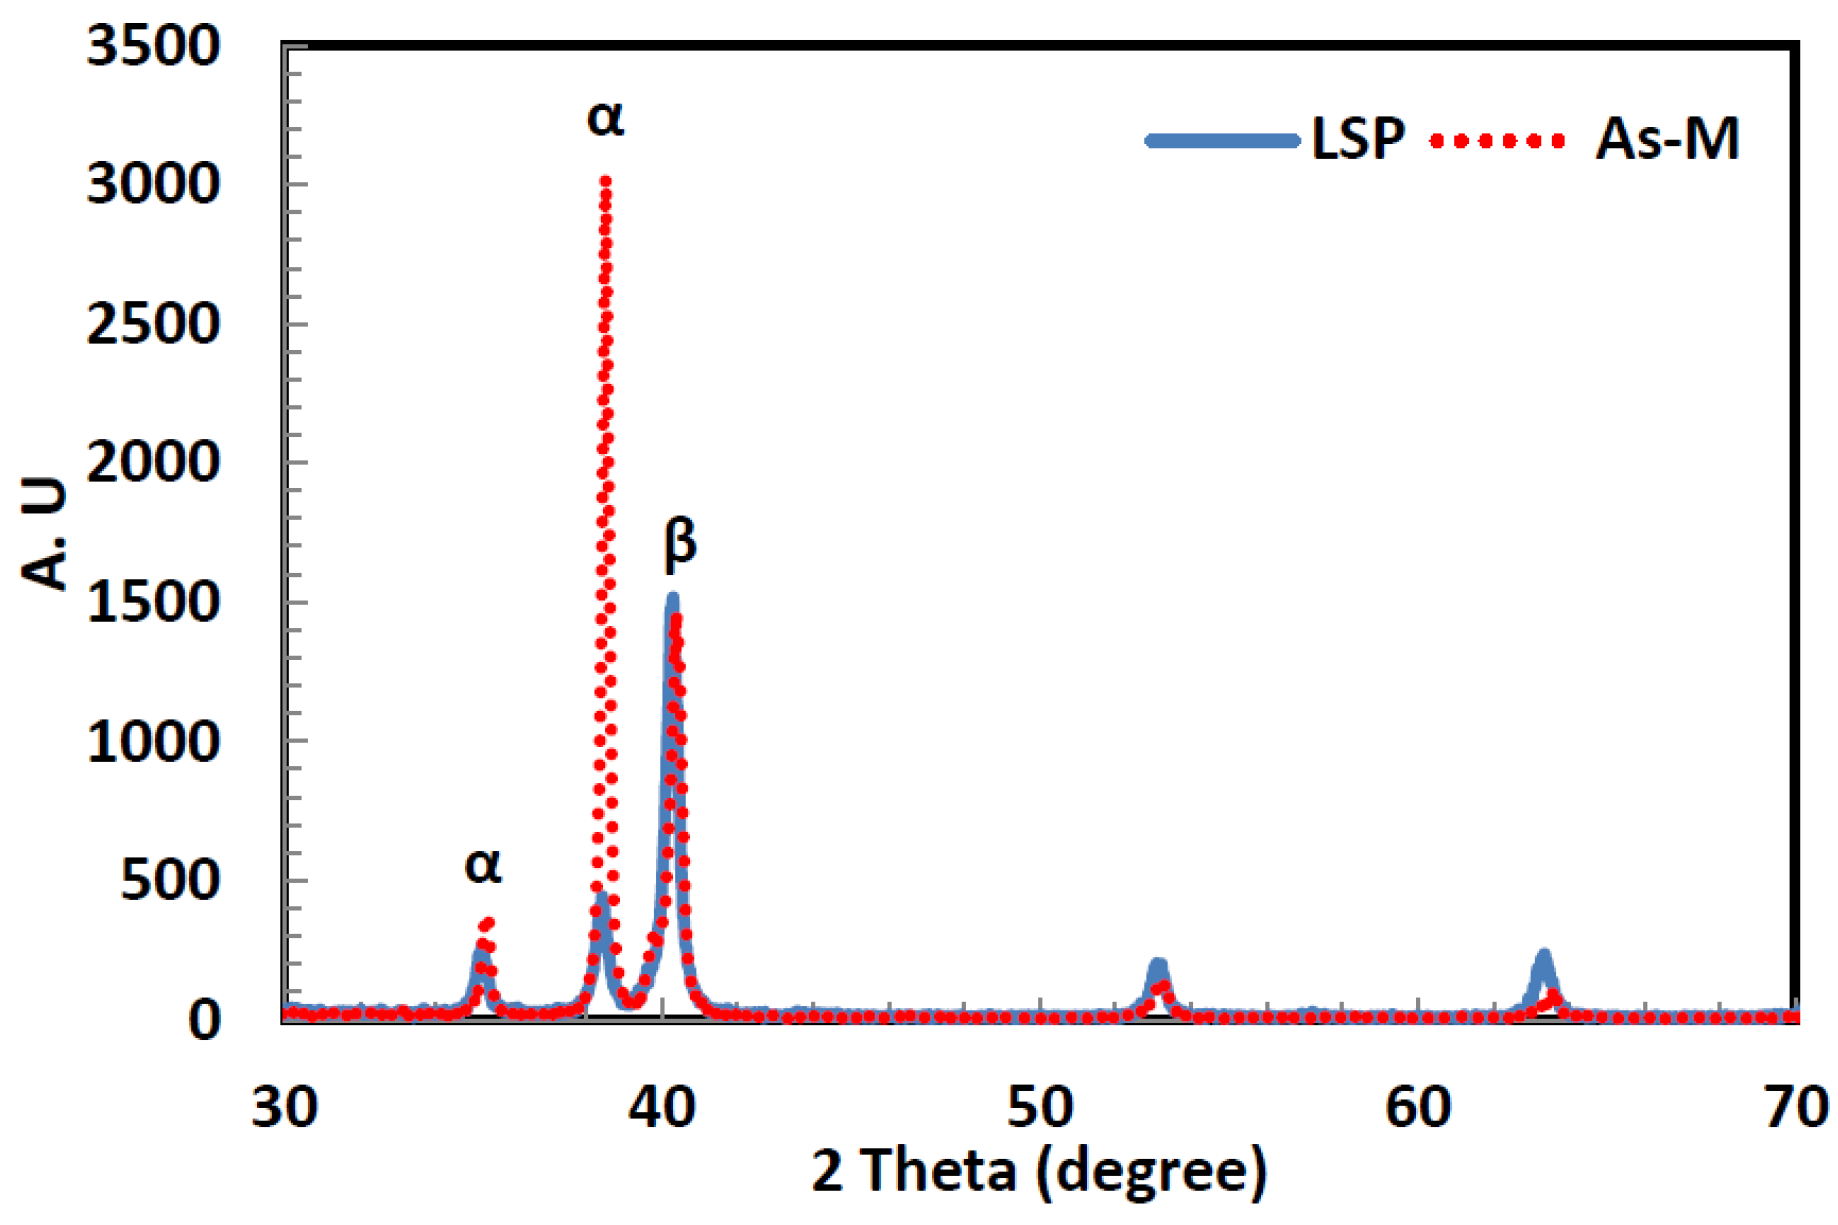
3.1.1. XRD Pattern and Compressive Residual Stresses

Figure 7 shows the XRD patterns of the As-M and LSP conditions acquired. Observing the first three peaks, the intensity of the first two peaks is reduced for the LSP condition compared to the As-M condition. For all three peaks, the LSP condition showed peak broadening compared to the As-M condition. The full width half maximum (FWHM) approach was used to quantify this peak broadening in Figure 7. For the As-M condition, 0.26, 0.22, and 0.36 were obtained for the first, second, and third peak, respectively. Similarly, for the LSP condition, 0.38, 0.39, and 0.38 were obtained. It can be inferred here that the reduced peak intensity and peak broadening are due to the induced lattice strains during LSP processing [34,35]. Prevéy [36] and Zolotoyabko et al. [29] mentioned that X-ray diffraction peak broadening is associated with an increase in induced lattice strains. This was attributed to the induced cold work during processing. This is in accord with the observation in this work.
Furthermore, the top surface compressive stresses were measured for the As-M and LSP conditions in the 0°, scanning, and 90°, transverse, directions. The As-M condition showed −490 ± 19 MPa and −607 ± 9 MPa, respectively in the 0° and 90° directions due to the machining process. The LSP condition showed residual stresses of −770 ± 13.50 MPa and −768 ± 14.82 MPa in the 0° and 90° directions, respectively, which are higher than those observed for the As-M condition. This is due to the effectiveness of LSP in inducing compressive residual stress. The LSP induced stresses are in the range of 600–750 MPa and are about 60%–80% of the materials’ yield strength. This is in accord with the current findings. Since then, several studies have reported the variation of the compressive residual stress with depth after the LSP process [14,15,17,18,37]. The in-depth residual stresses were not measured in this work.

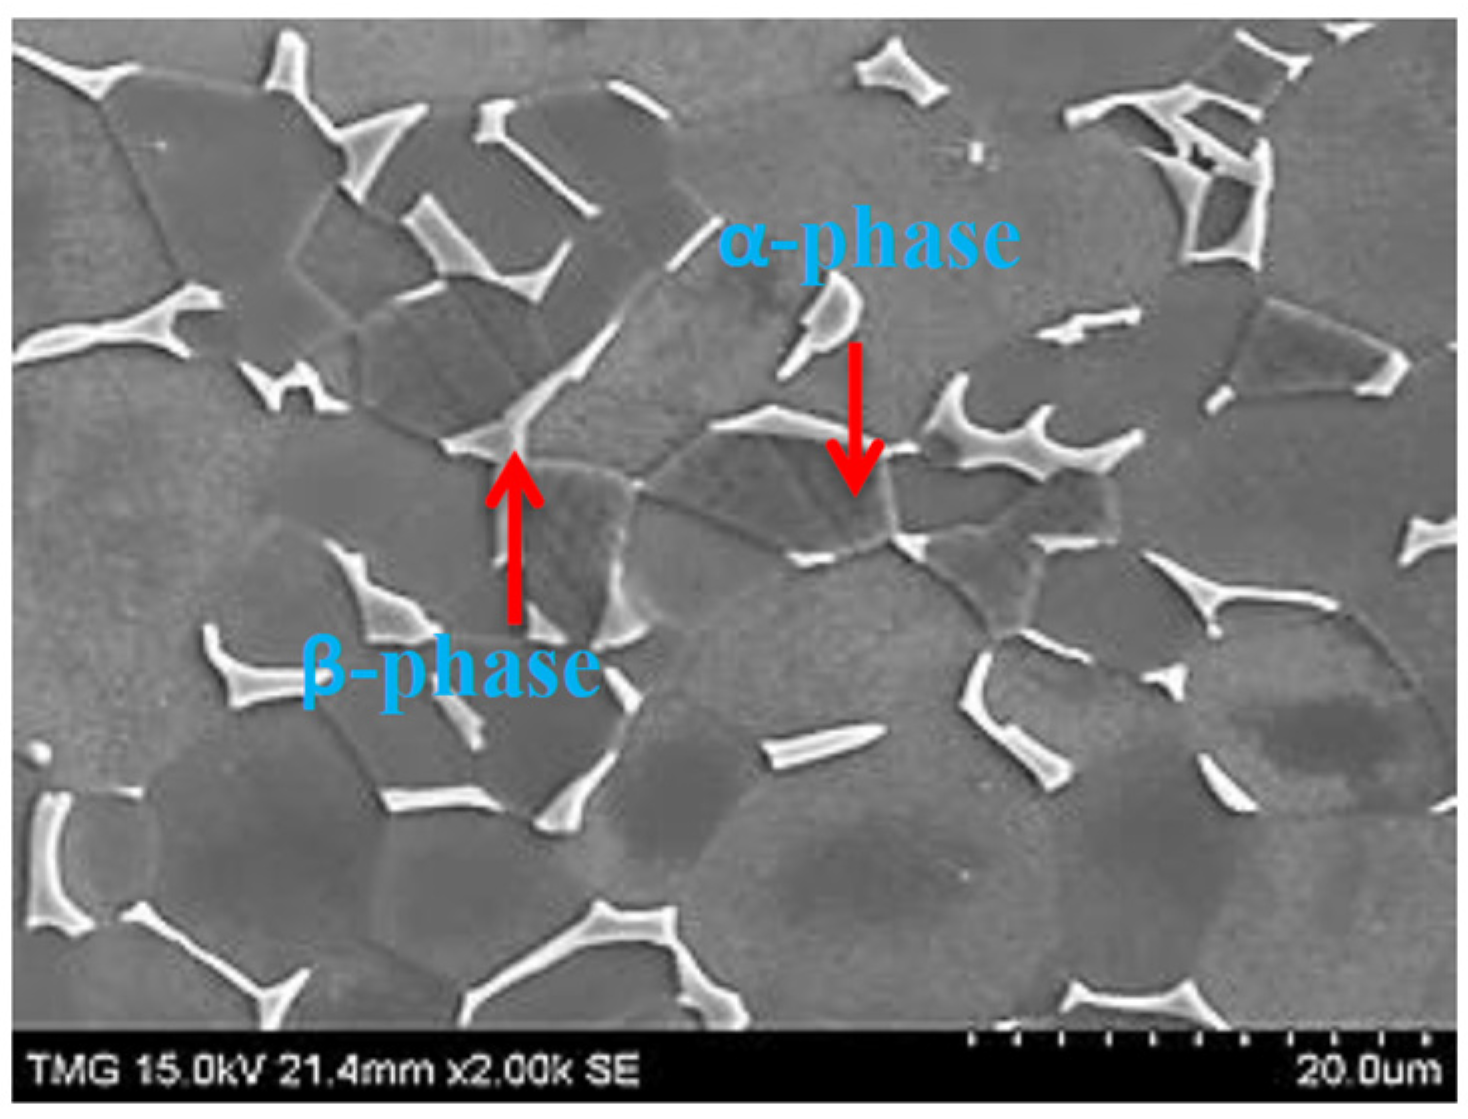
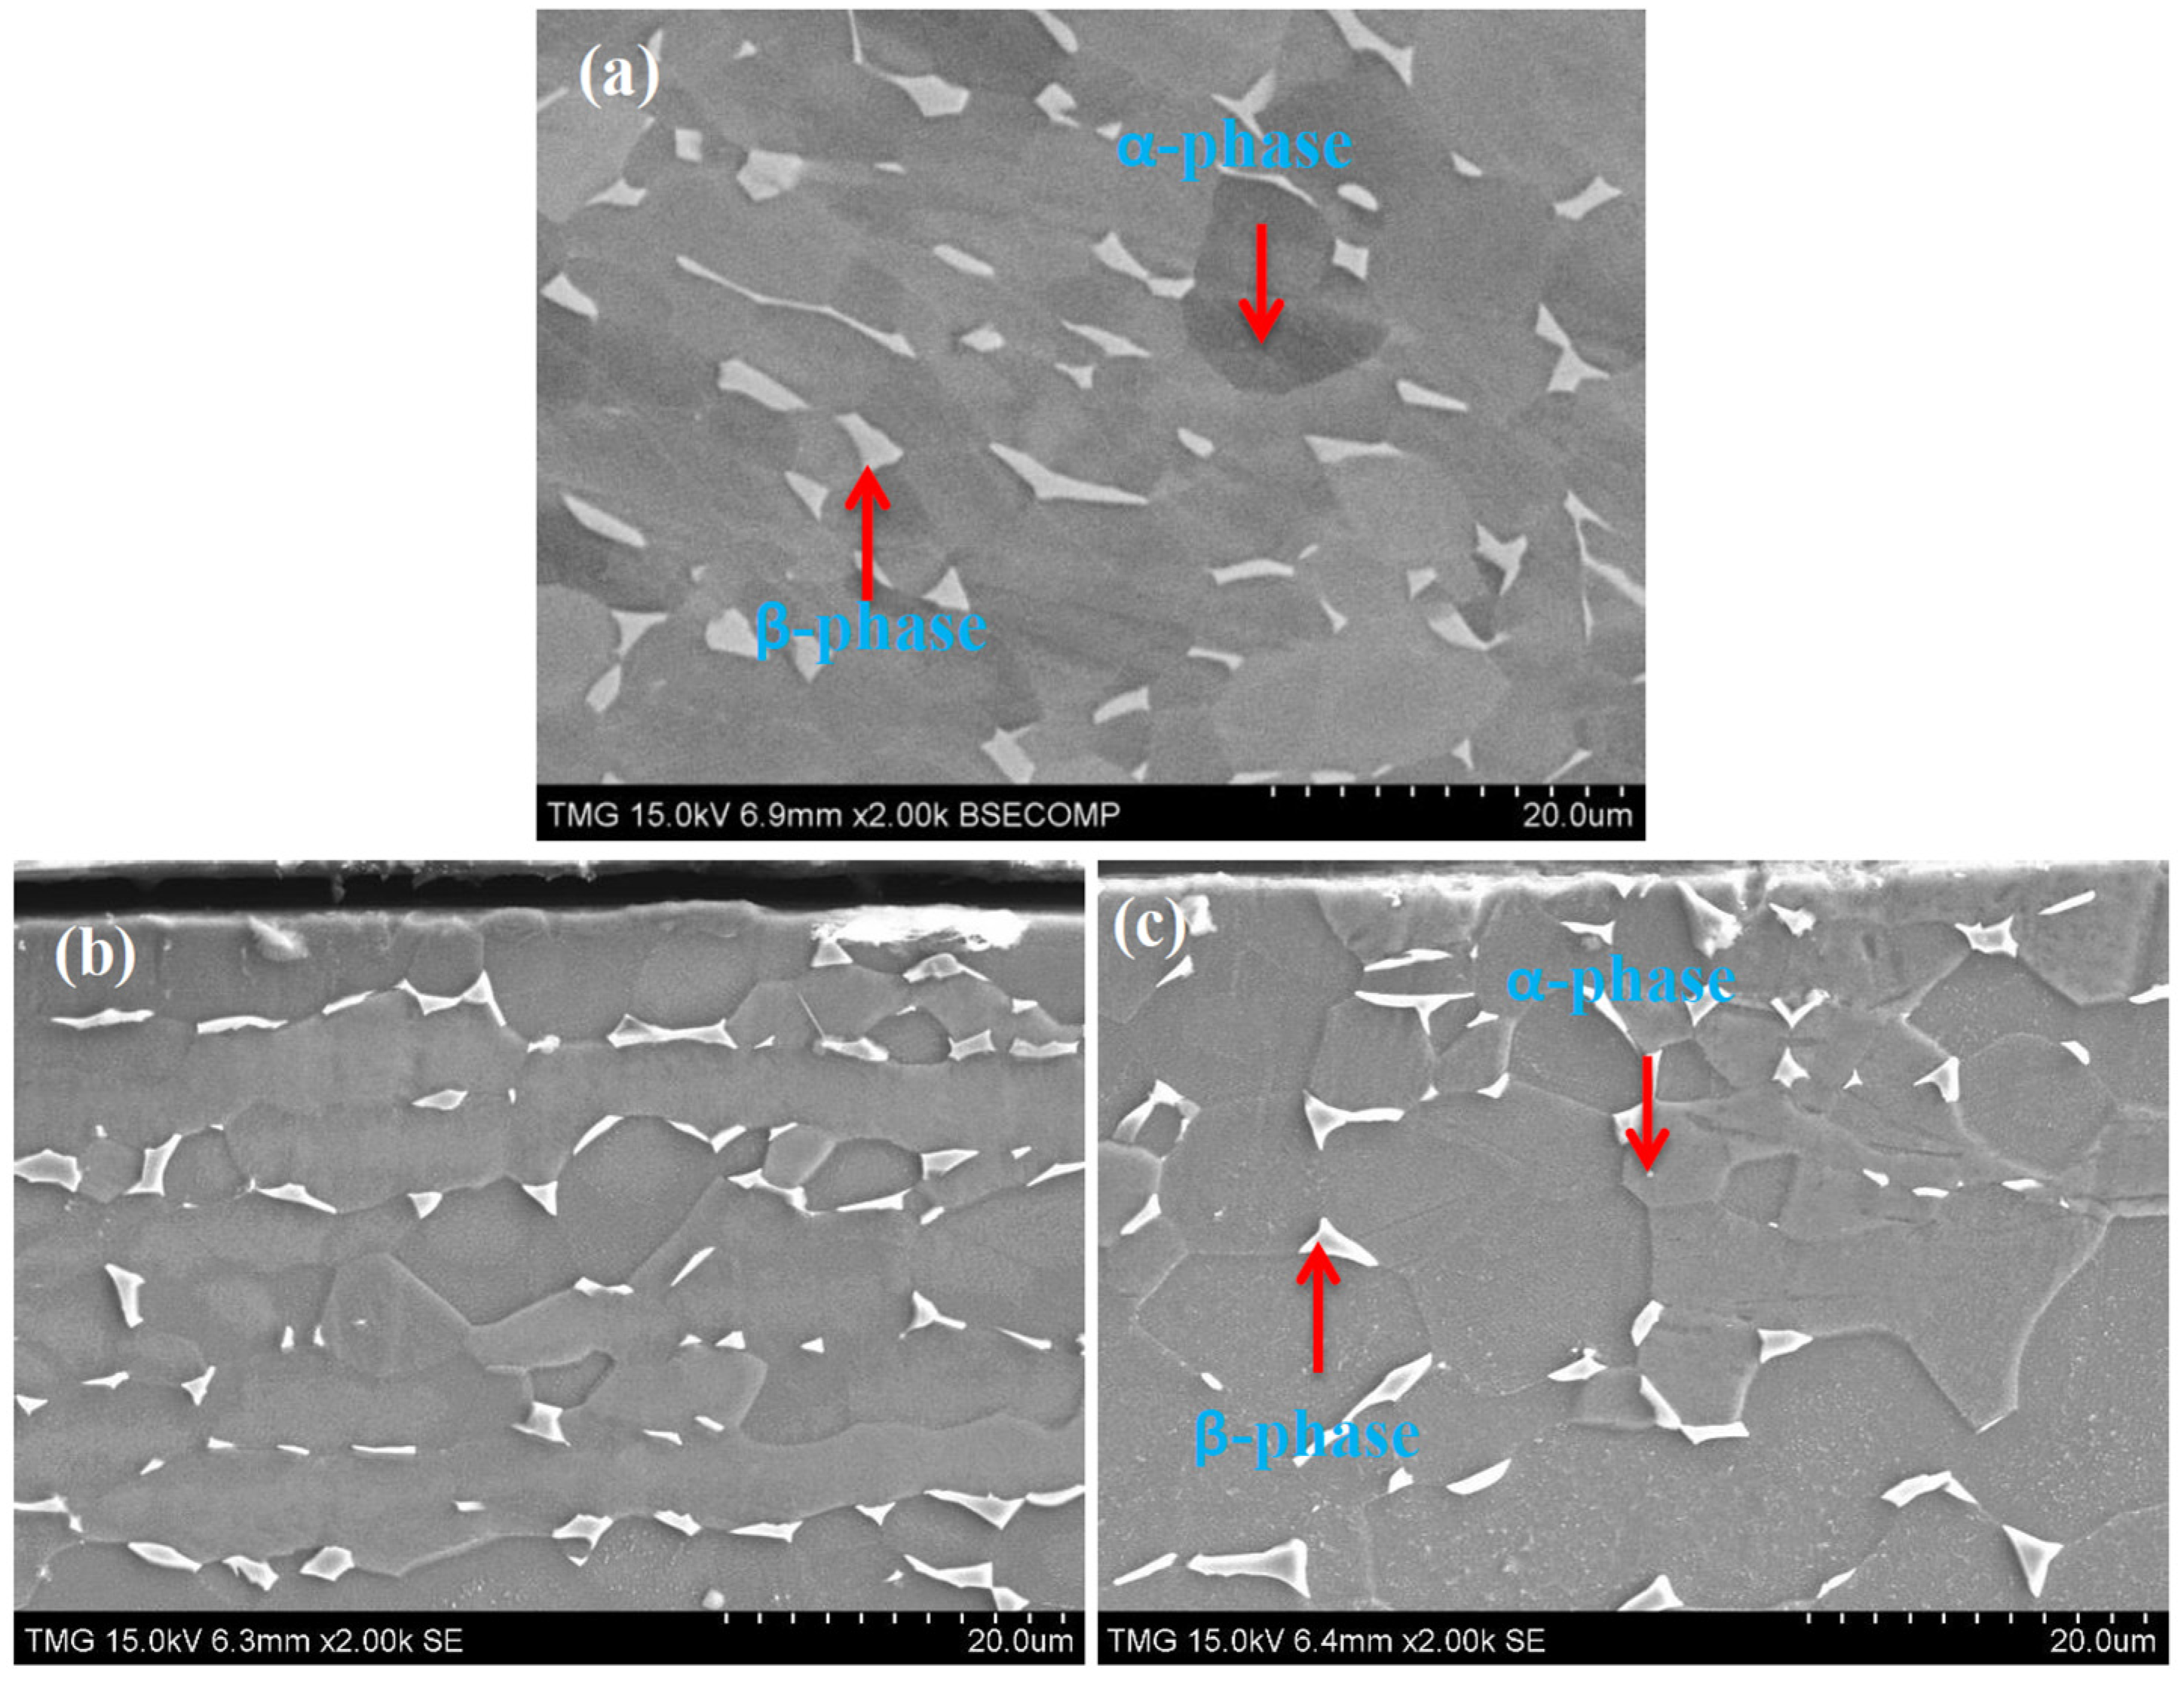
3.1.2. Microstructure

The top surface and cross-sectional views of the As-M and LSP conditions were observed using SEM. Figure 8a shows the observed top surface of the T-shaped geometry after LSP processing, however microstructural changes due to deformation are not observed due to the small amount of cold working induced during the LSP process [13,38,39]. This is similar to the observed trend on the airfoil geometry despite having higher number of layers compared to the T-shaped samples. Graham et al. [40] further mentioned that laser shock processing does not cause macroscopic deformation in the treated region. Thus, this micrograph is similar to the starting microstructure (As-M) shown in Figure 1. Figure 8b,c show the in-depth microstructures of the As-M and LSP conditions, respectively. Similarly, no noticeable changes were observed in the microstructure after LSP treatment across the depth. Shepard et al. [27] reported the effect of LSP on the microstructure of Ti-6Al-4V. They [27] employed several peening parameters such as different pulse repetitions of 1, 3, and 5 shocks/spot and power densities of 4 and 9 GW/cm2 while keeping the pulse duration of 20 ns constant. Their [27] results showed that LSP induced deep levels of compressive residual stresses, especially with an increase in both pulse repetition and power density. However, their [27] SEM micrographs showed no changes in the microstructure after peening. Zhao [41] also reported that the microstructure of peened and unpeened Ti-6Al-4V samples after LSP processing at different energy levels was similar. This is also the case in the present work. It is well known that the pulse duration produced by the peening process where laser shock interaction times are very short (in nanoseconds) compared to other conventional peening techniques such as shot peening [42]. Even though XRD analysis (peak broadening) suggests induced strains after LSP, the short interaction times and very limited impacts per unit area might not significantly change the microstructure. This is mainly attributed to the low level of cold work during the processing used (about 5%) [39]. Moreover, information on the interaction of the microstructure with laser induced shock waves and the resulting changes at the macro- and microstructural levels is still lacking in the literature. Based on the present work and works in [27,41], it can be inferred that microstructural changes after peening might not be significant even though deep compressive residual stresses are induced.

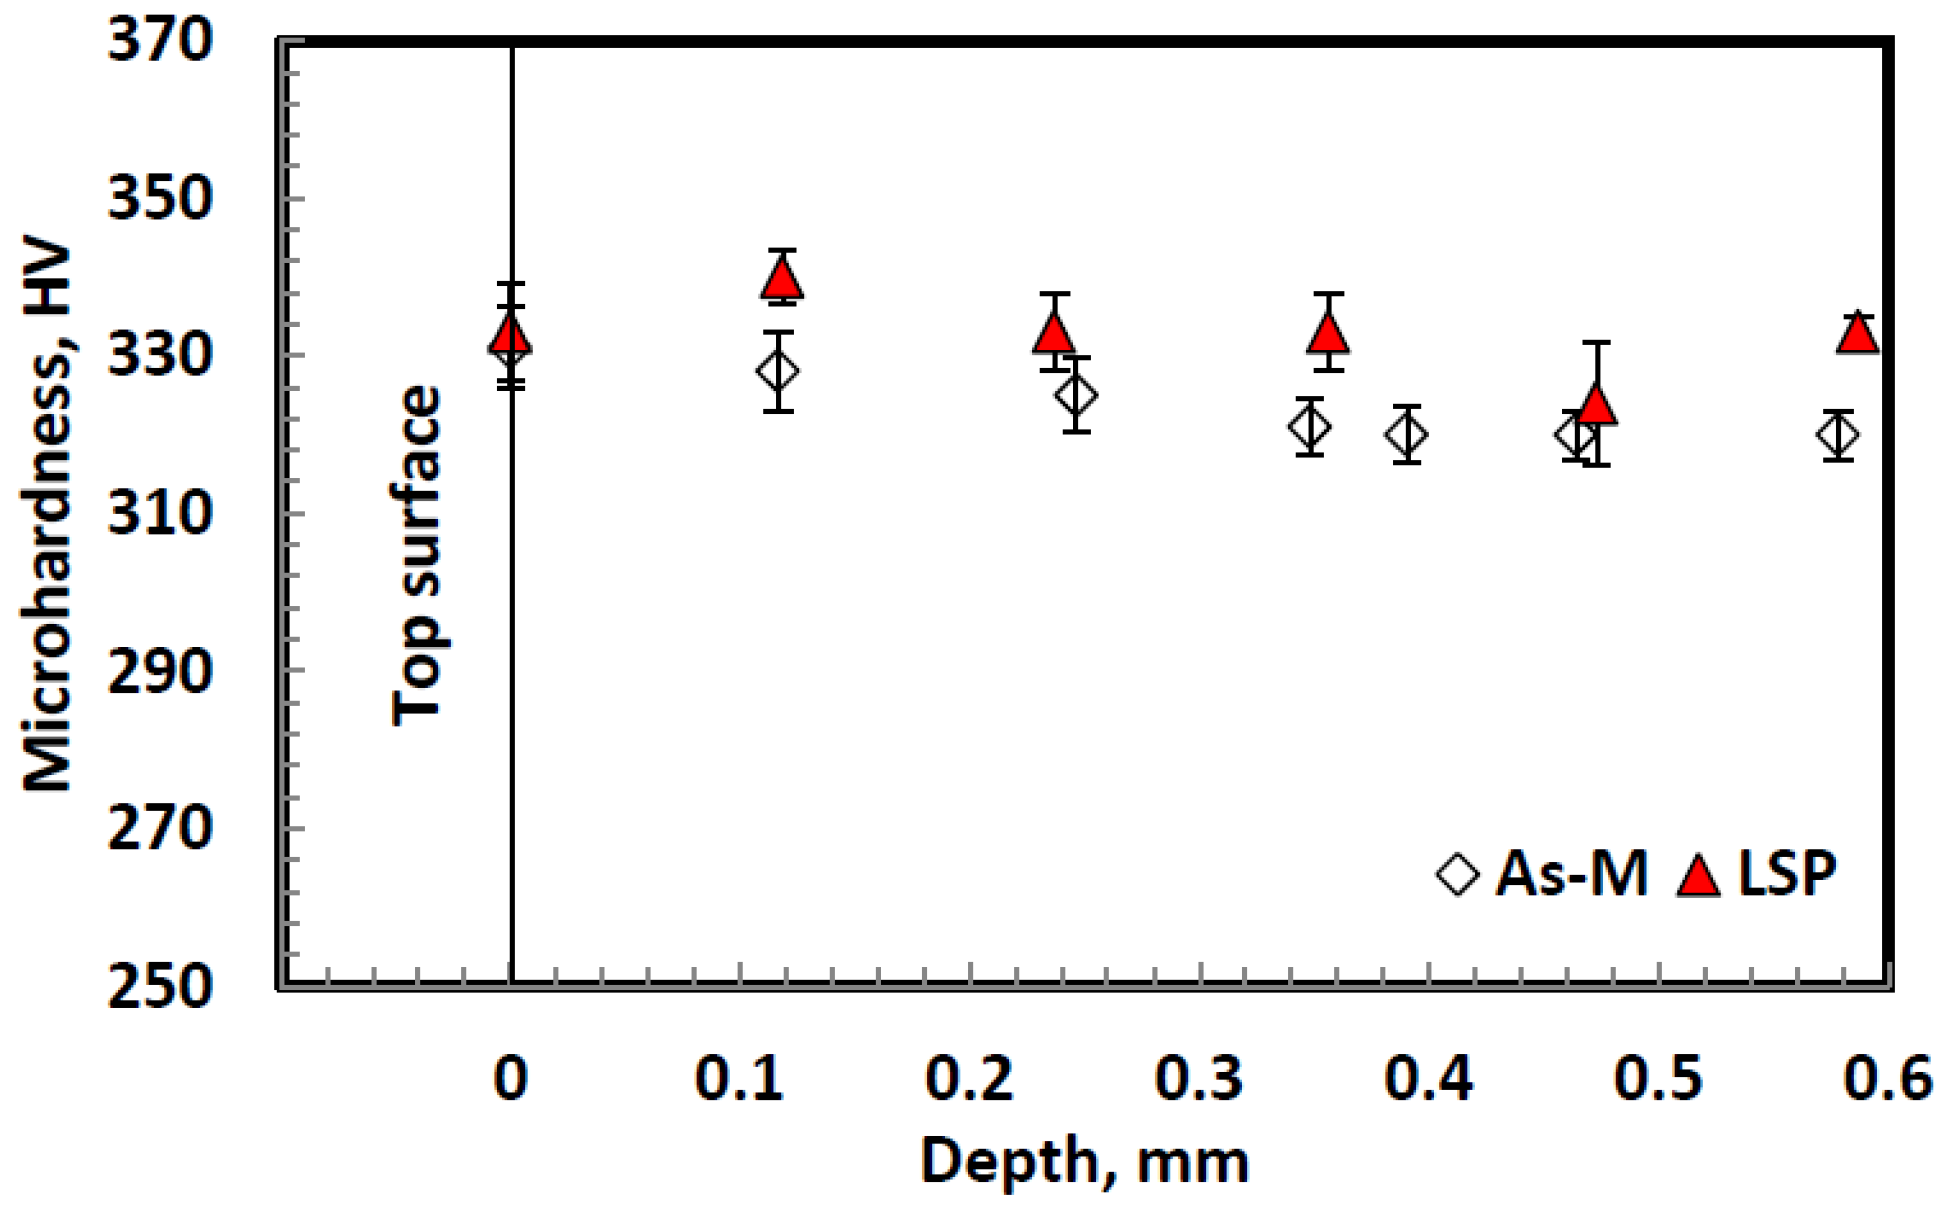
3.1.3. Microhardness

Figure 9 shows the microhardness measurements of As-M and LSP conditions on the T-shaped geometry. The top surface microhardness values were 331 ± 5.3 HV and 333 ± 6.2 HV for As-M and LSP conditions, respectively. Microhardness across the depth shows only a mild increase or no appreciable increase after the LSP treatment. A similar trend was observed on the airfoil samples. Chavez et al. [43] also reported that LSP had no apparent effect on the microhardness of Ti-6Al-4V. These observations are in accord with the works of Rubio-González et al. [44] and Fairand and Clauer [45] on other materials. For instance, Rubio-González et al. [44] showed that LSP had no effect on the hardness of 2205 duplex stainless steel. They [44] attributed this to the insufficient energy from LSP. Again, Fairand and Clauer [45] reported the effect of LSP on heat treated aluminum alloys (2024-T351, 2024-T851, 7075-T651, 7075-T73). Their [45] results showed that LSP increased the hardness in 2024-T351. However, there was no appreciable effect on the hardness of peak aged 2024-T851 and 7075-T651 and over-aged 7075-T73. No obvious reasons were mentioned for the observed behaviours. This can be attributed to the low level of cold working associated with the LSP processing [46]. Reports [39,47] have shown that LSP induces about 5% cold working. It is known that cold working improves the mechanical properties such as hardness and tensile strength [48]. For instance, Nagarjuna et al. [49] studied the effect of cold working on the mechanical properties and structure of Ti alloy (Ti with Cu-1.5 wt %). They [49] reported that increases in the percentage cold work from 0%, 20%, 40%, 60%, up to 80% showed significant increase in hardness. This also had a corresponding increase in the tensile strength of the alloy. This is due to the fact that tensile strength is directly proportional to the hardness [50]. It was deduced from their work [49] that at 5% cold work, the tensile strength was increased by only less than 2% compared to a 46.15% increase at 80% cold work. Petunina and Poplavskaya [48] also studied the effect of cold working on the strength of titanium-based alloys (pure Ti and Ti-3Al-2V). They [48] stated that the tensile strength of the titanium alloys was enhanced significantly after 20% cold working with only a slight loss in ductility. Gupta et al. [51] also studied the effect of prior cold working before tensile tests on equiaxed α- and β-phase Ti-6Al-4V. Three different levels of cold working were employed, 0%, 10% and 15%. They [51] reported that with 10% and 15% cold work, the tensile strength (TS) and ultimate tensile strength (UTS) were increased as compared to the 0% cold worked condition. Hence, the strain hardening exponent (n) and strength coefficient (K) were consequently increased with an increase in cold working. They [51] attributed this behaviour to the large amount of dislocations and the dislocation pile up hindered the movement of other dislocations, thus strain hardening the material. In the current work where LSP is assumed to induce only 5% cold work, the hardness increased by only 2%–3%. From the aforementioned works [48,49,51], it can be confirmed that a low level of cold working from LSP might not have a significant effect on hardness. This accompanied with the unchanged microstructure (Figure 8c) could have led to the observed unchanged microhardness. It is known that refinement of microstructure or reduction in grain size is associated with enhanced microhardness [12]. This is not the case in this work. The observed surface and in-depth characteristics are used to understand the WDE performance.

3.2. Water Droplet Erosion Performance

During WDE tests, two coupons (As-M versus LSP) were tested at the same time in order to investigate their WDE performances. To understand the effects of LSP and its attributes on WDE performance, a wide range of impact speeds was used. For the T-shaped flat samples, impact speed was the main parameter varied while keeping other parameters constant. Here, impact speeds of 150, 200, 250, 300, 325, and 350 m/s were selected. For the airfoil samples, only impact speeds of 300 and 350 m/s were used. Also, two droplet sizes of 200 and 460 µm were used. For the 460 µm droplet size used, impact speeds of 300 and 350 m/s were employed, whereas only 350 m/s was employed for the 200 µm droplet size test. An impact speed of 350 m/s was chosen as the most severe condition, whereas 300 m/s was chosen to have a less severe testing condition. Testing at lower impact speeds than 300 m/s and 200 µm droplets would require impractically long testing times. Therefore, tests using impact speeds of <300 m/s for airfoil geometry were not performed in this work.

3.2.1. WDE Performance of LSP and As-M T-Shaped Sample Conditions

Figure 10a,b show the graphs of cumulative mass loss versus number of impingements for flat T-shaped LSP and As-M conditions at impact speeds ranging from 150 to 350 m/s. Figure 10b shows typical well-behaved erosion curves with an S-shape. With this curve shape, distinct erosion stages such as incubation (initiation) period with negligible mass loss; acceleration stage up to a ERmax stage; deceleration (attenuation) stage with declining erosion rate (ER) and terminal erosion state with constant ER can be observed [31,33,52]. In this work, the incubation period and ERmax are analyzed. From Figure 10, it can be seen generally that increasing the impact speed from 150 to 350 m/s showed faster erosion evolutions and progressions in both As-M and LSP conditions. This is due to the increase in test severity with an increase in impact speed. Interestingly, at an impact speed of 150 m/s (Figure 10a), no erosion was observed on both As-M and LSP conditions after 840 min of exposure which corresponds to approximately 30 million impingements. Here, only a shiny erosion line trace was observed under the optical macrograph and no visible damage was detected. This is shown in the insert macrograph in Figure 10a. This could be the threshold speed for both As-M and LSP conditions which is greater than or equal to 150 m/s. The threshold speed is the speed below which no apparent damage is seen [52]. Moreover, the definition of this speed is somehow subjective and depends on the testing conditions such as impact speed, droplet size, and number of impingements. In this work, it was found that using an average droplet size of 464 µm and a flow rate of 0.05 L/min, the threshold velocity was in the range of 150 m/s ≤ Vthreshold ˂ 200 m/s where there was no measurable mass loss after 840 min of exposure which corresponds to more than 30 million impingements. This is an important observation that has not been captured in previous studies on WDE of Ti-6Al-4V [10,20,53]. Based on Figure 10a,b, it can be seen that similar WDE performance was observed for both As-M and LSP conditions. In other words, both conditions showed similar WDE behaviour at all stages of the erosion, irrespective of the impact speed employed. The slight differences observed in the graphs is considered within the experimental errors.
Using the three line representation (Figure 6a), the effect of impact speed on the erosion initiation and ERmax was deduced for the LSP and As-M conditions based on the results presented in Figure 10a,b. Figure 11a,b show the aforementioned effect of speed on the erosion initiation and ERmax, respectively. It is evident from Figure 11a that at higher impact speeds, a lower number of impingements were required to initiate erosion damage. Also, higher impact speed corresponds to greater ERmax due to increased test severity. However, at all tested speeds, the number of impingements to initiate erosion for the LSP and As-M samples was the same. The relationship between impact speed and ERmax was established using the power law equation (Equation (2)) and the speed exponent was determined. For metals, typical exponent values range from 5 to 7 in the literature [54,55]. However, based on Figure 11b, an exponent value of 8.9 was observed for the As-M and LSP samples, respectively. This observation is in accord with the studies by Kamkar [20] and Mahdipoor et al. [56], where they reported values of 9 and 7–9, respectively, for WDE tested Ti-6Al-4V. The exponent value obtained in this work and in [20,56] is higher than the range (5–7) found in the literature. This could be due to the test set-up/conditions, initial target surface conditions, and erosive medium characteristics such as droplet size and droplet velocity. For instance, exponent values of 5 [54] and 6–7 [21] have been reported for liquid jet impact and liquid impingement erosion for pipe wall thinning applications, respectively. In this work and in [20,56], the application is for water droplet erosion for compressor blades of gas turbines. Hence, it can be seen that the test set-up/conditions are different which resulted in different exponent values. Also, the technique used for determining ERmax could have influenced the observed difference. In this work and in [20,56], the three line representation technique was employed, whereas others [21,54,57] used the ERinst approach. Based on Figure 11b, the exponent value (8.9) further confirms that the LSP and As-M conditions have similar WDE performance.
Two main reasons for the observed WDE performance are the lack of noticeable microstructural changes (Figure 8) and a mild increase in microhardness (Figure 9) after the LSP treatment. Microhardness is one of the most important material properties used to assess the resistance of materials to WDE damage [52,58]. It has been reported [32,58] that erosion resistance varies with the 2nd to 3rd power of hardness. A refined microstructure and reduction in grain size have also been associated with erosion resistance [52,58]. For treated Ti-6Al-4V, enhanced microhardness and refined grains have shown improved erosion resistance [59,60]. However, this is not the case for the LSP condition, thus similar erosion behaviour compared to the As-M condition is expected.
The influence of induced compressive residual stresses in understanding erosion performance is paramount. It has been reported that induced compressive residual stresses suppress cavitation erosion. For instance, Hackel et al. [37] reported the effect of laser peening on the cavitation erosion behaviour of Ti-6Al-4V. Their [37] preliminary erosion results showed that the LSP technique suppresses cavitation erosion due to the beneficial induced compressive residual stresses. In their [37] work, no information about microhardness, microstructure, and surface roughness after LSP was provided. Also, the starting surface conditions for both peened and unpeened samples prior to the cavitation test were not mentioned. These details are needed in order to understand this behaviour. It should be noted here that cavitation erosion is different from water droplet erosion. The main difference is the high exerted pressure by the liquid droplets and the radial outflows in WDE damage and this is not the case during cavitation tests which deal with the collapse of bubbles. In WDE, the surface is continuously impacted by water droplets, and transmission and reflection of the stress waves will occur repeatedly. These waves interact and result in high tensile stress waves that cause crack initiation and propagation of existing cracks. Because of the high frequency of the liquid impacts at high speeds, the stress wave interactions will be very fast and the magnitude of the resulting tensile stress waves will be high. This is not the case in cavitation tests.
The influence of mechanical surface treatments on the WDE behaviour of materials has not been explored extensively in the literature. Heymann [58] stated that processes involving cold working (strain hardening) such as pressing, rolling, or hammering might be beneficial in mitigating erosion damage. However, too much cold working might show detrimental effects. In another report, Frederick and Heymann [5] stated that processes involving peening might not be beneficial in enhancing the WDE behaviour of materials especially during the incubation stage. This is due to the fact that the exposed surface is plastically deformed twice and consequently, work hardened twice. The first work hardening comes from the peening process itself, whereas the second comes from the continuous droplet impacts during the erosion process. The duplication of the work hardening process at the incubation period might be detrimental to the WDE behaviour [5]. Heymann [52] further stated that the first plastic deformation retards erosion initiation while the second promotes the erosion initiation. The first and second plastic deformations balance each other, thus this may result in non-enhanced WDE performance. The statements mentioned in [5,52,58] are contradictory and need to be supported with further investigations. In addition to this work, two mechanical surface treatments, deep rolling (DR) and ultrasonic nanocrystalline surface modification (UNSM), have recently been explored in relation to WDE performance of Ti-6Al-4V. For instance, Ma et al. [11] studied the water impingement erosion performance of deep rolled versus As-M Ti-6Al-4V. During their [11] work, several DR parameters were explored in order to have deep compressive residual stress while improving the surface and sub-surface properties. Using similar sample geometry (T-shaped flat), WDE parameters such as droplet sizes (464 and 603 µm) and impact speeds (250 and 350 m/s) were employed. Their [11] WDE results showed no improved WDE performance for the DR condition compared to the As-M condition at all tested conditions. This is in accord with the present work, where no enhanced WDE performance was observed for the LSP condition. More so, the present work and [11] revealed that no deterioration in the WDE performance was observed after LSP and DR processing, respectively. Gujba et al. [12] studied the effect of UNSM on the WDE performance of Ti-6Al-4V. T-shaped flat geometry was also tested while using impact speeds of 250, 275, 300, and 350 m/s and 464 µm droplet size. Their [12] WDE results showed that the UNSM condition had enhanced WDE performance at impact speeds of 250, 275, and 300 m/s compared with the As-M condition. At 350 m/s, the effectiveness of the UNSM process diminished. The enhanced performance was attributed to the increased microhardness and modified microstructure after UNSM processing. In this work, even with lower speeds of 150 and 200 m/s employed, no enhanced WDE performance could be observed. This is due to the fact that LSP had no significant effect on the microhardness and microstructure (grain refinement). Even though the amount of cold working is small in LSP, the observations in this work and [11] are in agreement with the explanations given in [5,51], which pointed out that a non-enhanced WDE performance may be observed due to duplication of the working hardening process. However, the current work and [11] are in disagreement with statements given in [58], who claimed that processes involving cold working might mitigate erosion damage. Interestingly, the work in [12] showed that specific processes involving cold working mitigates erosion damage at certain conditions which is in accord with the explanations given in [58]. Also, the same work in [12] proved that duplication of the working hardening process did not show any non-enhanced WDE performance, which is in disagreement with the explanation given in [5,52].

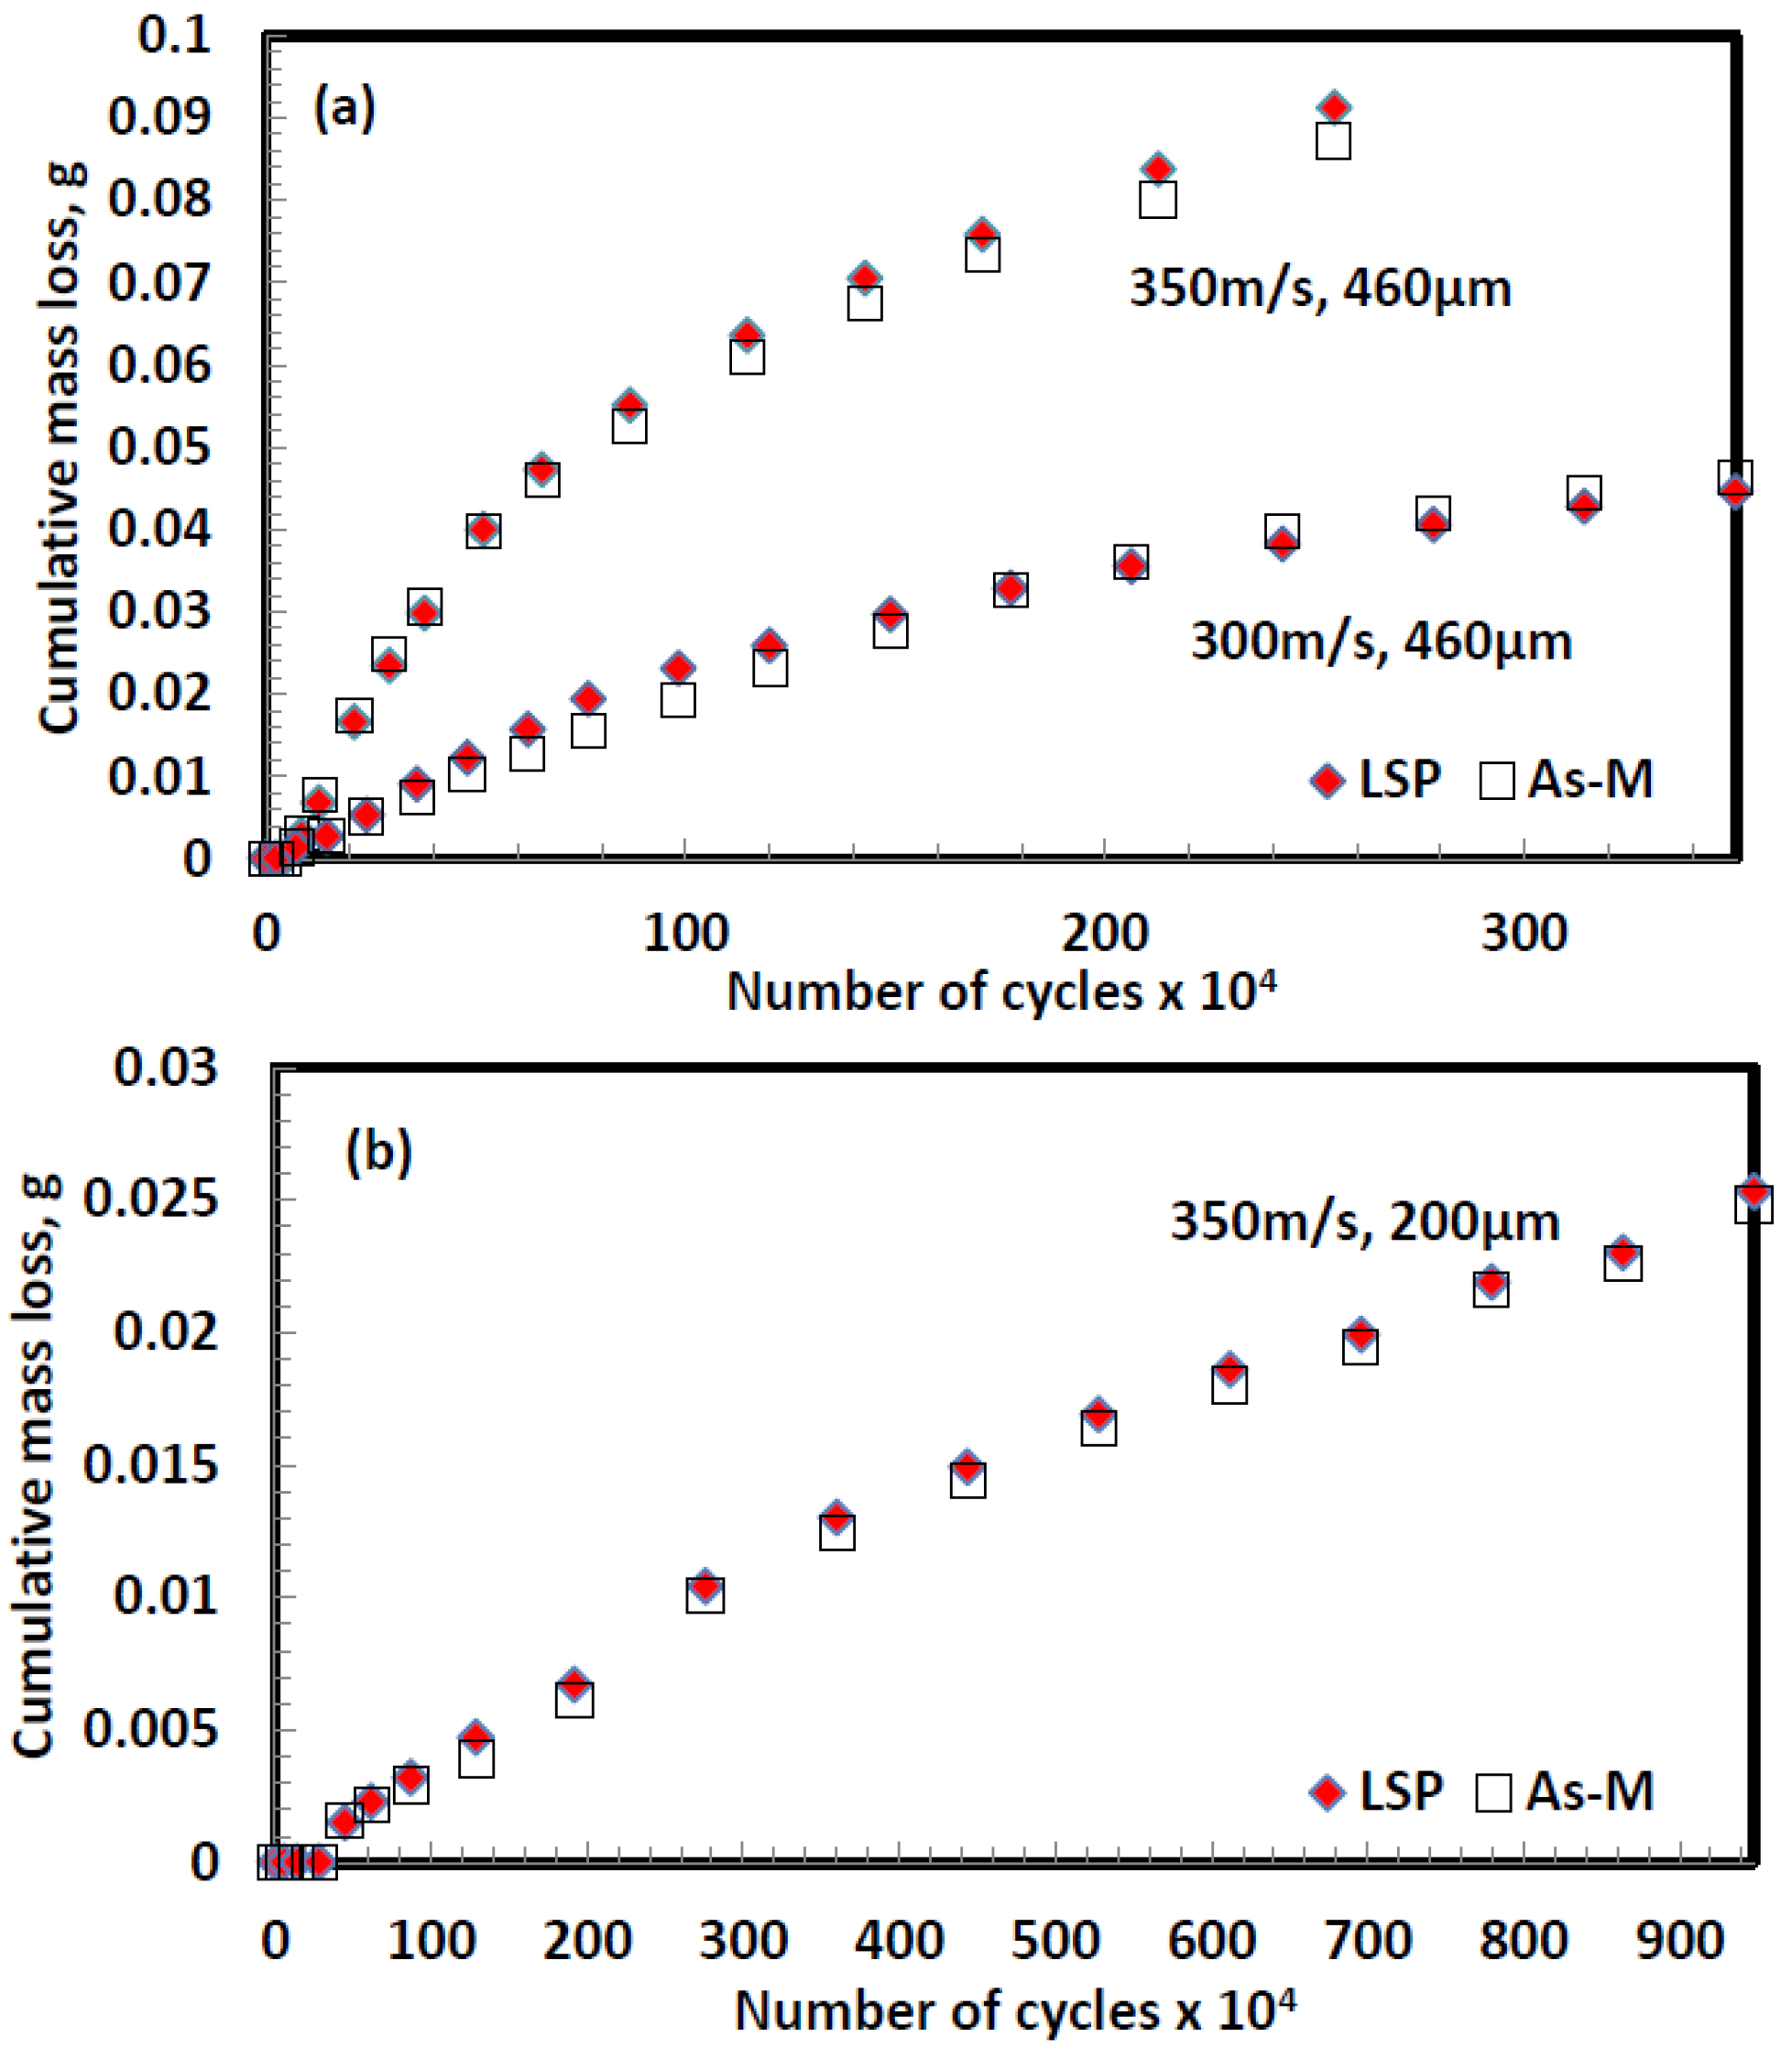
3.2.2. WDE Performance of LSP and As-M Airfoil Sample Conditions

Similar to the WDE studies on the flat T-shaped samples, airfoils in As-M and LSP conditions were investigated. However, the WDE tests were conducted perpendicular to the LSP treated surface as shown in Figure 5b. Figure 12a,b show the WDE curves for the As-M and LSP airfoil samples tested using 460 and 200 µm droplet sizes, respectively. Figure 12a shows the test carried out using 460 µm droplets at 350 and 300 m/s, and it can be seen that at 350 m/s, significant mass loss at all stages of the erosion was observed as compared with the test at 300 m/s. This observation is also shown in the ERinst curves in Figure 13a,b, respectively. Again, at 350 m/s (Figure 12a and Figure 13a), the WDE performance of the As-M and LSP conditions were very close. However, at 300 m/s (Figure 12a and Figure 13b), the LSP condition lost more material during early stages of the damage as compared to the As-M condition. At the advanced stages (>100 × 104 cycles), the LSP condition showed slightly reduced erosion rate compared to the As-M condition. This could be due to the influence of induced compressive residual stresses which is through the thickness of the airfoil. This is an interesting observation that has been reported in another work by Gujba et al. [12]. They [12] studied the influence of UNSM treatment on the WDE performance of treated and untreated airfoil Ti-6Al-4V. Similar to the LSP treatment on the airfoil geometry, the UNSM treatment was carried out on both sides, thus residual stresses are through the thickness as well. Using similar erosion conditions, i.e., 460 µm at 350 and 300 m/s, they [12] reported that at 350 m/s, no enhanced performance was observed. However, at 300 m/s the UNSM airfoil showed mildly enhanced WDE performance at the advanced WDE stages. This is the case in the present work (shown in Figure 13b) under the same eroding condition. Hence, the induced stresses might have resisted further crack propagations similar to the crack arrest in stress corrosion cracking (SCC) tests [13]. Based on the present work and [12], it can be said that both LSP and UNSM might be effective treatments especially when samples are treated away from the leading edge. It should be noted that this behaviour was observed only at 300 m/s which is a relatively low speed testing condition.
In order to further reduce the test severity, the droplet size was reduced to 200 µm while using 350 m/s. Figure 12b shows the WDE curve for testing at 350 m/s and 200 µm. Reducing the droplet size reduced the mass loss compared to testing at 350 m/s using 460 µm (Figure 12a). This is attributed to the decreased test severity when using smaller droplet sizes. Figure 13c shows the corresponding ERinst for Figure 12b where the erosion rate was reduced significantly. However, the LSP condition did not show enhanced WDE performance at all stages of the erosion. By reducing the droplet size (reducing test severity), one would expect behaviour similar to Figure 13b. This is not the case in Figure 13c where the WDE performance for both the As-M and LSP conditions was the same.

3.2.3. Effect of Sample Geometry and LSP on WDE Performance

The effect of the LSP process on WDE performance of treated and untreated T-shaped and airfoil samples is reported in this study. LSP induced compressive residual stresses but had no significant effect on the microstructure and microhardness.
For the T-shaped flat sample, the WDE test was conducted parallel to the peened surface (Figure 5a). Laser peening had no beneficial effect in enhancing WDE performance for this sample geometry. This is clearly demonstrated in Figure 10 where both As-M and LSP conditions showed similar WDE performance. In other words, both conditions showed similar erosion initiation and ERmax at all tested speeds as shown in Figure 11a,b. This was attributed to the unchanged microstructure and lack of appreciable increase in microhardness. Even though LSP induced compressive residual stresses which are beneficial in retarding crack initiation and propagation, this benefit could not be realized for the T-shaped flat samples. This explanation is in accord with the findings in [12]. In their [12] WDE study, they mentioned that the benefit of compressive residual stresses could not be guaranteed for the T-shaped sample. This is because the modified microstructure and enhanced microhardness seem to be the dominating factors in erosion resistance rather than the induced compressive residual stresses. Comparing [12] with this work, the argument can be further strengthened that compressive residual stresses are not beneficial for this T-shaped flat sample geometry. This is due to the fact that LSP only induced compressive residual stresses with minimum influence on the microstructure and microhardness. Based on this study and [12], it can be inferred that for enhanced WDE performance on the flat samples, hardening effects must be realized.
For the airfoils where the WDE testing was performed perpendicular to the treated surface (Figure 5b), the LSP treatment had limited beneficial effect in mitigating the erosion damage during the advanced erosion stage at a relatively low speed (300 m/s). At 350 m/s, where the test condition is severe, the induced compressive residual stresses showed no beneficial effect on the airfoil geometry. Comparing with the T-shaped sample geometry, the WDE performance of the treated airfoil condition at a relatively low speed (300 m/s) could have been influenced by the induced compressive residual stresses via LSP. This is because the induced compressive residual stresses are present through the airfoil thickness. Hence, erosion damage is improved to some degree by resisting further crack propagation, especially at advanced stages. This observation is in accord with the study in [12].

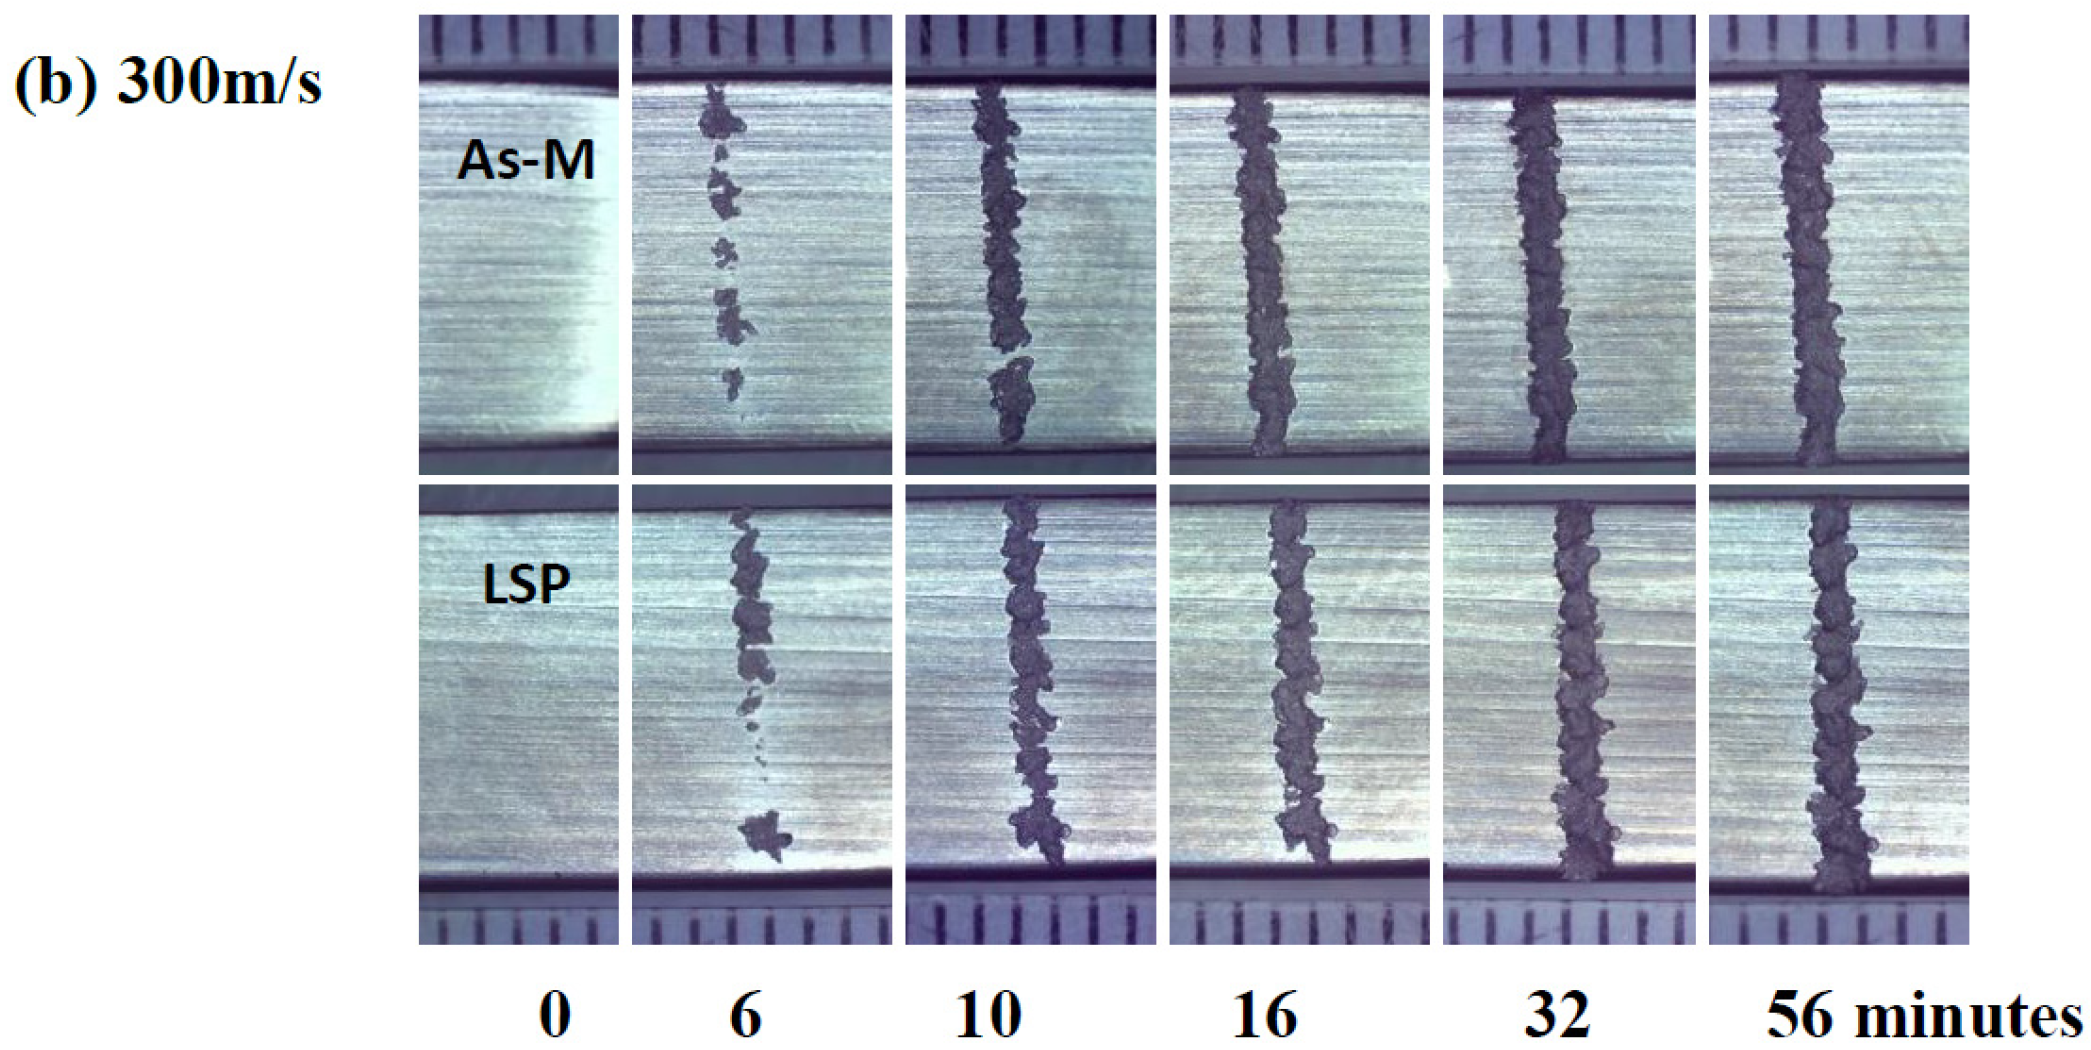
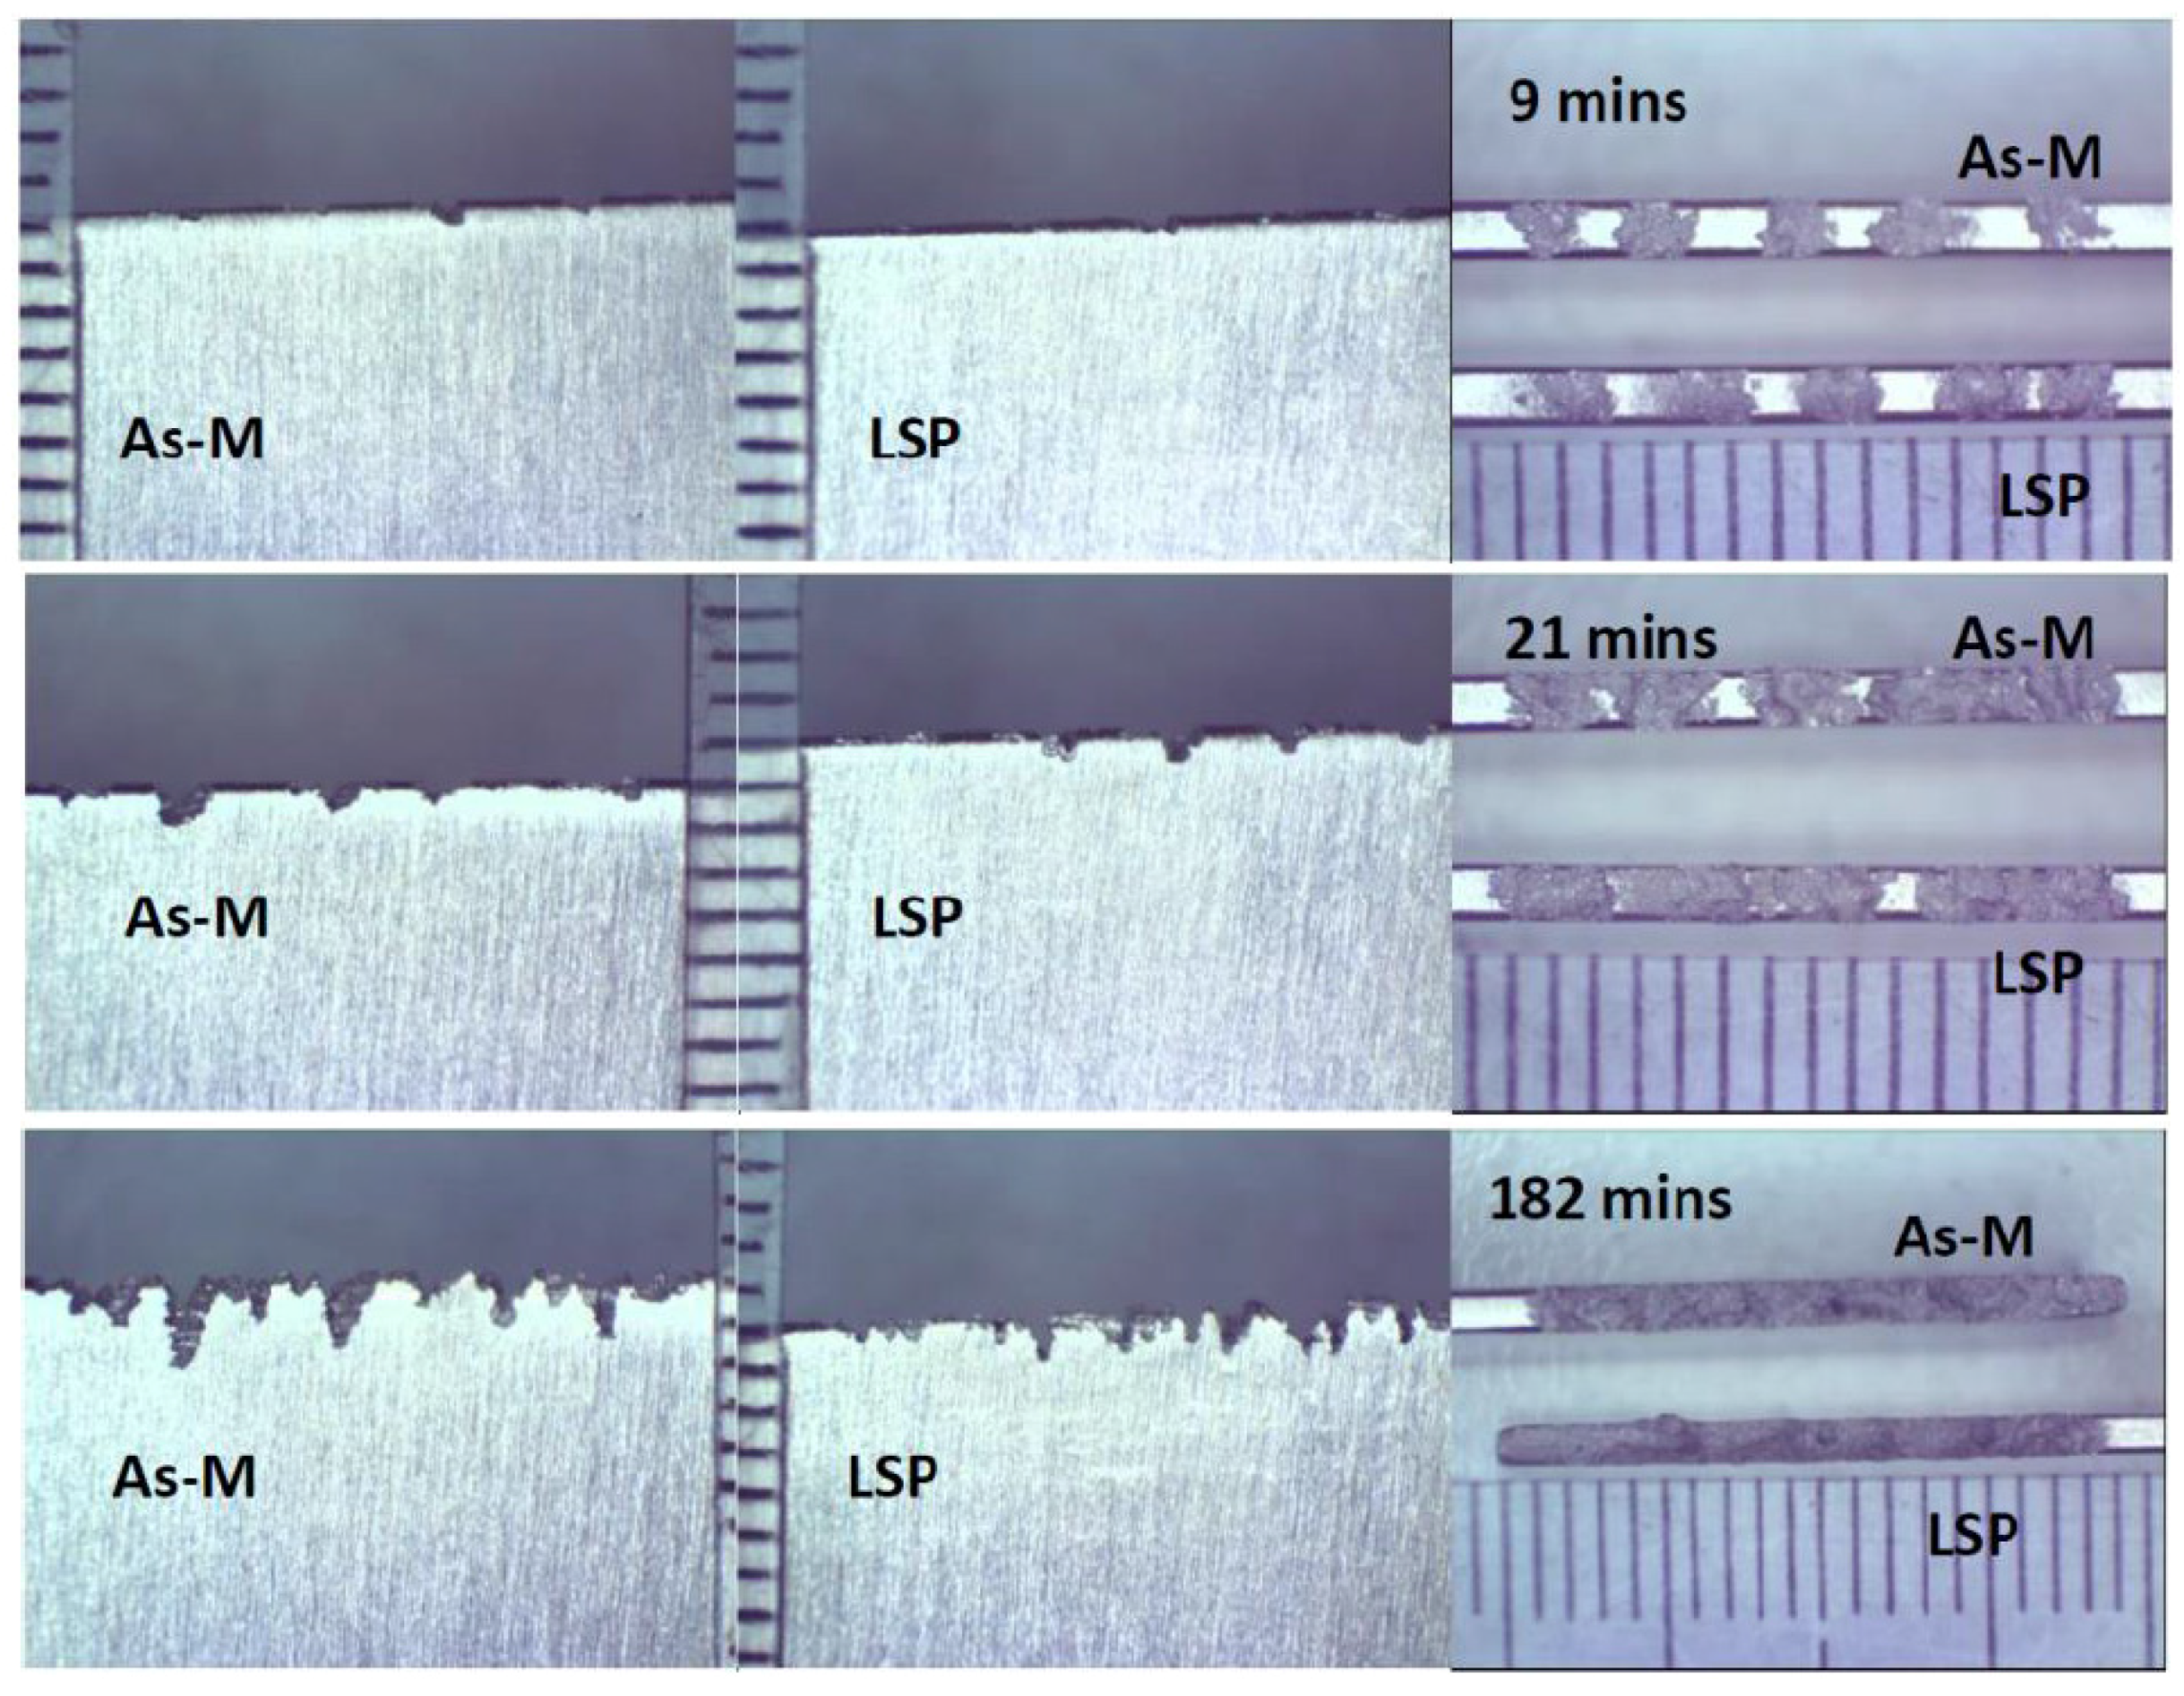
3.3. WDE Damage Evolution

During the erosion tests, optical macrographs were taken after every interval. This is to observe the erosion initiation and progression on the As-M and LSP conditions. Figure 14a,b show the macrographs taken during tests at 250 and 300 m/s which correspond to WDE curves in Figure 10. The erosion initiation started with the emergence of the erosion trace line. Figure 14a shows this initiation process on the As-M condition after 6 min of exposure at 250 m/s. This is the incubation stage where mass loss is negligible. Compared with the LSP condition, a similar erosion trace line was seen after the same 6 min exposure. After 10 min of exposure (Figure 14a), both conditions showed formation of small isolated pits along the trace line, thus indicating the early stage of the erosion damage. Here, the As-M and LSP conditions showed mass losses of 0.0003 and 0.0002 g, respectively. With additional impacts (after 16 min), large isolated pits were formed and gradual pit growth was observed in the As-M and LSP conditions. At this point, mass losses of 0.012 and 0.013 g were recorded for the As-M and LSP condition, respectively. After 56 min, complete craters were formed and a mass loss of 0.084 g was observed for both As-M and LSP conditions. Similarly, by increasing the impact speed from 250 to 300 m/s (Figure 14b), quicker erosion initiation and progression were observed. For instance, after 6 min of exposure, formation of pits and gradual pit growth were observed in both As-M and LSP conditions compared to the pit growth after 10 min at 250 m/s (Figure 14a). ERmax was reached after 16 min of exposure (11.52 × 10⁵ impingements) after which a decrease in the rate was observed for both conditions (Figure 10b).
From the optical macrographs shown in Figure 14, it can be said that decreasing the impact speed delays the erosion initiation and progression. The early erosion initiation and progression at high impact speeds are due to the significant impact stresses. This is attributed to the high impact pressure and the radial outflows (lateral jetting) of the liquid droplets. It is worth noting that with increased exposure time/droplet impacts, both the depth and the width of the craters are increased [11]. At 250 m/s, crater width of less than 1 mm and greater than 1 mm were observed on both As-M and LSP conditions after 10 and 76 min, respectively. This observation is also true when comparing the crater width/depth for different speeds at the same exposure. For instance, comparing the crater widths after 16 min of exposure at 250 and 300 m/s, it can be observed that crater width of less than 1 mm and greater than 1 mm were observed at 250 and 300 m/s, respectively. This is also the case when comparing the As-M and LSP conditions. This is due to the continuous droplet impacts and the radial liquid outflows. At all exposure times shown in Figure 14a,b, similar erosion evolution and progression were observed for the As-M and LSP conditions. This further indicates that LSP had no benefit in enhancing the WDE performance for this sample geometry. This can be attributed to the unchanged microstructure and the lack of appreciable increase in microhardness after peening.
Similar to Figure 14, Figure 15 shows the erosion evolution and progression for the LSP and As-M airfoil samples at 350 m/s using a 460 µm droplet size, which correspond to the WDE curve in Figure 12a. Due to the sample geometry, images were taken at two different orientations. From Figure 15, both As-M and LSP conditions showed similar erosion initiation and progression. Isolated pits/craters were observed after 9 min of exposure due to the shower head nozzle employed. Here, mass losses of 0.0068 and 0.0077 g were observed on the LSP and As-M conditions, respectively. After 21 min of exposure, the craters merged into one another due to the continuous liquid impacts and lateral jetting, causing significant loss of material. At this stage, the formed craters became deeper and cumulative mass losses of 0.0235 and 0.0249 g were observed for the LSP and As-M conditions, respectively. With additional exposure (after 182 min), the craters further deepened and widened due to the accumulated liquid impacts and the radial outflows. Mass loss of 0.0913 and 0.0873 g were recorded for the LSP and As-M conditions, respectively. Both As-M and LSP conditions showed crater depth of <1 mm and ~2 mm after 21 and 182 min, respectively. Based on Figure 15, the WDE performance of As-M and LSP airfoils is the same. This is also the case for the test at 350 m/s using a 200 µm droplet size. The effect of LSP and the associated compressive residual stresses had no benefit in mitigating erosion at this speed (350 m/s).

3.4. WDE and Fatigue Damage

Despite researchers [11,20,21] associating WDE to fatigue-like damage due to continuous liquid impingements in a cyclic fashion, the question still remains; is a fatigue mechanism dominating in WDE? Also, the perception that compressive residual stresses enhance fatigue life is becoming a fact. If fatigue is dominating in WDE, then processes that induce deep and large compressive residual stresses such as LSP should mitigate erosion damage. However, this does not seem to be the case for enhancing water droplet erosion resistance. Even though fatigue-like features such as striations during WDE damage have been observed [22], the likelihood that a fatigue-like mechanism is dominating in WDE is unlikely. If this is the case, the level of residual stresses reached via LSP should have been sufficient to mitigate erosion damage. It has been mentioned that compressive residual stresses through the thickness of the airfoil samples could have arrested further crack propagations. These are normal cracks which could be observed in other damages such as stress corrosion cracking (SCC) not only limited to WDE. It is worth noting that only the effect of continuous liquid impacts is usually considered when ascribing WDE to fatigue while ignoring the effect of the continuous liquid lateral jetting after the impacts. The continuous lateral jetting, which is not the case in real fatigue damage, could be more damaging than liquid impacts especially at high impact speeds. It has been reported that an increase in impact speed has a significant effect on the lateral jetting and the resulting damage [22]. Hence, WDE damage should be viewed and understood as a synergy of both continuous liquid impacts and the lateral jetting.

4. Conclusions

This work studies the effect of LSP on the WDE performance of Ti-6Al-4V for the first time. The work explores the influence of impact speed on two sample geometries (T-shaped flat and airfoil). The following conclusions can be drawn:
  • LSP treatment using 2 and 3 pulses per unit area induces significant levels of compressive residual stress. However, for the treatment approach and conditions used in this work, LSP shows little or no effect on the Ti-6Al-4V microstructure and microhardness.
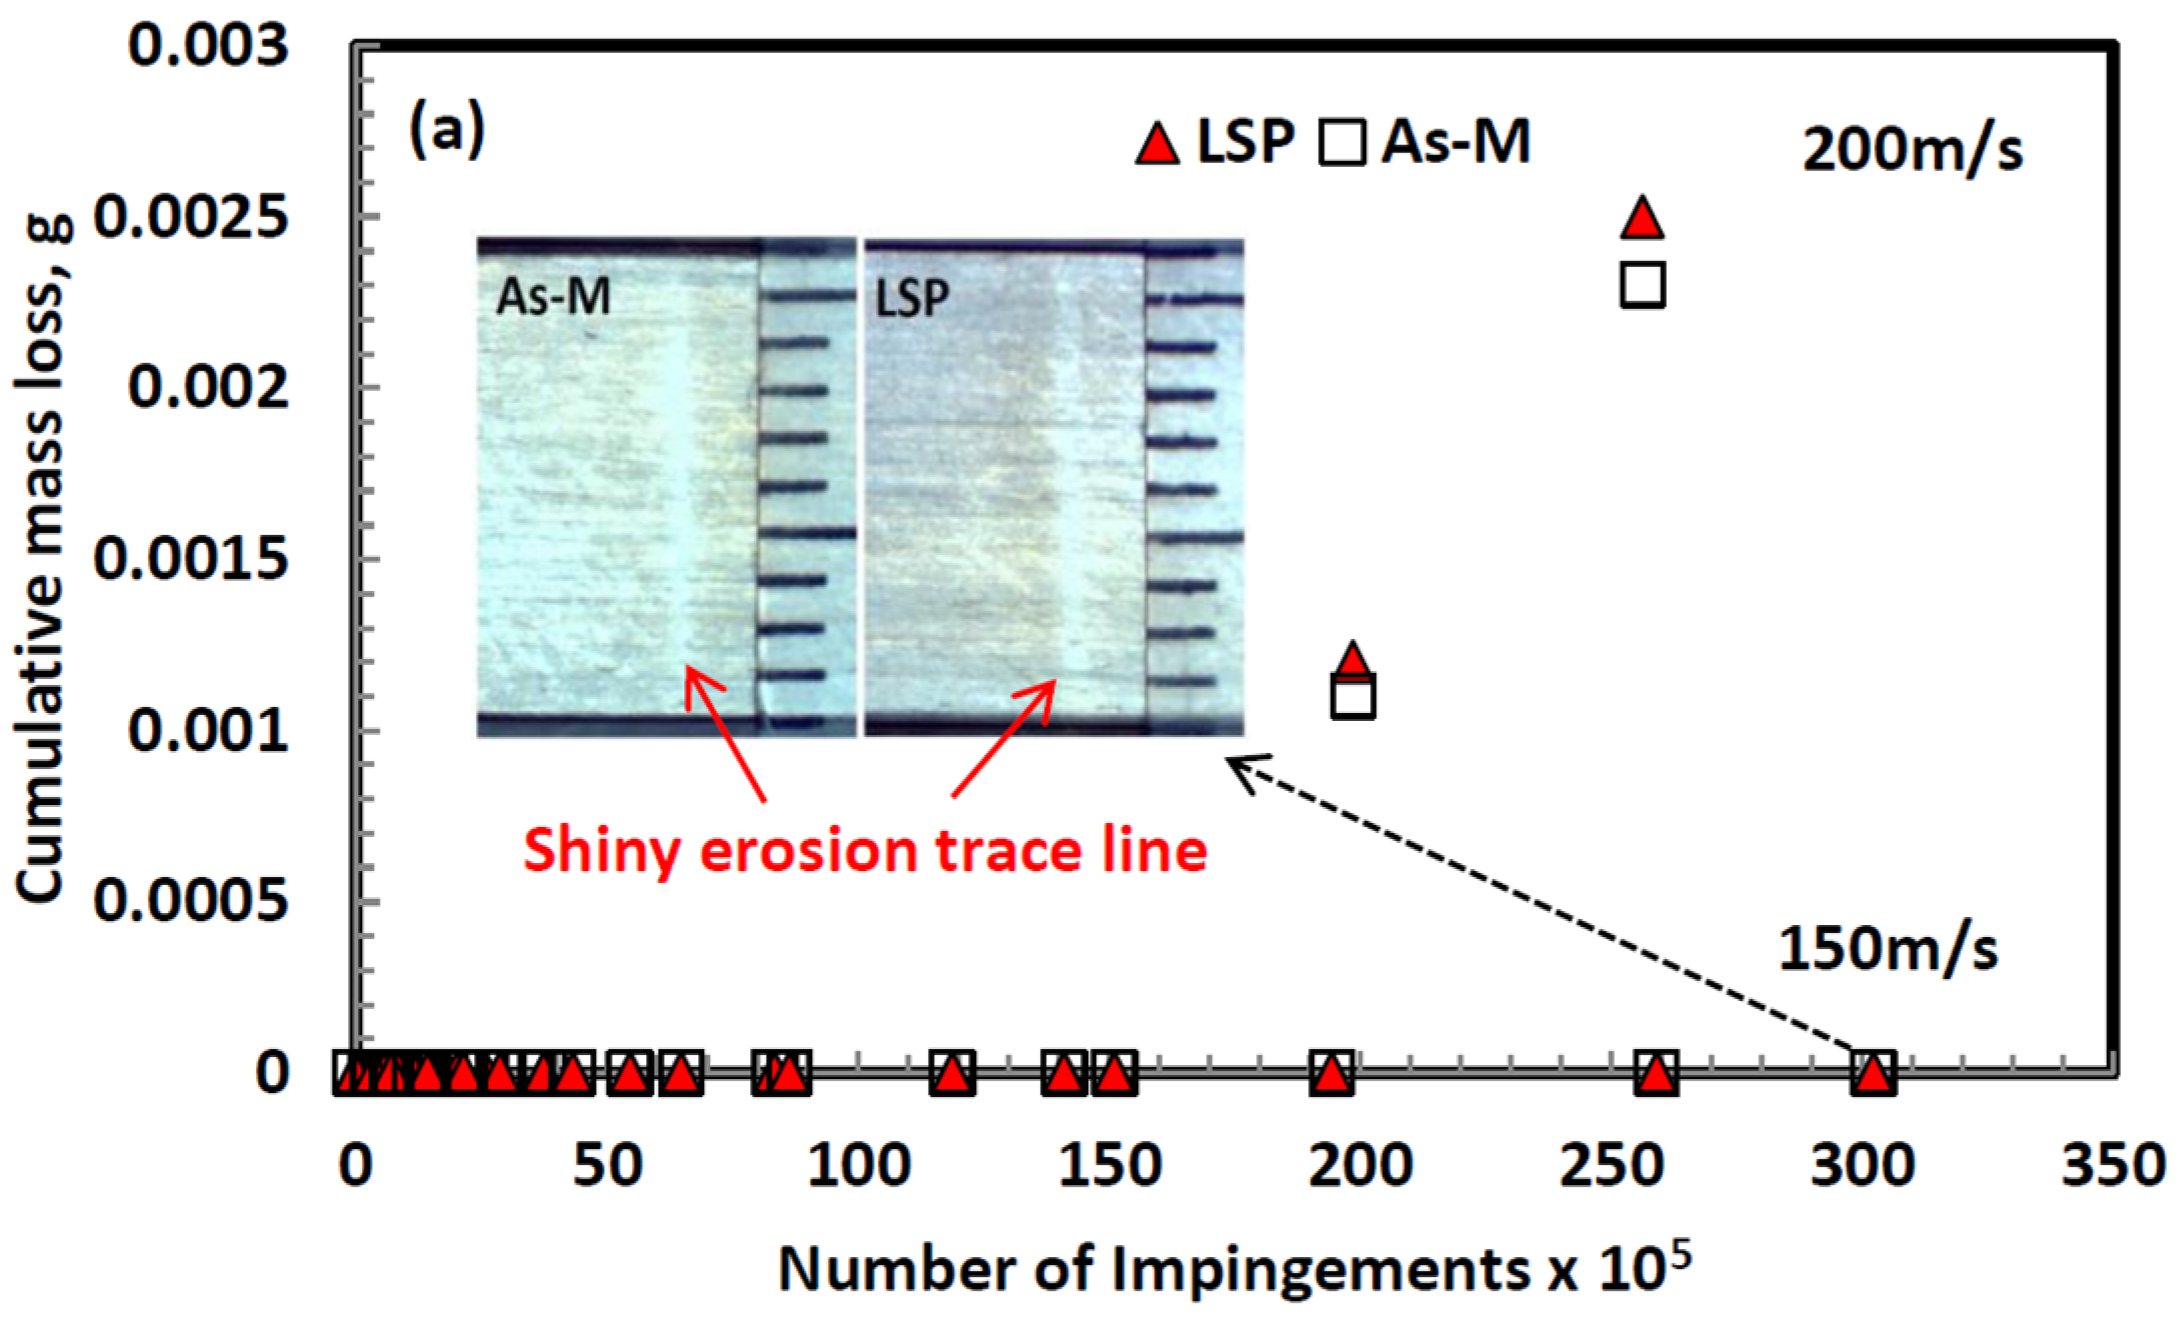
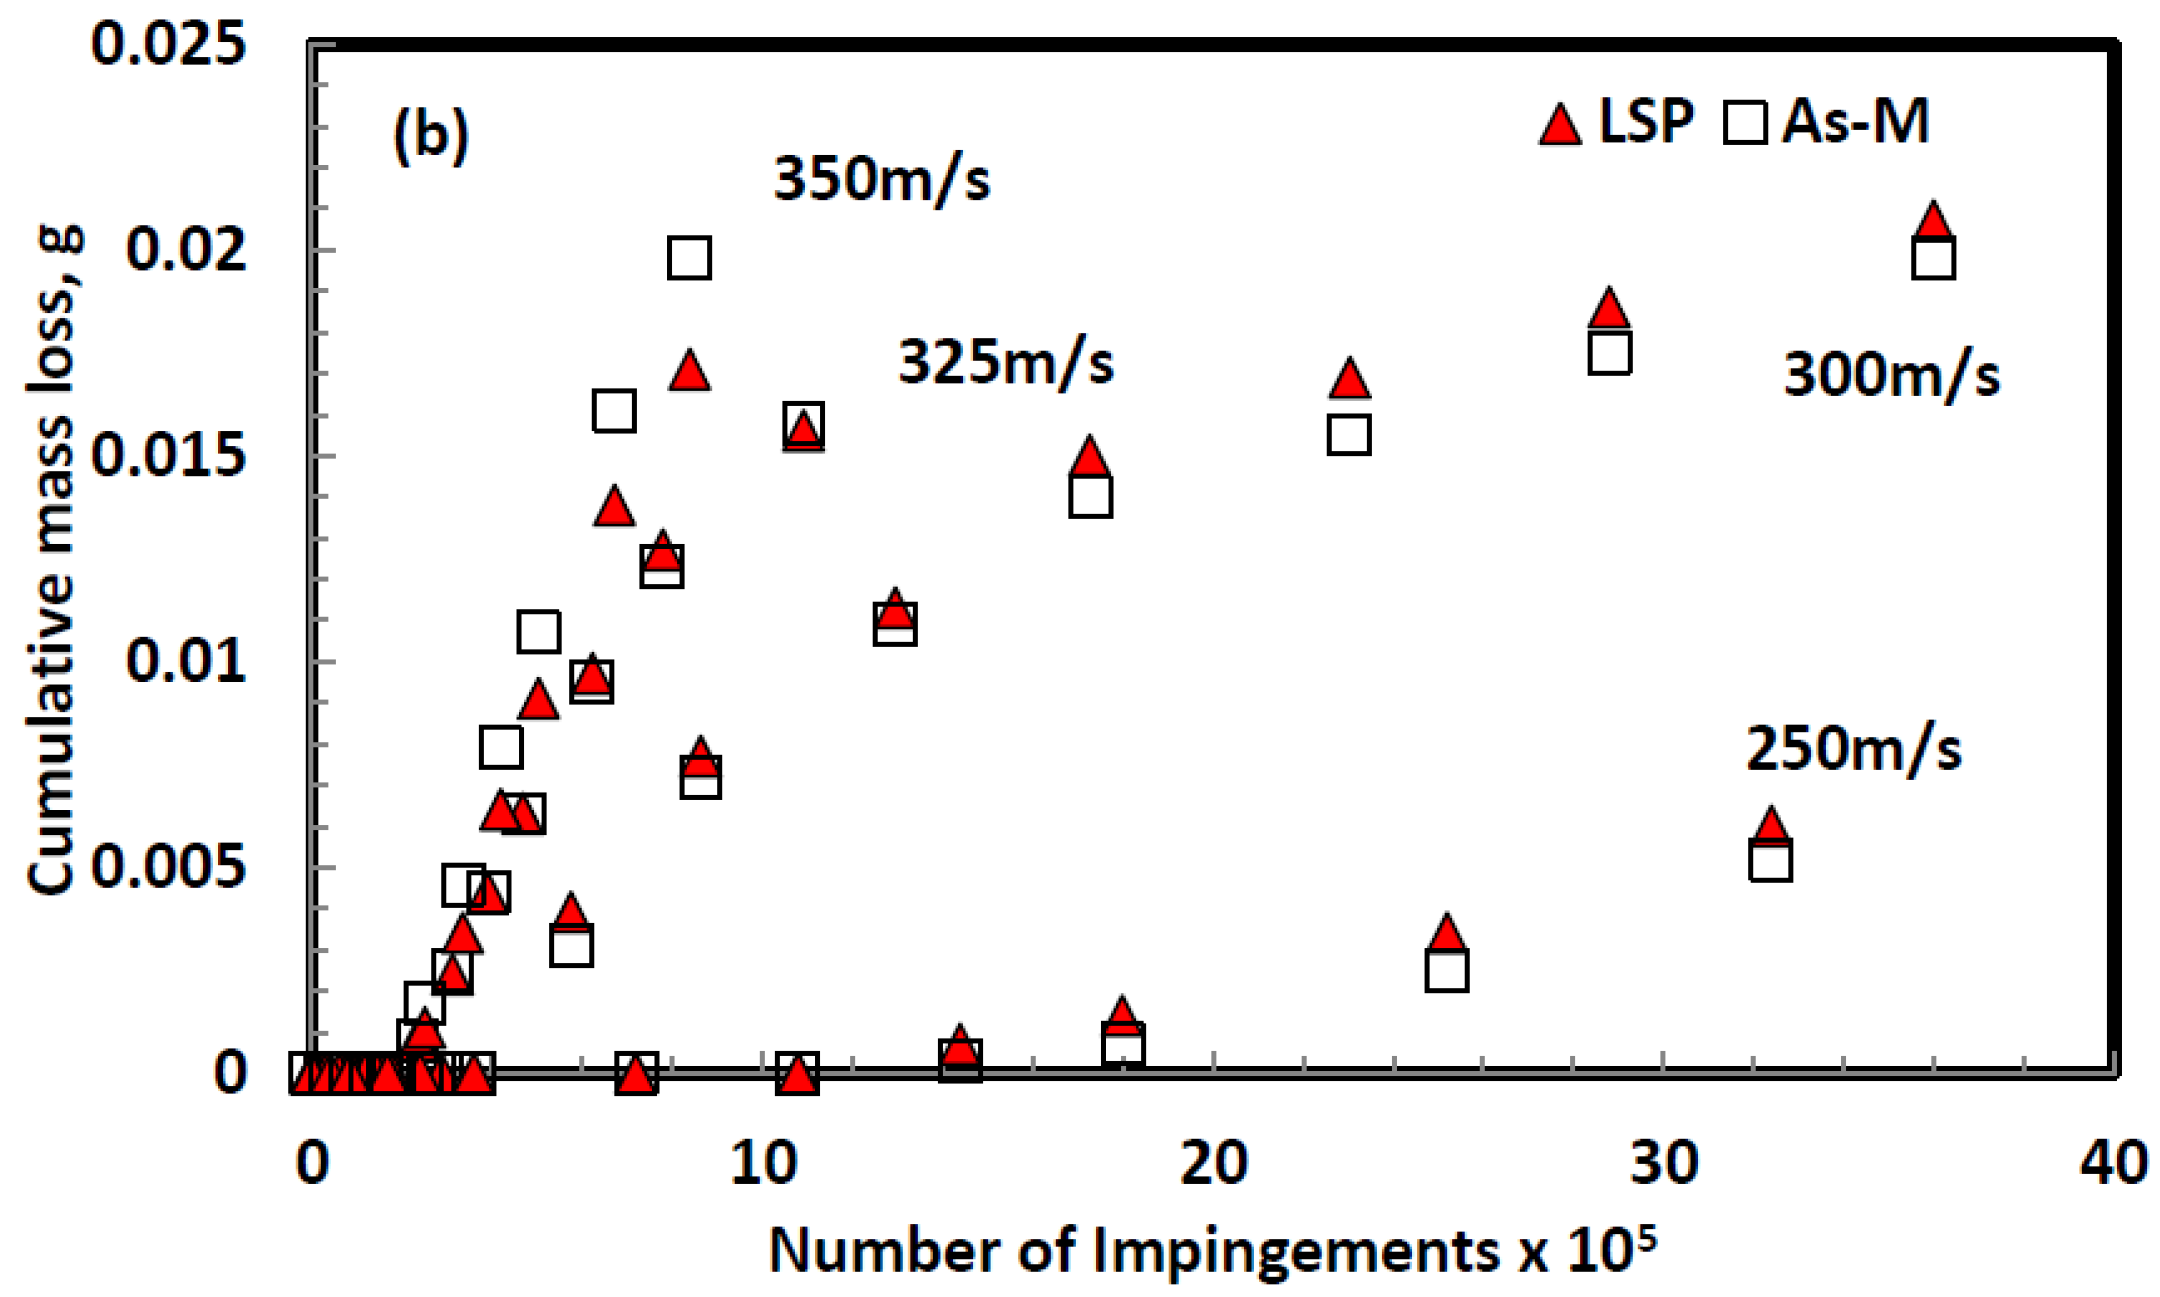
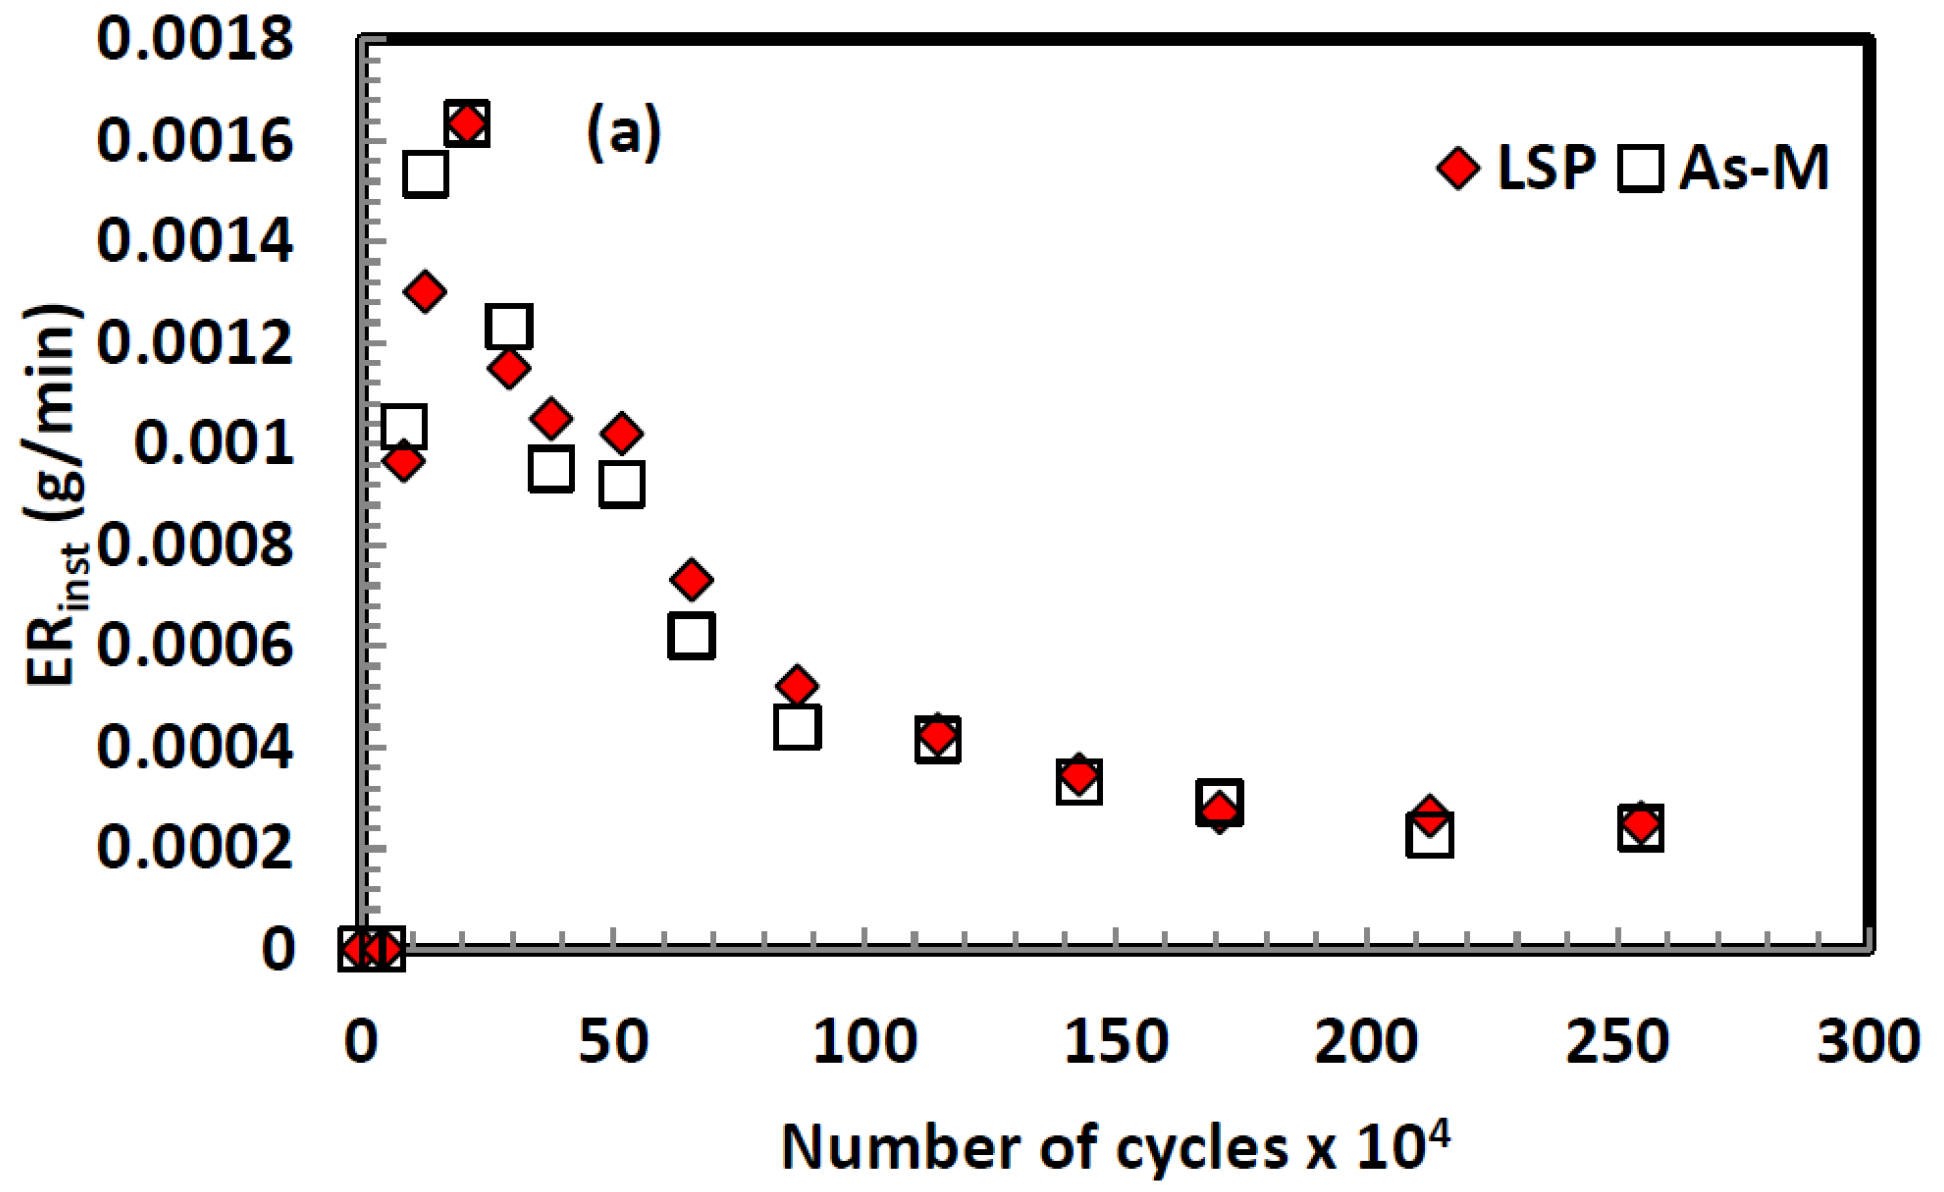
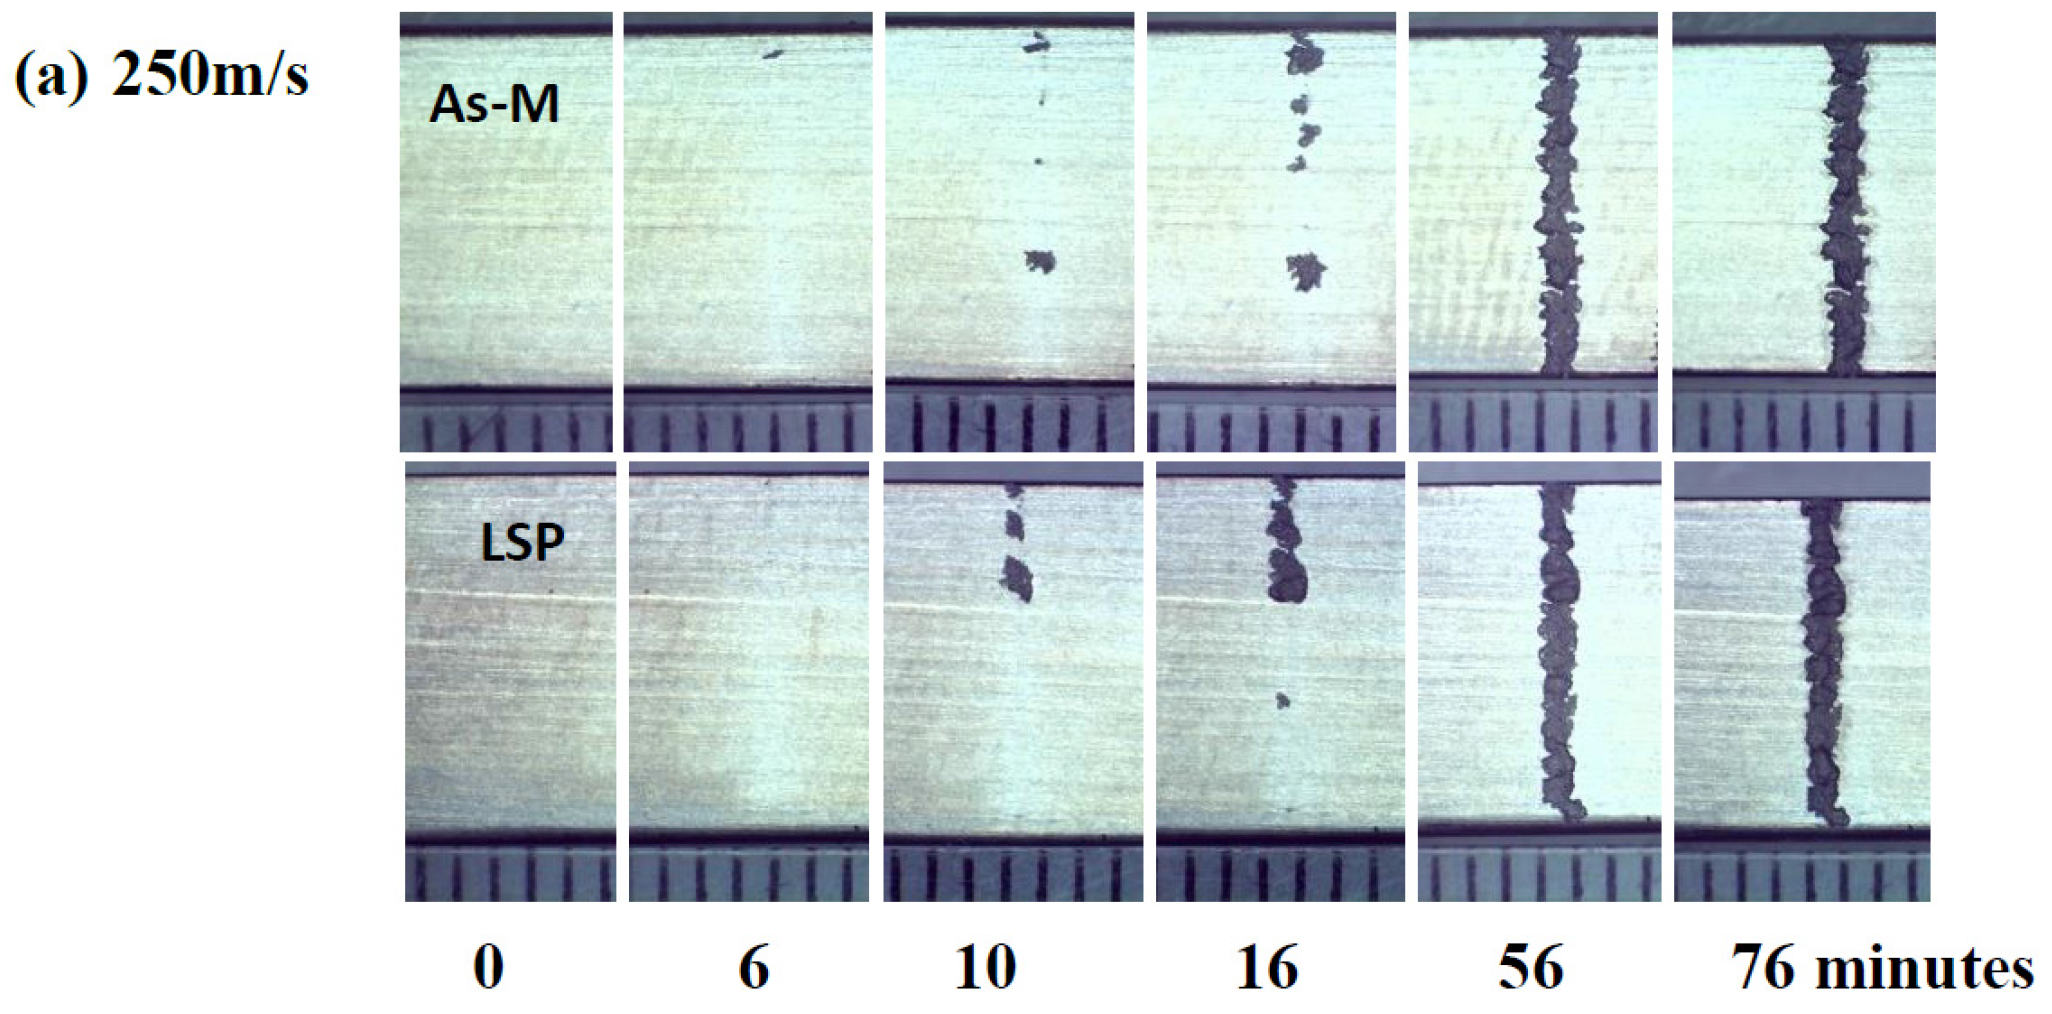
  • WDE results show similar WDE performance for the T-shaped flat LSP and As-M conditions at all tested speeds (150 to 350 m/s). At 150 m/s, both the LSP and As-M conditions show no erosion damage after 840 min (30 million impingements).
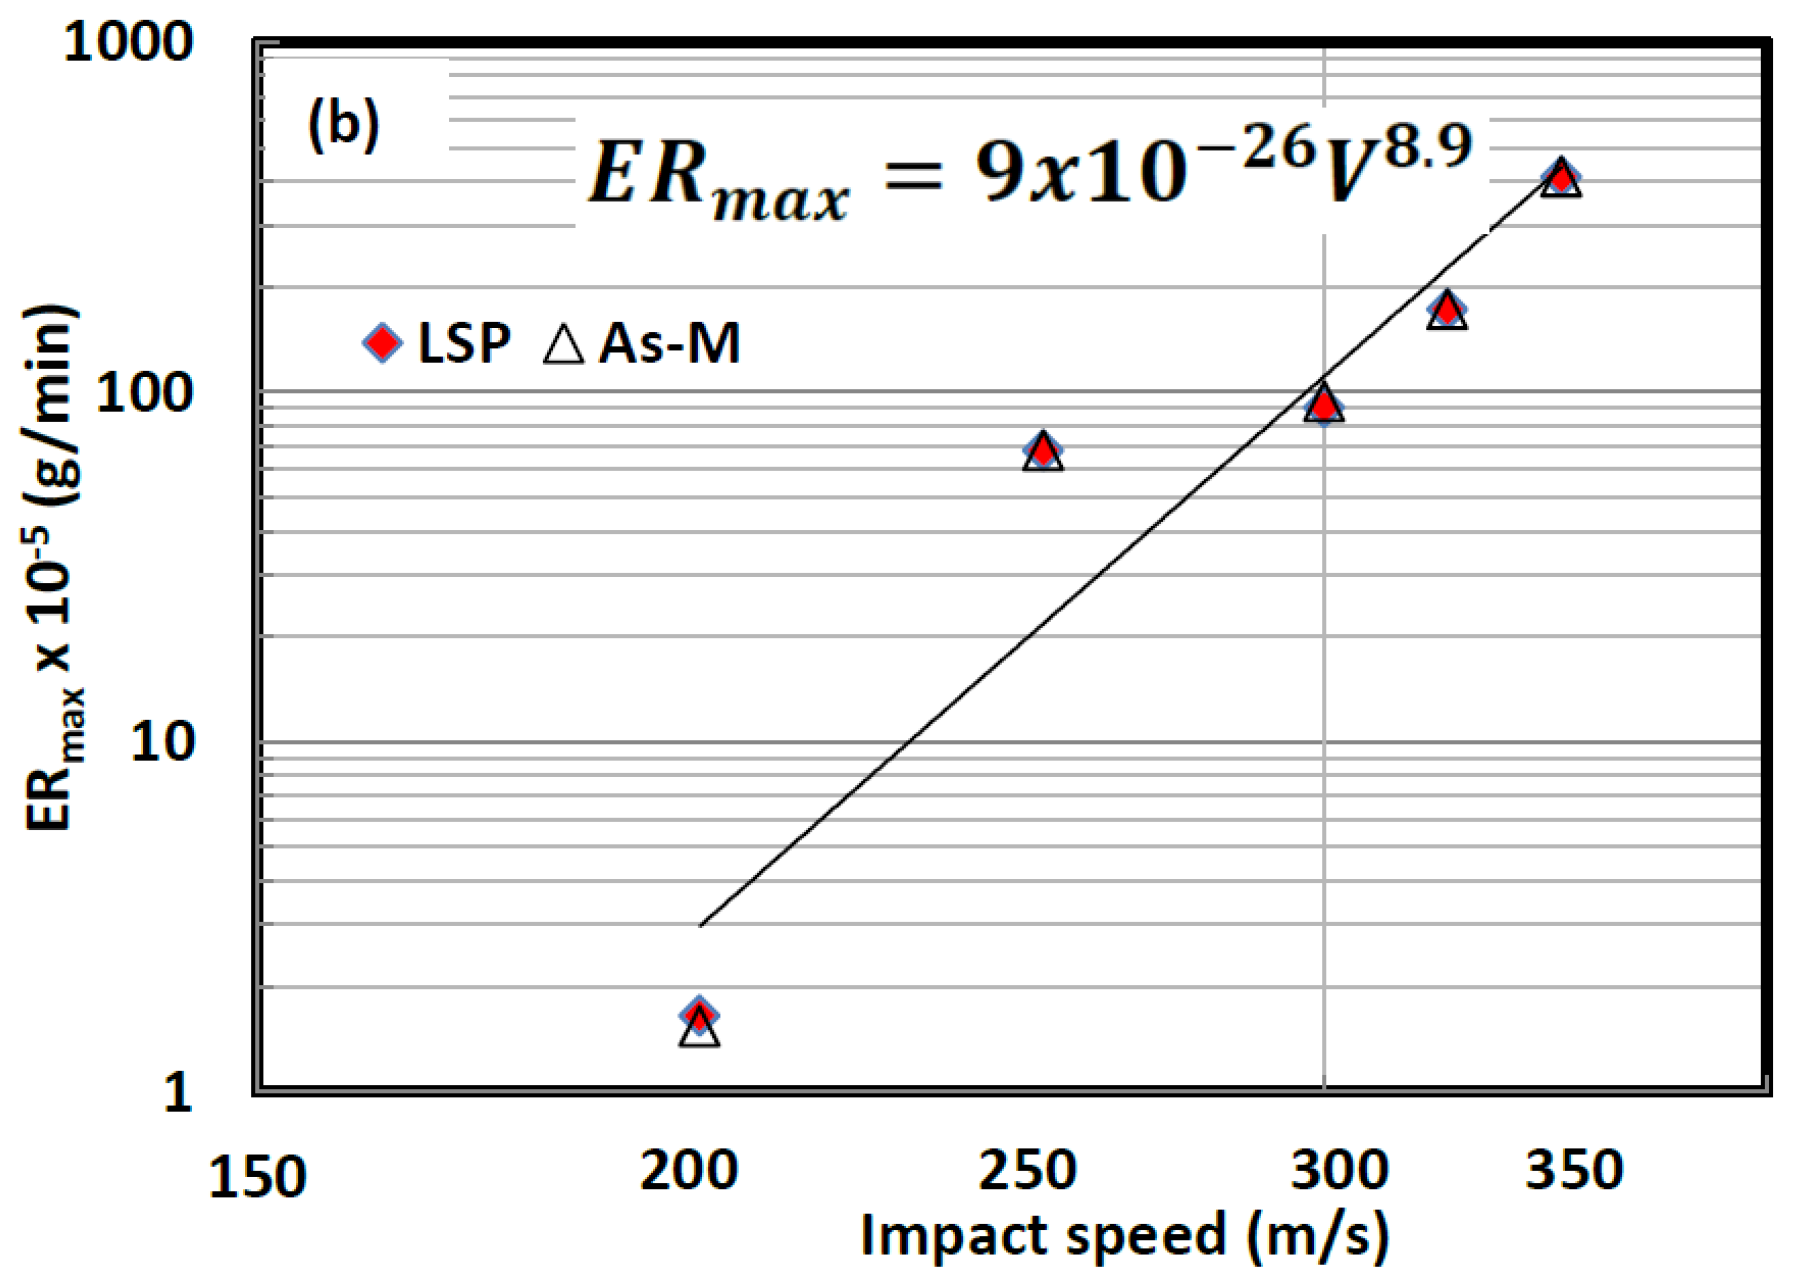
  • Both LSP and As-M conditions show similar ERmax and a speed exponent value of 8.9. Hence, for the T-shaped flat geometry, the LSP treatment shows no beneficial effect in enhancing the WDE performance.
  • Despite LSP inducing compressive residual stresses, the residual stresses reached in this work do not improve WDE performance. Since LSP is proven to improve fatigue behaviour of Ti-6Al-4V alloy, this indicates that the fatigue-like mechanism is not dominating in WDE.
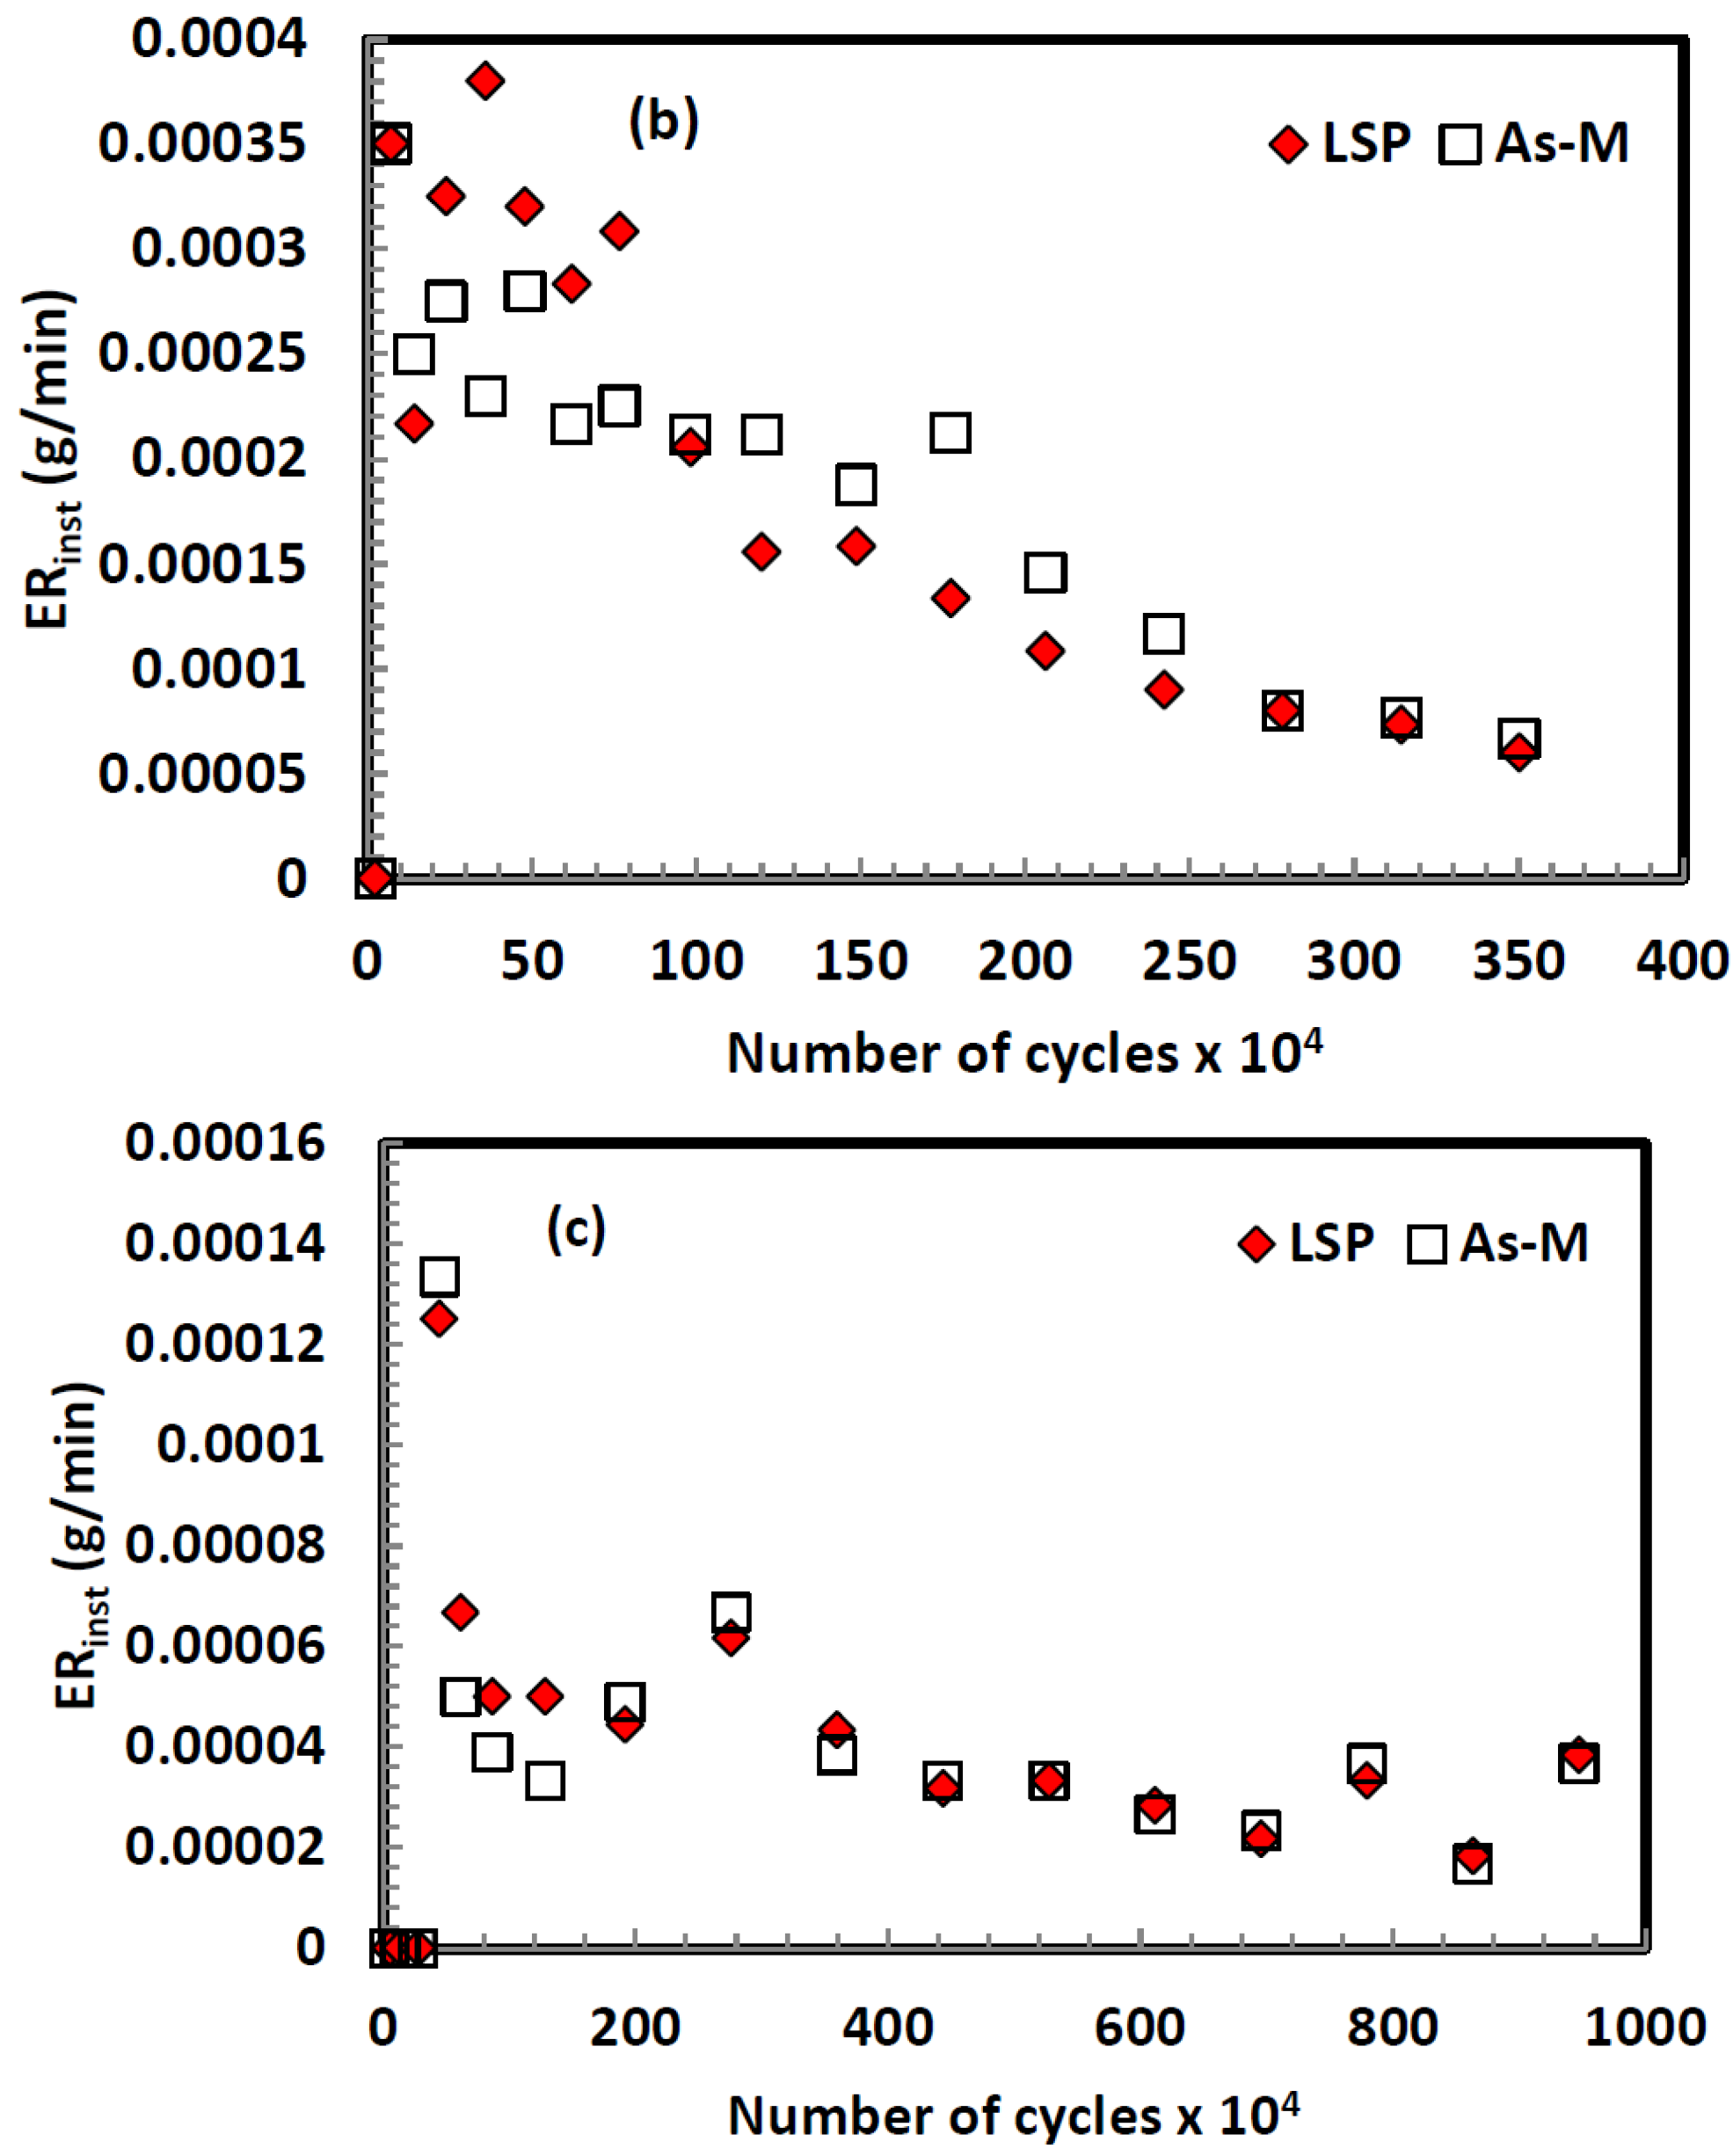
  • For the airfoil geometry, WDE curves show similar WDE performances for LSP and As-M conditions at 350 m/s. At 300 m/s, LSP shows little improvement in WDE resistance at the advanced erosion stage. The compressive residual stress through the sample thickness influences this behaviour.
  • Synergy between surface hardening, microstructural refinement, and compressive residual stresses is necessary for significant improvement in water droplet impingement erosion resistance.

Acknowledgments

The authors gratefully acknowledge the financial support provided by Concordia University, Montreal, Canada (Frederick Lowy Scholars Fellowship Award, the Graduate Student Support Program (GSSP), and the Natural Sciences and Engineering Research Council of Canada (NSERC).

Author Contributions

Abdullahi K. Gujba designed and performed the experiments. Abdullahi K. Gujba also analyzed the data and wrote the initial draft of the manuscript; Lloyd Hackel provided the laser shock peening (LSP) experiments at Metal Improvement Company, Livermore, CA, USA. Lloyd Hackel contributed to understanding the LSP process and its effect on materials behavior. He also provided constructive comments and suggestions during the manuscript writing; Mamoun Medraj supervised Abdullahi K. Gujba and his lab provided all the experimental works related to sample characterizations and water droplet erosion tests. Mamoun Medraj directed the project and helped in the interpretation of the results. Also, Mamoun Medraj provided constructive comments, corrections, and suggestions during the manuscript writing.

Conflicts of Interest

The authors declare no conflict of interest.

References

  1. Meher-Homji, C.B.; Mee, T.R. Gas turbine power augmentation by fogging of inlet air. In Proceedings of the ASME International 28th Turbomachinery Symposium, Houston, TX, USA, 4 September 1999; pp. 93–114.
  2. Giampaolo, T. The Gas Turbine Handbook: Principles and Practice, 3rd ed.; Fairmont Press: New York, NY, USA, 2006. [Google Scholar]
  3. Khan, J.R. Fog Cooling, Wet Compression and Droplet Dynamics in Gas Turbine Compressors. Ph.D. Thesis, University of New Orleans, New Orleans, LA, USA, 2009. [Google Scholar]
  4. ASTM G40-15: Standard Terminology Relating to Wear and Erosion; ASTM International: West Conshohocken, PA, USA, 2015.
  5. Hammitt, F.G.; Heymann, F.J. Liquid-Erosion Failures, Failure Analysis and Prevention. In ASM Handbook; ASM International: Materials Park, OH, USA, 1986; Volume 11, pp. 163–171. [Google Scholar]
  6. Lesser, M.B.; Field, J.E. The impact of compressible liquids. Annu. Rev. Fluid Mech. 1983, 15, 97–122. [Google Scholar] [CrossRef]
  7. Mahdipoor, M.S.; Tarasi, F.; Moreau, C.; Dolatabadi, A.; Medraj, M. HVOF sprayed coatings of nano-agglomerated tungsten-carbide/cobalt powders for water droplet erosion application. Wear 2015, 330–331, 338–347. [Google Scholar] [CrossRef]
  8. Mann, B.S.; Arya, V. An experimental study to corelate water jet impingement erosion resistance and properties of metallic materials and coatings. Wear 2002, 253, 650–661. [Google Scholar] [CrossRef]
  9. Mann, B.S. Water droplet and cavitation erosion behavior of laser treated stainless steel and titanium alloy: Their similarities. J. Mater. Eng. Perform. 2013, 22, 3647–3656. [Google Scholar] [CrossRef]
  10. Gerdes, C.; Karimi, A.; Bieler, H. Water droplet erosion and microstructure of laser nitrided Ti-6A1-4V. Wear 1995, 186–187, 368–374. [Google Scholar] [CrossRef]
  11. Ma, D.; Mostafa, A.; Kevorkov, D.; Jedrzejowski, P.; Pugh, M.; Medraj, M. Water impingement erosion of deep-rolled Ti64. Metals 2015, 5, 1462–1486. [Google Scholar] [CrossRef]
  12. Gujba, A.K.; Ren, Z.; Dong, Y.; Ye, C.; Medraj, M. Effect of ultrasonic nanocrystalline surface modification on the water droplet erosion performance of Ti-6Al-4V. Surf. Coat. Technol. 2016, 307, 157–170. [Google Scholar] [CrossRef]
  13. Gujba, A.K.; Medraj, M. Laser peening process and its impact on materials properties in comparison with shot peening and ultrasonic impact peening. Materials 2014, 7, 7925–7974. [Google Scholar] [CrossRef]
  14. Zhang, X.C.; Zhang, Y.K.; Lu, J.Z.; Xuan, F.Z.; Wang, Z.D.; Tu, S.T. Improvement of fatigue life of Ti-6Al-4V alloy by laser shock peening. Mater. Sci. Eng. A 2010, 527, 3411–3415. [Google Scholar] [CrossRef]
  15. Ruschau, J.; John, R.; Thompson, S.R.; Nicholas, T. Fatigue crack nucleation and growth rate behavior of laser shock peened titanium. Int. J. Fatigue 1999, 21, 199–209. [Google Scholar] [CrossRef]
  16. Altenberger, I.; Nalla, R.K.; Sano, Y.; Wagner, L.; Ritchie, R.O. On the effect of deep-rolling and laser-peening on the stress-controlled low- and high-cycle fatigue behavior of Ti-6Al-4V at elevated temperatures up to 550 °C. Int. J. Fatigue 2012, 44, 292–302. [Google Scholar] [CrossRef]
  17. Liu, K.K.; Hill, M.R. The effects of laser peening and shot peening on fretting fatigue in Ti-6Al-4V coupons. Tribol. Int. 2009, 42, 1250–1262. [Google Scholar] [CrossRef]
  18. Srinivasan, S.; Garcia, D.B.; Gean, M.C.; Murthy, H.; Farris, T.N. Fretting fatigue of laser shock peened Ti-6Al-4V. Tribol. Int. 2009, 42, 1324–1329. [Google Scholar] [CrossRef]
  19. Gao, Y.K. Improvement of fatigue property in 7050–T7451 aluminum alloy by laser peening and shot peening. Mater. Sci. Eng. A 2011, 528, 3823–3828. [Google Scholar] [CrossRef]
  20. Kamkar, N. Water Droplet Erosion Mechanisms of Ti-6Al-4V. Ph.D. Thesis, École de Technologie Supérieure (ÉTS), Montreal, QC, Canada, 2014. [Google Scholar]
  21. Hattori, S.; Takinami, M. Comparison of cavitation erosion rate with liquid impingement erosion rate. Wear 2010, 269, 310–316. [Google Scholar] [CrossRef]
  22. Gujba, A.K.; Hackel, L.; Kevorkov, D.; Medraj, M. Water droplet erosion behaviour of Ti-6Al-4V and mechanisms of material removal at the early and advanced stages. Wear 2016, 358–359, 109–122. [Google Scholar] [CrossRef]
  23. ASM Aerospace Specification Metals: Titanium Ti-6Al-4V (Grade 5), ASM Material Data Sheet. Available online: www.aerospacemetals.com (accessed on 20 August 2016).
  24. Zhou, Z.; Bhamare, S.; Ramakrishnan, G.; Mannava, S.R.; Langer, K.; Wen, Y.; Qian, D.; Vasudevan, V.K. Thermal relaxation of residual stress in laser shock peened Ti-6Al-4V alloy. Surf. Coat. Technol. 2012, 206, 4619–4627. [Google Scholar] [CrossRef]
  25. Zabeen, S.; Preuss, M.; Withers, P.J. Residual stresses caused by head-on and 45° foreign object damage for a laser shock peened Ti-6Al-4V alloy aerofoil. Mater. Sci. Eng. A 2013, 560, 518–527. [Google Scholar] [CrossRef]
  26. Lin, B.; Lupton, C.; Spanrad, S.; Schofield, J.; Tong, J. Fatigue crack growth in laser-shock-peened Ti-6Al-4V aerofoil specimens due to foreign object damage. Int. J. Fatigue 2014, 59, 23–33. [Google Scholar] [CrossRef]
  27. Shepard, M.J.; Smith, P.R.; Amer, M.S. Introduction of compressive residual stresses in Ti-6Al-4V simulated airfoils via laser shock processing. J. Mater. Eng. Perform. 2001, 10, 670–678. [Google Scholar] [CrossRef]
  28. Spanrad, S.; Tong, J. Characterisation of foreign object damage (FOD) and early fatigue crack growth in laser shock peened Ti-6Al-4V aerofoil specimens. Mater. Sci. Eng. A 2011, 528, 2128–2136. [Google Scholar] [CrossRef]
  29. Zolotoyabko, E.; Rupp, J.L.M.; Gauckler, L.J. Interrelationship between grain size-induced and strain-induced broadening of X-ray diffraction profiles: What we can learn about nanostructured materials? Scr. Mater. 2012, 66, 190–193. [Google Scholar] [CrossRef]
  30. Gammon, L.M.; Briggs, R.D.; Packard, J.M.; Batson, K.W.; Boyer, R.; Domby, C.W. Metallography and microstructures of titanium and its alloys. In ASM Handbook; ASM International: Materials Park, OH, USA, 2004; Volume 9, pp. 899–917. [Google Scholar]
  31. ASTM G73-10: Standard Test Method for Liquid Impingement Erosion Using Rotating Apparatus; ASTM International: West Conshohocken, PA, USA, 2010.
  32. Ahmad, M.; Casey, M.; Sürken, N. Experimental assessment of droplet impact erosion resistance of steam turbine blade materials. Wear 2009, 267, 1605–1618. [Google Scholar] [CrossRef]
  33. Heymann, F. Liquid Impingement Erosion. In ASM Handbook; ASM International: Materials Park, OH, USA, 1992; Volume 18, pp. 221–232. [Google Scholar]
  34. Peyre, P.; Fabbro, R.; Merrien, P.; Lieurade, H. Laser shock processing of aluminium alloys. Application to high cycle fatigue behaviour. Mater. Sci. Eng. A 1996, 210, 102–113. [Google Scholar] [CrossRef]
  35. Peyre, P.; Sollier, A.; Chaieb, I.; Berthe, L.; Bartnicki, E.; Braham, C.; Fabbro, R. FEM simulation of residual stresses induced by laser Peening. Eur. Phys. J. Appl. Phys. 2003, 88, 83–88. [Google Scholar] [CrossRef]
  36. Prevey, P. Current Applications of X-ray Diffraction Residual Stress Measurement. In Developments in Materials Characterization Technologies; ASM International: Materials Park, OH, USA, 1996; pp. 103–110. [Google Scholar]
  37. Hackel, L.; Marley, S.; Rubenchik, A. Reduction of cavitation erosion by laser peening. In Proceedings of the SNAME Annual Maritime Convention (SMC), Houston, TX, USA, 22–24 October 2014; pp. 1–10.
  38. Prevéy, P.; Hornbach, D.; Mason, P. Thermal residual stress relaxation and distortion in surface enhanced gas turbine engine components. In Proceedings of the 17th Heat Treating Society Conference and Exposition and the 1st International Induction Heat Treating Symposium, Indianapolis, IN, USA, 16–18 September 1997; pp. 3–12.
  39. Feng, B.; Yang, G.; Mao, X.; Yu, L.; Wu, X. Research development of shot peening strengthening of titanium alloys. Titan. Ind. Prog. 2008, 3, 1–5. [Google Scholar]
  40. Hammersley, G.; Hackel, L.A.; Harris, F. Surface prestressing to improve fatigue strength of components by laser shot peening. Opt. Lasers Eng. 2000, 34, 327–337. [Google Scholar] [CrossRef]
  41. Zhao, Y. Effects of Laser Shock Peening on Residual Stress, Texture and Deformation Microstructure of Ti-6Al-4V Alloy. Ph.D. Thesis, University of Cincinnati, Cincinnati, OH, USA, 2012. [Google Scholar]
  42. Hatamleh, O. The effects of laser peening and shot peening on mechanical properties in friction stir welded 7075-T7351 aluminum. J. Mater. Eng. Perform. 2008, 17, 688–694. [Google Scholar] [CrossRef]
  43. Chávez, J.; Rodríguez, E.; Flores, M.; Ibarra-Montalvo, J.; Jiménez, O.; Gómez-Rosas, G. On the properties and resistance to abrasive wear of surface-modified Ti-6Al-4V alloy by laser shock processing. Superf. Vacio 2014, 27, 54–60. [Google Scholar]
  44. Rubio-González, C.; Felix-Martinez, C.; Gomez-Rosas, G.; Ocaña, J.L.; Morales, M.; Porro, J.A. Effect of laser shock processing on fatigue crack growth of duplex stainless steel. Mater. Sci. Eng. A 2011, 528, 914–919. [Google Scholar] [CrossRef]
  45. Clauer, A.H.; Fairand, B.P. Interaction of laser-induced stress waves with metals. In Proceedings of the ASM Conference Applications of Lasers in Materials Processing, Washington, DC, USA, 18–20 April 1979.
  46. Cellard, C.; Retraint, D.; François, M.; Rouhaud, E.; Le Saunier, D. Laser shock peening of Ti-17 titanium alloy: Influence of process parameters. Mater. Sci. Eng. A 2012, 532, 362–372. [Google Scholar] [CrossRef]
  47. Smith, P.R.; Shepard, M.J.; Prevey, P.S.; Clauer, A.H. Effect of power density and pulse repetition on laser shock peening of Ti-6AI-4V. J. Mater. Eng. Perform. 2000, 9, 33–37. [Google Scholar] [CrossRef]
  48. Petunlna, E.V.; Poplayskaya, V.L. Strength increase of titanium-base alloys by cold working. Met. Sci. Heat Treat. Met. 1959, 1, 24–27. [Google Scholar]
  49. Nagarjuna, S.; Balasubramanian, K.; Sarma, D.S. Effect of prior cold work on mechanical properties. J. Mater. Sci. 1997, 2, 3375–3385. [Google Scholar] [CrossRef]
  50. Baufeld, B.; van der Biest, O. Mechanical properties of Ti-6Al-4V specimens produced by shaped metal deposition. Sci. Technol. Adv. Mat. 2009, 10, 1–10. [Google Scholar] [CrossRef]
  51. Gupta, R.K.; Kumar, V.A.; Mathew, C.; Rao, G.S. Strain hardening of Titanium alloy Ti-6Al-4V sheets with prior heat treatment and cold working. Mater. Sci. Eng. A 2016, 662, 537–550. [Google Scholar] [CrossRef]
  52. Heymann, F. On the Time Dependence of the Rate of Erosion Due to Impingement or Cavitation; ASTM STP 408; American Society for Testing and Materials: West Conshohocken, PA, USA, 1967; pp. 70–110. [Google Scholar]
  53. Kirols, H.S.; Kevorkov, D.; Uihlein, A.; Medraj, M. The effect of initial surface roughness on water droplet erosion behaviour. Wear 2015, 342–343, 198–209. [Google Scholar] [CrossRef]
  54. Thiruvengadam, A.; Rudy, S.L. Experimental and Analytical Investigations on Multiple Liquid Impact Erosion; National Aeronautics and Space Administration (NASA): Moffett Field, CA, USA, 1969; pp. 1–93.
  55. Hoff, G.; Landbein, G.; Rieger, H. Material destruction due to liquid impact in Erosion by Cavitation or Impingement: A symposium. In Proceedings of the 6–9th Annual Meeting, American Society for Testing and Materials, Atlanta City, NJ, USA, 26 June–1 July 1966; pp. 42–69.
  56. Mahdipoor, M.S.; Kirols, H.S.; Kevorkov, D.; Jedrzejowski, P.; Medraj, M. Influence of impact speed on water droplet erosion of TiAl compared with Ti-6Al-4V. Sci. Rep. 2015, 5, 14182. [Google Scholar] [CrossRef] [PubMed]
  57. Fujisawa, N.; Yamagata, T.; Takano, S.; Saito, K.; Morita, R.; Fujiwara, K.; Inada, F. The influence of material hardness on liquid droplet impingement erosion. Nucl. Eng. Des. 2015, 288, 27–34. [Google Scholar] [CrossRef]
  58. Heymann, F.J. Erosion by liquids. Available online: http://users.encs.concordia.ca/~tmg/images/8/8b/Erosion_by_liquids.pdf (accessed on 20 August 2016).
  59. Robinson, J.I.; Reed, R.C. Water droplet erosion of laser surface treated Ti-6A1-4V. Wear 1995, 187, 360–367. [Google Scholar] [CrossRef]
  60. Yasugahira, N.; Namura, K.; Kaneko, R.; Satoh, T. Erosion resistance of titanium alloys for steam turbines blades as measured by water droplet impingement. In Proceedings of the Workshop on titanium steam turbine blading, PaloAlto, CA, USA, 9–10 November 1988; pp. 385–402.
Figure 1. Scanning electron microscope (SEM) micrographs showing the initial Ti-6Al-4V microstructure.
Metals 06 00262 g001
Figure 2. Typical T-shaped flat (a) and airfoil (b) samples that were machined.
Metals 06 00262 g002
Figure 3. Illustration of 0° and 90° directions relative to the laser scanning direction on a peened sample.
Metals 06 00262 g003
Figure 4. Water erosion rig with attached samples (a) and fixed nozzles and sample (b).
Metals 06 00262 g004
Figure 5. Schematic illustration of the WDE testing direction with respect to (a) T-shaped flat and (b) airfoil treated surfaces.
Metals 06 00262 g005
Figure 6. WDE curve analyses using (a) three line representation [33] and (b) ERinst [31].
Metals 06 00262 g006
Figure 7. XRD patterns of the As-M and LSP treated surface.
Metals 06 00262 g007
Figure 8. SEM micrographs showing (a) treated top surface (b) untreated cross-section and (c) LSP treated cross-section.
Metals 06 00262 g008
Figure 9. Measured microhardness with respect to depth for LSP and As-M conditions.
Metals 06 00262 g009
Figure 10. WDE curves for As-M versus LSP at (a) 150–200 m/s and (b) 250–350 m/s.
Metals 06 00262 g010aMetals 06 00262 g010b
Figure 11. Effect of impact speed on (a) erosion initiation and (b) ERmax.
Metals 06 00262 g011aMetals 06 00262 g011b
Figure 12. WDE curve of As-M versus LSP for (a) 460 and (b) 200 µm droplet sizes.
Metals 06 00262 g012
Figure 13. ERinst for WDE tests using (a) 350 m/s, 460 µm; (b) 300 m/s, 460 µm and (c) 350 m/s, 200 µm.
Metals 06 00262 g013aMetals 06 00262 g013b
Figure 14. Optical macrographs showing the erosion evolution and progression on As-M and LSP samples tested at (a) 250 m/s and (b) 300 m/s.
Metals 06 00262 g014aMetals 06 00262 g014b
Figure 15. Optical macrographs showing the erosion evolution and progression on As-M and LSP airfoil samples at 350 m/s using 460 µm.
Metals 06 00262 g015
Table 1. Laser shock peened (LSP) processing parameters and conditions.
Sample GeometryT-Shaped FlatAirfoil
Surface treatedAs-MAs-M
Laser typeNd:GlassNd:Glass
Ablative layerAluminumNo layer
Intensity (GW/cm2)1010
Pulse time (ns)1818
Number of layers23
Spot geometrySquareSquare
Spot size (mm)3 × 33 × 3
Table 2. WDE test parameters used in this work.
WDE ParametersFlat SampleAirfoil Sample
Impact speed (m/s)150, 200, 250, 300, 325, 350300, 350
Rotational speed × 103 (rpm)6, 8, 10, 12, 13, 1412, 14
Flow rate (L/min)0.050.15, 0.20 *
Nozzle head typeSingle streakShower head
Nozzle distance from sample (mm)55
Average droplet size (µm)463460, 200
Impact angle (°)9090
* Flow rate of 0.20 L/min was used only for the shower head nozzle producing average droplet size of 200 µm.

