
A Simple Method for the Determination of Deposition Coefficient Using the Analytical Solution of Advection-Dispersion-Deposition Equation for Step Input


Abstract
:1. Introduction
2. Theoretical Analysis
3. Results and Discussion
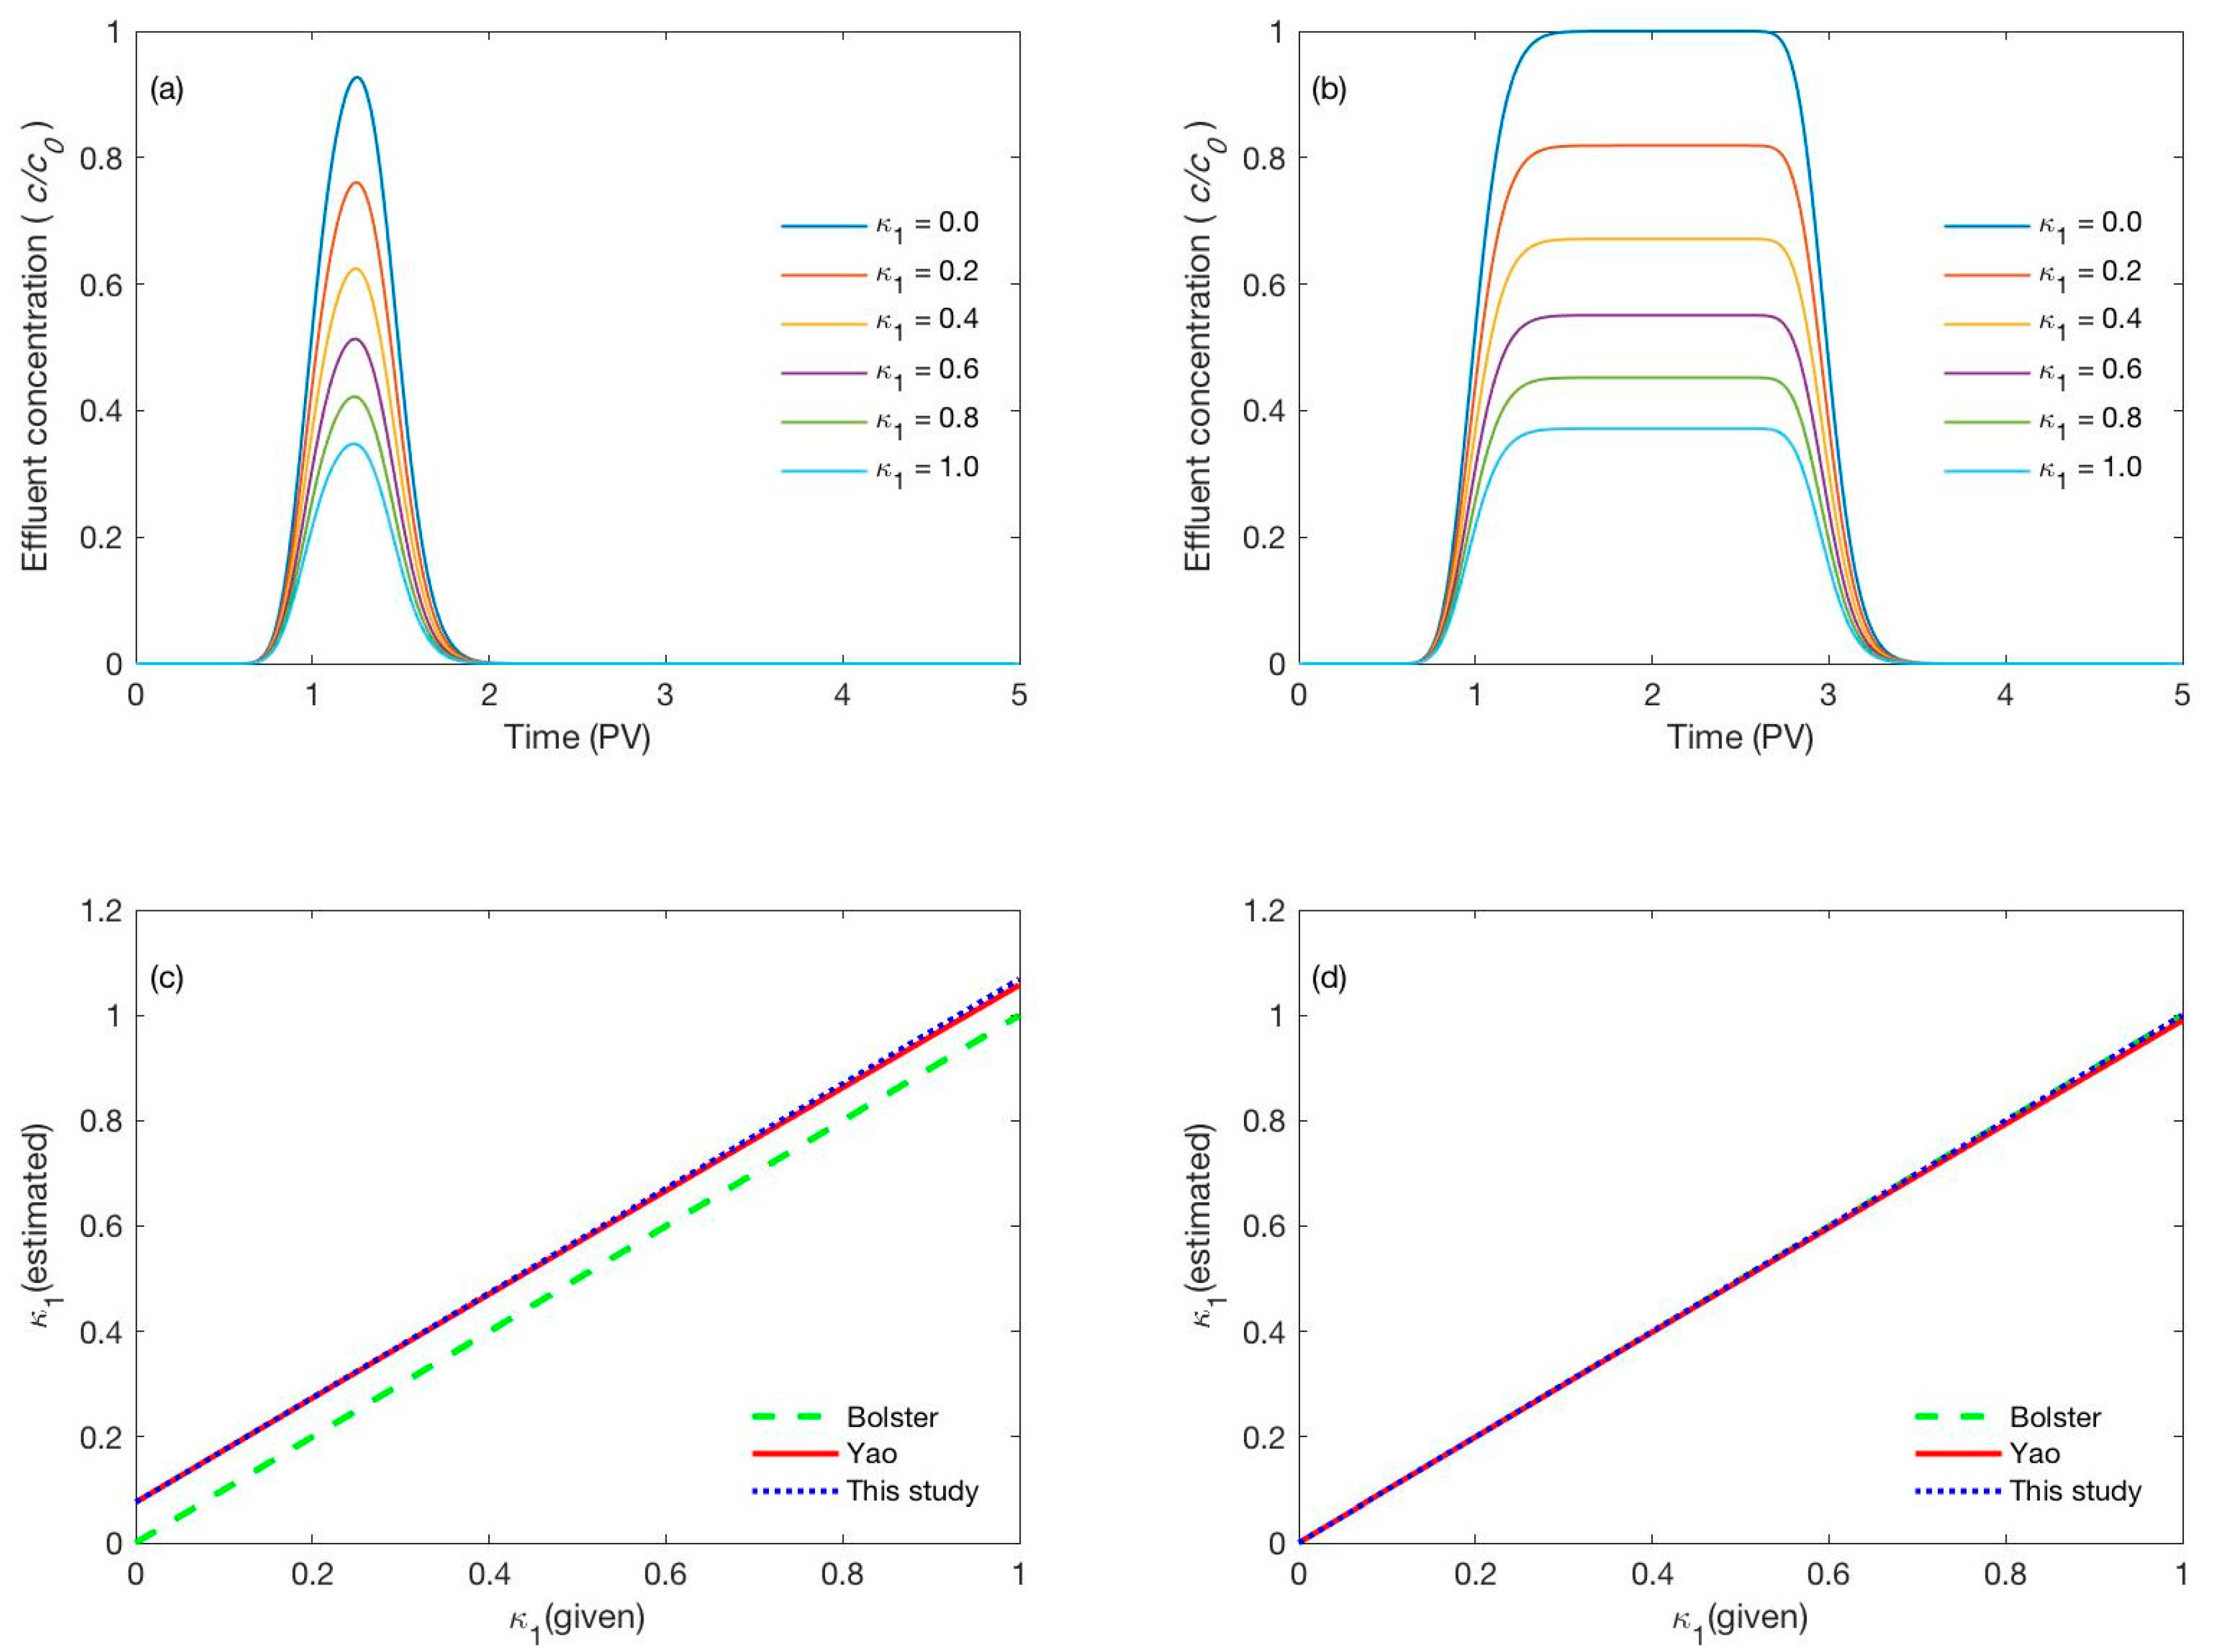
3.1. Discrepancy between the Given Deposition Coefficient and the Estimated Values
3.2. Validation of the Detemined Deposition Coefficient
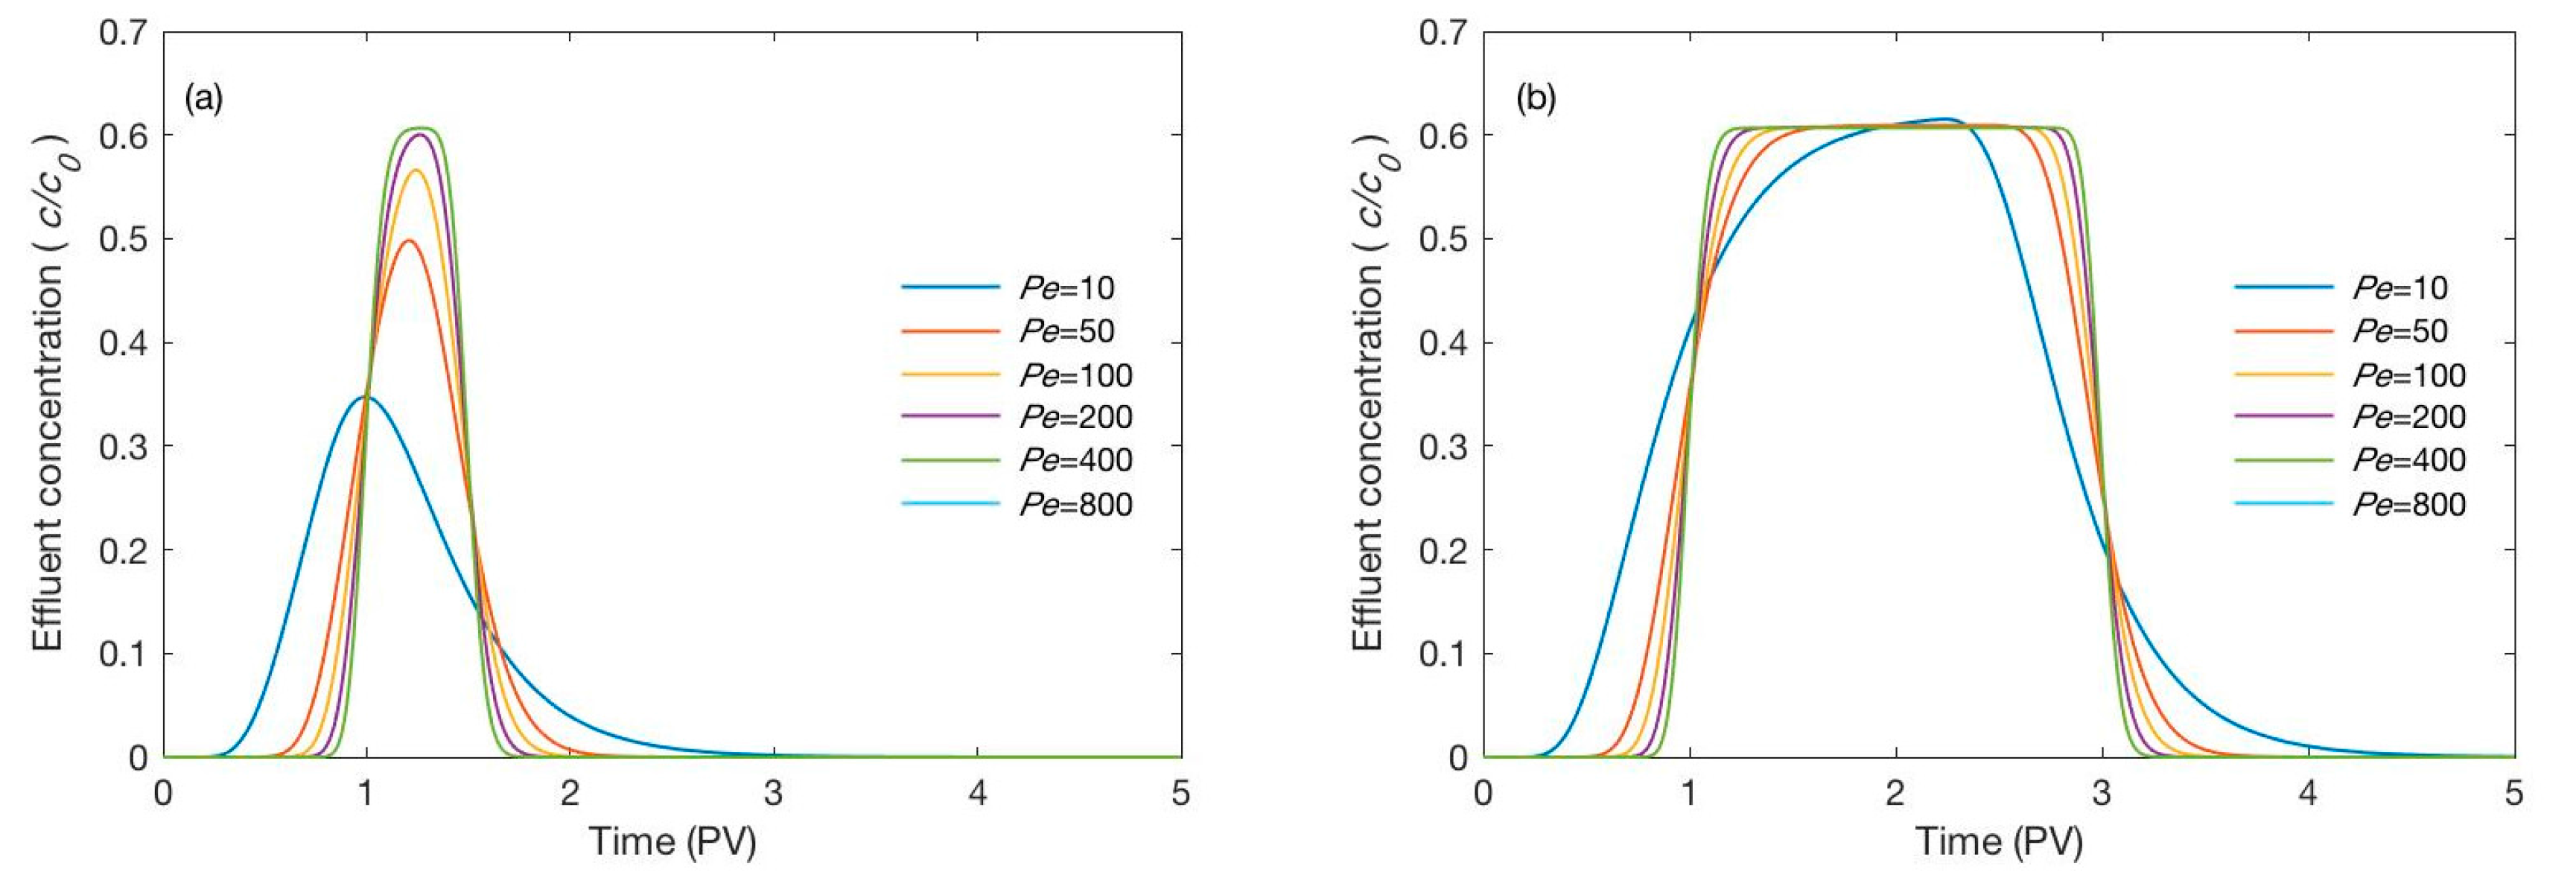
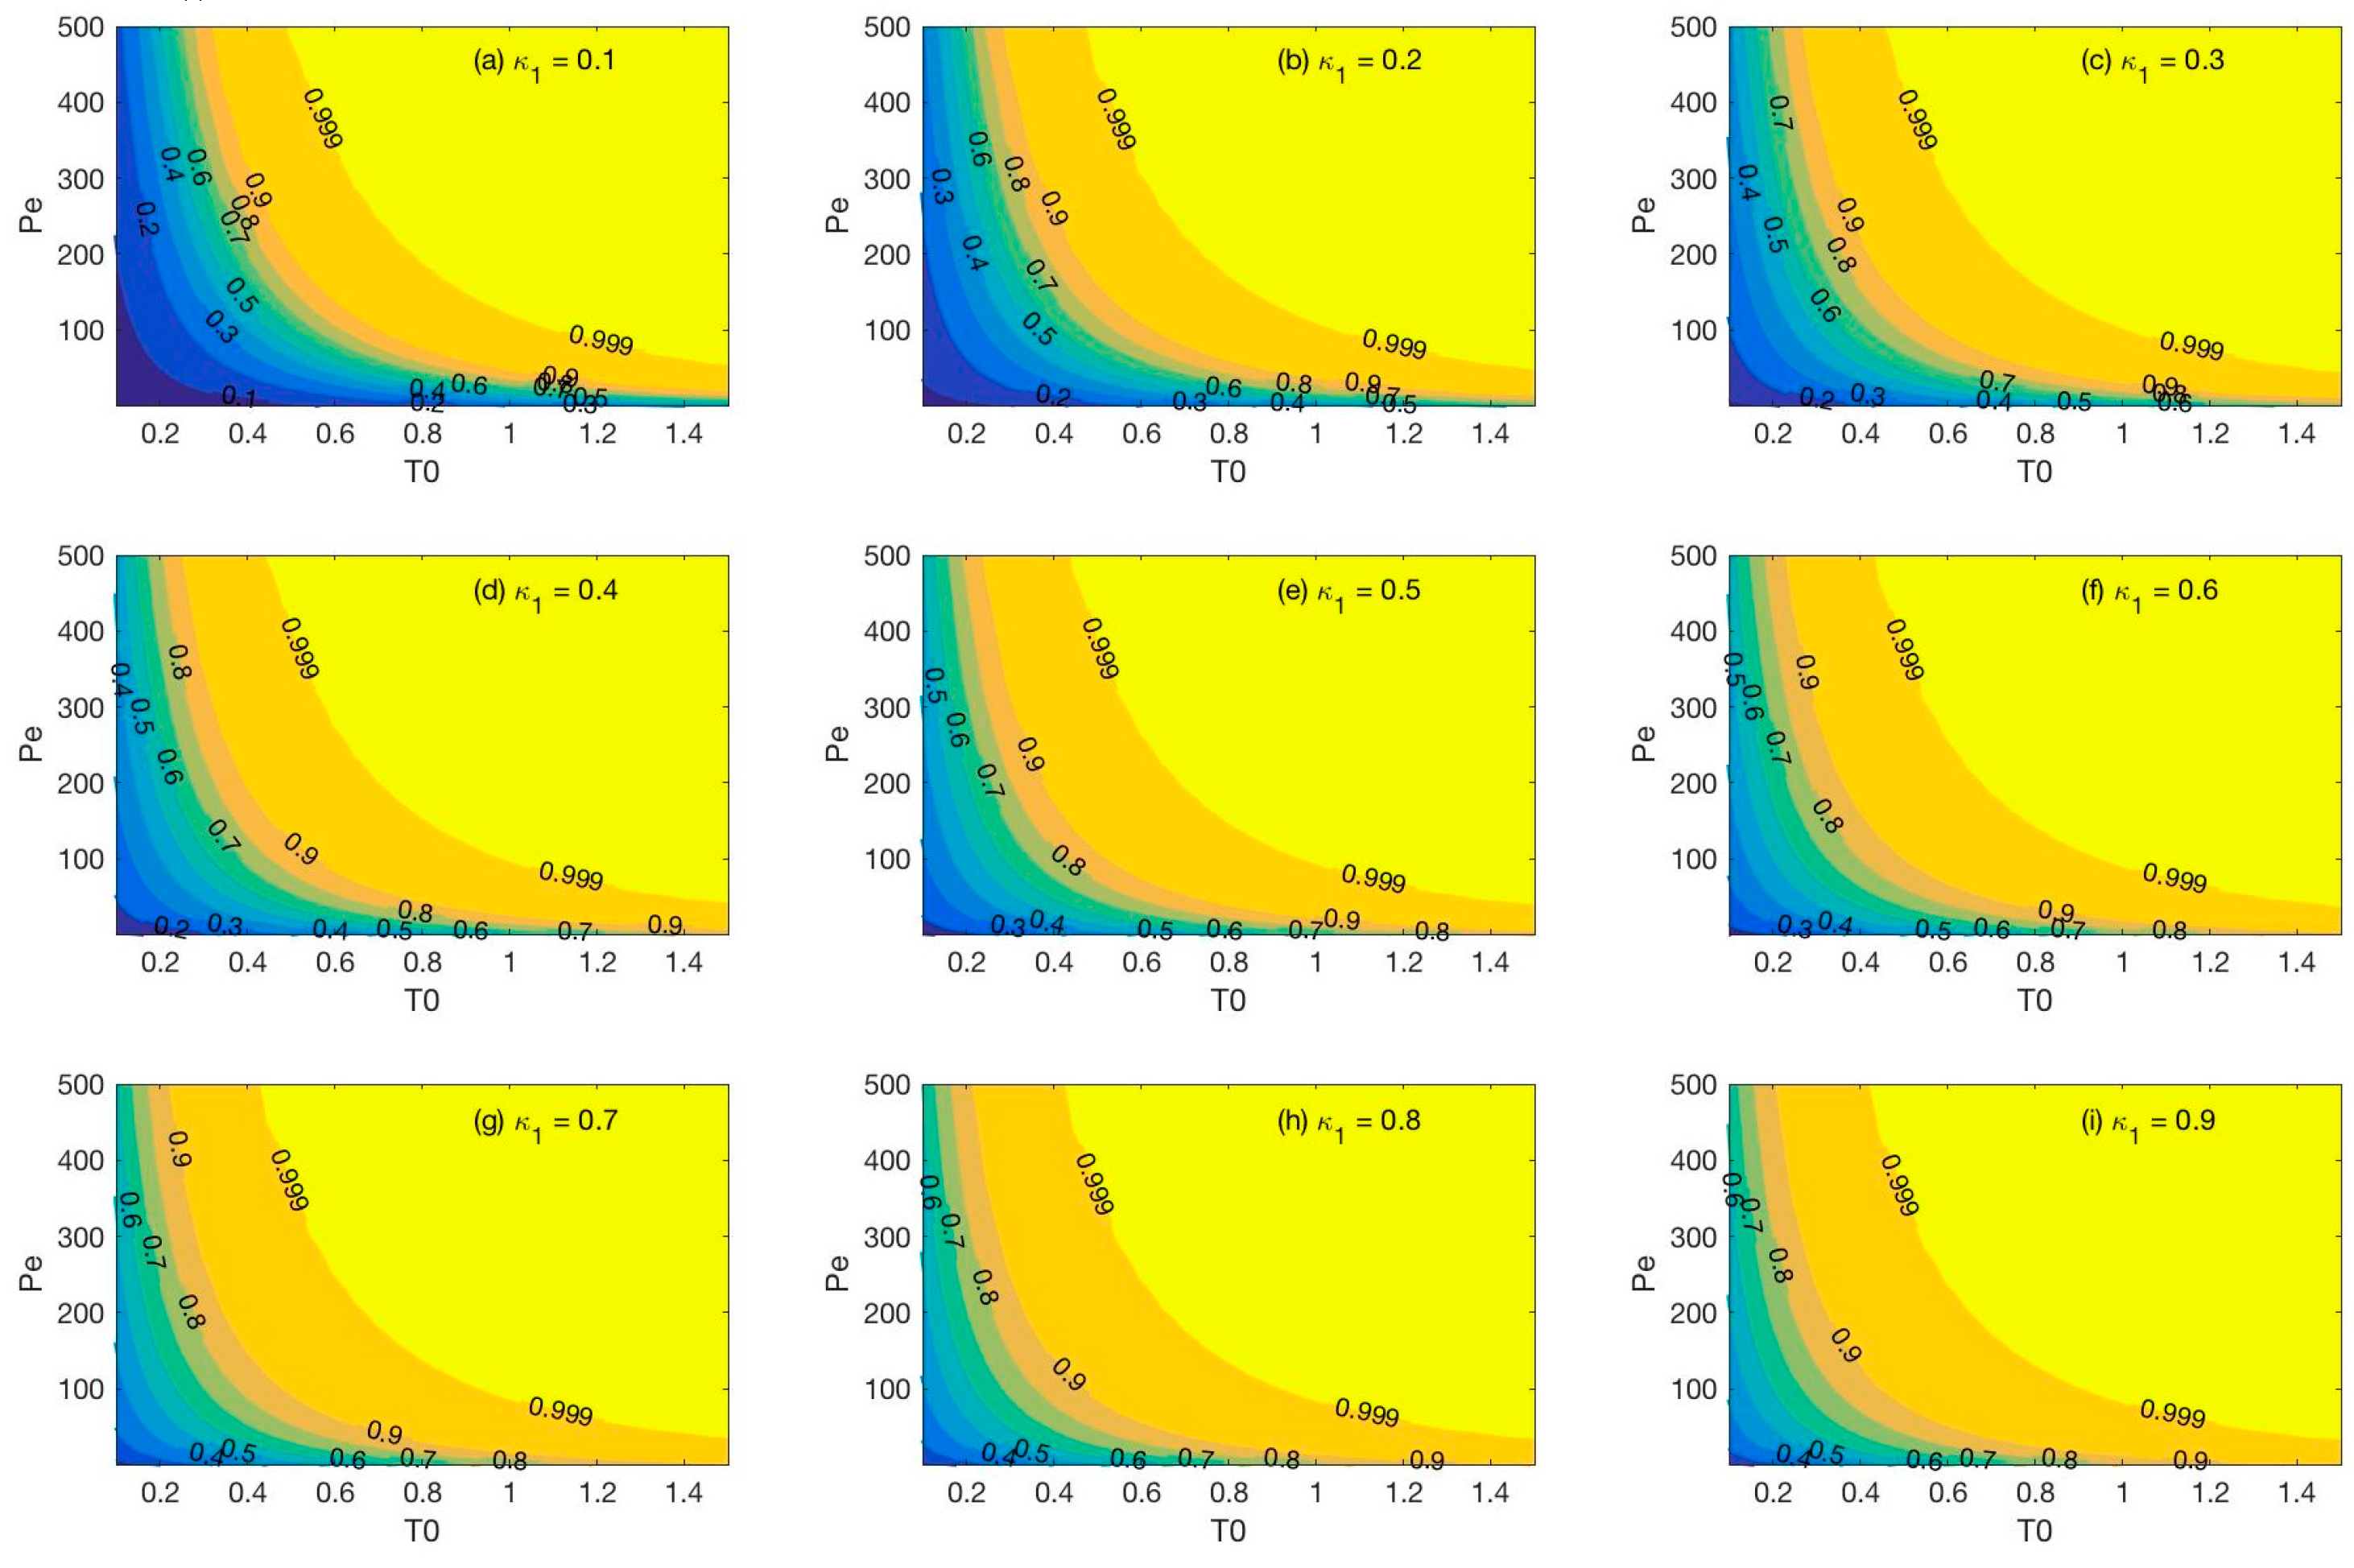
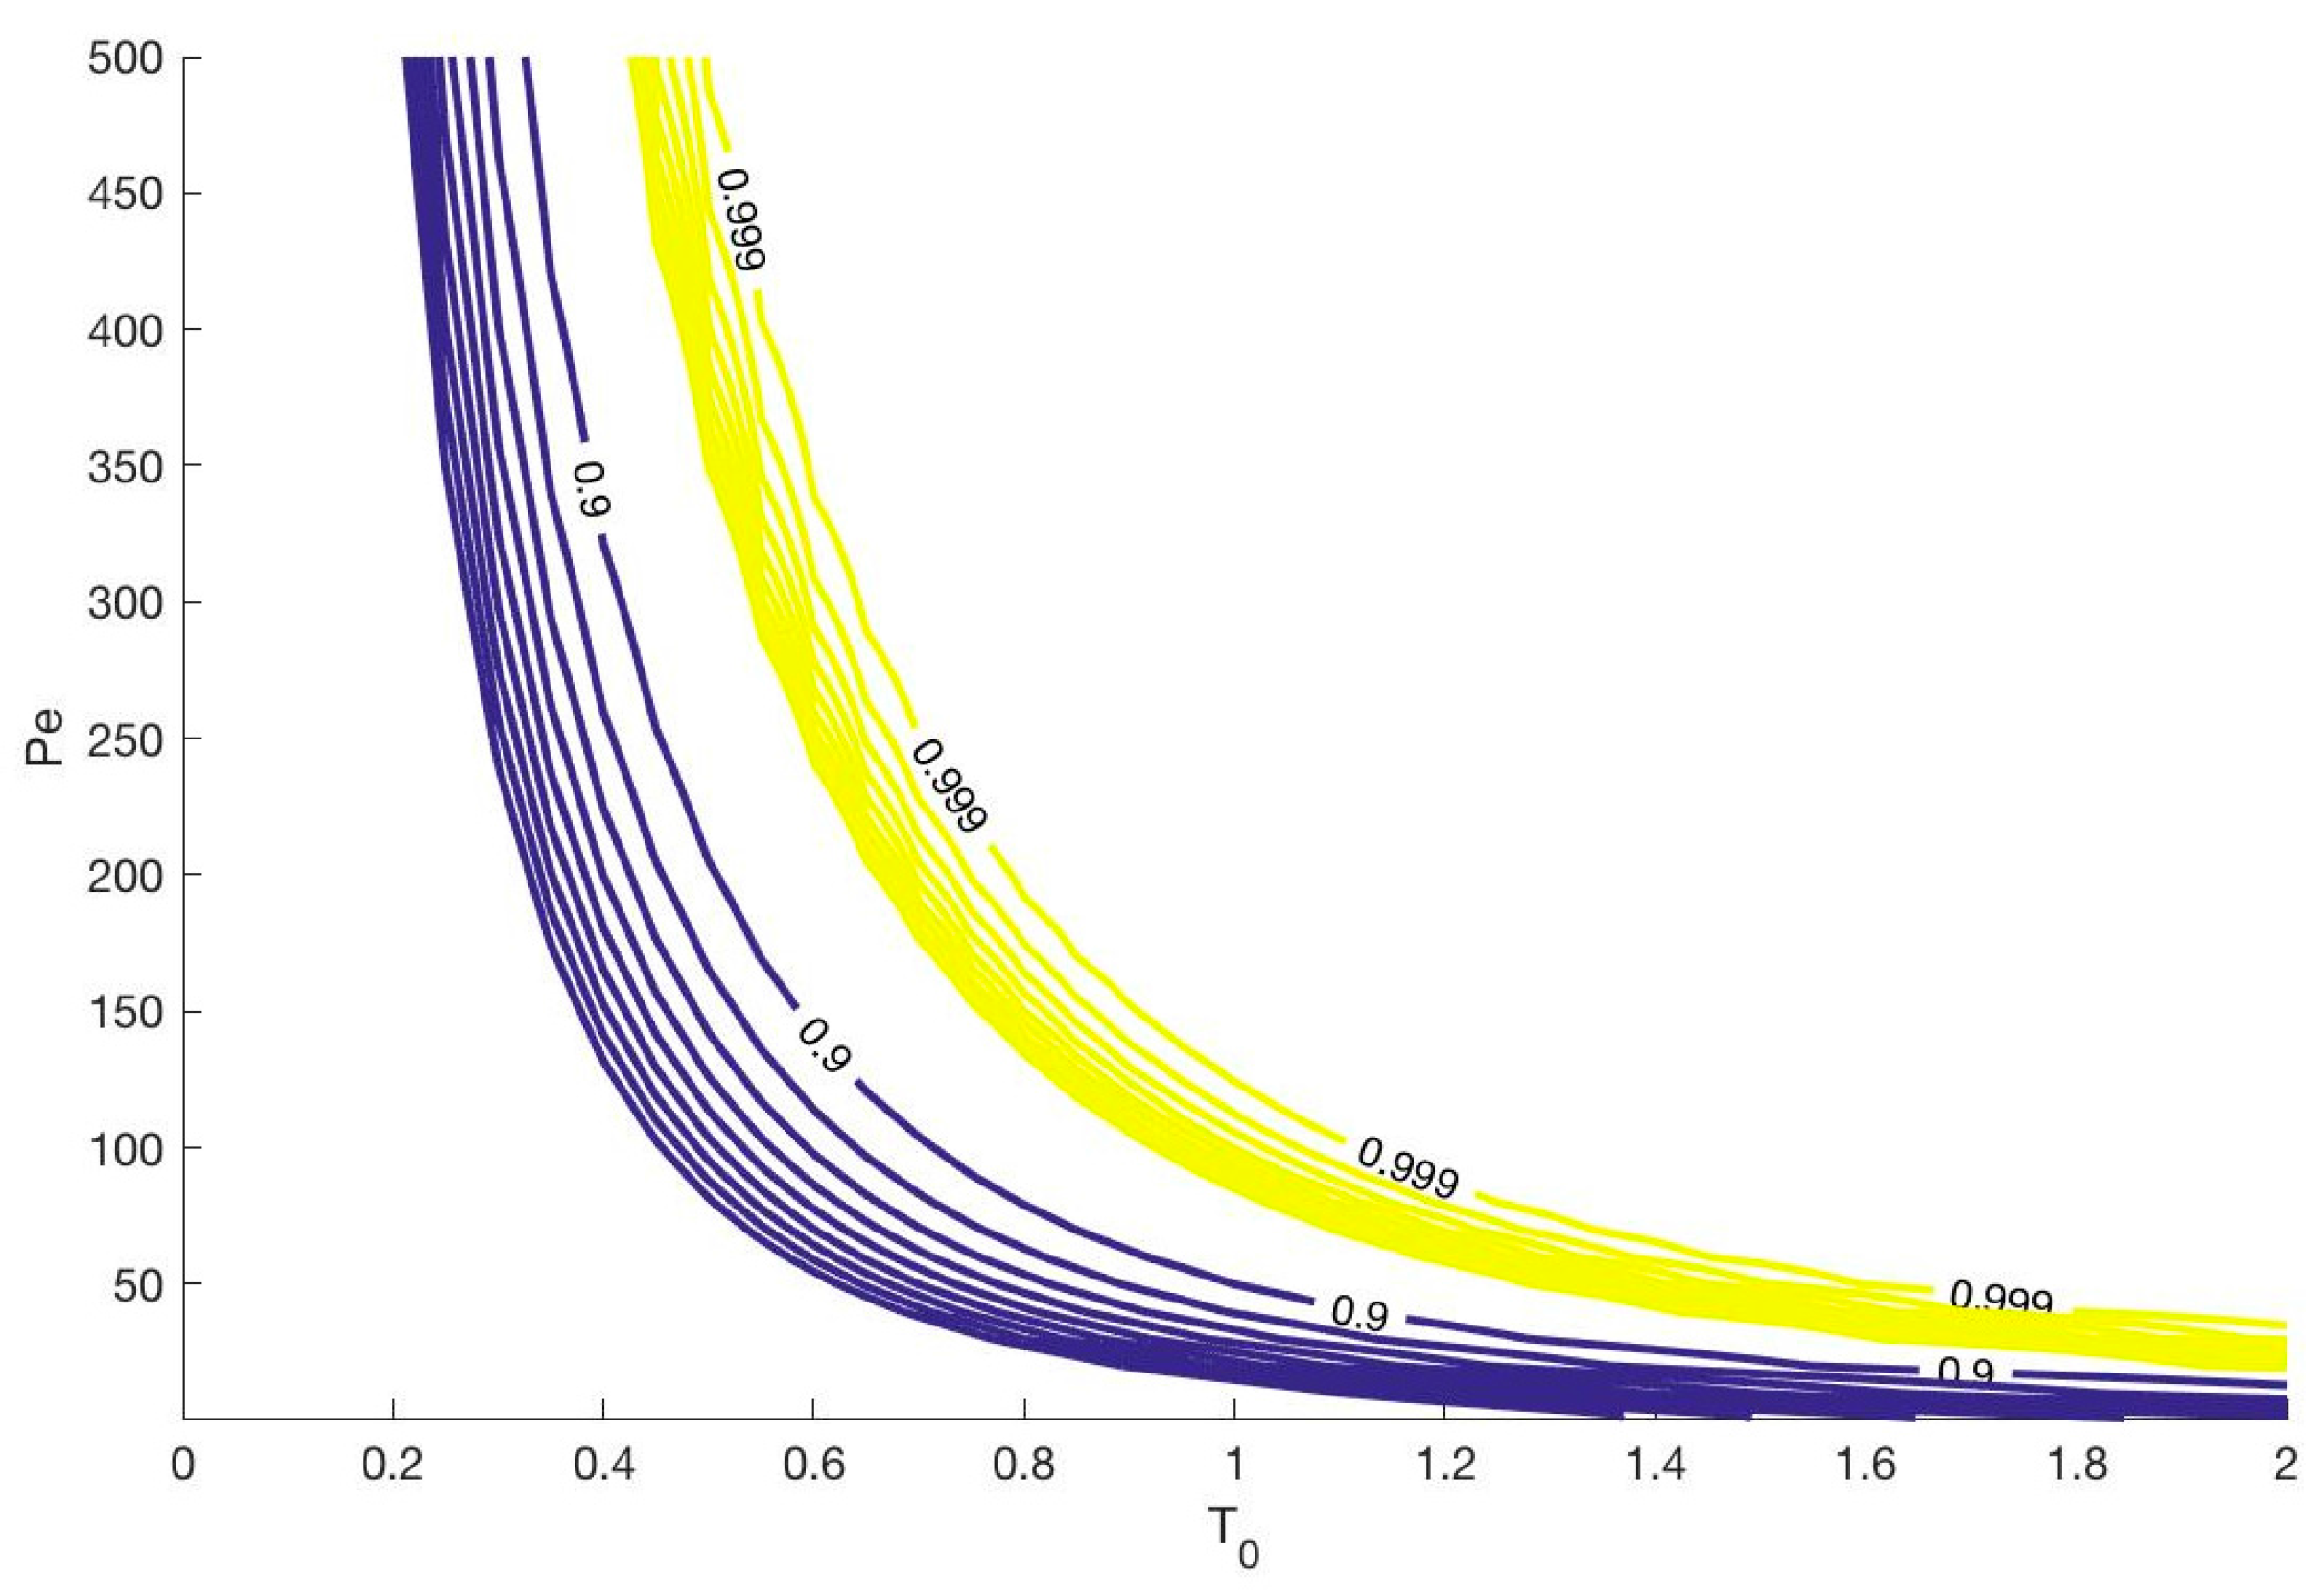
3.2.1. Effect of the Peclet Number
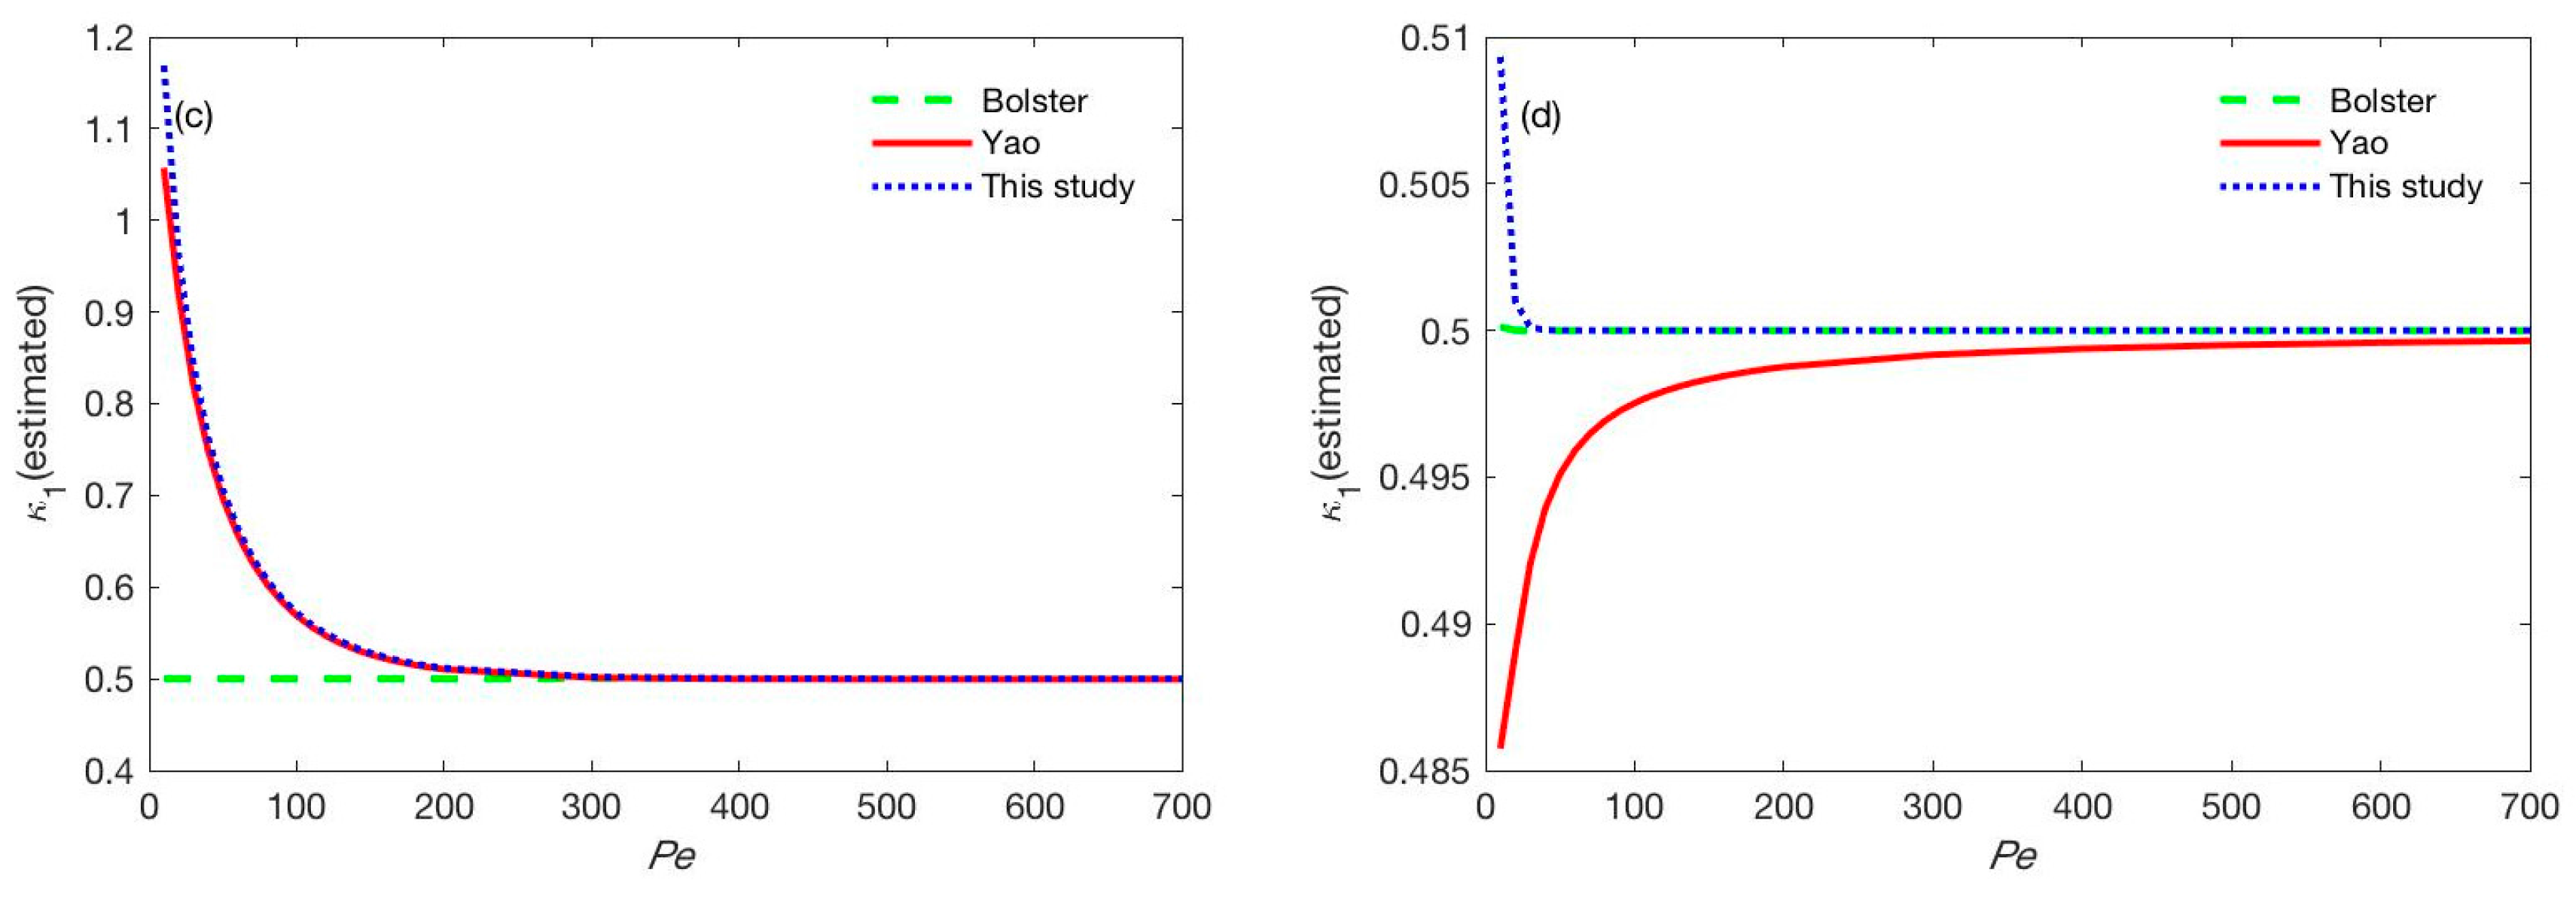
3.2.2. Effect of the Pulse Duration
3.2.3. Applicablility of the New Method for the Estimation of
4. Conclusions
Acknowledgments
Author Contributions
Conflicts of Interest
References
- Abramson, A.; Brown, D.G. Influence of solution ionic strength on the collision efficiency distribution and predicted transport distance of a Sphingomonas sp. Flowing through porous media. Water Res. 2007, 41, 4435–4445. [Google Scholar] [CrossRef] [PubMed]
- Kim, H.N.; Walker, S.L. Escherichia coli transport in porous media: Influence of cell strain, solution chemistry, and temperature. Colloids Surf. B Biointerfaces 2009, 71, 160–167. [Google Scholar] [CrossRef] [PubMed]
- Gargiulo, G.; Bradford, S.; Simunek, J.; Ustohal, P.; Vereecken, H.; Klumpp, E. Bacteria transport and deposition under unsaturated conditions: The role of the matrix grain size and the bacteria surface protein. J. Contam. Hydrol. 2007, 92, 255–273. [Google Scholar] [CrossRef] [PubMed]
- Chen, G.; Walker, S.L. Fecal indicator bacteria transport and deposition in saturated and unsaturated porous media. Environ. Sci. Technol. 2012, 46, 8782–8790. [Google Scholar] [CrossRef] [PubMed]
- Syngouna, V.I.; Chrysikopoulos, C.V. Transport of biocolloids in water saturated columns packed with sand: Effect of grain size and pore water velocity. J. Contam. Hydrol. 2011, 126, 301–314. [Google Scholar] [CrossRef] [PubMed]
- Fang, J.; Xu, M.J.; Wang, D.J.; Wen, B.; Han, J.Y. Modeling the transport of TiO2 nanoparticle aggregates in saturated and unsaturated granular media: Effects of ionic strength and pH. Water Res. 2013, 47, 1399–1408. [Google Scholar] [CrossRef] [PubMed]
- Yao, K.M.; Habibian, M.M.; Omelia, C.R. Water and waste water filtration—Concepts and applications. Environ. Sci. Technol. 1971, 5, 1105–1112. [Google Scholar] [CrossRef]
- Bolster, C.H.; Hornberger, G.M.; Mills, A.L.; Wilson, J.L. A method for calculating bacterial deposition coefficient using the fraction of bacteria recovered from laboratory columns. Environ. Sci. Technol. 1998, 32, 1329–1332. [Google Scholar] [CrossRef]

| Reference | |
|---|---|
| Bolster et al. (1998) [8] | |
| Yao et al. (1971) [7] | |
| This study |
| Cases | |||
|---|---|---|---|
| analysis | 0.1–1.0 | 100 | 0.5, 2 |
| analysis | 0.5 | 10–800 | 0.5, 2 |
| analysis | 0.5 | 100 | 0.1–2 |
| Parameters | Step | Short Pulse | Long Pulse | Remark |
|---|---|---|---|---|
| Pe | 100 | 100 | 100 | Parameters used for the simulation of BTC |
| (given) | 0.50 | 0.50 | 0.50 | |
| - | 0.50 | 2.00 | ||
| 0.61 | - | - | Obtained from BTC | |
| - | 0.56 | 0.61 | ||
| - | 0.61 | 0.61 | ||
| (estimated) | - | 0.50 | 0.50 | Bolster et al. (1998) [8] |
| (estimated) | 0.50 | - | 0.50 | Yao et al. (1971) [7] |
| (estimated) | 0.50 | 0.57 | 0.50 | This study |
© 2017 by the authors. Licensee MDPI, Basel, Switzerland. This article is an open access article distributed under the terms and conditions of the Creative Commons Attribution (CC BY) license (http://creativecommons.org/licenses/by/4.0/).
Share and Cite
Choi, N.-C.; Choi, J.-W.; Kwon, K.-S.; Lee, S.-G.; Kim, B.-J.; Lee, S. A Simple Method for the Determination of Deposition Coefficient Using the Analytical Solution of Advection-Dispersion-Deposition Equation for Step Input. Water 2017, 9, 398. https://doi.org/10.3390/w9060398
Choi N-C, Choi J-W, Kwon K-S, Lee S-G, Kim B-J, Lee S. A Simple Method for the Determination of Deposition Coefficient Using the Analytical Solution of Advection-Dispersion-Deposition Equation for Step Input. Water. 2017; 9(6):398. https://doi.org/10.3390/w9060398
Chicago/Turabian StyleChoi, Nag-Choul, Jae-Woo Choi, Kyu-Sang Kwon, Sang-Gil Lee, Bong-Ju Kim, and Soonjae Lee. 2017. "A Simple Method for the Determination of Deposition Coefficient Using the Analytical Solution of Advection-Dispersion-Deposition Equation for Step Input" Water 9, no. 6: 398. https://doi.org/10.3390/w9060398