
The Effect of Artificial Recharge on Hydrochemistry: A Comparison of Two Fluvial Gravel Pit Lakes with Different Post-Excavation Uses in The Netherlands

Abstract
:1. Introduction
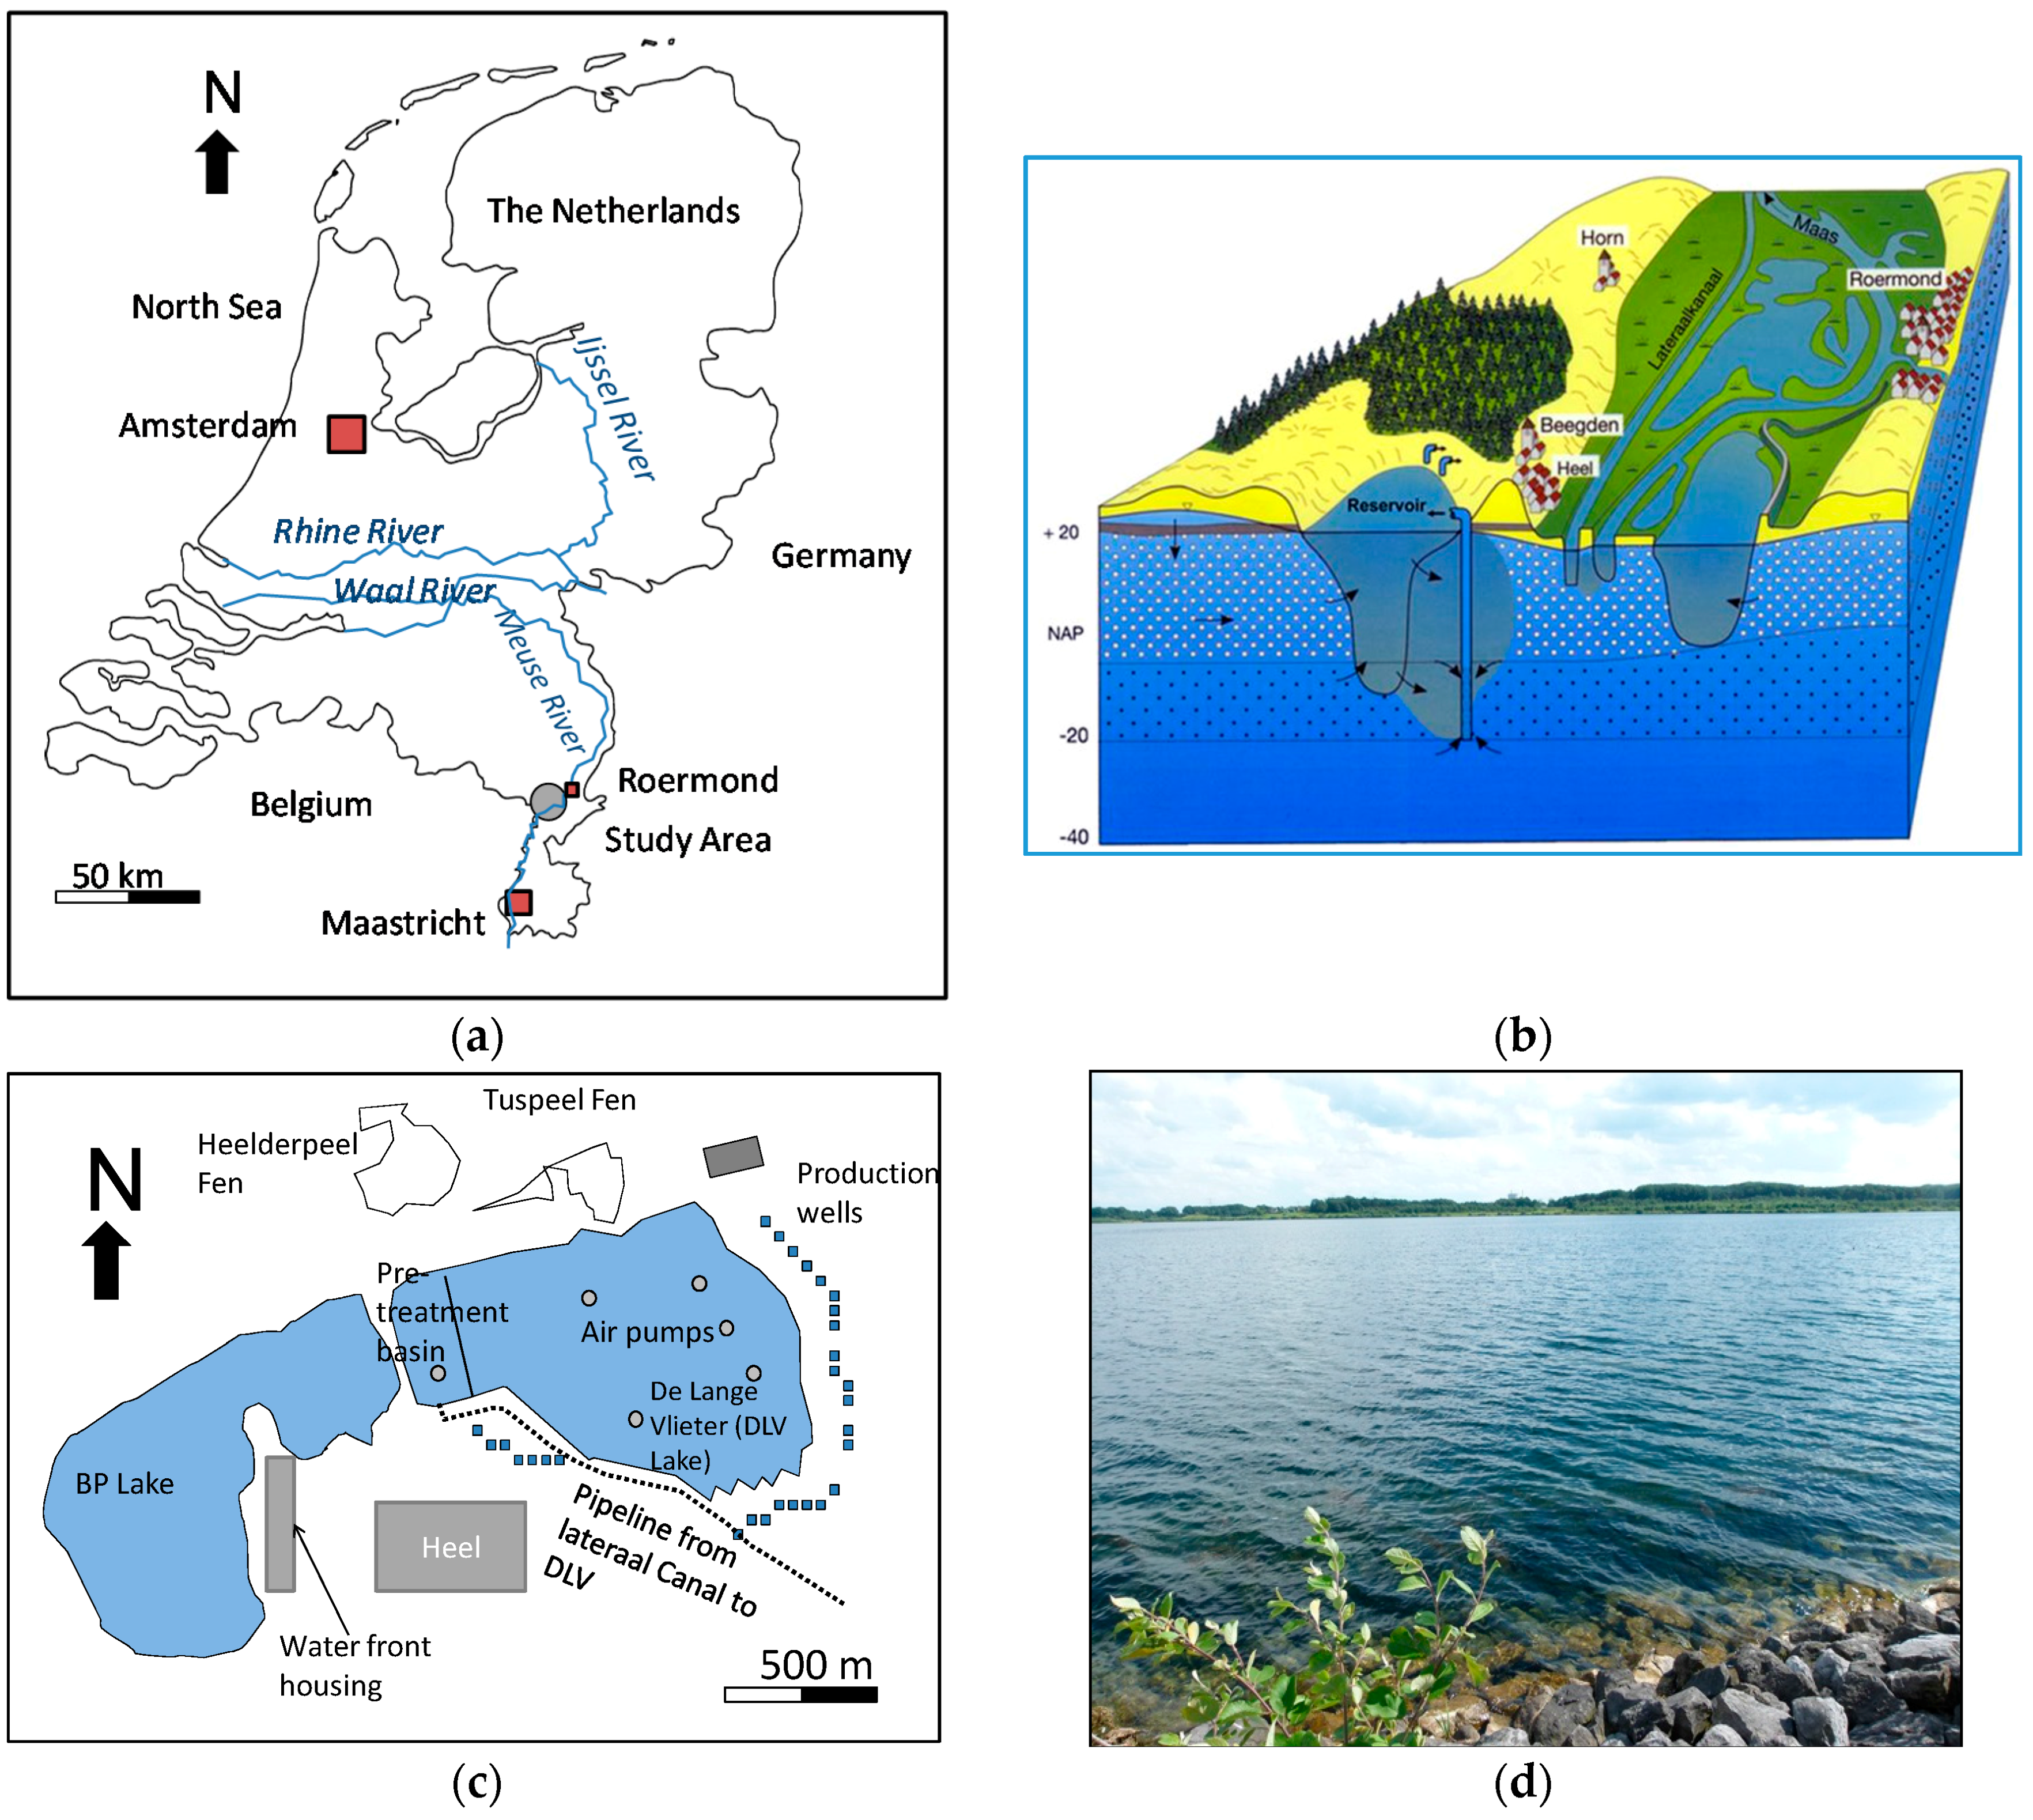
2. Study Area
3. Sampling, Chemical Analysis and Statistical Analysis
4. Results
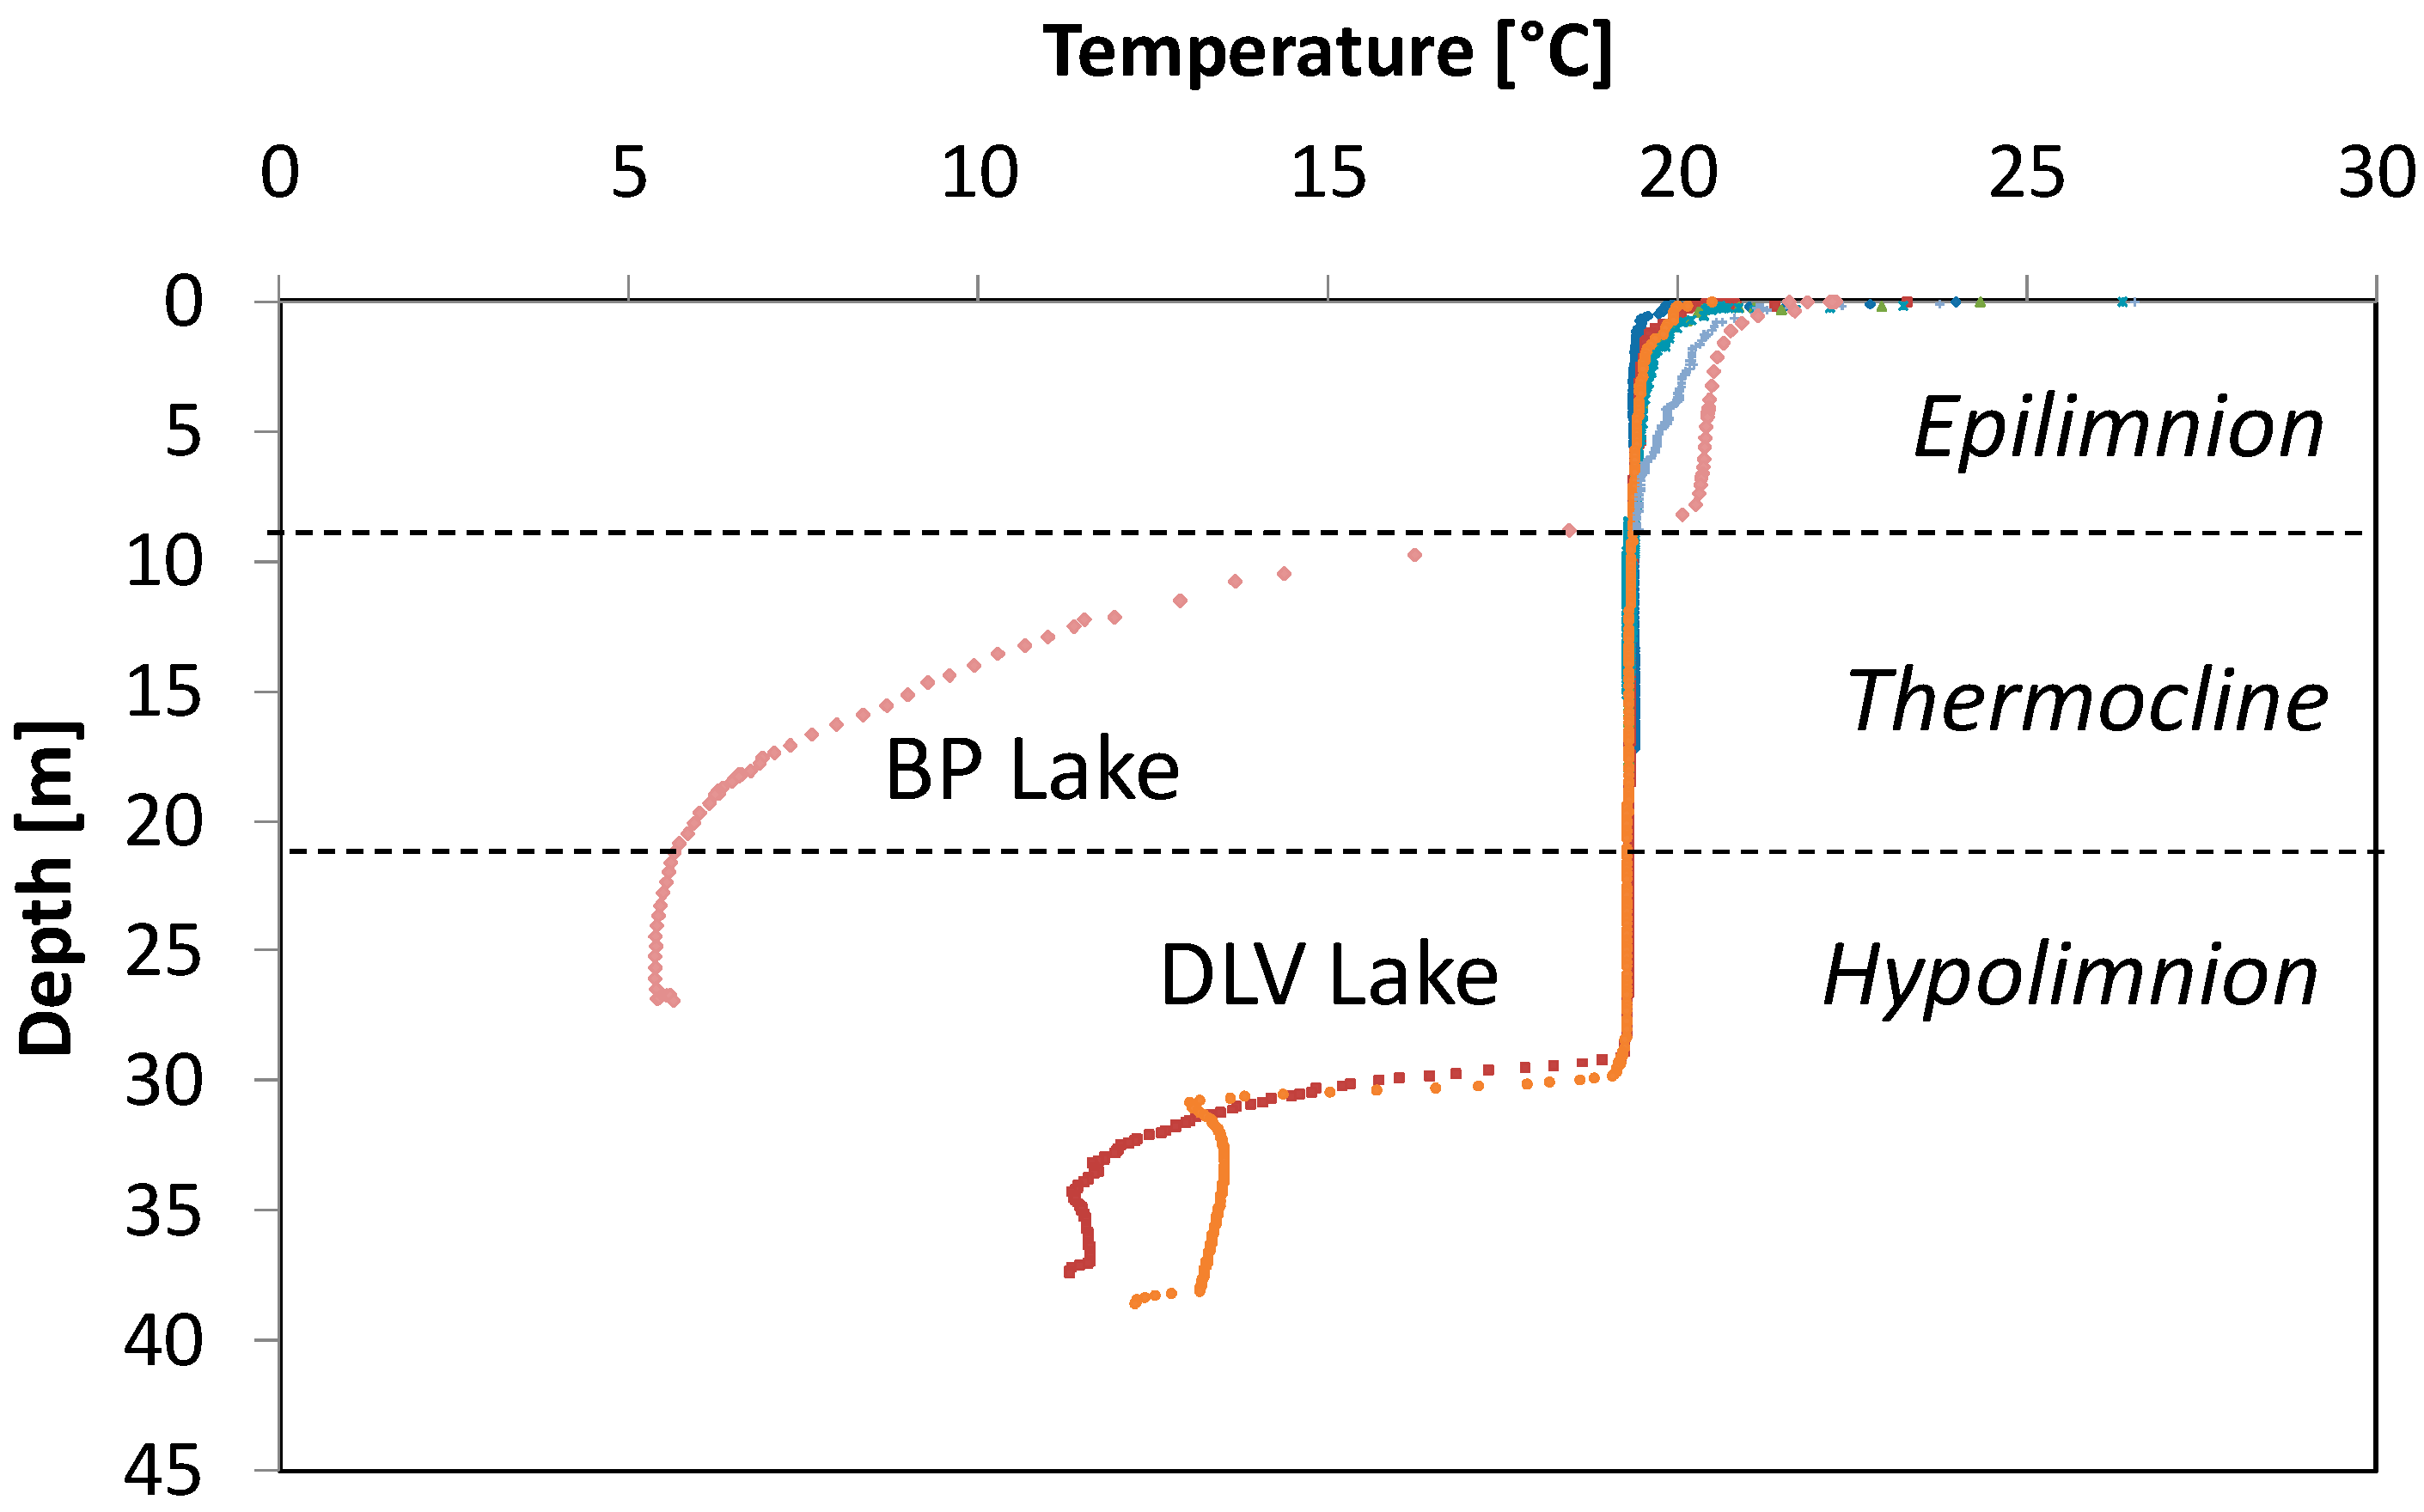
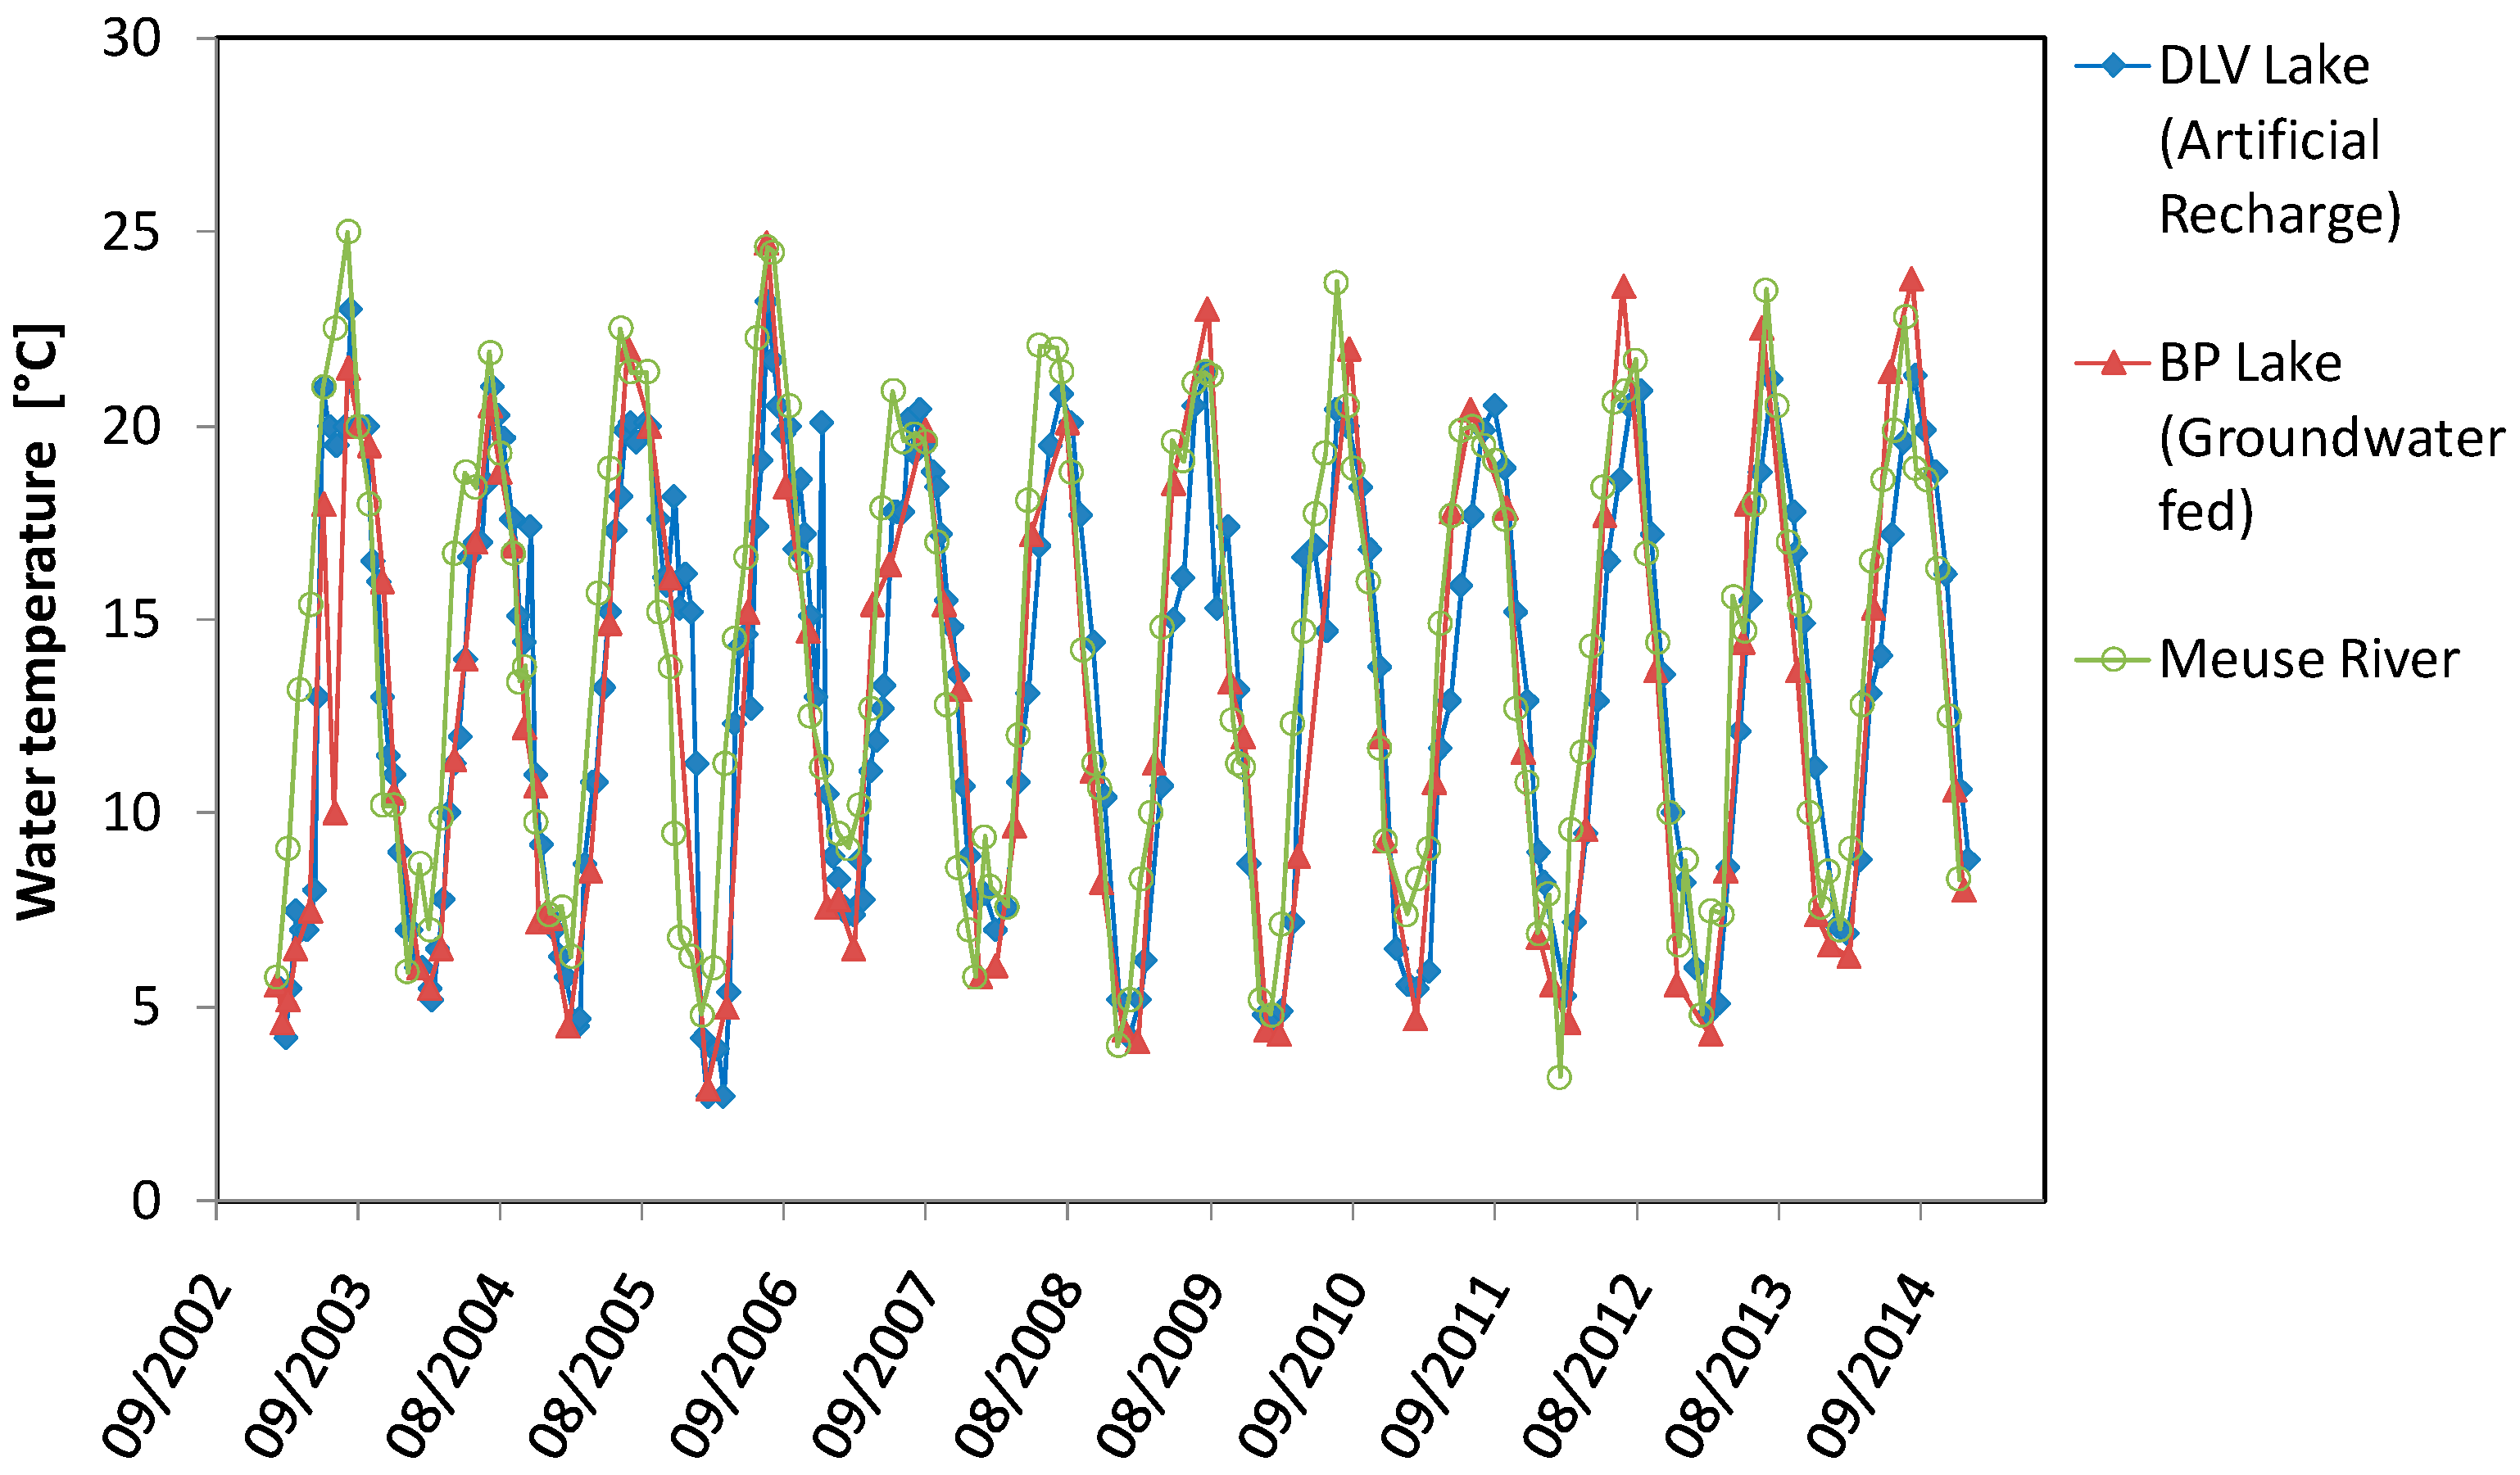
4.1. Temperature with Depth Profiles
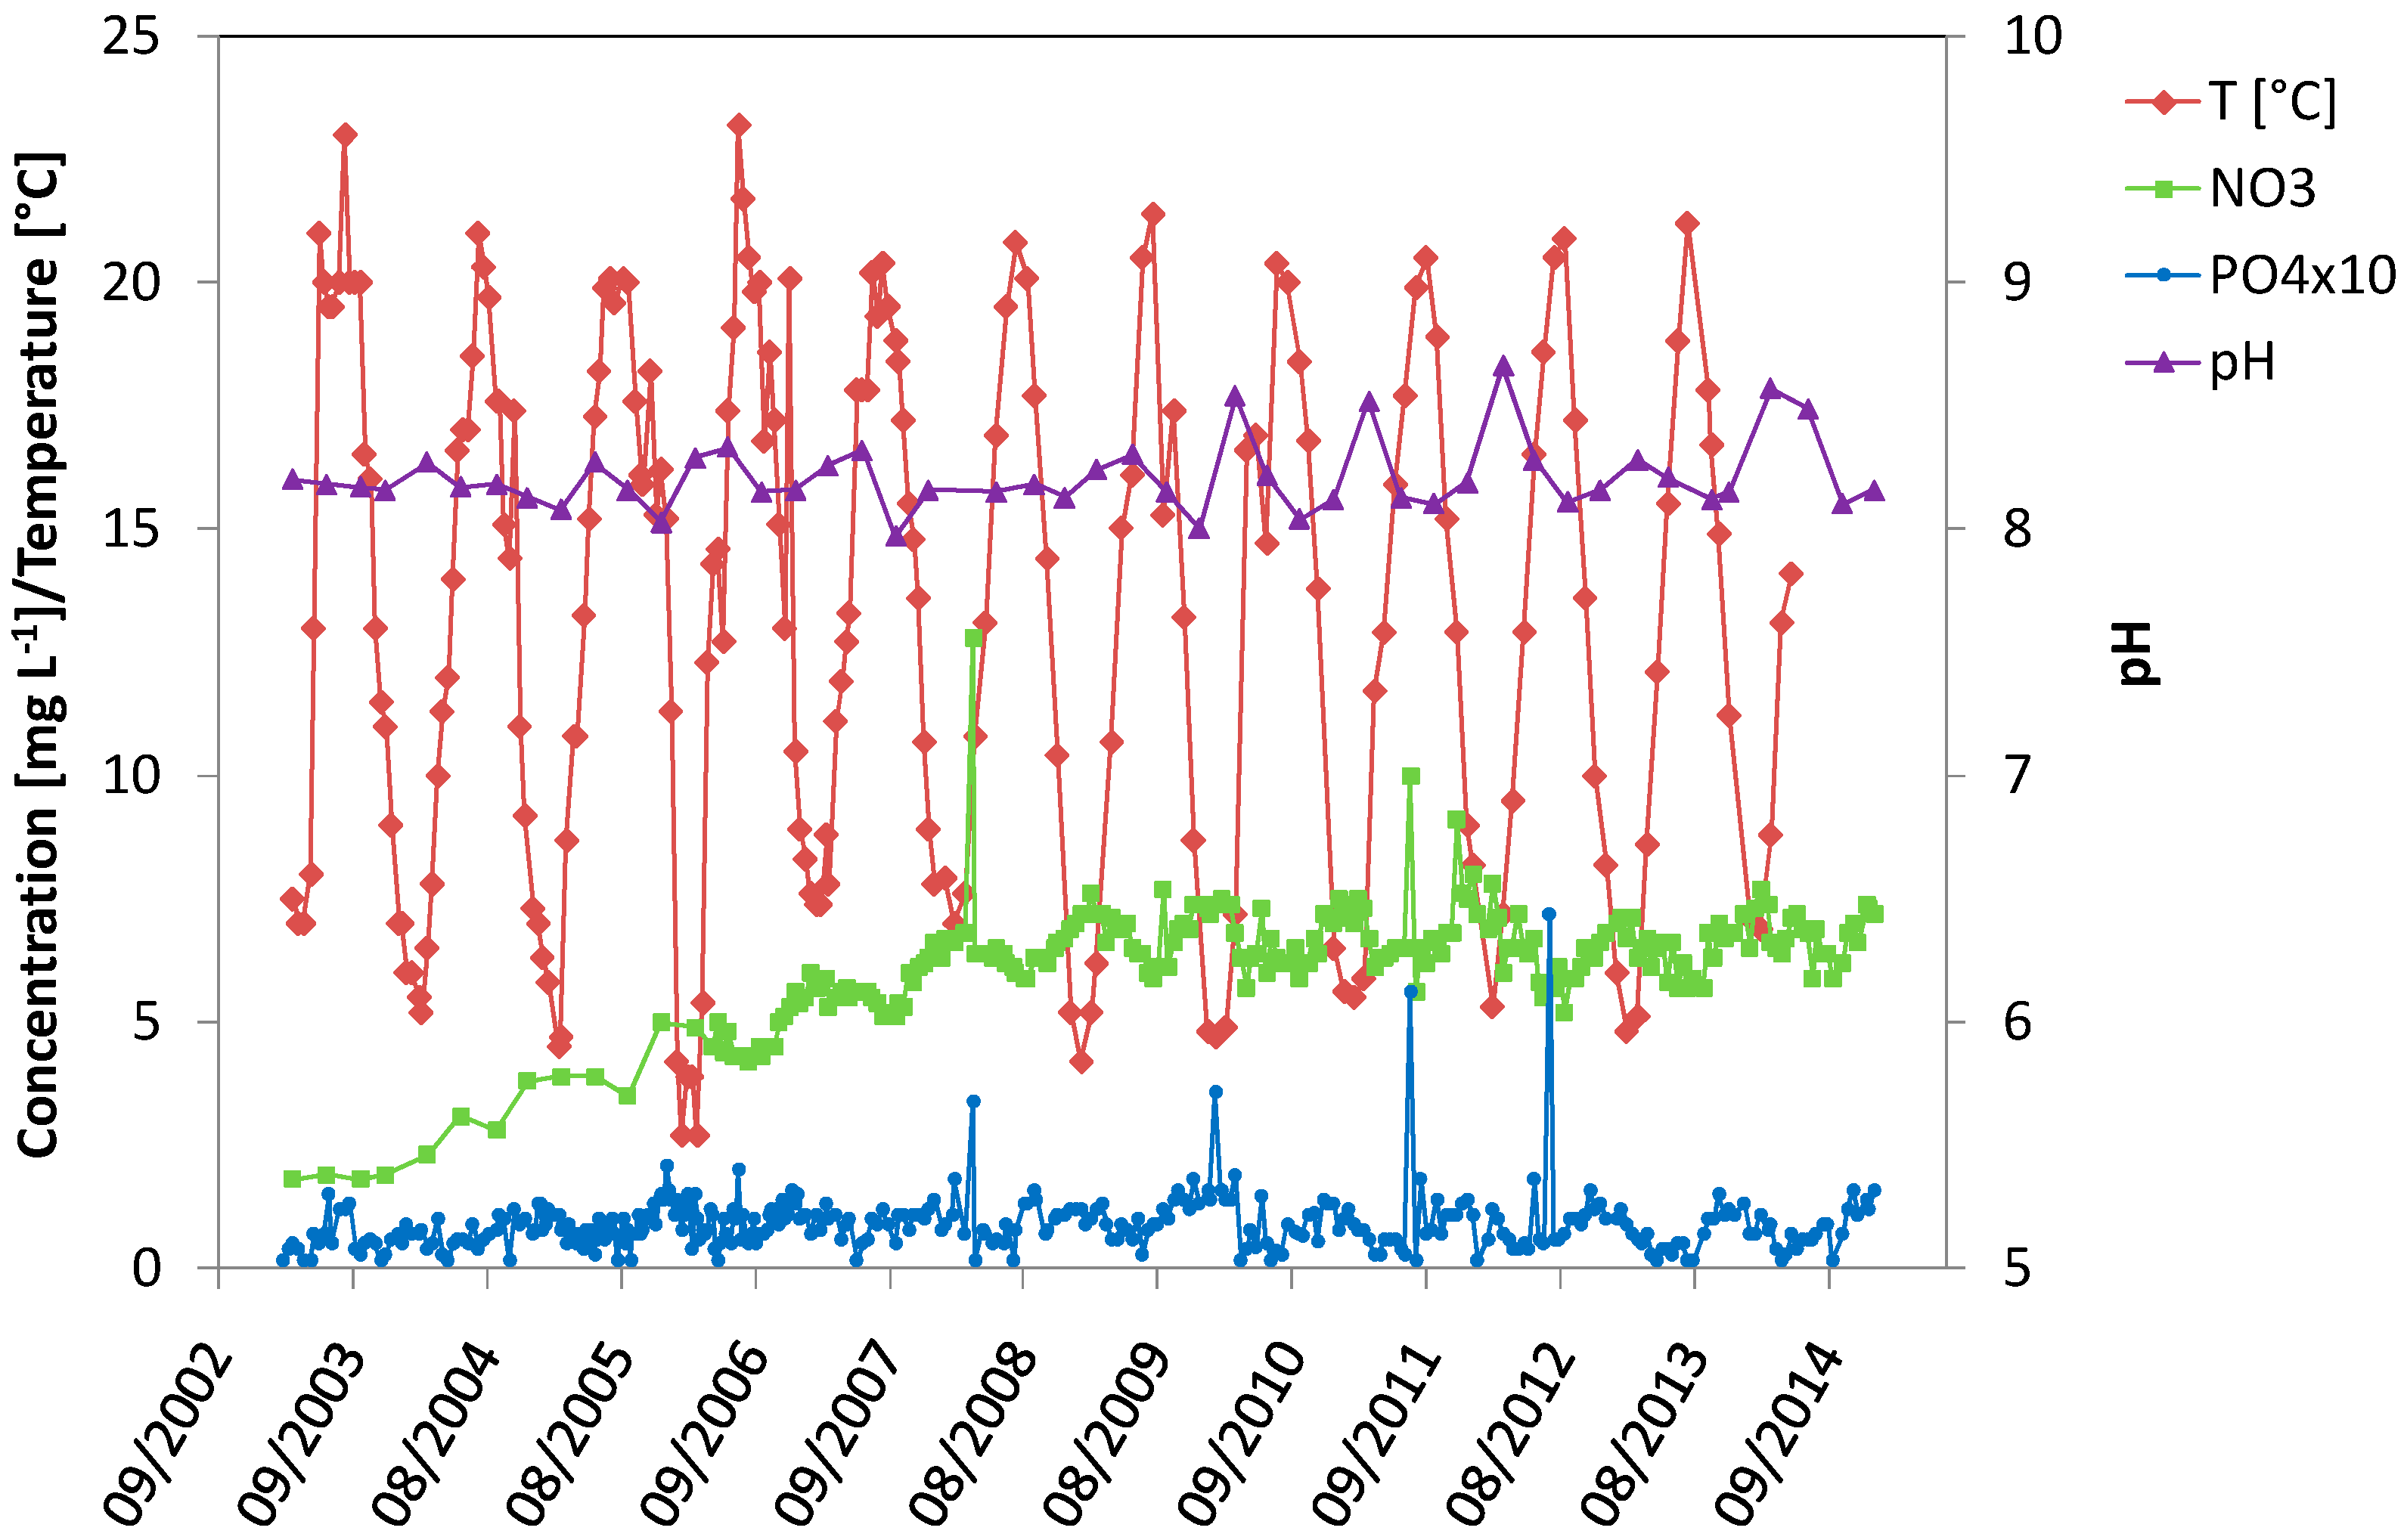
4.2. Seasonal Variations in BP Lake
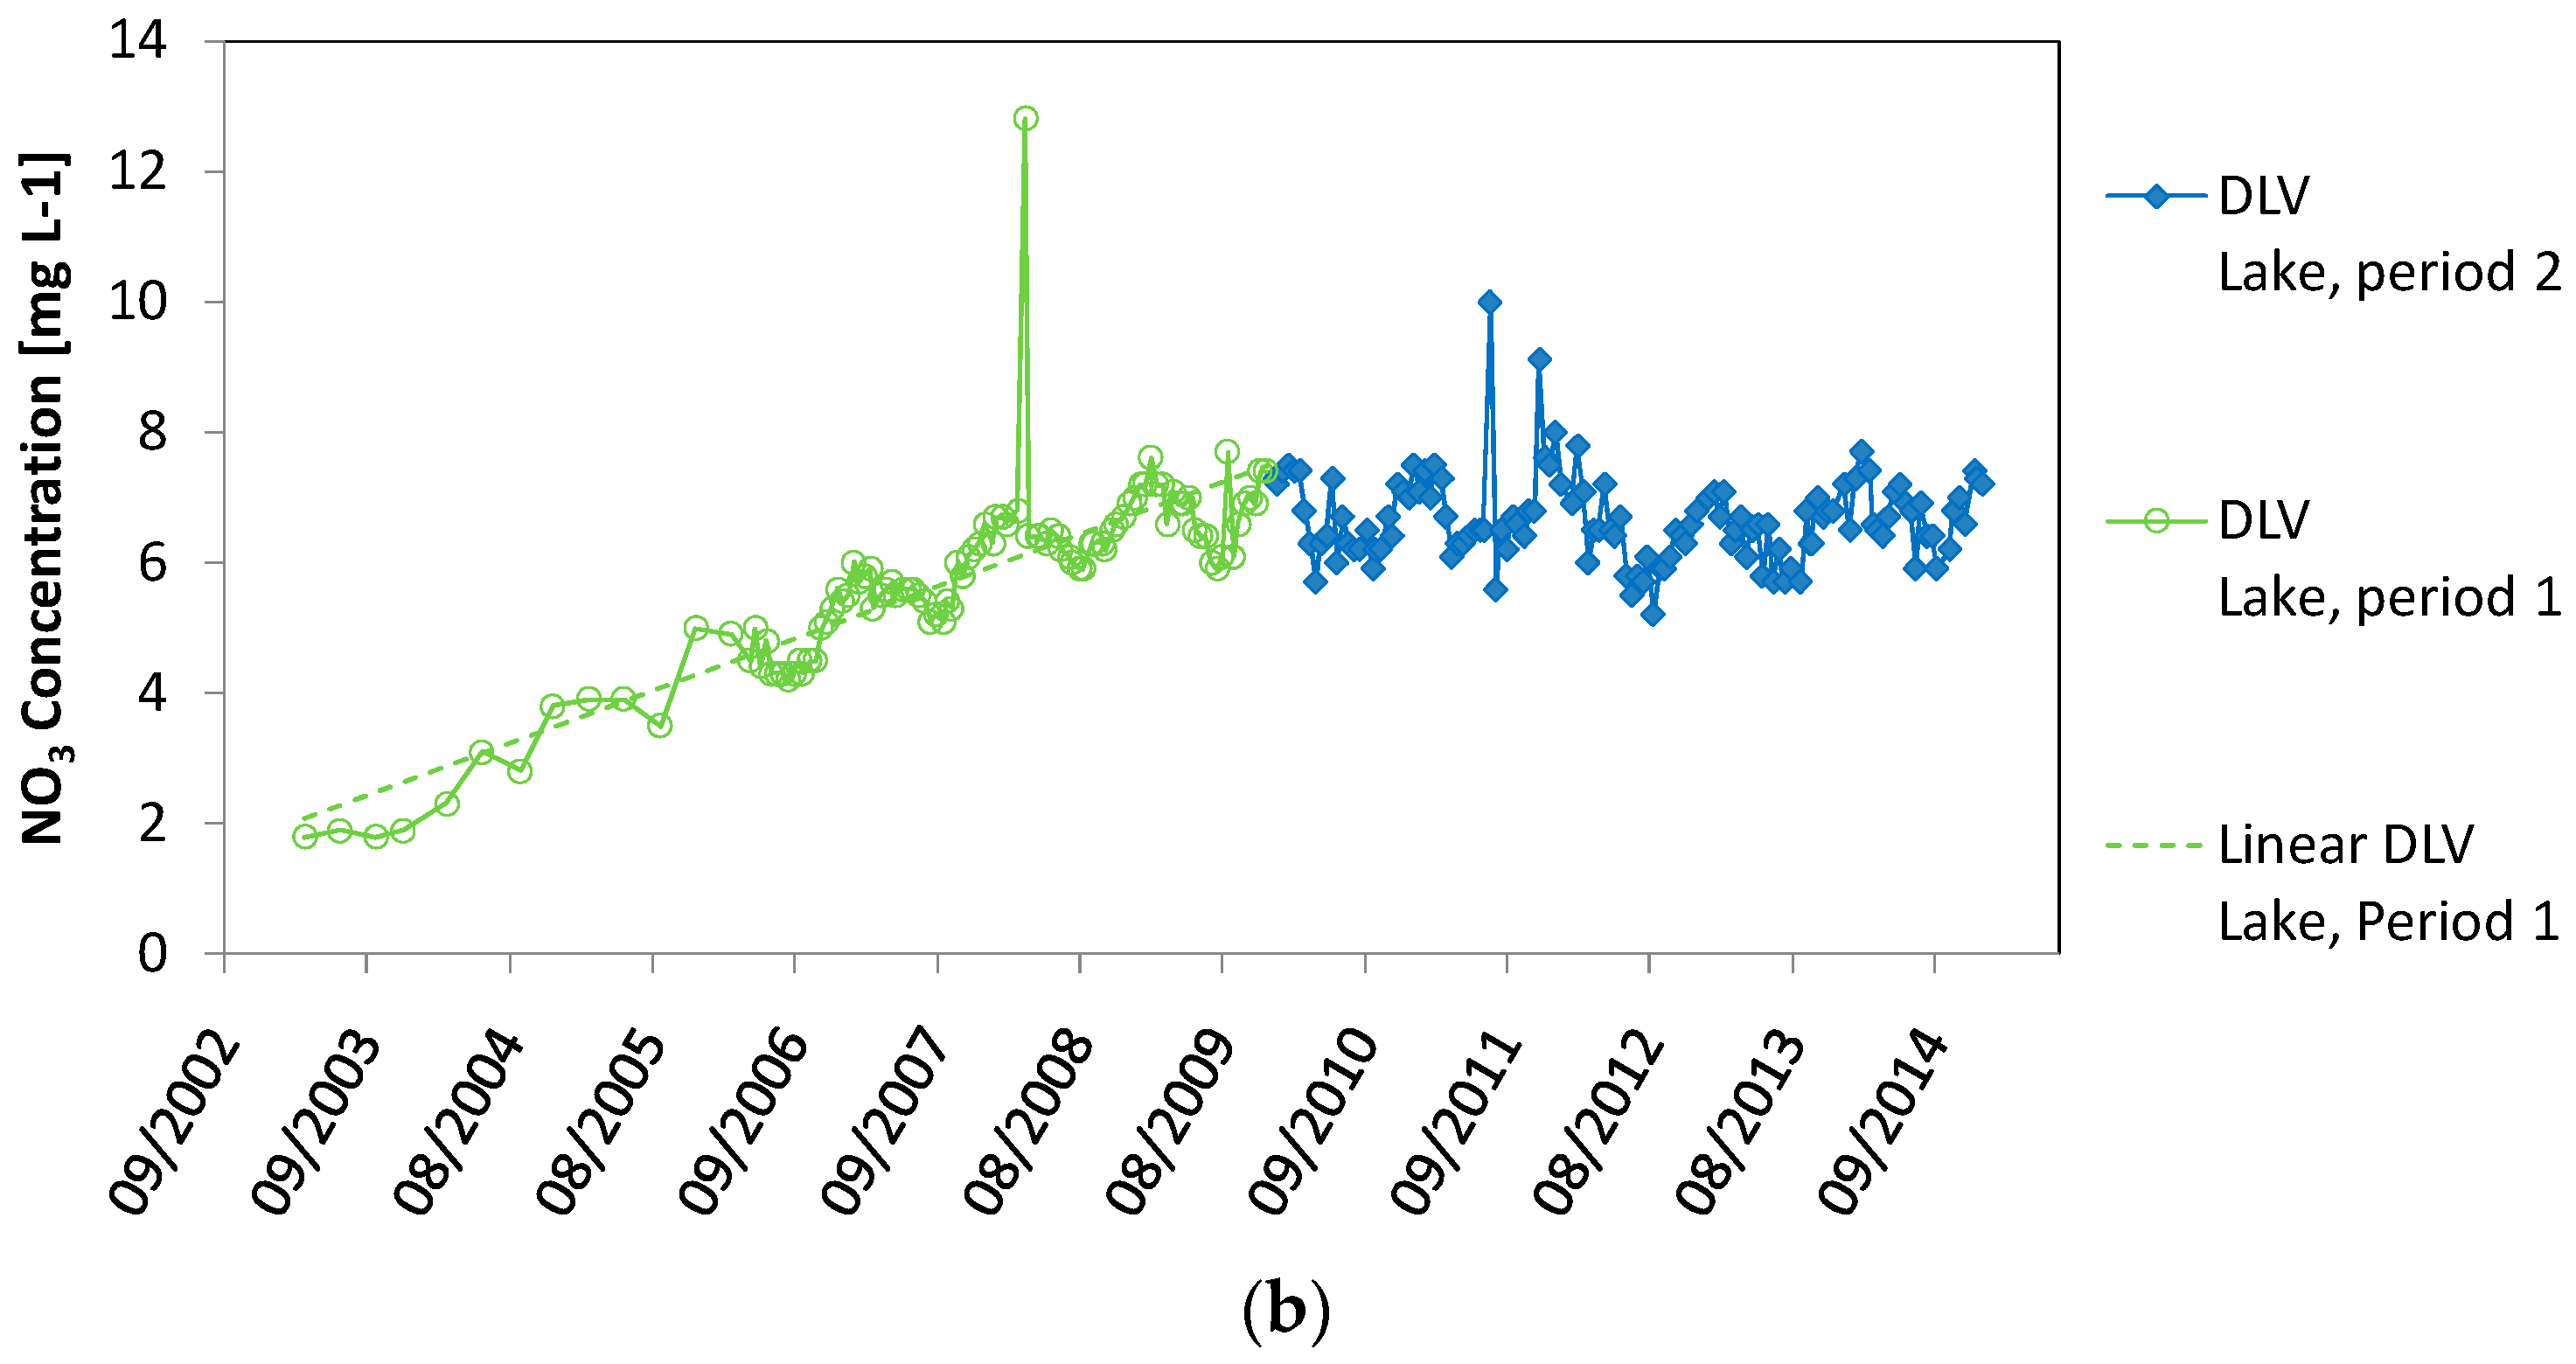
4.3. Seasonal Variations in DLV Lake
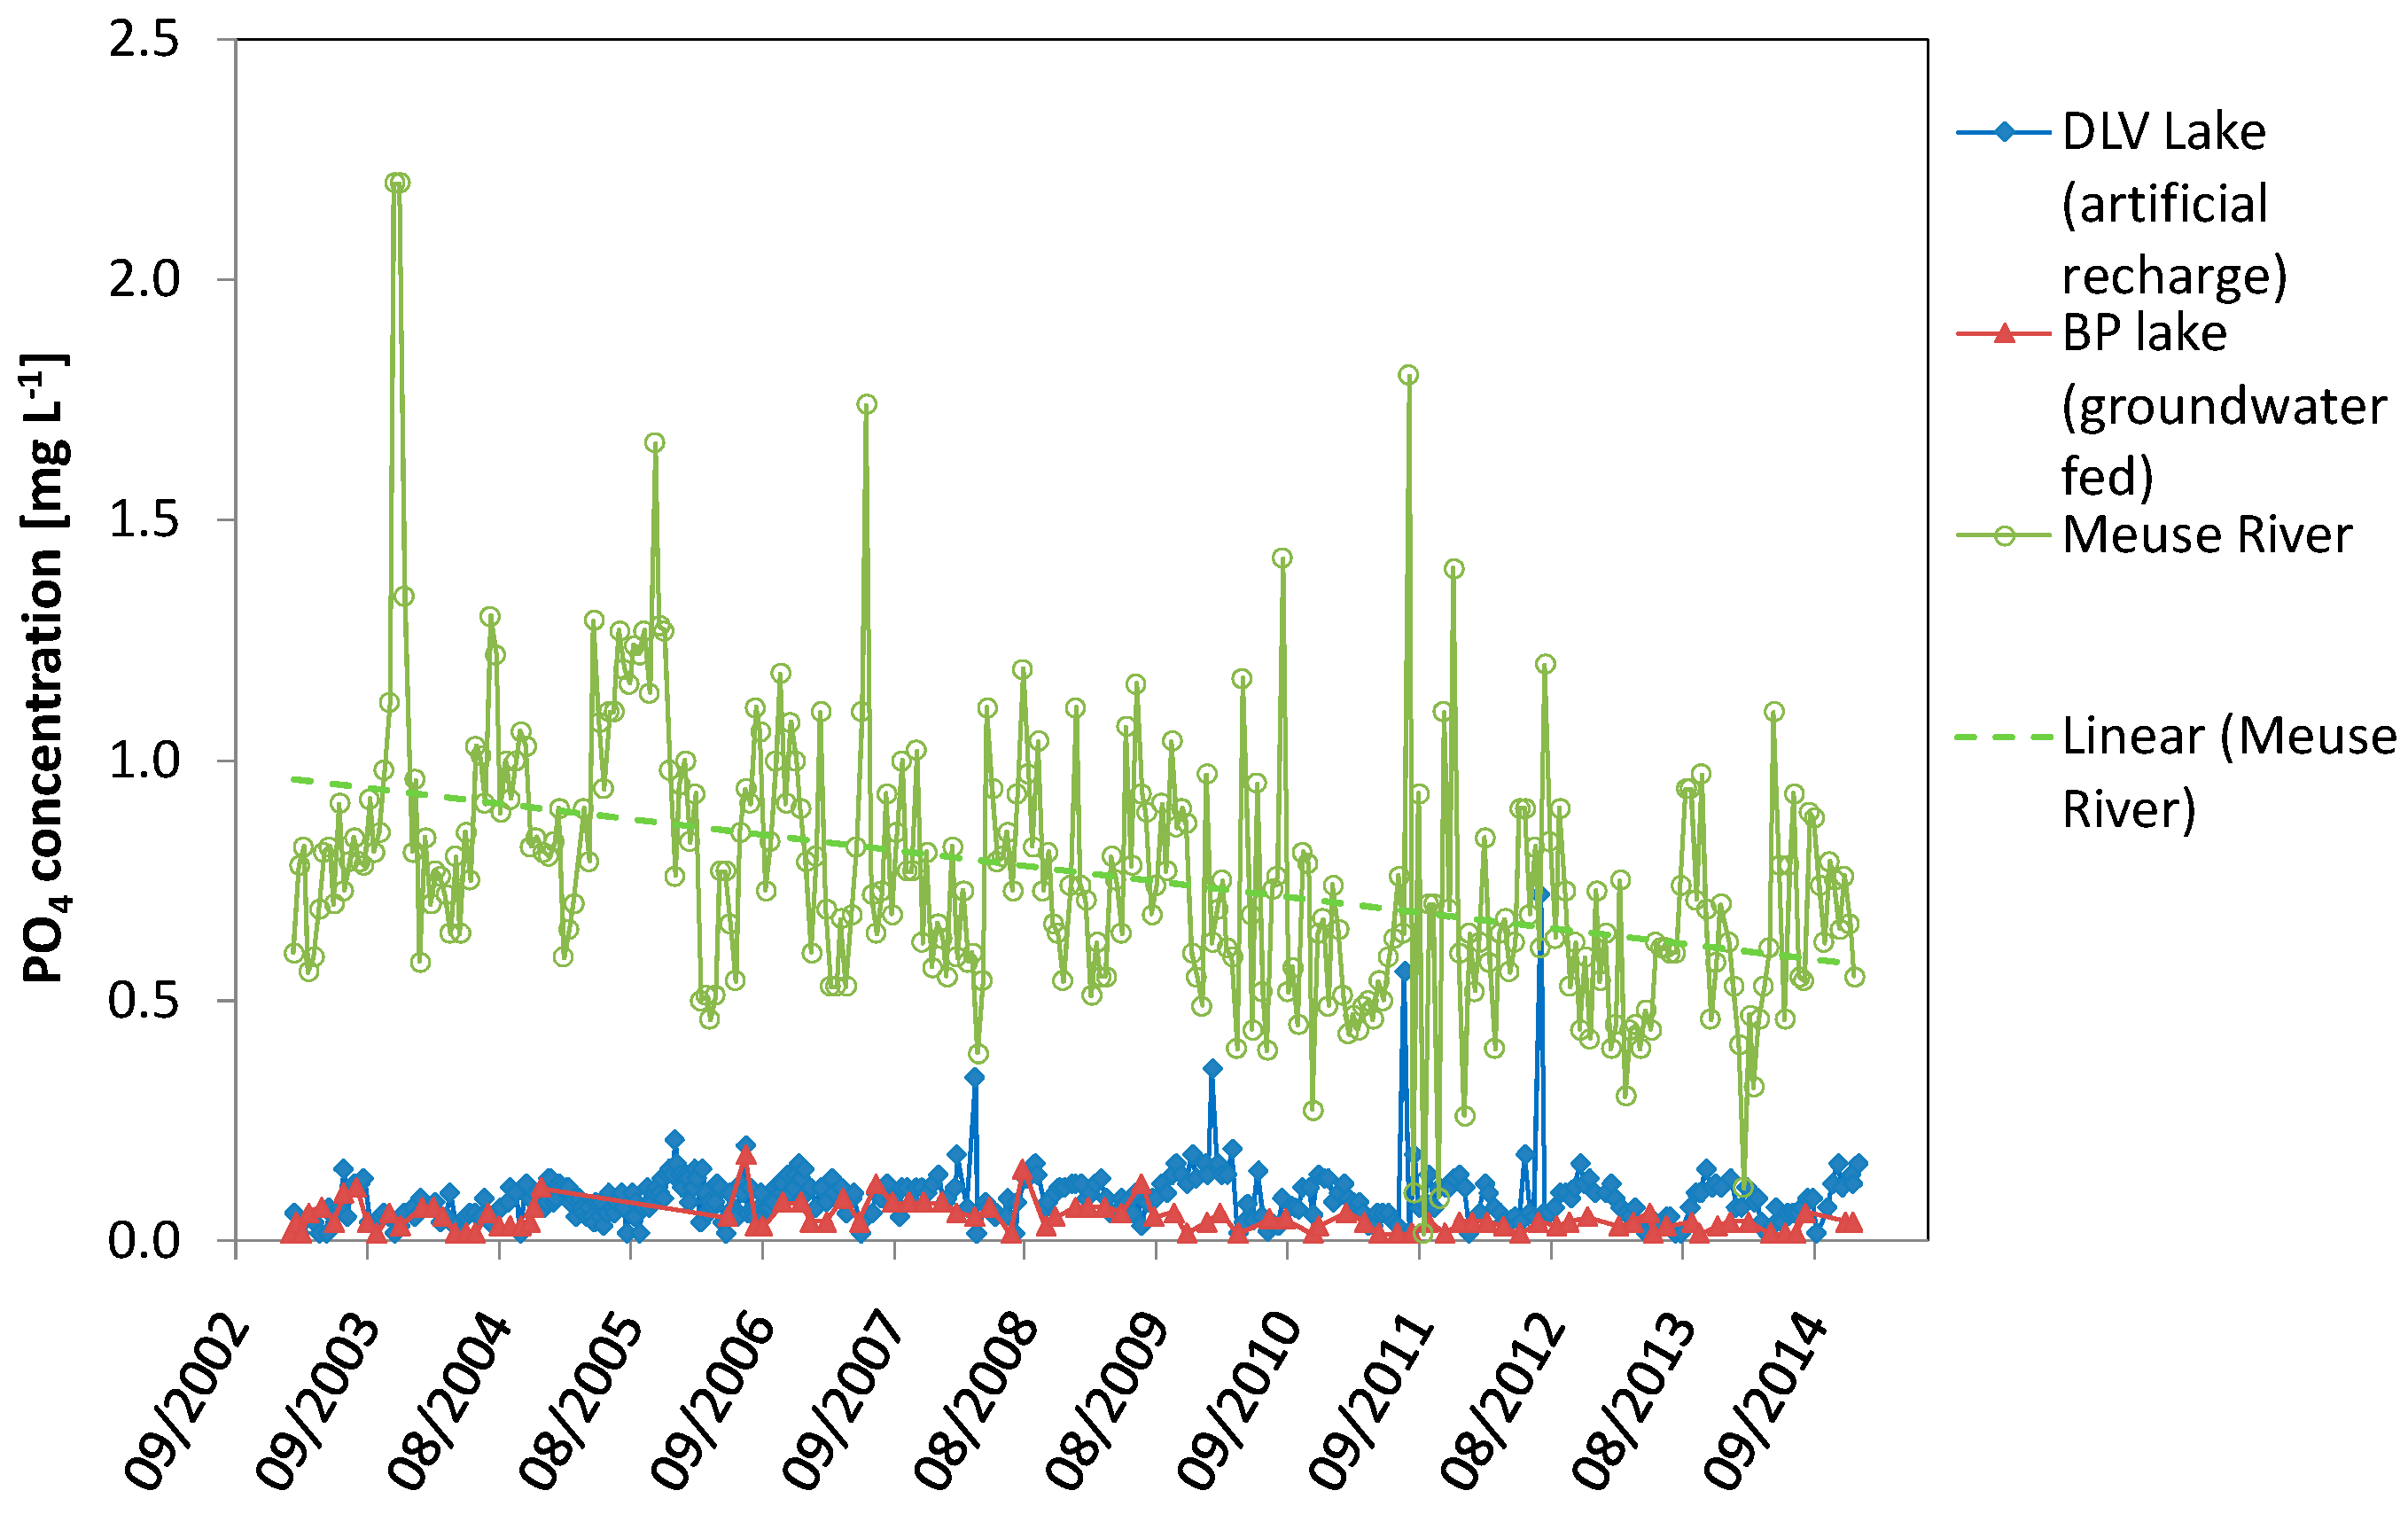
4.4. Comparison of BP Lake, DLV Lake and Meuse River
4.5. Linear Trend Analysis of Time Series
5. Discussion
5.1. Temperature
5.2. pH
5.3. NO3
5.4. PO4
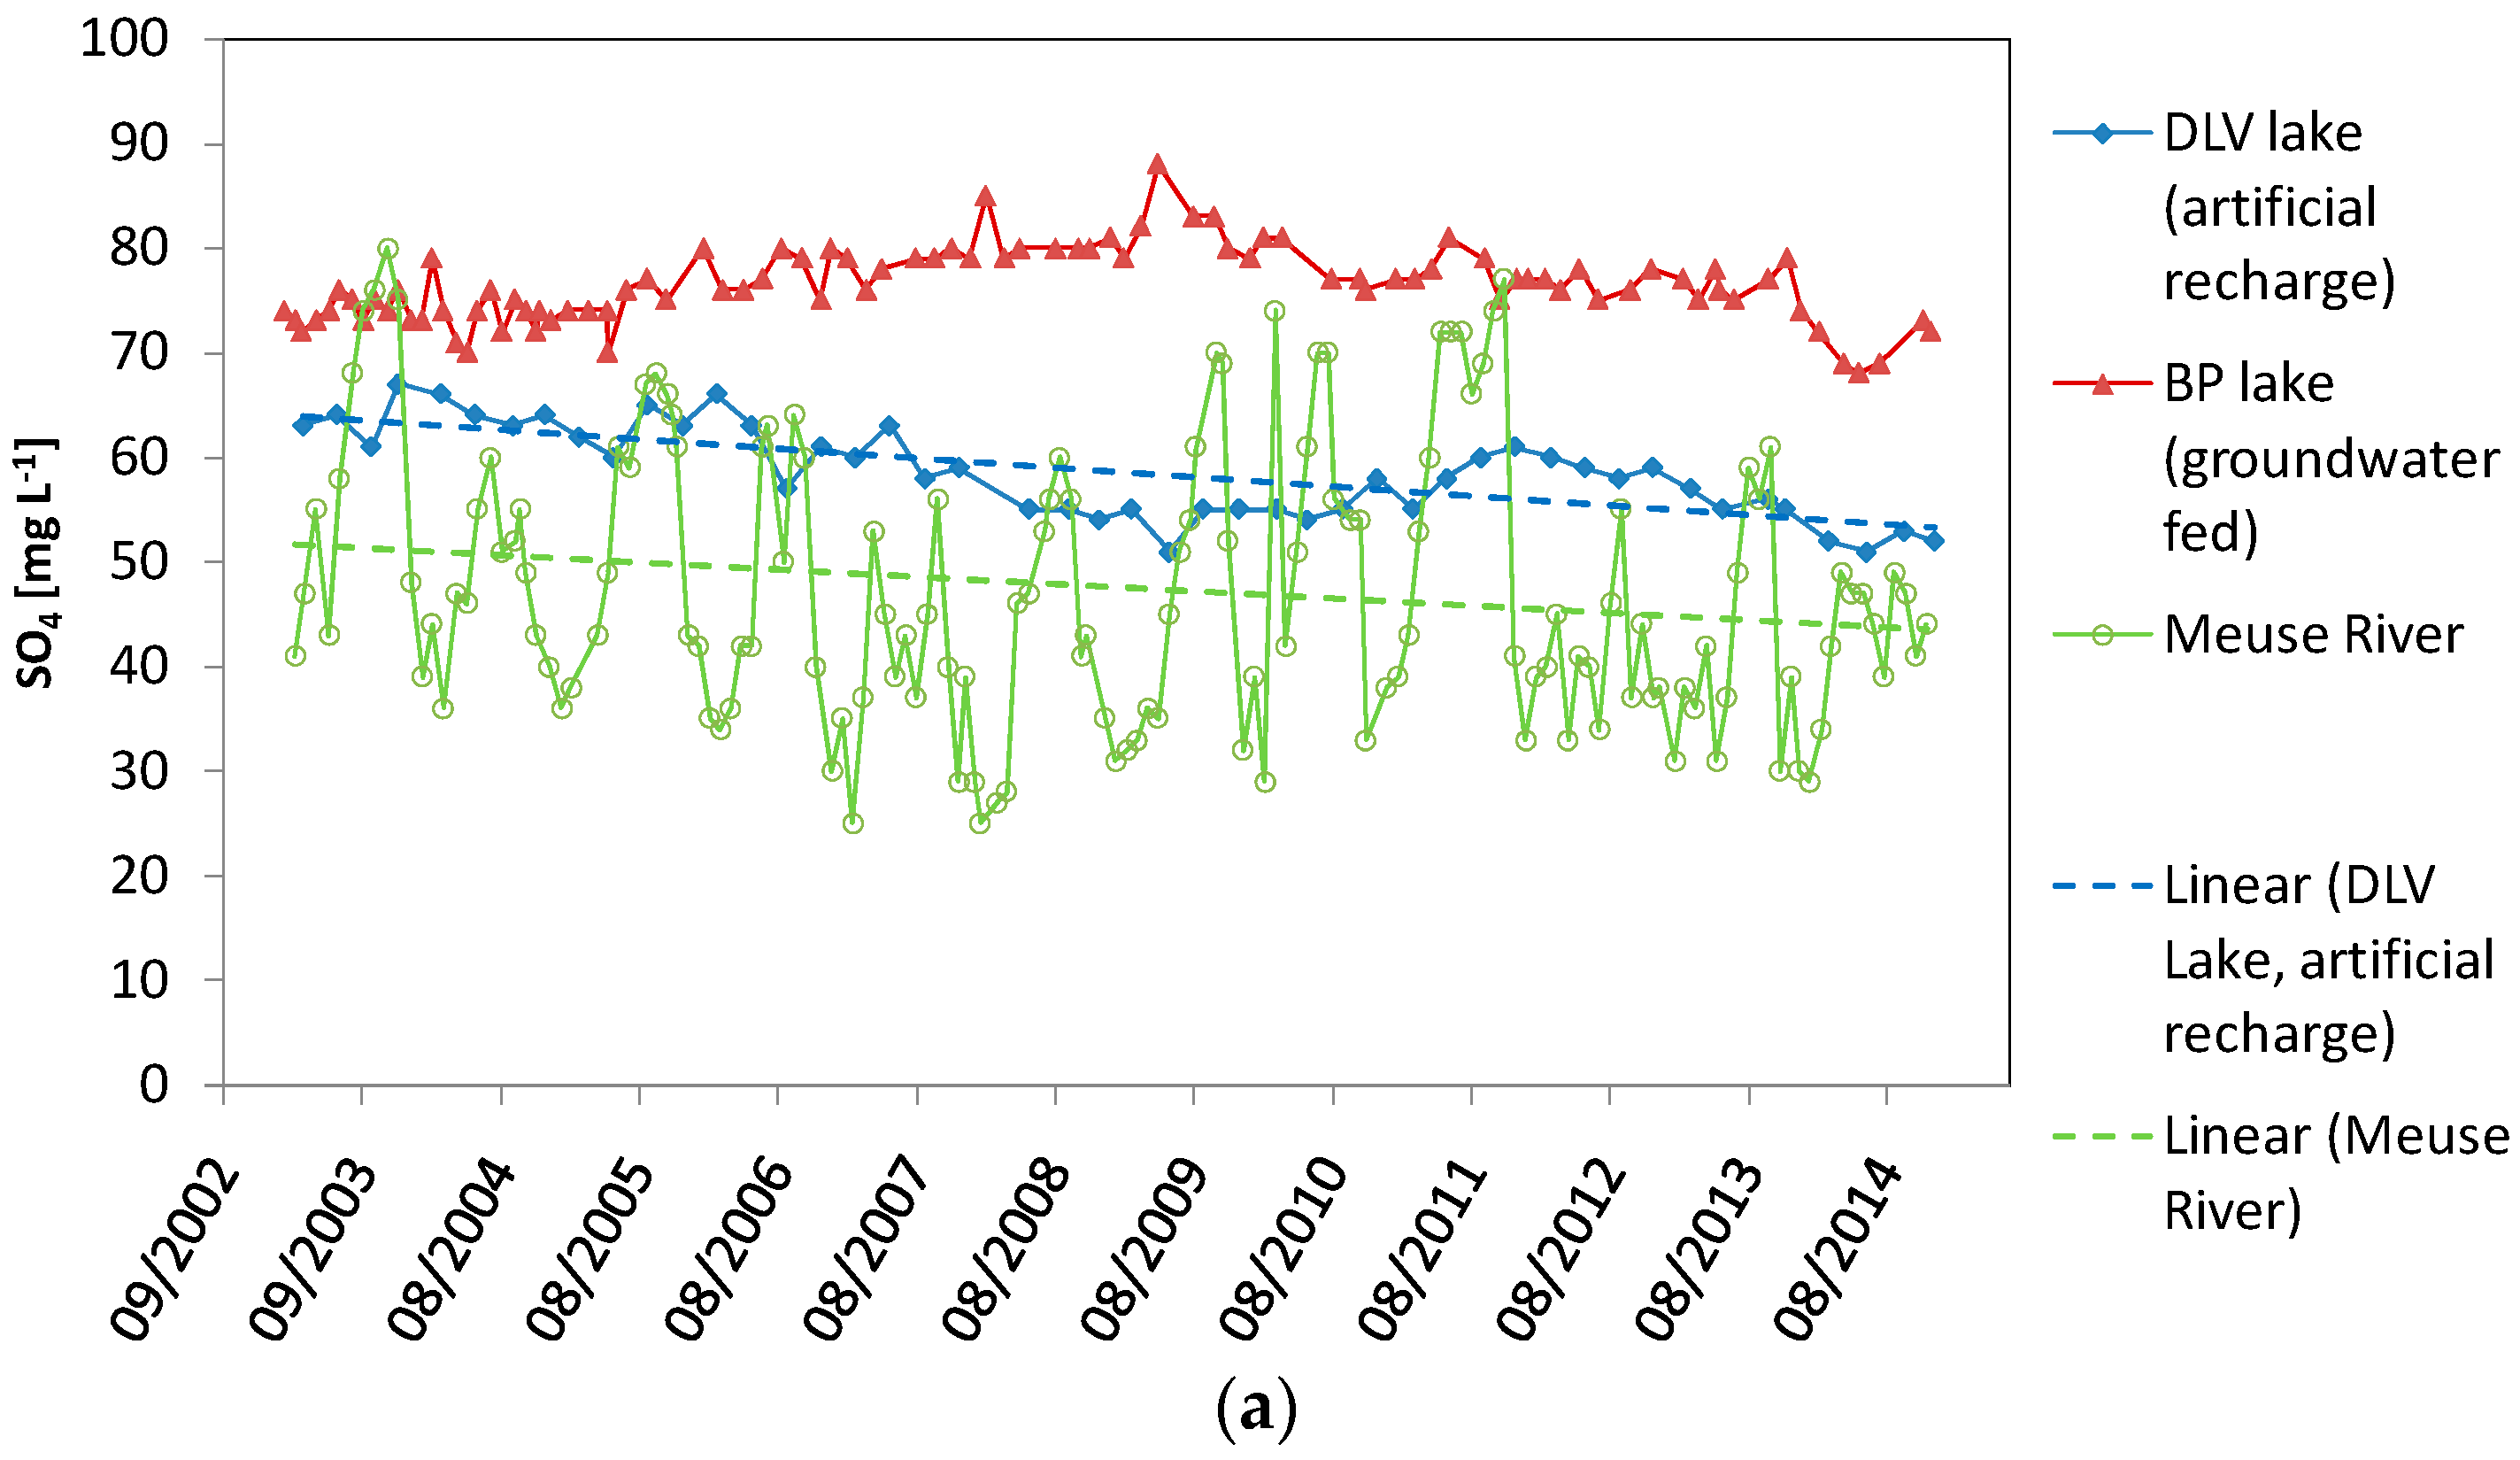
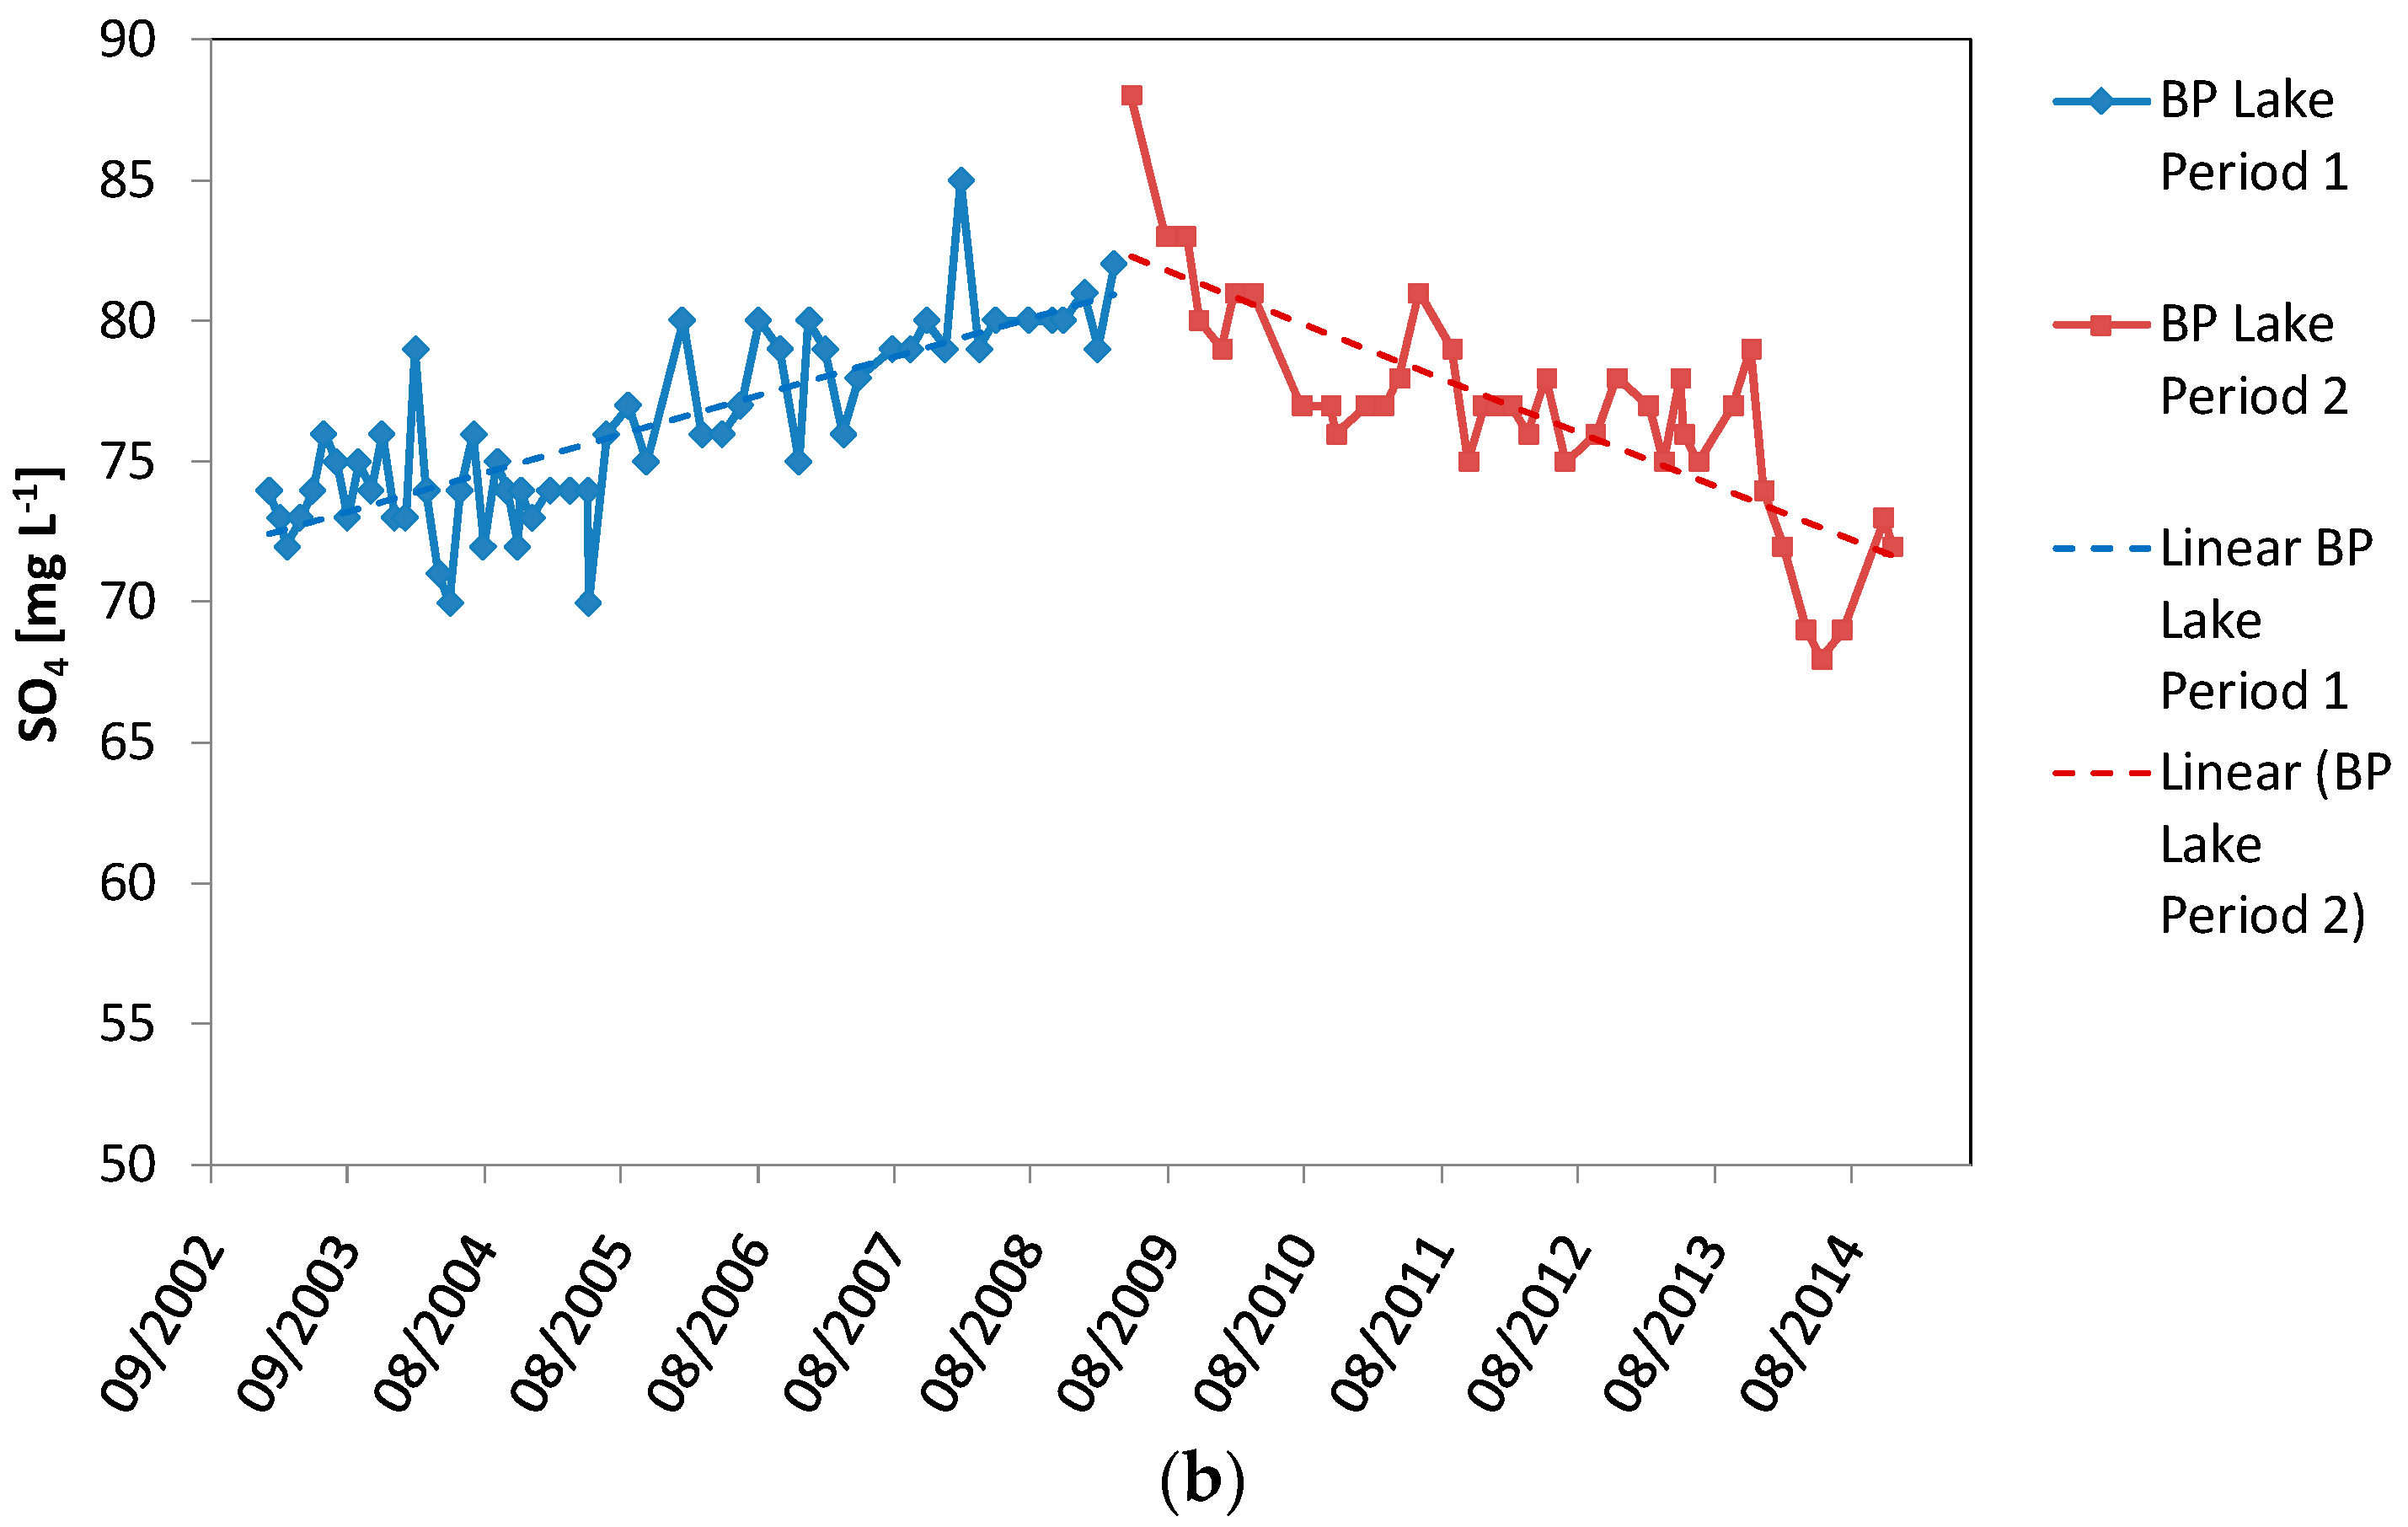
5.5. SO4
5.6. Effect of Artificial Recharge with River Water and of Air Blowers and Implications for Drinking Water Quality
6. Conclusions
Acknowledgments
Author Contributions
Conflicts of Interest
References
- Oude Essink, G.H.P.; van Baaren, E.S.; de Louw, P.G.B. Effects of climate change on coastal groundwater systems: A modeling study in the Netherlands. Water Resour. Res. 2010, 46, W00F04. [Google Scholar] [CrossRef]
- Stuyfzand, P.J. The impact of land reclamation on groundwater quality and future drinking water supply in The Netherlands. Water Sci. Technol. 1995, 31, 47–57. [Google Scholar] [CrossRef]
- Van Ek, R.; Witte, J.P.M.; Runhaar, J.; Klijn, F. Ecological effects of water management in The Netherlands: The model DEMNAT. Ecol. Eng. 2000, 16, 127–141. [Google Scholar] [CrossRef]
- Karlsen, R.H.; Smits, F.J.C.; Stuyfzand, P.J.; Olsthoorn, T.N.; van Breukelen, B.M. A post audit and inverse modeling in reactive transport: 50 years of artificial recharge in the Amsterdam Water Supply Dunes. J. Hydrol. 2012, 454–455, 7–25. [Google Scholar] [CrossRef]
- De Vet, W.W.J.M.; Van Genuchten, C.C.A.; Van Loosdrecht, M.C.M.; Van Dijk, J.C. Water quality and treatment of river bank filtrate Drink. Water Eng. Sci. 2010, 3, 79–90. [Google Scholar] [CrossRef]
- Mollema, P.N.; Antonellini, M. Water and (bio)chemical cycling in gravel pit lakes: A review and outlook. Earth-Sci. Rev. 2016, 159, 247–270. [Google Scholar] [CrossRef]
- Cross, I.D.; McGowan, S.; Needham, T.; Pointer, C.M. The effects of hydrological extremes on former gravel pit lake ecology: Management implications. Fundam. Appl. Limnol./Arch. Hydrobiol. 2014, 185, 71–90. [Google Scholar] [CrossRef]
- Weilhartner, A.; Muellegger, C.; Kainz, M.; Mathieu, F.; Hofmann, T.; Battin, T.J. Gravel pit lake ecosystems reduce nitrate and phosphate concentrations in the out flowing groundwater. Sci. Total Environ. 2012, 420, 222–228. [Google Scholar] [CrossRef] [PubMed]
- Muellegger, C.; Weilhartner, A.; Battin, T.J.; Hofmann, T. Positive and negative impacts of five Austrian gravel pit lakes on groundwater quality. Sci. Total Environ. 2013, 443, 14–23. [Google Scholar] [CrossRef] [PubMed]
- Seitzinger, S.; Harrison, J.A.; Böhlke, J.K.; Bouwman, A.F.; Lowrance, R.; Peterson, B.; Tobias, C.; Drecht, G.V. Denitrification across landscapes and waterscapes: A synthesis. Ecol. Appl. 2006, 16, 2064–2090. [Google Scholar] [CrossRef]
- Mollema, P.N.; Stuyfzand, P.J.; Juhasz-Holterman, M.H.A.; Van Diepenbeek, P.M.J.A.; Antonellini, M. Metal accumulation in an artificially recharged gravel pit lake used for drinking water supply. J. Geochem. Explor. 2015, 150, 35–51. [Google Scholar] [CrossRef]
- Søndergaard, M.; Larsen, S.E.; Johansson, L.S.; Lauridsen, T.; Jeppesen, E. Ecological classification of lakes: Uncertainty and the influence of year-to-year variability. Ecol. Indic. 2016, 61, 248–257. [Google Scholar] [CrossRef]
- United States Geological Survey (USGS). Mineral Commodity Summaries 2015: U.S. Geological Survey; USGS: Reston, VA, USA, 2015; 196p. 978-1-4113-3877-7.
- United States Geological Survey (USGS). National Minerals Information Center. Available online: http://minerals.usgs.gov/minerals/ (accessed on 18 November 2015).
- Statistics Netherlands (CBS); Planbureau voor de Leefomgeving (PBL); Wageningen University and Research Centre. Winning en Verbruik Van Oppervlaktedelfstoffen, 2000–2013; Indicator 0067, Versie 15; CBS: Den Haag, The Netherlands; Planbureau voor de Leefomgeving: Den Haag, The Netherlands; Bilthoven en Wageningen UR: Wageningen, The Netherlands, 21 April 2016; Available online: http://www.compendiumvoordeleefomgeving.nl (accessed on 21 April 2016).
- Juhasz-Holterman, M. Excavation and hydrological history of Middle Limburg (The Netherlands). In Ontgrindingsgeschiedenis en Wijziging Geohydrologie Midden-Limburg; WML Report Nr. 6884; NV WML Waterleiding Maatschappij Limburg: Maastricht, The Netherlands, 2012. [Google Scholar]
- Montgomery, D.C. Design and Analysis of Experiments, 7th ed.; Wiley: Hoboken, NJ, USA, 2009; ISBN 978-0-470-45687-3. [Google Scholar]
- Hsu, J. Multiple Comparisons: Theory and Methods; CRC Press: Boca Raton, FL, USA, 1996; 296p. [Google Scholar]
- Statistics Netherlands (CBS); Planbureau voor de Leefomgeving (PBL); Wageningen University and Research Centre. Temperatuur Oppervlaktewater, 1910–2013; Indicator 0566, Versie 2; CBS: Den Haag, The Netherlands; Planbureau voor de Leefomgeving: Den Haag, The Netherlands; Bilthoven en Wageningen UR: Wageningen, The Netherlands, 3 June 2014; Available online: http://www.compendiumvoordeleefomgeving.nl (accessed on 25 May 2016).
- Han, Q.; Zhang, S.; Huang, G.; Zhang, R. Analysis of Long-Term Water Level Variation in Dongting Lake, China. Water 2016, 8, 306–327. [Google Scholar] [CrossRef]
- Maberly, S.C. Diel, episodic and seasonal changes in pH and concentrations of inorganic carbon in a productive lake. Freshw. Biol. 1996, 35, 579–598. [Google Scholar] [CrossRef]
- Smyntek, P.M.; Maberly, S.C.; Grey, J. Dissolved carbon dioxide concentration controls baseline stable carbon isotope signatures of a lake food web. Limnol. Oceanogr. 2012, 57, 1292–1302. [Google Scholar] [CrossRef]
- Caroll, J.J.; Slupsky, J.D.; Mather, A.D. The solubility of CO2 in water at low pressure. J. Phys. Chem. Ref. Data 1991, 20, 1201–1208. [Google Scholar] [CrossRef]
- European Parliament, Council of the European Union. The Groundwater Directive 2006/118/EC Developed in Response to the Requirements of Article 17 of the Water Framework Directive; European Parliament, Council of the European Union: Brussels, Belgium, 2006. [Google Scholar]
- Jeppesen, E.; Sondergaard, M.; Jensen, J.P.; Havens, K.E.; Anneville, O.; Carvalho, L.; Coveney, M.F.; Deneke, R.; Dokulil, M.; Foy, B.; et al. Lake responses to reduced nutrient loading an analysis of contemporary long-term data from 35 case studies. Freshw. Biol. 2005, 50, 1747–1771. [Google Scholar] [CrossRef]
- European Environment Agency (EEA). Nutrients in Freshwater. Available online: http://www.eea.europa.eu/data-and-maps/indicators/nutrients-in-freshwater/nutrients-in-freshwater-assessment-published-6 (accessed on 29 April 2016).
- Mollema, P.N.; Antonellini, M.; Dinelli, E.; Greggio, N.; Stuyfzand, P.J. The influence of flow-through saline gravel pit lakes on the hydrologic budget and hydrochemistry of a Mediterranean drainage basin. Limnol. Oceanogr. 2015, 60, 2009–2025. [Google Scholar] [CrossRef]
- NV WML Waterleiding Maatschappij Limburg. Availability of Phosphate in the de lange Vlieter retention basin. In Fosfaatbeschikbaarheid in SpaarbekkenLange Vlieterte Heel Situatie; Rapport nr. 6762; NV WML Waterleiding Maatschappij Limburg: Maastricht, The Netherlands, 2010. [Google Scholar]
- Jensen, J.P.; Pedersen, A.R.; Jeppesen, E.; Søndergaard, M. An empirical model describing the seasonal dynamics of phosphorus in 16 shallow eutrophic lakes after external loading reduction. Limnol. Oceanogr. 2006, 51, 791–800. [Google Scholar] [CrossRef]
- Søndergaard, M.; Jensen, J.P.; Jeppesen, E. Role of sediment and internal loading of phosphorus in shallow lakes. Hydrobiologia 2003, 506, 135–145. [Google Scholar] [CrossRef]
- Søndergaard, M.; Jensen, J.P.; Jeppesen, E. Seasonal response of nutrients to reduced phosphorus loading in 12 Danish lakes. Freshw. Biol. 2005, 50, 1605–1615. [Google Scholar] [CrossRef]
- Søndergaard, M.; Jensen, J.P.; Jeppesen, E.; Hald Moller, P. Seasonal dynamics in the concentrations and retention of phosphorus in shallow Danish lakes after reduced loading. Aquat. Ecosyst. Health Manag. 2002, 5, 19–29. [Google Scholar] [CrossRef]
- Lewicka-Szczebak, D.; Trojanowska, A.; Drzewicki, W.; Gorka, M.; Jedrysek, M.-O.; Jezierski, P.; Kurasiewicz, M.; Krajniak, J. Sources and sinks of sulphate dissolved in lake water of a dam reservoir: S and O isotopic approach. Appl. Geochem. 2009, 24, 1941–1950. [Google Scholar] [CrossRef]
- European Chemicals Agency (ECHA). Substance Information (Ammonium Sulphate). Available online: http://www.echa.europa.eu/web/guest/substance-information/-/substanceinfo/100.029.076 (accessed on 14 June 2016).
- Peeters, L.; Haerens, B.; Van der Sluys, J.; Dassargues, A. Modelling seasonal variations in nitrate and sulphate concentrations in a vulnerable alluvial aquifer. Environ. Geol. 2004, 46, 951–961. [Google Scholar] [CrossRef]
- Xiaoqian, L.; Gana, Y.; Zhou, A.; Liua, Y.; Wang, D. Hydrological controls on the sources of dissolved sulphate in the Heihe river, a large inland river in the arid north western China, inferred from S and O isotopes. Appl. Geochem. 2013, 35, 99–109. [Google Scholar]
- Appelo, C.A.J.; Postma, D. Geochemistry, Groundwater and Pollution, 2nd ed.; CRC Press: New York, NY, USA, 2005; 649p. [Google Scholar]
- Jeppesen, E.; Meerhoff, M.; Davidson, T.A.; Trolle, D.; Søndergaard, M.; Lauridsen, T.L.; Beklioglu, M.; Brucet, S.; Volta, P.; González-Bergonzoni, I.; et al. Climate change impacts on lakes: An integrated ecological perspective based on a multi-faceted approach, with special focus on shallow lakes. J. Limnol. 2014, 73, 88–111. [Google Scholar] [CrossRef] [Green Version]
- Jeppesen, E.; Brucet, S.; Naselli-Flores, L.; Papastergiadou, E.; Stefanidis, K.; Nõges, T.; Nõges, P.; Attayde, J.L.; Zohary, T.; Coppens, J.; et al. Ecological impacts of global warming and water abstraction on lakes and reservoirs due to changes in water level and related changes in salinity. Hydrobiologia 2015, 750, 201–227. [Google Scholar] [CrossRef]
- NV WML Waterleiding Maatschappij Limburg. The limnological situation of de Lange Vlieter in 2010. In De Limnologische Toestandvan de Lange Vlieter in 2010; Rapport nr. 6801; NV WML Waterleiding Maatschappij Limburg: Maastricht, The Netherlands, 2010. [Google Scholar]
- Jeppesen, E.; Kronvang, B.; Meerhoff, M.; Sondergaard, M.; Hansen, K.M.; Andersen, H.E.; Lauridsen, T.L.; Liboriussen, L.; Beklioglu, M.; Ozen, A.; et al. Climate change effects on runoff, catchment phosphorus loading and lake ecological state, and potential adaptations. J. Environ. Qual. 2009, 38, 1930–1941. [Google Scholar] [CrossRef] [PubMed]
- Visser, A.; Kroes, J.; van Vliet, M.T.H.; Blenkinsop, S.; Fowler, H.J.; Broers, H.P. Climate Change Impacts on the Leaching of a heavy metal contamination in a small lowland catchment. J. Contam. Hydrol. 2012, 127, 47–64. [Google Scholar] [CrossRef] [PubMed]
- Bustos-Medina, D.; van den Berg, G.A.; van Breukelen, B.M.; Juhasz-Holterman, M.; Stuyfzand, P.J. Iron hydroxide clogging of public supply wells receiving artificial recharge: Near-well and in-well hydrological and hydrochemical observations. Hydrogeol. J. 2013, 21, 1393–1412. [Google Scholar] [CrossRef]
- Stuyfzand, P.J.; Juhàsz-Holterman, M.H.A.; De Lange, W.J. Riverbank Filtration in the Netherlands: Well Fields, Clogging and Geochemical Reactions. In Riverbank Filtration Hydrology; Nato Science Series: IV: Earth and Environmental Sciences; Springer: Rotterdam, The Netherlands, 2004; Volume 60, pp. 119–153. [Google Scholar]
- Weiske, A.; Schaller, J.; Hegewald, T.; Kranz, U.; Feger, K.-H.; Werner, I.; Dudel, G. Changes in catchment conditions lead to enhanced remobilization of arsenic in a water reservoir. Sci. Total Environ. 2013, 449, 63–70. [Google Scholar] [CrossRef] [PubMed]
- Roy, P.K.; Majumder, A.; Banerjee, G.; Roy, M.B.; Pal, S.; Mazumdar, A. Removal of arsenic from drinking water using dual treatment process. Clean Technol. Environ. Policy 2015, 17, 1065. [Google Scholar] [CrossRef]
- Gerke, T.L.; Little, B.J.; Maynarda, J.B. Manganese deposition in drinking water distribution systems. Sci. Total Environ. 2016, 541, 184–193. [Google Scholar] [CrossRef] [PubMed]
- Serrano, M.; Montesinos, I.; Cardador, M.J.; Silva, M.; Gallego, M. Seasonal evaluation of the presence of 46 disinfection by-products throughout a drinking water treatment plant. Sci. Total Environ. 2015, 517, 246–258. [Google Scholar] [CrossRef] [PubMed]
- Bai, X.; Ma, X.; Xu, F.; Li, J.; Zhang, H.; Xiao, X. The drinking water treatment process as a potential source of affecting the bacterial antibiotic resistance. Sci. Total Environ. 2015, 533, 24–31. [Google Scholar] [CrossRef] [PubMed]
- World Health Organization. Management of Cyanobacteria in Drinking-Water Supplies: Information for Regulators and Water Suppliers; Technical Brief 2015; WHO/FWC/WSH/15.03; World Health Organization: Geneva, Switzerland, 2015. [Google Scholar]


| De Lange Vlieter (DLV) Lake | Boschmolen Plas (BP) Lake | |
|---|---|---|
| Surface area | 123 ha | 104 ha |
| Maximum depth | 35 m | 25–30 m |
| Water residence time * | 1.5 years | 4.5 years |
| Current use | Artificial Recharge and drinking water production | Recreation: water front housing |
| Summer Stratification | No | Yes |
| Air blowers | 9 | 0 |
| Temperature (T) | DLV Lake (Artificial Recharge) | BP Lake (Groundwater Fed) | Meuse River |
|---|---|---|---|
| Range in T (°C) | 2.7–23.2 | 2.9–24.7 | 3.2–25.0 |
| Mean T and (standard deviation) (°C) | 13.3 (5.5) | 12.3 (6.0) | 14.0 (5.7) |
| Range summer maximum T (°C) | 19.9–23.2 | 19.9–24.7 | 20.0–25.0 |
| Range winter minimum T (°C) | 2.7–7.6 | 2.9–6.5 | 3.2–9.1 |
| Timing maximum T | 15/7–31/8 | 15/7–31/8 | 15/7–31/8 |
| Timing minimum T | 30/1–15/3 | 30/1–15/3 | 30/1–15/3 |
| Number of samples n | 215 | 94 | 153 |
| Linear regression R2 | 0.001 | 0.002 | 0.00001 |
| Linear regression p | 0.69 | 0.71 | 0.84 |
| Linear regression trend over time | No significant trend | No significant trend | No significant trend |
| Acidity pH | DLV Lake (Artificial Recharge) | BP Lake (Groundwater Fed) | Meuse River |
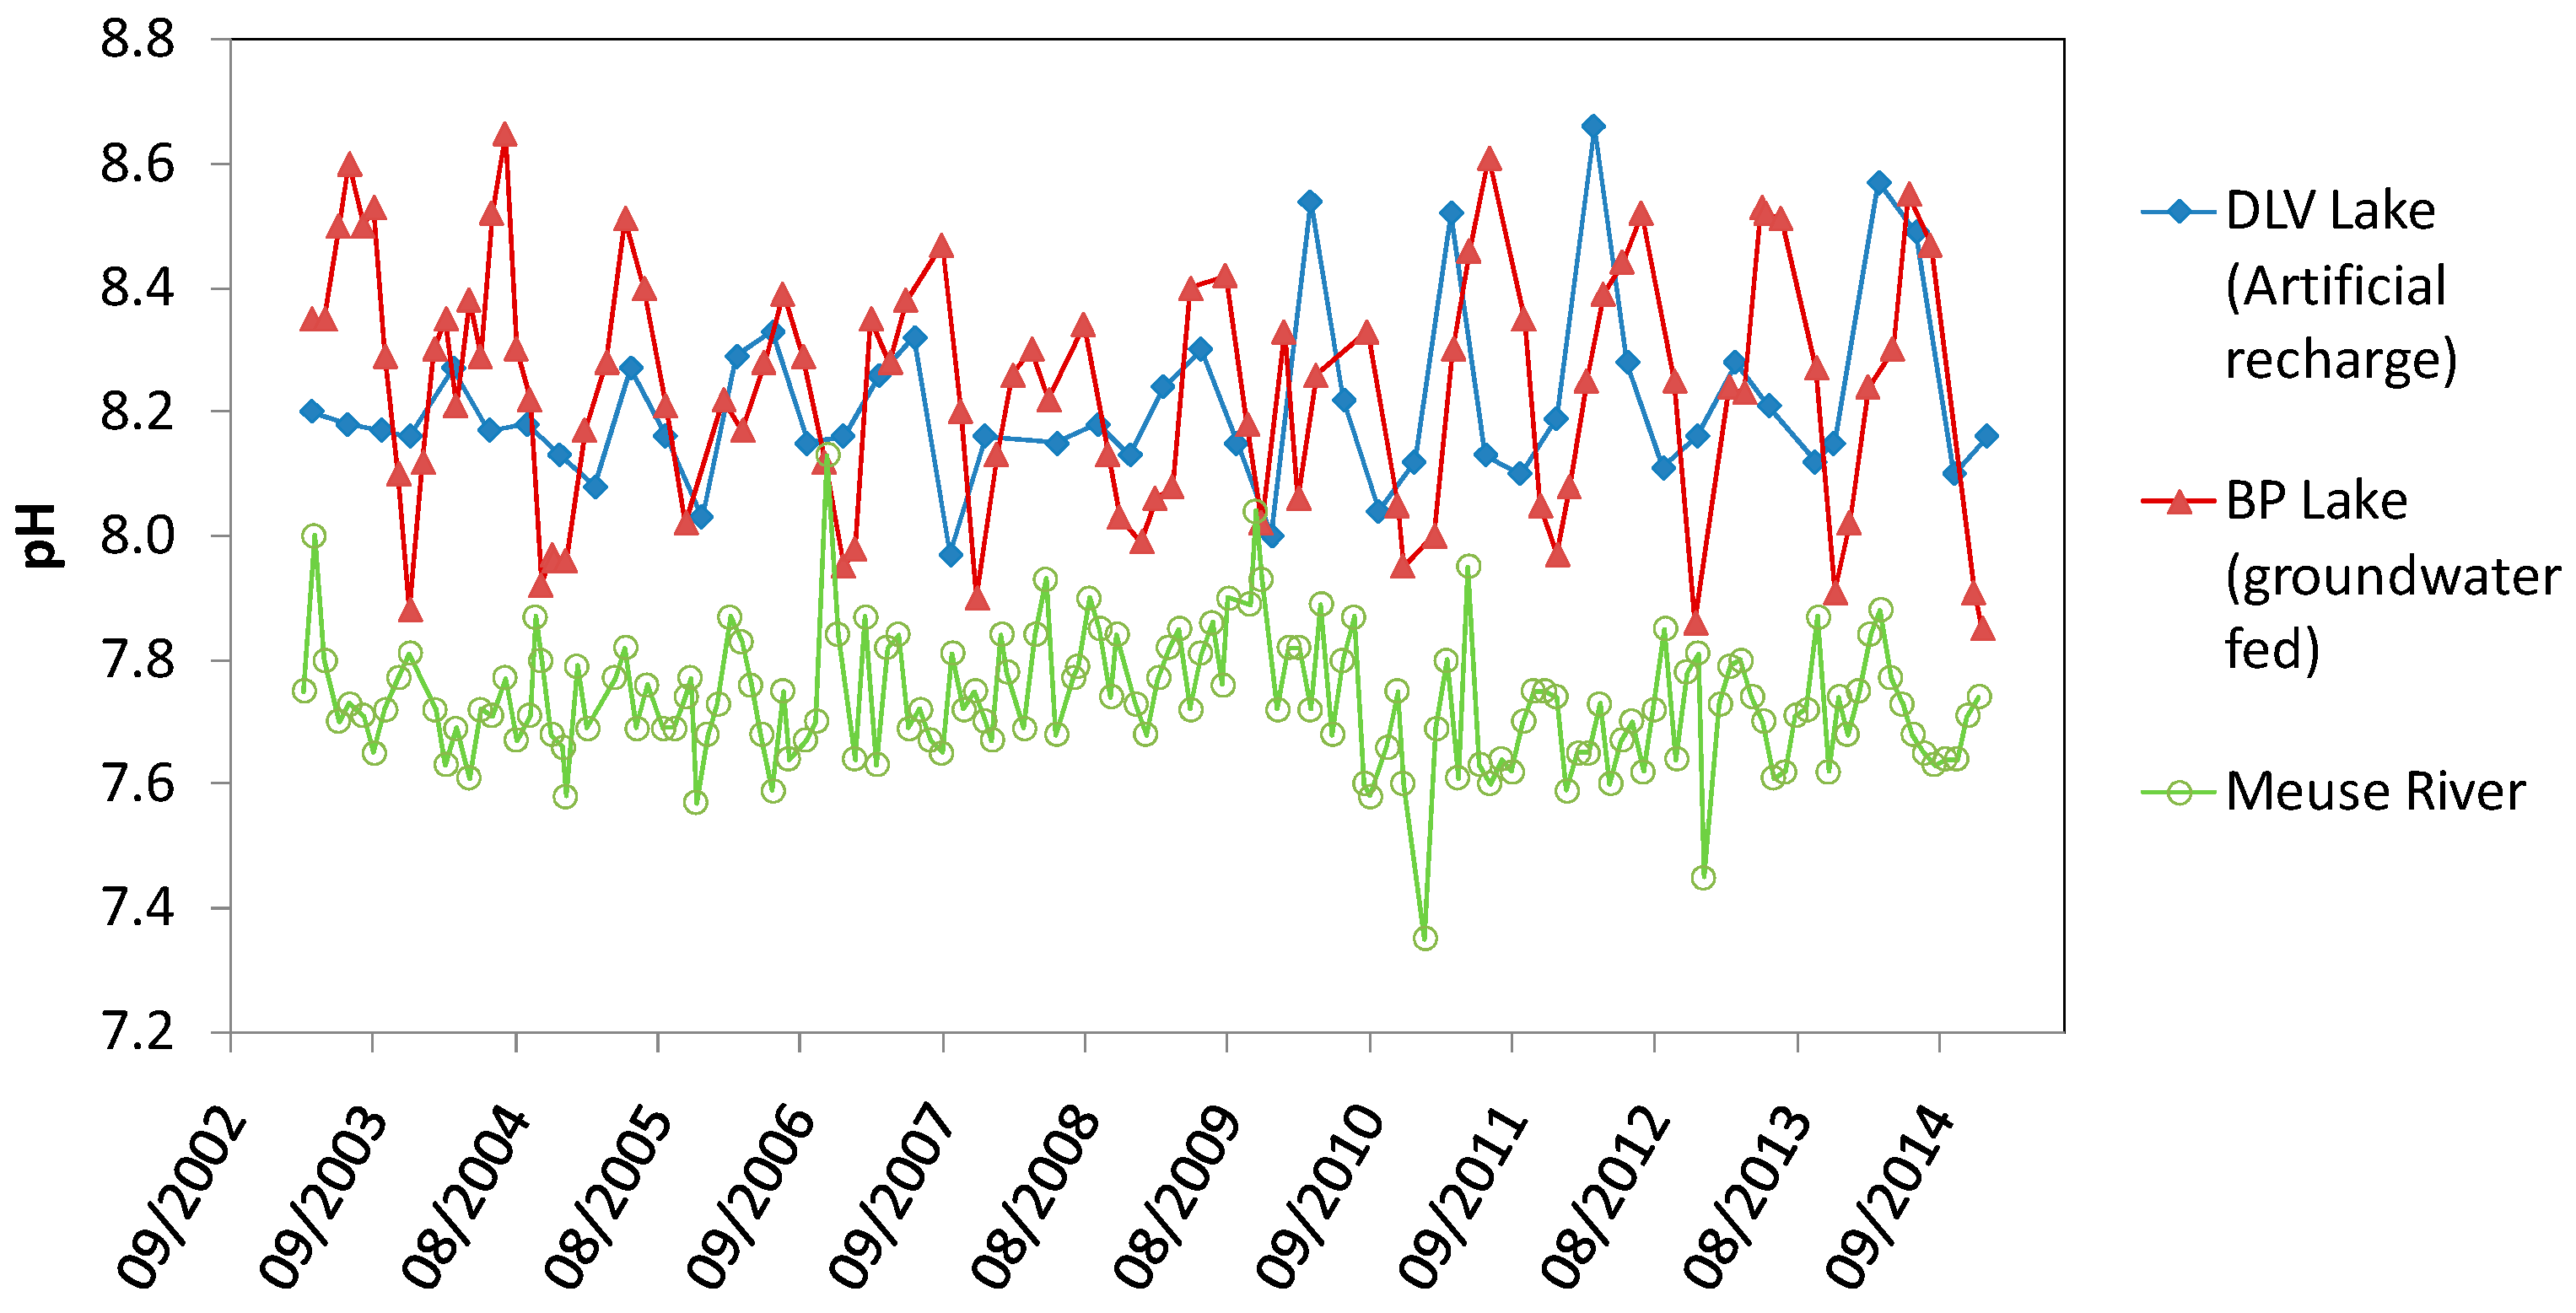
| Range in pH | 8.0–8.7 | 7.9–8.7 | 7.4–8.1 |
| Mean pH (standard deviation) | 8.2 (0.1) | 8.2 (0.2) | 7.7 (0.1) |
| Range summer maximum pH | 8.1–8.7 | 8.3–8.7 | n.a. |
| Range winter minimum pH | (7.7) 8.0–8.2 | 7.9–8.0 | n.a. |
| Timing maximum pH | 15/3–31/7 | 1/6–31/8 | n.a. |
| Timing minimum pH | n.a. | ||
| Number of samples n | 47 | 91 | 152 |
| Linear regression R2 | 0.044 | 0.007 | 0.014 |
| Linear regression p | 0.16 | 0.428 | 0.150 |
| Linear regression trend over time | No significant trend | No significant trend | No significant trend |
| Nitrate Concentration (NO3) | DLV Lake (Artificial Recharge) | BP Lake (Groundwater Fed) | Meuse River |
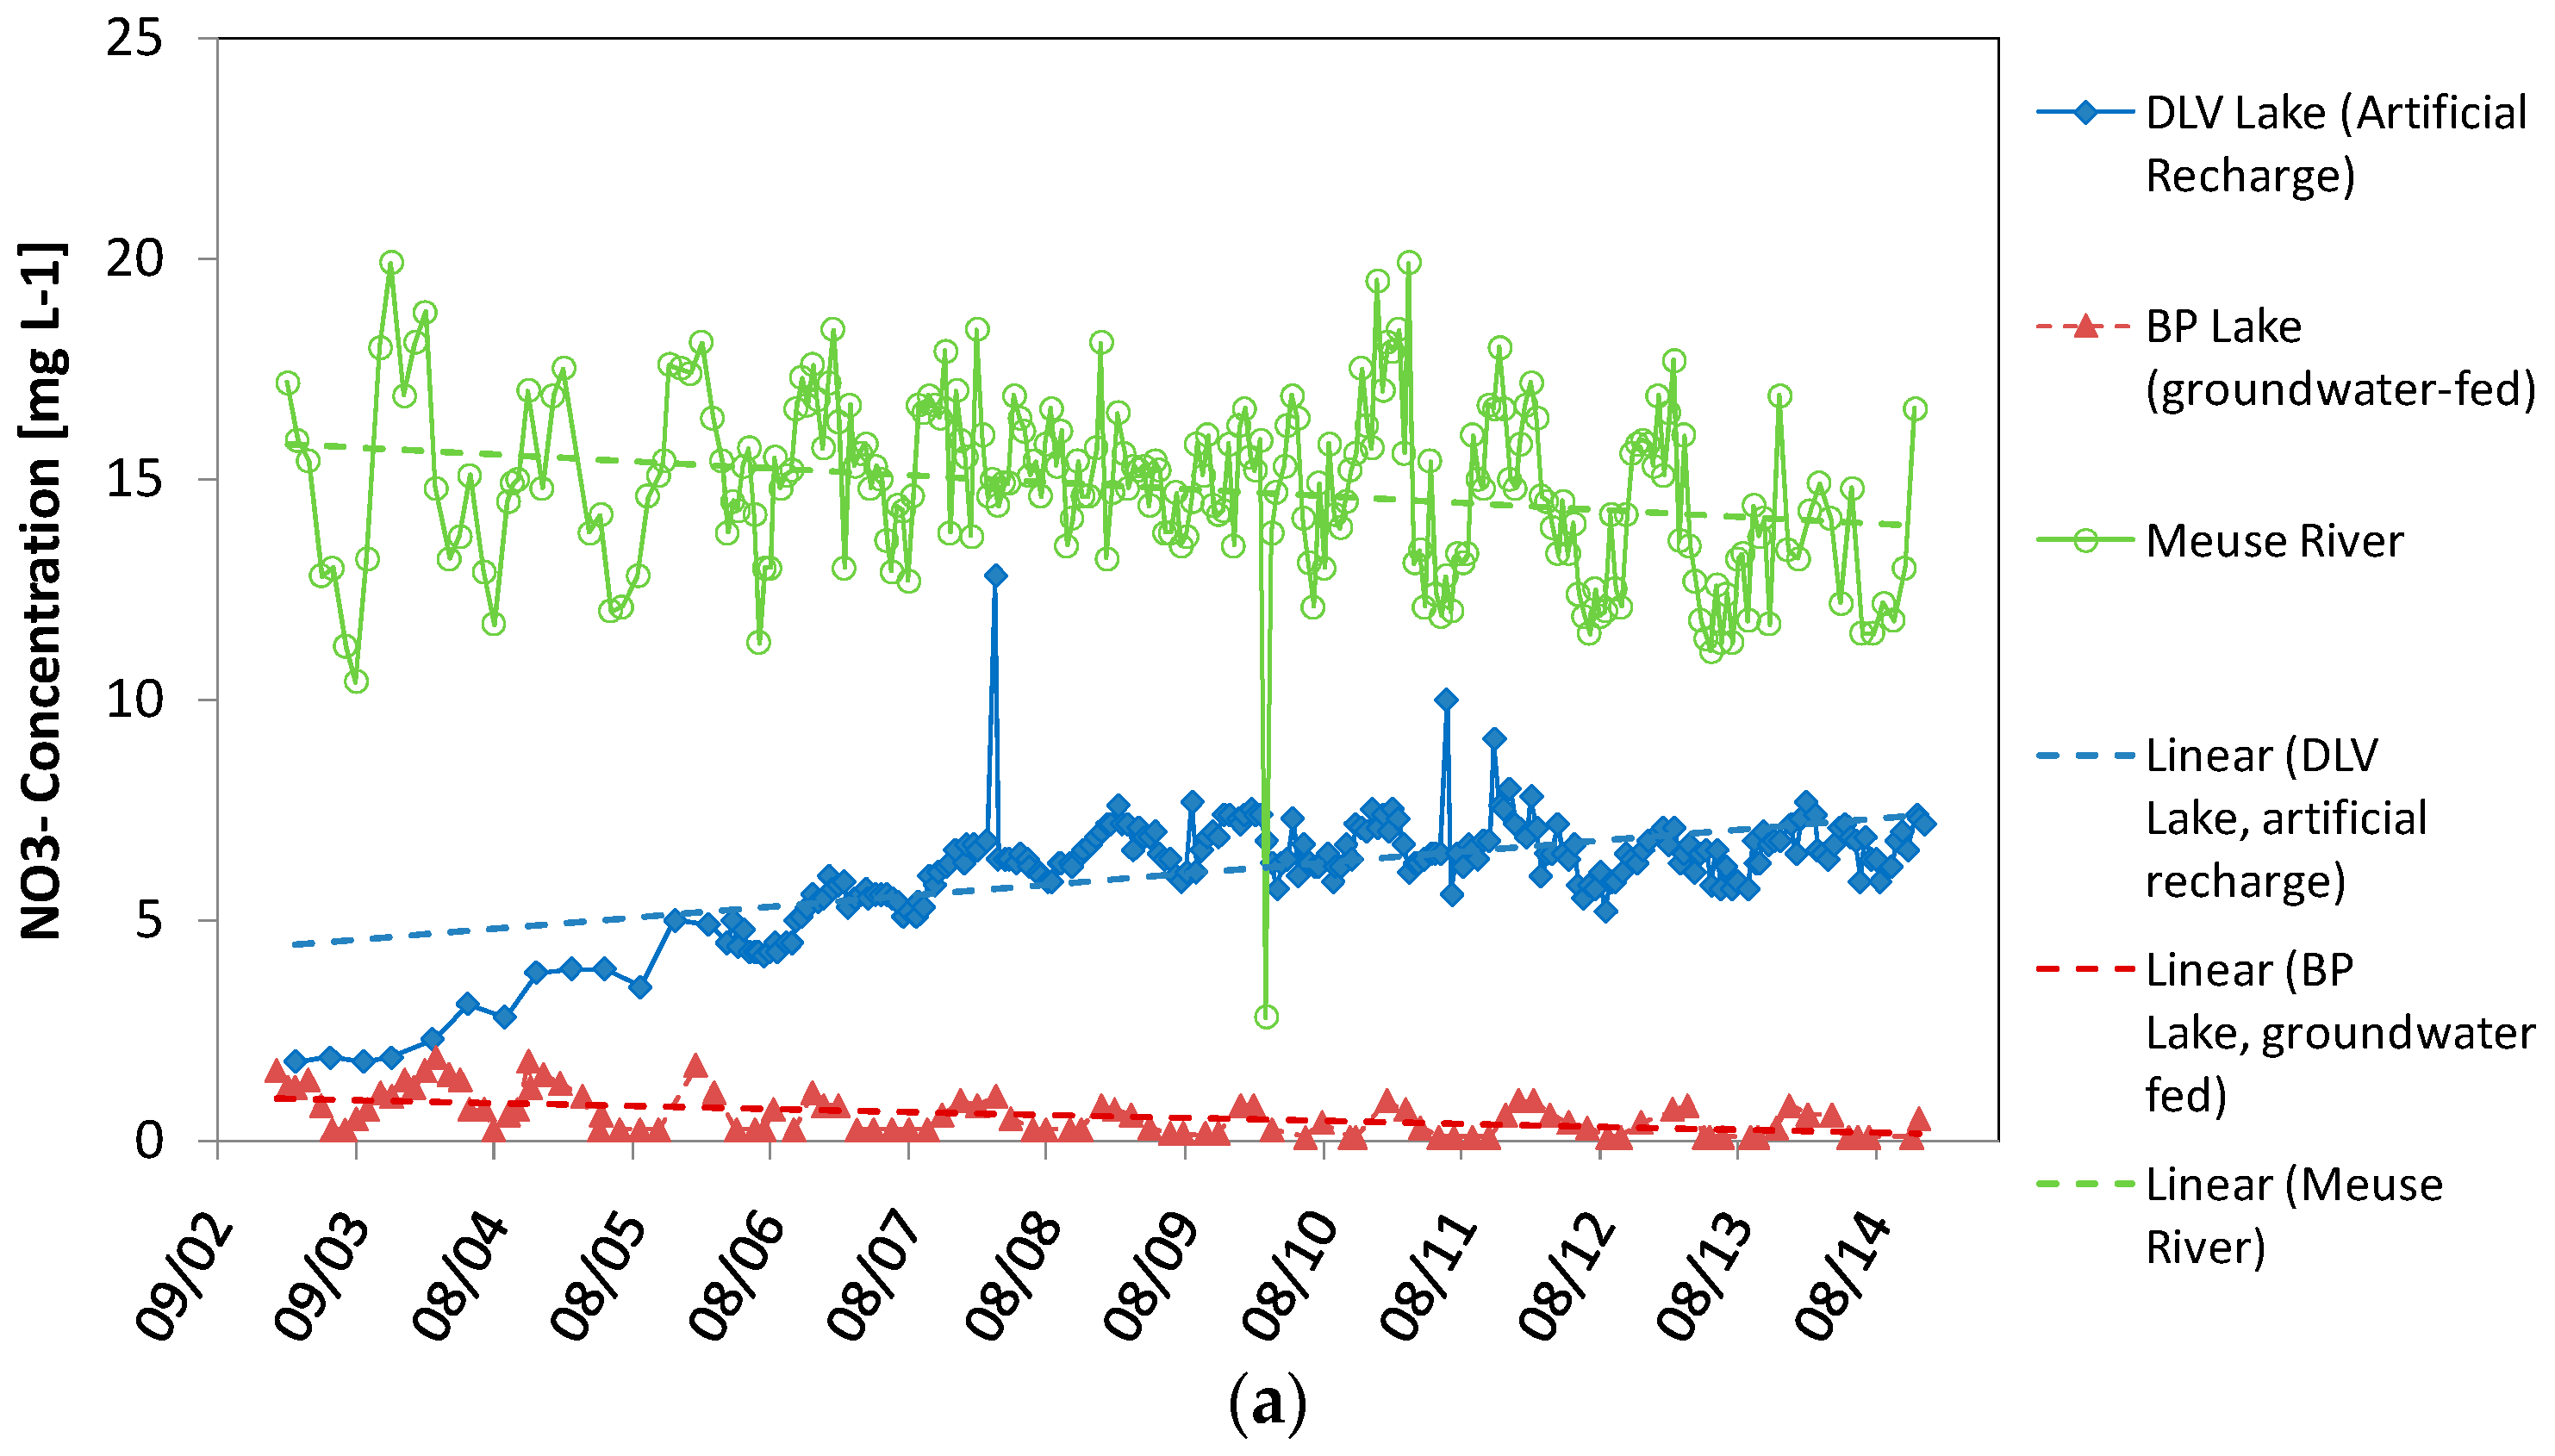
| Range in (NO3) (mg·L−1) | 1.8–12.8 | 0.1–1.9 | 2.8–19.9 |
| Mean (NO3) (mg·L−1) (standard deviation) | 6.2 (1.2) | 0.6 (0.5) | 14.8 (2.0) |
| Range summer maximum (NO3) (mg·L−1) | 3.1–21.3 | 0.0–1.9 | |
| Range winter minimum (NO3) (mg·L−1) | 1.8–5.6 | <0.25 | |
| Timing maximum (NO3) (mg·L−1) | End of January–end of March | End of November–end of March | December–April |
| Timing minimum (NO3) (mg·L−1) | August–September | July–August | July–September |
| Number of samples n | 234 | 101 | 251 |
| Linear regression R2 | 0.341 | 0.267 | 0.055 |
| Linear regression p | <0.00001 | <0.00001 | 0.00002 |
| Linear regression trend over time (all data) | Positive | Negative | Negative |
| Linear regression period 1 R2 | 0.706 | ||
| Linear regression period 1 p | <0.0001 | ||
| Linear regression period 1 trend over time | positive | ||
| Linear regression period 1 R2 | 0.0008 | ||
| Linear regression period 1 p | 0.332 | ||
| Linear regression period 2 trend over time | No significant trend | ||
| Total Phosphate Concentration (PO4) | DLV Lake (Artificial Recharge) | BP Lake (Groundwater Fed) | Meuse River |
| Range in (PO4) (mg·L−1) | <0.015–0.72 | <0.0150–0.18 | <0.015–2.2 |
| Mean (PO4) (mg·L−1) (standard deviation) | 0.09 (0.06) | 0.05 (0.03) | 0.77 (0.28) |
| Range summer maximum (PO4) (mg·L−1) | n.a. | n.a. | n.a. |
| Range winter minimum (PO4) (mg·L−1) | n.a. | n.a. | n.a. |
| Timing maximum (PO4) (mg·L−1) | All year | All year | All year |
| Timing minimum (PO4) (mg·L−1) | All year | All year | All year |
| Linear regression R2 | 0.09 | 0.254 | 0.159 |
| Linear regression p | 0.072 | <0.0001 | 0.0001 |
| Linear regression trend over time (all data) | No significant trend | Negative | Negative |
| Number of samples n | 355 | 94 | 137 |
| Sulphate Concentration (SO4) | DLV Lake (Artificial Recharge) | BP Lake (Groundwater Fed) | Meuse River |
| Range (SO4) of complete monitoring period (mg·L−1) | 51.0–67.0 | 68.0–88.0 | 25.0–80.0 |
| Mean (SO4) of complete monitoring period (mg·L−1) (standard deviation) | 58.6 (4.3) | 76.4 (3.5) | 47.6 (13.1) |
| Range summer maximum (SO4) (mg·L−1) | n.a. | n.a. | 55–80 |
| Range winter minimum (SO4) (mg·L−1) | n.a. | n.a. | 25–37 |
| Timing maximum (SO4) (mg·L−1) | n.a. | n.a. | End August beginning November |
| Timing minimum (SO4) (mg·L−1) | n.a. | n.a. | January–March |
| Number of samples n | 47 | 94 | 152 |
| Linear regression R2 | 0.56 | 0.22 | 0.032 |
| Linear regression p | <0.00001 | 0.150 | 0.027 |
| Linear regression trend over time (all data) | Negative | No significant trend | Negative |
| Linear regression period 1 R2 | 0.621 | ||
| Linear regression period 1 p | <0.00001 | ||
| Linear regression period 1 trend over time | positive | ||
| Linear regression period 1 R2 | 0.631 | ||
| Linear regression period 1 p | <0.00001 | ||
| Linear regression period 2 trend over time | negative |
| One Way ANOVA Analysis | REGWQ: Analysis of the Differences | ||||||
|---|---|---|---|---|---|---|---|
| Parameters | R2 | F | p-Value | Number of Outliers (St. Residuals Outside (−1.96, 1.96) | Significant Difference between BP Lake vs. Meuse River | Significant Difference between BP Lake vs. DLV Lake | Significant Difference between DLV Lake vs. Meuse River |
| Temperature | 0.009 | 3.1 | 0.047 | 0 | Yes | No | No |
| pH | 0.737 | 401.7 | <0.0001 | 10 (0 DLV Lake, 8 BP Lake, 2 Meuse River) | Yes | No | Yes |
| NO3 | 0.927 | 3728.6 | <0.0001 | 28 (8 DLV Lake, 0 BP Lake, 20 Meuse River) | Yes | Yes | Yes |
| PO4 | 0.844 | 1574.1 | <0.0001 | 27 (1 DLV Lake, 0 BP Lake 26 Meuse River) | Yes | Yes | Yes |
| SO4 | 0.633 | 250.6 | <0.0001 | 0 DLV Lake, 0 BP, 21 Meuse River | Yes | Yes | Yes |
© 2016 by the authors; licensee MDPI, Basel, Switzerland. This article is an open access article distributed under the terms and conditions of the Creative Commons Attribution (CC-BY) license (http://creativecommons.org/licenses/by/4.0/).
Share and Cite
Mollema, P.N.; Antonellini, M.; Hubeek, A.; Van Diepenbeek, P.M.J.A. The Effect of Artificial Recharge on Hydrochemistry: A Comparison of Two Fluvial Gravel Pit Lakes with Different Post-Excavation Uses in The Netherlands. Water 2016, 8, 409. https://doi.org/10.3390/w8090409
Mollema PN, Antonellini M, Hubeek A, Van Diepenbeek PMJA. The Effect of Artificial Recharge on Hydrochemistry: A Comparison of Two Fluvial Gravel Pit Lakes with Different Post-Excavation Uses in The Netherlands. Water. 2016; 8(9):409. https://doi.org/10.3390/w8090409
Chicago/Turabian StyleMollema, Pauline N., Marco Antonellini, Alwin Hubeek, and Peter M. J. A. Van Diepenbeek. 2016. "The Effect of Artificial Recharge on Hydrochemistry: A Comparison of Two Fluvial Gravel Pit Lakes with Different Post-Excavation Uses in The Netherlands" Water 8, no. 9: 409. https://doi.org/10.3390/w8090409