
Long-Term Trends and Temporal Synchrony in Plankton Richness, Diversity and Biomass Driven by Re-Oligotrophication and Climate across 17 Danish Lakes

 , ,
, ,  ,
,
Abstract
:1. Introduction
2. Materials and Methods
3. Results
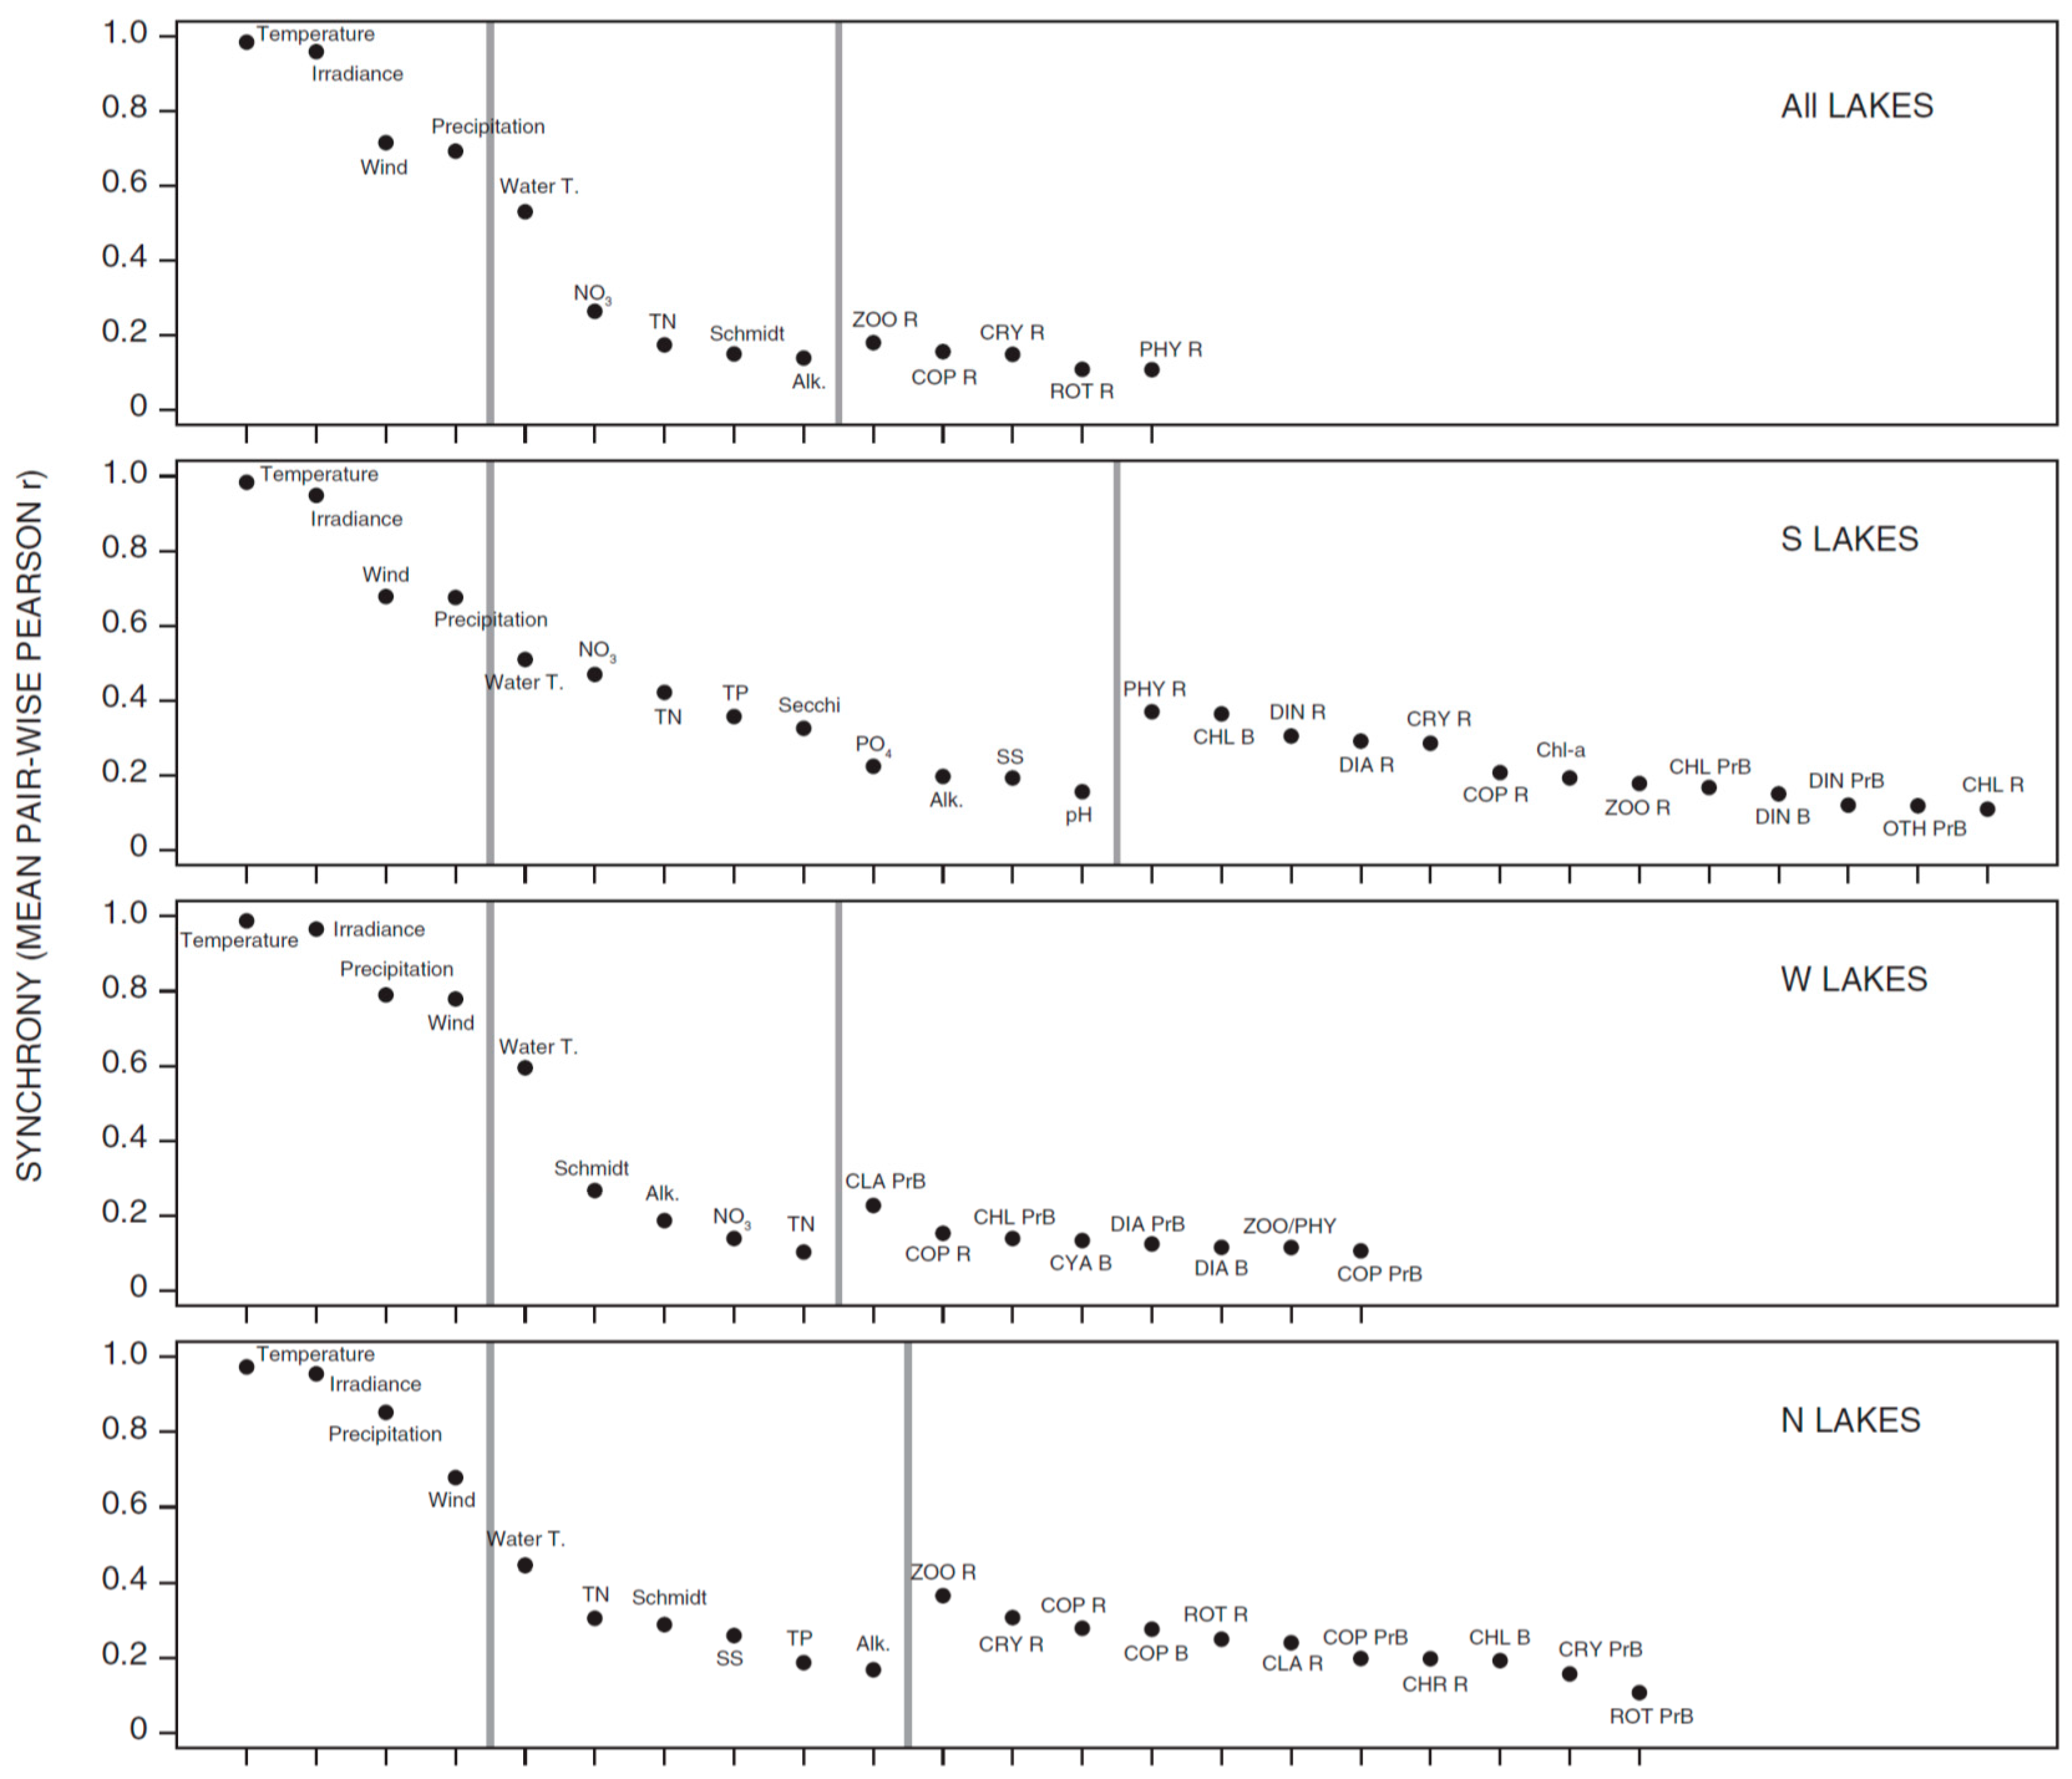
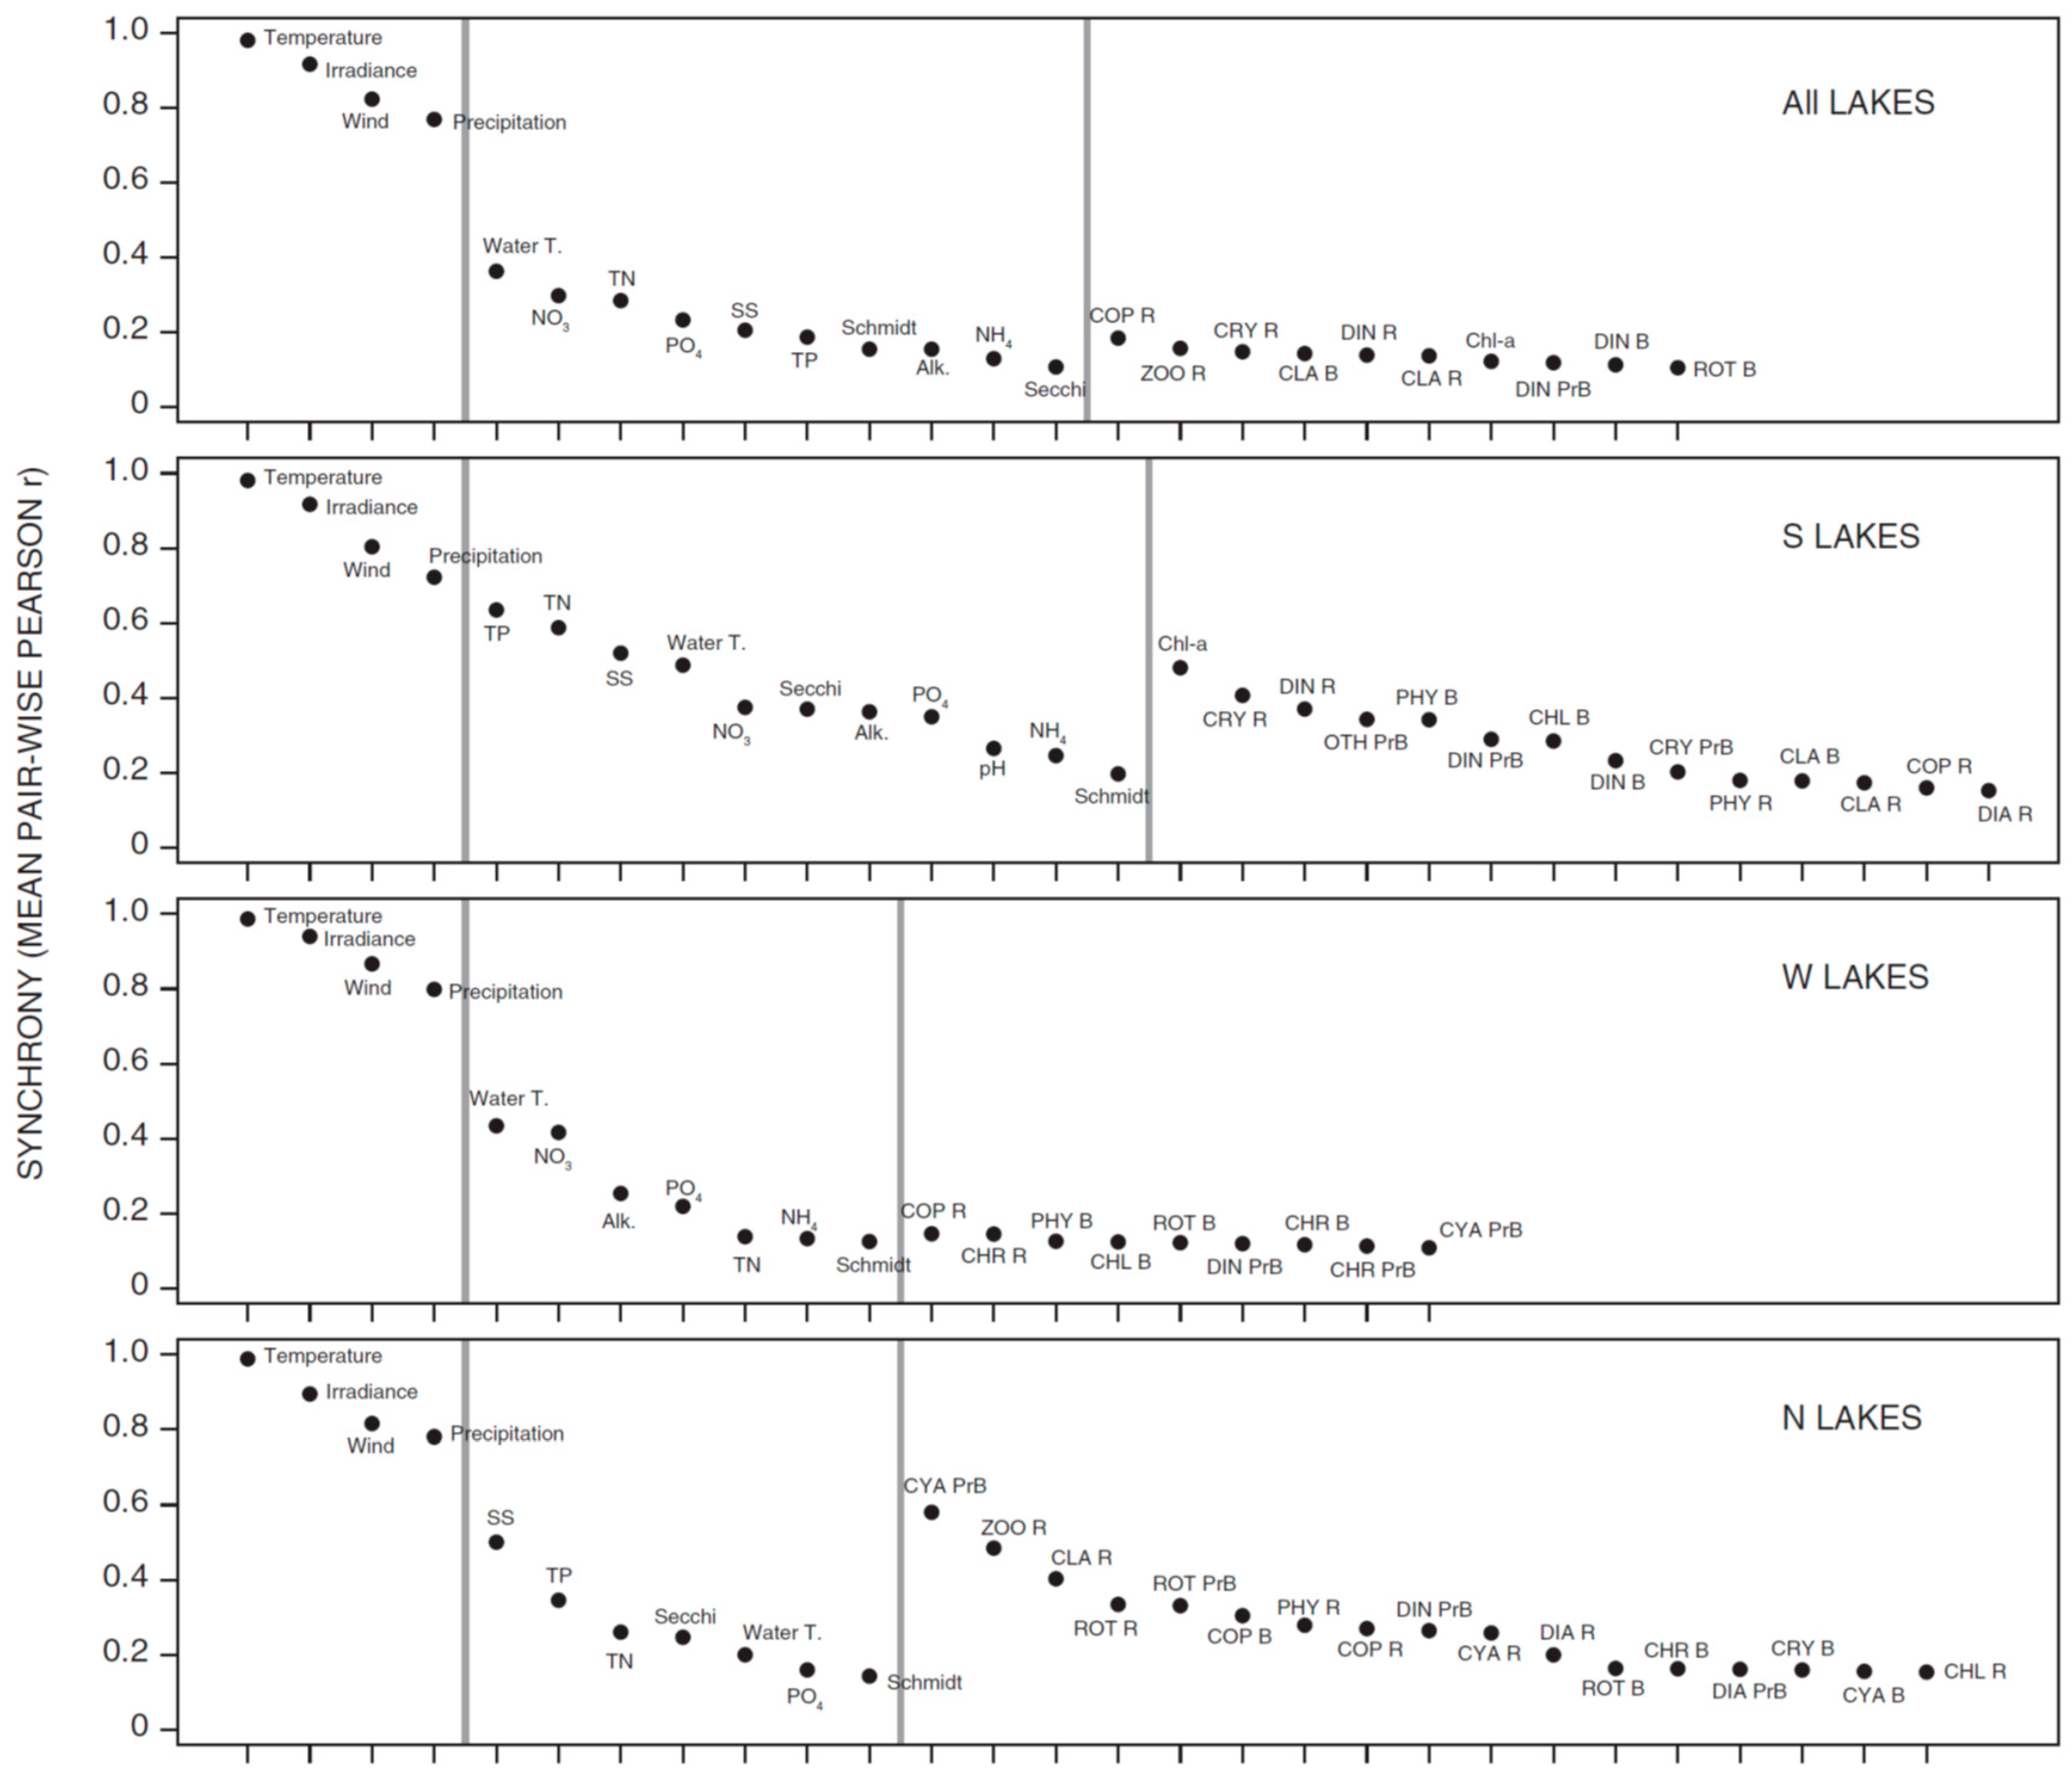
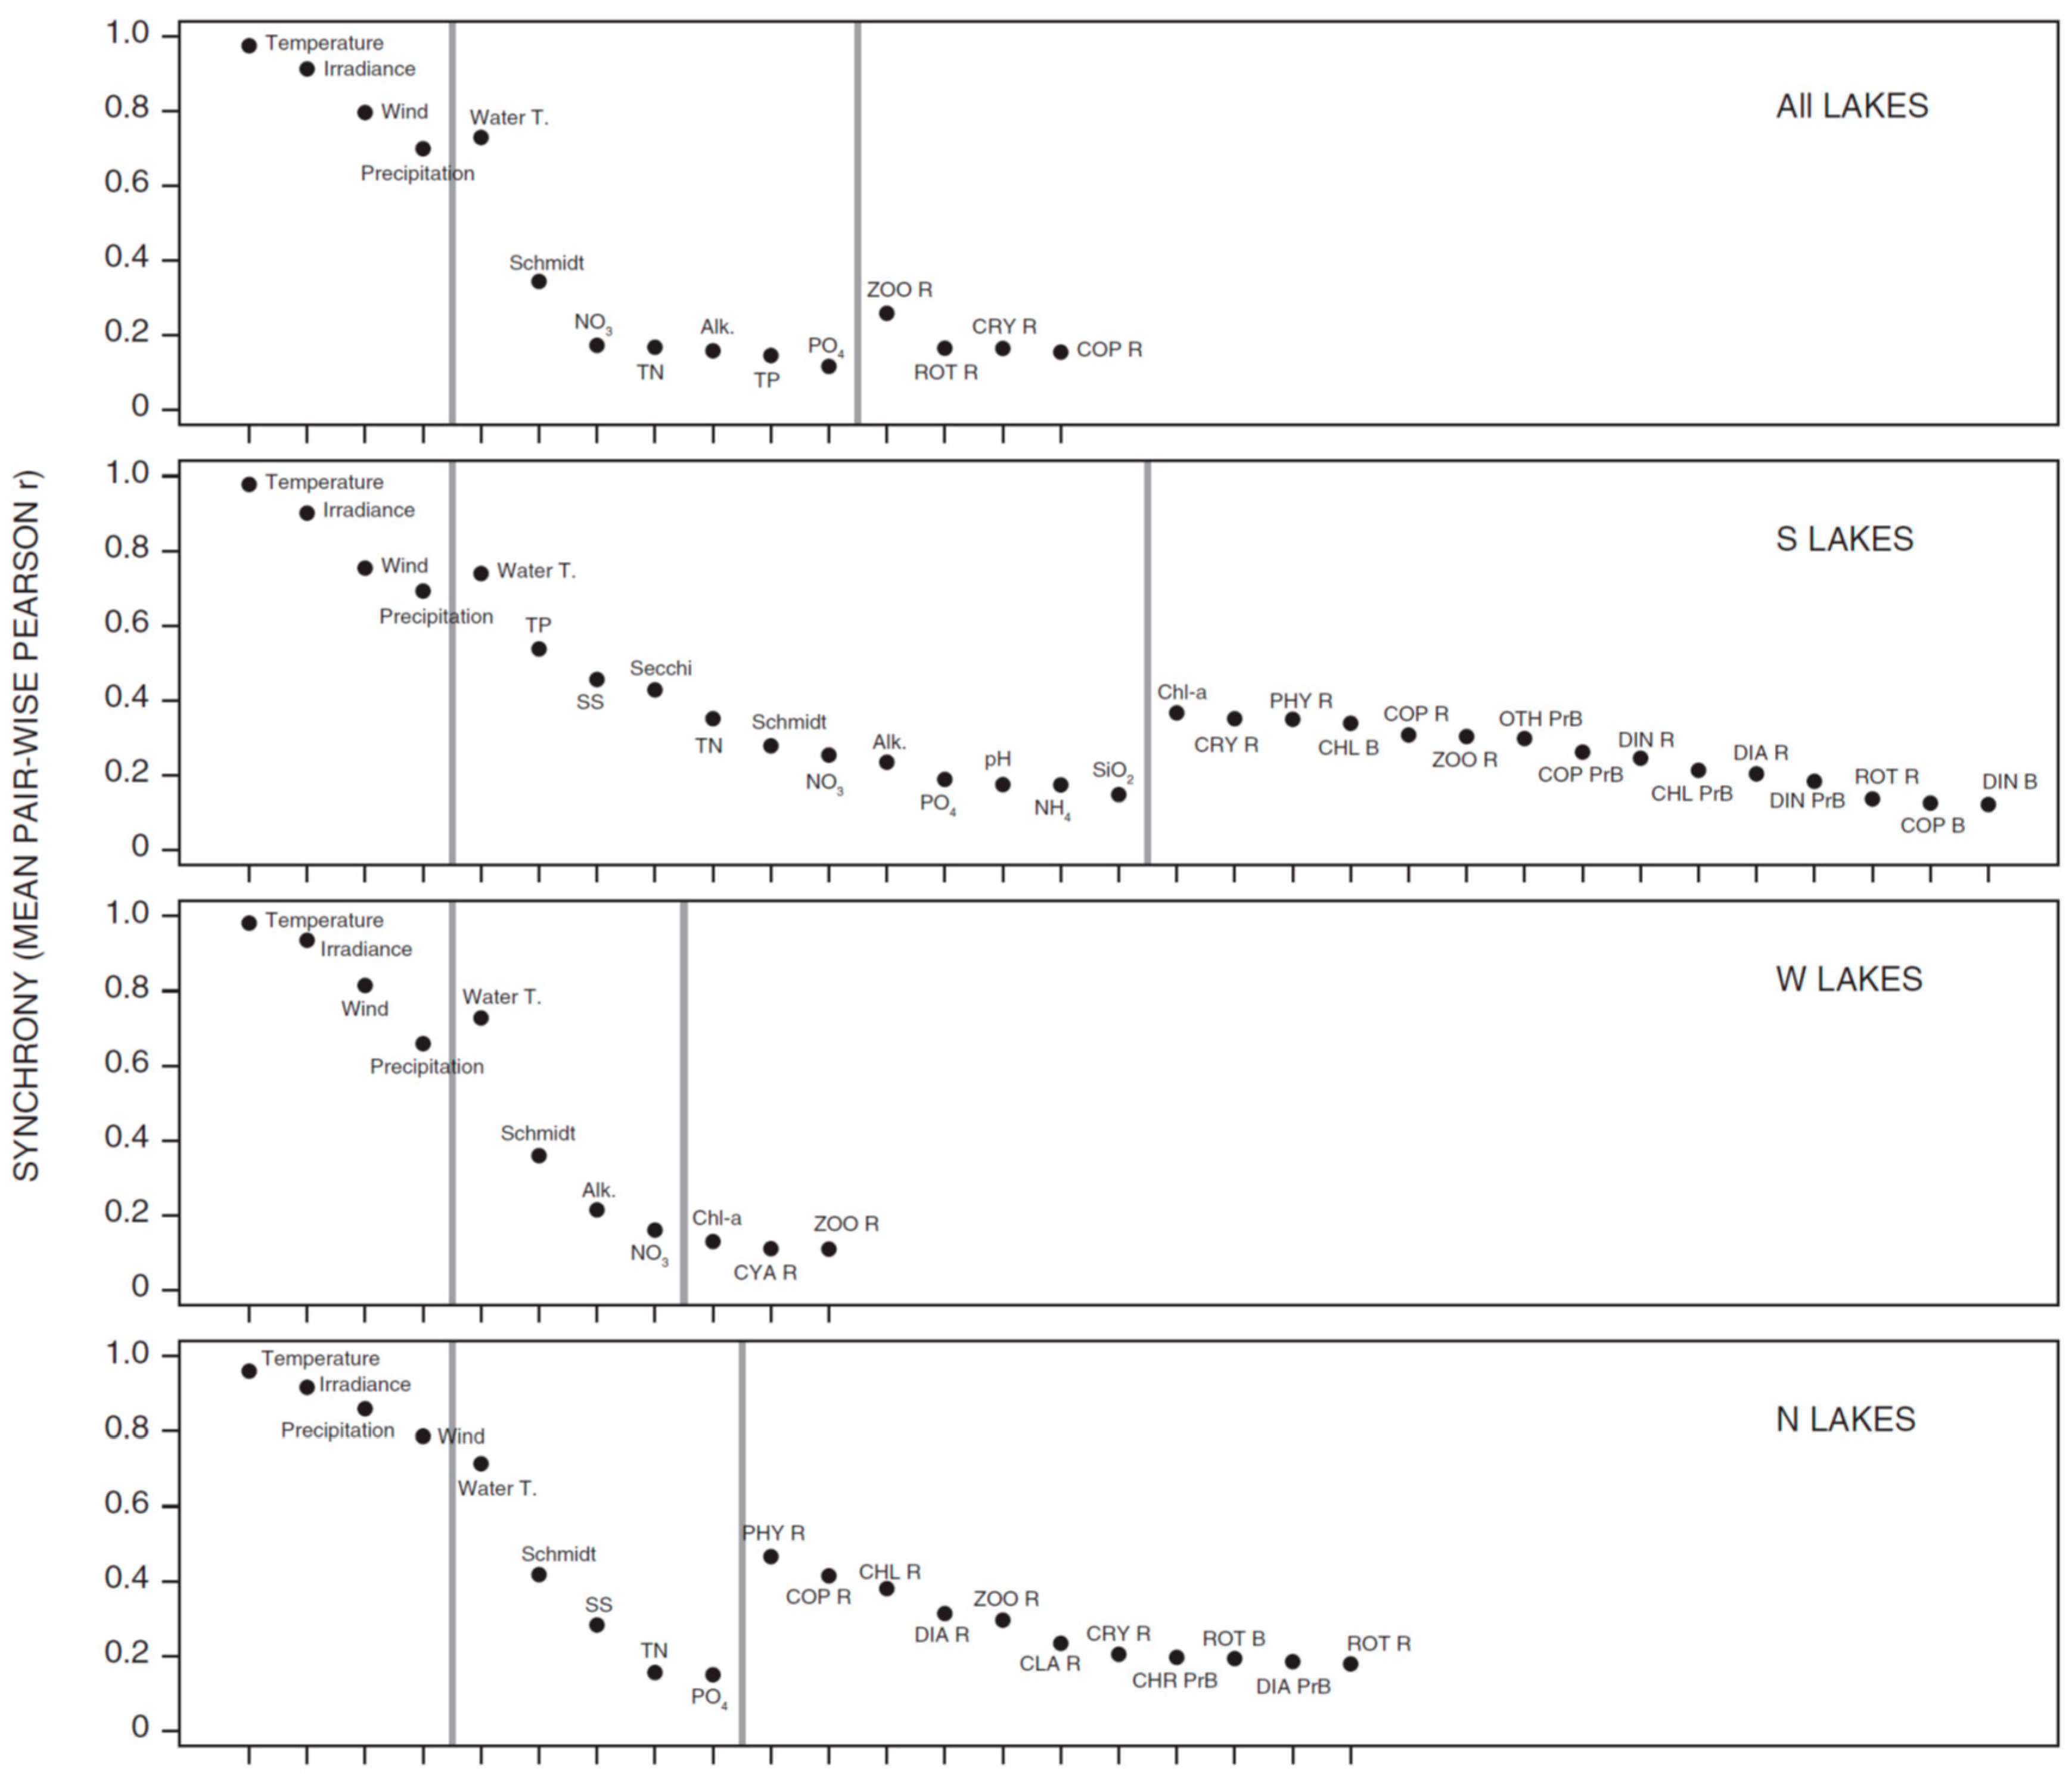
3.1. Synchrony in Temporal Changes
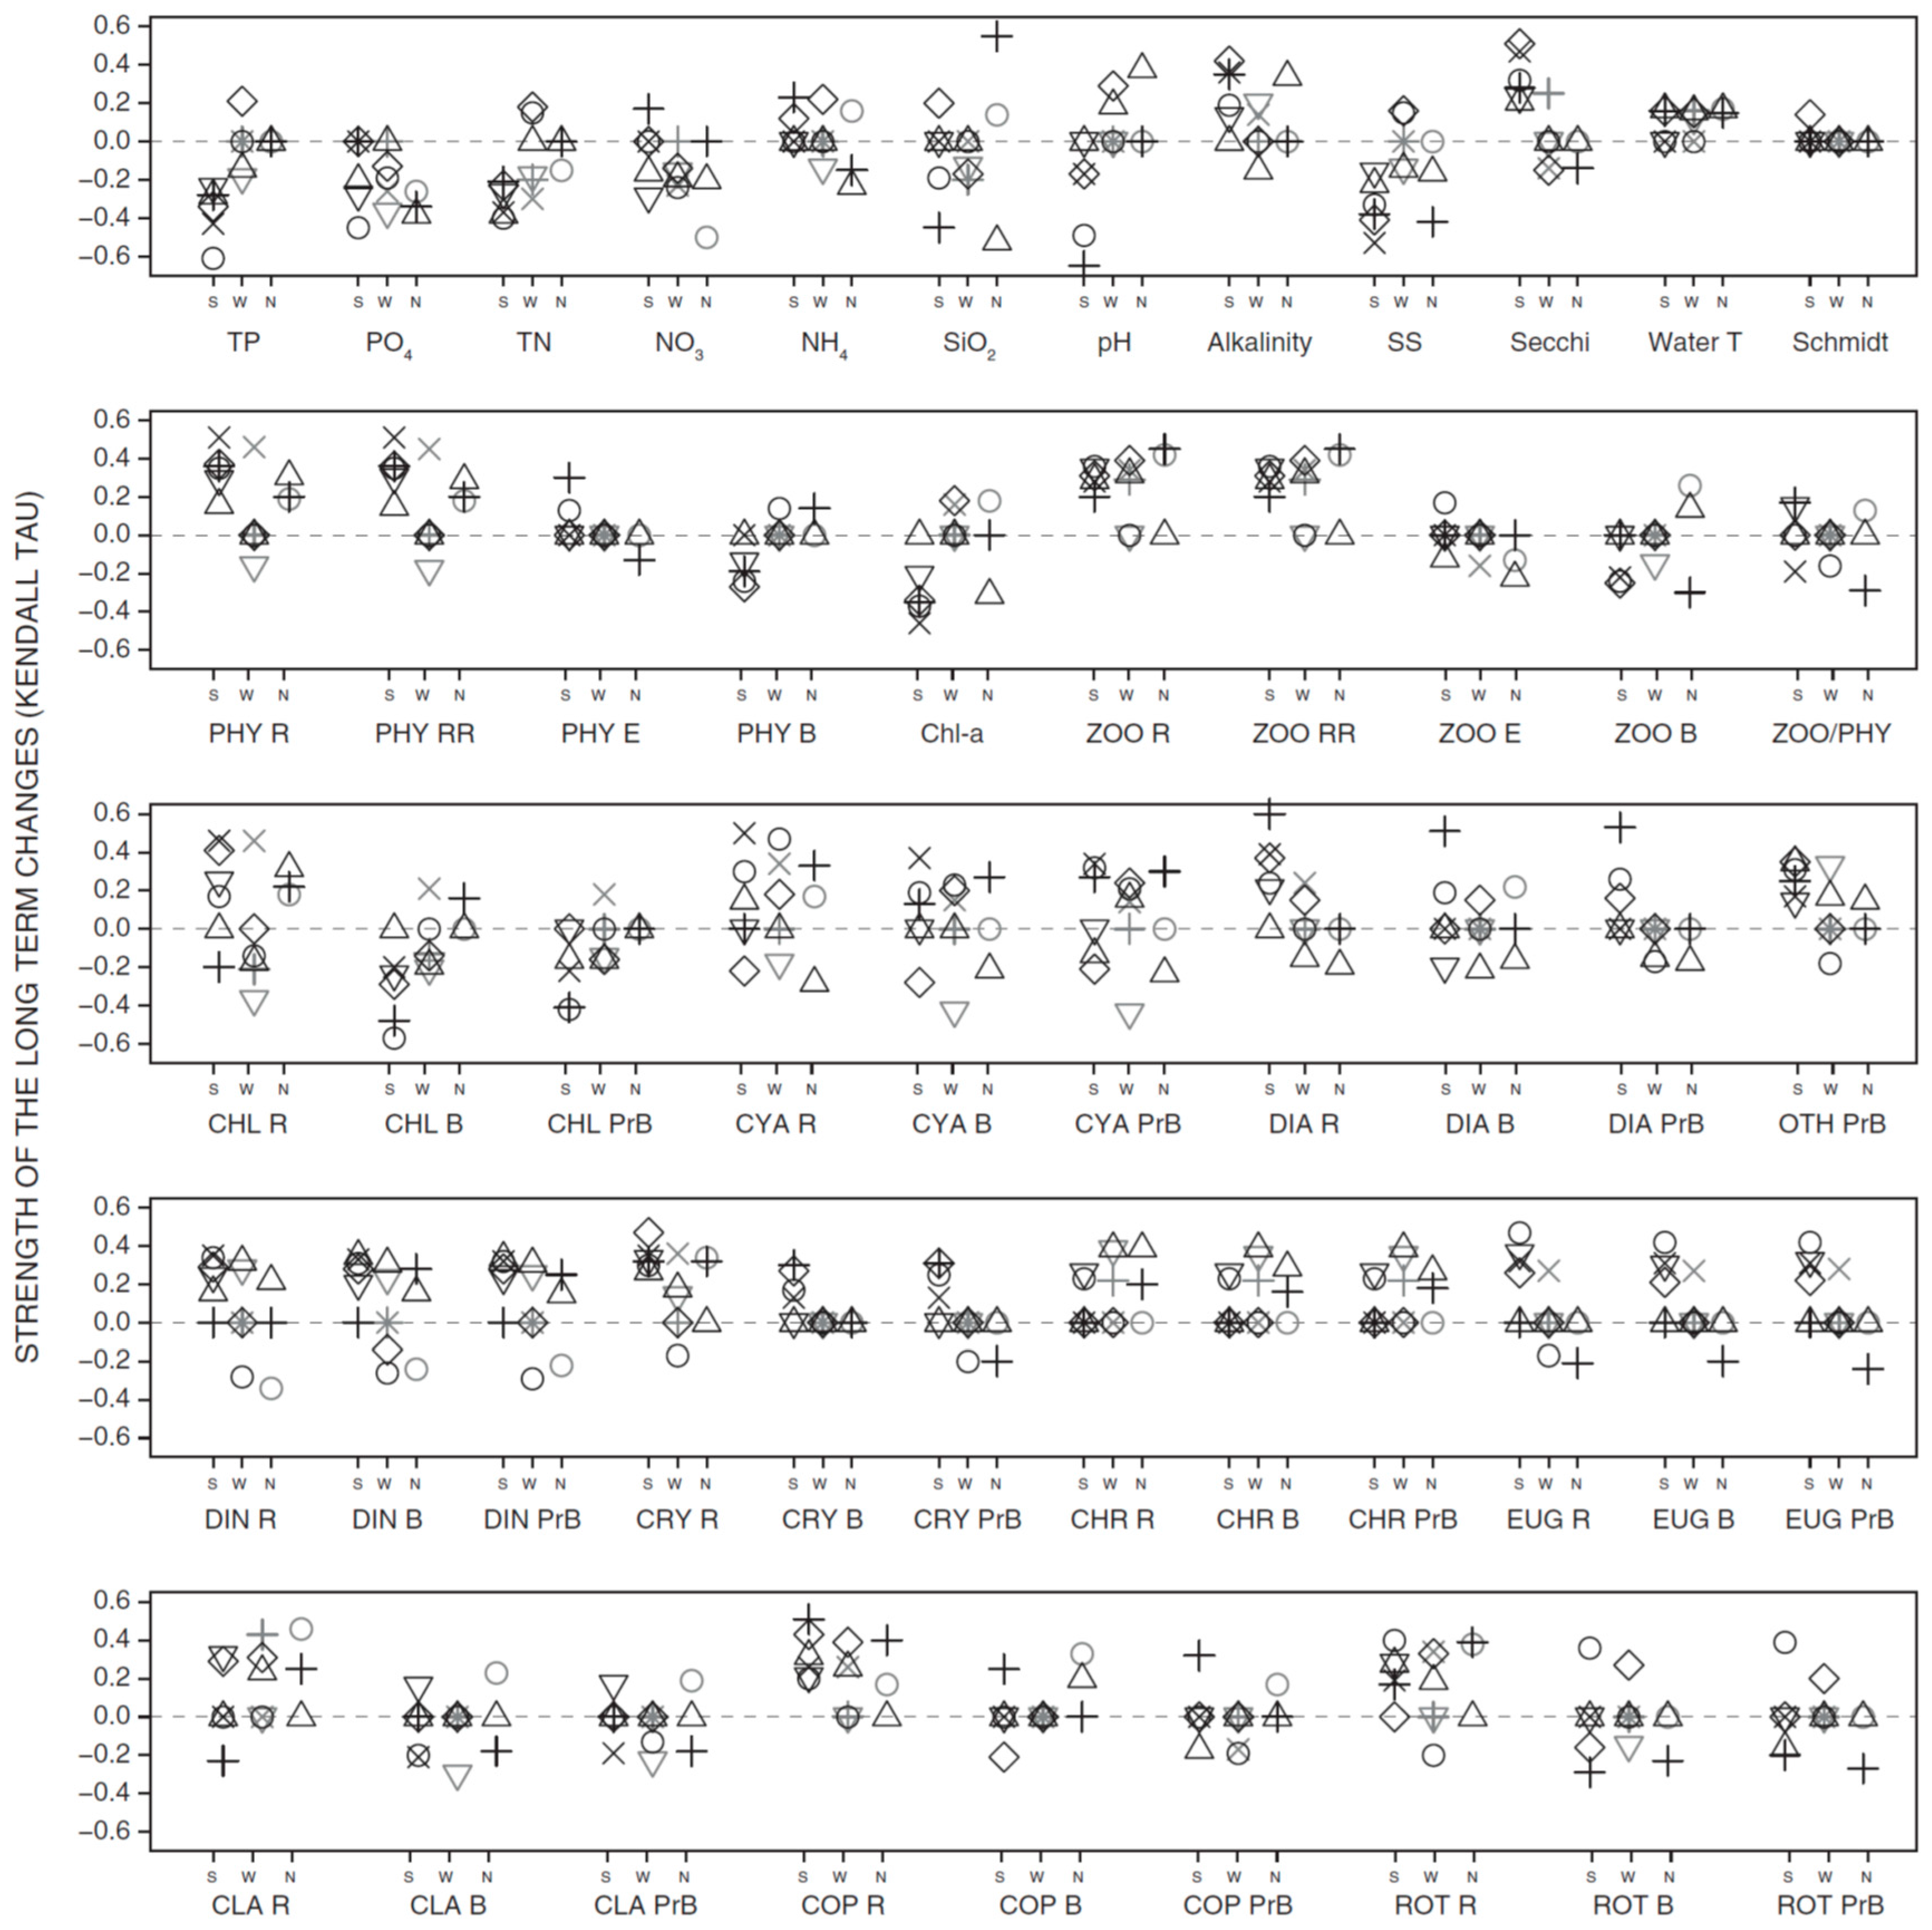
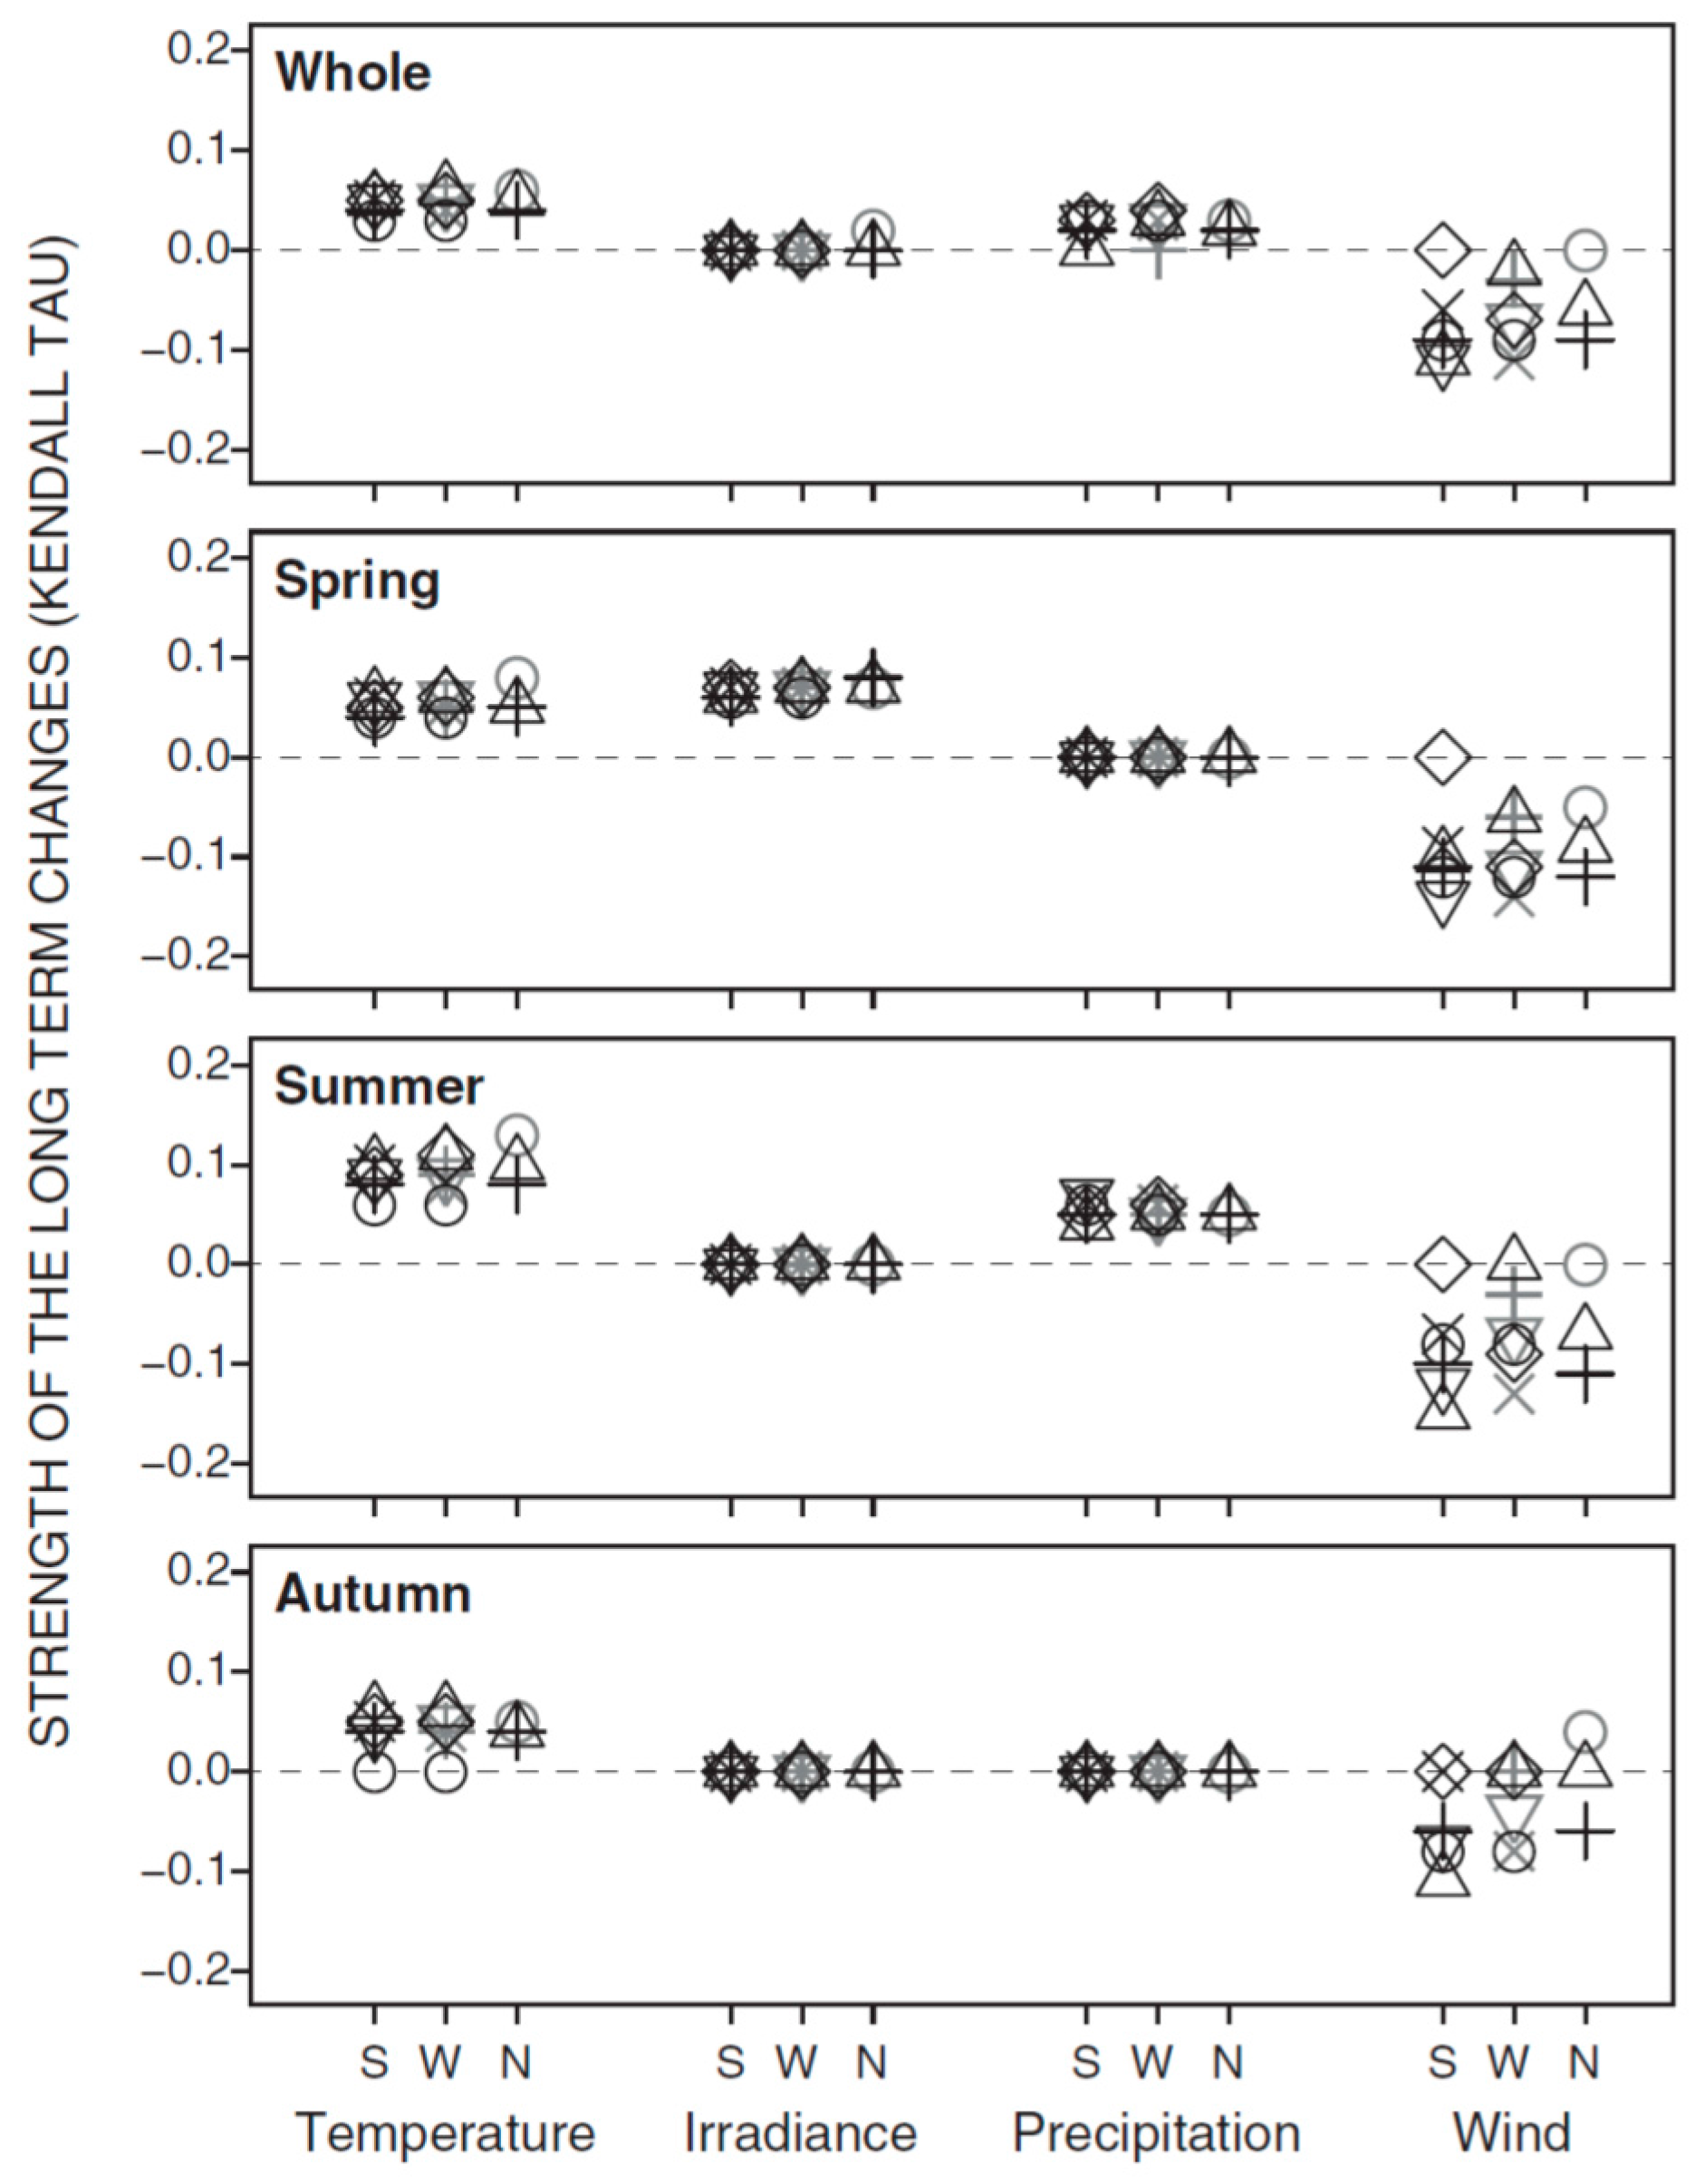
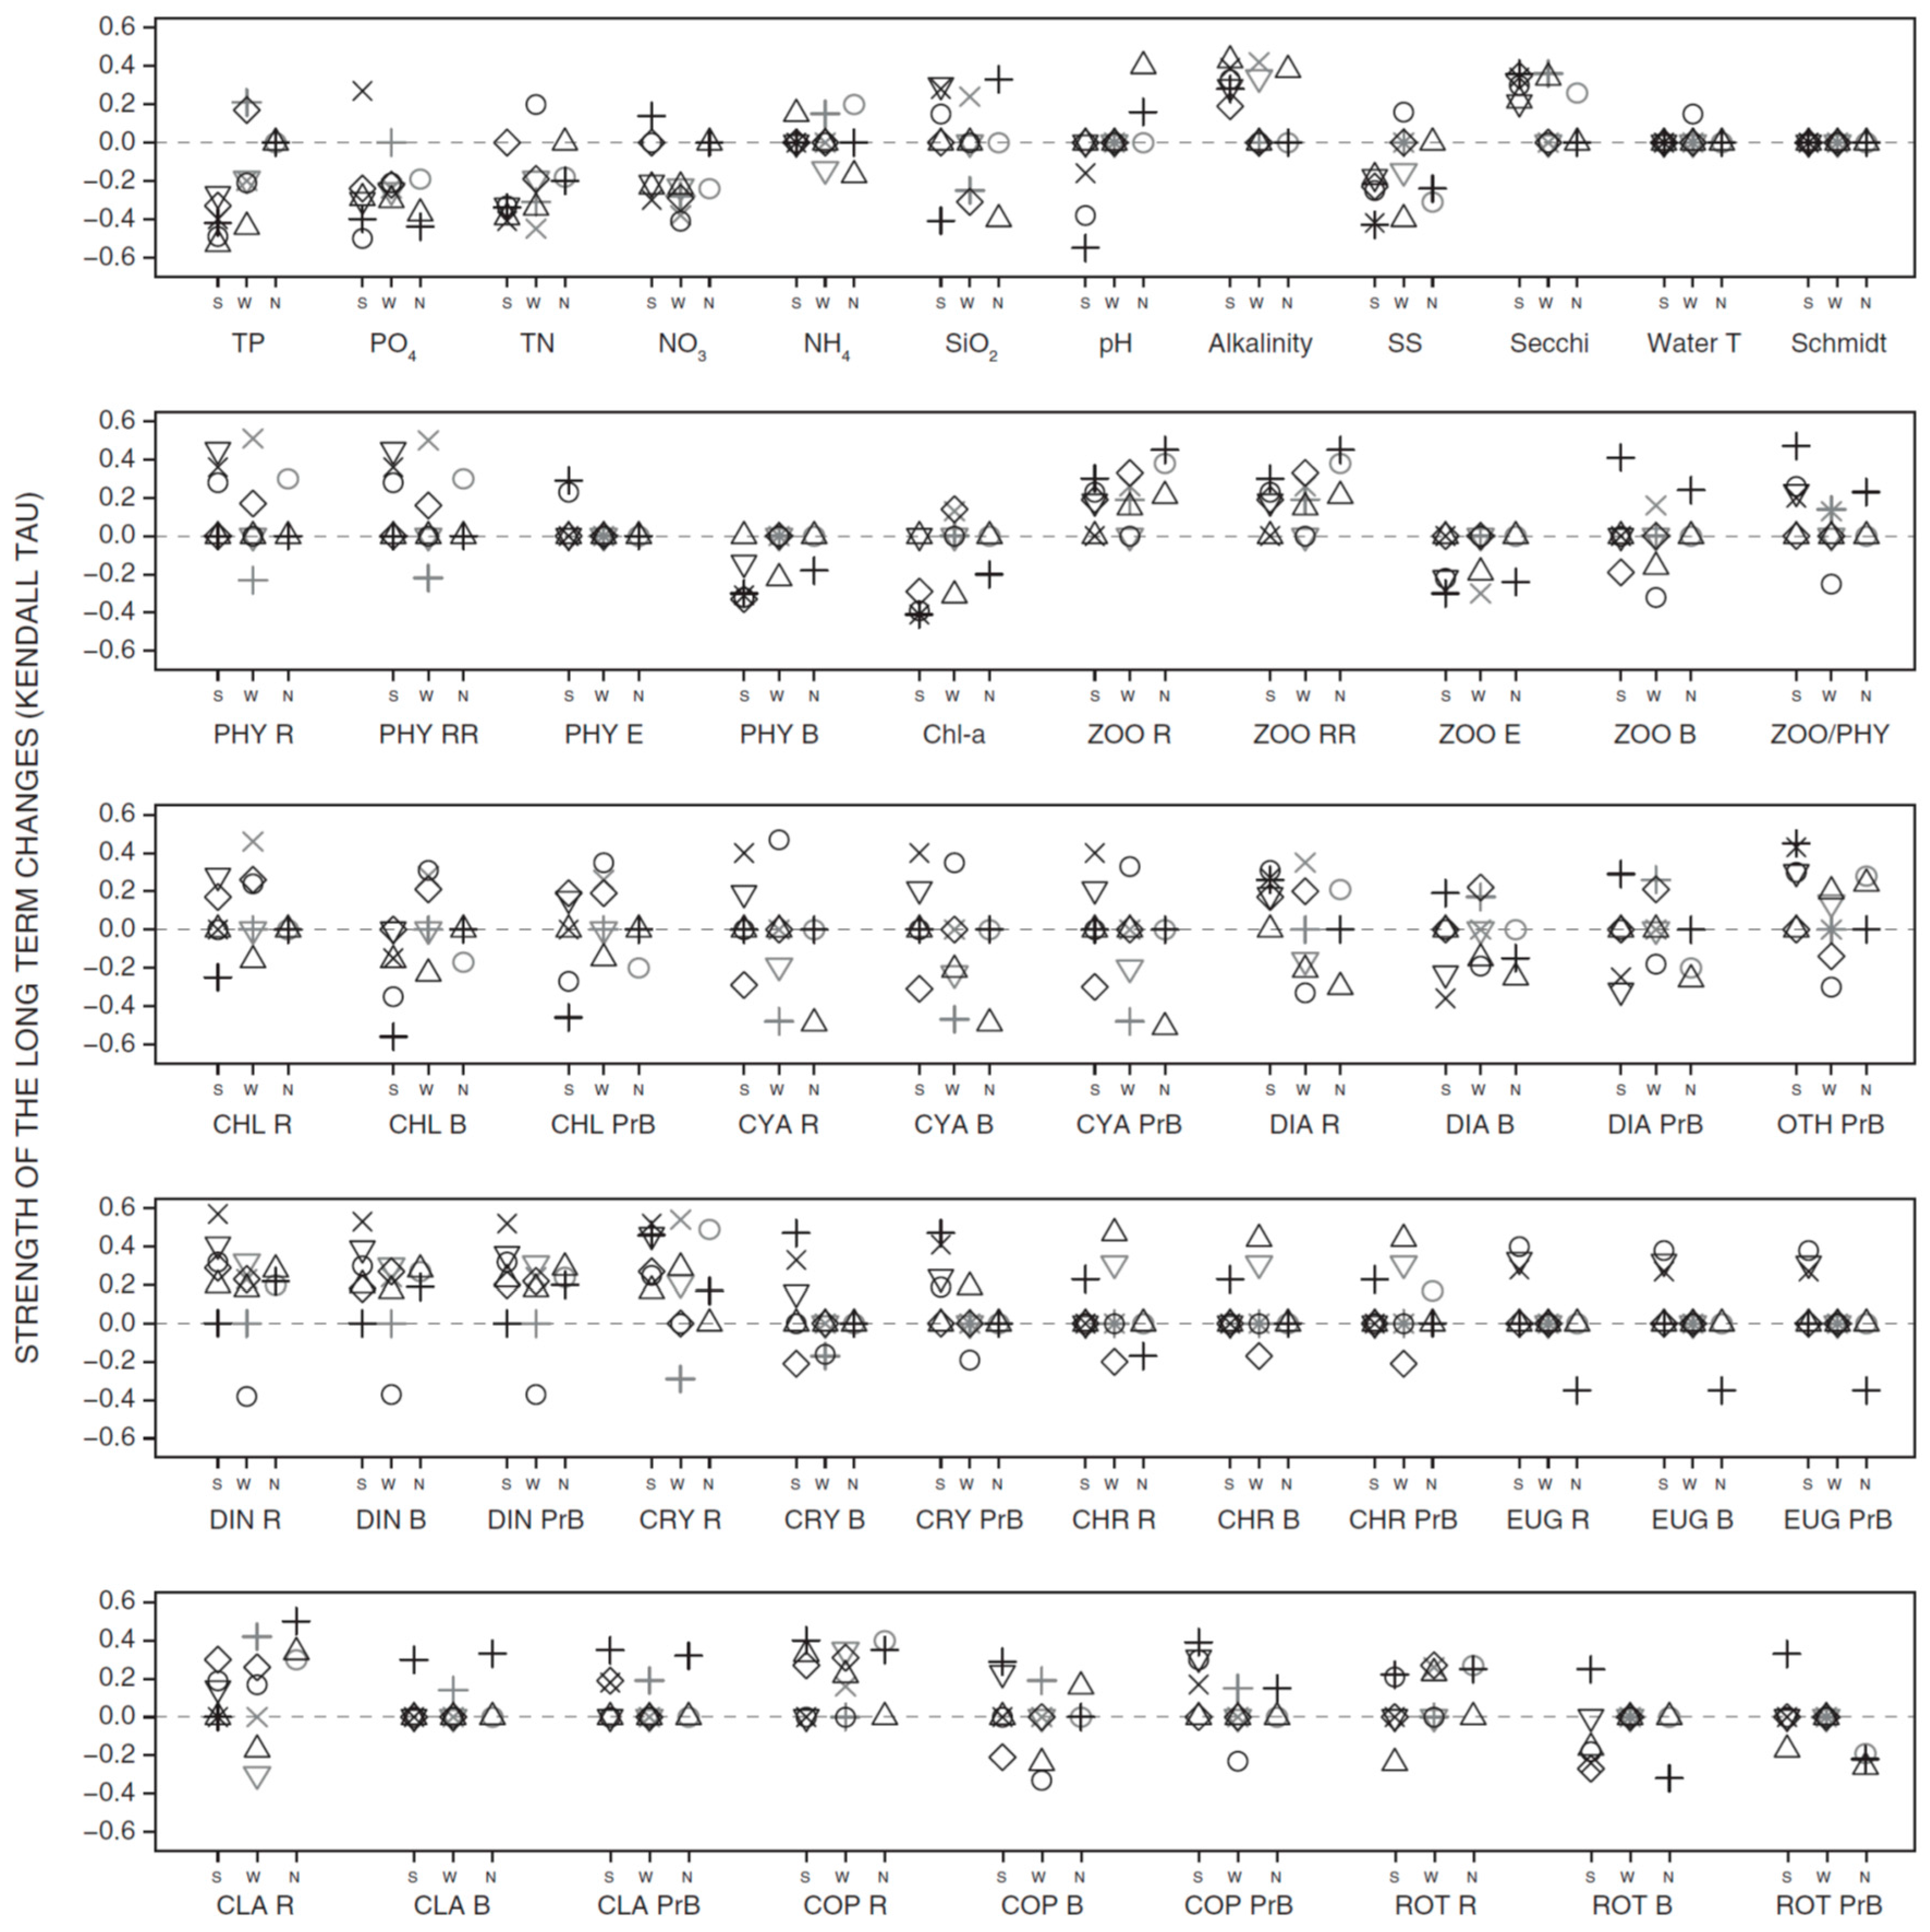
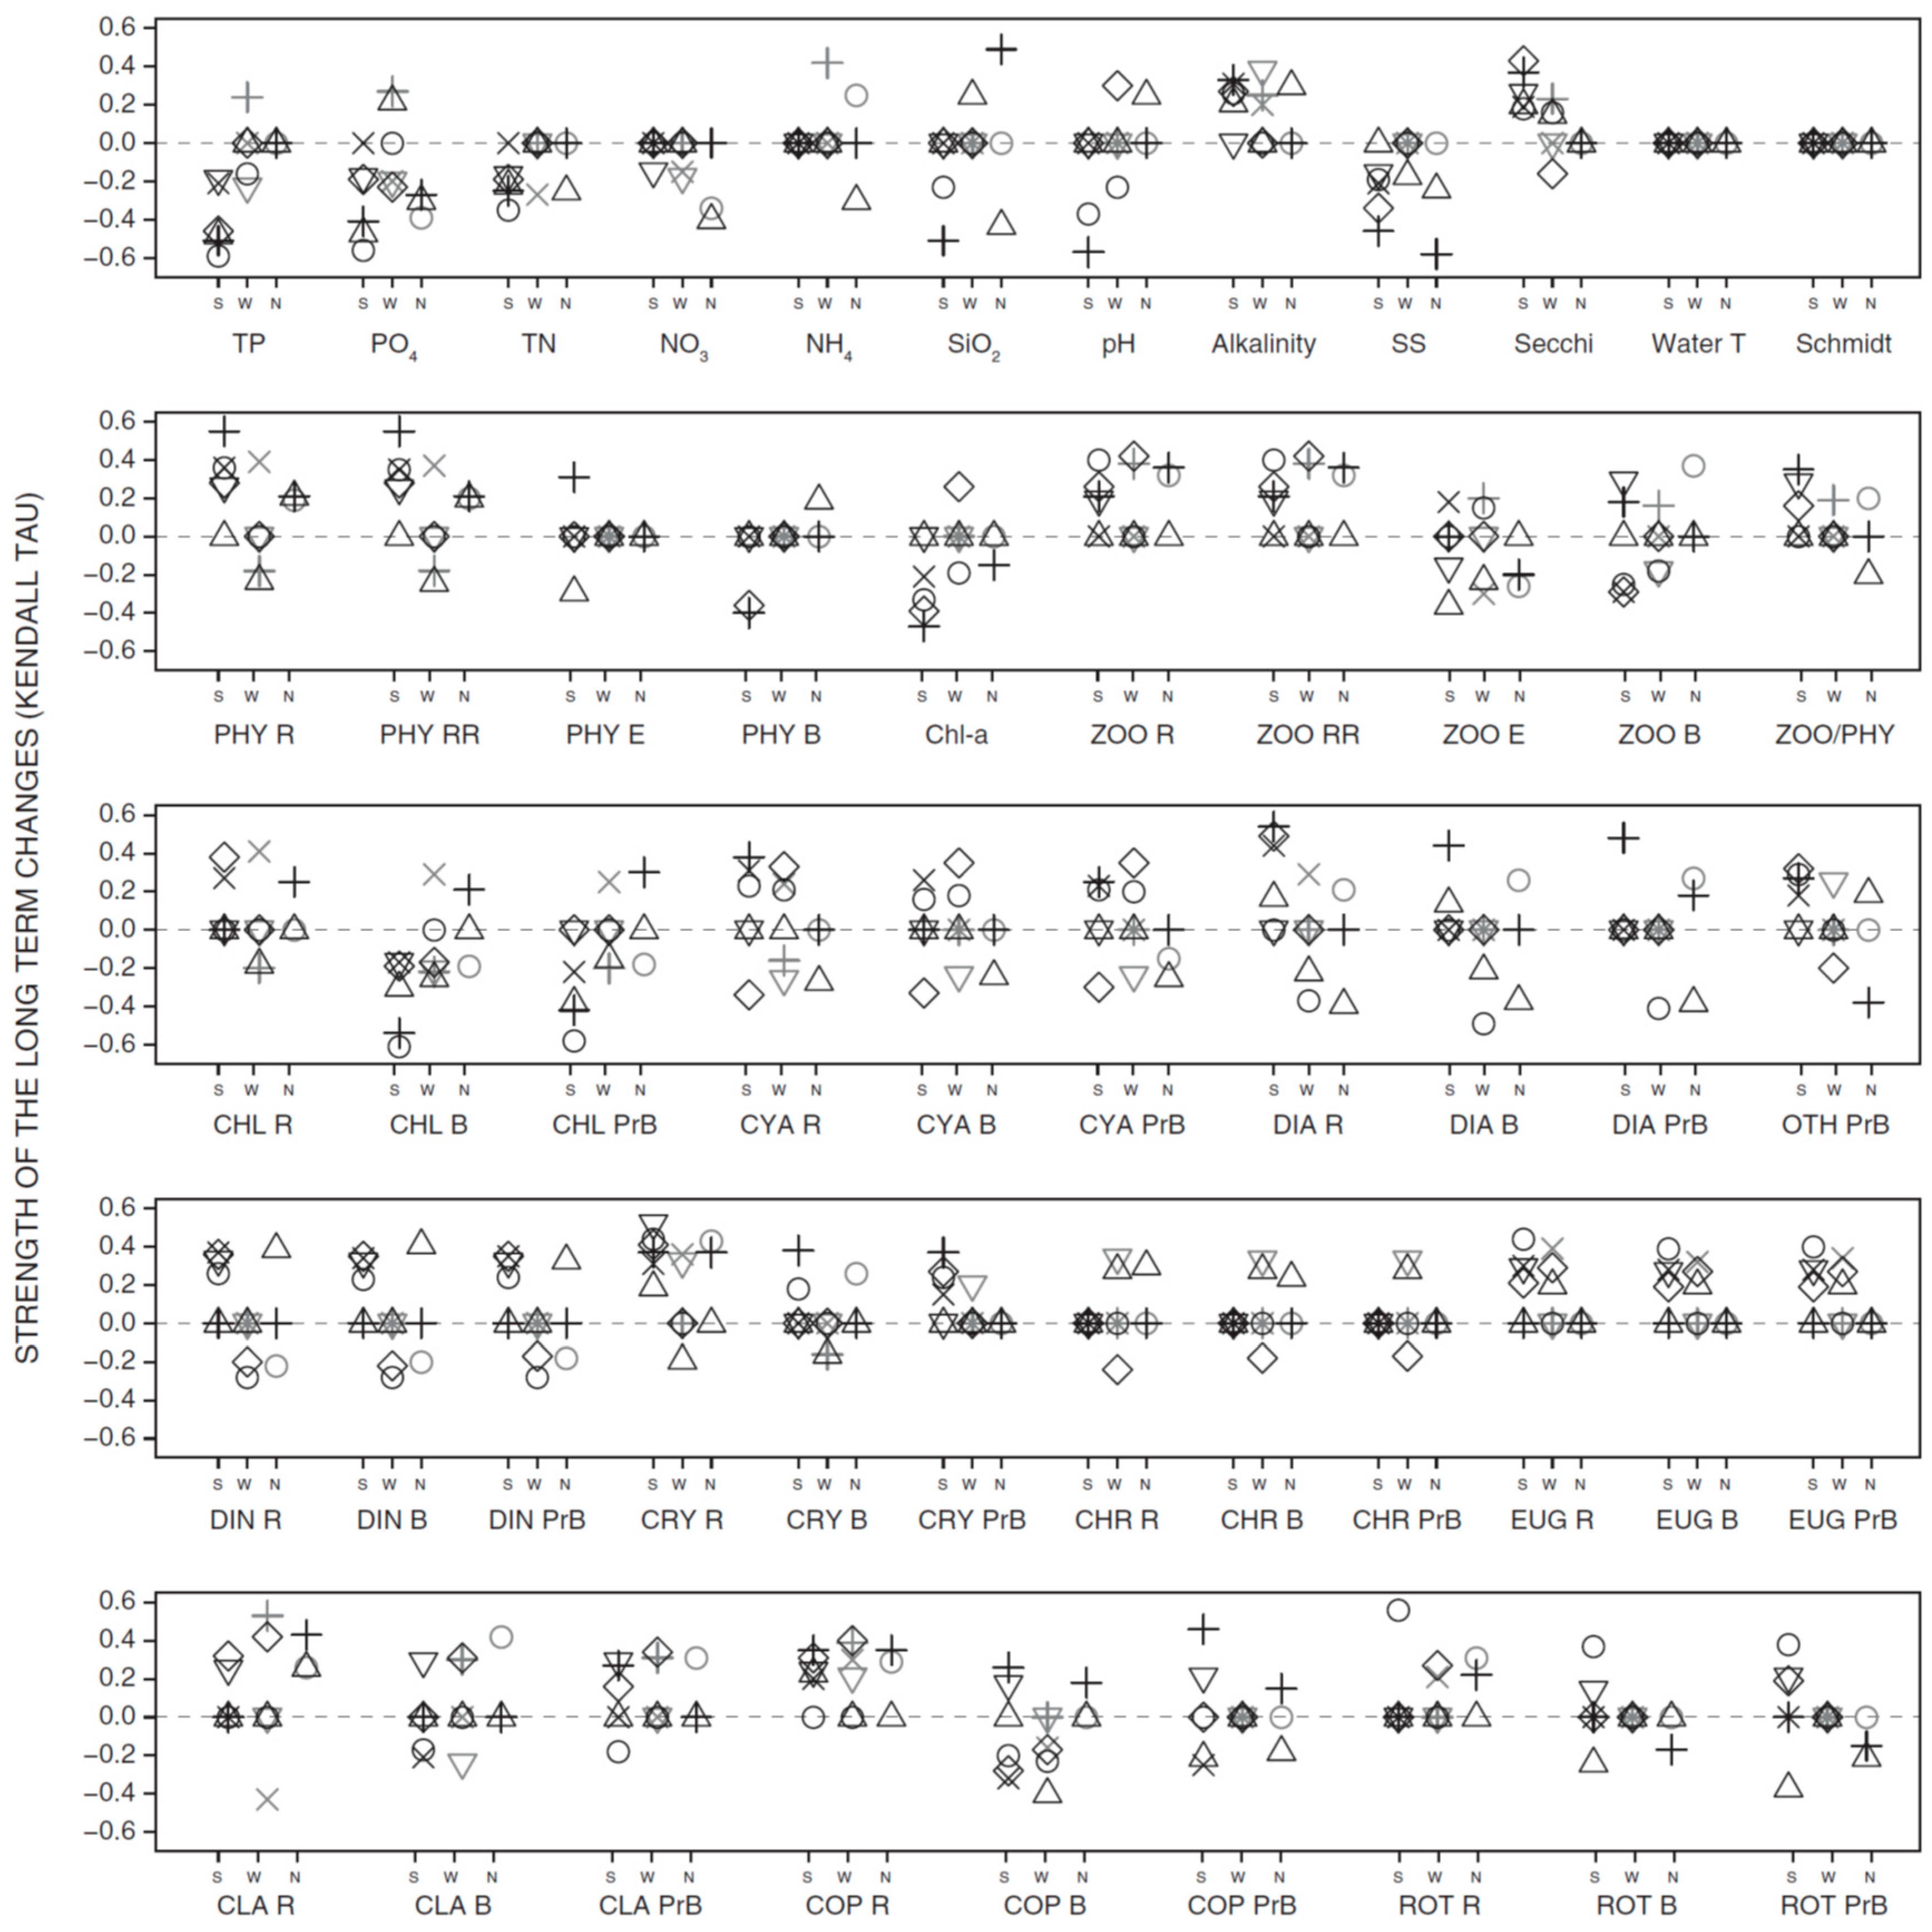
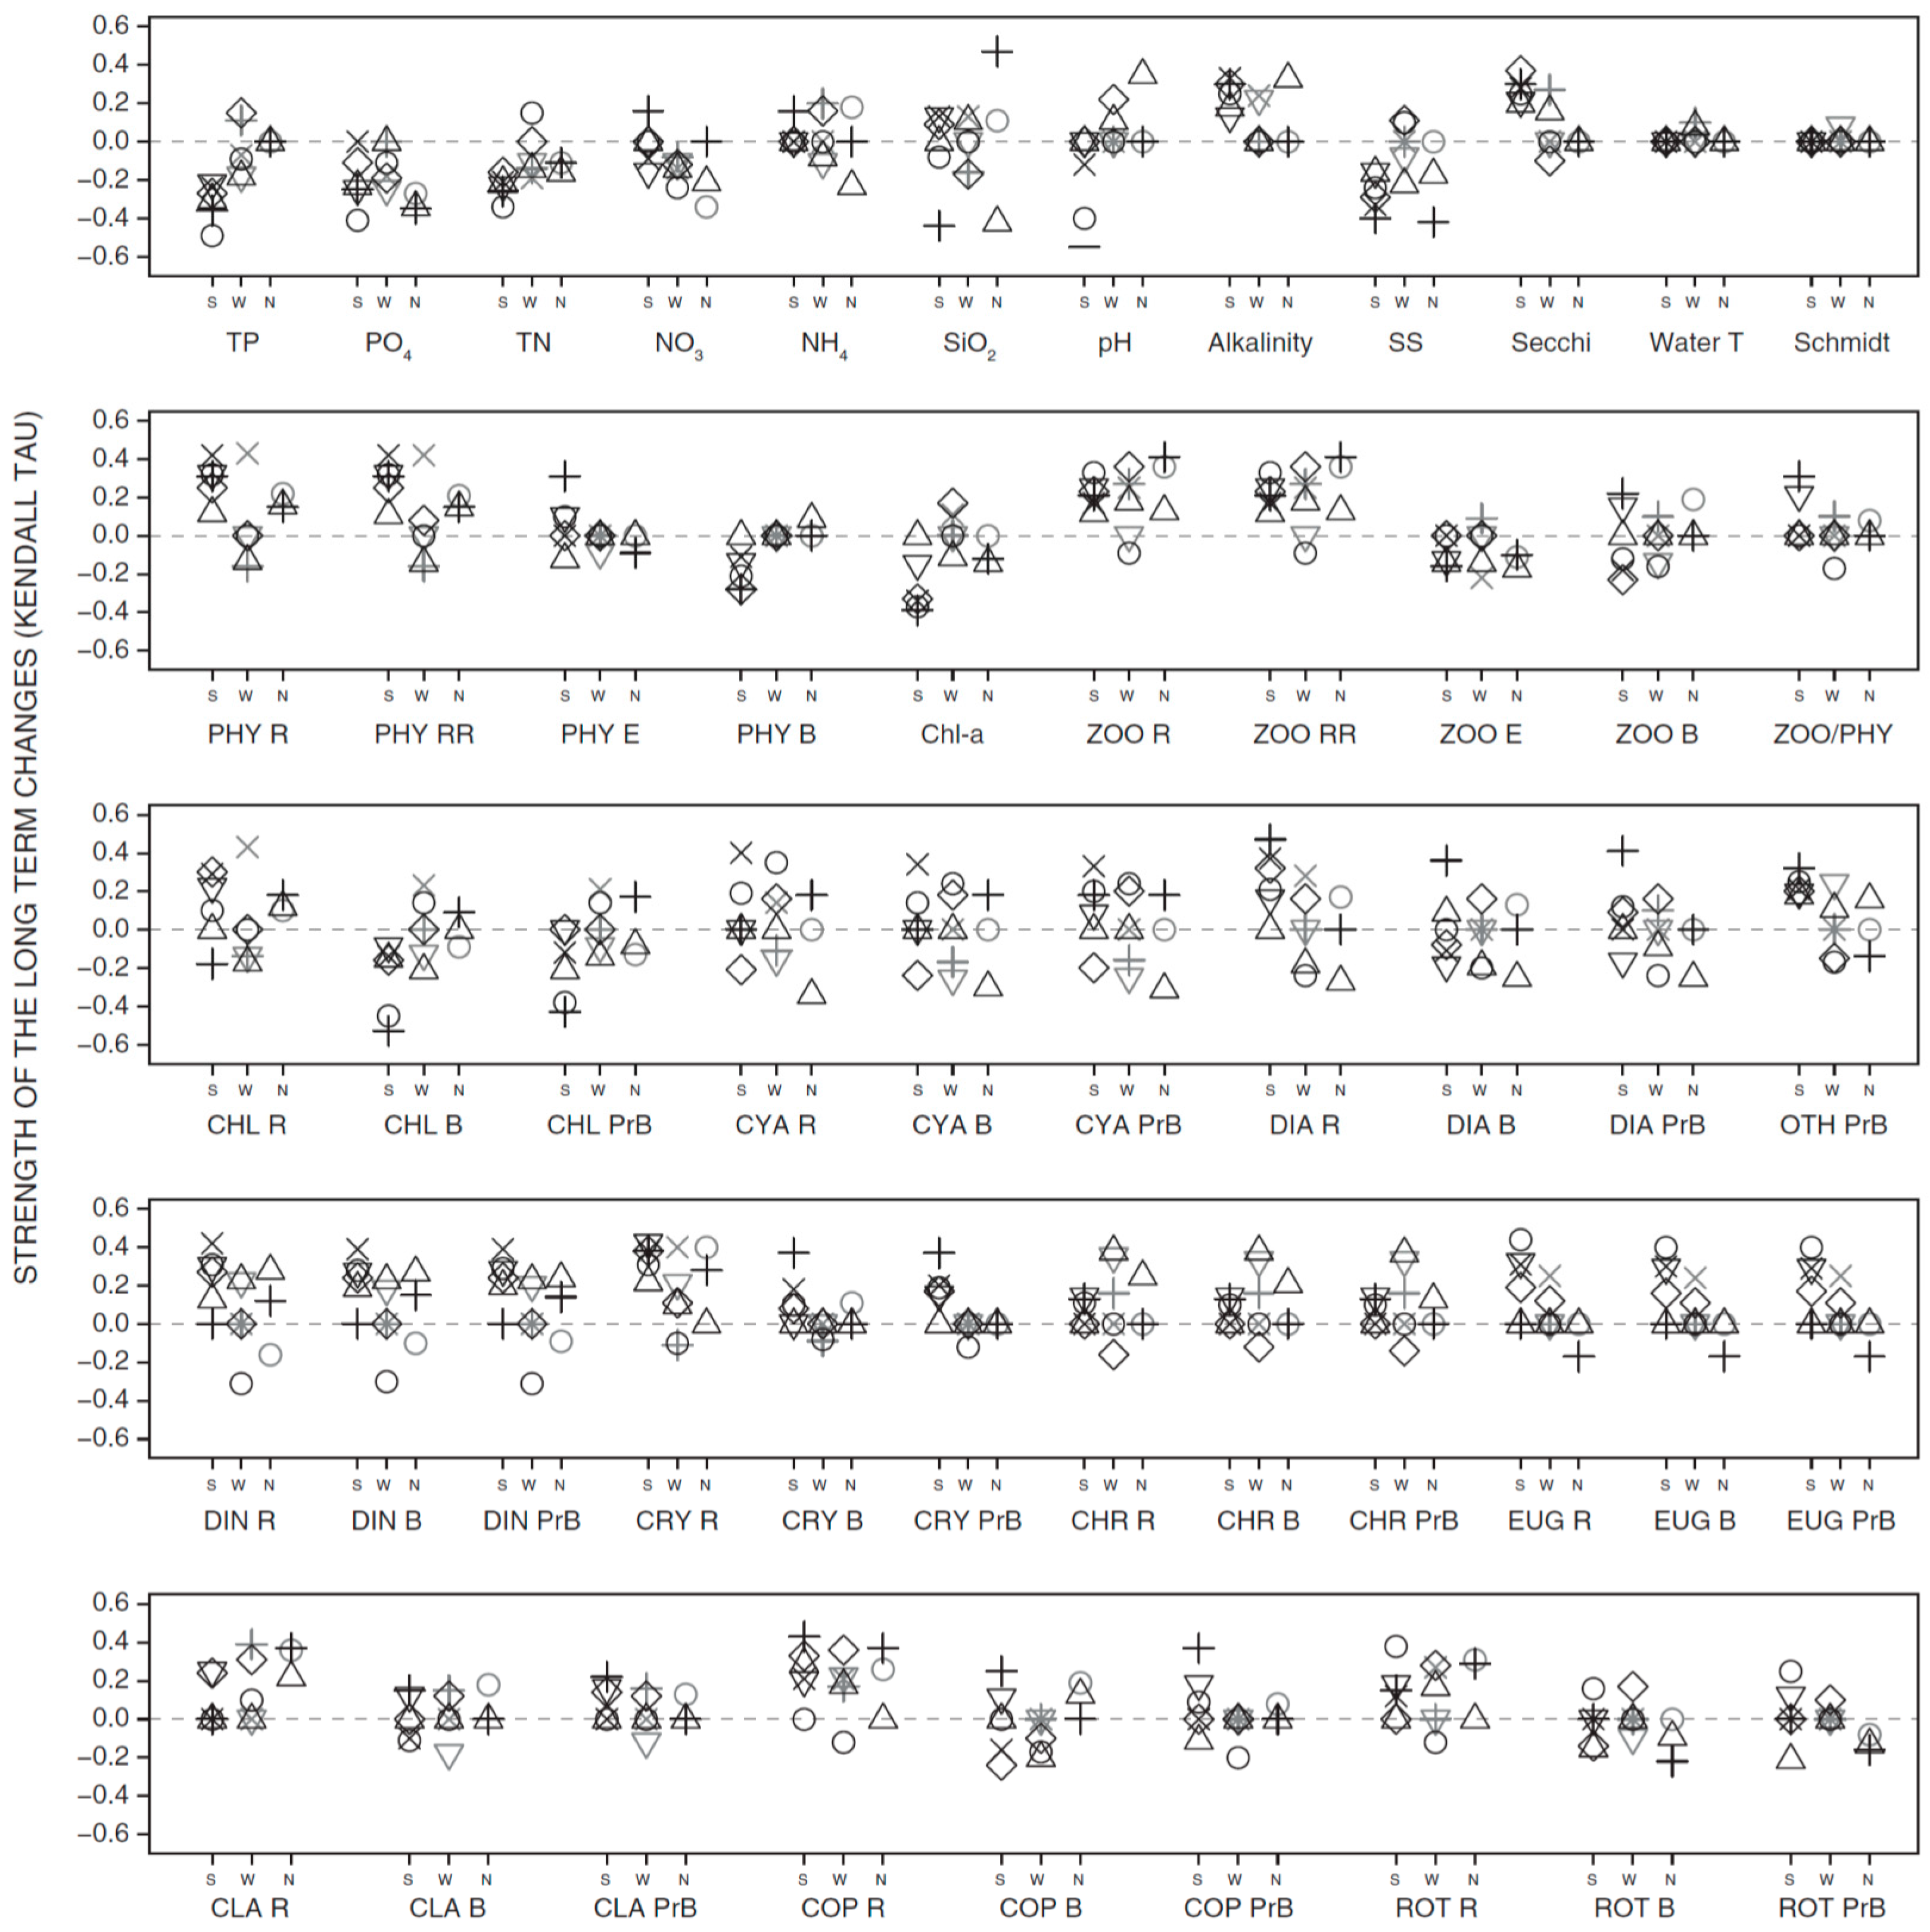
3.2. Long-Term Trends in Environmental and Plankton Variables
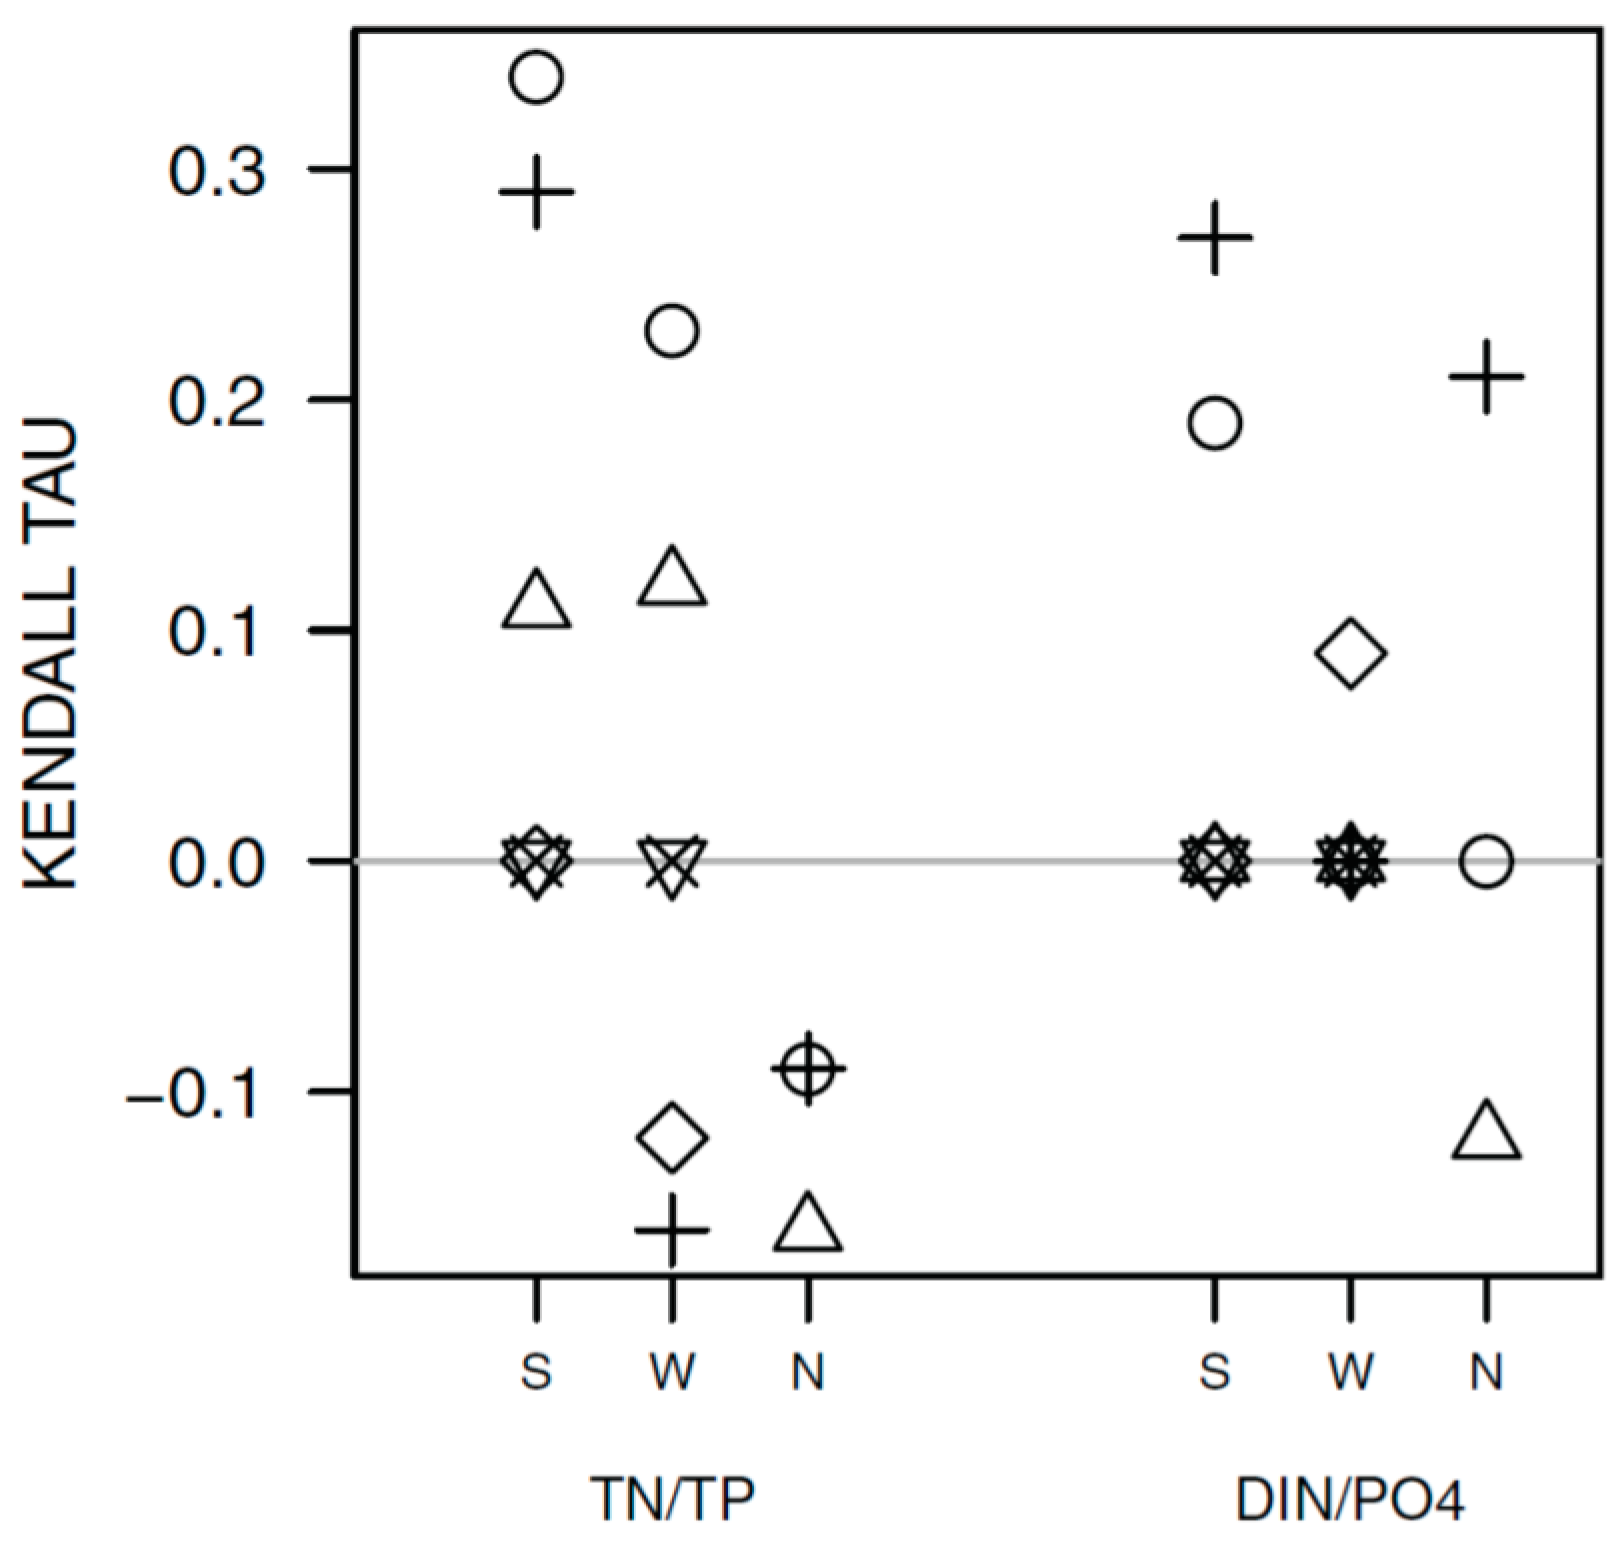
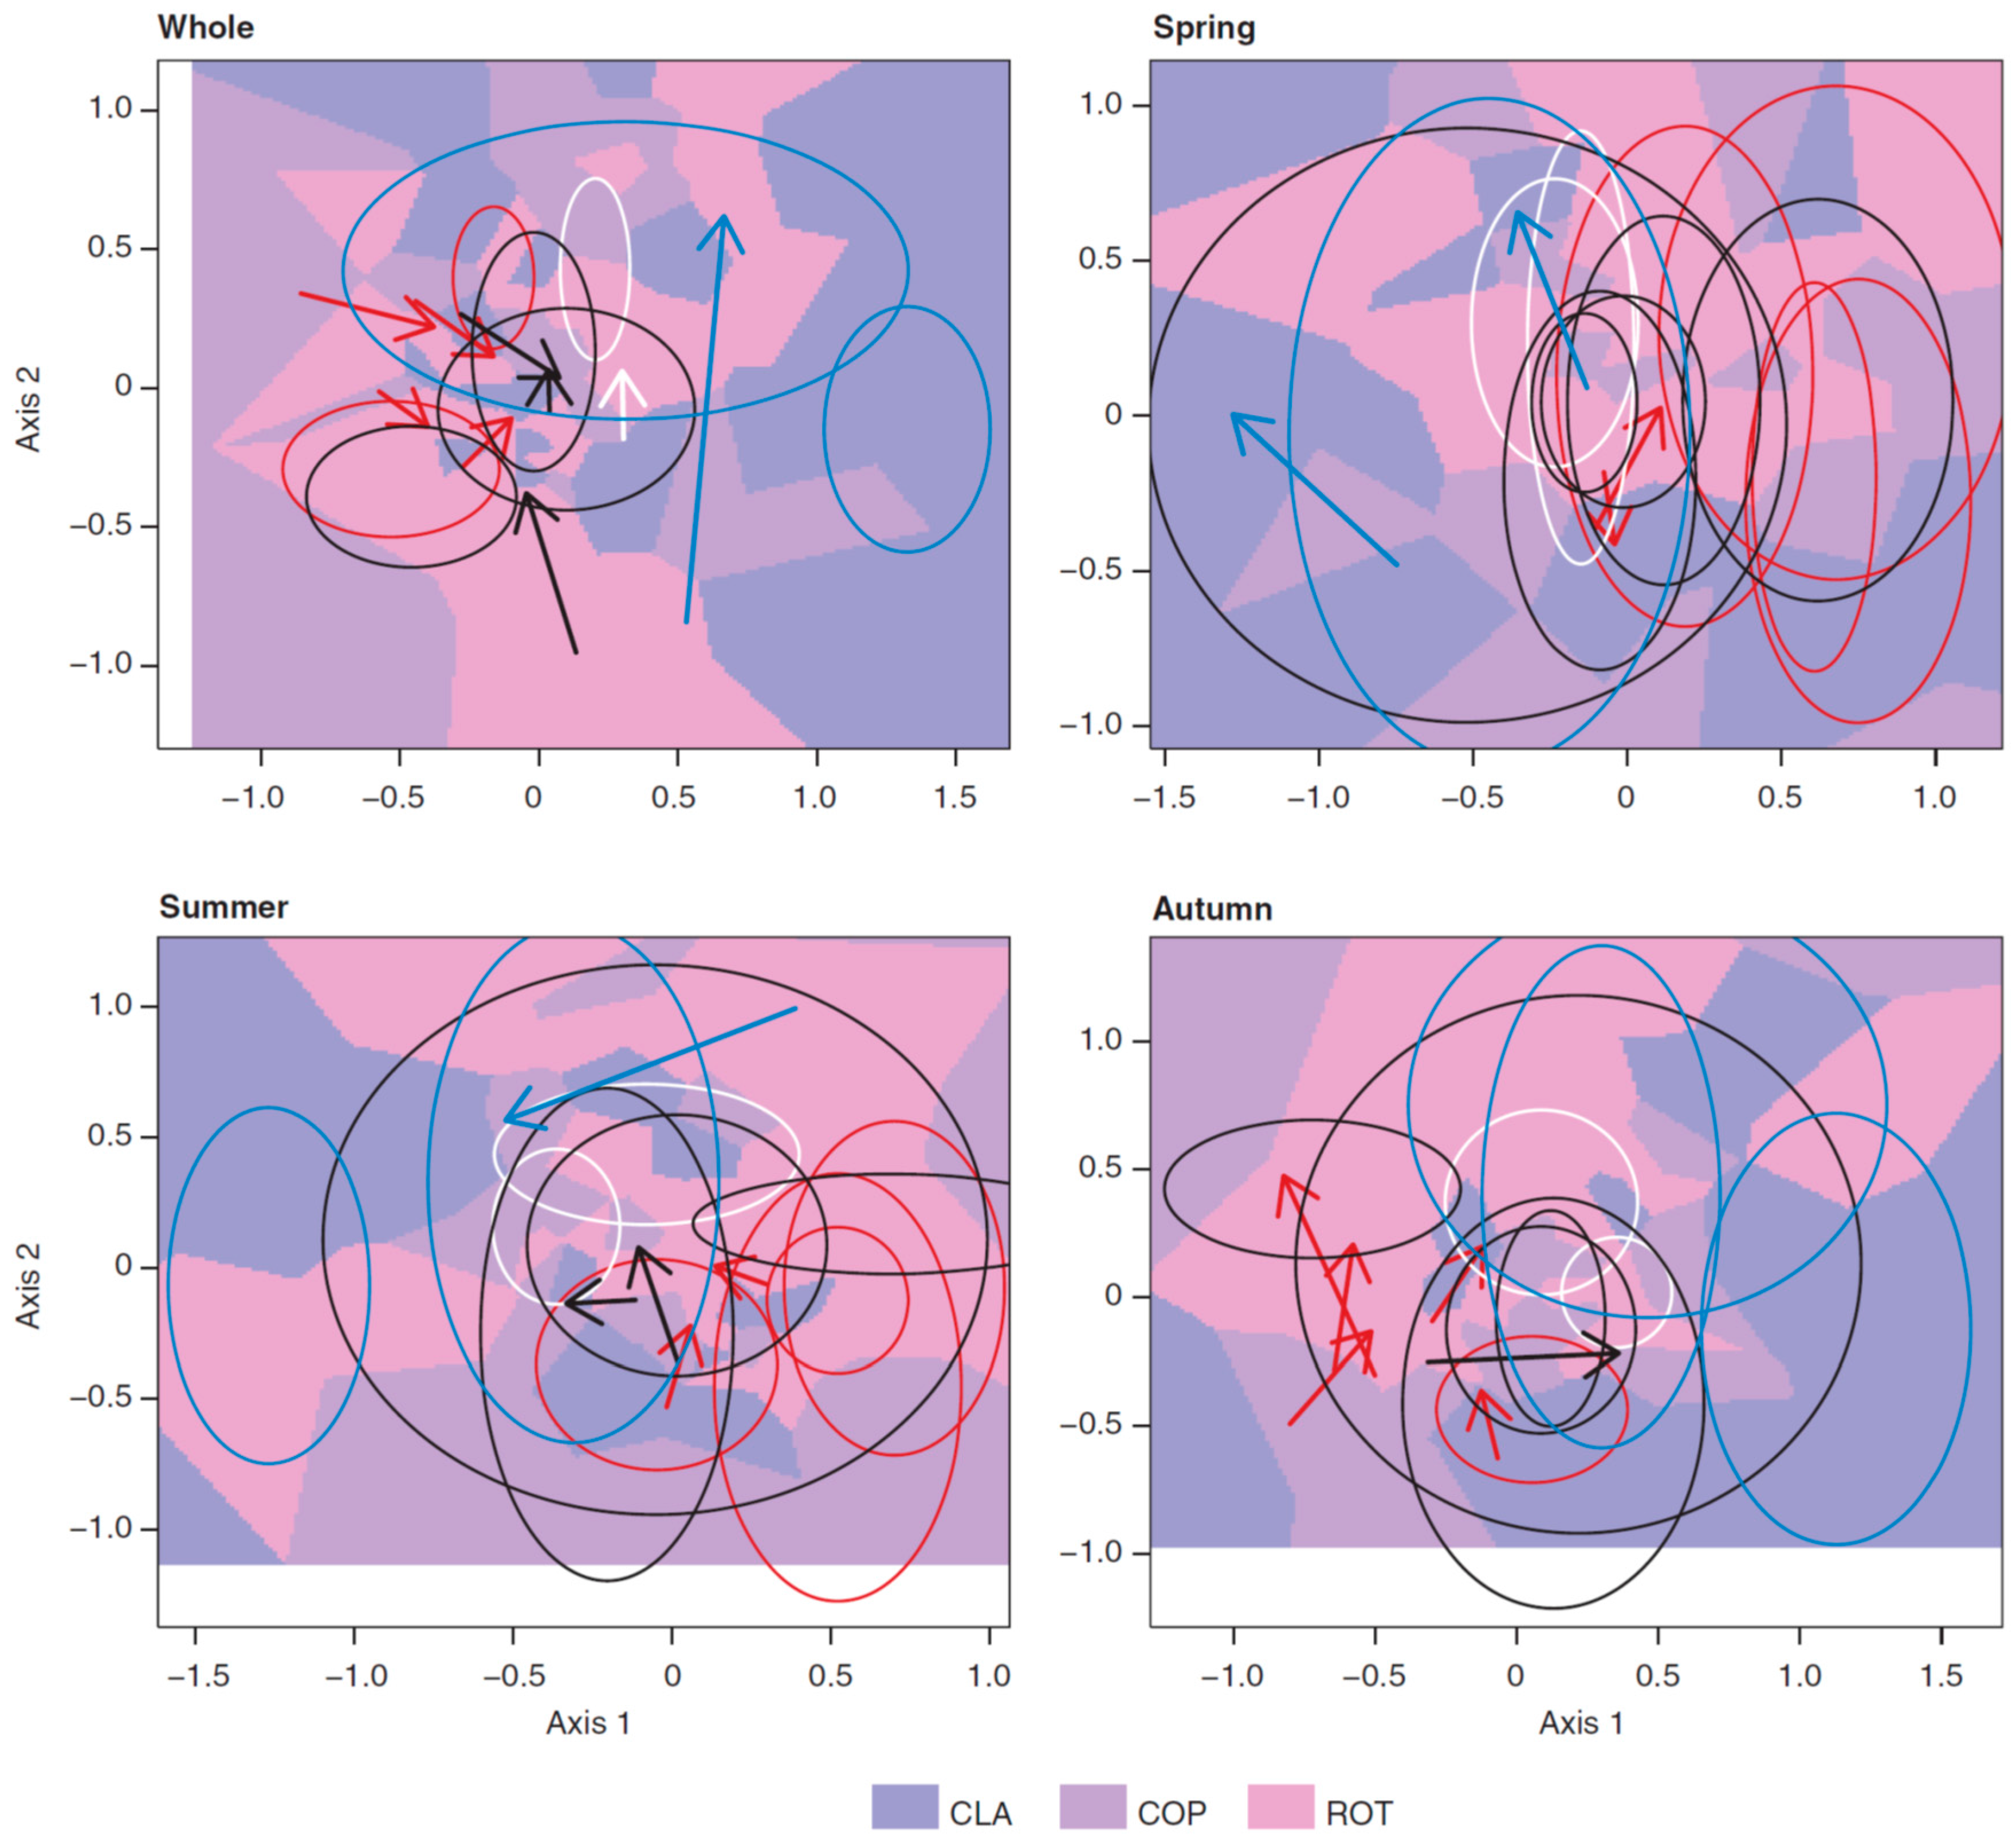
3.3. Long-Term Trends in Plankton Community Composition
4. Discussion
Acknowledgments
Author Contributions
Conflicts of Interest
Appendix A

| Original | One Week | Two Weeks | One Month | Missing | |
|---|---|---|---|---|---|
| TP | 0.97 | 0.015 | 0.005 | 0.005 | 0.005 |
| PO4 | 0.968 | 0.015 | 0.005 | 0.005 | 0.006 |
| TN | 0.969 | 0.015 | 0.005 | 0.006 | 0.006 |
| NO3-2 | 0.966 | 0.015 | 0.005 | 0.004 | 0.01 |
| NH4 | 0.968 | 0.015 | 0.005 | 0.006 | 0.006 |
| pH | 0.97 | 0.015 | 0.004 | 0.005 | 0.005 |
| Alkalinity | 0.956 | 0.015 | 0.005 | 0.007 | 0.018 |
| Chl-a | 0.964 | 0.015 | 0.005 | 0.007 | 0.009 |
| SS | 0.949 | 0.013 | 0.005 | 0.007 | 0.026 |
| Secchi | 0.963 | 0.006 | 0.004 | 0.005 | 0.021 |
| SiO2 | 0.967 | 0.015 | 0.005 | 0.007 | 0.007 |
| Water Temperature | 0.956 | 0.006 | 0.005 | 0.009 | 0.024 |
| Schmidt | 0.884 | 0.006 | 0.004 | 0.01 | 0.096 |
| Air Temperature | Irradiance | Precipitation | Wind Speed | |
|---|---|---|---|---|
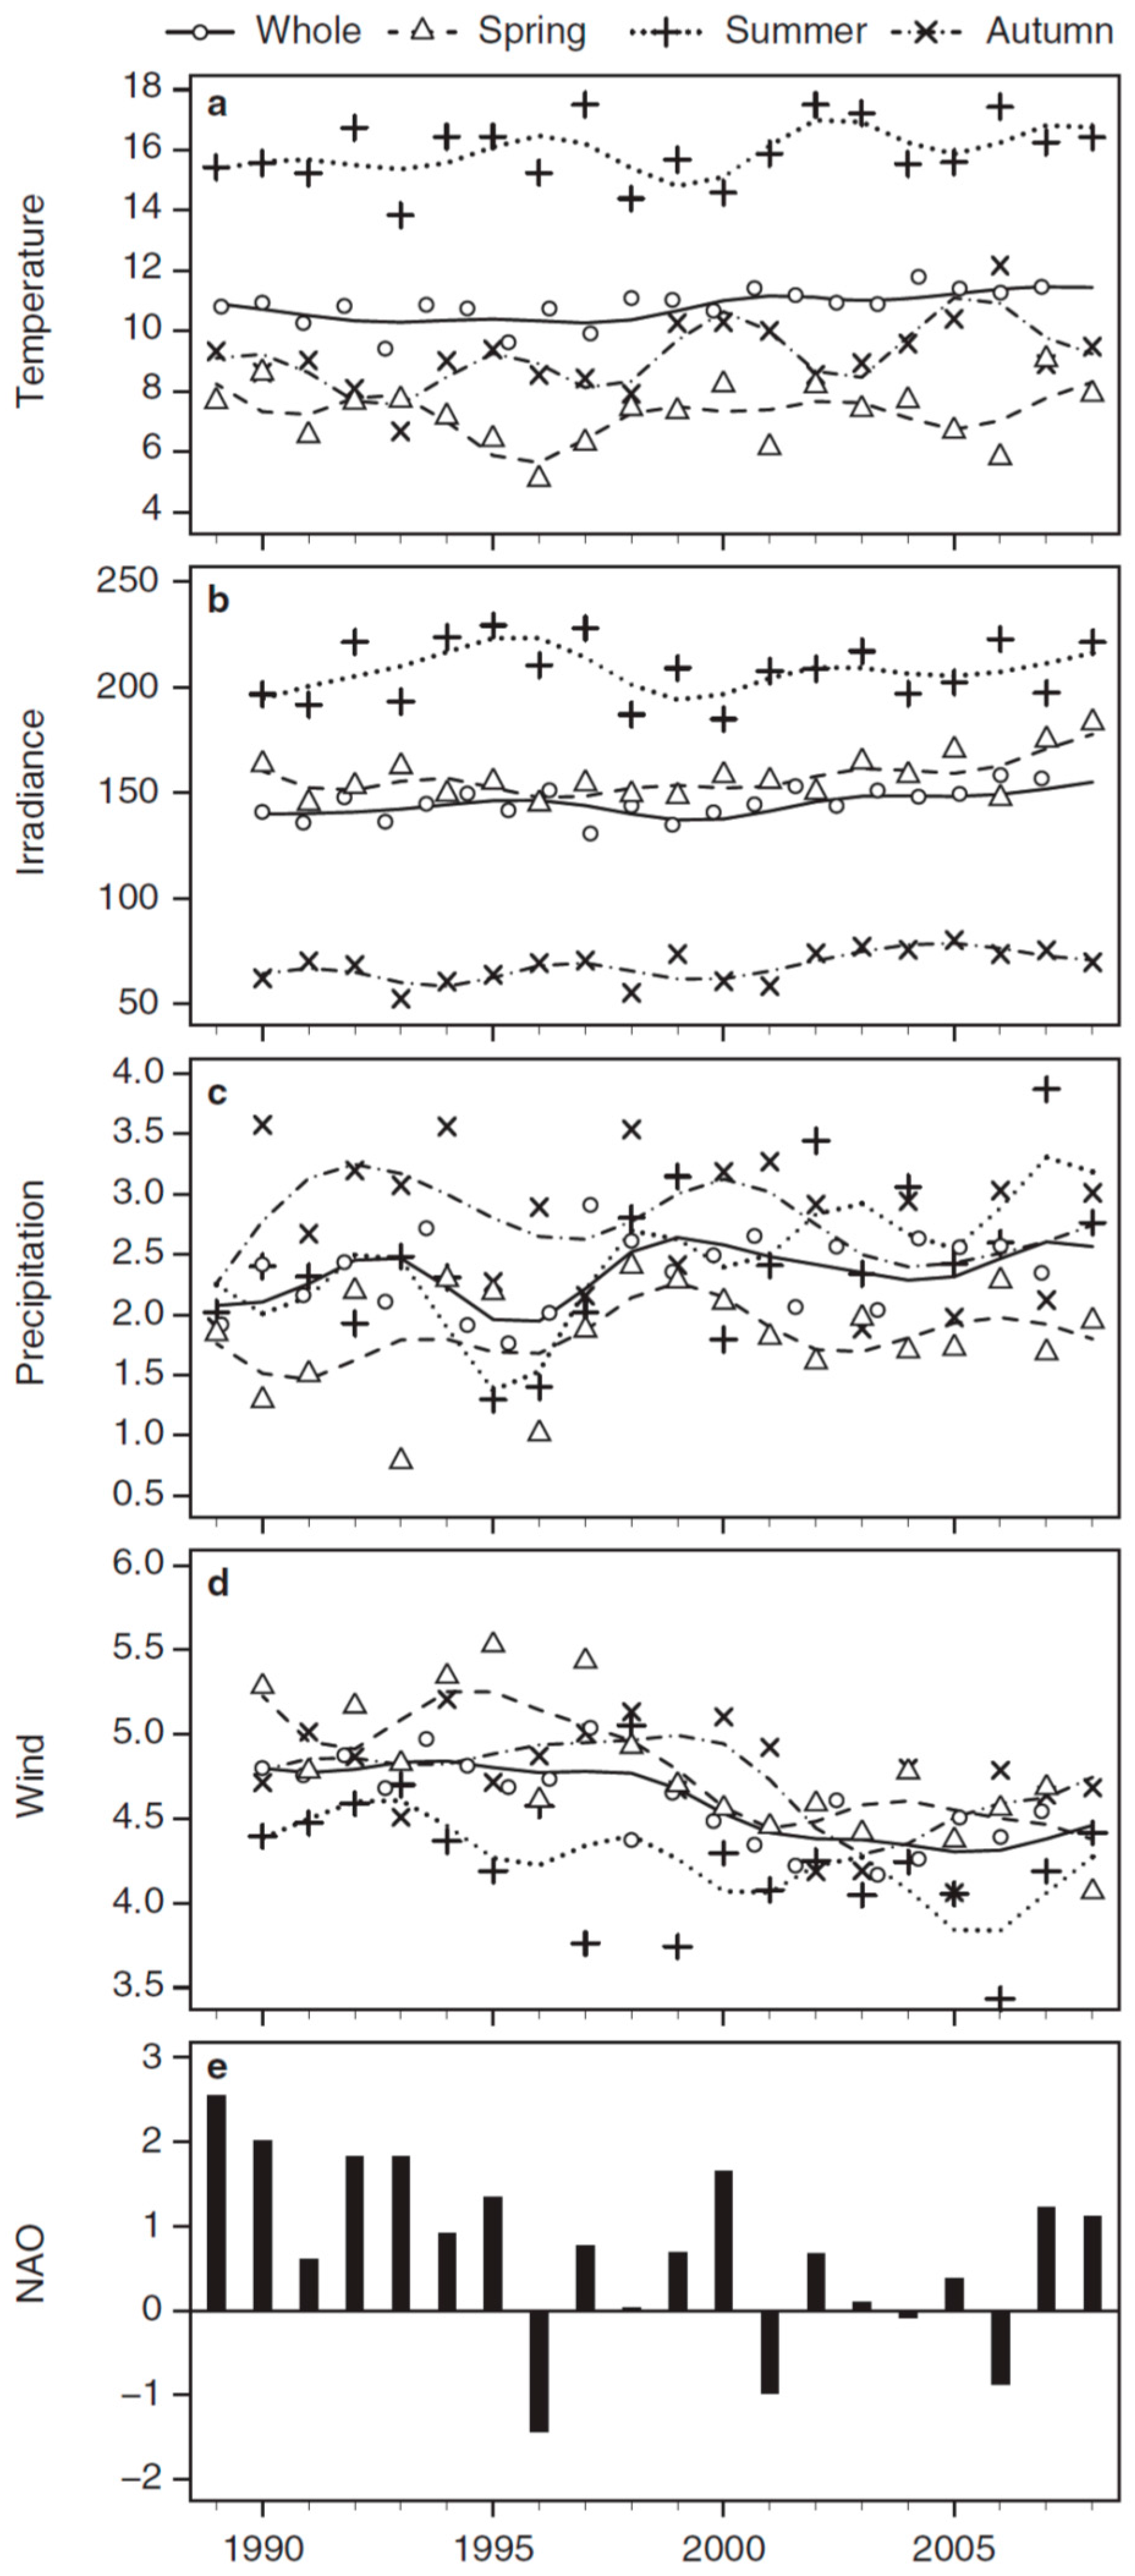
| Whole | 0.05 *** | 0.01 ns | 0.02 * | −0.07 *** |
| Spring | 0.05 *** | 0.07 *** | −0.01 ns | −0.10 *** |
| Summer | 0.09 *** | −0.00 ns | 0.05 *** | −0.08 *** |
| Autumn | 0.04 ** | 0.01 ns | 0.00 ns | −0.05 ** |


References
- Isermann, K. Share of agriculture in nitrogen and phosphorus emissions into the surface waters of western-Europe against the background of their eutrophication. Fertil. Res. 1990, 26, 253–269. [Google Scholar] [CrossRef]
- Smith, V.H.; Tilman, G.D.; Nekola, J.C. Eutrophication: Impacts of excess nutrient inputs on freshwater, marine, and terrestrial ecosystems. Environ. Pollut. 1999, 100, 179–196. [Google Scholar] [CrossRef]
- Cooke, G.D.; Welch, E.B.; Peterson, S.A.; Newroth, P.R. Restoration and Management of Lakes and Reservoirs, 2nd ed.; Lewis Publishers: Boca Raton, FL, USA, 1993. [Google Scholar]
- Carpenter, S.R.; Ludwig, D.; Brock, W.A. Management of eutrophication for lakes subject to potentially irreversible change. Ecol. Appl. 1999, 9, 751–771. [Google Scholar] [CrossRef]
- Jeppesen, E.; Søndergaard, M.; Jensen, J.P.; Havens, K.E.; Anneville, O.; Carvalho, L.; Coveney, M.F.; Deneke, R.; Dokulil, M.T.; Foy, B.; et al. Lake responses to reduced nutrient loading—An analysis of contemporary long-term data from 35 case studies. Freshw. Biol. 2005, 50, 1747–1771. [Google Scholar] [CrossRef]
- Kernan, M.; Battarbee, R.W.; Moss, B. Climate Change Impacts on Freshwater Ecosystems; Wiley-Blackwell: Oxford, UK, 2010. [Google Scholar]
- Vogt, R.J.; Rusak, J.A.; Patoine, A.; Leavitt, P.R. Differential effects of energy and mass influx on the landscape synchrony of lake ecosystems. Ecology 2011, 92, 1104–1114. [Google Scholar] [CrossRef] [PubMed]
- Paerl, H.W.; Huisman, J. Blooms like it hot. Science 2008, 320, 57–58. [Google Scholar] [CrossRef] [PubMed]
- Jeppesen, E.; Moss, B.; Bennion, H.; Friberg, N.; Gessner, M.O.; May, L. Chapter 6: Interaction of climate and eutrophication. In Changing Climate and Changing Freshwaters: A European Perspective; Kernan, M., Battarbee, R., Moss, B., Eds.; Wiley-Blackwell: Oxford, UK, 2009; pp. 119–151. [Google Scholar]
- Moss, B.; Kosten, S.; Meerhoff, M.; Battarbee, R.W.; Jeppesen, E.; Mazzeo, N.; Havens, K.; Lacerot, G.; Liu, Z.W.; De Meester, L.; et al. Allied attack: Climate change and eutrophication. Inland Waters 2011, 1, 101–105. [Google Scholar] [CrossRef]
- Schindler, D.W. The cumulative effects of climate warming and other human stresses on Canadian freshwaters in the new millennium. Can. J. Fish. Aquat. Sci. 2001, 58, 18–29. [Google Scholar] [CrossRef]
- Smith, V.H.; Schindler, D.W. Eutrophication science: Where do we go from here? Trends Ecol. Evol. 2009, 24, 201–207. [Google Scholar] [CrossRef] [PubMed]
- Köhler, J.; Hilt, S.; Adrian, R.; Nicklisch, A.; Kozerski, H.P.; Walz, N. Long-term response of a shallow, moderately flushed lake to reduced external phosphorus and nitrogen loading. Freshw. Biol. 2005, 50, 1639–1650. [Google Scholar] [CrossRef]
- Anderson, N.J.; Jeppesen, E.; Søndergaard, M. Ecological effects of reduced nutrient loading (oligotrophication) on lakes: An introduction. Freshw. Biol. 2005, 50, 1589–1593. [Google Scholar] [CrossRef]
- Anneville, O.; Souissi, S.; Gammeter, S.; Straile, D. Seasonal and inter-annual scales of variability in phytoplankton assemblages: Comparison of phytoplankton dynamics in three peri-alpine lakes over a period of 28 years. Freshw. Biol. 2004, 49, 98–115. [Google Scholar] [CrossRef]
- Salmaso, N. Long-term phytoplankton community changes in a deep subalpine lake: Responses to nutrient availability and climatic fluctuations. Freshw. Biol. 2010, 55, 825–846. [Google Scholar] [CrossRef]
- Arhonditsis, G.B.; Brett, M.T.; DeGasperi, C.L.; Schindler, D.E. Effects of climatic variability on the thermal properties of Lake Washington. Limnol. Oceanogr. 2004, 49, 256–270. [Google Scholar] [CrossRef]
- Coats, R.; Perez-Losada, J.; Schladow, G.; Richards, R.; Goldman, C. The warming of Lake Tahoe. Clim. Chang. 2006, 76, 121–148. [Google Scholar] [CrossRef]
- Livingstone, D.M. Impact of secular climate change on the thermal structure of a large temperate central European lake. Clim. Chang. 2003, 57, 205–225. [Google Scholar] [CrossRef]
- Dokulil, M.T.; Jagsch, A.; George, G.D.; Anneville, O.; Jankowski, T.; Wahl, B.; Lenhart, B.; Blenckner, T.; Teubner, K. Twenty years of spatially coherent deepwater warming in lakes across europe related to the North Atlantic Oscillation. Limnol. Oceanogr. 2006, 51, 2787–2793. [Google Scholar] [CrossRef]
- Jeppesen, E.; Kronvang, B.; Jørgensen, T.B.; Larsen, S.E.; Andersen, H.E.; Søndergaard, M.; Liboriussen, L.; Bjerring, R.; Johansson, L.S.; Trolle, D. Recent climate-induced changes in freshwaters in denmark. In Climatic Change and Global Warming of Inland Waters: Impacts and Mitigation for Ecosystems and Societies; Wiley-Blackwell: Oxford, UK, 2013; pp. 155–171. [Google Scholar]
- Anderson, J.; Foy, R.H.; Engstrom, D.R.; Rippey, B.; Alamgir, F. Climate forcing of diatom productivity in a lowland, eutrophic lake: White lough revisited. Freshw. Biol. 2012, 57, 2030–2043. [Google Scholar] [CrossRef]
- Pomati, F.; Matthews, B.; Jokela, J.; Schildknecht, A.; Ibelings, B.W. Effects of re-oligotrophication and climate warming on plankton richness and community stability in a deep mesotrophic lake. Oikos 2011, 121, 1317–1327. [Google Scholar] [CrossRef]
- Thackeray, S.J.; Jones, I.D.; Maberly, S.C. Long-term change in the phenology of spring phytoplankton: Species-specific responses to nutrient enrichment and climatic change. J. Ecol. 2008, 96, 523–535. [Google Scholar] [CrossRef]
- Meis, S.; Thackeray, S.J.; Jones, I.D. Effects of recent climate change on phytoplankton phenology in a temperate lake. Freshw. Biol. 2009, 54, 1888–1898. [Google Scholar] [CrossRef]
- Blenckner, T.; Adrian, R.; Livingstone, D.M.; Jennings, E.; Weyhenmeyer, G.A.; George, D.G.; Jankowski, T.; Jarvinen, M.; Aonghusa, C.N.; Noges, T.; et al. Large-scale climatic signatures in lakes across Europe: A meta-analysis. Glob. Chang. Biol. 2007, 13, 1314–1326. [Google Scholar] [CrossRef]
- Anneville, O.; Gammeter, S.; Straile, D. Phosphorus decrease and climate variability: Mediators of synchrony in phytoplankton changes among European peri-alpine lakes. Freshw. Biol. 2005, 50, 1731–1746. [Google Scholar] [CrossRef]
- Winder, M.; Reuter, J.E.; Schladow, S.G. Lake warming favours small-sized planktonic diatom species. Proc. R. Soc. B Biol. Sci. 2009, 276, 427–435. [Google Scholar] [CrossRef] [PubMed]
- Edwards, M.; Richardson, A.J. Impact of climate change on marine pelagic phenology and trophic mismatch. Nature 2004, 430, 881–884. [Google Scholar] [CrossRef] [PubMed]
- Winder, M.; Schindler, D.E. Climate change uncouples trophic interactions in an aquatic ecosystem. Ecology 2004, 85, 2100–2106. [Google Scholar] [CrossRef]
- Dong, X.H.; Bennion, H.; Maberly, S.C.; Sayer, C.D.; Simpson, G.L.; Battarbee, R.W. Nutrients exert a stronger control than climate on recent diatom communities in Esthwaite water: Evidence from monitoring and palaeolimnological records. Freshw. Biol. 2012, 57, 2044–2056. [Google Scholar] [CrossRef]
- Moss, B.; Barker, T.O.M.; Stephen, D.; Williams, A.E.; Balayla, D.J.; Beklioglu, M.; Carvalho, L. Consequences of reduced nutrient loading on a lake system in a lowland catchment: Deviations from the norm? Freshw. Biol. 2005, 50, 1687–1705. [Google Scholar] [CrossRef]
- Nõges, P.; Mischke, U.; Laugaste, R.; Solimini, A. Analysis of changes over 44 years in the phytoplankton of Lake Võrtsjärv (Estonia): The effect of nutrients, climate and the investigator on phytoplankton-based water quality indices. Hydrobiologia 2010, 646, 33–48. [Google Scholar] [CrossRef]
- Phillips, G.; Kelly, A.; Pitt, J.A.; Sanderson, R.; Taylor, E. The recovery of a very shallow eutrophic lake, 20 years after the control of effluent derived phosphorus. Freshw. Biol. 2005, 50, 1628–1638. [Google Scholar] [CrossRef]
- Gaedke, U.; Ollinger, D.; Bäuerle, E.; Straile, D. The impact of the interannual variability in hydrodynamic conditions on the plankton development in Lake Constance in spring and summer. Adv. Limnol. 1998, 53, 565–585. [Google Scholar]
- Adrian, R.; O’Reilly, C.M.; Zagarese, H.; Baines, S.B.; Hessen, D.O.; Keller, W.; Livingstone, D.M.; Sommaruga, R.; Straile, D.; Van Donk, E. Lakes as sentinels of climate change. Limnol. Oceanogr. 2009, 54, 2283. [Google Scholar] [CrossRef] [PubMed] [Green Version]
- Christensen, M.R.; Graham, M.D.; Vinebrooke, R.D.; Findlay, D.L.; Paterson, M.J.; Turner, M.A. Multiple anthropogenic stressors cause ecological surprises in boreal lakes. Glob. Chang. Biol. 2006, 12, 2316–2322. [Google Scholar] [CrossRef]
- Reiss, J.; Bridle, J.R.; Montoya, J.M.; Woodward, G. Emerging horizons in biodiversity and ecosystem functioning research. Trends Ecol. Evol. 2009, 24, 505–514. [Google Scholar] [CrossRef] [PubMed]
- Arnott, S.E.; Keller, B.; Dillon, P.; Yan, N.; Paterson, M.; Findlay, D. Using temporal coherence to determine the response to climate change in boreal shield lakes. Environ. Monit. Assess. 2003, 88, 365–388. [Google Scholar] [CrossRef] [PubMed]
- Magnuson, J.J.; Benson, B.J.; Kratz, T.K. Temporal coherence in the limnology of a suite of lakes in Wisconsin, USA. Freshw. Biol. 1990, 23, 145–159. [Google Scholar] [CrossRef]
- Baines, S.B.; Webster, K.E.; Kratz, T.K.; Carpenter, S.R.; Magnuson, J.J. Synchronous behavior of temperature, calcium, and chlorophyll in lakes of Northern Wisconsin. Ecology 2000, 81, 815–825. [Google Scholar] [CrossRef]
- Rusak, J.A.; Yan, N.D.; Somers, K.M.; McQueen, D.J. The temporal coherence of zooplankton population abundances in neighboring north-temperate lakes. Am. Nat. 1999, 153, 46–58. [Google Scholar] [CrossRef]
- Fischer, J.M.; Frost, T.M.; Ives, A.R. Compensatory dynamics in zooplankton community responses to acidification: Measurement and mechanisms. Ecol. Appl. 2001, 11, 1060–1072. [Google Scholar] [CrossRef]
- Jeppesen, E.; Søndergaard, M.; Kronvang, B.; Jensen, J.P.; Svendsen, L.M.; Lauridsen, T.L. Lake and catchment management in denmark. Hydrobiologia 1999, 396, 419–432. [Google Scholar] [CrossRef]
- Svendsen, L.M.; van der Bijl, L.; Boutrup, S.; Norup, B. Novana. Det Nationale Program for Overvågning af Vandmiljøet og Naturen. Programbeskrivelse–del 2 (Report in Danish: The National Monitoring Programme of the Water Environment and Nature); National Environmental Research Institute: Maharashtra, India, 2004; p. 128. [Google Scholar]
- Özkan, K.; Jeppesen, E.; Davidson, T.A.; Sondergaard, M.; Lauridsen, T.L.; Bjerring, R.; Johansson, L.S.; Svenning, J.C. Cross-taxon congruence in lake plankton largely independent of environmental gradients. Ecology 2014, 95, 2778–2788. [Google Scholar] [CrossRef]
- Pielou, E.C. Ecological Diversity; John Wiley & Sons: New York, NY, USA, 1975; p. 165. [Google Scholar]
- Lauridsen, T.L.; Søndergaard, M.; Jensen, J.P.; Jeppesen, E.; Jørgensen, T.B. Undersøgelser i Søer. NOVANA og DEVANO Overvågningsprogram (Report in Danish: Investigations in Lakes); Danmarks Miljøundersøgelser, Aarhus University: Aarhus, Denmark, 2007; p. 164. [Google Scholar]
- Idso, S.B. On the concept of lake stability. Limnol. Oceanogr. 1973, 18, 681–683. [Google Scholar] [CrossRef]
- Read, J.S.; Hamilton, D.P.; Jones, I.D.; Muraoka, K.; Winslow, L.A.; Kroiss, R.; Wu, C.H.; Gaiser, E. Derivation of lake mixing and stratification indices from high-resolution lake buoy data. Environ. Model. Softw. 2011, 26, 1325–1336. [Google Scholar] [CrossRef]
- Mann, H.B. Nonparametric tests against trend. Econometrica 1945, 13, 245–259. [Google Scholar] [CrossRef]
- Jeppesen, E.; Jensen, J.P.; Søndergaard, M. Response of phytoplankton, zooplankton, and fish to re-oligotrophication: An 11 year study of 23 Danish lakes. Aquat. Ecosyst. Health Manag. 2002, 5, 31–43. [Google Scholar] [CrossRef]
- Wood, S.N. Generalized Additive Models: An Introduction with R; Chapman & Hall/CRC: Boca Raton, FL, USA, 2006; p. 391. [Google Scholar]
- Minchin, P.R. An evaluation of the relative robustness of techniques for ecological ordination. Vegetatio 1987, 69, 89–107. [Google Scholar] [CrossRef]
- R Development Core Team. R: A Language and Environment for Statistical Computing; R Version 2.13.0; R Foundation for Statistical Computing: Vienna, Austria, 2011. [Google Scholar]
- Oksanen, J.; Kindt, R.; Legendre, P.; O’Hara, B.; Simpson, G.L.; Solymos, P.; Henry, M.; Stevens, H.; Wagner, H. Vegan: Community Ecology Package, R Package Version 1.17-11; 2011. Available online: https://cran.r-project.org/web/packages/vegan/index.html (accessed on 26 September 2016).
- McLeod, A.I. Kendall: Kendall Rank Correlation and Mann-Kendall Trend Test, R package version 2.2; 2011. Available online: https://cran.r-project.org/web/packages/Kendall/index.html (accessed on 26 September 2016).
- Winder, M.; Cloern, J.E. The annual cycles of phytoplankton biomass. Philos. Trans. R. Soc. B 2010, 365, 3215–3226. [Google Scholar] [CrossRef] [PubMed] [Green Version]
- Gerten, D.; Adrian, R. Differences in the persistency of the North Atlantic Oscillation signal among lakes. Limnol. Oceanogr. 2001, 46, 448–455. [Google Scholar] [CrossRef]
- Huber, V.; Wagner, C.; Gerten, D.; Adrian, R. To bloom or not to bloom: Contrasting responses of cyanobacteria to recent heat waves explained by critical thresholds of abiotic drivers. Oecologia 2012, 169, 245–256. [Google Scholar] [CrossRef] [PubMed]
- Wagner, C.; Adrian, R. Consequences of changes in thermal regime for plankton diversity and trait composition in a polymictic lake: A matter of temporal scale. Freshw. Biol. 2011, 56, 1949–1961. [Google Scholar] [CrossRef]
- Winder, M.; Schindler, D.E. Climatic effects on the phenology of lake processes. Glob. Chang. Biol. 2004, 10, 1844–1856. [Google Scholar] [CrossRef]
- Nielsen, A.; Trolle, D.; Søndergaard, M.; Lauridsen, T.L.; Bjerring, R.; Olesen, J.E.; Jeppesen, E. Watershed land use effects on lake water quality in Denmark. Ecol. Appl. 2012, 22, 1187–1200. [Google Scholar] [CrossRef] [PubMed]
- Kronvang, B.; Andersen, H.E.; Borgesen, C.; Dalgaard, T.; Larsen, S.E.; Bogestrand, J.; Blicher-Mathiasen, G. Effects of policy measures implemented in Denmark on nitrogen pollution of the aquatic environment. Environ. Sci. Policy 2008, 11, 144–152. [Google Scholar] [CrossRef]
- Jeppesen, E.; Kronvang, B.; Olesen, J.E.; Audet, J.; Søndergaard, M.; Hoffmann, C.C.; Andersen, H.E.; Lauridsen, T.L.; Liboriussen, L.; Larsen, S.E.; et al. Climate change effects on nitrogen loading from cultivated catchments in Europe: Implications for nitrogen retention, ecological state of lakes and adaptation. Hydrobiologia 2011, 663, 1–21. [Google Scholar] [CrossRef]
- Finlay, J.C.; Small, G.E.; Sterner, R.W. Human influences on nitrogen removal in lakes. Science 2013, 342, 247–250. [Google Scholar] [CrossRef] [PubMed]
- Weyhenmeyer, G.A.; Jeppesen, E.; Adrian, R.; Arvola, L.; Blenckner, T.; Jankowski, T.; Jennings, E.; Noges, P.; Noges, T.; Straile, D. Nitrate-depleted conditions on the increase in shallow Northern European lakes. Limnol. Oceanogr. 2007, 52, 1346–1353. [Google Scholar] [CrossRef]
- Bloch, I.; Weyhenmeyer, G.A. Long-term changes in physical and chemical conditions of nutrient-poor lakes along a latitudinal gradient: Is there a coherent phytoplankton community response? Aquat. Sci. 2012, 74, 77–85. [Google Scholar] [CrossRef]
- George, D.G.; Talling, J.F.; Rigg, E. Factors influencing the temporal coherence of five lakes in the English Lake District. Freshw. Biol. 2000, 43, 449–461. [Google Scholar] [CrossRef]
- Jeppesen, E.; Jensen, J.P.; Søndergaard, M.; Lauridsen, T.L. Response of fish and plankton to nutrient loading reduction in eight shallow Danish lakes with special emphasis on seasonal dynamics. Freshw. Biol. 2005, 50, 1616–1627. [Google Scholar] [CrossRef]
- Gutierrez, M.F.; Devercelli, M.; Brucet, S.; Lauridsen, T.L.; Søndergaard, M.; Jeppesen, E. Is recovery of large-bodied zooplankton after nutrient loading reduction hampered by climate warming? A long-term study of shallow hypertrophic Lake Søbygaard, Denmark. Water 2016, 8. [Google Scholar] [CrossRef]
- Alric, B.; Jenny, J.-P.; Berthon, V.; Arnaud, F.; Pignol, C.; Reyss, J.-L.; Sabatier, P.; Perga, M.-E. Local forcings affect lake zooplankton vulnerability and response to climate warming. Ecology 2013, 94, 2767–2780. [Google Scholar] [CrossRef] [PubMed]
- Kronvang, B.; Jeppesen, E.; Conley, D.J.; Søndergaard, M.; Larsen, S.E.; Ovesen, N.B.; Carstensen, J. Nutrient pressures and ecological responses to nutrient loading reductions in Danish streams, lakes and coastal waters. J. Hydrol. 2005, 304, 274–288. [Google Scholar] [CrossRef]
- Özkan, K.; Jeppesen, E.; Johansson, L.S.; Beklioglu, M. The response of periphyton and submerged macrophytes to nitrogen and phosphorus loading in shallow warm lakes: A mesocosm experiment. Freshw. Biol. 2010, 55, 463–475. [Google Scholar] [CrossRef]
- Gonzalez Sagrario, M.A.; Jeppesen, E.; Gomá, J.; Søndergaard, M.; Jensen, J.P.; Lauridsen, T.; Landkildehus, F. Does high nitrogen loading prevent clear-water conditions in shallow lakes at moderately high phosphorus concentrations? Freshw. Biol. 2005, 50, 27–41. [Google Scholar] [CrossRef]
- James, C.; Fisher, J.; Russell, V.; Collings, S.; Moss, B. Nitrate availability and hydrophyte species richness in shallow lakes. Freshw. Biol. 2005, 50, 1049–1063. [Google Scholar] [CrossRef]
- Özkan, K.; Jeppesen, E.; Søndergaard, M.; Lauridsen, T.; Liboriussen, L.; Svenning, J.-C. Contrasting roles of water chemistry, lake morphology, land-use, climate and spatial processes in driving phytoplankton richness in the Danish landscape. Hydrobiologia 2013, 710, 173–187. [Google Scholar] [CrossRef]
- Tilman, D.; Pacala, S. The maintenance of species richness in plant communities. In Species Diversity in Ecological Communities; Ricklefs, R.E., Schluter, D., Eds.; University of Chicago Press: Chicago, IL, USA, 1993; pp. 13–25. [Google Scholar]
- Tilman, D.; Kilham, S.S.; Kilham, P. Phytoplankton community ecology—The role of limiting nutrients. Annu. Rev. Ecol. Syst. 1982, 13, 349–372. [Google Scholar] [CrossRef]
- Guisande, C.; Bartumeus, F.; Ventura, M.; Catalan, J. Role of food partitioning in structuring the zooplankton community in mountain lakes. Oecologia 2003, 136, 627–634. [Google Scholar] [PubMed]
- Striebel, M.; Singer, G.; Stibor, H.; Andersen, T. “Trophic overyielding”: Phytoplankton diversity promotes zooplankton productivity. Ecology 2012, 93, 2719–2727. [Google Scholar] [CrossRef] [PubMed]
- Declerck, S.; Vandekerkhove, J.; Johansson, L.; Muylaert, K.; Conde-Porcuna, J.M.; Van der Gucht, K.; Pérez-Martínez, C.; Lauridsen, T.; Schwenk, K.; Zwart, G.; et al. Multi-group biodiversity in shallow lakes along gradients of phosphorus and water plant cover. Ecology 2005, 86, 1905–1915. [Google Scholar] [CrossRef]
- Declerck, S.; Vanderstukken, M.; Pals, A.; Muylaert, K.; de Meester, L. Plankton biodiversity along a gradient of productivity and its mediation by macrophytes. Ecology 2007, 88, 2199–2210. [Google Scholar] [CrossRef] [PubMed]
- Kruk, C.; Rodriguez-Gallego, L.; Meerhoff, M.; Quintans, F.; Lacerot, G.; Mazzeo, N.; Scasso, F.; Paggi, J.C.; Peeters, E.T.H.M.; Marten, S. Determinants of biodiversity in subtropical shallow lakes (Atlantic coast, Uruguay). Freshw. Biol. 2009, 54, 2628–2641. [Google Scholar] [CrossRef]
- Muylaert, K.; Perez-Martinez, C.; Sanchez-Castillo, P.; Lauridsen, T.L.; Vanderstukken, M.; Declerck, S.A.J.; Van der Gucht, K.; Conde-Porcuna, J.M.; Jeppesen, E.; De Meester, L.; et al. Influence of nutrients, submerged macrophytes and zooplankton grazing on phytoplankton biomass and diversity along a latitudinal gradient in Europe. Hydrobiologia 2010, 653, 79–90. [Google Scholar] [CrossRef]
- Straile, D.; Jochimsen, M.; Kümmerlin, R. The use of long-term monitoring data for studies of planktonic diversity: A cautionary tale from two Swiss lakes. Freshw. Biol. 2013, 58, 1292–1301. [Google Scholar] [CrossRef]
- Søndergaard, M.; Jensen, J.P.; Jeppesen, E. Seasonal response of nutrients to reduced phosphorus loading in 12 Danish lakes. Freshw. Biol. 2005, 50, 1605–1615. [Google Scholar] [CrossRef]
- Søndergaard, M.; Bjerring, R.; Jeppesen, E. Persistent internal phosphorus loading during summer in shallow eutrophic lakes. Hydrobiologia 2012, 710, 95–107. [Google Scholar] [CrossRef]


| Lake Area (ha) | Average Depth (m) | Max. Depth (m) | TP (mg·L−1) | TN (mg·L−1) | |
|---|---|---|---|---|---|
| Min. | 12 | 0.8 | 1.8 | <0.001 | 0.100 |
| Median | 37 | 2.7 | 6.0 | 0.075 | 1.770 |
| Max. | 3954 | 15.1 | 32.6 | 2.700 | 19.000 |
© 2016 by the authors; licensee MDPI, Basel, Switzerland. This article is an open access article distributed under the terms and conditions of the Creative Commons Attribution (CC-BY) license (http://creativecommons.org/licenses/by/4.0/).
Share and Cite
Özkan, K.; Jeppesen, E.; Davidson, T.A.; Bjerring, R.; Johansson, L.S.; Søndergaard, M.; Lauridsen, T.L.; Svenning, J.-C. Long-Term Trends and Temporal Synchrony in Plankton Richness, Diversity and Biomass Driven by Re-Oligotrophication and Climate across 17 Danish Lakes. Water 2016, 8, 427. https://doi.org/10.3390/w8100427
Özkan K, Jeppesen E, Davidson TA, Bjerring R, Johansson LS, Søndergaard M, Lauridsen TL, Svenning J-C. Long-Term Trends and Temporal Synchrony in Plankton Richness, Diversity and Biomass Driven by Re-Oligotrophication and Climate across 17 Danish Lakes. Water. 2016; 8(10):427. https://doi.org/10.3390/w8100427
Chicago/Turabian StyleÖzkan, Korhan, Erik Jeppesen, Thomas A. Davidson, Rikke Bjerring, Liselotte S. Johansson, Martin Søndergaard, Torben L. Lauridsen, and Jens-Christian Svenning. 2016. "Long-Term Trends and Temporal Synchrony in Plankton Richness, Diversity and Biomass Driven by Re-Oligotrophication and Climate across 17 Danish Lakes" Water 8, no. 10: 427. https://doi.org/10.3390/w8100427