
Impact of Climate Change on Runoff in the Gilgel Abbay Watershed, the Upper Blue Nile Basin, Ethiopia


Abstract
:1. Introduction
2. Materials and Methods
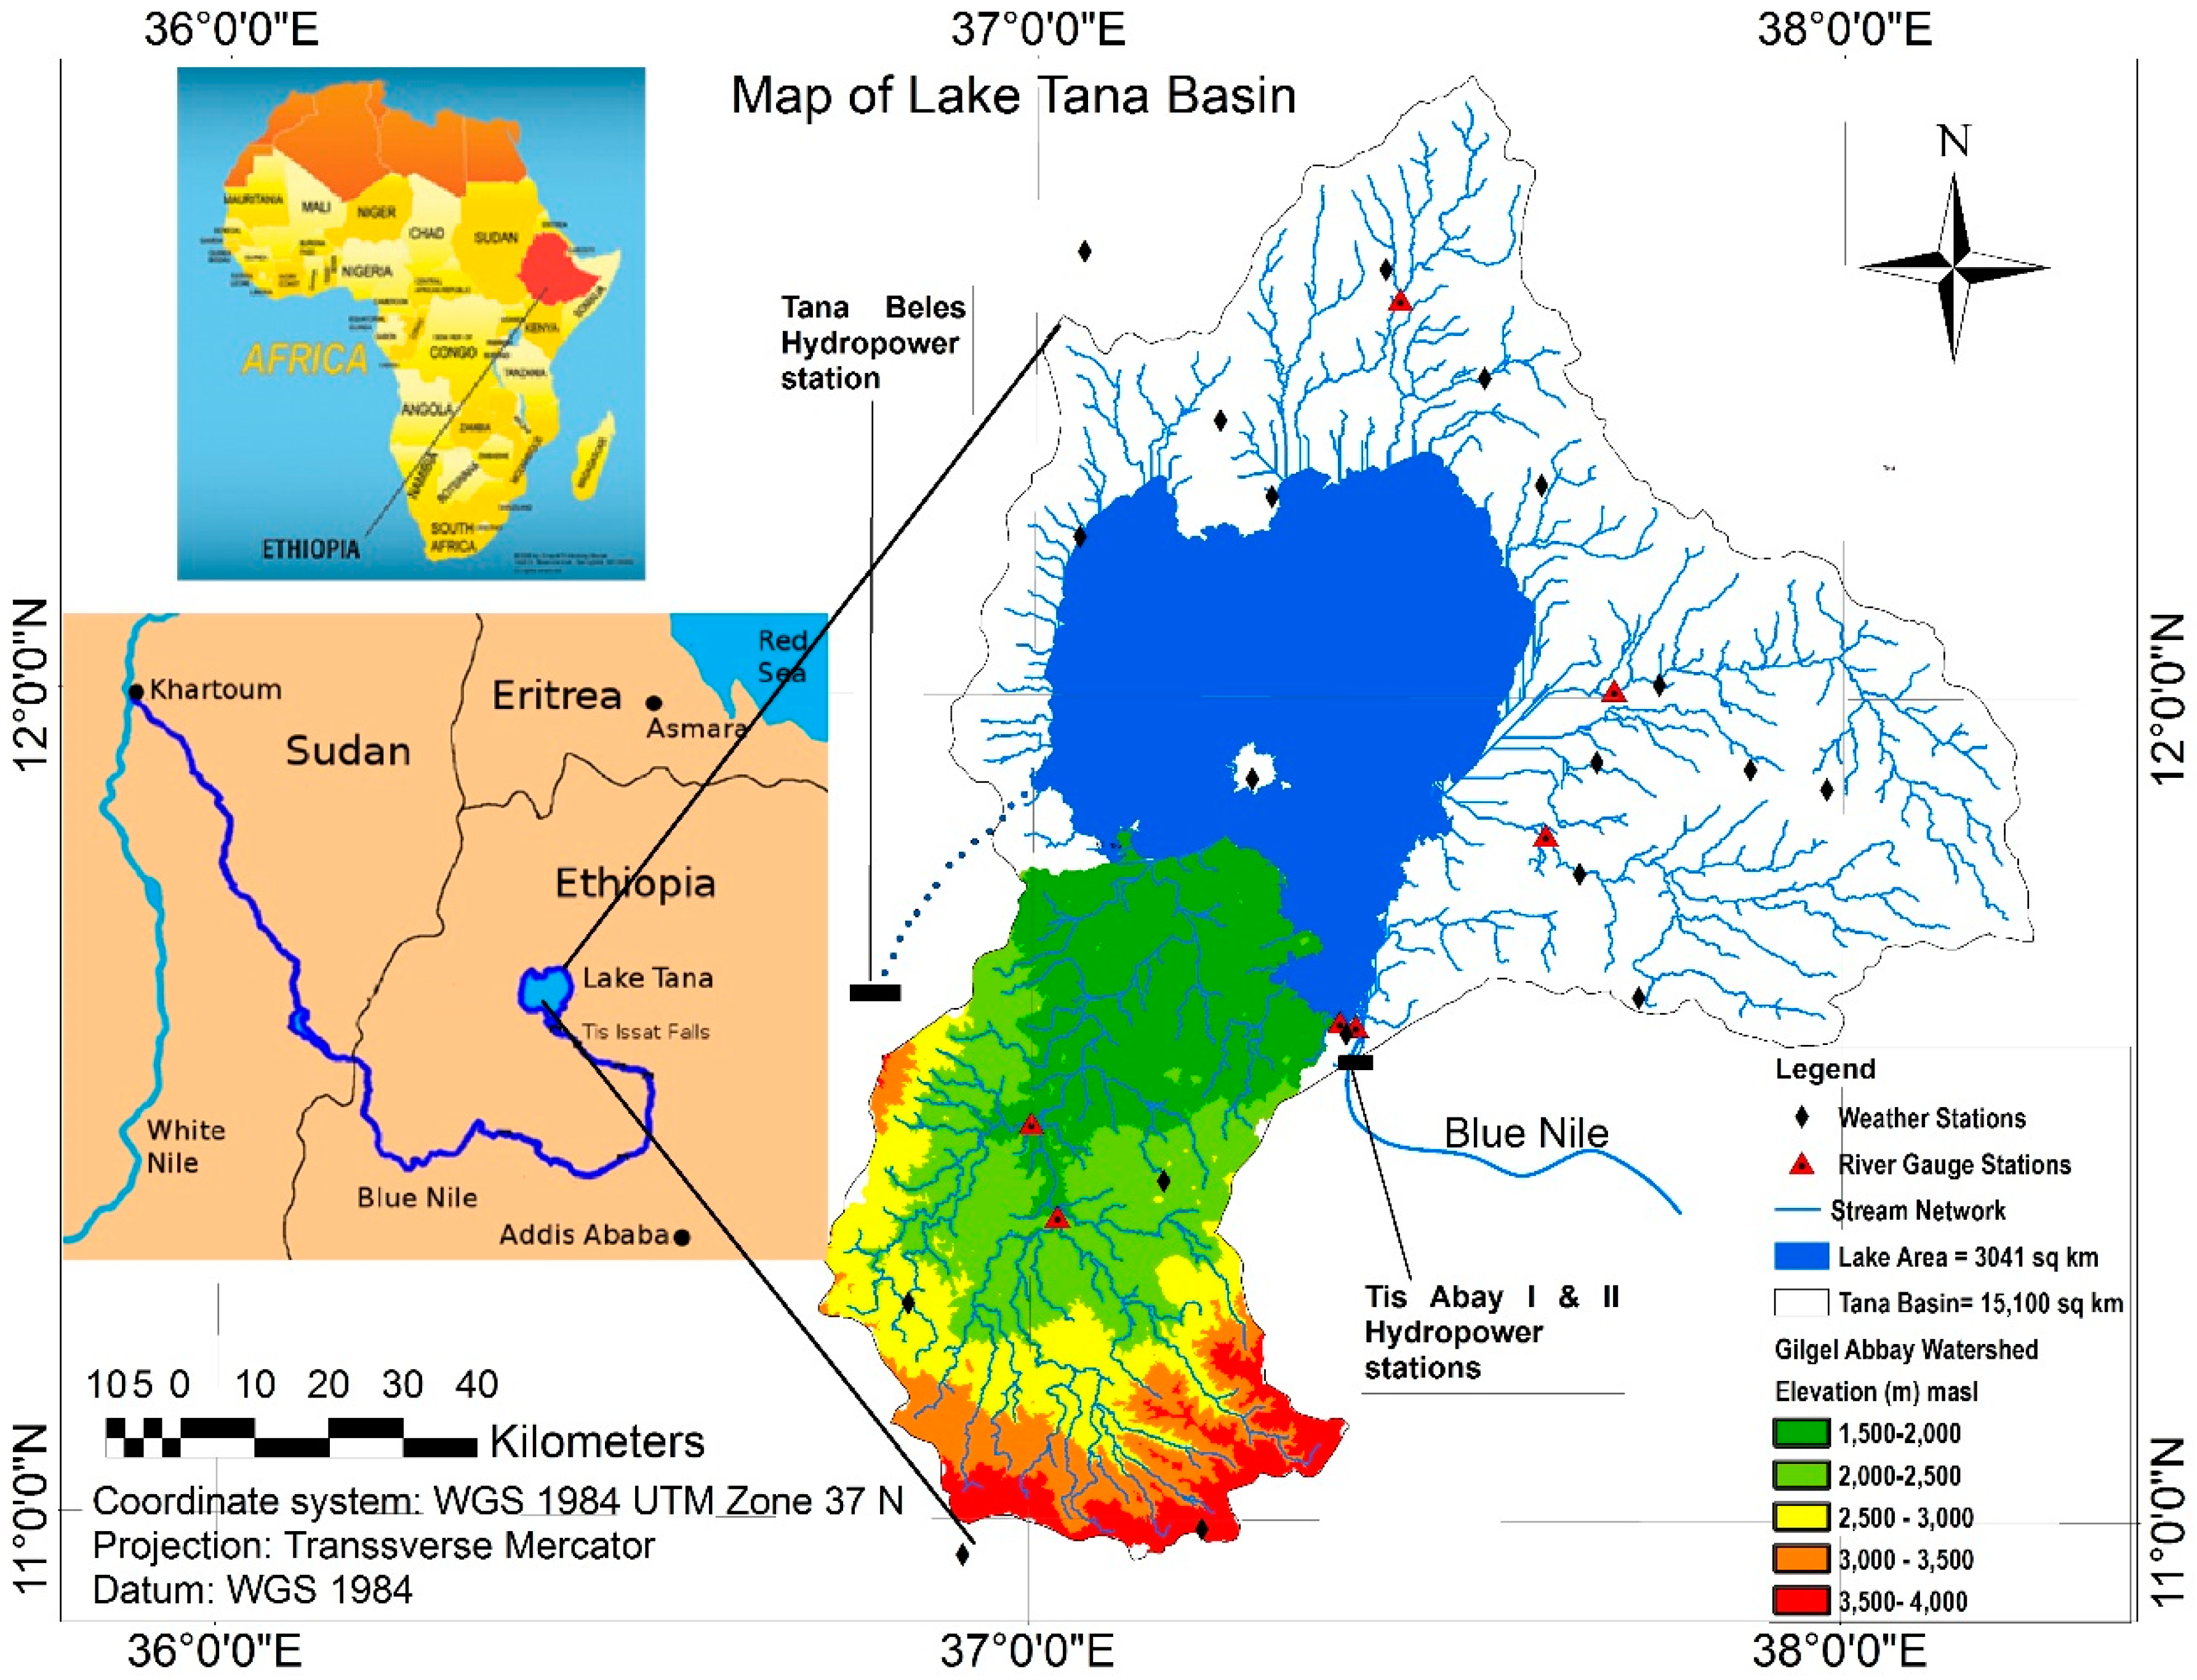
2.1. Study Area
Historical Climate Trends in the Study Area
2.2. Methodology
2.2.1. Data
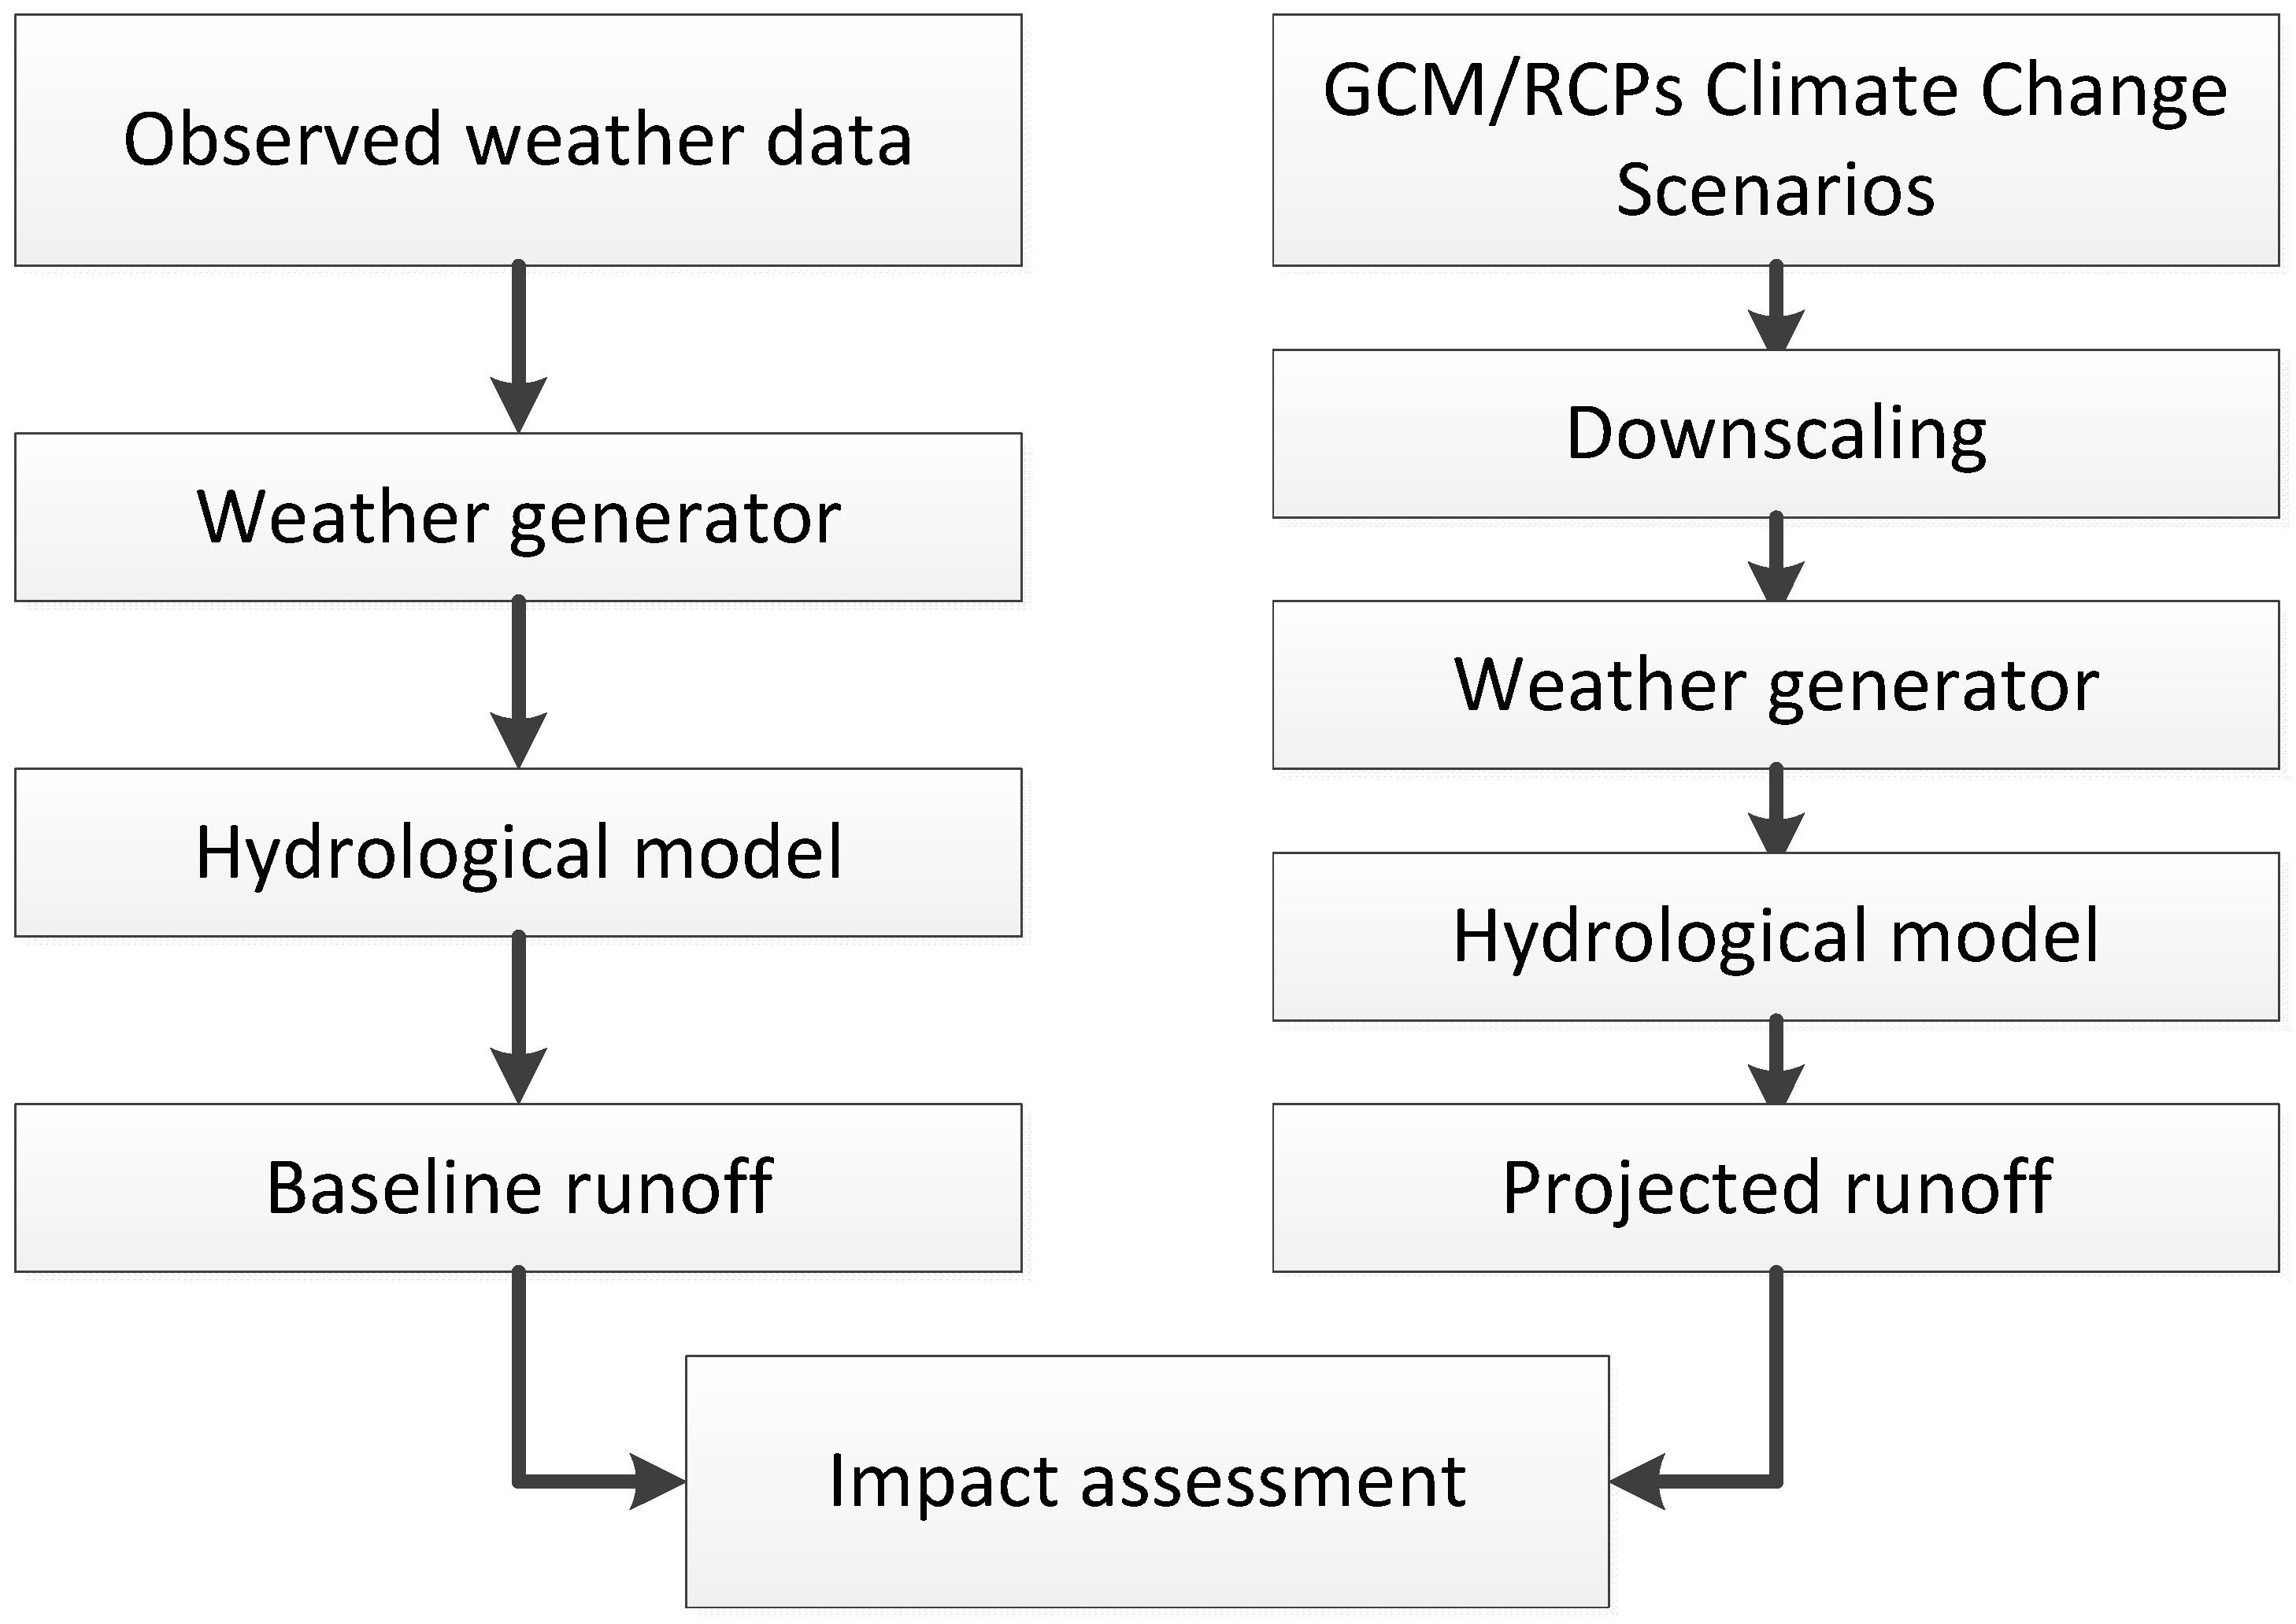
2.2.2. Impact Assessment Framework
2.2.3. Climate Change Scenarios
Selection of GCMs
Downscaling
2.2.4. Hydrological Model
3. Results
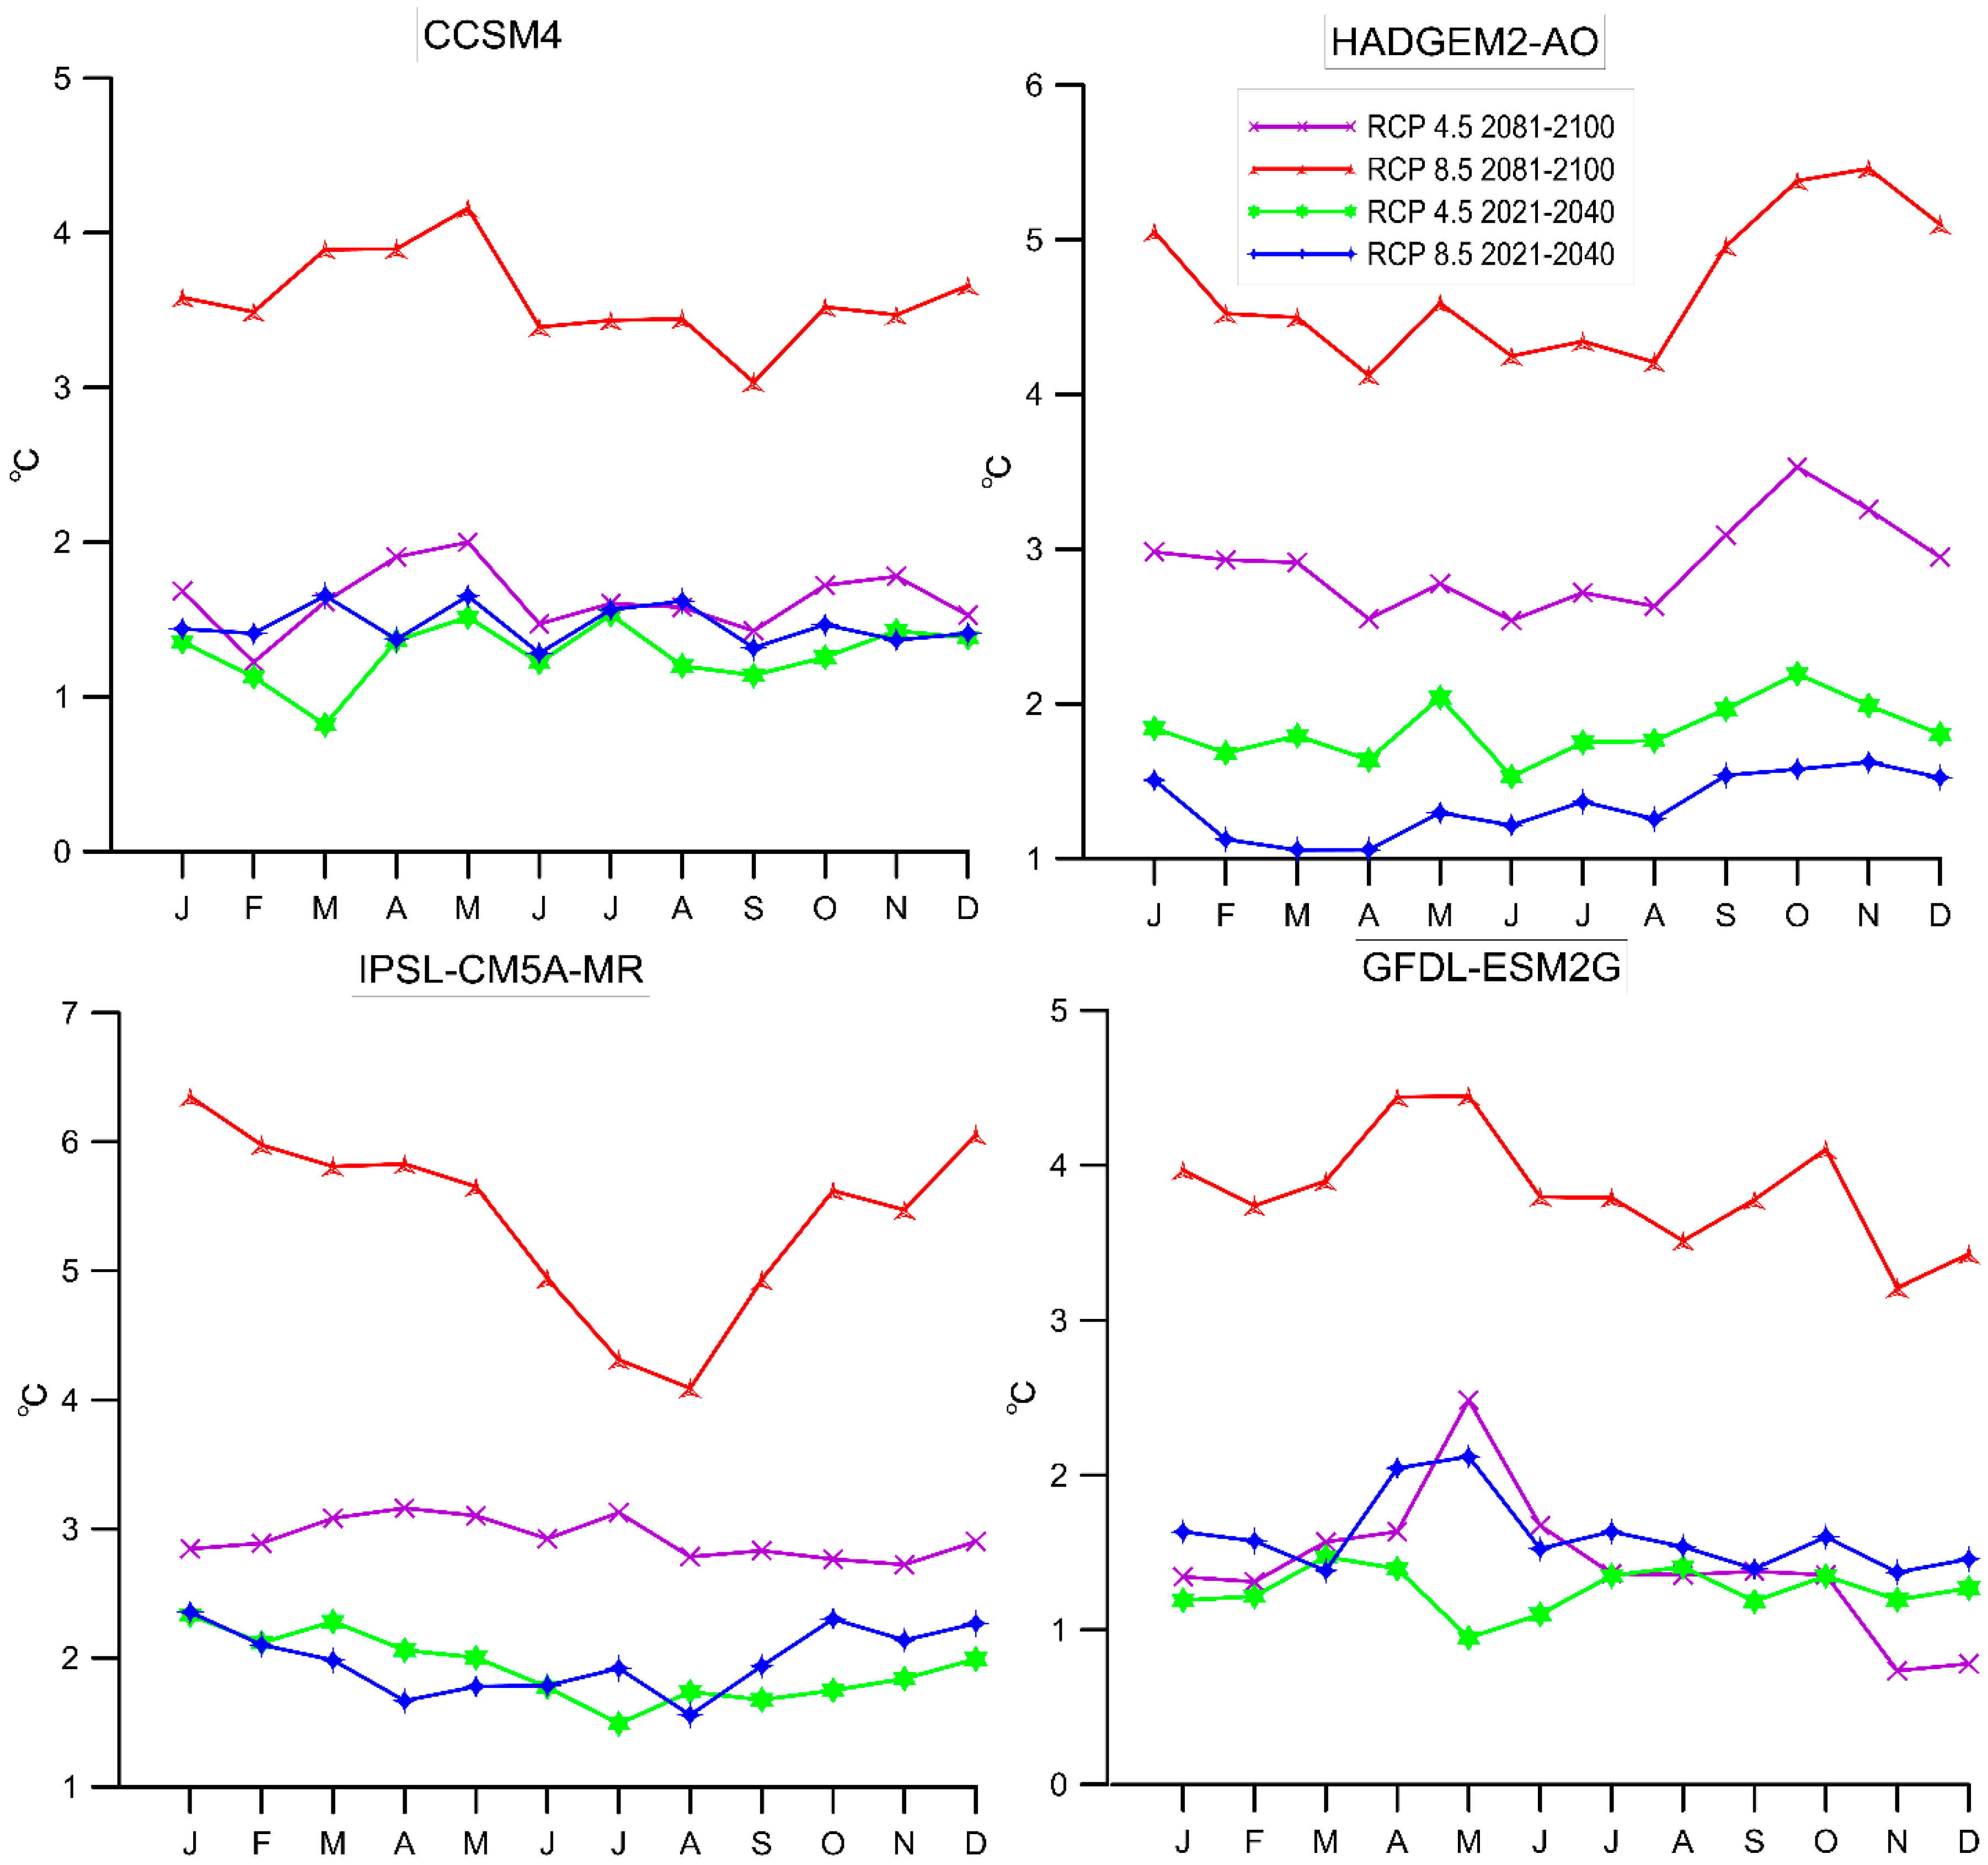
3.1. Temperature
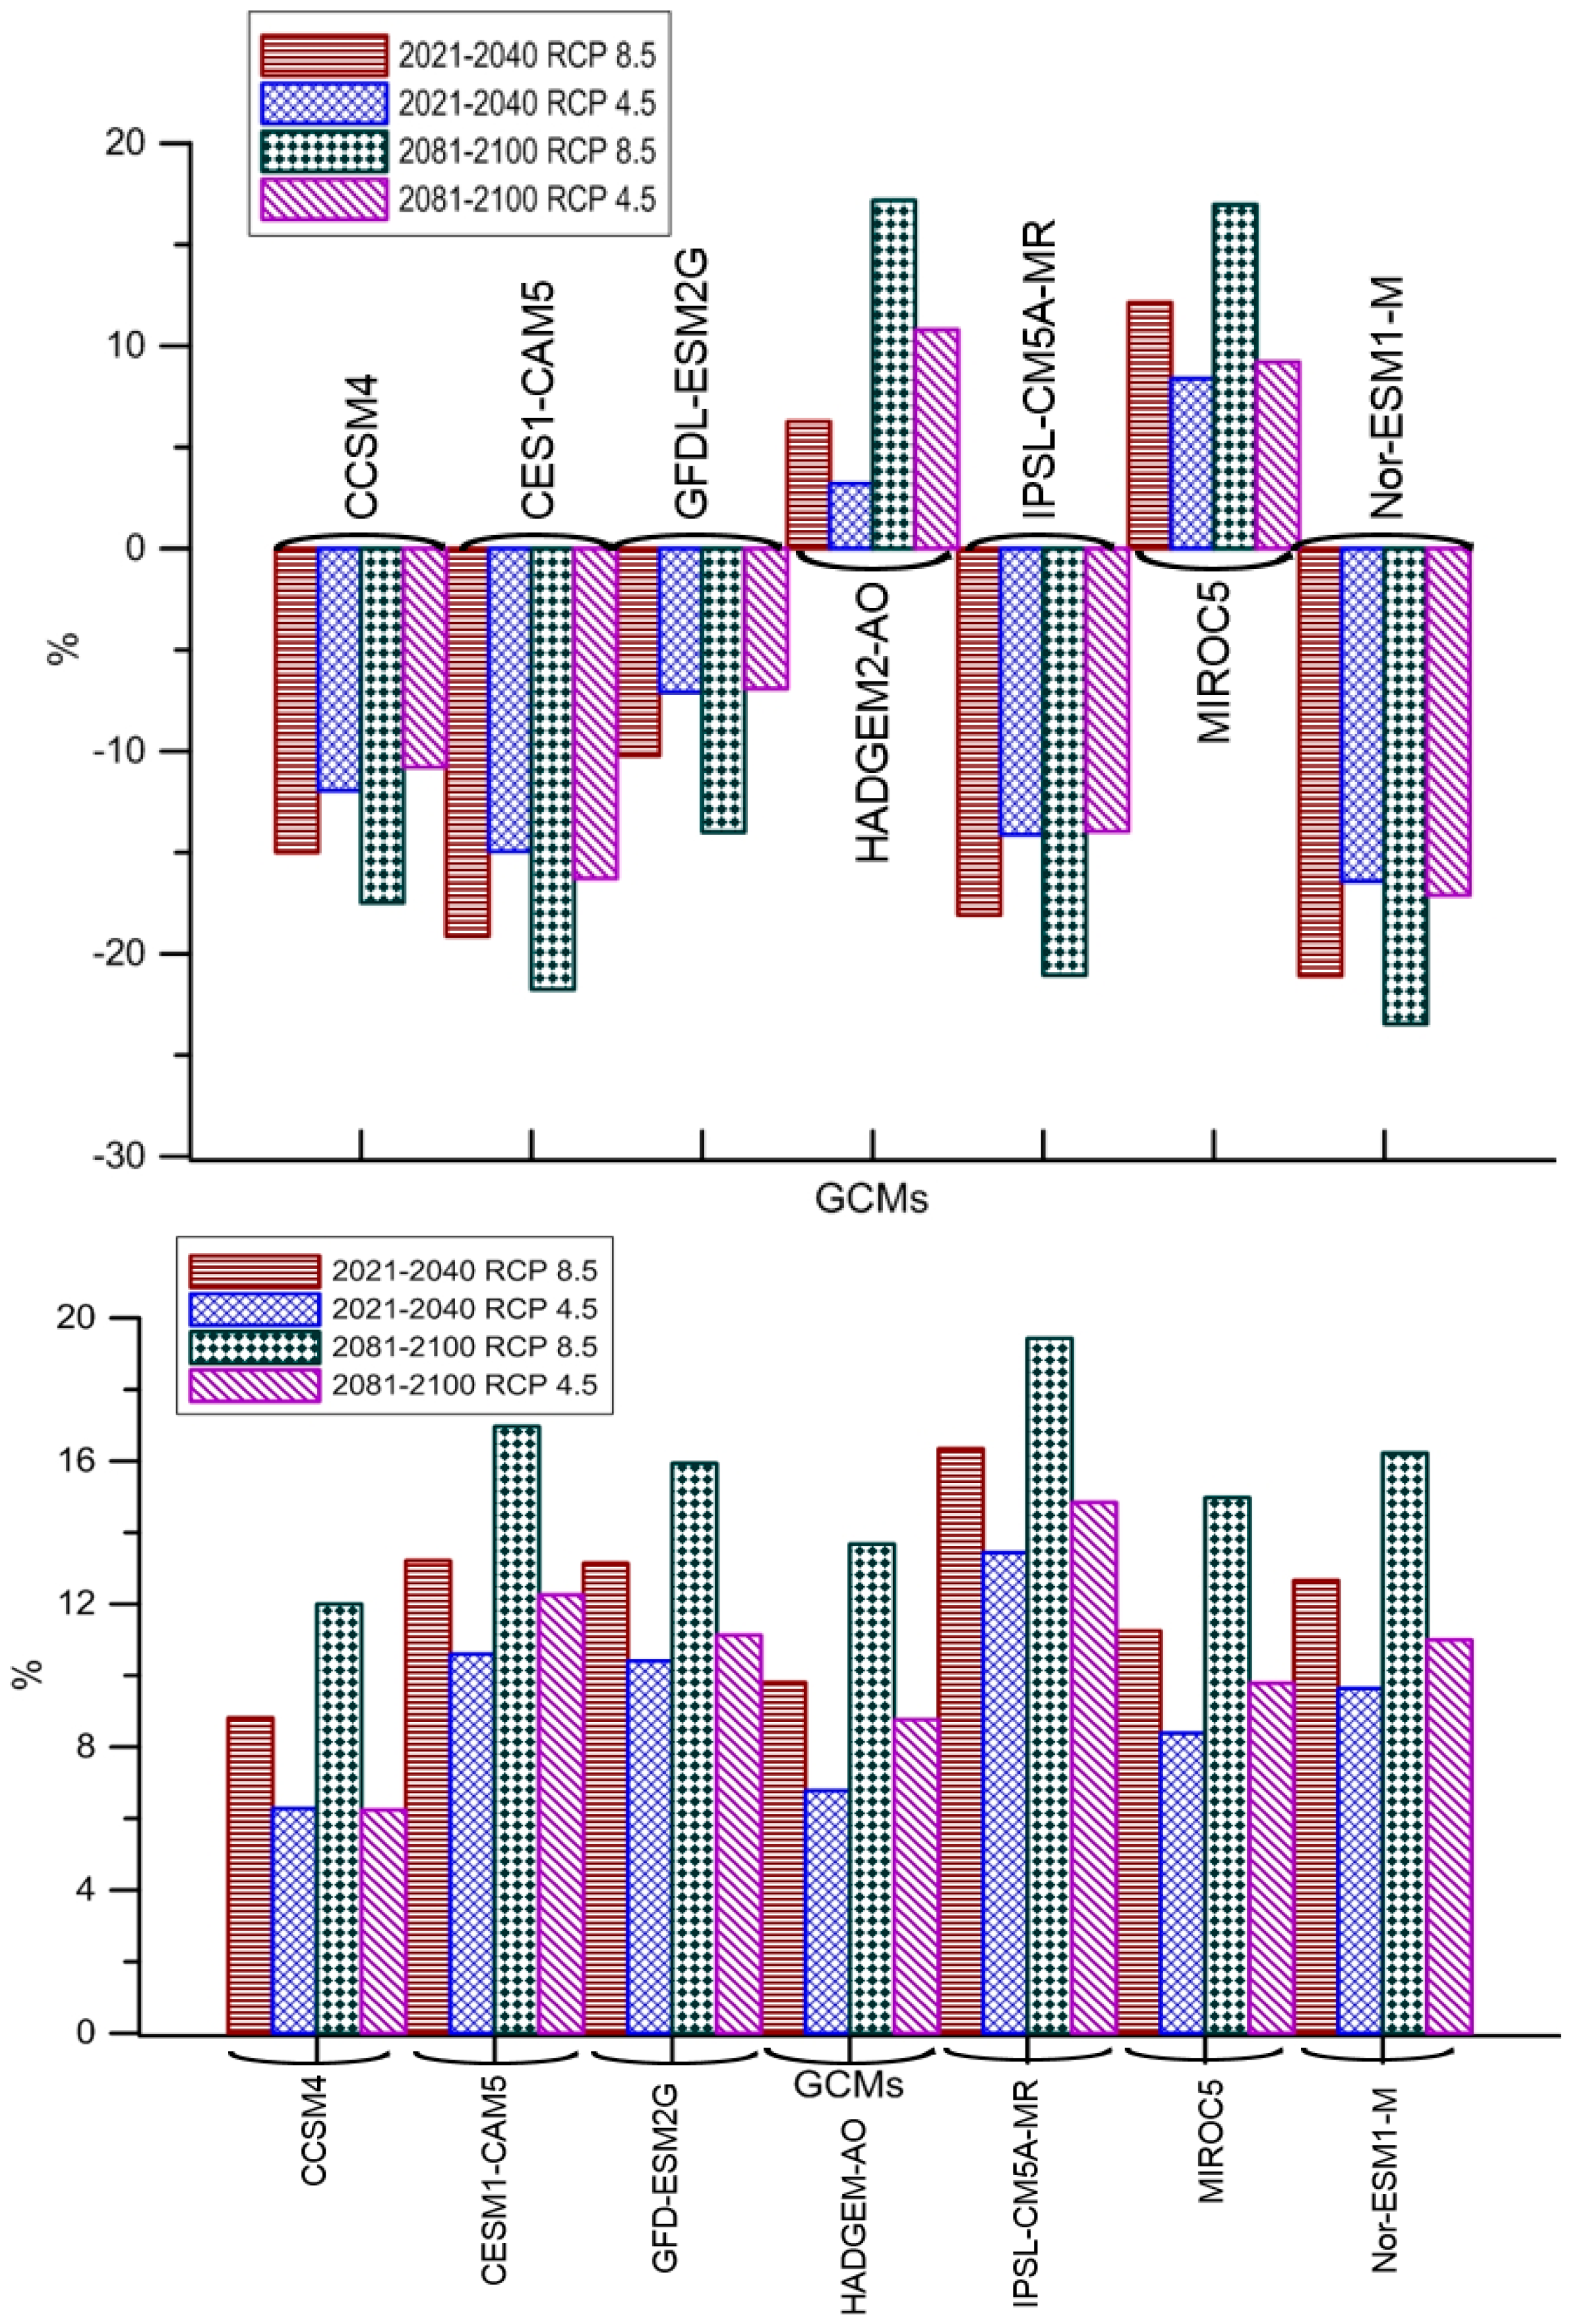
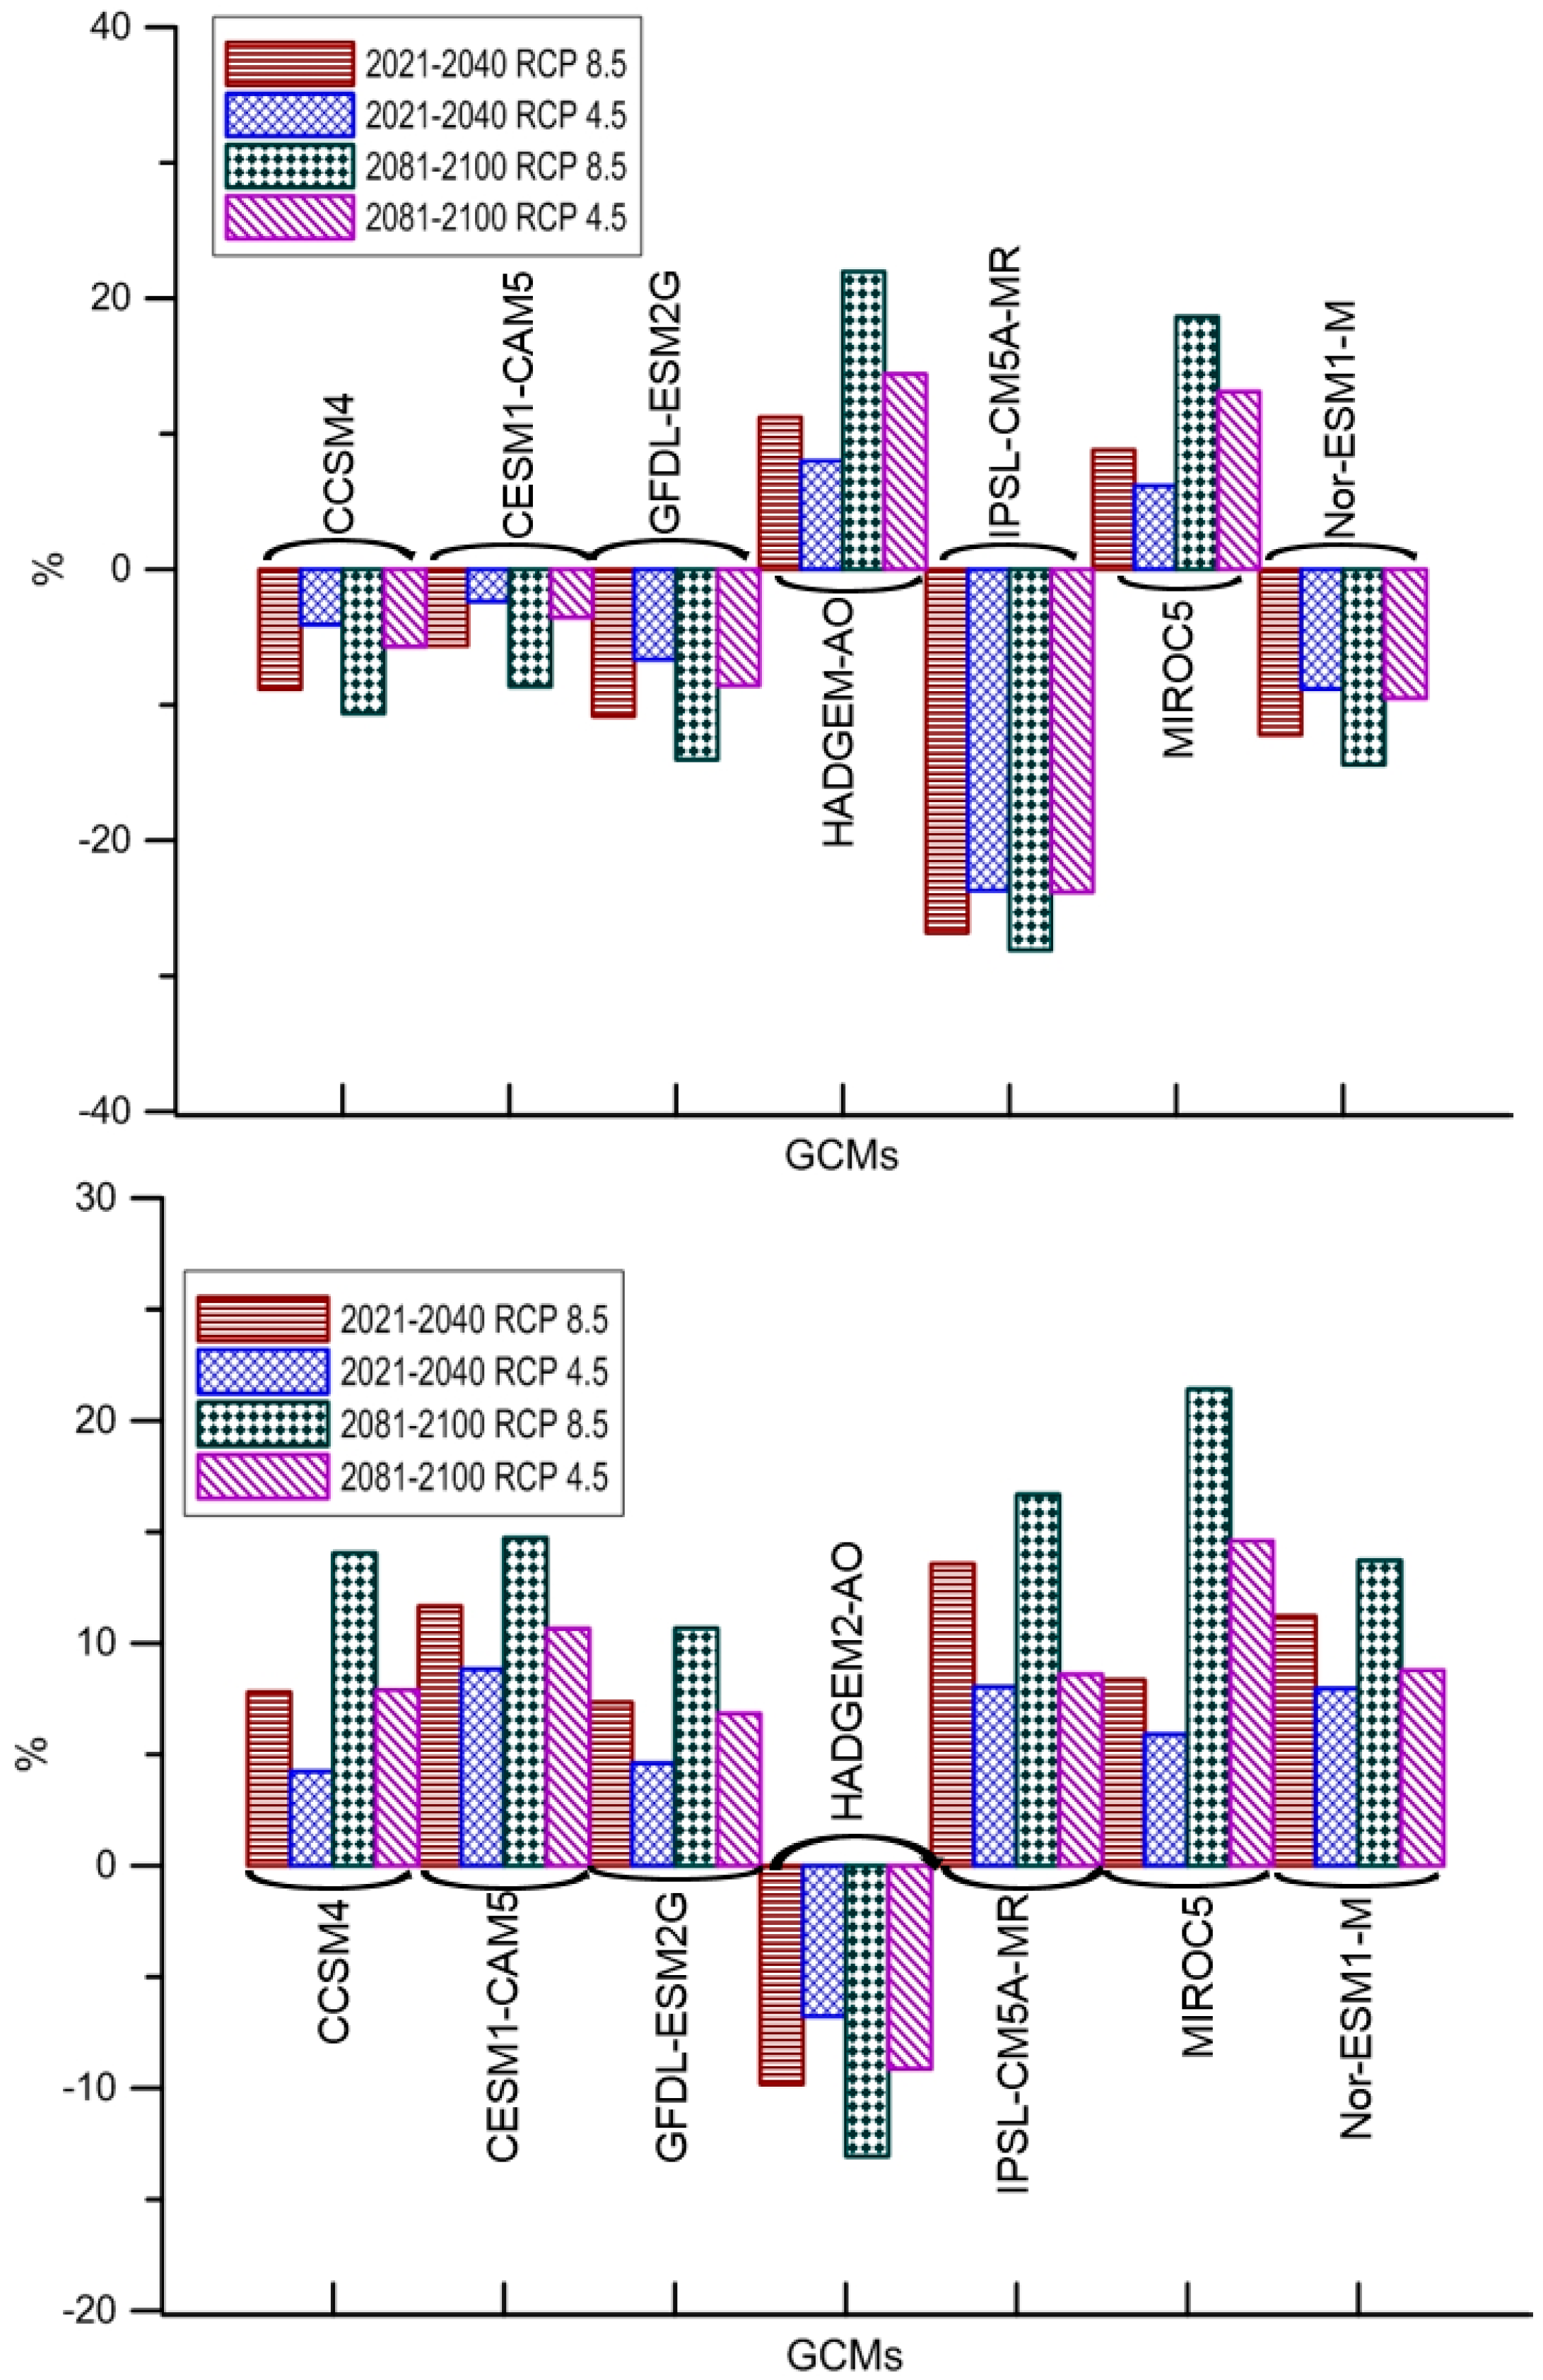
3.2. Precipitation
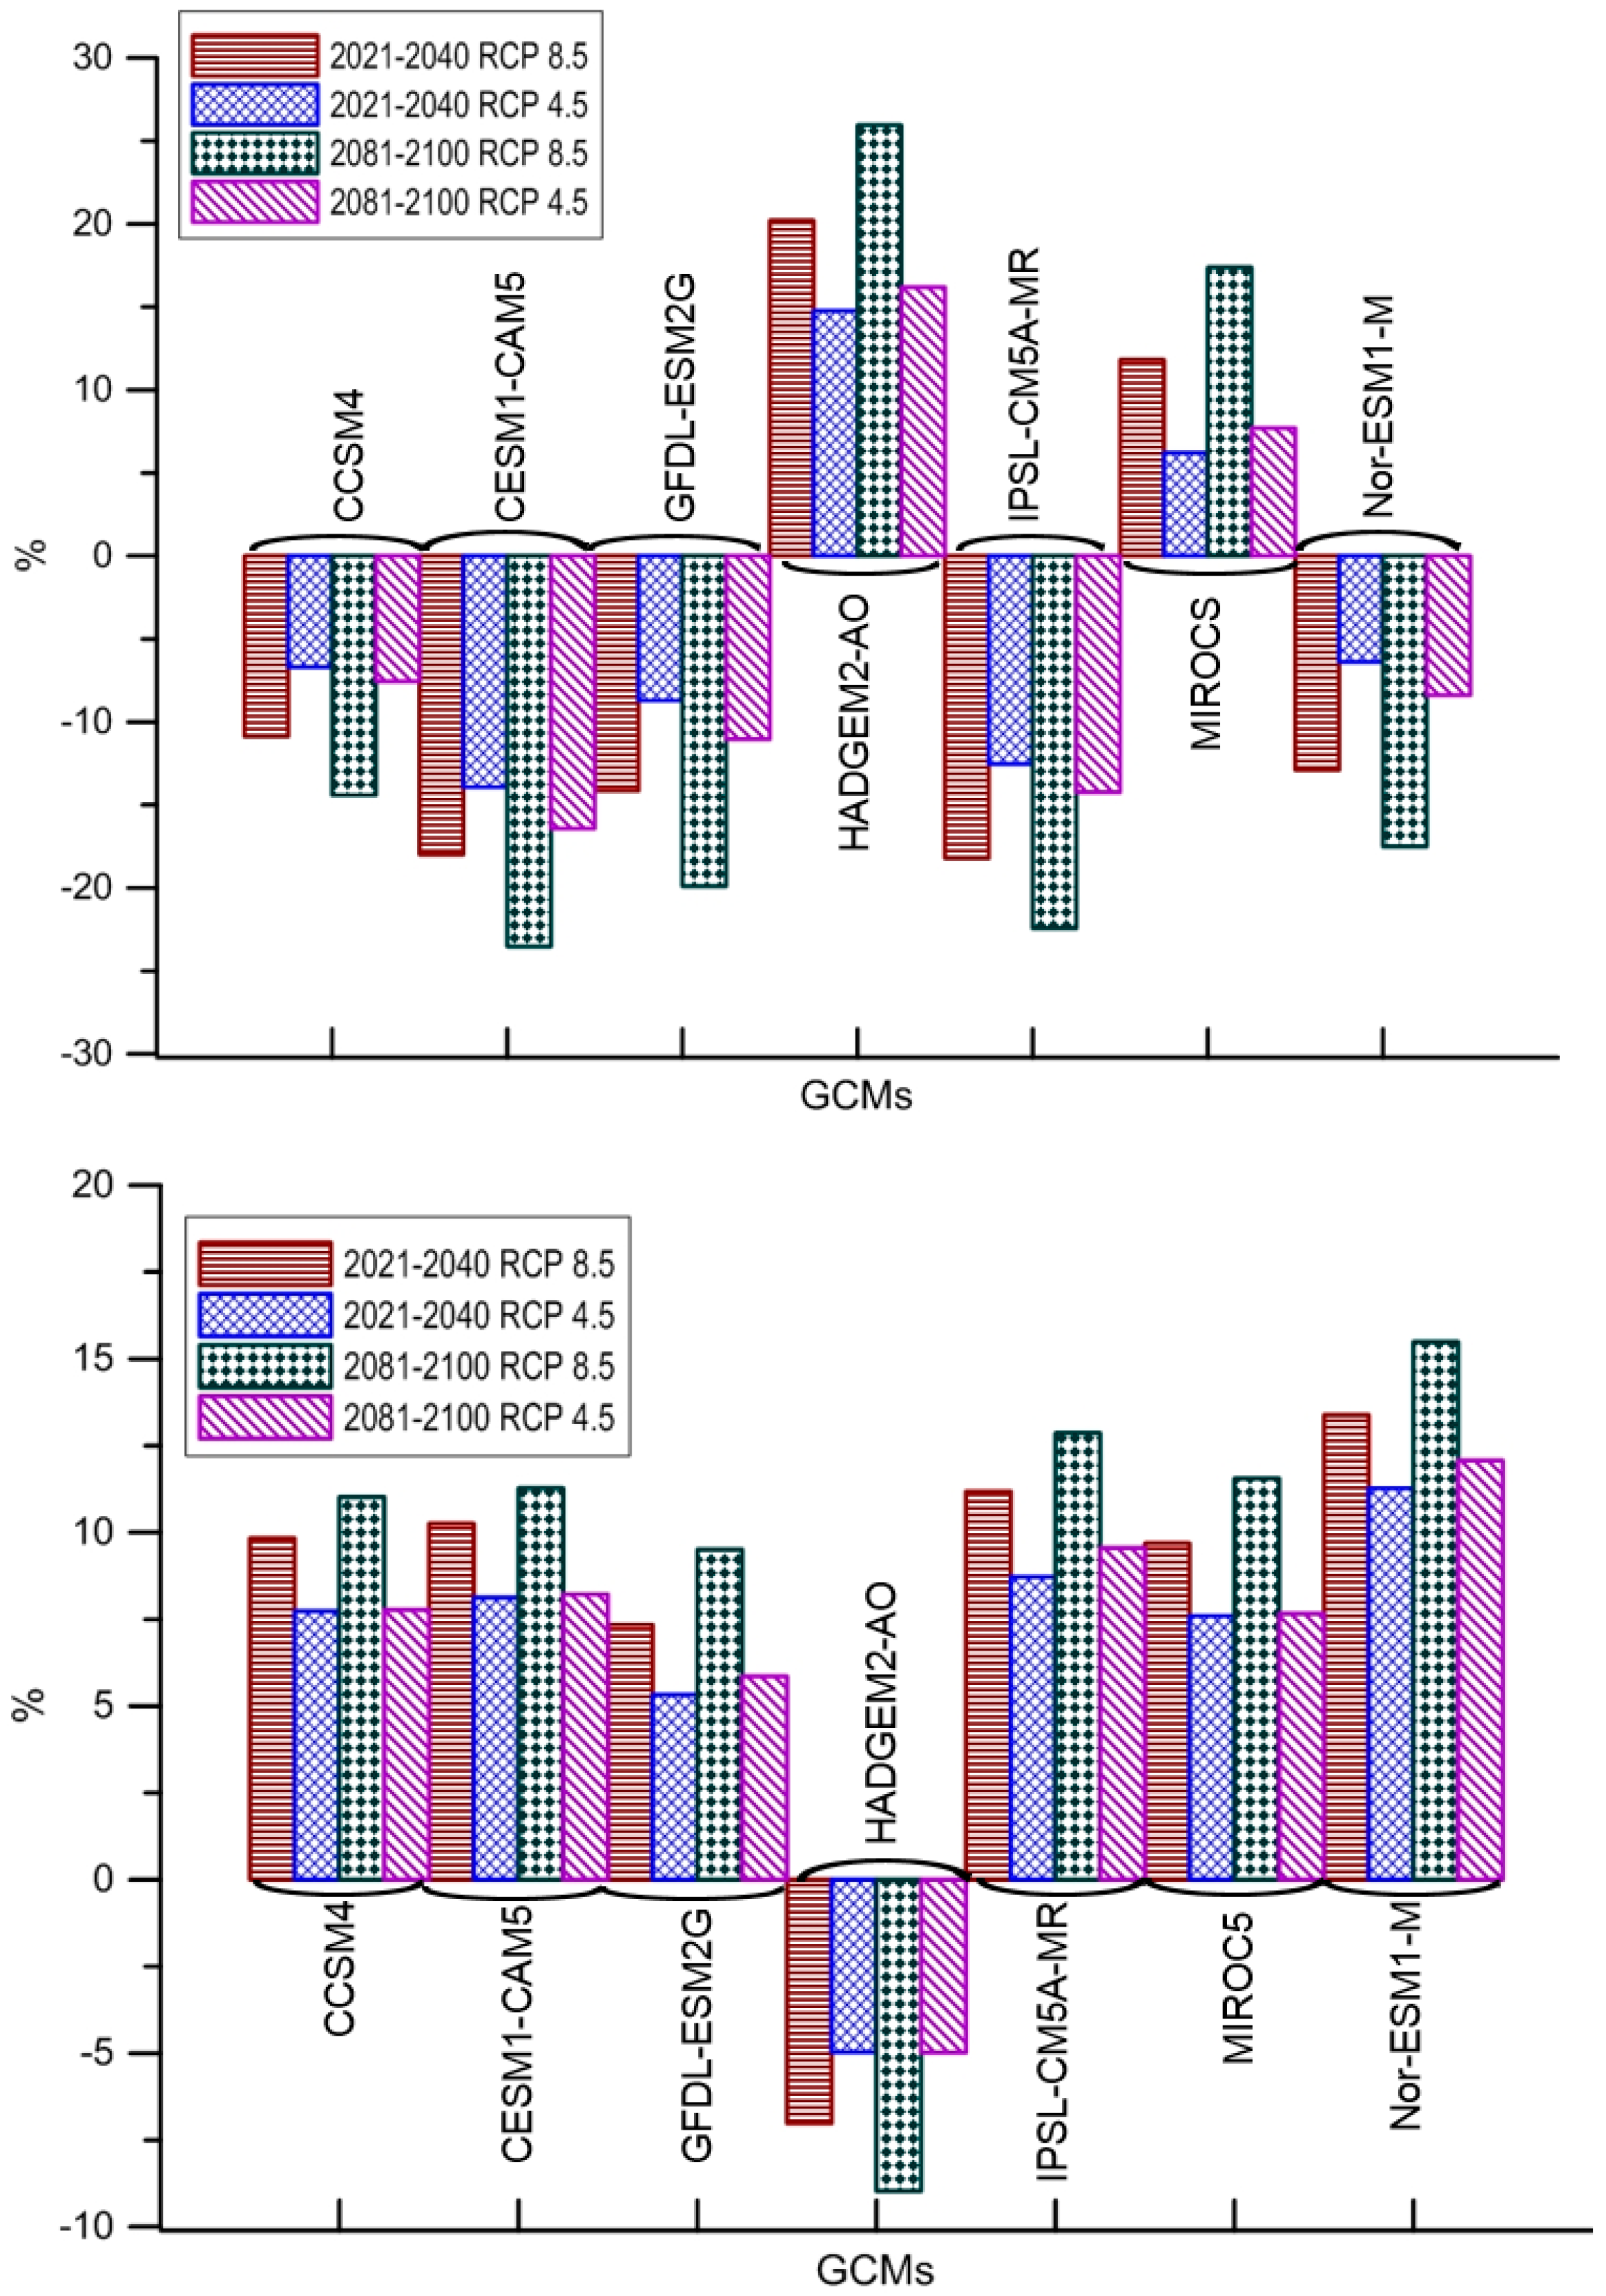
3.3. Evapotranspiration
3.4. Hydrological Model Calibration
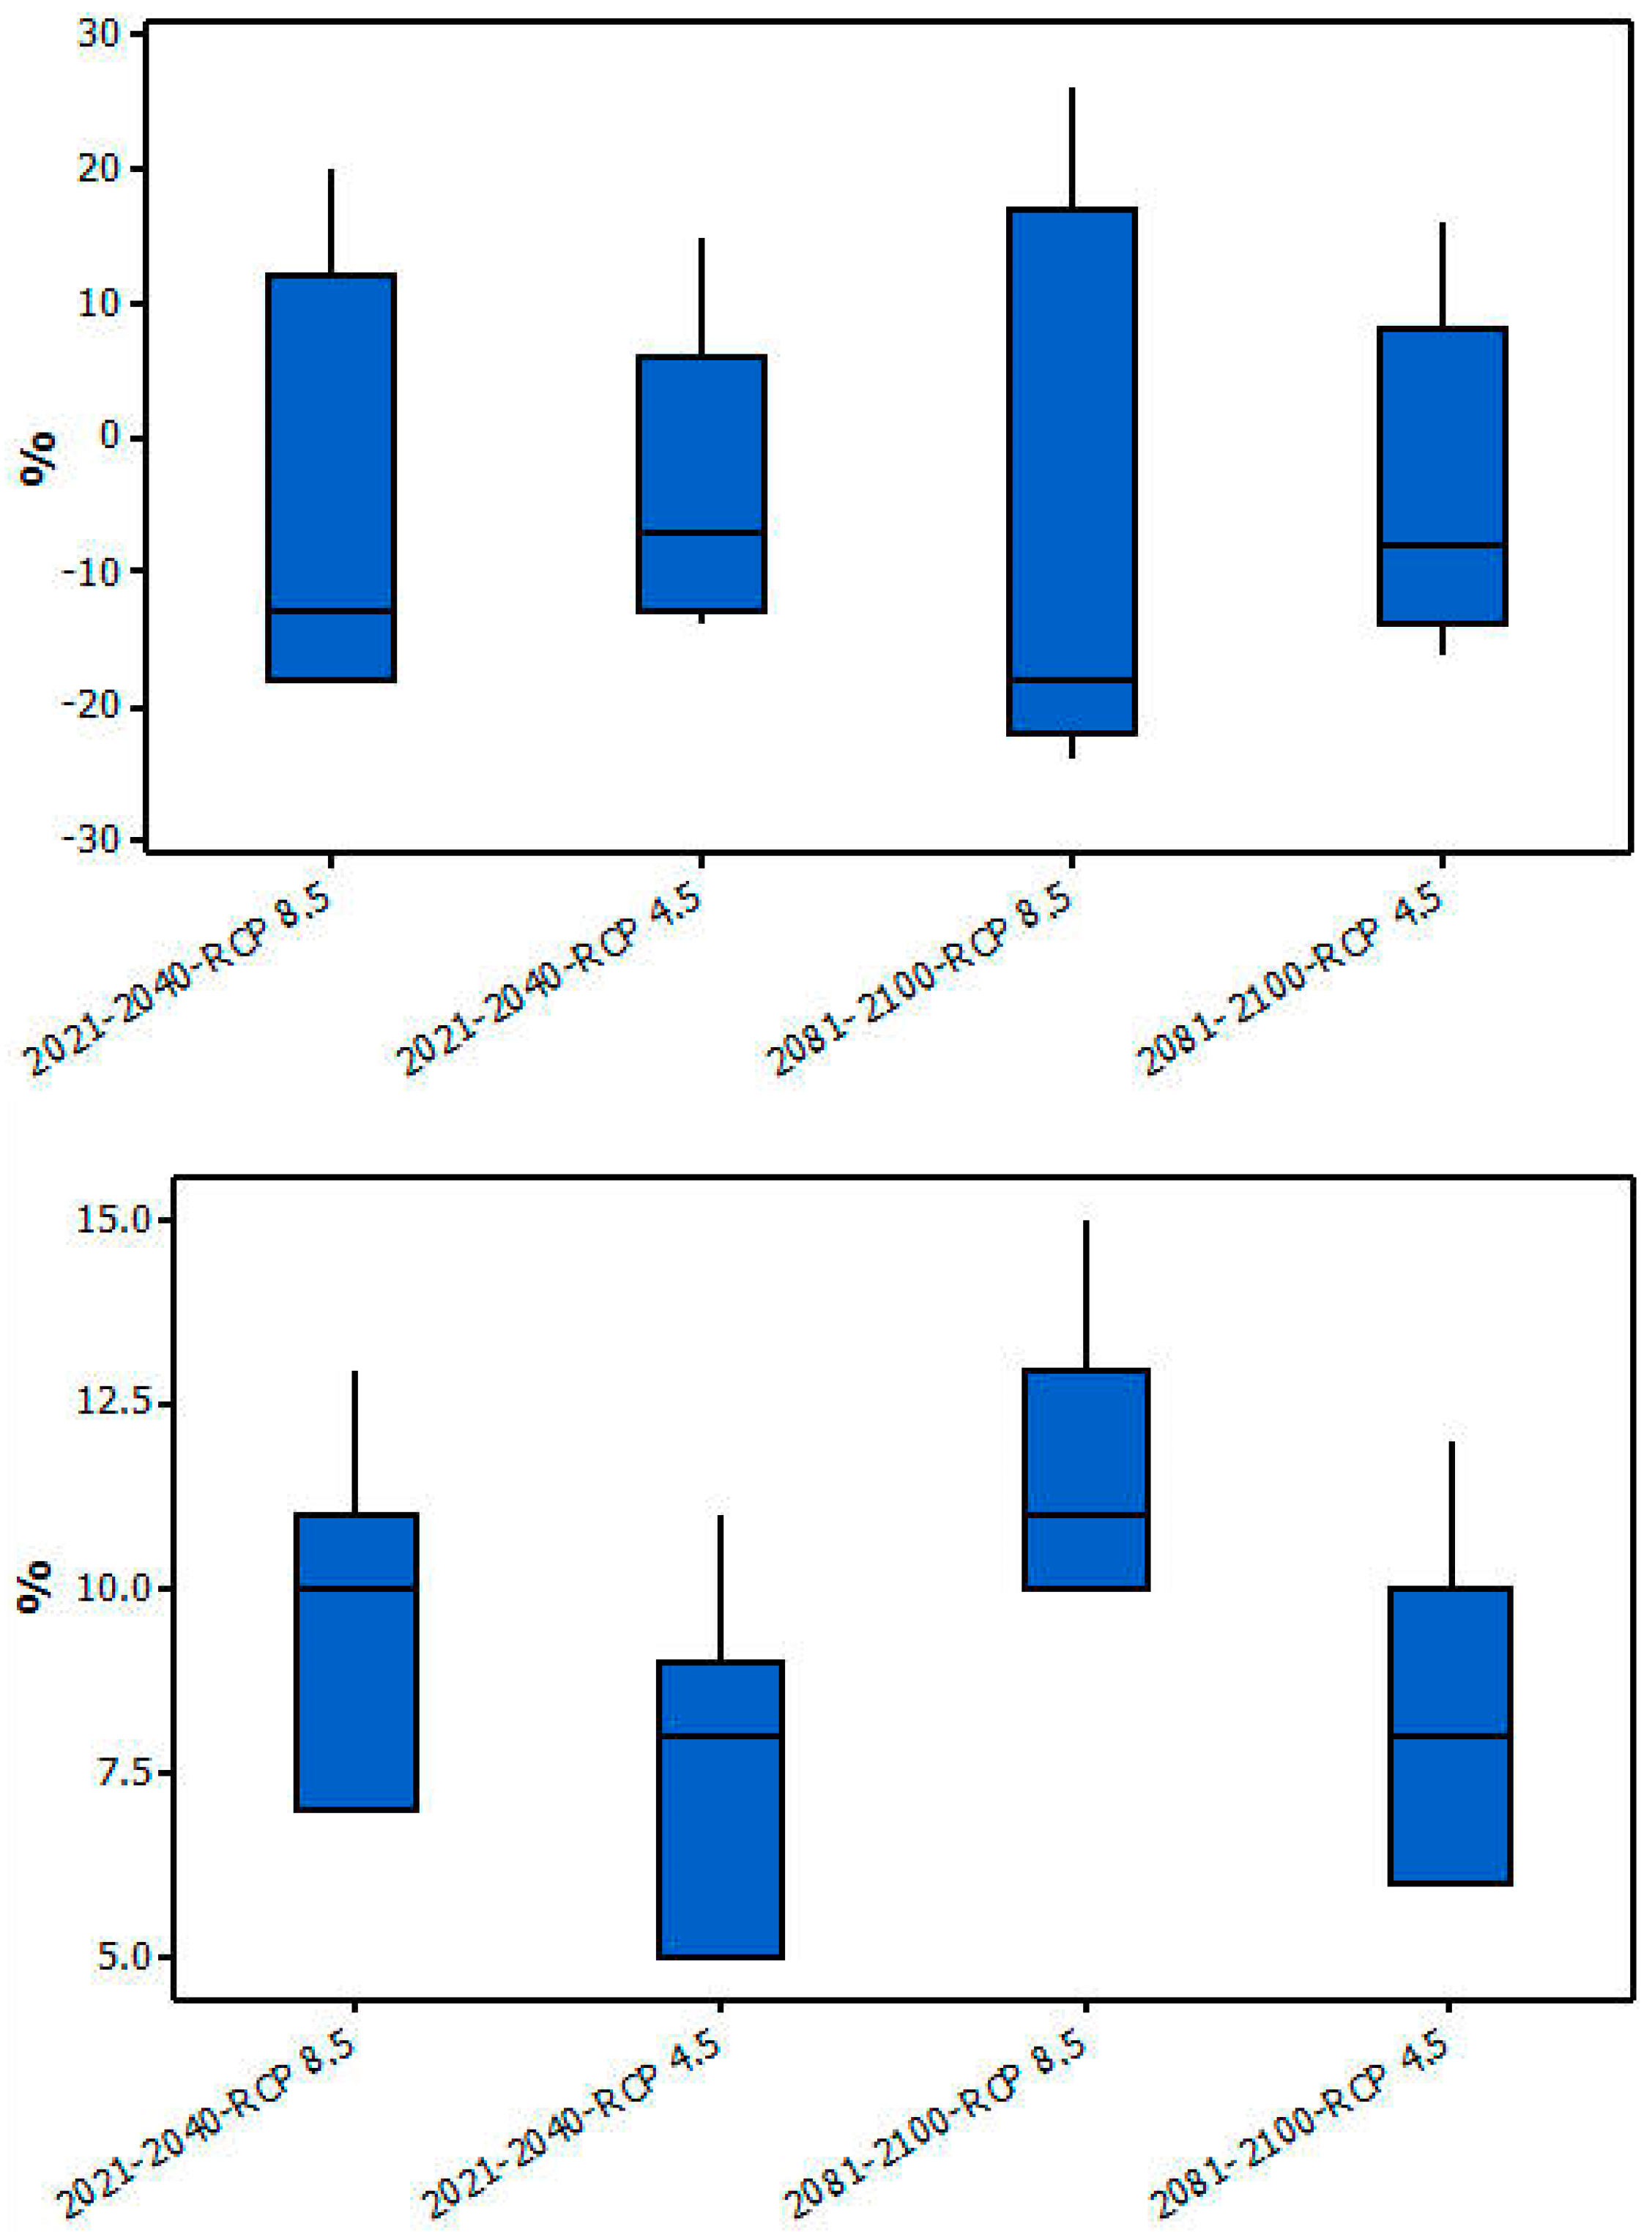
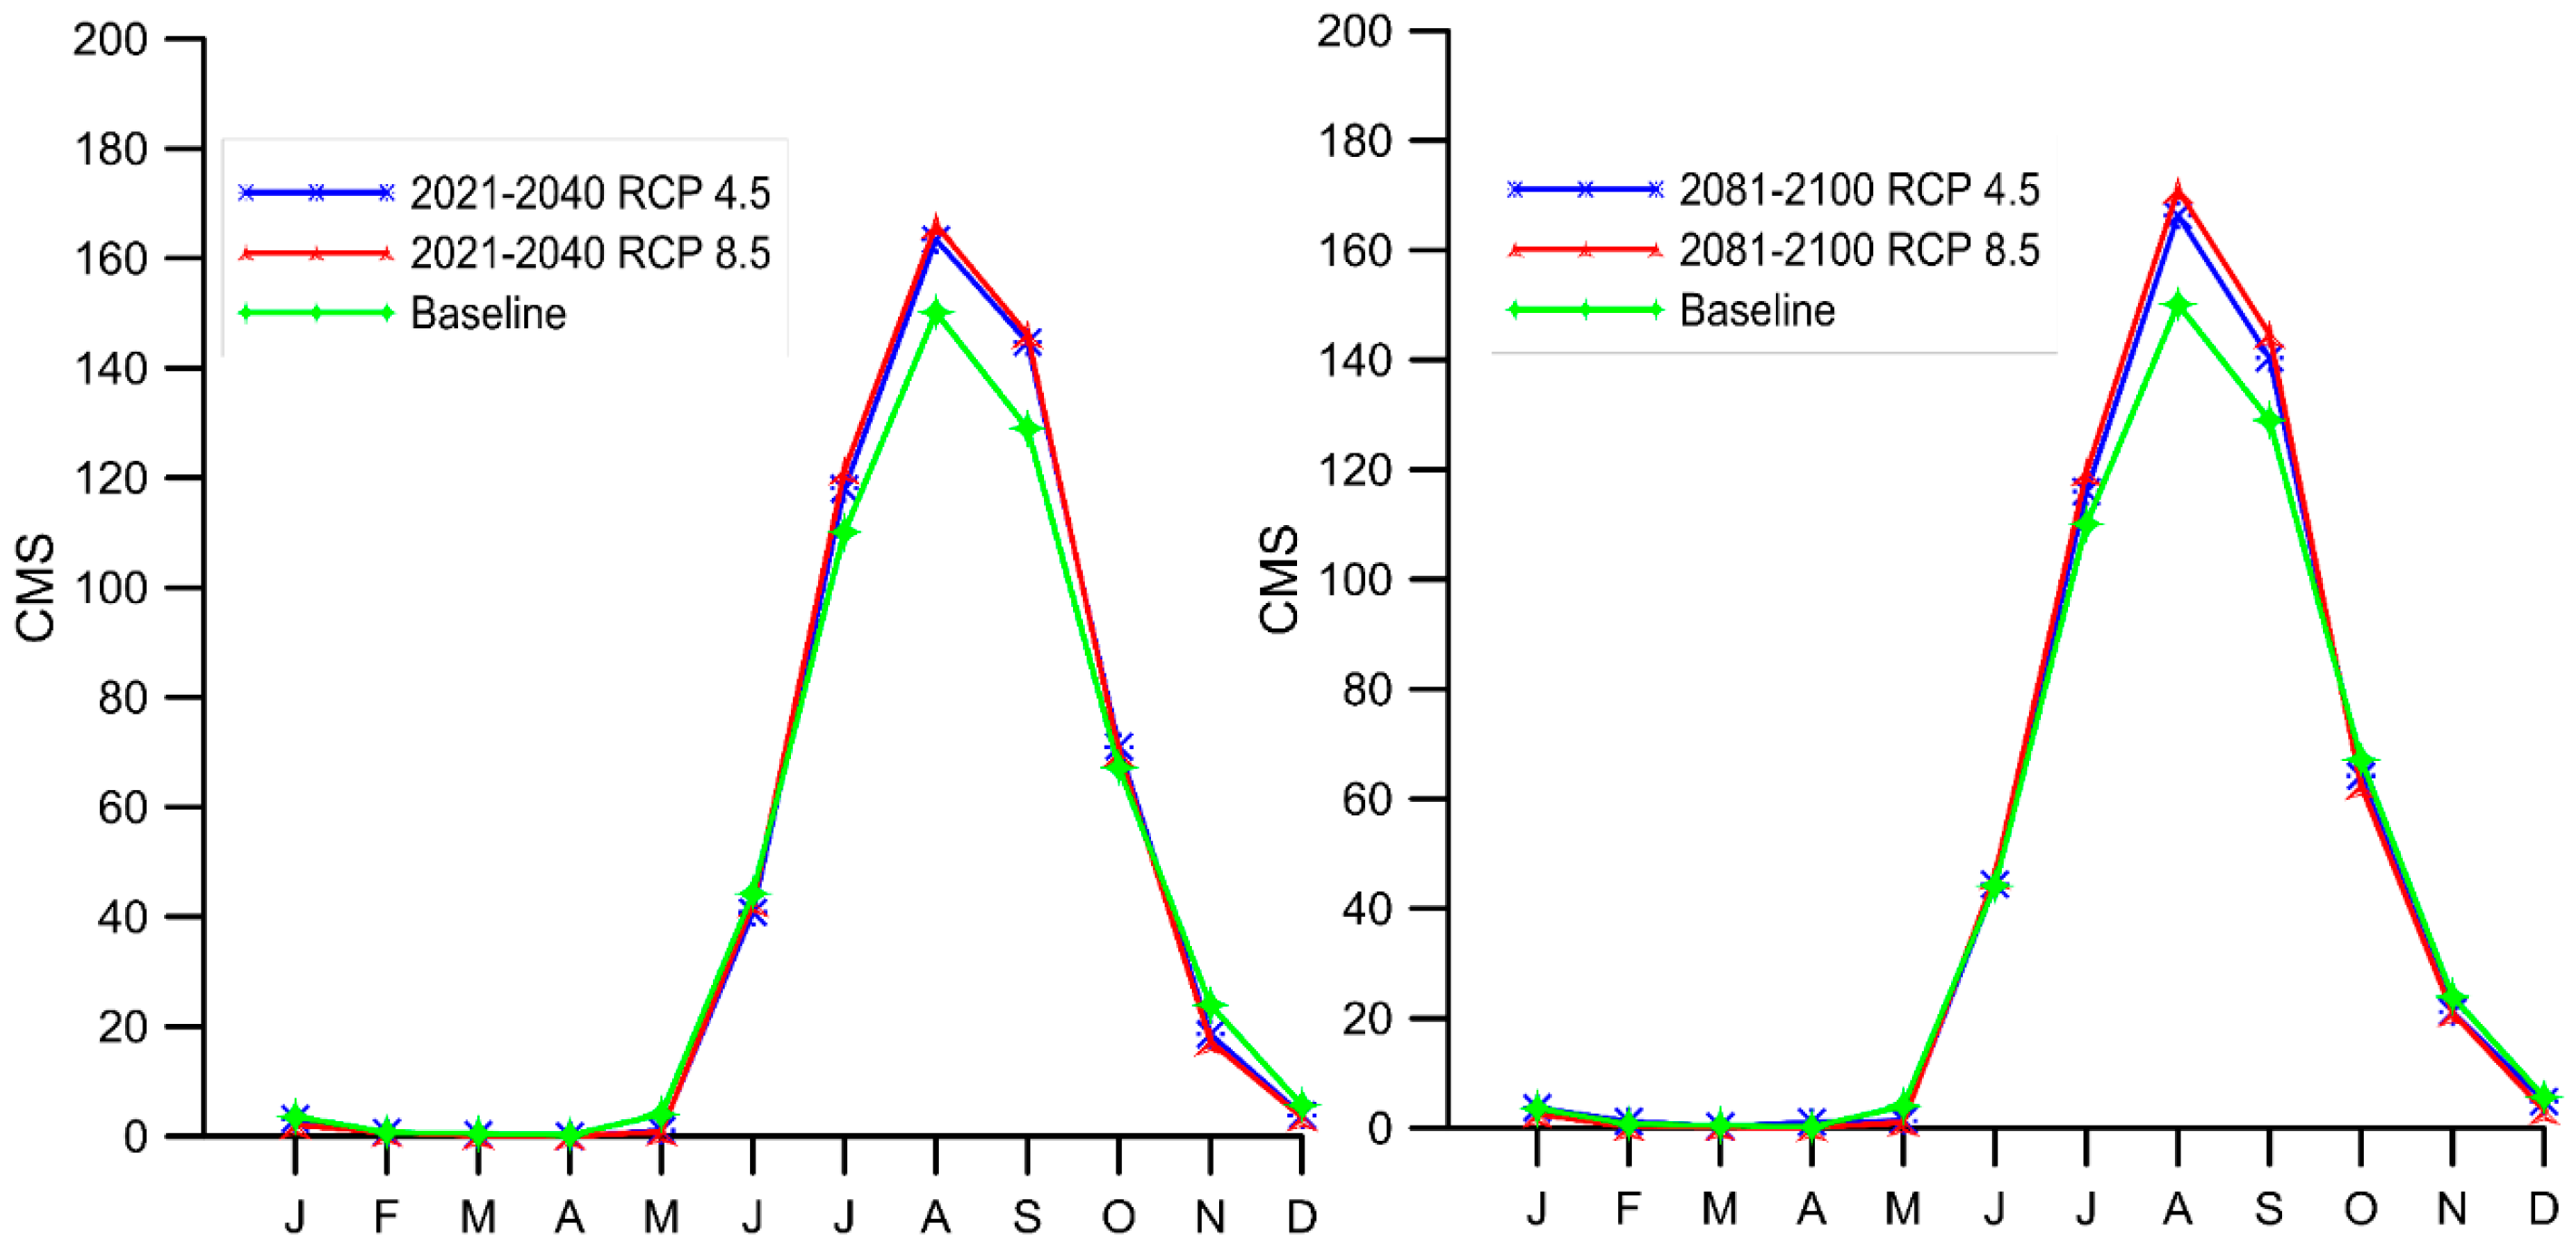
3.5. Impact of Climate Change on Runoff
Seasonal Variability of Flow
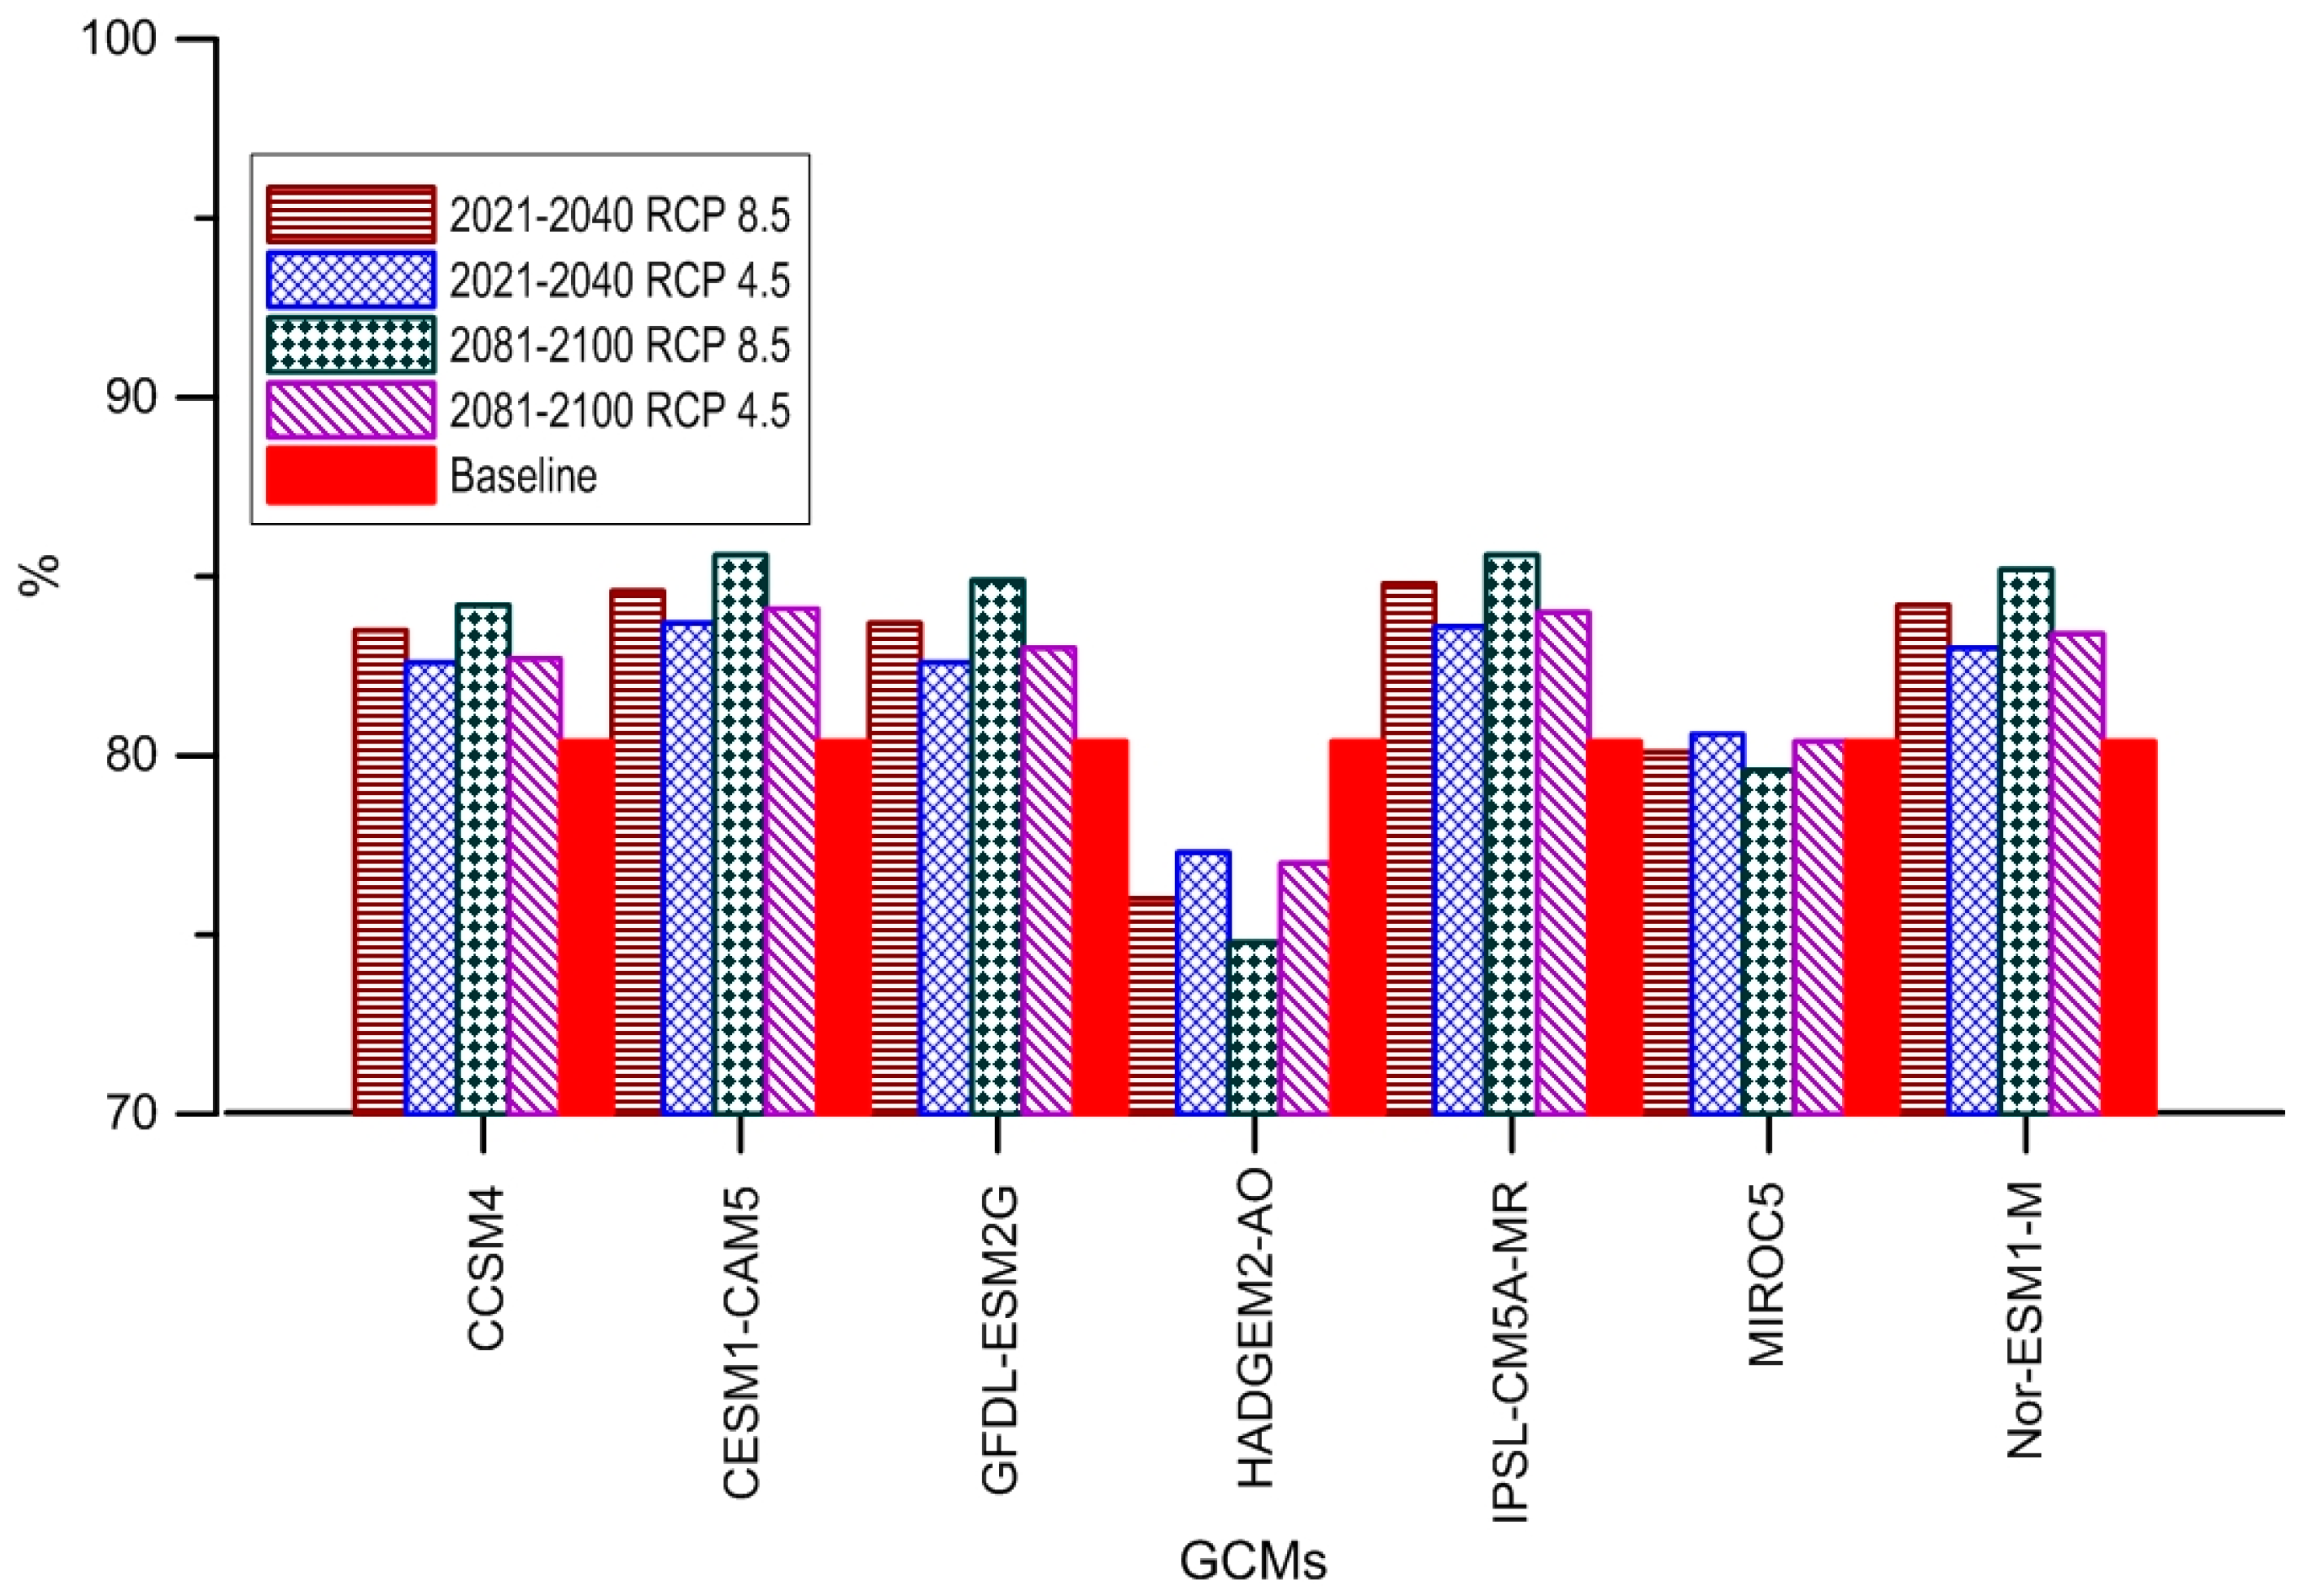
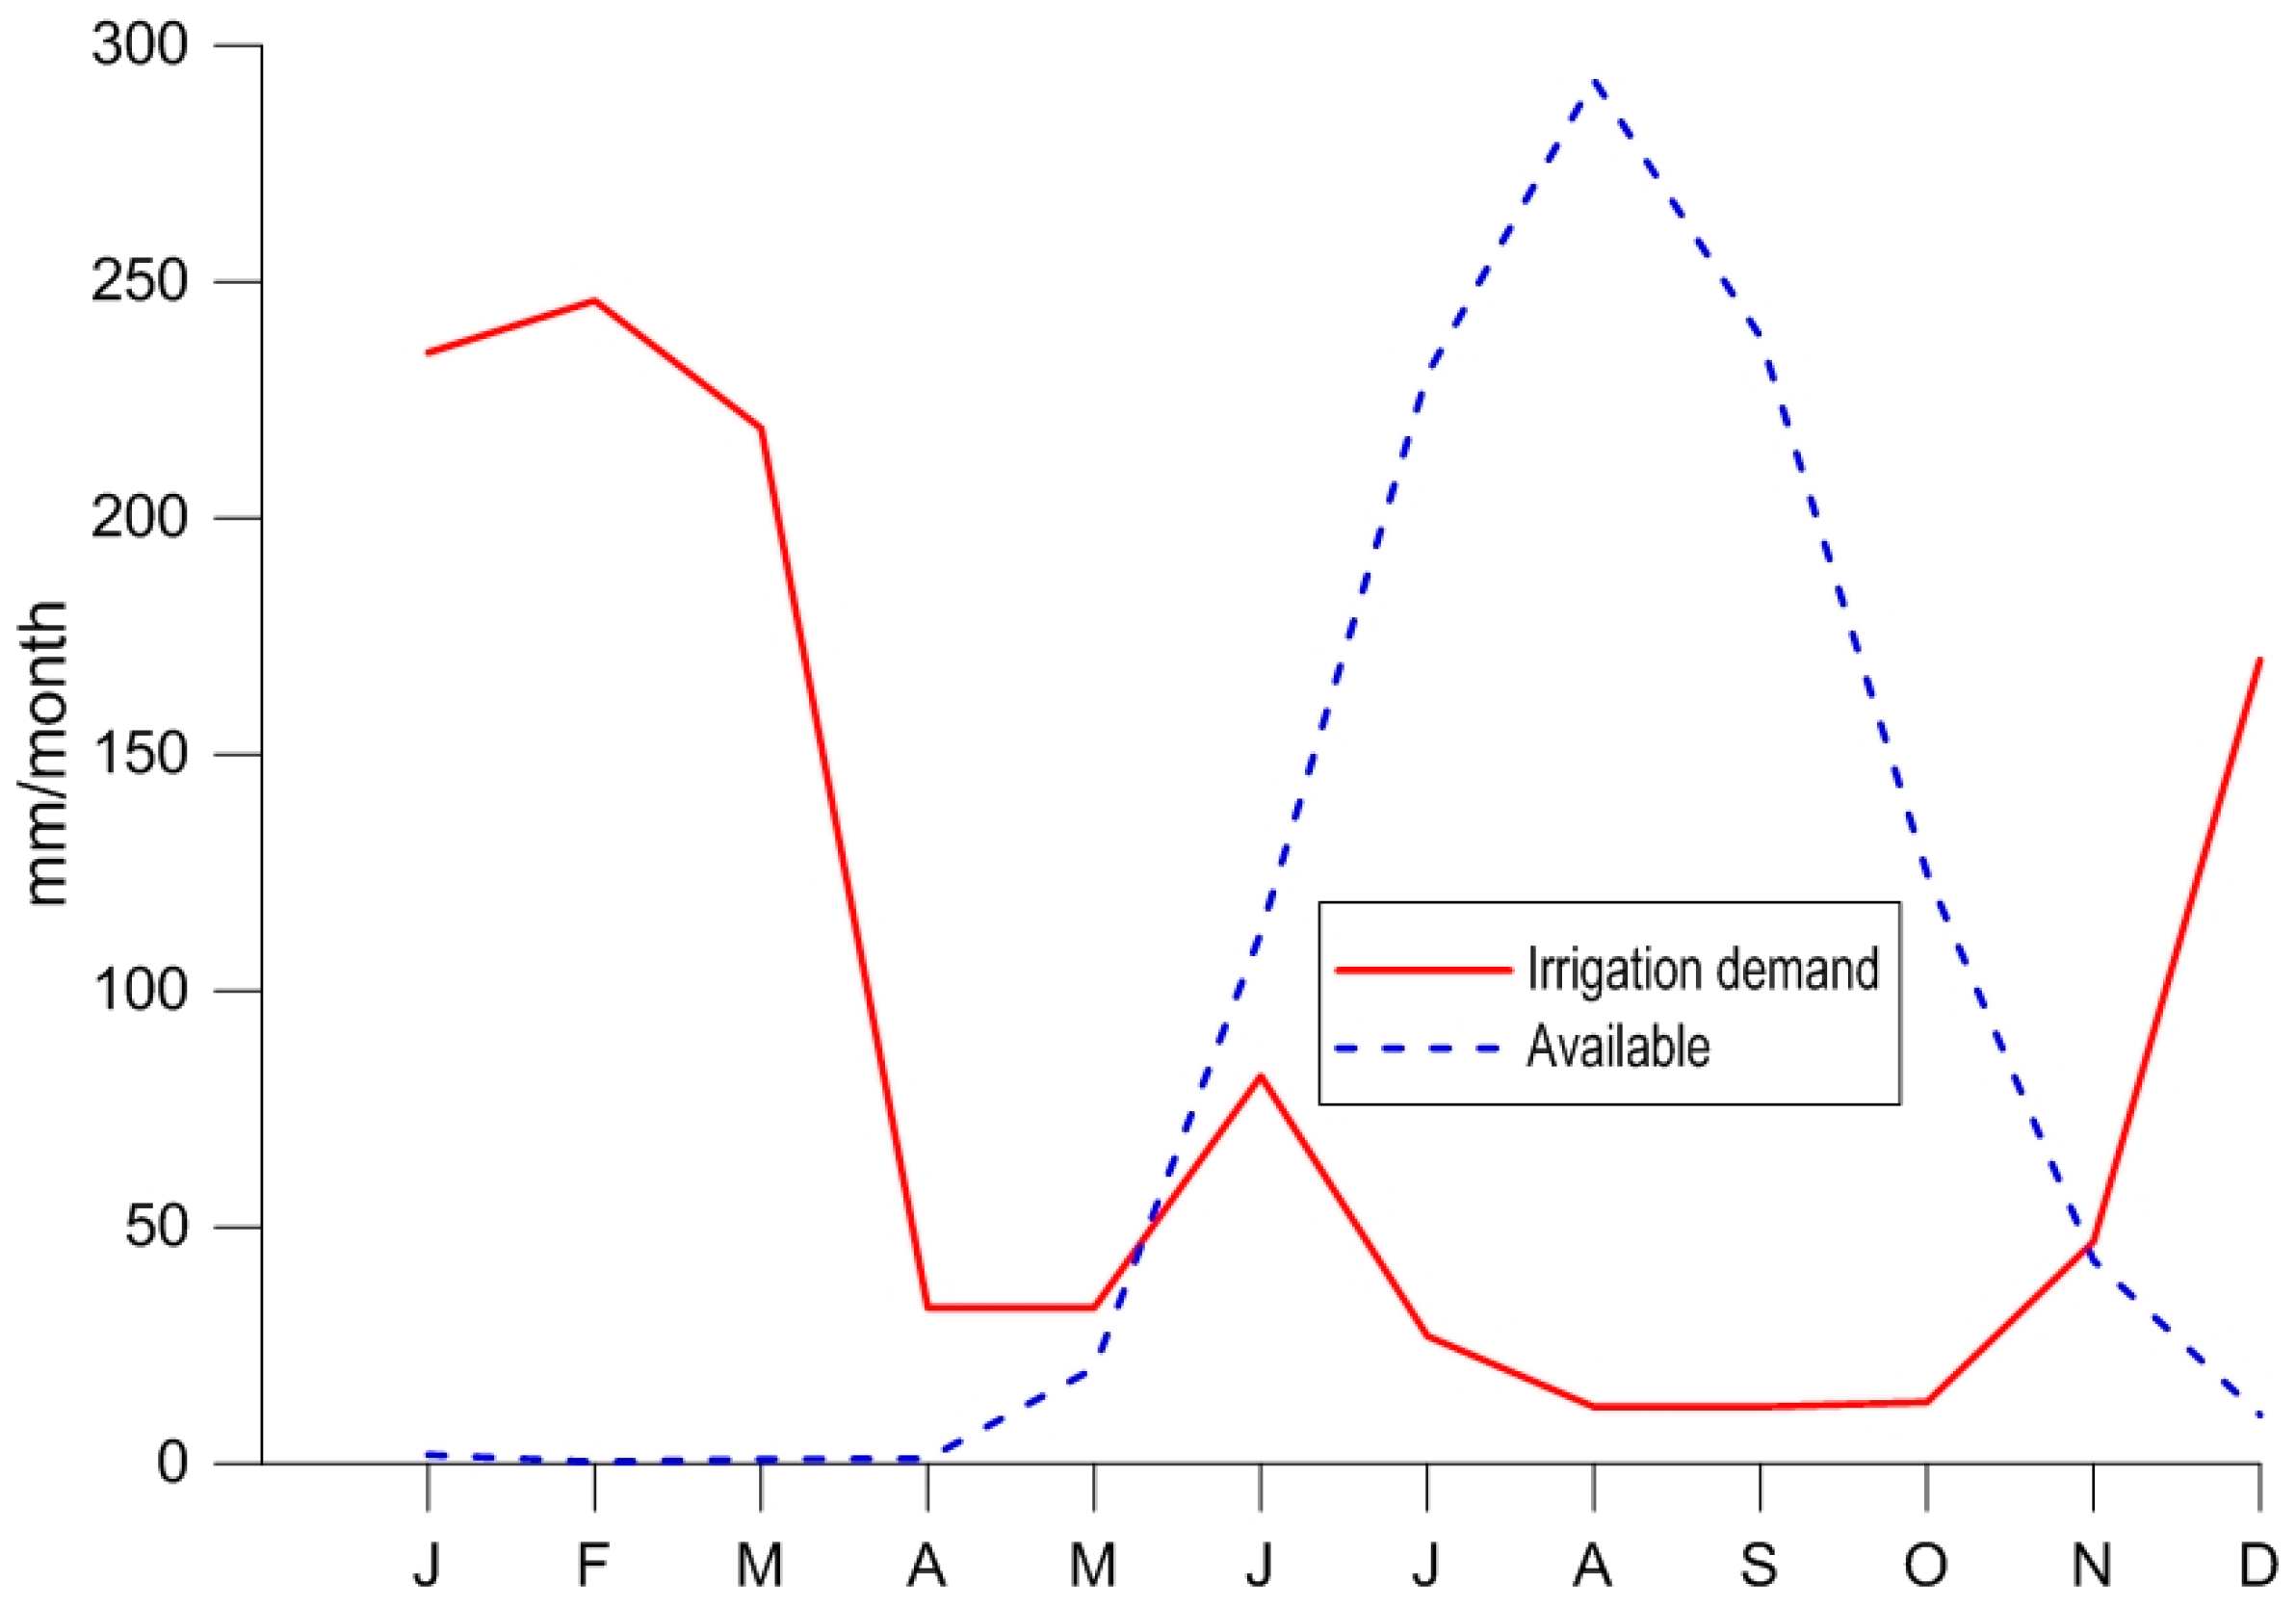
3.6. Possible Impact on Lake Storage and Irrigation Scheme
4. Discussion
5. Conclusions
Acknowledgments
Author Contributions
Conflicts of Interest
References
- Team, C.W.; Pachauri, R.; Reisinger, A. Contribution of Working Groups I, II and III to the Fourth Assessment Report of the Intergovernmental Panel on Climate Change; IPCC: Geneva, Switzerland, 2007. [Google Scholar]
- Pachauri, R.K.; Allen, M.; Barros, V.; Broome, J.; Cramer, W.; Christ, R.; Church, J.; Clarke, L.; Dahe, Q.; Dasgupta, P. Climate Change 2014: Synthesis Report. Contribution of Working Groups I, II and III to the Fifth Assessment Report of the Intergovernmental Panel on Climate Change; IPCC: Geneva, Switzerland, 2014. [Google Scholar]
- Falloon, P.D.; Betts, R.A. The impact of climate change on global river flow in HadGEM1 simulations. Atmos. Sci. Lett. 2006, 7, 62–68. [Google Scholar] [CrossRef]
- Mbaye, M.L.; Hagemann, S.; Haensler, A.; Stacke, T.; Gaye, A.T.; Afouda, A. Assessment of climate change impact on water resources in the upper senegal basin (West Africa). Am. J. Clim. Chang. 2015, 4, 77–93. [Google Scholar] [CrossRef]
- Omambia, C.S.; Gu, Y. The cost of climate change in Tanzania: Impacts and adaptations. J. Am. Sci. 2010, 6. [Google Scholar] [CrossRef]
- Nicholson, S.E.; Yin, X. Rainfall conditions in equatorial East Africa during the nineteenth century as inferred from the record of lake victoria. Clim. Chang. 2001, 48, 387–398. [Google Scholar] [CrossRef]
- Setegn, S.G.; Rayner, D.; Melesse, A.M.; Dargahi, B.; Srinivasan, R. Impact of climate change on the hydroclimatology of Lake Tana Basin, Ethiopia. Water Resour. Res. 2011, 47. [Google Scholar] [CrossRef]
- Fang, G.; Yang, J.; Chen, Y.; Zhang, S.; Deng, H.; Liu, H.; De Maeyer, P. Climate change impact on the hydrology of a typical watershed in the Tianshan Mountains. Adv. Meteorol. 2015, 2015, 960471. [Google Scholar] [CrossRef]
- Tan, M.L.; Ficklin, D.L.; Yusop, Z. Impacts and uncertainties of climate change on streamflow of the Johor River Basin, Malaysia using a CMIP5 General Circulation Model ensemble. J. Water Clim. Chang. 2014, 5, 676–695. [Google Scholar] [CrossRef]
- Beyene, T.; Lettenmaier, D.P.; Kabat, P. Hydrologic impacts of climate change on the Nile River Basin: Implications of the 2007 IPCC scenarios. Clim. Chang. 2010, 100, 433–461. [Google Scholar] [CrossRef]
- Abdo, K.; Fiseha, B.; Rientjes, T.; Gieske, A.; Haile, A. Assessment of climate change impacts on the hydrology of gilgel abay catchment in Lake Tana Basin, Ethiopia. Hydrol. Process. 2009, 23, 3661–3669. [Google Scholar] [CrossRef]
- Thornes, J.E.; IPCC. Climate Change 2001: Impacts, Adaptation and Vulnerability, Contribution of Working Group II to the Third Assessment Report of the Intergovernmental Panel on Climate Change; Mccarthy, J.J., Canziani, O.F., Leary, N.A., Dokken, D.J., White, K.S., Eds.; Cambridge University Press: Cambridge, UK; New York, NY, USA, 2001; p. 1032. [Google Scholar]
- Haith, D.A.; Mandel, R.; Wu, R.S. GWLF, Generalized Watershed Loading Functions, Version 2.0, User’s Manual; Department of Agricultural & Biological Engineering, Cornell University: Ithaca, NY, USA, 1992. [Google Scholar]
- McCartney, M.; Alemayehu, T.; Shiferaw, A.; Awulachew, S. Evaluation of Current and Future Water Resources Development in the Lake Tana Basin, Ethiopia; IWMI: Colombo, Sri Lanka, 2010; Volume 134. [Google Scholar]
- Easton, Z.; Fuka, D.; White, E.; Collick, A.; Biruk Ashagre, B.; McCartney, M.; Awulachew, S.; Ahmed, A.; Steenhuis, T. A multi basin SWAT model analysis of runoff and sedimentation in the Blue Nile, Ethiopia. Hydrol. Earth Syst. Sci. 2010, 14, 1827–1841. [Google Scholar] [CrossRef]
- Federal Democratic Republic of Ethiopia Population Census Commission (FDREP). Summary and Statistical Report of the 2007 Population and Housing Census; UNFPA: Addis Ababa, Ethiopia, 2008. [Google Scholar]
- Enyew, B.; Van Lanen, H.; Van Loon, A. Assessment of the impact of climate change on hydrological drought in Lake Tana catchment, Blue Nile Basin, Ethiopia. J. Geol. Geosci. 2015, 2014. [Google Scholar] [CrossRef]
- Dingman, S.L. Physical Hydrology; Prentice Hall: Upper Saddle River, NJ, USA, 2002. [Google Scholar]
- Meinshausen, M.; Smith, S.J.; Calvin, K.; Daniel, J.S.; Kainuma, M.; Lamarque, J.; Matsumoto, K.; Montzka, S.; Raper, S.; Riahi, K. The RCP greenhouse gas concentrations and their extensions from 1765 to 2300. Clim. Chang. 2011, 109, 213–241. [Google Scholar] [CrossRef]
- Riahi, K.; Rao, S.; Krey, V.; Cho, C.; Chirkov, V.; Fischer, G.; Kindermann, G.; Nakicenovic, N.; Rafaj, P. RCP 8.5—A scenario of comparatively high greenhouse gas emissions. Clim. Chang. 2011, 109, 33–57. [Google Scholar] [CrossRef]
- Thomson, A.M.; Calvin, K.V.; Smith, S.J.; Kyle, G.P.; Volke, A.; Patel, P.; Delgado-Arias, S.; Bond-Lamberty, B.; Wise, M.A.; Clarke, L.E. RCP 4.5: A pathway for stabilization of radiative forcing by 2100. Clim. Chang. 2011, 109, 77–94. [Google Scholar] [CrossRef]
- Wise, M.; Calvin, K.; Thomson, A.; Clarke, L.; Bond-Lamberty, B.; Sands, R.; Smith, S.J.; Janetos, A.; Edmonds, J. Implications of limiting CO2 concentrations for land use and energy. Science 2009, 324, 1183–1186. [Google Scholar] [CrossRef] [PubMed]
- Tung, C.P.; Liu, T.M.; Chen, S.W.; Ke, K.Y.; Li, M.H. Carrying capacity and sustainability appraisals on regional water supply system under climate change. Br. J. Environ. Clim. Chang. 2014, 4, 27–44. [Google Scholar] [CrossRef]
- Snowy Mountains Engineering Corporation (SMEC). Hydrological study of the Tana-Beles Sub-Basin: Surface Water Investigation; SMEC: Melbourne, Australia, 2008. [Google Scholar]
- Kurc, S.A.; Small, E.E. Soil moisture variations and ecosystem-scale fluxes of water and carbon in semiarid grassland and shrubland. Water Resour. Res. 2007, 43. [Google Scholar] [CrossRef]
- Wilske, B.; Kwon, H.; Wei, L.; Chen, S.; Lu, N.; Lin, G.; Xie, J.; Guan, W.; Pendall, E.; Ewers, B.E. Evapotranspiration (ET) and regulating mechanisms in two semiarid artemisia-dominated shrub steppes at opposite sides of the globe. J. Arid Environ. 2010, 74, 1461–1470. [Google Scholar] [CrossRef]
- United Nations Economic Commission for Africa (UNECA); African Climate Policy Centre (ACPC). Climate Change and Water Resources of Africa: Challenges, Opportunities and Impacts; Working Paper 5; UNECA: Addis Ababa, Ethiopia, 2011. [Google Scholar]
- Babatolu, J.; Akinnubi, R. Influence of climate change in Niger River Basin development authority area on Niger Runoff, Nigeria. J. Earth Sci. Clim. Chang. 2014, 5, 1–8. [Google Scholar] [CrossRef]
- Belete, M.A. Modeling and Analysis of Lake Tana Sub Basin Water Resources Systems, Ethiopia. Ph.D. Thesis, University of Rostock, Rostock, Germany, 2013. [Google Scholar]
- Wale, A.; Rientjes, T.; Gieske, A.; Getachew, H. Ungauged catchment contributions to lake tana’s water balance. Hydrol. Process. 2009, 23, 3682–3693. [Google Scholar] [CrossRef]
- Li, M.-H.; Tien, W.; Tung, C.-P. Assessing the impact of climate change on the land hydrology in Taiwan. Paddy Water Environ. 2009, 7, 283–292. [Google Scholar] [CrossRef]


| Time Windows | Scenarios (RCPs) | Dry-Season | Wet-Season | ||||||
|---|---|---|---|---|---|---|---|---|---|
| P | ET | P | ET | ||||||
| (+), 2 | (−), 5 | (+), 2 | (−), 5 | (+), 6 | (−), 1 | (+), 7 | (−), 0 | ||
| 2021–2040 | RCP 8.5 | 10% | 13% | 9% | 17% | 10% | 10% | 12% | 0 |
| RCP 4.5 | 7% | 9% | 6% | 13% | 7% | 7% | 9% | 0 | |
| 2081–2100 | RCP 8.5 | 20% | 15% | 17% | 20% | 15% | 13% | 16% | 0 |
| RCP 4.5 | 14% | 10% | 10% | 13% | 10% | 9% | 11% | 0 | |
| Current Contribution | Percent Increase in Projected Contribution | |||
|---|---|---|---|---|
| Volume percentage | 2021–2040 | 2081–2100 | ||
| RCP 8.5 | RCP 4.5 | RCP 8.5 | RCP 4.5 | |
| 19.5 | 5.2 | 4.2 | 5.5 | 4.3 |
© 2016 by the authors; licensee MDPI, Basel, Switzerland. This article is an open access article distributed under the terms and conditions of the Creative Commons Attribution (CC-BY) license (http://creativecommons.org/licenses/by/4.0/).
Share and Cite
Ayele, H.S.; Li, M.-H.; Tung, C.-P.; Liu, T.-M. Impact of Climate Change on Runoff in the Gilgel Abbay Watershed, the Upper Blue Nile Basin, Ethiopia. Water 2016, 8, 380. https://doi.org/10.3390/w8090380
Ayele HS, Li M-H, Tung C-P, Liu T-M. Impact of Climate Change on Runoff in the Gilgel Abbay Watershed, the Upper Blue Nile Basin, Ethiopia. Water. 2016; 8(9):380. https://doi.org/10.3390/w8090380
Chicago/Turabian StyleAyele, Hailu Sheferaw, Ming-Hsu Li, Ching-Pin Tung, and Tzu-Ming Liu. 2016. "Impact of Climate Change on Runoff in the Gilgel Abbay Watershed, the Upper Blue Nile Basin, Ethiopia" Water 8, no. 9: 380. https://doi.org/10.3390/w8090380
APA StyleAyele, H. S., Li, M.-H., Tung, C.-P., & Liu, T.-M. (2016). Impact of Climate Change on Runoff in the Gilgel Abbay Watershed, the Upper Blue Nile Basin, Ethiopia. Water, 8(9), 380. https://doi.org/10.3390/w8090380