Article

Performance of Four Full-Scale Artificially Aerated Horizontal Flow Constructed Wetlands for Domestic Wastewater Treatment

1
Cranfield University, College Road, Cranfield, Bedfordshire MK43 0AL, UK
2
Severn Trent Water, 2 St John’s Street, Coventry CV1 2LZ, West Midlands, UK
3
DICATECh, Polytechnic University of Bari, Bari 70125, Italy
*
Author to whom correspondence should be addressed.
Water 2016, 8(9), 365; https://doi.org/10.3390/w8090365
Submission received: 2 June 2016 / Revised: 13 August 2016 / Accepted: 15 August 2016 / Published: 24 August 2016
(This article belongs to the Special Issue Constructed Wetlands for Water Treatment: New Developments)

Abstract

:
A comparison of the performance of four full-scale aerated horizontal flow constructed wetlands was conducted to determine the efficacy of the technology on sites receiving high and variable ammonia loading rates not yet reported in the literature. Performance was assessed in terms of ammonia and solids removal, hydraulic conductivity and mixing patterns. The capability of systems to produce ammonium effluent concentrations <3 mgNH4+-N/L was observed across all sites in systems receiving variable loadings between 0.1 and 13.0 gNH4+-N/m2/d. Potential resilience issues were observed in relation to response to spike loadings posited to be due to an insufficient nitrifying population within the beds. Hydraulic conductivity and flow mixing patterns observed suggested deterioration of the reactor effective volume over time. Overall, the study demonstrates the efficacy of the technology where ammonium removal is required on small sites receiving high and variable flow rates, with adequate removal of organics and solids, but no significant benefit to the long term hydraulics of the system.

1. Introduction

Horizontal sub-surface flow constructed wetlands (HSSF CWs) are passive wastewater treatment systems commonly used for the removal of suspended solids, organic matter, and nitrate. The relatively large footprint associated with the technology of 5–10 m2/person equivalent (p.e.) and 0.7–1 m2/p.e. in secondary and tertiary sewage treatment applications, respectively, focuses applications towards rural small works (sub 2000 p.e.). In response to the challenges associated with achieving “good ecological status” in European rivers, as part of the Water Framework Directive, a large number of these rural domestic wastewater treatment plants are requiring upgrading in order to discharge lower levels of organic matter and ammonia into the receiving waters. To achieve this, the flowsheet is typically upgraded by replacement/enhancement of the secondary biological processes or inclusion of additional aerobic biological processes, such as submerged aerated filters [1].
Sub-surface flow wetlands can also be considered to be a form of biofilm-based bioreactors and hence functionally have the capability to meet the future needs. However, traditional HSSF beds are often hydraulically loaded at rates that cause anoxic/anaerobic conditions to predominate with the associated sub-surface oxygen limitation (sub 0.5 mg/L) restricting observed nitrification rates in full scale tertiary HSSF CWs to 0.05–0.22 gNH4+-N/m2/d [2]. This type of operation and loading rates are generally insufficient to meet future discharge targets within typically limited available land areas. Across the full spectrum of applications for constructed wetlands a number of innovative adaptations have been developed to overcome the oxygen limitation including decreasing the depth of the bed [3]; recirculation of the treated effluent [4]; batch loading including traditional vertical flow systems [5] and adaption to horizontal flow beds, i.e., tidal flow [6]; and forced (artificial) aeration of traditional vertical flow systems [7], flooded vertical flow systems [8], or horizontal flow beds [2,9].
The general efficacy of the approach towards enhancing nitrification has been demonstrated predominately at pilot scale for a range of feed water types including synthetic wastewater [10,11], heavily polluted river water [12], and municipal secondary sewage [8]. Illustrations of the efficacy of the technology have also been presented at full-scale in terms of the treatment of landfill leachate [13], industrial wastewater [14], and tertiary treatment of municipal sewage [2]. In the latter, hydraulic loading rates are considerably higher than those utilised elsewhere with typical rates of 0.2–0.9 m/d reported in the UK [15] compared to 0.001–0.049 m/d for the sites treating industrial wastewaters [14]. Ammonia concentrations feeding the tertiary beds can reach as high as 40 mgNH4+-N/L on sites that previously had no requirement to remove ammonia and, as such, ammonia-loading rates can significantly exceed those previously considered. To illustrate, non-tertiary cases have reported loading rates in the range 0.9 gNH4+-N/m2/d to 6.9 gNH4+-N/m2/d [8,13], which compares to a maximum rate of 10.1 mgNH4+-N/m2/d observed during an assessment of the initial stages of operation of a full scale tertiary aerated wetland [2]. The same study demonstrated near complete nitrification (99% removal) without negatively impacting on solids and organic matter removal efficiencies. Aeration also appeared to increase hydraulic conductivity, and improve hydraulic efficiency in the aerated bed under sub-surface flow, resulting in a more efficient reactor [2].
A paucity of information remains around full-scale tertiary systems treating variable flows and loads including storm flows and the inherent seasonal variations in wastewater characteristics and temperatures. Coupled to the short duration of the majority of previous investigation at both pilot and full scale the appropriateness of the technology has yet to proven sufficiently to enhance confidence, particularly in terms of the performance consistency across various applications of the technology. This study aims to respond to this knowledge gap through assessment of four full-scale wetlands retrofitted with artificial aeration in small domestic wastewater treatment works in the UK. The current study extends beyond the initial study carried out on a fully aerated tertiary system with separate storm over-flow during its first year post commissioning [2], to assess suitability of the artificial aeration across various situations including intermittent aeration, tertiary combined storm flow and a secondary bed. Performance was assessed in terms of ammonia and solids removal, hydraulic conductivity and mixing patterns and in terms of process robustness to determine whether the use of aerated HSSF CWs is viable as a reliable tertiary process for ammonium removal on small sites.

2. Materials and Methods
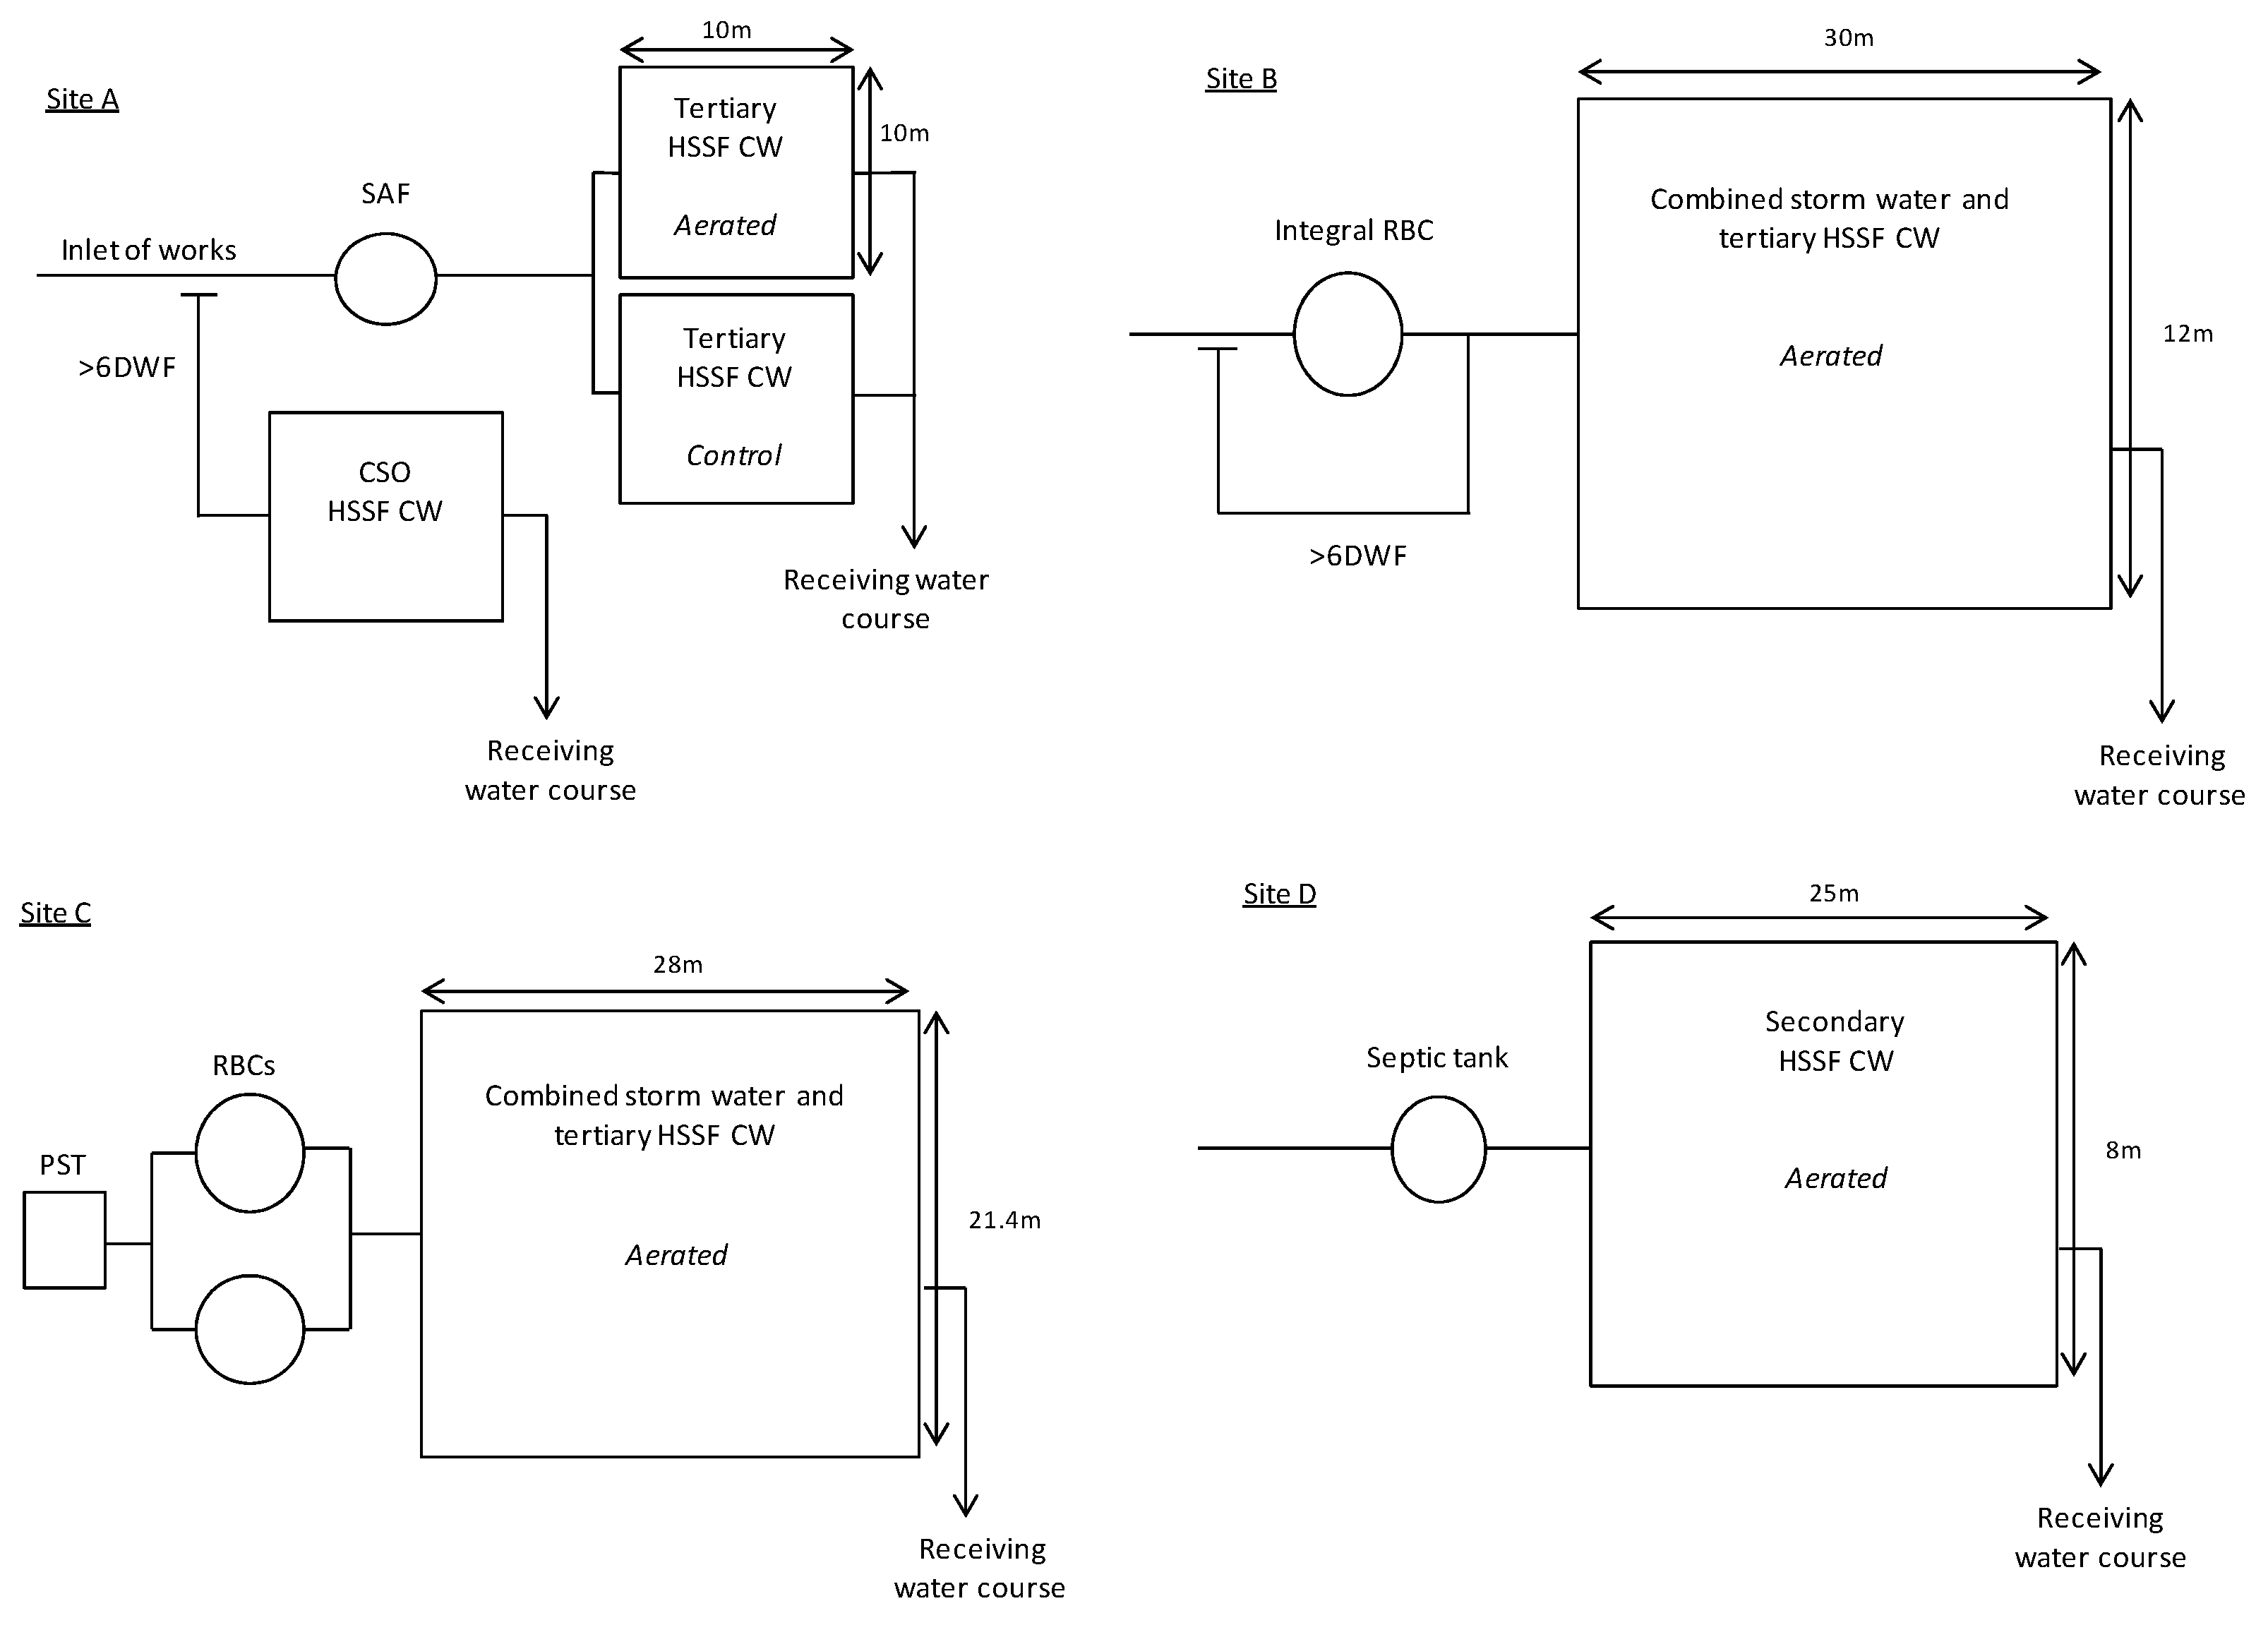
2.1. Site Details

Aeration systems were retrofitted into existing HSSF CWs during refurbishment on three Severn Trent Water sites with tightening ammonium consents (Sites A, B, and C) and one secondary treatment system with a descriptive consent that required upgrading for improved response with regards to odour emissions on the site (Site D; Table 1). In all cases, the aeration system consists of a 1.6 kW air blower, a distribution header and loops of perforated LDPE 12 mm piping with 2 mm holes drilled into it at 300 mm intervals placed on top of the impermeable liner covering the surface area of the bed floor. The aeration grid was tested by flooding the wetlands and checking the bubble pattern on the flooded surface, which appeared homogenous. The beds contained 0.6 m of 6–12 mm gravel media giving a measured porosity of 0.4, and are planted with Phragmites australis at 4 seedlings/m2 with the exception of Site C which was planted with Typha latifolia. The sites have been built according to the standard UK criteria as described in Reference [15].
Treatment at Site A consists of a primary settling tank (PST) followed by a submerged aerated filter (SAF; Figure 1). Tertiary treatment is via two HSSF CWs with a separate combined sewer overflow (CSO) HSSF CW that receives the wastewater exceeding six times the dry weather flow. Site A serves as a control site with side by side wetlands of equal size. Aeration of the test bed began 3 March 2011 and was left dormant in the control bed. The beds at this site were disconnected for 5 months (December 2011–April 2012) due to mechanical maintenance of the secondary treatment during which time the flow was removed from site. The mean flow to each bed is 46 m3/d, resulting in mean hydraulic loadings of 0.46 m3/m2/d. Average inlet loadings to the bed during the trial were 12 gBOD/m2/d, 25 gTSS/m2/d, and 9.1 gNH4+-N/m2/d.
Treatment at Site B is via an integral RBC followed by a combined wetland (Figure 1). The bed was retrofitted with aeration in October 2010 to provide a failsafe for occasional ammonia peaks observed in the conventional flow sheet. Since its retrofit, the bed has been operating with intermittent aeration, with the blowers only being active between 8:00 A.M. and 8:00 P.M. (continuously). The mean flow to the bed is 45 m3/d, resulting in mean hydraulic loadings of 0.1 m3/m2/d. Average loadings to the bed during the trial were 11 gBOD/m2/d, 1 gTSS/m2/d, and 1.6 gNH4+-N/m2/d.
Site C consists of two integral RBCs and a combined tertiary reed bed (Figure 1). The aeration was activated on 26 January 2012. The driver for aeration at this site was the addition of an ammonia effluent consent at a site that was not originally designed to nitrify. The mean flow to the bed is 248 m3/d, resulting in mean hydraulic loadings of 0.4 m3/m2/d. Average loadings to the bed during the trial were 8 gBOD/m2/d, 17 gTSS/m2/d, and 8.9 gNH4+-N/m2/d.
Site D is the only secondary bed in the trial (Figure 1). Treatment consists of a septic tank followed by a combined reed bed. Consents here are descriptive, as set out by the Environment Agency, and are based on visual inspection of the effluent into the watercourse. The bed was refurbished in March 2010 and fitted with aeration on 30 March 2011. Because the consented flow is below 50 m3/d, this site had no flow measurement during the trial.

2.2. Sampling and Analysis

Composite samples (every 15 min over 24 h) were collected fortnightly during the first year and monthly thereafter using ISCO auto-samplers at the inlet and outlets of the beds. Samples were collected in 1 L plastic sampling bottles and stored in a cool box with ice blocks during transport to the laboratory for same-day testing. Where same-day testing was not feasible samples were stored at 4 °C and allowed to reach room temperature prior to analysis. Sampling was conducted from the onset of aeration at respective sites to February 2013.
Hach-Lange test kits were employed for determining NH4+-N according to Hach-Lange procedures and read via a Hach-Lange DR2800 spectrophotometer. Portable meters were used to determine dissolved oxygen and temperature (Hach-Lange HQ40D) in the top 5 cm of the water. Probes were checked weekly with hydrogen sulphite solution and Hach standards were used periodically to ensure accuracy of test kits. Total suspended solids were quantified following standard procedures using a three piece filter funnel with a 70-mm filter diameter and 1.2-μm pore size [16].

2.3. Hydraulic Characterisation

Tracer tests were carried out as in Reference [2] and involved the addition of a 0.135 g impulse of 20% Rhodamine Water Tracer Liquid (Keystone Europe Ltd., Huddersfield, UK) at the inlet points of both wetlands. Concentrations were monitored at the outlet over time using a fluorescence spectrophotometer (YSI 6 series sonde fitted with Rhodamine sensor). Comparative tracer studies were only carried out at Site A.
In-situ saturated hydraulic conductivity measurements were taken using a steel pipe perforated at the base and a model 3001 Solinst levelogger, following the falling head methodology as described by the authors of [17]. Measurements were taken in triplicate along three transect points spanning the length of each of the wetlands (minus the inlet and outlet distribution rocks). This measurement gives approximate saturated hydraulic conductivity values, as vertical conductivity is measured, and does not take into account the horizontal flow. In addition, a certain degree of compaction occurs when inserting the pipe into the bed presents a source of error but these errors have been evaluated and are considered acceptable [18].

2.4. Robustness and Resilience Analysis

Robustness curves were generated by plotting the percentile distribution against the effluent values. In this context, robustness is described as the ability of a treatment unit to produce consistent effluent quality under varying influent characteristics and differentiates from resilience, which is defined as the ability to return to normal after a dynamic event [19]. Resilience was assessed by evaluating the response of Site B to an upstream process failure and time to restore nitrification capacity in Site A after a period of 5 months where the beds were taken offline.
A robustness index (RI) was calculated with respect to overall ammonium removal performance against a treatment goal (Tgoal) and the percentage time spent under the treatment goal (Equation (1), [19]). As the goal term heavily influences the outcome, RI was calculated for a range of treatment goals from 0.1 to 5 mgNH4+-N/L. A lower robustness score indicates a more robust process.
R I = [ ( 1 G % 100 ) × T 90 T 50 ] + [ T 50 T g o a l × G % 100 ]
RI = Robustness index; G% = percentage time spent under Tgoal; T90 = 90th percentile value (mgNH4+-N/L); T50 = 50th percentile value (mgNH4+-N/L); Tgoal = treatment goal (mgNH4+-N/L).
In accordance with Reference [19], the approach was used to assess overall robustness rather than directly assess the ability of the sites to meet regulatory standards as RI is more effectively used as an indicator of variation rather than directly about meeting a fixed goal. Accordingly the 90th percentile was used to avoid confusion with regulatory compliance at the 95th percentile.
Statistical analyses were carried out using Graphpad Prism v.5. Statistical significance between datasets was tested using the non-parametric Mann-Whitney unpaired, two-tailed test (p < 0.05). Where multiple comparisons were required the Kruskal-Wallis test was used (p < 0.05).

3. Results and Discussion

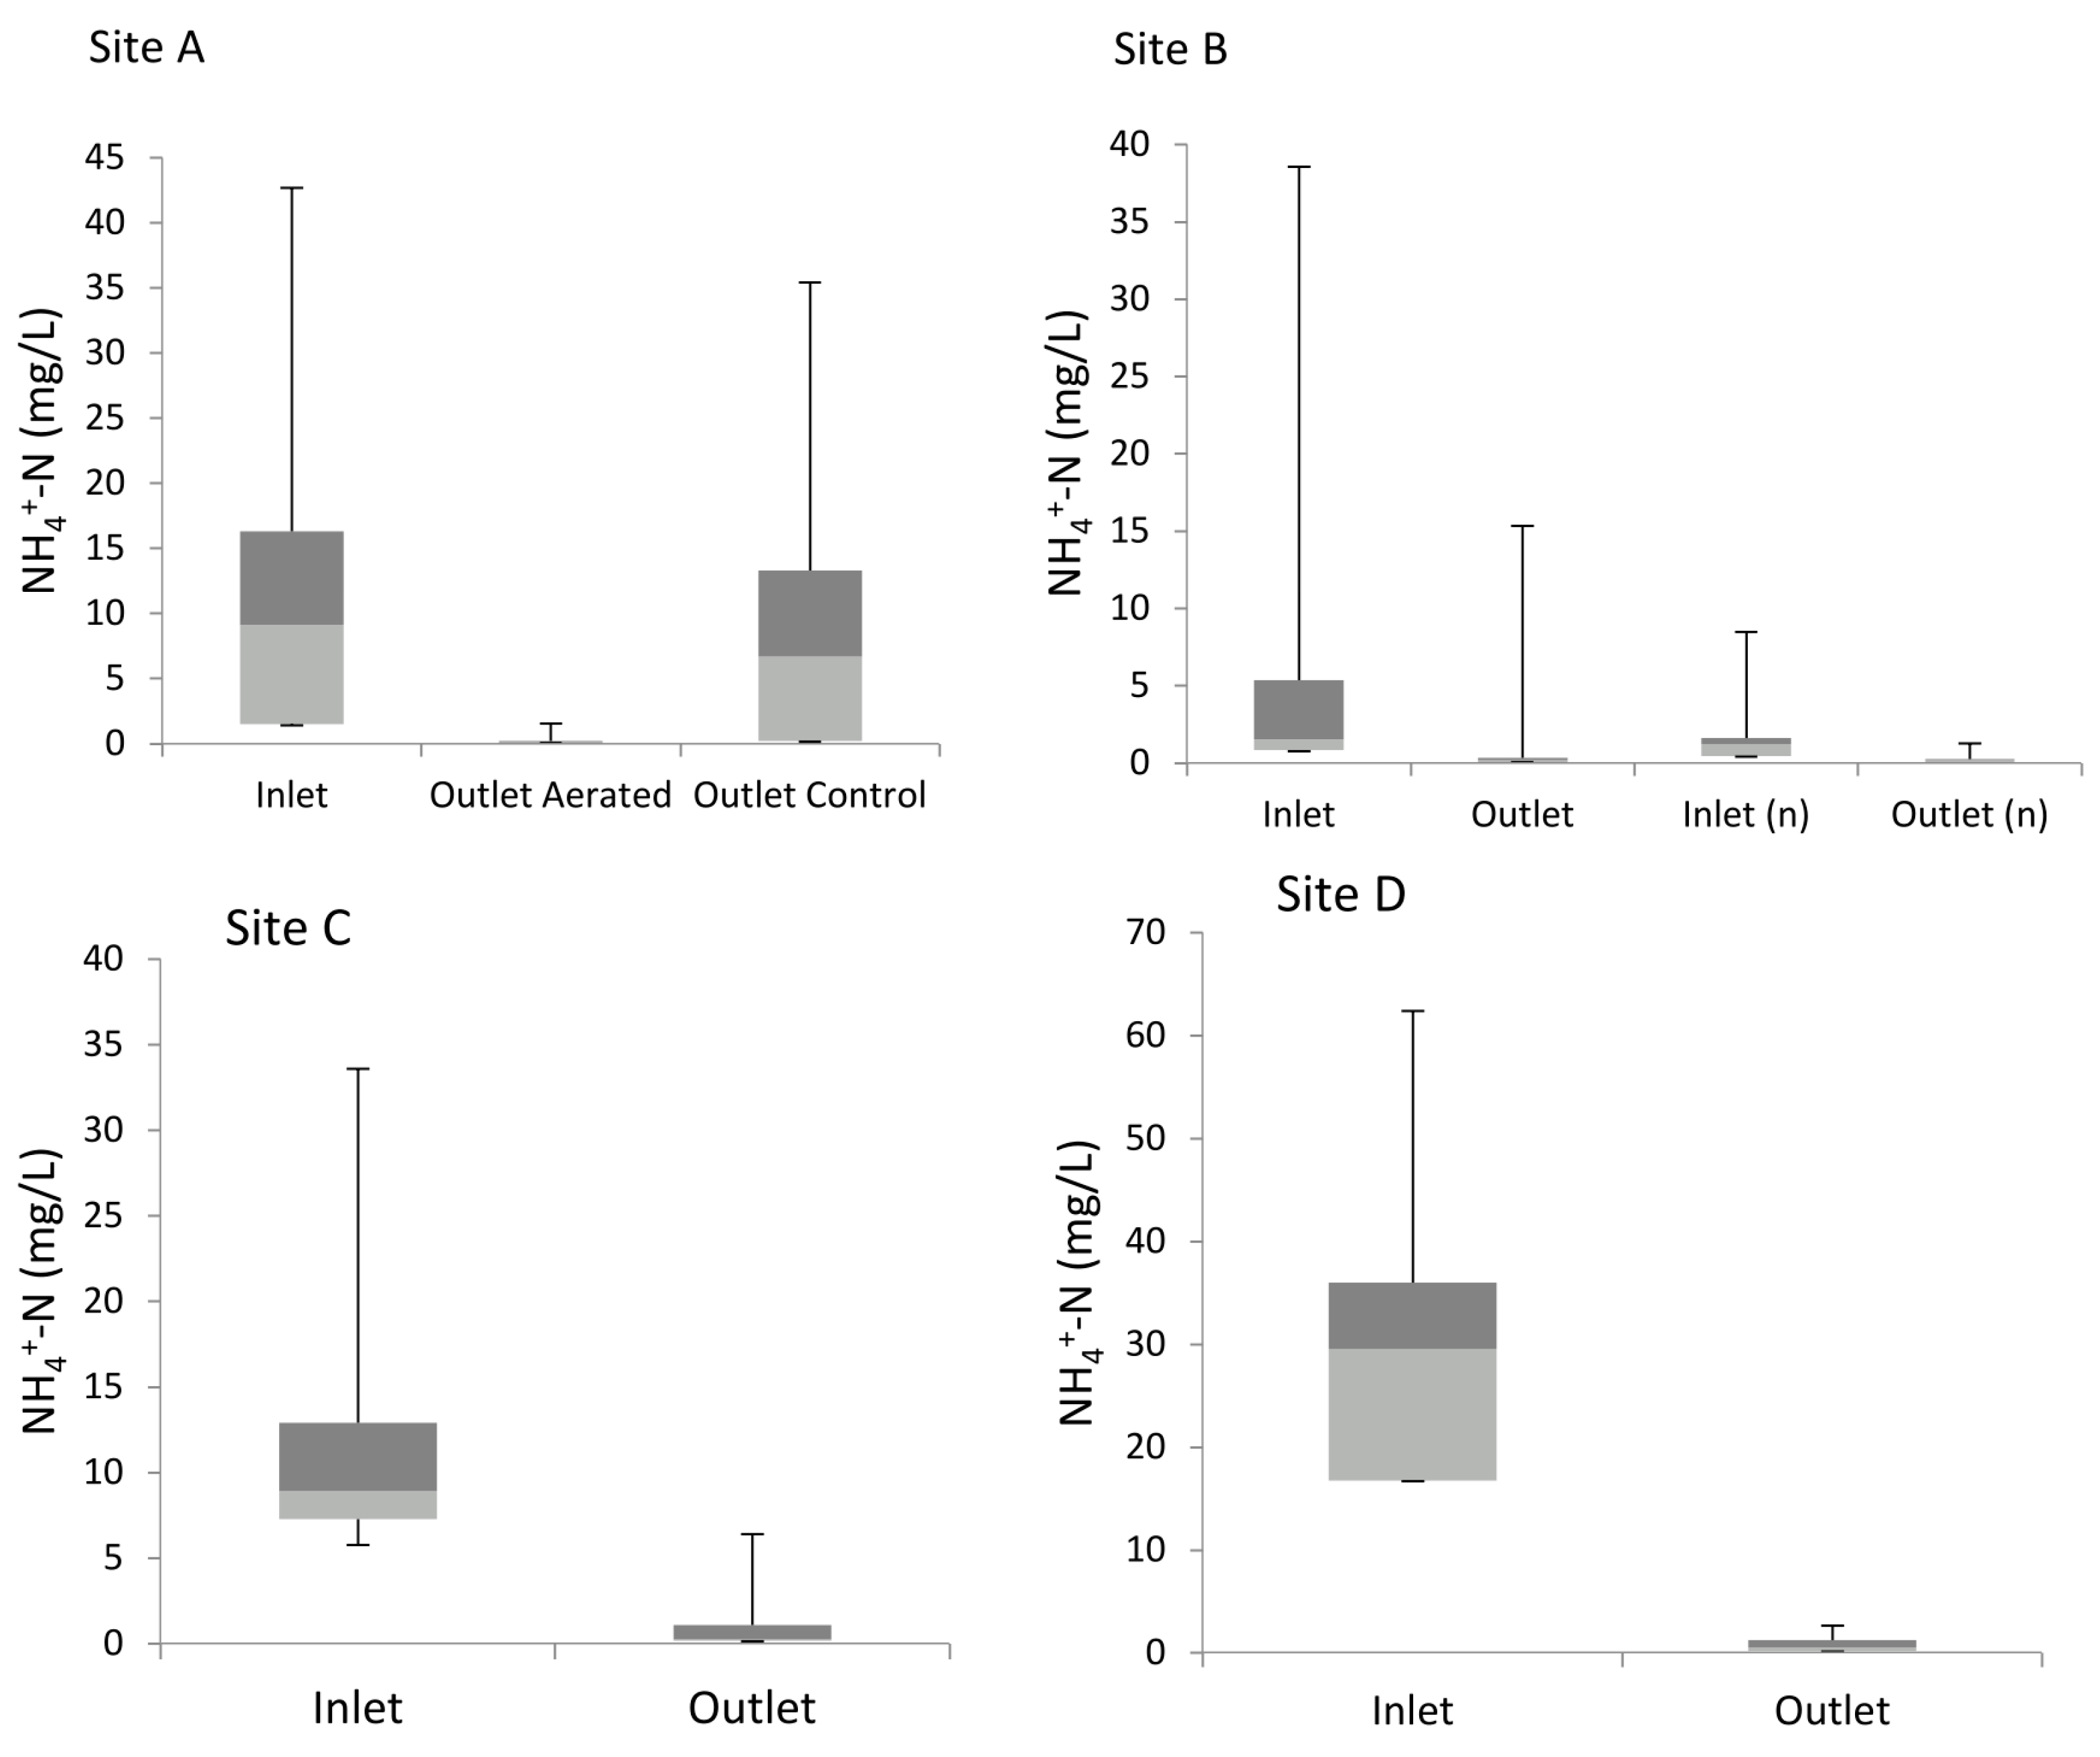
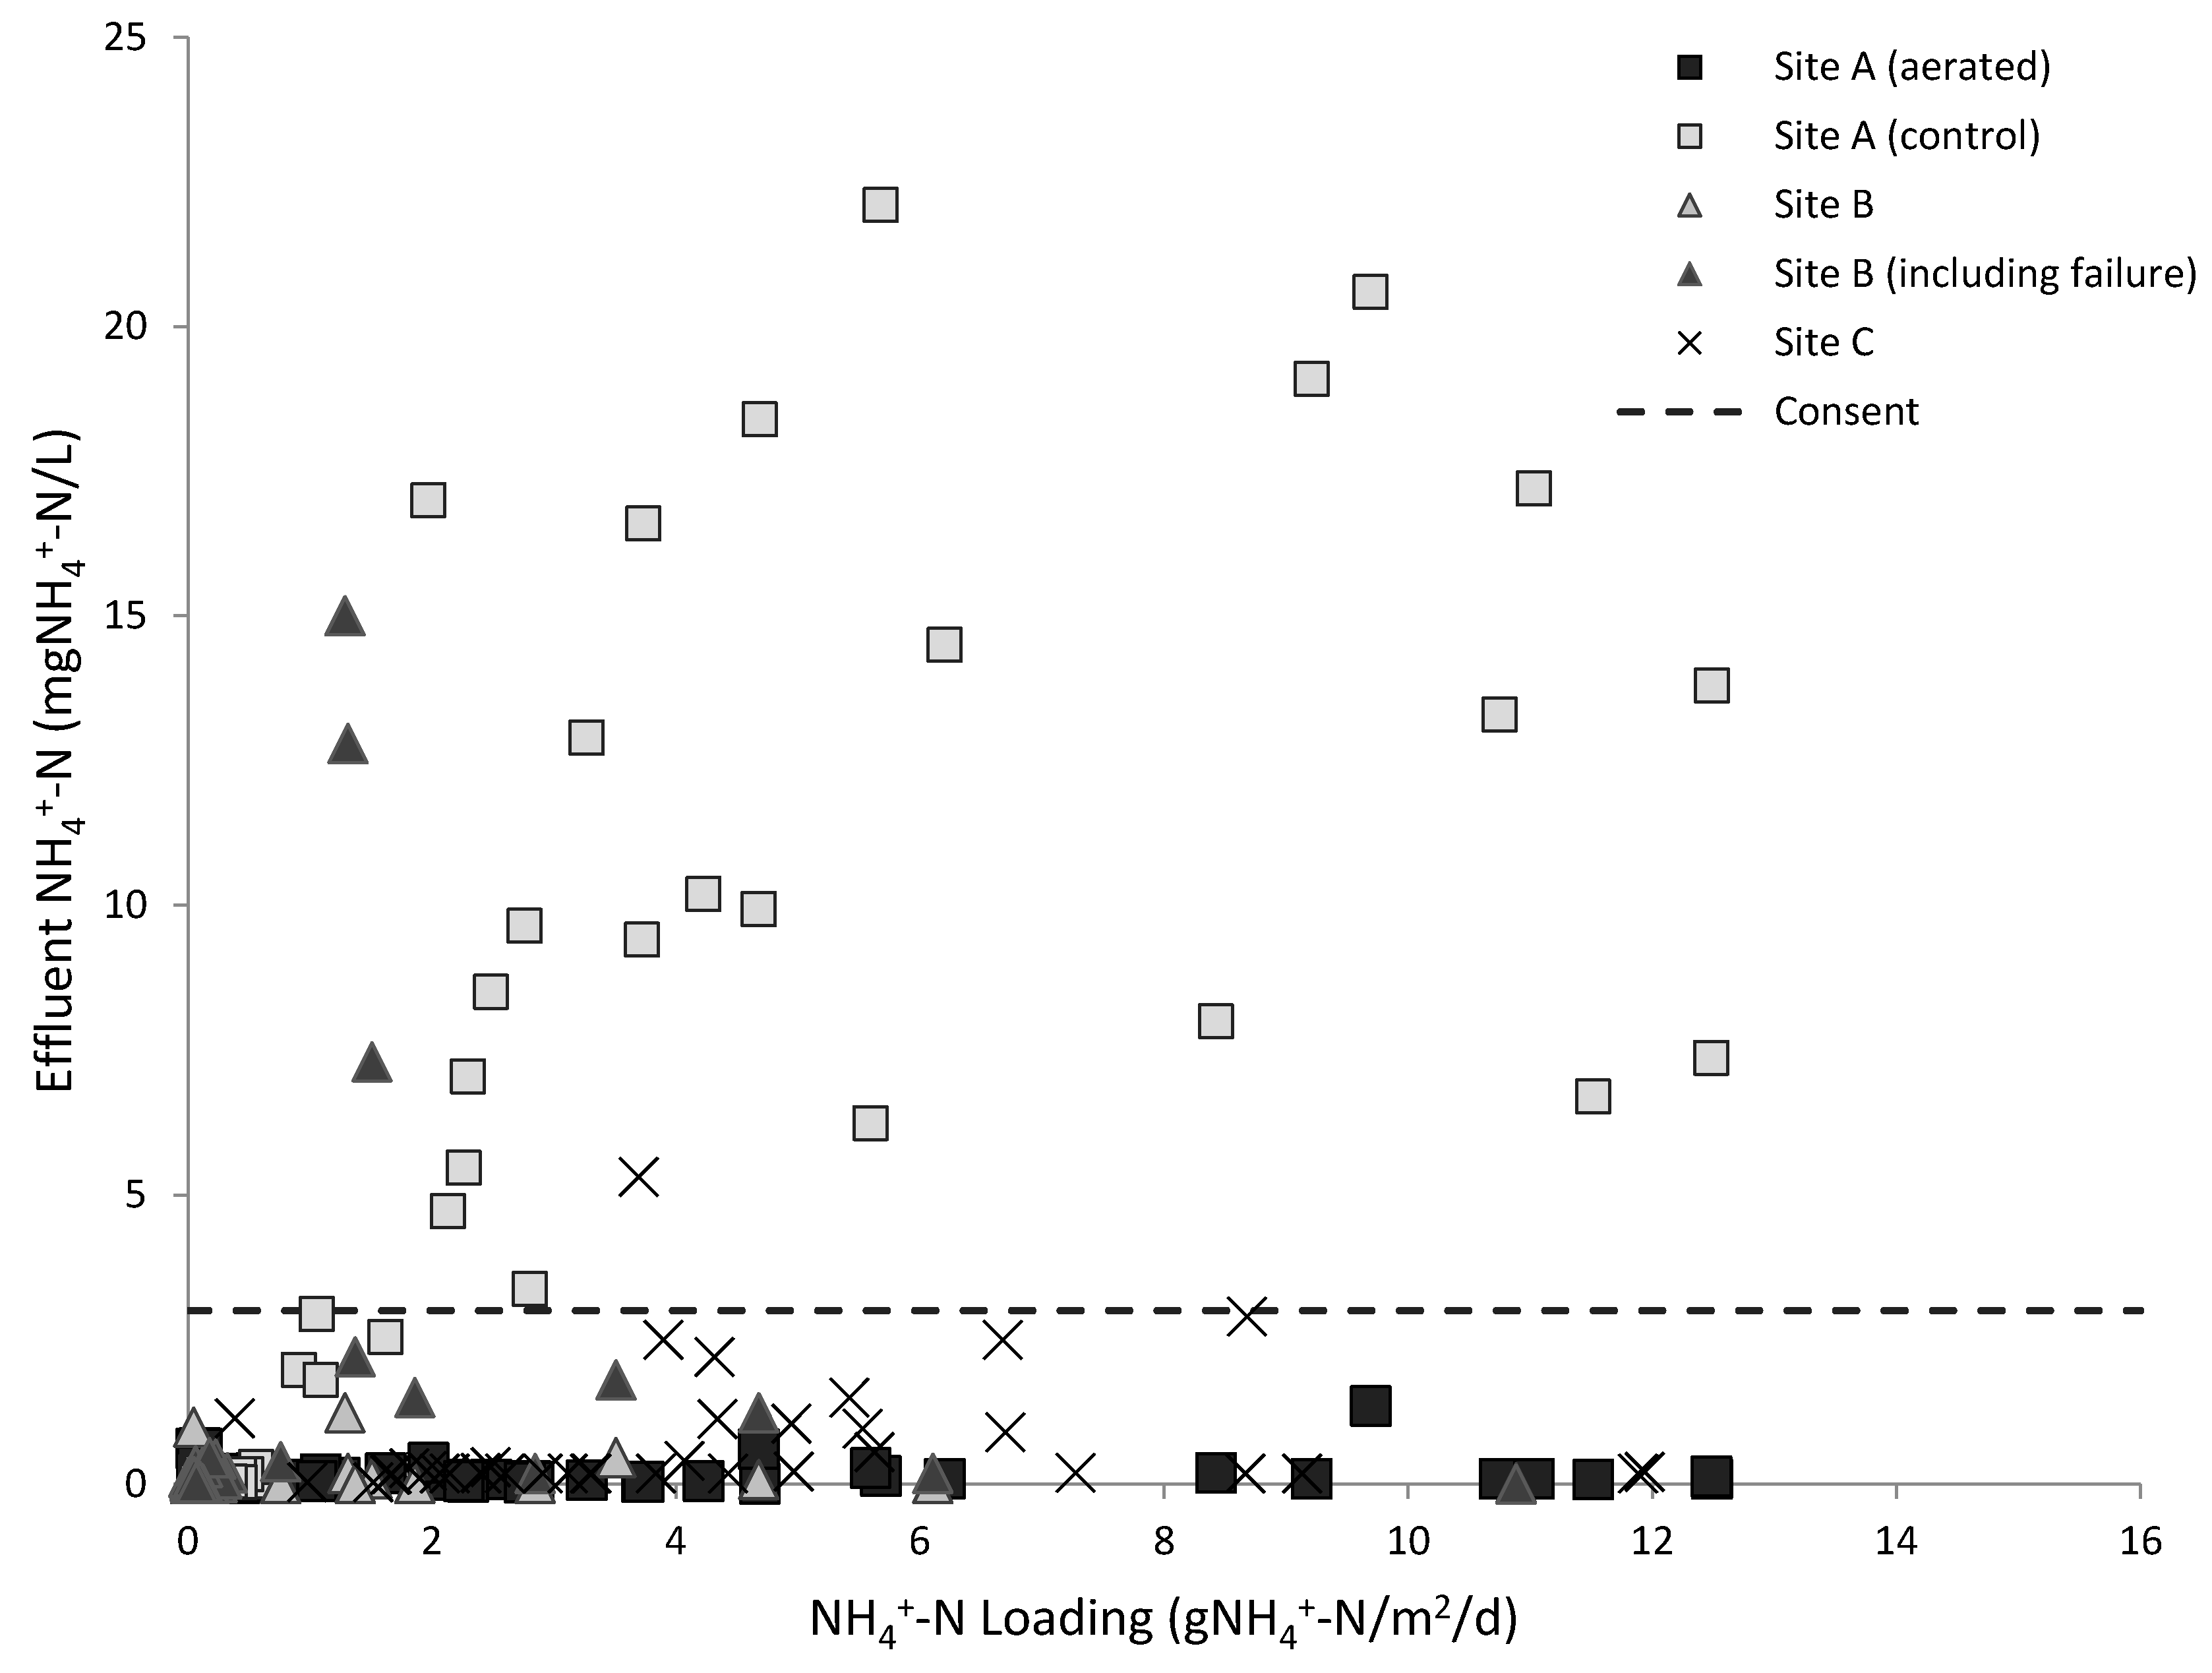
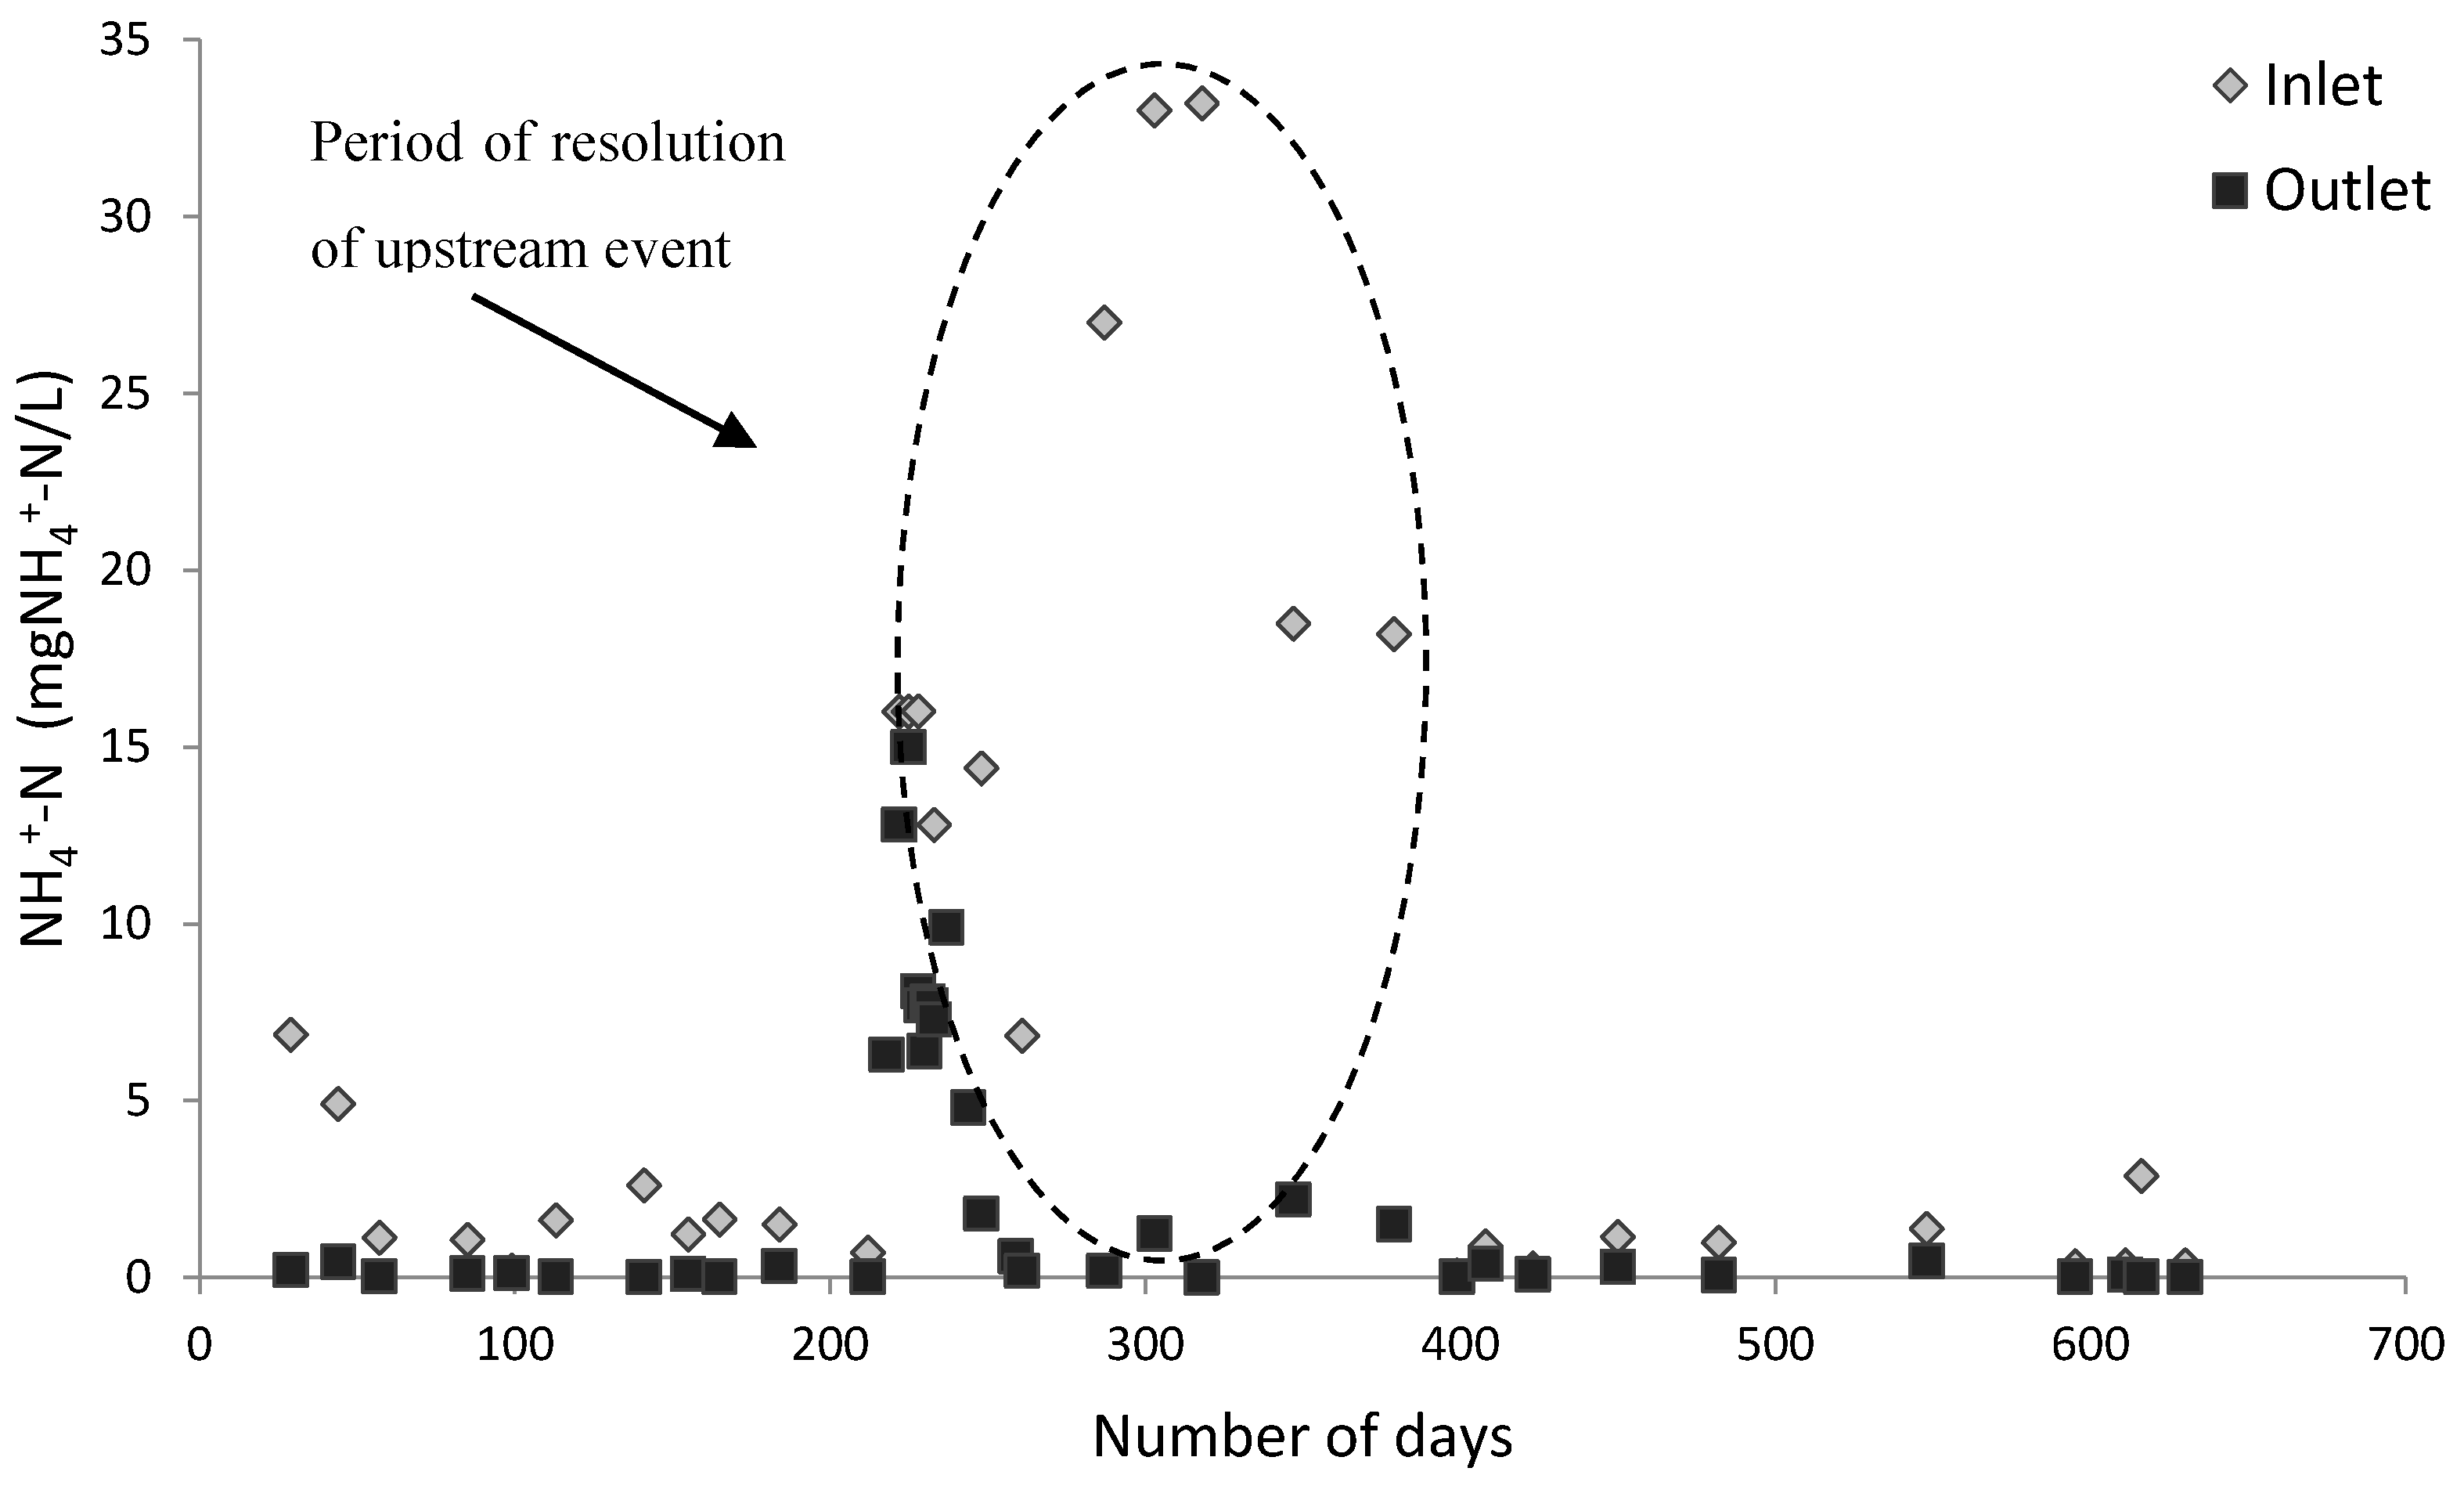
3.1. Ammonium Removal

Low ammonium effluent (<3 mgNH4+-N/L) was achieved in all aerated sites up to the maximum measured ammonia-loading rate of 12.5 mgNH4+-N/m2/d (Figure 2). The efficacy of nitrification was consistent across the full range of variable loading rates observed indicating no deterioration in effluent quality at higher loadings. Consequently, associated nitrification rates in the aerated beds increased linearly with increased loadings from 0.05 to 12.5 mgNH4+-N/m2/d demonstrating a strong causal relationship suggesting ammonia loadings were not a rate limiting factor. In comparison, a non-linear range of nitrification rates between 0.04 and 7.0 mgNH4+-N/m2/d was observed in the non-aerated wetland at Site A (Figure S1, Supplementary Materials). The current findings extend the reported maximum loading rates for effective nitrification in aerated wetlands [8,10,11,13] even extending above the 10.1 mgNH4+-N/m2/d previously reported during the initial months of the trial [2]. In comparison, the control bed (Site A) exceeded 3 mgNH4+-N/L once the loading rate rose above 1.9 mgNH4+-N/m2/d; consistent with previous findings concerning sub-surface oxygen deficiency limiting nitrification [2]. The median mass removal was 23% in the control bed across all loading rates tested but increased to 72% below a loading rate of 1.9 mgNH4+-N/m2/d suggesting adequate removal can be achieved in tertiary HSSF CWs at sufficiently low loading rates.
Comparison of the data across the different sites revealed median effluent ammonia concentrations (mgNH4+-N/L ± standard deviation) of 0.1 ± 0.3 (Site A), 0.2 ± 3.0 (Site B), 0.2 ± 0.2 (Site B not including upstream failure), 0.2 ± 1.2 (Site C) and 0.6 ± 0.8 (Site D) equating to median mass removal rates of 98.8%, 93.9%, 94.7%, 94.7% for Sites A–C, respectively (Figure 3). Overall, median outlet concentrations of 0.1–0.2 mgNH4+-N/L were recorded for the tertiary aerated beds from inlet concentrations of 1.6–9.1 mgNH4+-N/L and an effluent of 0.6 mgNH4+-N/L for the secondary bed from an inlet of 29.6 mgNH4+-N/L. This compares to a median effluent concentration of 6.7 mgNH4+-N/L in the non-aerated control. For context, typical literature values report influent concentrations of 22–54 mgNH4+-N/L for tertiary HSSF CWs, corresponding to effluents of 5–31 mgNH4+-N/L [20,21,22,23], whereas reported secondary systems achieve concentrations of 3–61 mgNH4+-N/L from inlets of 15–225 mgNH4+-N/L [21,24,25].
More detailed profiling at Site A revealed NH4+-N concentrations of 0.8, 0.7 and 0.2 mgNH4+-N/L with corresponding DOs of 2–3, 3–4 and >5 mgO2/L at 0.7, 1.2 and 10 m from the inlet of the bed, with the final value corresponding to the final effluent from the bed compared to an influent level of 9.1 ± 7.6 mgNH4+-N/L. Accordingly, only an initial fraction of the bed appeared to be utilised for nitrification, indicating that the majority the bed was unnecessarily aerated supporting previous laboratory investigations that limited aeration to the front portion of the bed to allow a reduced DO environment conducive of denitrification thereafter [9].
Greater variability in the effluent ammonia concentrations was observed in Sites C and D compared to A and B. Site C (tertiary combined storm flow, continuously aerated) showed the greatest variation in effluent concentration with effluent ammonium concentrations over 1.0 mgNH4+-N /L recorded on 11 occasions out of 43 (25%). This compares to 2% and 0% for the other tertiary Sites A and B (excluding upstream failure), suggesting the observed instability was not directly due to the inclusion of storm flows, increased loading rates or inadequate level of aeration. Diagnostic analysis of the bed confirmed no link to aeration as DO profiles ranged between 3.3 and 9.5 mgO2/L across the length and breadth of the bed. Further diagnostics concerning alkalinity revealed no definitive explanation, and further investigation is required to establish a coherent diagnosis. However, the results show that process instability in aerated wetlands is possible, congruent with other tertiary nitrification systems [26].
Site B (tertiary combined storm flow, intermittently aerated) experienced an operational issue with the upstream secondary biological process such that a substantial increase in ammonia concentration was loaded on to the bed (Figure 4). During the resolution of the upstream event, the influent ammonium concentration to the wetland increased from 1.2 ± 4.0 mgNH4+-N/L to 16.0 ± 8.4 mgNH4+-N/L with a peak concentration of 33.2 mgNH4+-N/L during the winter period when the effluent temperature ranged between 5.2 and 9.3 °C. Effluent ammonia peaked at 15 mgNH4+-N/L, 7 days post failure, and began to decrease 10 days after the event started. Ultimately, the effluent returned to below 3 mgNH4+-N/L after 30 days (water temperature 9.5–13 °C), despite consistently high loadings comparable to those received from the secondary bed (Site D), and confirmed the ability of the aerated system to treat high ammonia concentrations under steady state conditions.
Further consideration of response time (resilience) was possible at Site A (test and control site, tertiary combined storm flow) as the beds were taken offline for a period of 5 months, during which time no flow was run through the beds. Upon re-commencement of the flow to the wetlands, the effluent concentration decreased to below 1 mgNH4+-N/L after seven days of operation whilst the control bed provided only minimal removal (Figure 5). The response of the systems relates to the abundance and activity of the nitrifying population. Once the maximum capable rate of ammonia oxidation per cell is exceeded, the systems will start to fail until sufficient growth of the population occurs to meet the demand [27]. No direct quantification of the nitrifier community was conducted during the current investigation, but it is posited that the consistently low ammonium loading experienced prohibited establishment of large populations such that the system was incapable of responding to concentration spikes due to a lack of abundance of active nitrifiers and hence the system lacks a degree of inherent resilience. This agrees with the lag time observed in Site C (Figure 4) between the time from increased influent ammonia load and fully nitrified effluent. This has also been observed in other tertiary nitrification systems, where an increase in effluent ammonia has been recorded during the autumn when the inlet ammonium increases concurrent with a temperature derived decrease in nitrification activity in the main secondary process [28]. Effluent from such processes then improves as the nitrification population increases commensurate with the increased available substrate.
In the case of the aerated wetlands, analysis of seasonal impacts revealed a slight increase in effluent ammonium concurrent with increased hydraulic loading posited to be due to heavier rainfall and consequently less residence time in the bed (Table 2). Heavy rainfall could result in short circuiting in the beds and therefore contribute to decreased performance. For instance, Sites C and D recorded an increase in the median outlet concentrations in the aerated beds during winter of 0.9 and 1.6 mgNH4+-N/L compared to 0.2 and 0.5 mg/L in the summer. In comparison, no difference was observed at Site A with the aerated bed where the mean effluent ammonium remained at 0.2 mgNH4+-N/L during both summer and winter periods. In contrast, higher mean outlet concentrations of 8.4 mgNH4+-N/L were observed in winter compared to 6.5 mgNH4+-N/L when the temperature decreased to 4.1 °C.
In fact, no direct correlation was observed between effluent ammonia and temperature or between increased ammonium in the inlet and the outlet during the reduction in activity of the upstream processes. Whilst this suggests that the combination of aeration and long residence time affords a degree of robustness, the response to shock loads suggests that further enhancement of the nitrifying population would be beneficial in terms of resilience. Given that it appears only a small proportion of the bed is active, and only the aerated portions of the bed can sustain an active nitrifying population, it is posited that sequencing the portion of the bed that receives air in a pre defined cycle will enable a larger total community to be maintained and when required utilised by aerating all sections of the bed. Previous work on the integrated fixed film activated sludge process (IFAS) has shown that when the nitrifying microbial community occupy non competitive niches (such as the biofilm carriers in IFAS) the nitrification rate can be controlled by aeration levels as it correlates with DO up to 5 mg/L [29]. Combined, these features offer the potential to enhance resilience of the system and offer a degree of turn up/turn down control with regards to nitrification through changing aeration rates.

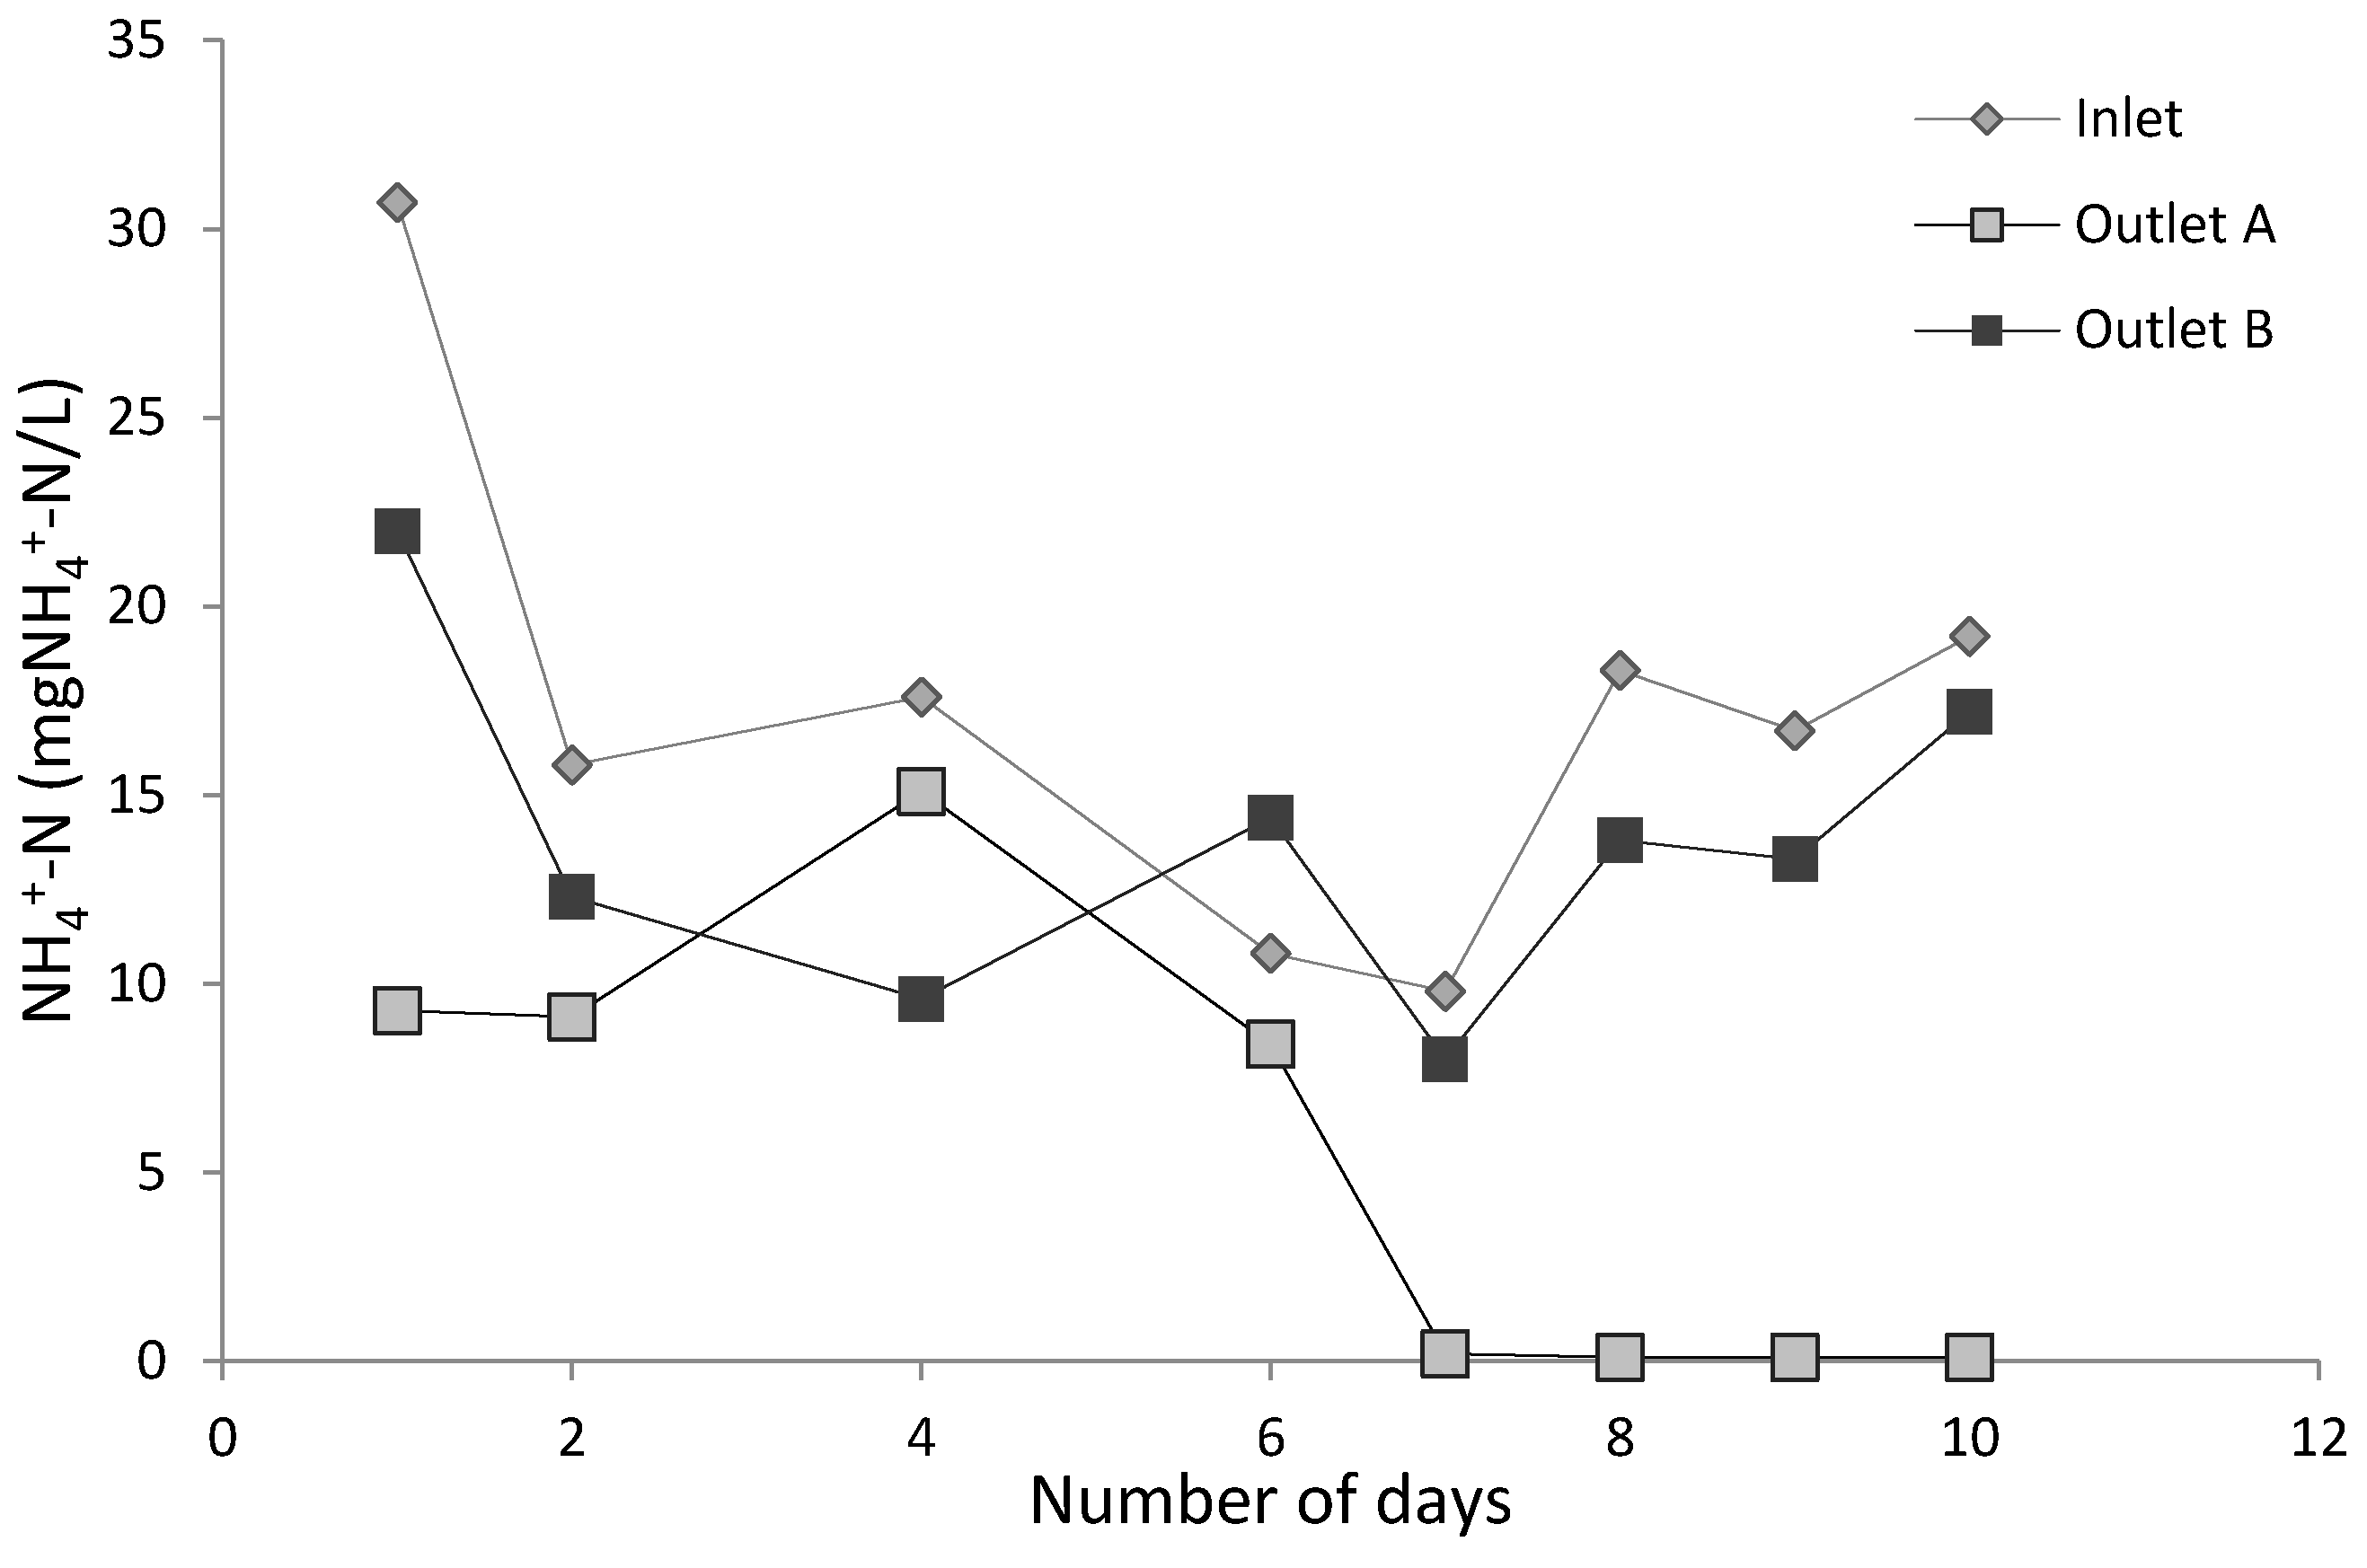
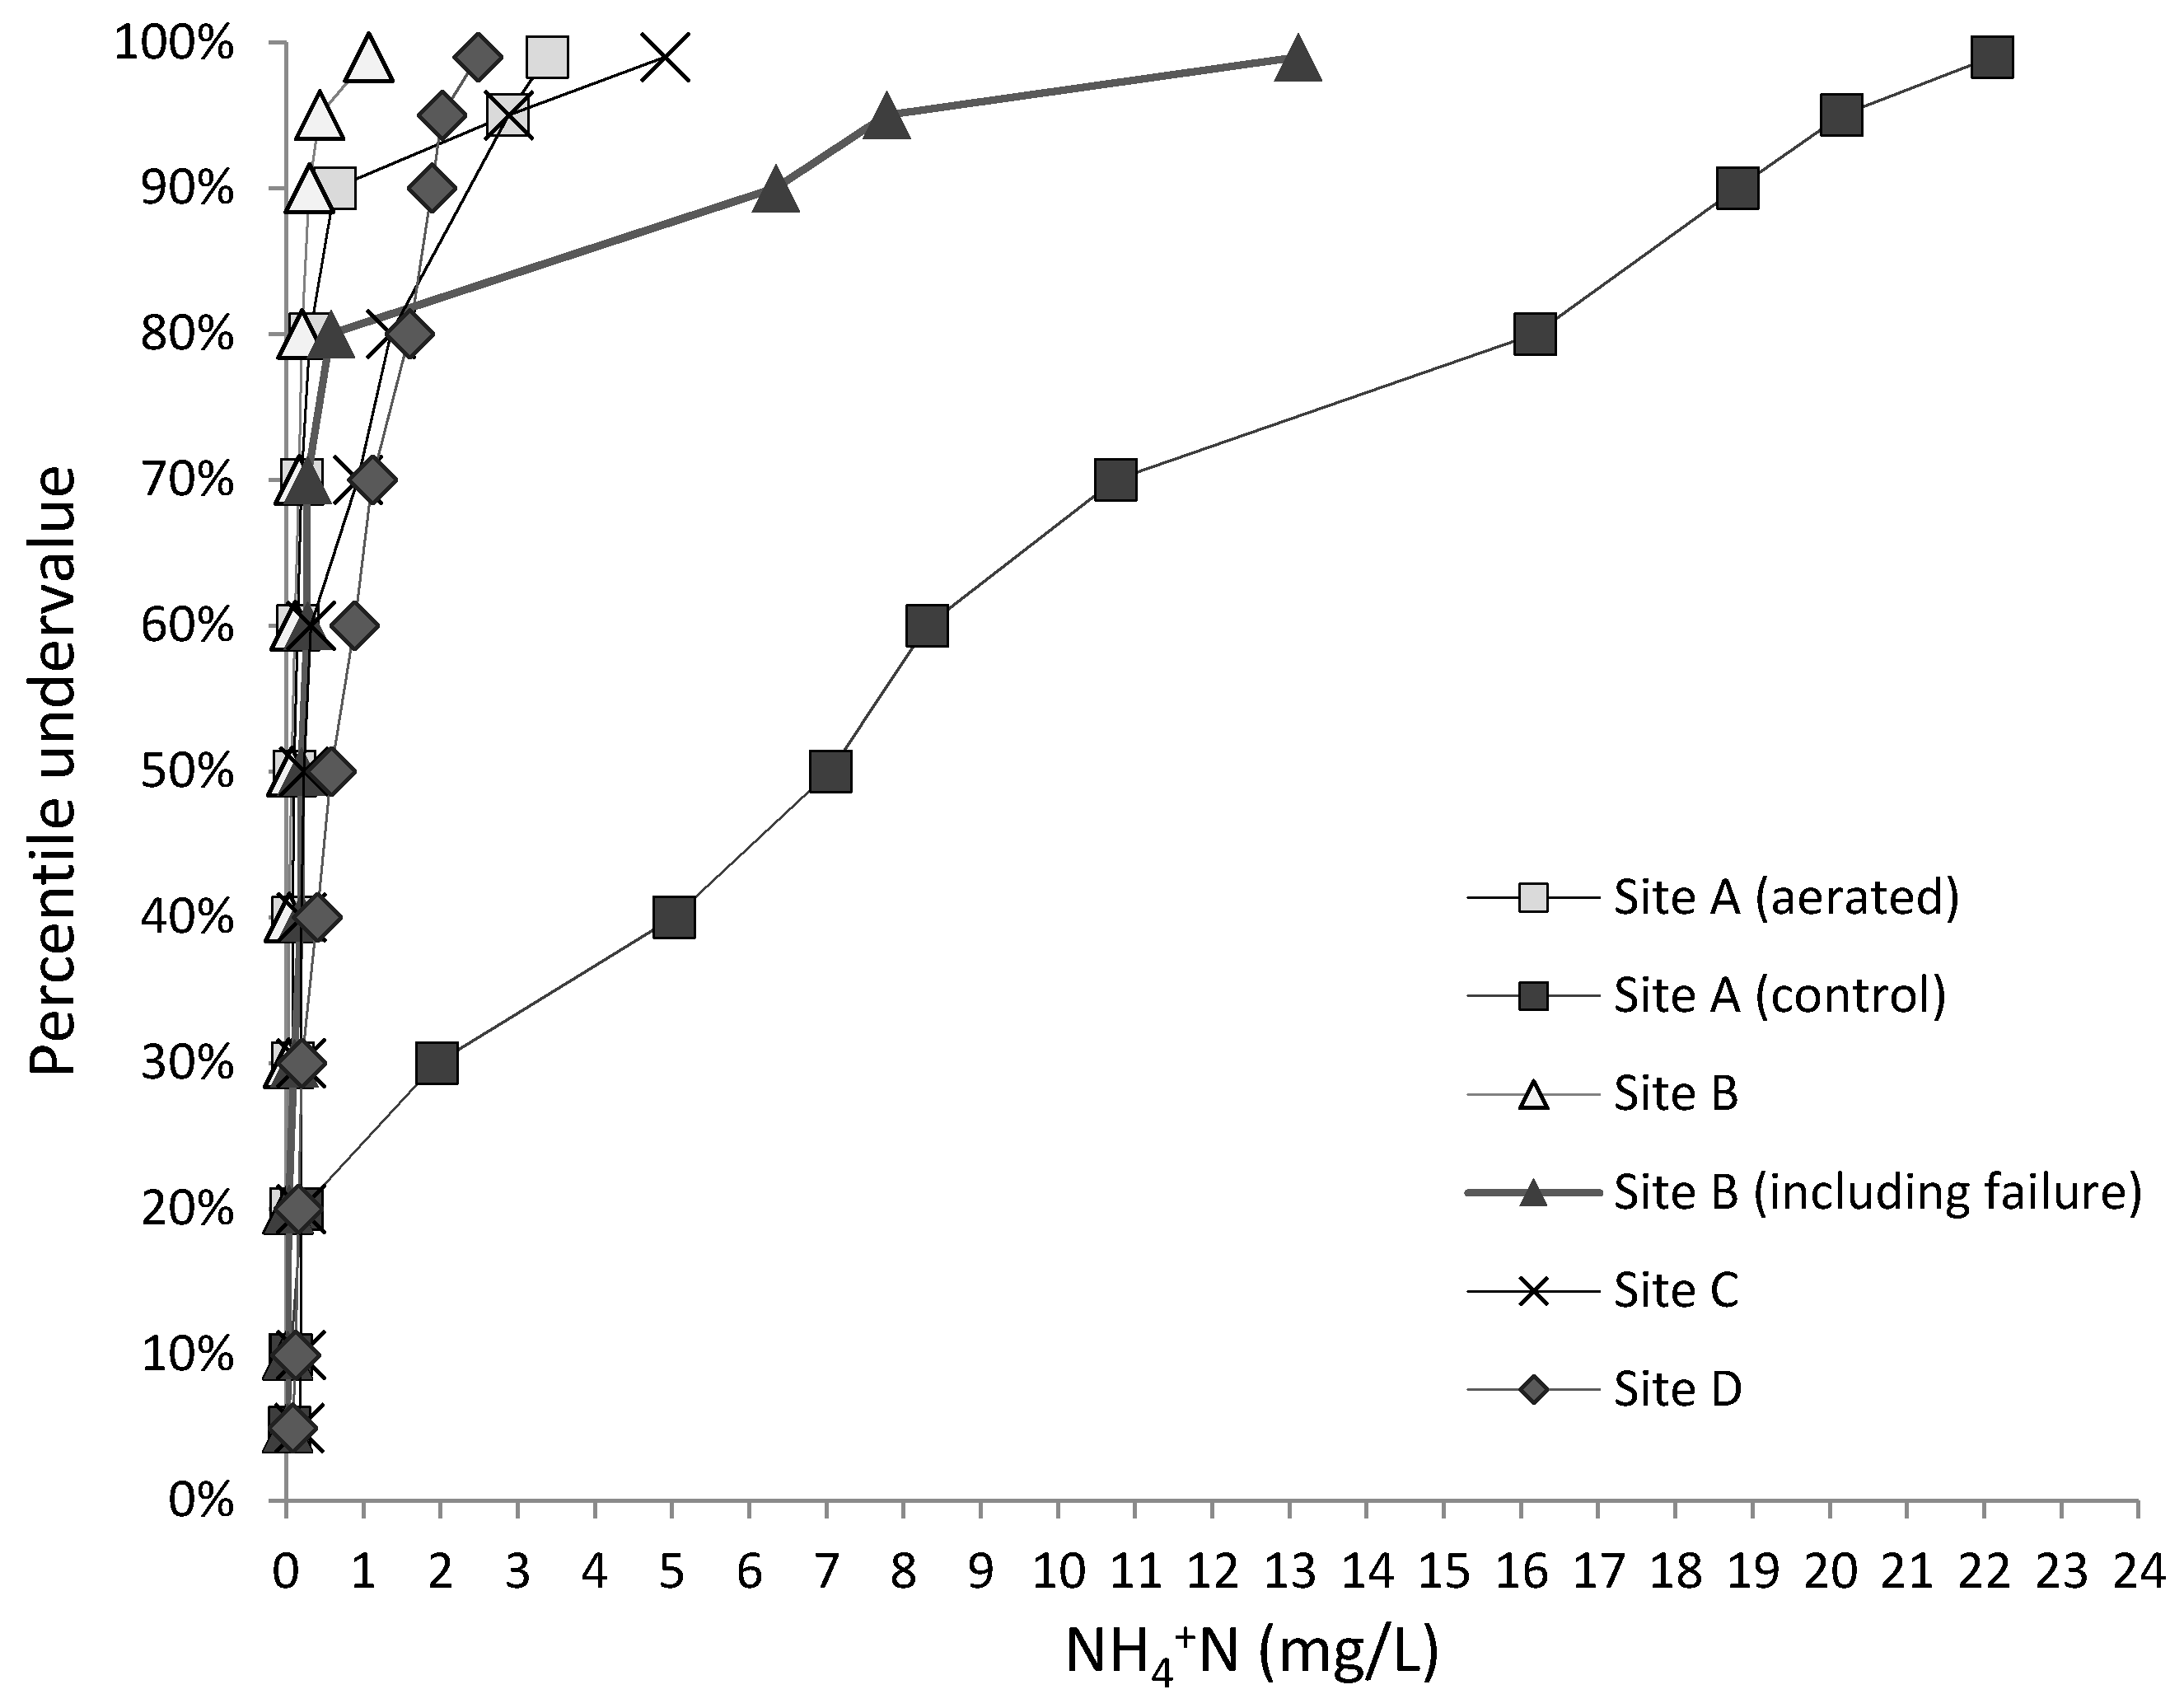
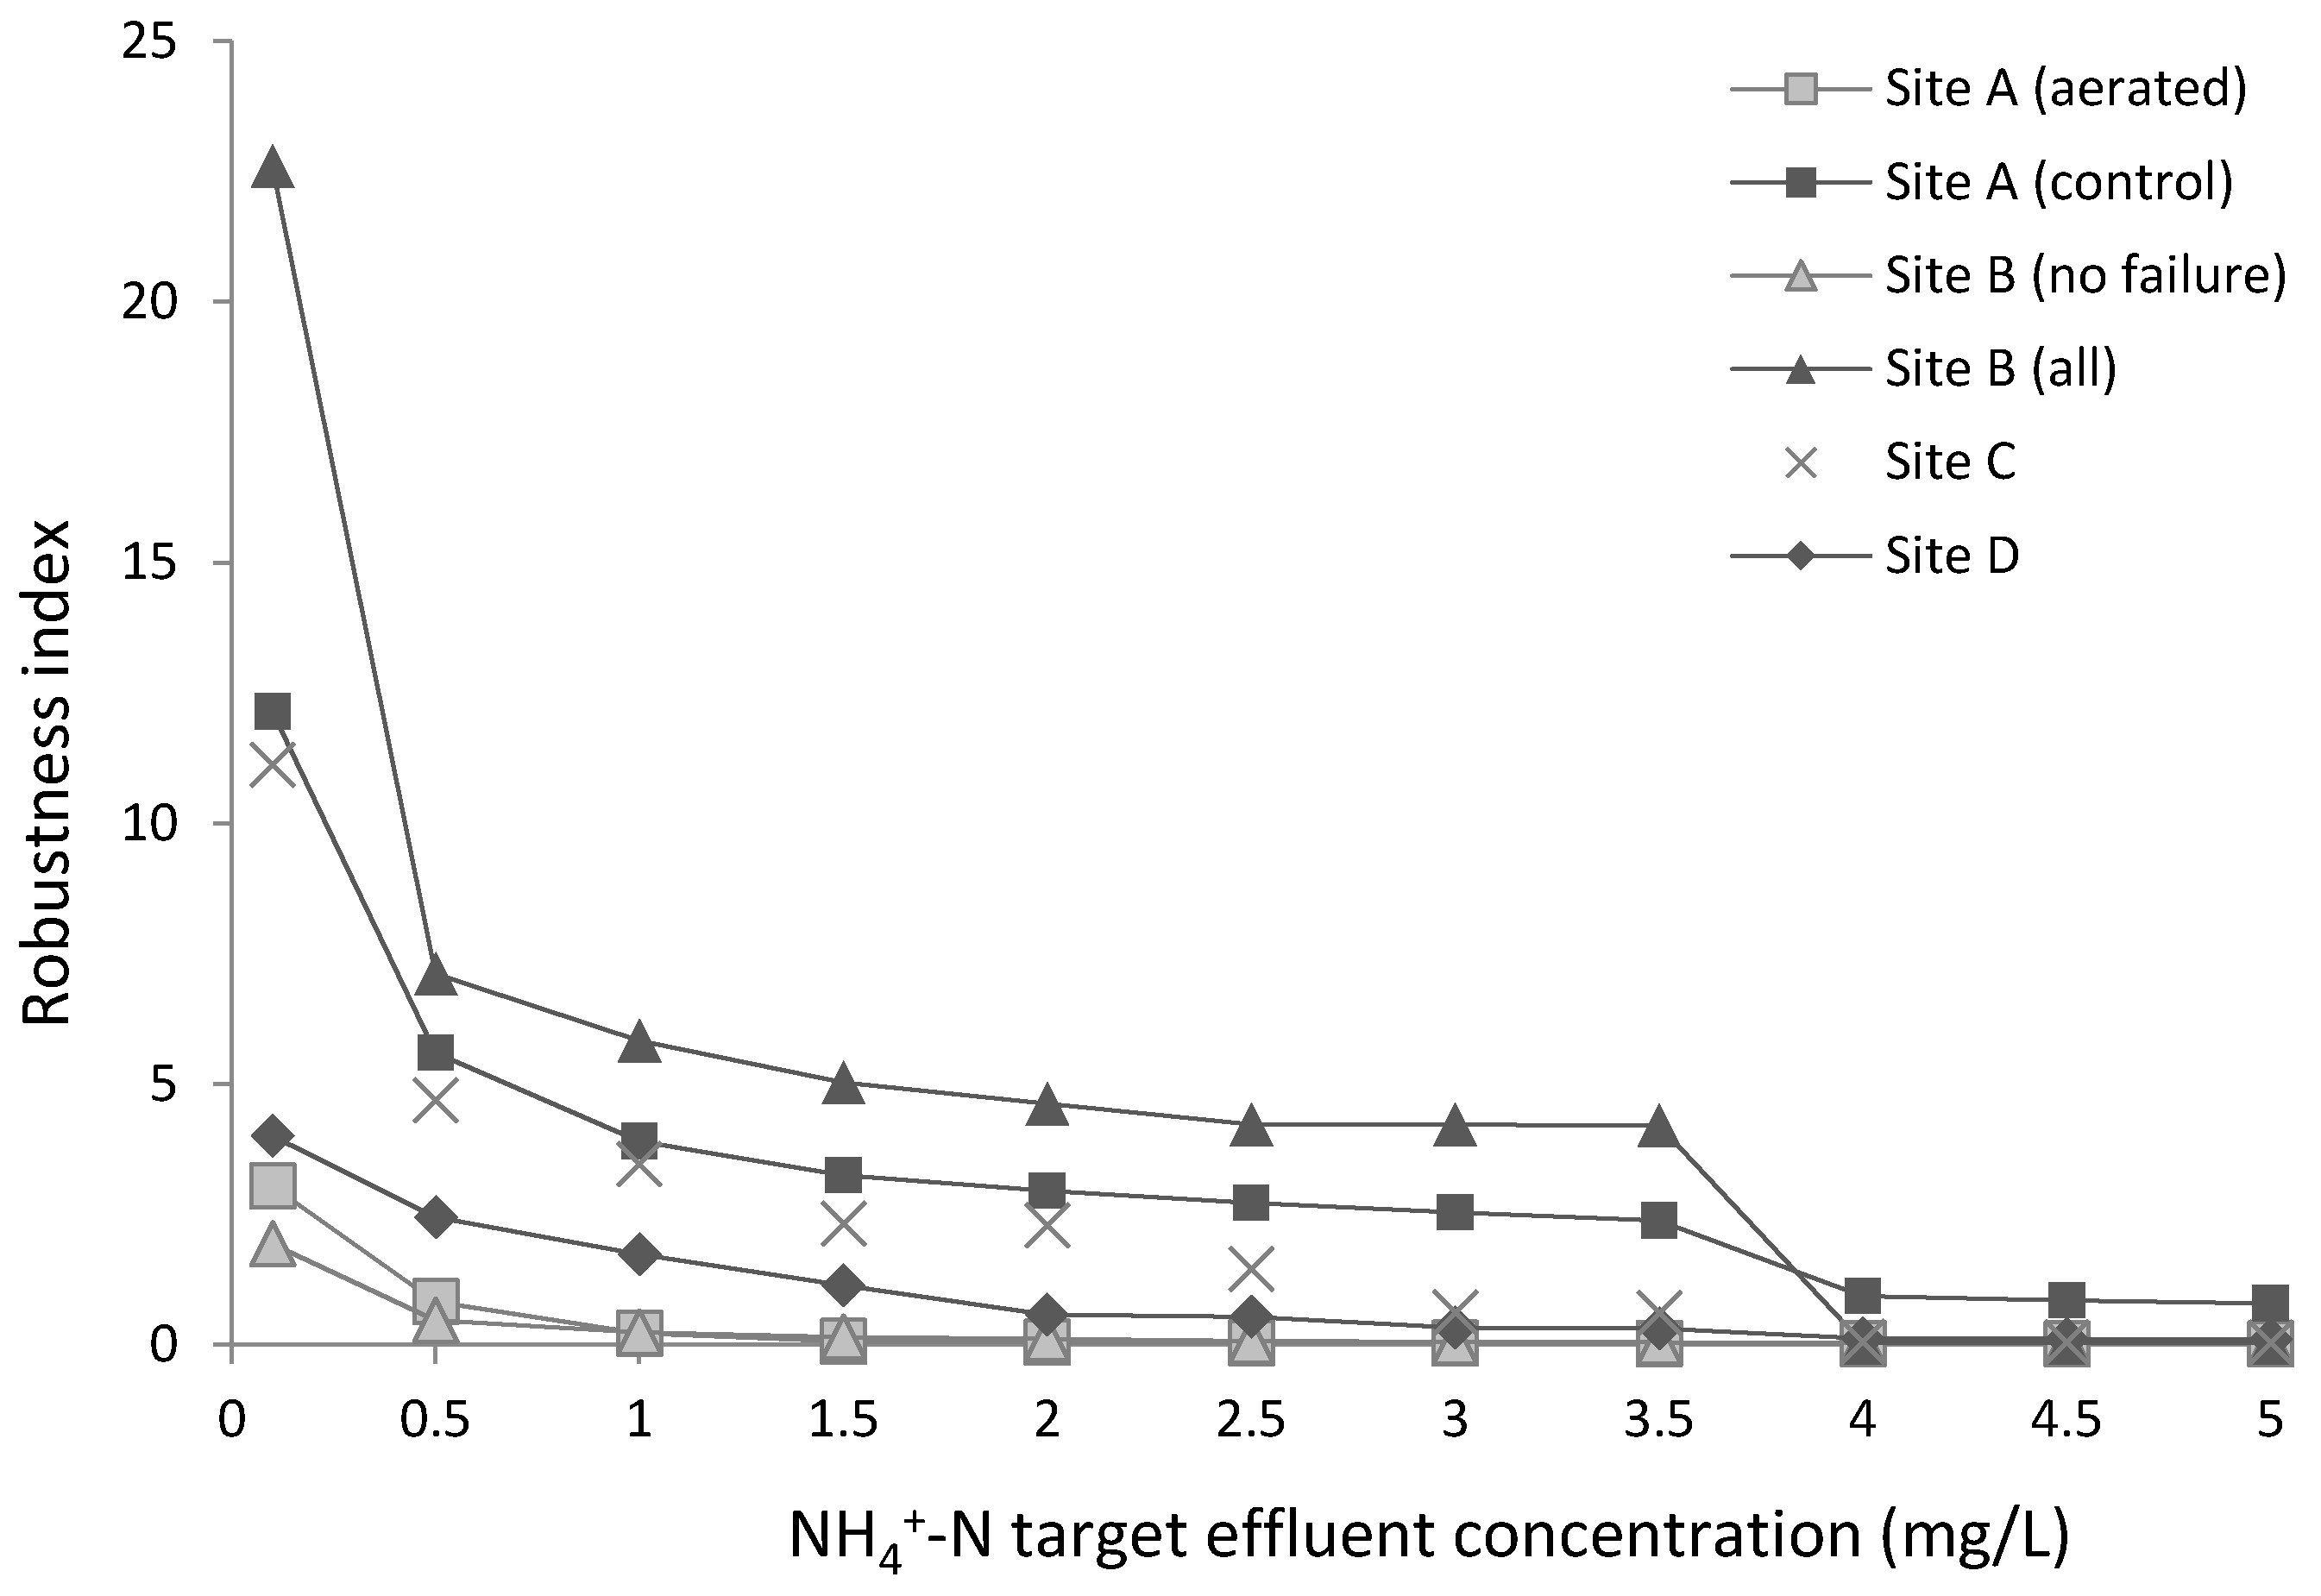
3.2. Process Robustness

Excluding the variation due to the upstream events, statistical analysis revealed no significant difference between the effluent concentrations between the tertiary beds A and B (Mann-Whitney U = 1434, p = 0.7687). Whilst still achieving low effluent concentrations, the increased spread in the data at Site C compared to consistently extremely low concentrations in Site A and B meant the effluent data could not be categorized as statistically the same. However, effluent concentrations were statistically similar in Site C and the secondary bed D (Mann-Whitney U = 388, p = 0.7545). Accordingly, the efficacy of artificial aeration appears irrespective of configuration of the wetland in terms of the type of flow treated (inclusion of storm flows, secondary or tertiary) across the range of concentrations and loading rates observed in the current study. This leads to the suggestion that nitrification rate is not the controlling factor in the design and operation of such systems.
The robustness profile for the control bed at Site A exhibited a curved shape across the majority of the data sets indicative of limited robustness (Figure 6). This is commensurate with the outlet ammonium concentrations that were above the future consent of 4 mgNH4+-N/L 63% of the time. In contrast, comparative data from the aerated beds revealed relatively robust systems with regards to ammonium removal as illustrated by steep near vertical lines across the majority of the data (Figure 6) and commensurate with the fact that the outlet concentrations were below respective future consents 100% of the time, with the exception of the upstream process failure recorded at Site B.
The use of RI enabled consideration of the impact of tightening consents through changing the target goal level and hence an analysis of the link between tightening discharge consents and robustness of the systems. A similar level of robustness was observed across all sites down to a target effluent level of 3 mgNH4+-N/L below which the RI of the different sites diverged (Figure 7). This extended down to a target concentration of 2 mgNH4+-N/L including the secondary bed (Site D) when Site C was excluded, the site that was identified to have some general nitrification issues. Sites A and B remained robust down to target concentrations of 0.5 mgNH4+-N/L indicating that artificial aeration can remain robust even when considered in relation to the most challenging consents of 0.5 mgNH4+-N/L discussed for small works in the UK in the near future [28].

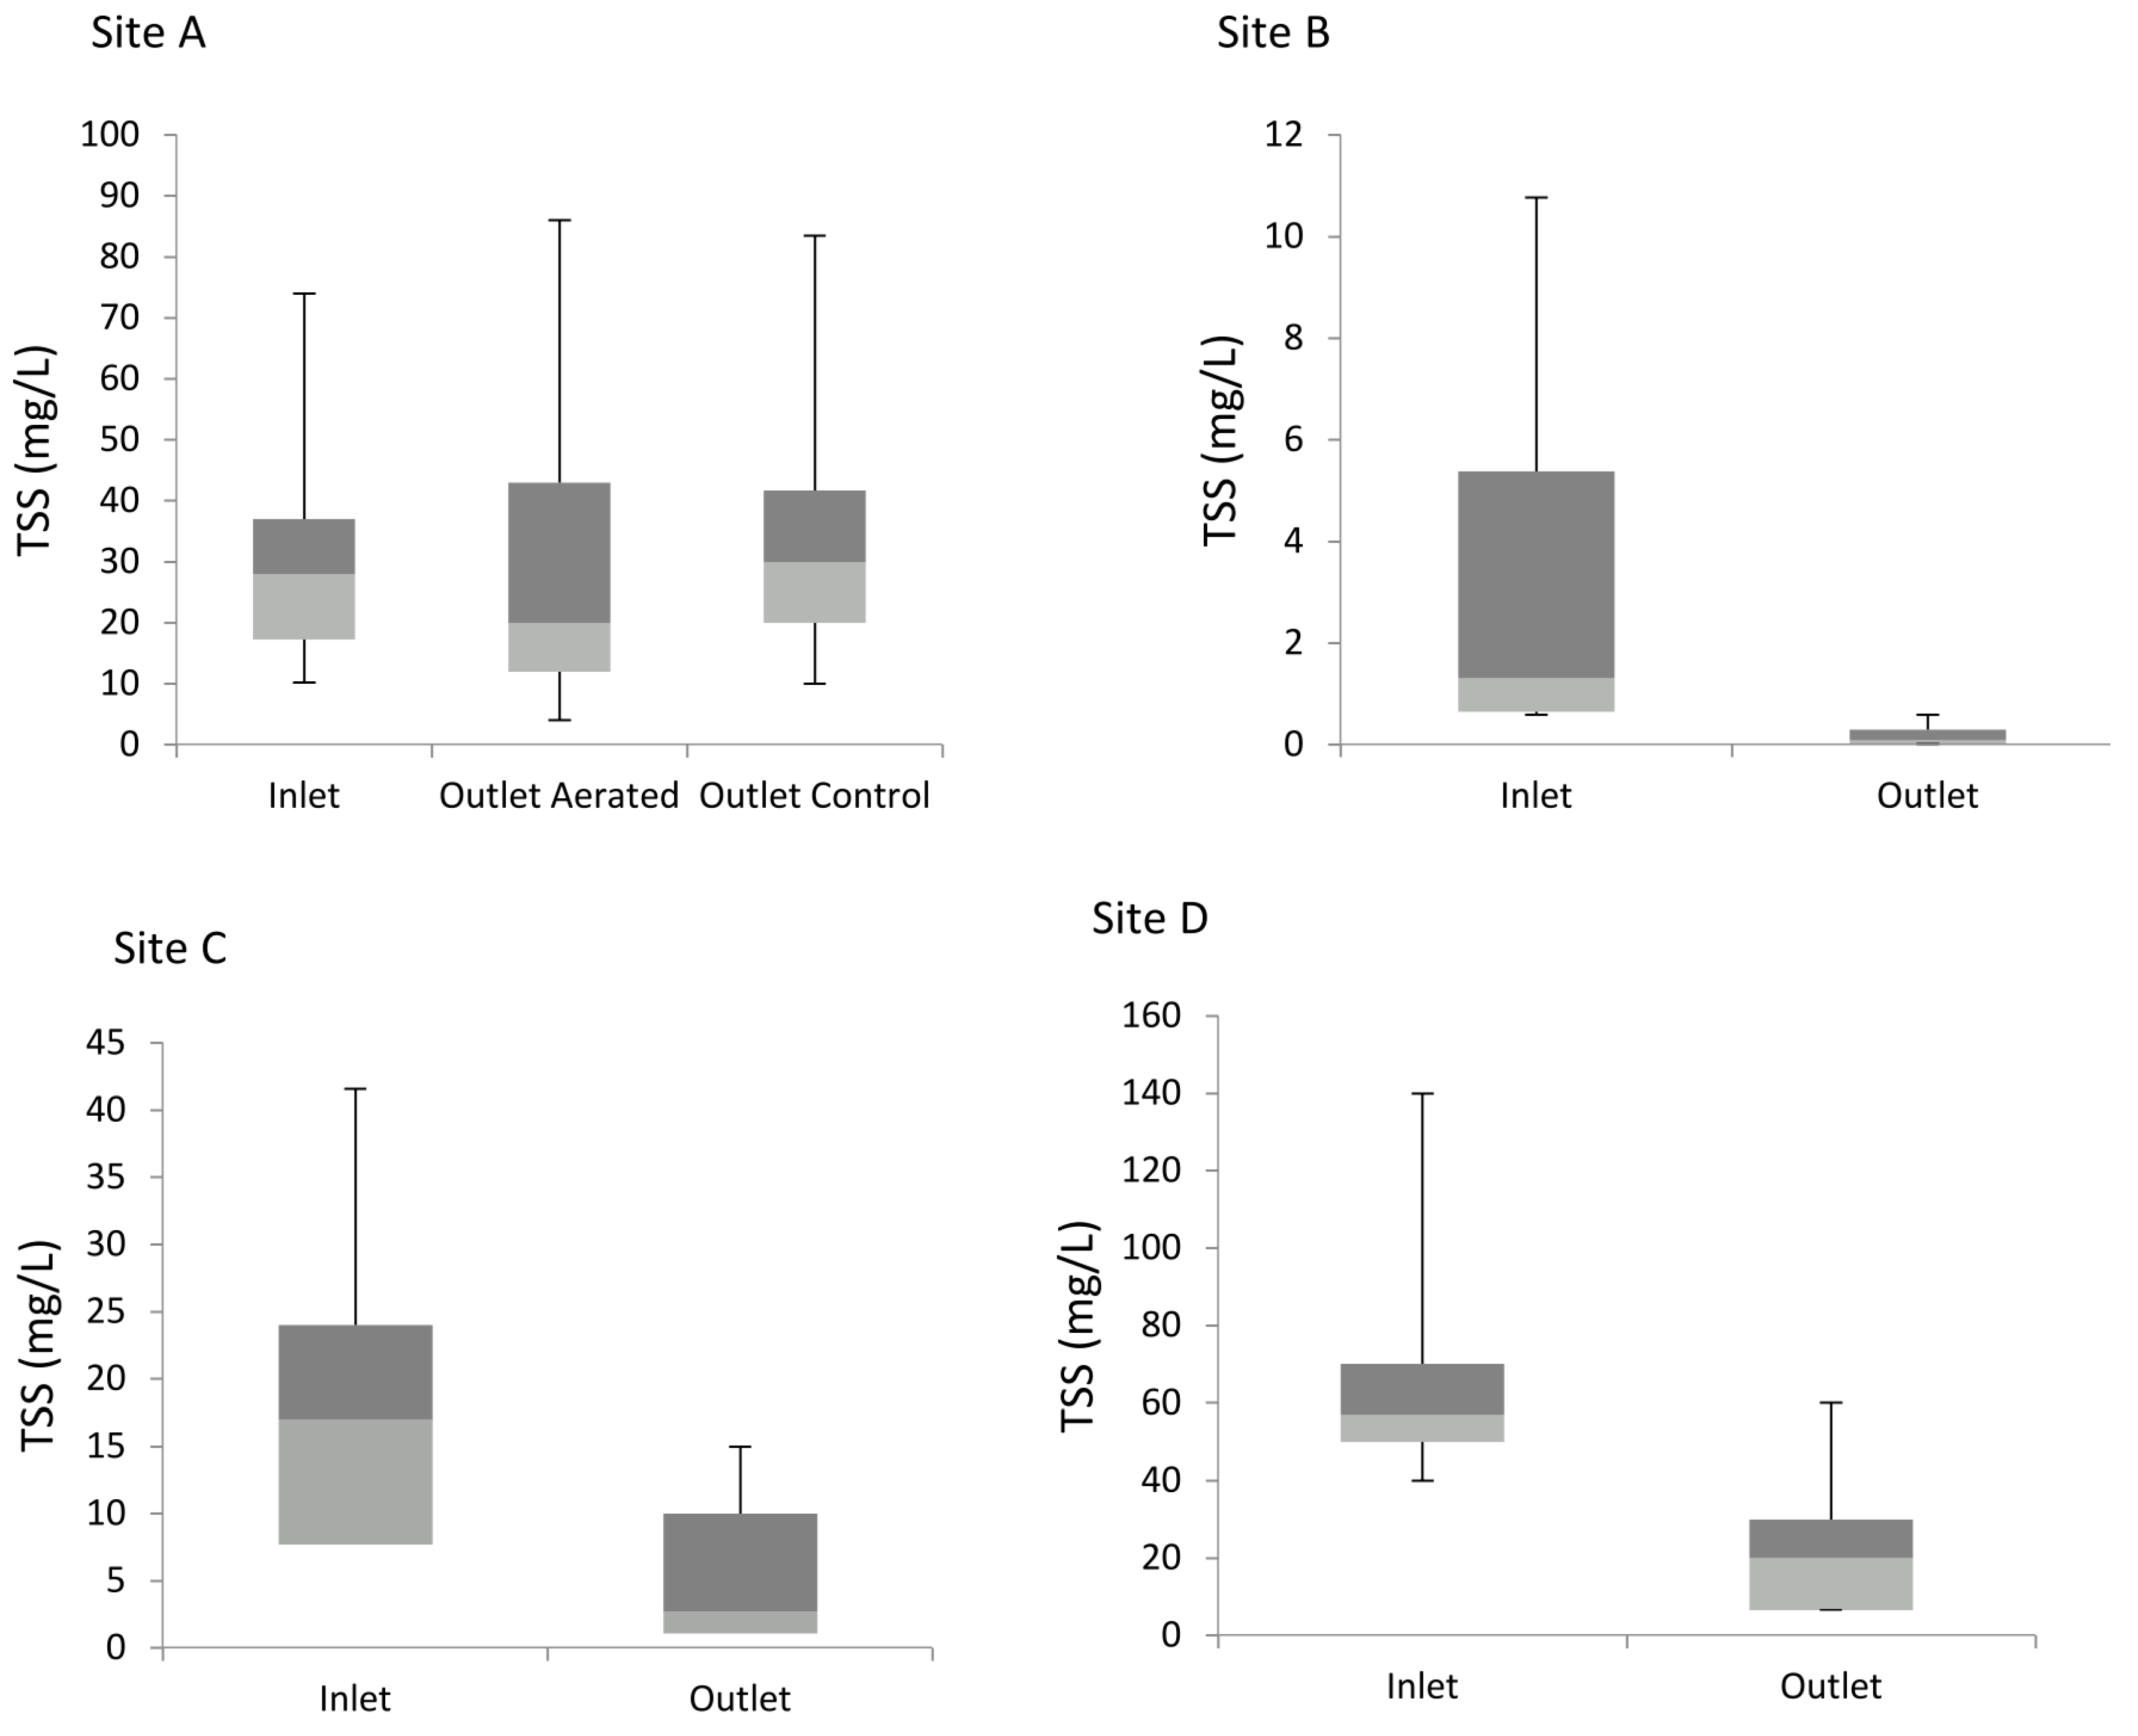
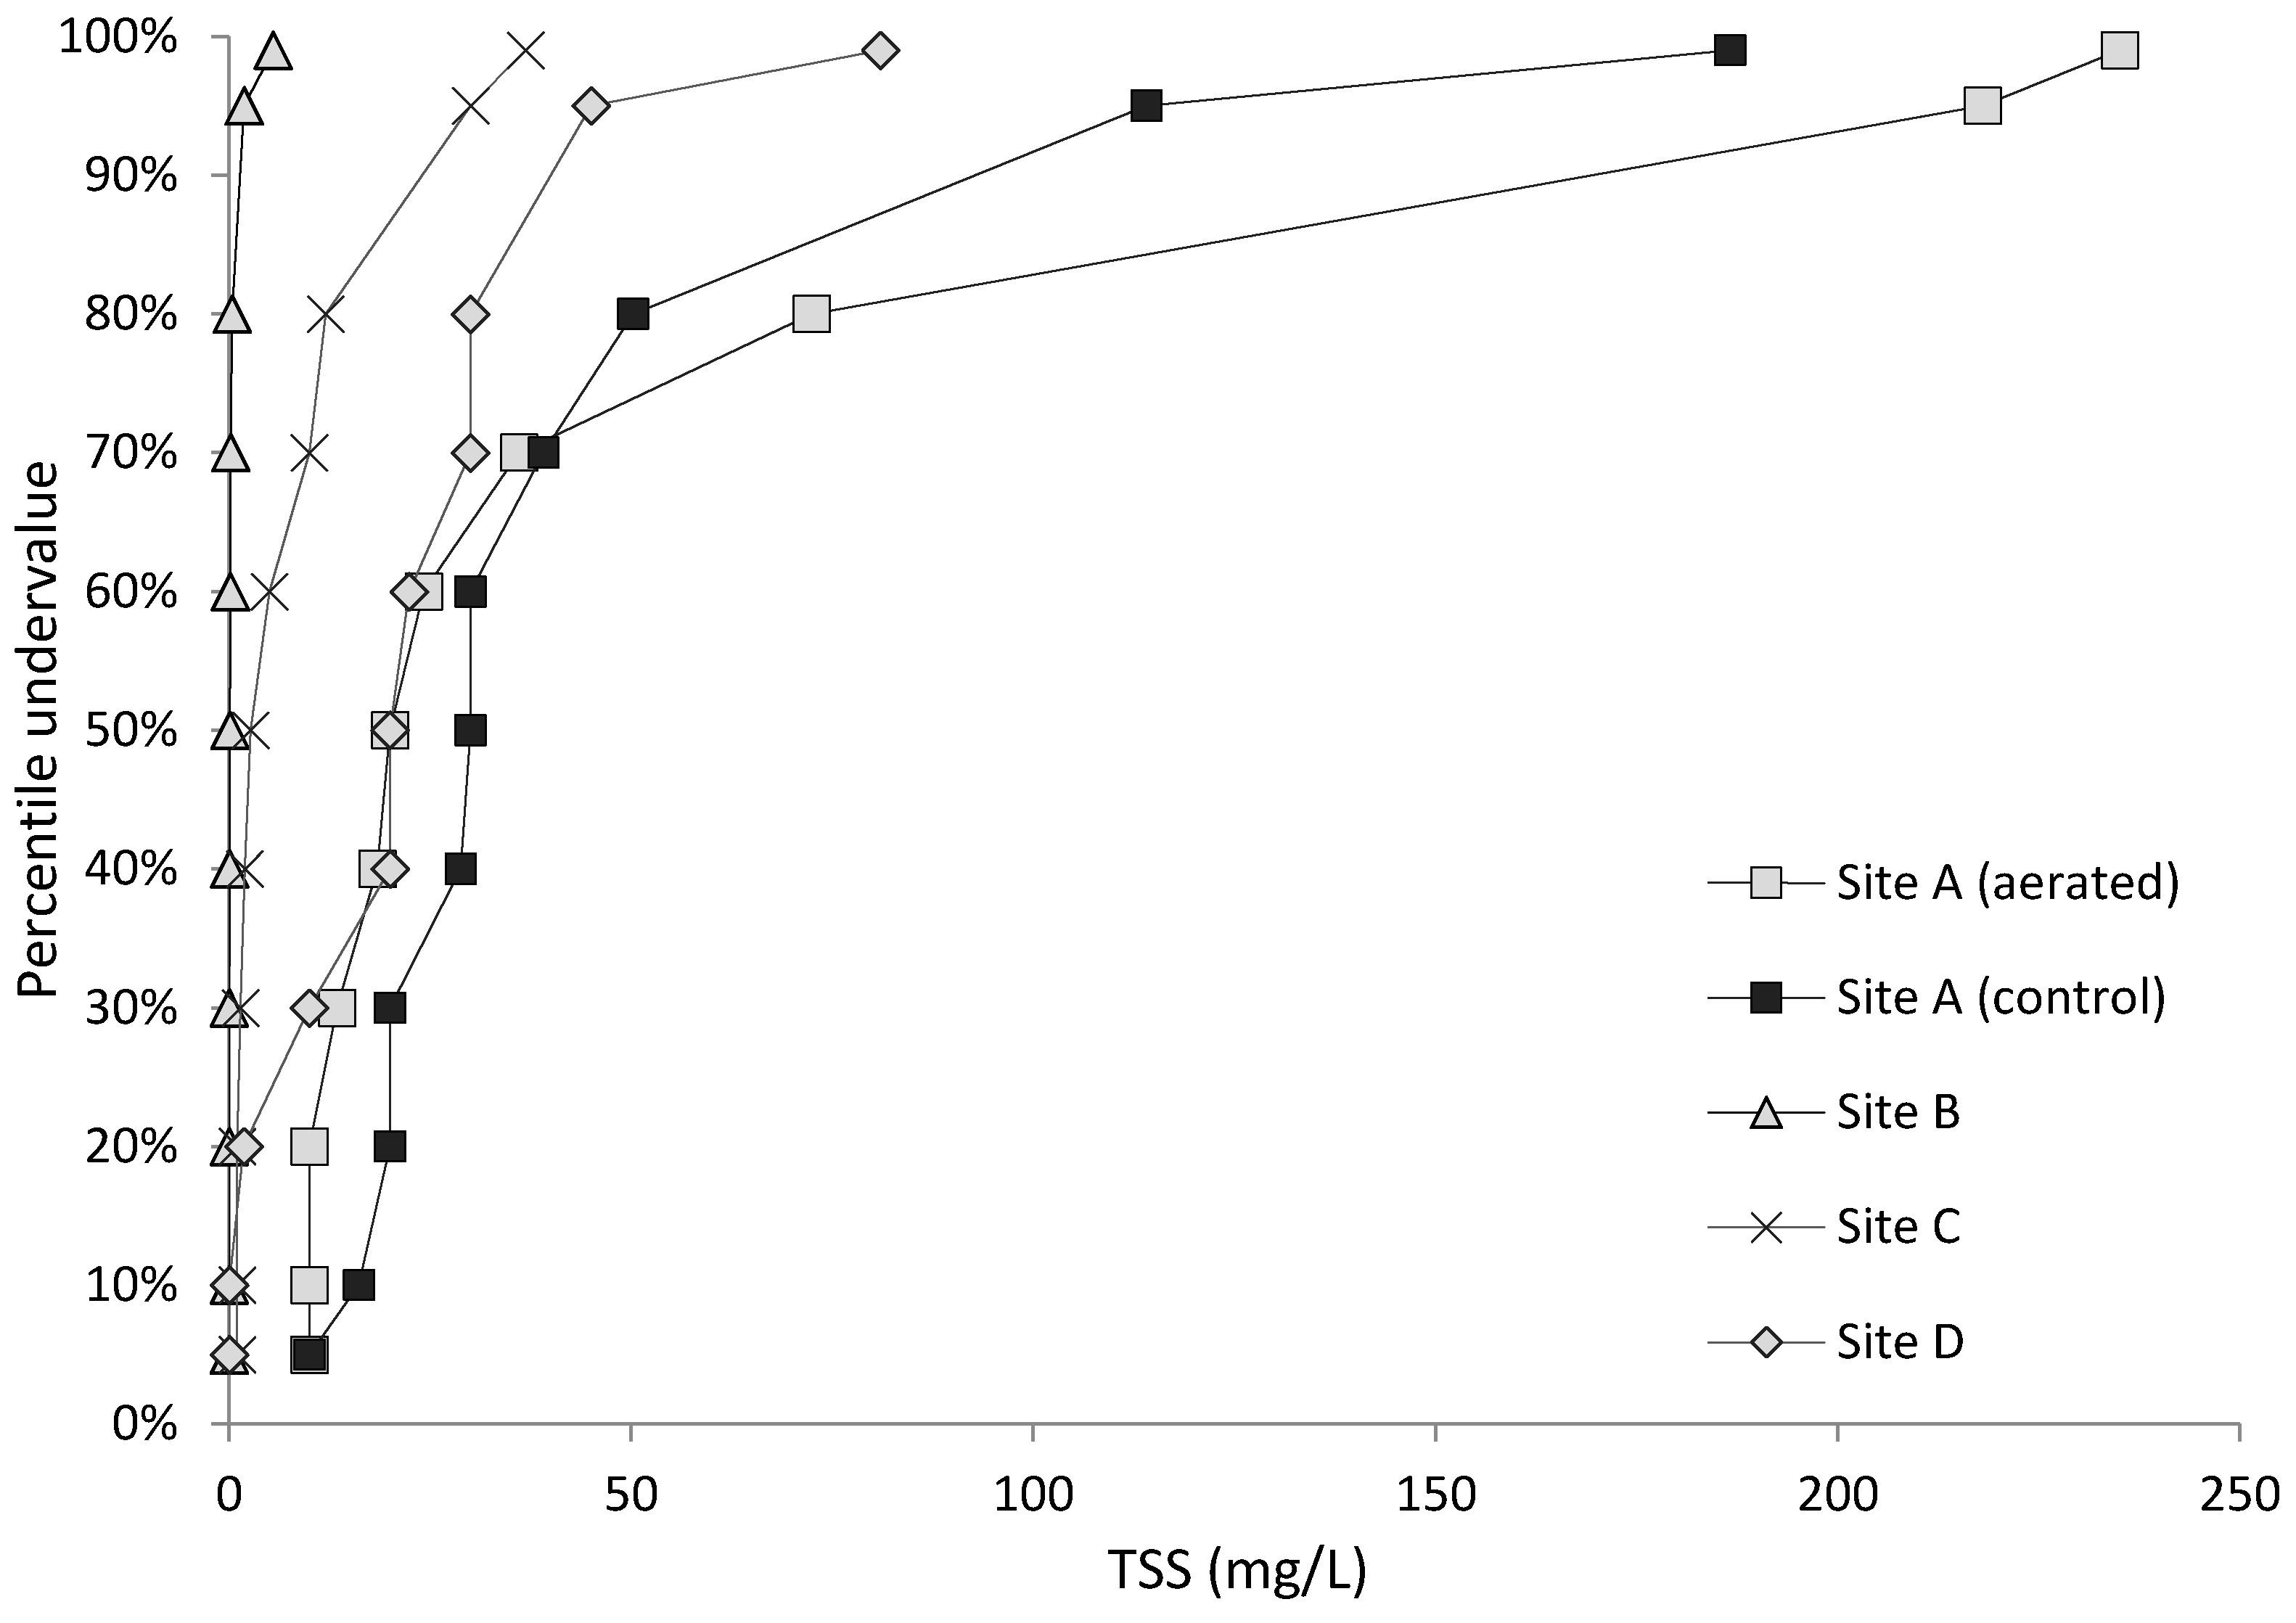
3.3. Solids and Organics Removal

A significant reduction in effluent total suspended solids concentrations was observed in comparison to inlet concentrations at sites B–D (Mann-Whitney U = 172.5, 364, 45.5, p < 0.0001) recording median effluent concentrations below 5 mg/L for sites B and C, and 20 mgTSS/L for site D (Figure 8; Table S1, Supplementary Materials). In the case of Site A, TSS concentrations were not significantly different between the inlet and outlets of both the aerated and non-aerated beds (Kruskal-Wallis statistic 2.194, p = 0.3338). Investigation into the cause revealed a site specific sampling issue reducing confidence in the significance of any findings related to the solids data at that site. No relationship was apparent between TSS loading rate and effluent concentration at any individual site or across all sites combined with the effluent TSS remaining below 40 mgTSS/L up to a maximum loading rate of 25 gTSS/m2/d with the exception of one measurement (Figure S2, Supplementary Materials).
However, comparison of the robustness profiles (Figure 9) revealed a decrease in the robustness of the systems as a function of the median TSS loading rate across sites. For instance, Site B exhibited a near vertical line, consistent with a very robust system only deviating from its near vertical slope beyond the 80th percentile and then only to a solids concentration of 5.5 mgTSS/L at the 99th percentile level and well below the future consent of 45 mgTSS/L 100% of the time (Figure 9). However, inlet concentrations onto this site were very low ranging between 0.01 and 7.3 mgTSS/L with a corresponding median loading rate of 0.1 gTSS/m2/d. Less robust systems were observed at sites C and D although effluent solids remained below the consent level 100% of the time. To illustrate, Site D (secondary) represented the least robust system with respect to solids with a shape similar to the non-aerated bed with respect to ammonia which is characteristic of a system with little or no inherent robustness to the treatment objective. However, the site achieved a 45 mgTSS/L up to the 95th percentile equivalent to consents on a number of small works and hence shows that aeration of secondary wetlands can provide effective treatment even with regards to solids.
Effluent BOD concentrations remained below respective future treatment goals for all sites (Table S1, Supplementary Materials). No significant difference was found between the medians of effluent concentrations from the aerated and control bed at Site A (Kruskal-Wallis statistic 5.428, p = 0.2461). Furthermore, BOD loadings did not affect effluent concentrations and together results suggest the presence of aeration did not further enhance BOD removal. Across all aerated sites, effluent BOD remained below 14 mgO2/L up to the maximum tested loading of 25 gO2/m2/d and confirms previous findings with regards to organic removal in aerated wetlands [2].

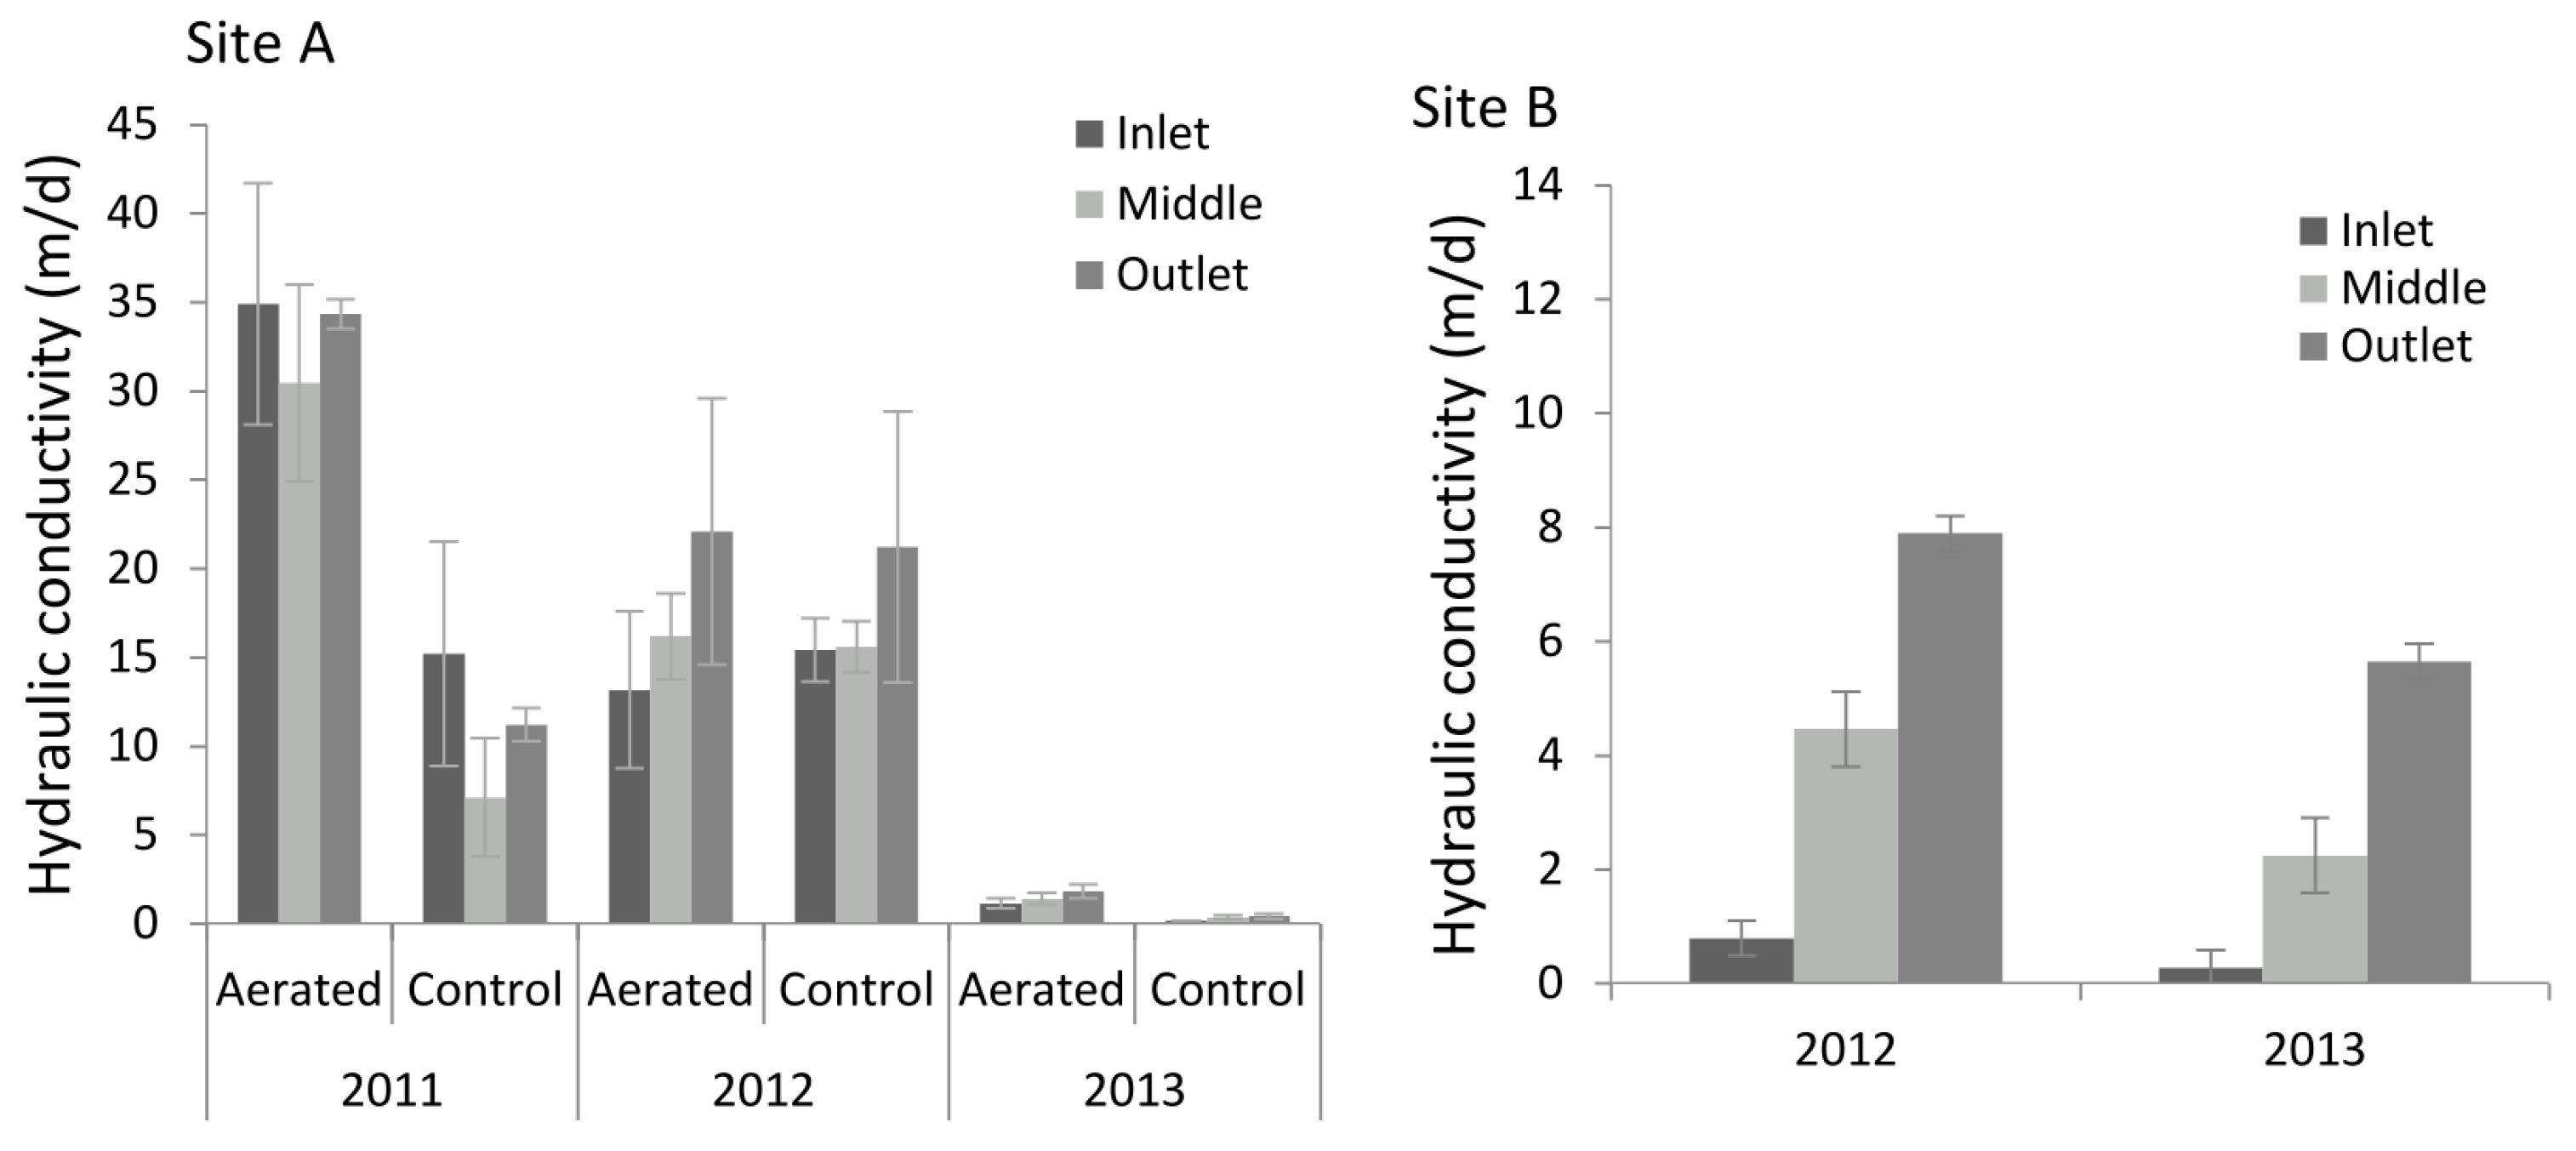
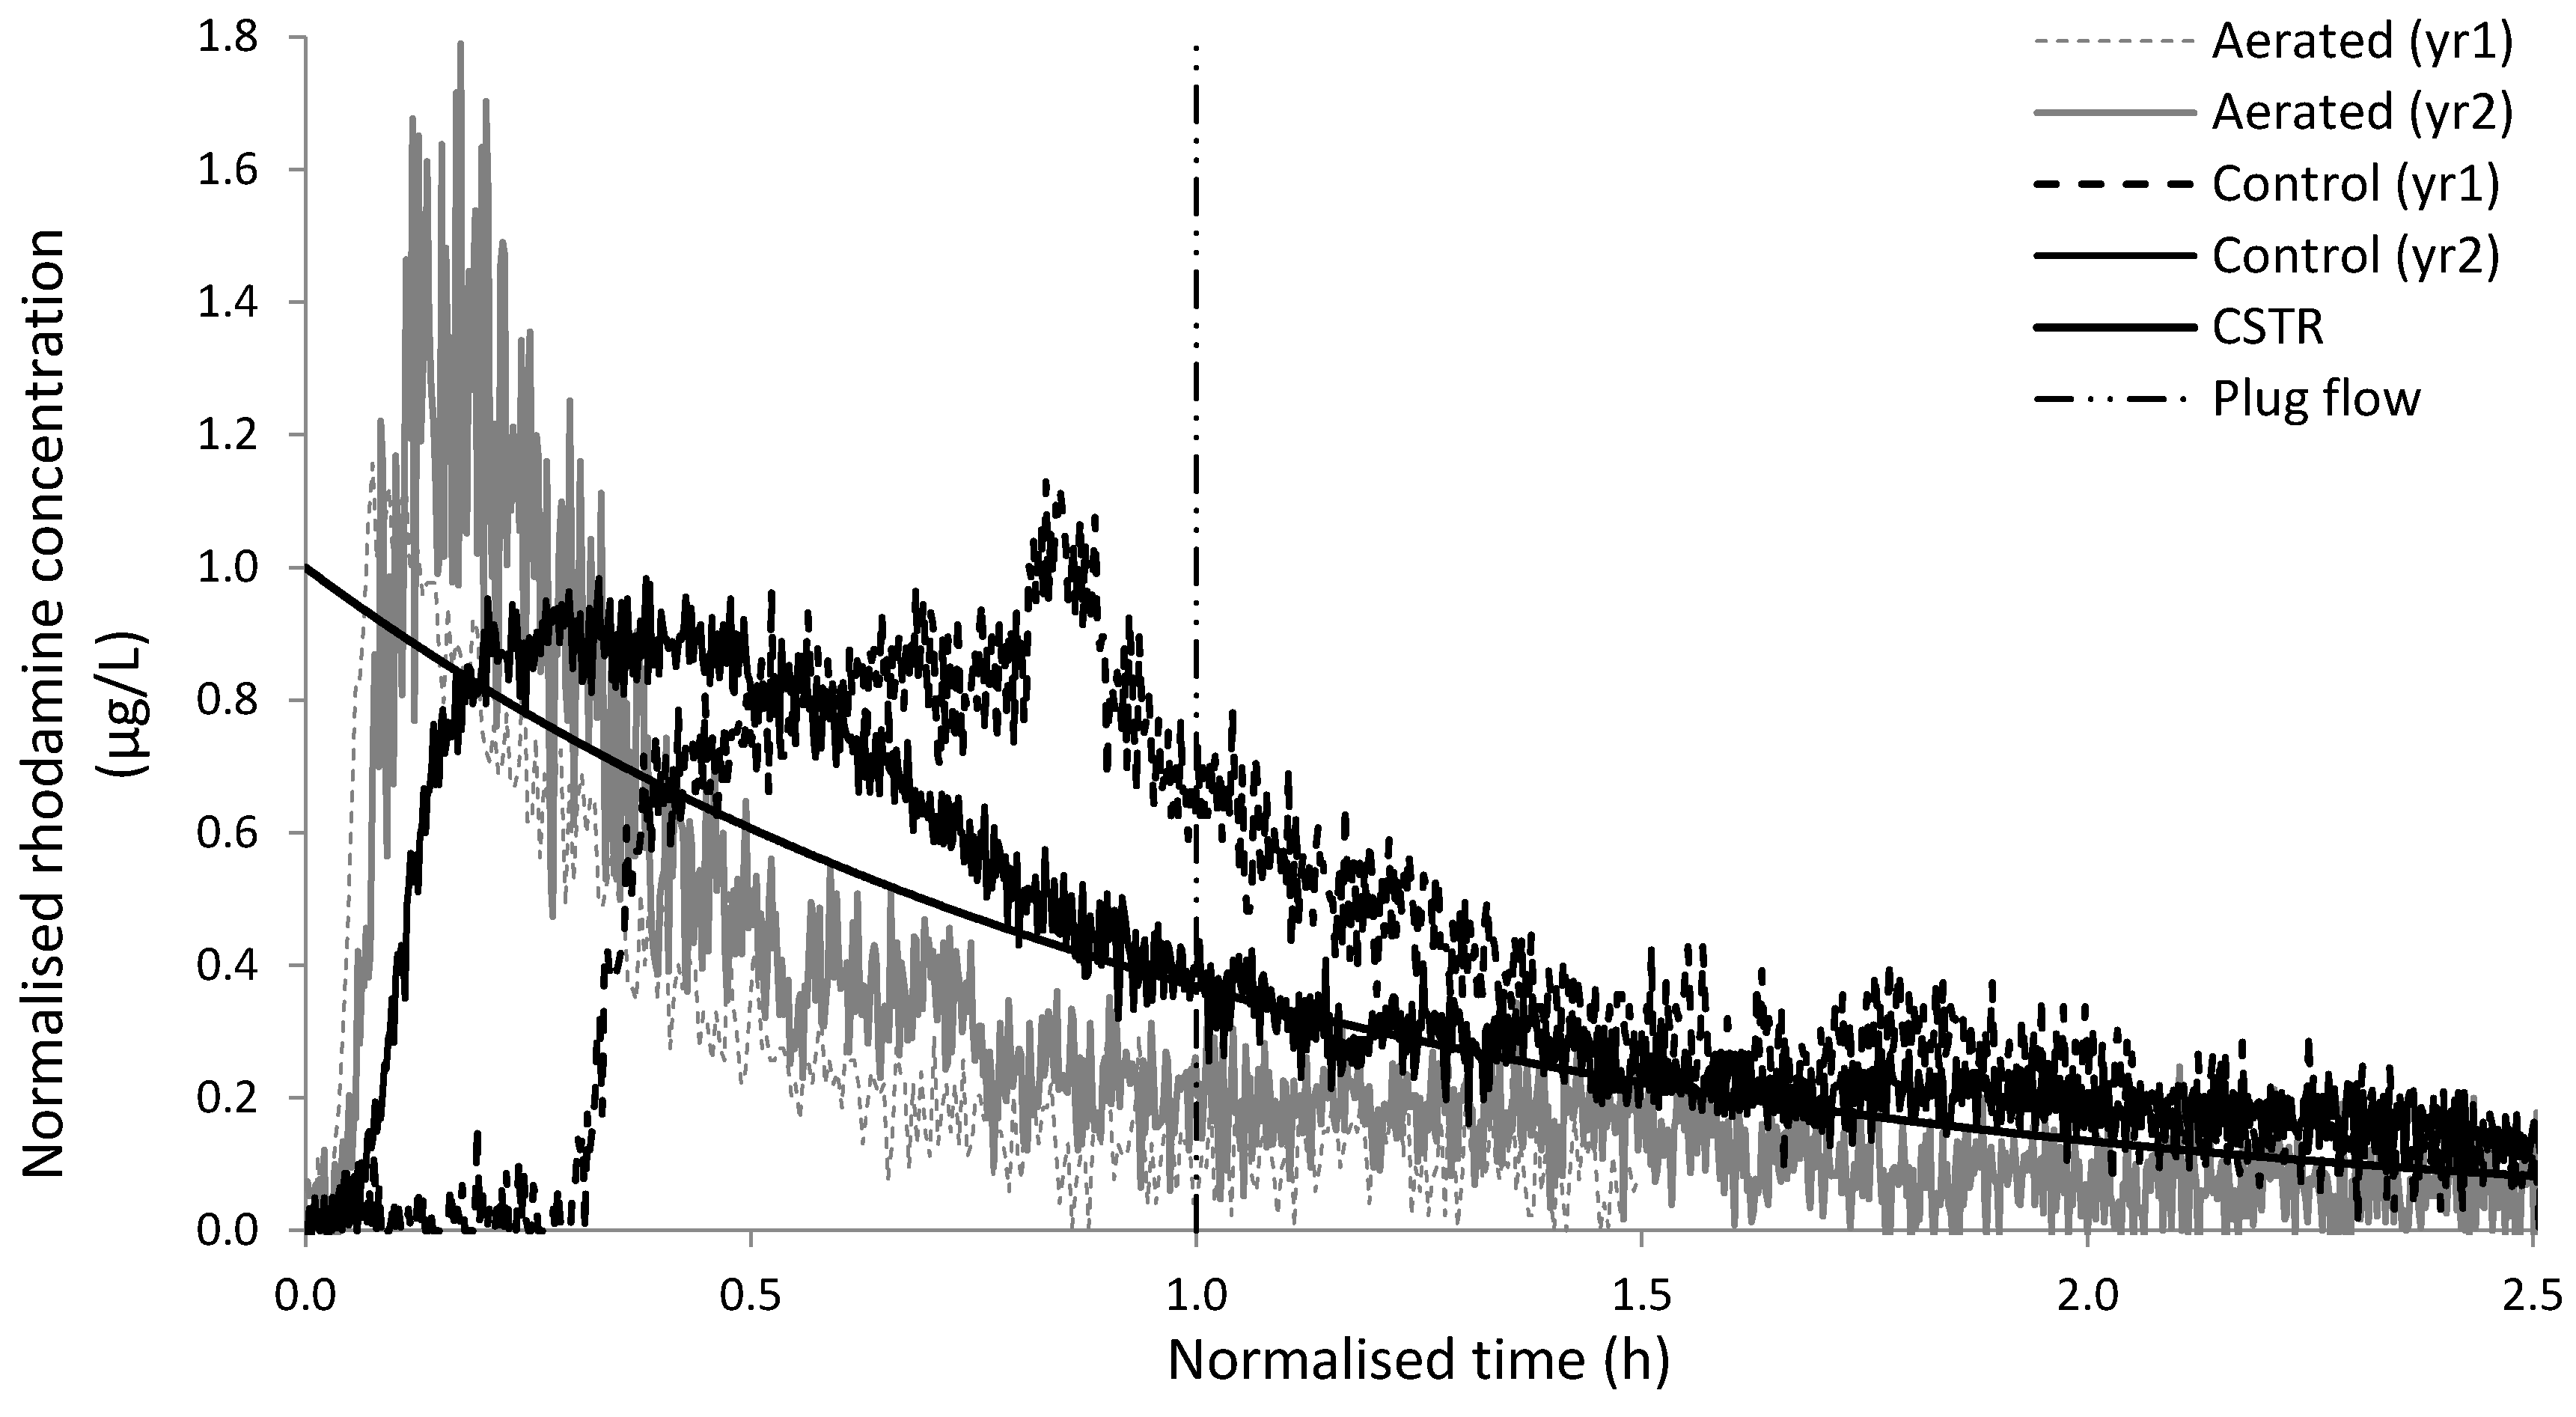
3.4. Hydraulic Characterisation

Conductivity was compared across the majority of sites in year two of the study quantified by a range of 11.5–15.4 m/d and 18.8–25.9 m/d for the inlets and outlets respectively of Sites A, C and D (no significant variation between medians, Kruskal-Wallis, p < 0.05) and generally showed a decrease at the inlet of the bed compared to the outlet, indicating improved hydraulic conductivity with distance from the inlet. Site B differed with comparatively lower values of 3.4–6.0 m/d and no decrease from inlet to outlet. For context, this is comparable to studies that report 350 m/d for clean systems and 4–6 m/d for clogged media [18]. It must be noted though that these measurements are of the top layer of media and thus are only indicative of clogging progression in the wetland rather than absolute measurements of clogging within the entire media volume.
In terms of deterioration over time, hydraulic conductivity was higher in year one in the aerated beds at Site A and B followed by a decrease in subsequent years indicating that the initial trend that suggested aeration may improve hydraulic conductivity [2] and solids removal [30] is not supported by our data. No pattern was obvious in values measured from the inlet, middle and outlet of the beds at Site A, but an increase from inlet to outlet was observed in site B in both years (Figure 10).
Further analysis of the impact of aeration on mixing pattern was conducted by means of tracer studies in years one and two at Site A (aerated vs. non-aerated control; Figure 11). Both beds displayed non-uniform flow, with a greater tendency towards plug flow in the control bed compared to the aerated bed, indicated by the higher index of modal retention time (τpn) of 0.33–0.56 in the control compared to 0.01–0.17 in the aerated bed, similar to the patterns observed in year one [2]. In support of the difference in mixing patterns, the Morrill dispersion index (MDI) was higher in the aerated bed than the control in both years, more consistent with CSTR mixing patterns; calculated as 14.9–31.7 and 4.5–9.0 in the aerated and control beds respectively (Table 3). In addition, the MDI approximately doubled in both beds in year two compared to year one consistent with increased back mixing. Support for this is provided through analysis of convective dispersion which increased in both beds as a function of age rising from 0.37 to 0.59 in the aerated and 0.15 to 0.26 in the control beds (Table 3). The volumetric efficiency was calculated as 3.2%–6.7% in the aerated bed compared to 11.1%–22.3% in the control and decreased by 52% in the aerated bed between year one and year two and 50% in the control. Overall, analysis of the change in RTDs indicates that the beds are progressively deviating from plug flow consistent with the beds becoming clogged and operated with a slight free water level. Additionally the change in hydraulic conductivity and mixing pattern in both beds appears to progress at a similar relative rate suggesting that aeration is unlikely to positively influence long term hydraulic operation.
Overall, artificially aerating the wetlands significantly improved their ammonia treatment capacity per unit area compared to non-aerated systems and impacted on the hydraulic behavior of the reactors. Whilst aeration can indeed deliver improved effluent quality, it comes at a carbon and financial cost. Further analysis of these trade-offs are explored in References [2] and [31].

4. Conclusions

Ammonium removal performance of aerated horizontal flow sub-surface flow constructed wetlands was assessed at four full-scale small sewage treatment works of various configurations. Based on the results of this study, the technology was shown to be capable of delivering nitrified effluents down to 3 mgNH4+-N/L in both a secondary system and tertiary treatment application including combined storm flow beds with the potential to deliver sub 1 mgNH4+-N/L in the case of tertiary systems. The system was observed to remain robust in systems receiving variable loadings between 0.1 and 13.0 NH4+-N/m2/d. However, the systems showed limited resilience to spike loads posited to be due to insufficient abundance of the nitrifying community within the bed which could be ameliorated through cyclic operation of the aeration to sequenced parts of the bed.
Further investigation into hydraulic characterisation recorded hydraulic conductivity values in a similar range over the sites. Furthermore, mixing patterns in the bed demonstrated a decrease in volumetric efficiency over time. Overall, the study demonstrates the efficacy of the technology where ammonium removal is required on small sites receiving high and variable flow rates, with adequate removal of BOD and TSS, but has no significant benefit to the long term hydraulics of the system.

Supplementary Materials

The following are available online at https://www.mdpi.com/2073-4441/8/9/365/s1, Figure S1: Ammonium loading and associated nitrification rates at Sites A–C; Figure S2: TSS loading and effluent concentrations at Sites A–C; Table S1: Inlet and outlet concentrations of BOD, TSS and NH4+-N at all sites.

Acknowledgments

The authors would like to express their gratitude for the financial and resource support of the work from Severn Trent Water Limited and to the Engineering and Physical Sciences Research Council (EPSRC) for their allocation of funding and support of the project (grant EP/I501347/1). Enquiries for access to the data referred to in this article should be directed to [email protected].

Author Contributions

All Cranfield authors were involved in the conception and design of the experimental work; Eleanor Butterworth performed all the experiments, with the exception of the hydraulic characterisation in year 2 of the study, which was conducted by Gabriella Mansi under the guidance of the Cranfield authors and Ezio Ranieri. Eleanor Butterworth wrote the main body of the paper as part of the Ph.D. thesis; all authors contributed to the analysis of the data.

Conflicts of Interest

The authors declare no conflict of interest.

References

  1. Ishikawa, S.; Suzuki, T.; Nikata, T.; Kakii, K.; Shirakashi, T. Tertiary nitrification in a new dual-medium aerated filter. Water Sci. Technol. 2003, 47, 219–237. [Google Scholar] [PubMed]
  2. Butterworth, E.; Dotro, G.; Jones, M.; Richards, A.; Onunkwo, P.; Narroway, Y.; Jefferson, B. Effect of artificial aeration on tertiary nitrification in a full-scale subsurface horizontal flow constructed wetland. Ecol. Eng. 2013, 54, 236–244. [Google Scholar] [CrossRef]
  3. García, J.; Aguirre, P.; Barragán, J.; Mujeriego, R.; Matamoros, V.; Bayona, J.M. Effect of key design parameters on the efficiency of horizontal subsurface flow constructed wetlands. Ecol. Eng. 2005, 25, 405–418. [Google Scholar] [CrossRef]
  4. Gross, A.; Sklarz, M.Y.; Yakirevich, A.; Soares, M.I.M. Small scale recirculating vertical flow constructed wetland (RVFCW) for the treatment and reuse of wastewater. Water Sci. Technol. 2008, 58, 487–494. [Google Scholar] [CrossRef] [PubMed]
  5. Brix, H.; Arias, C.A. The use of vertical flow constructed wetlands for on-site treatment of domestic wastewater: New Danish guidelines. Constr. Wetl. Wastewater Treat. 2005, 25, 491–500. [Google Scholar] [CrossRef]
  6. Wu, S.; Zhang, D.; Austin, D.; Dong, R.; Pang, C. Evaluation of a lab-scale tidal flow constructed wetland performance: Oxygen transfer capacity, organic matter and ammonium removal. Ecol. Eng. 2011, 37, 1789–1795. [Google Scholar] [CrossRef]
  7. Foladori, P.; Ruaben, J.; Ortigara, A. Recirculation or artificial aeration in vertical flow constructed wetlands: A comparative study for treating high load wastewater. Bioresour. Technol. 2013, 149, 398–405. [Google Scholar] [CrossRef] [PubMed]
  8. Nivala, J.; Headley, T.; Wallace, S.; Bernhard, K.; Brix, H.; van Afferden, M.; Müller, R.A. Comparative analysis of constructed wetlands: The design and construction of the ecotechnology research facility in Langenreichenbach, Germany. Ecol. Eng. 2013, 61, 527–543. [Google Scholar] [CrossRef]
  9. Maltais-Landry, G.; Maranger, R.; Brisson, J. Effect of artificial aeration and macrophyte species on nitrogen cycling and gas flux in constructed wetlands. Ecol. Eng. 2009, 35, 221–229. [Google Scholar] [CrossRef]
  10. Fan, J.; Wang, W.; Zhang, B.; Guo, Y.; Ngo, H.H.; Guo, W.; Zhang, J.; Wu, H. Nitrogen removal in intermittently aerated vertical flow constructed wetlands: Impact of influent COD/N ratios. Bioresour. Technol. 2013, 143, 461–466. [Google Scholar] [CrossRef] [PubMed]
  11. Matthys, A.; Parkin, G.; Wallace, S. A comparison of constructed wetlands used to treat domesitc wastes: Conventional, drawdown, and aerated systems. In Proceedings of the 7th International Conference on Wetland Systems for Water Pollution Control, Lake Buena Vista, FL, USA, 11–16 November 2000; International Water Association, Ed.; International Water Association: Colchester, UK, 2000. [Google Scholar]
  12. Dong, H.; Qiang, Z.; Li, T.; Jin, H.; Chen, W. Effect of artificial aeration on the performance of vertical-flow constructed wetland treating heavily polluted river water. J. Environ. Sci. 2012, 24, 596–601. [Google Scholar] [CrossRef]
  13. Nivala, J.; Hoos, M.B.; Cross, C.; Wallace, S.; Parkin, G. Treatment of landfill leachate using an aerated, horizontal subsurface-flow constructed wetland. Sci. Total Environ. 2007, 380, 19–27. [Google Scholar] [CrossRef] [PubMed]
  14. Wallace, S.; Kadlec, R. BTEX degradation in a cold-climate wetland system. Water Sci. Technol. 2005, 51, 165–171. [Google Scholar] [PubMed]
  15. Knowles, P.; Dotro, G.; Nivala, J.; García, J. Clogging in subsurface-flow treatment wetlands: Occurrence and contributing factors. Ecol. Eng. 2011, 37, 99–112. [Google Scholar] [CrossRef]
  16. American Public Health Association (APHA). Standard Methods for the Examination of Water and Wastewater, 21st ed.; APHA: Washington, DC, USA, 2005. [Google Scholar]
  17. Pedescoll, A.; Uggetti, E.; Llorens, E.; Granés, F.; García, D.; García, J. Practical method based on saturated hydraulic conductivity used to assess clogging in subsurface flow constructed wetlands. Ecol. Eng. 2009, 35, 1216–1224. [Google Scholar] [CrossRef]
  18. Pedescoll, A.; Samsó, R.; Romero, E.; Puigagut, J.; García, J. Reliability, repeatability and accuracy of the falling head method for hydraulic conductivity measurements under laboratory conditions. Ecol. Eng. 2011, 37, 754–757. [Google Scholar] [CrossRef]
  19. Hartshorn, A.J.; Prpich, G.; Upton, A.; Macadam, J.; Jefferson, B.; Jarvis, P. Assessing filter robustness at drinking water treatment plants. Water Environ. J. 2015, 29, 16–26. [Google Scholar] [CrossRef]
  20. Llorens, E.; Matamoros, V.; Domingo, V.; Bayona, J.M.; García, J. Water quality improvement in a full-scale tertiary constructed wetland: Effects on conventional and specific organic contaminants. Sci. Total Environ. 2009, 407, 2517–2524. [Google Scholar] [CrossRef] [PubMed]
  21. O’Luanaigh, N.D.; Goodhue, R.; Gill, L.W. Nutrient removal from on-site domestic wastewater in horizontal subsurface flow reed beds in Ireland. Ecol. Eng. 2010, 36, 1266–1276. [Google Scholar] [CrossRef]
  22. Albuquerque, A.; Oliveira, J.; Semitela, S.; Amaral, L. Influence of bed media characteristics on ammonia and nitrate removal in shallow horizontal subsurface flow constructed wetlands. Bioresour. Technol. 2009, 100, 6269–6277. [Google Scholar] [CrossRef]
  23. Yousefi, Z.; Mohseni-Bandpei, A. Nitrogen and phosphorus removal from wastewater by subsurface wetlands planted with Iris pseudacorus. Ecol. Eng. 2010, 36, 777–782. [Google Scholar] [CrossRef]
  24. Cottingham, P.; Davies, T.; Hart, B. Aeration to promote nitrification in constructed wetlands. Environ. Technol. 1999, 20, 69–75. [Google Scholar] [CrossRef]
  25. Vymazal, J. Long-term performance of constructed wetlands with horizontal sub-surface flow: Ten case studies from the Czech Republic. Ecol. Eng. 2011, 37, 54–63. [Google Scholar] [CrossRef]
  26. Boller, M.; Gujer, W. Nitrification in tertiary trickling filters followed by deep-bed filters. Water Res. 1986, 20, 1363–1373. [Google Scholar] [CrossRef]
  27. Pickering, R.L. How Hard is the Biomass Working? Ph.D. Thesis, University of Newcastle Upon Tyne, Newcastle Upon Tyne, UK, 2008. [Google Scholar]
  28. Pearce, P. Sustainable processes to meet low ammonia consents—The small works challenge. In Proceedings of the 2nd Conference on Low Energy Wastewater Treatment Systems, Solihull, UK, 24 September 2013.
  29. Kappel, C. Simplified Evaluation of the Operational Oxygen Transfer Efficiency of a Novel Dispersed Integrated Fixed Film Activated Sludge Process. Ph.D. Thesis, Cranfield University, Cranfield, UK, 2009. [Google Scholar]
  30. Chazarenc, F.; Gagnon, V.; Comeau, Y.; Brisson, J. Effect of plant and artificial aeration on solids accumulation and biological activities in constructed wetlands. Ecol. Eng. 2009, 35, 1005–1010. [Google Scholar] [CrossRef]
  31. Butterworth, E.; Richards, A.; Jones, M.; Dotro, G.; Jefferson, B. Assessing the potential for tertiary nitrification in sub-surface flow constructed wetlands. Environ. Technol. Rev. 2016. [Google Scholar] [CrossRef]
Figure 1. Site process flowsheets of aerated HSSF CW sites.
Water 08 00365 g001
Figure 2. Ammonium loading rates and corresponding effluent ammonium concentrations at all sites.
Water 08 00365 g002
Figure 3. Box and whisker plot of NH4+-N, concentrations at the inlet and the outlet of the control and aerated beds. (n = Site B data excluding the upstream process failure). The box represents the interquartile range; the line indicates the mean and the whiskers the 25th and 75th percentiles.
Water 08 00365 g003
Figure 4. Influent and effluent concentrations of ammonium at Site C showing the period of increased loadings and time to reach steady state (30 days).
Water 08 00365 g004
Figure 5. Effluent ammonia concentrations from control and aerated CW in Site A on resuming operation after 5 months of being offline.
Water 08 00365 g005
Figure 6. Ammonium removal robustness curves for all sites.
Water 08 00365 g006
Figure 7. Robustness index (RI) of all sites against a range of target effluent concentrations.
Water 08 00365 g007
Figure 8. Box and whisker plot of TSS, concentrations at the inlet and the outlet of the control and aerated beds. The box represents the interquartile range; the line indicates the mean and the whiskers the 25th and 75th percentiles.
Water 08 00365 g008
Figure 9. TSS removal robustness curves for all sites.
Water 08 00365 g009
Figure 10. Hydraulic conductivity (m/d) as the beds matured for Sites A and B.
Water 08 00365 g010
Figure 11. Year one and two residence time distributions for the aerated and control beds at Site A.
Water 08 00365 g011
Table 1. Site details and current and future consents for aerated horizontal flow constructed wetlands.
SiteTreatment StagePEProcess Area m2Aeration Power W/m3Hydraulic Retention Time (HRT) dAverage Flow m3/dCurrent ConsentFuture Consent
BODTSSNH4-NBODTSSNH4-N
ATertiary39320026.70.7653045n/a21454
BCombined a3963606.71.27625451014453
CCombined a6006004.40.81803050n/a305012
DSecondary5820013.33.116DDDDDD
Notes: a combined treatment refers to combined secondary treated water plus storm overflow. PE = population equivalent; BOD = 5-Day Carbonaceous Biochemical Oxygen Demand (mgO2/L); TSS = Total Suspended Solids (mgTSS/L); NH4+-N = ammonium nitrogen (mgNH4+-N/L); D = descriptive consent; Power based on the blower sized used per m3 of bed.
Table 2. Summer and winter ammonium inlet loadings and effluent concentrations.
SeasonSiteLoading (gNH4+-N/m2/d)Outlet Concentration (mgNH4+-N/L)
MedianMinMaxMedianMinMaxn
SummerSite A (aerated)2.00.311.50.10.021.419
Site A (control)2.00.311.56.50.0320.619
Site B0.080.021.90.10.011.520
Site C0.040.010.070.20.040.35
Site Dn/an/an/a0.50.12.611
WinterSite A (aerated)2.80.0712.50.10.020.623
Site A (control)2.80.0712.58.40.122.123
Site B0.20.0210.90.20.0215.022
Site C4.30.411.90.90.25.329
Site Dn/an/an/a1.20.113.320
Table 3. Hydraulic characterisation of HSSF CW with and without aeration.
Wetland BedQ (m3/h)Recovery (%)τn (h)τ (h)τpnDMDIev (%)
Aerated year 11.87714.26.20.010.3714.96.7
Aerated year 21.87214.224.50.170.5931.73.2
Control year 11.13534.228.10.560.154.522.3
Control year 21.26721.214.70.330.269.011.1
Notes: Q = flow rate; τn = nominal residence time; τ = residence time; σ = τpn = index of modal retention time; D = dispersion number; MDI = Morrill dispersion index; ev = volumetric efficiency.

