Article

Performance Evaluation of a Floating Treatment Wetland in an Urban Catchment

1
Stormwater Research Group, University of the Sunshine Coast, Sippy Downs Drive, Sippy Downs 4558, Queensland, Australia
2
Drapper Environmental Consultants (DEC), 12 Treetops Avenue, Springfield Lakes 4300, Queensland, Australia
3
Covey Associates Pty Ltd., 124 Duporth Ave, Maroochydore 4558, Queensland, Australia
*
Author to whom correspondence should be addressed.
Water 2016, 8(6), 244; https://doi.org/10.3390/w8060244
Submission received: 21 April 2016 / Revised: 31 May 2016 / Accepted: 6 June 2016 / Published: 8 June 2016

Abstract

:
Floating Treatment Wetland (FTW) systems are purpose-built devices designed to replicate the water treatment processes that occur in and around naturally occurring floating vegetated islands. FTWs can be used to improve the water quality of water storage ponds by contributing to water treatment processes through adhesion, filtration, nutrient uptake (direct use by plants), and sequestration. This paper presents the results of a twelve-month investigation into the pollution removal performance of a FTW receiving stormwater runoff from a 7.46 ha urban residential catchment. As anticipated, there was a high degree of variation in FTW treatment performance between individual rainfall events. Overall pollution removal performance was calculated to be 80% for Total Suspended Solids (TSS), 53% for Total Phosphorous (TP), and 17% for Total Nitrogen (TN) for a FTW footprint of 0.14% of the contributing catchment. TSS and TP concentrations were found to be significantly reduced after FTW treatment. The minimum FTW footprint to catchment size ratio required to achieve regulated nutrient removal rates was calculated to be 0.37%. Sum of loads calculations based on flow resulted in pollution load reductions of TSS 76%, TP 55%, and TN 17%. Pollution treatment performance (particularly for TN) was found to be affected by low influent concentrations, and highly-variable inflow concentrations. The study demonstrated that FTWs are an effective treatment solution for the removal of pollution from urban stormwater runoff.

Graphical Abstract

1. Introduction

Naturally occurring floating vegetated islands are found in freshwater lakes and ponds, and are comprised of a matrix of floating organic material and plant associations growing at the water surface. The buoyancy of a naturally occurring floating island is a result of gasses (Nitrogen-N and Carbon dioxide-CO2 in aerobic conditions, and additionally Methane-CH4 in anoxic conditions) trapped beneath the organic mat, and the air stored within the roots and leaves of vegetation growing on the island [1,2]. The size of naturally occurring floating islands can change organically over time, increasing via the accumulation of trapped floating organic material, and decreasing because of temporary higher velocity flows, wave action, or strong winds [1]. The inherent habitat value (especially to avifauna) of floating islands has been recognised for decades [3]. For example, the UK Royal Society for the Protection of Birds constructed artificial islands for the conservation of threatened species as early as the 1960’s [4].
Following these early successes, FTWs have since been used for a variety of purposes including treatment of pollution emanating from mine tailings [4,5,6,7], and pollution removal from stormwater [8,9,10,11,12,13,
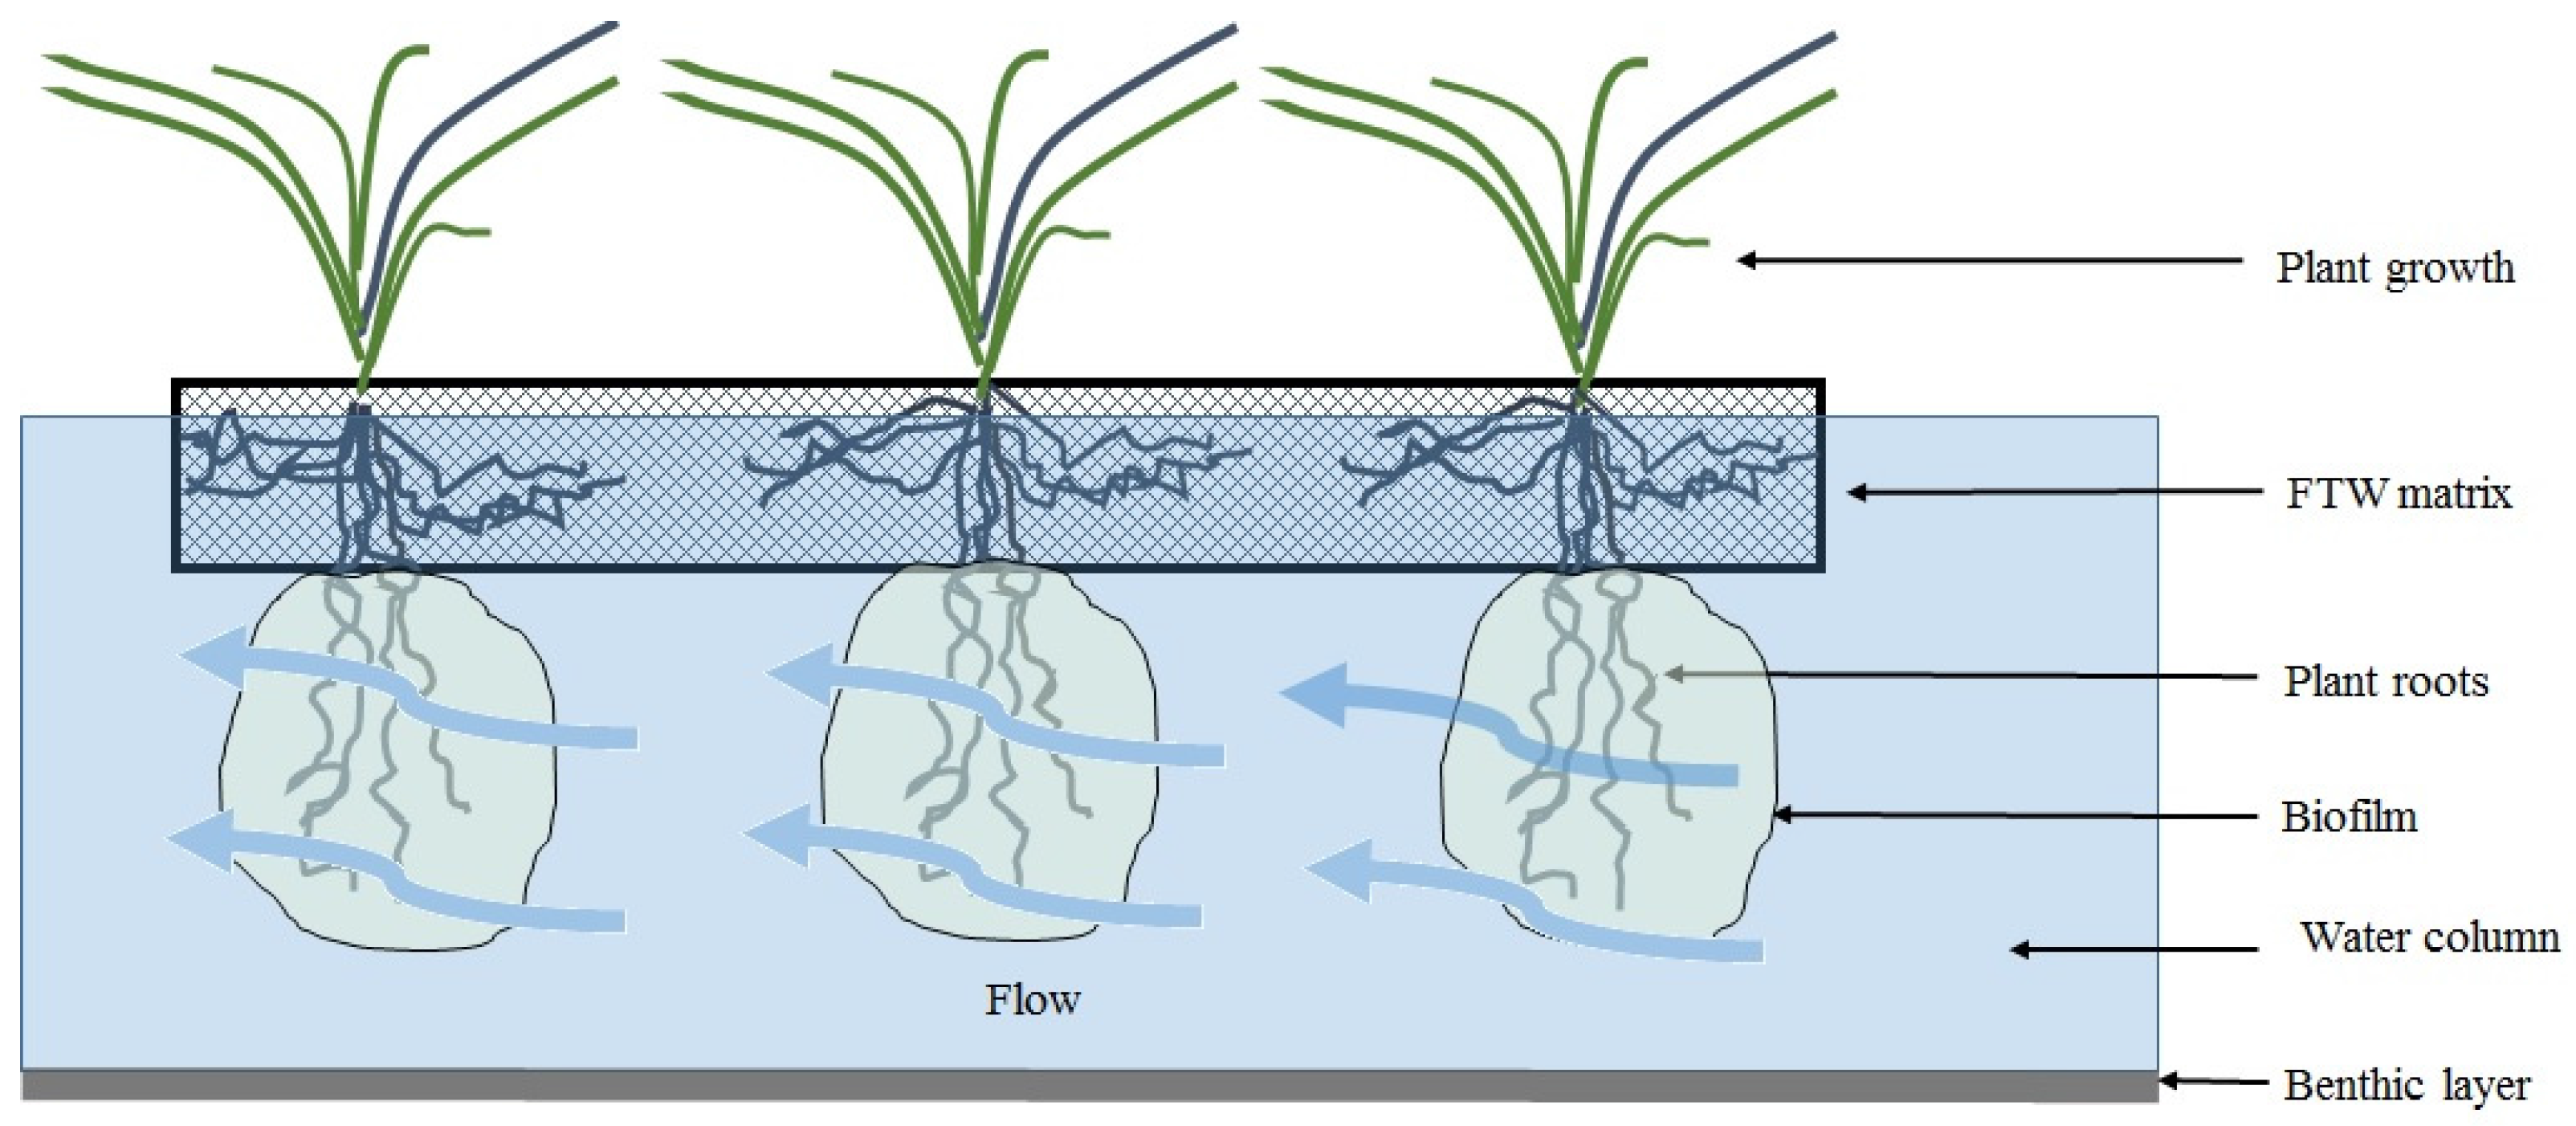
14]. FTWs make positive contributions to the health of their aquatic environment by reducing flow velocity which promotes the settlement of suspended solids. FTWs also mechanically filter suspended solids though the interaction of plant roots in the water column (Figure 1) which can grow to a depth of 3 m [3]. Complex microbial communities (biofilm) also assemble on, and throughout the root mass below the water surface, and contribute to water treatment processes through adhesion, filtration, nutrient uptake (direct use by plants), and sequestration [15,16]. FTWs have also been acknowledged to contribute to the aesthetic quality of an area [4]. As FTWs do not require additional earthworks or land uptake, they can also offer increased pollution removal performance at a substantially lower cost compared to alternatives such as constructed wetlands.
Contemporary artificial FTWs are typically constructed using a combination of woven plastic, organic based matting, and fibreglass [8,10]. Juvenile plants are established directly into this floating matrix, and the roots grow into the water column below (Figure 2).
Studies undertaken in the United States and New Zealand [10,11,12,13,14,15,16] have found that FTW can provide an effective, low cost, and low maintenance means of treating domestic and agricultural wastewater and stormwater. Tanner et al. [10] found that FTW were capable of reducing wastewater TSS by up to 81%, total nitrogen (TN) by up to 34%, and total phosphorus (TP) by up to 19%. Borne [11] observed significant reductions in TP as a result of a FTW installation in a stormwater pond. Similarly Borne et al. [12] in NZ found FTW retrofitted stormwater ponds to be more efficient at removing TSS. However, there are currently few field studies on the performance of FTW in treating urban stormwater runoff [9] and their treatment performance remains largely unknown. This paper describes the results of a twelve-month field study undertaken to evaluate the pollution removal performance of a FTW designed to treat stormwater runoff from an existing urban development in Queensland, Australia.

2. Site Description

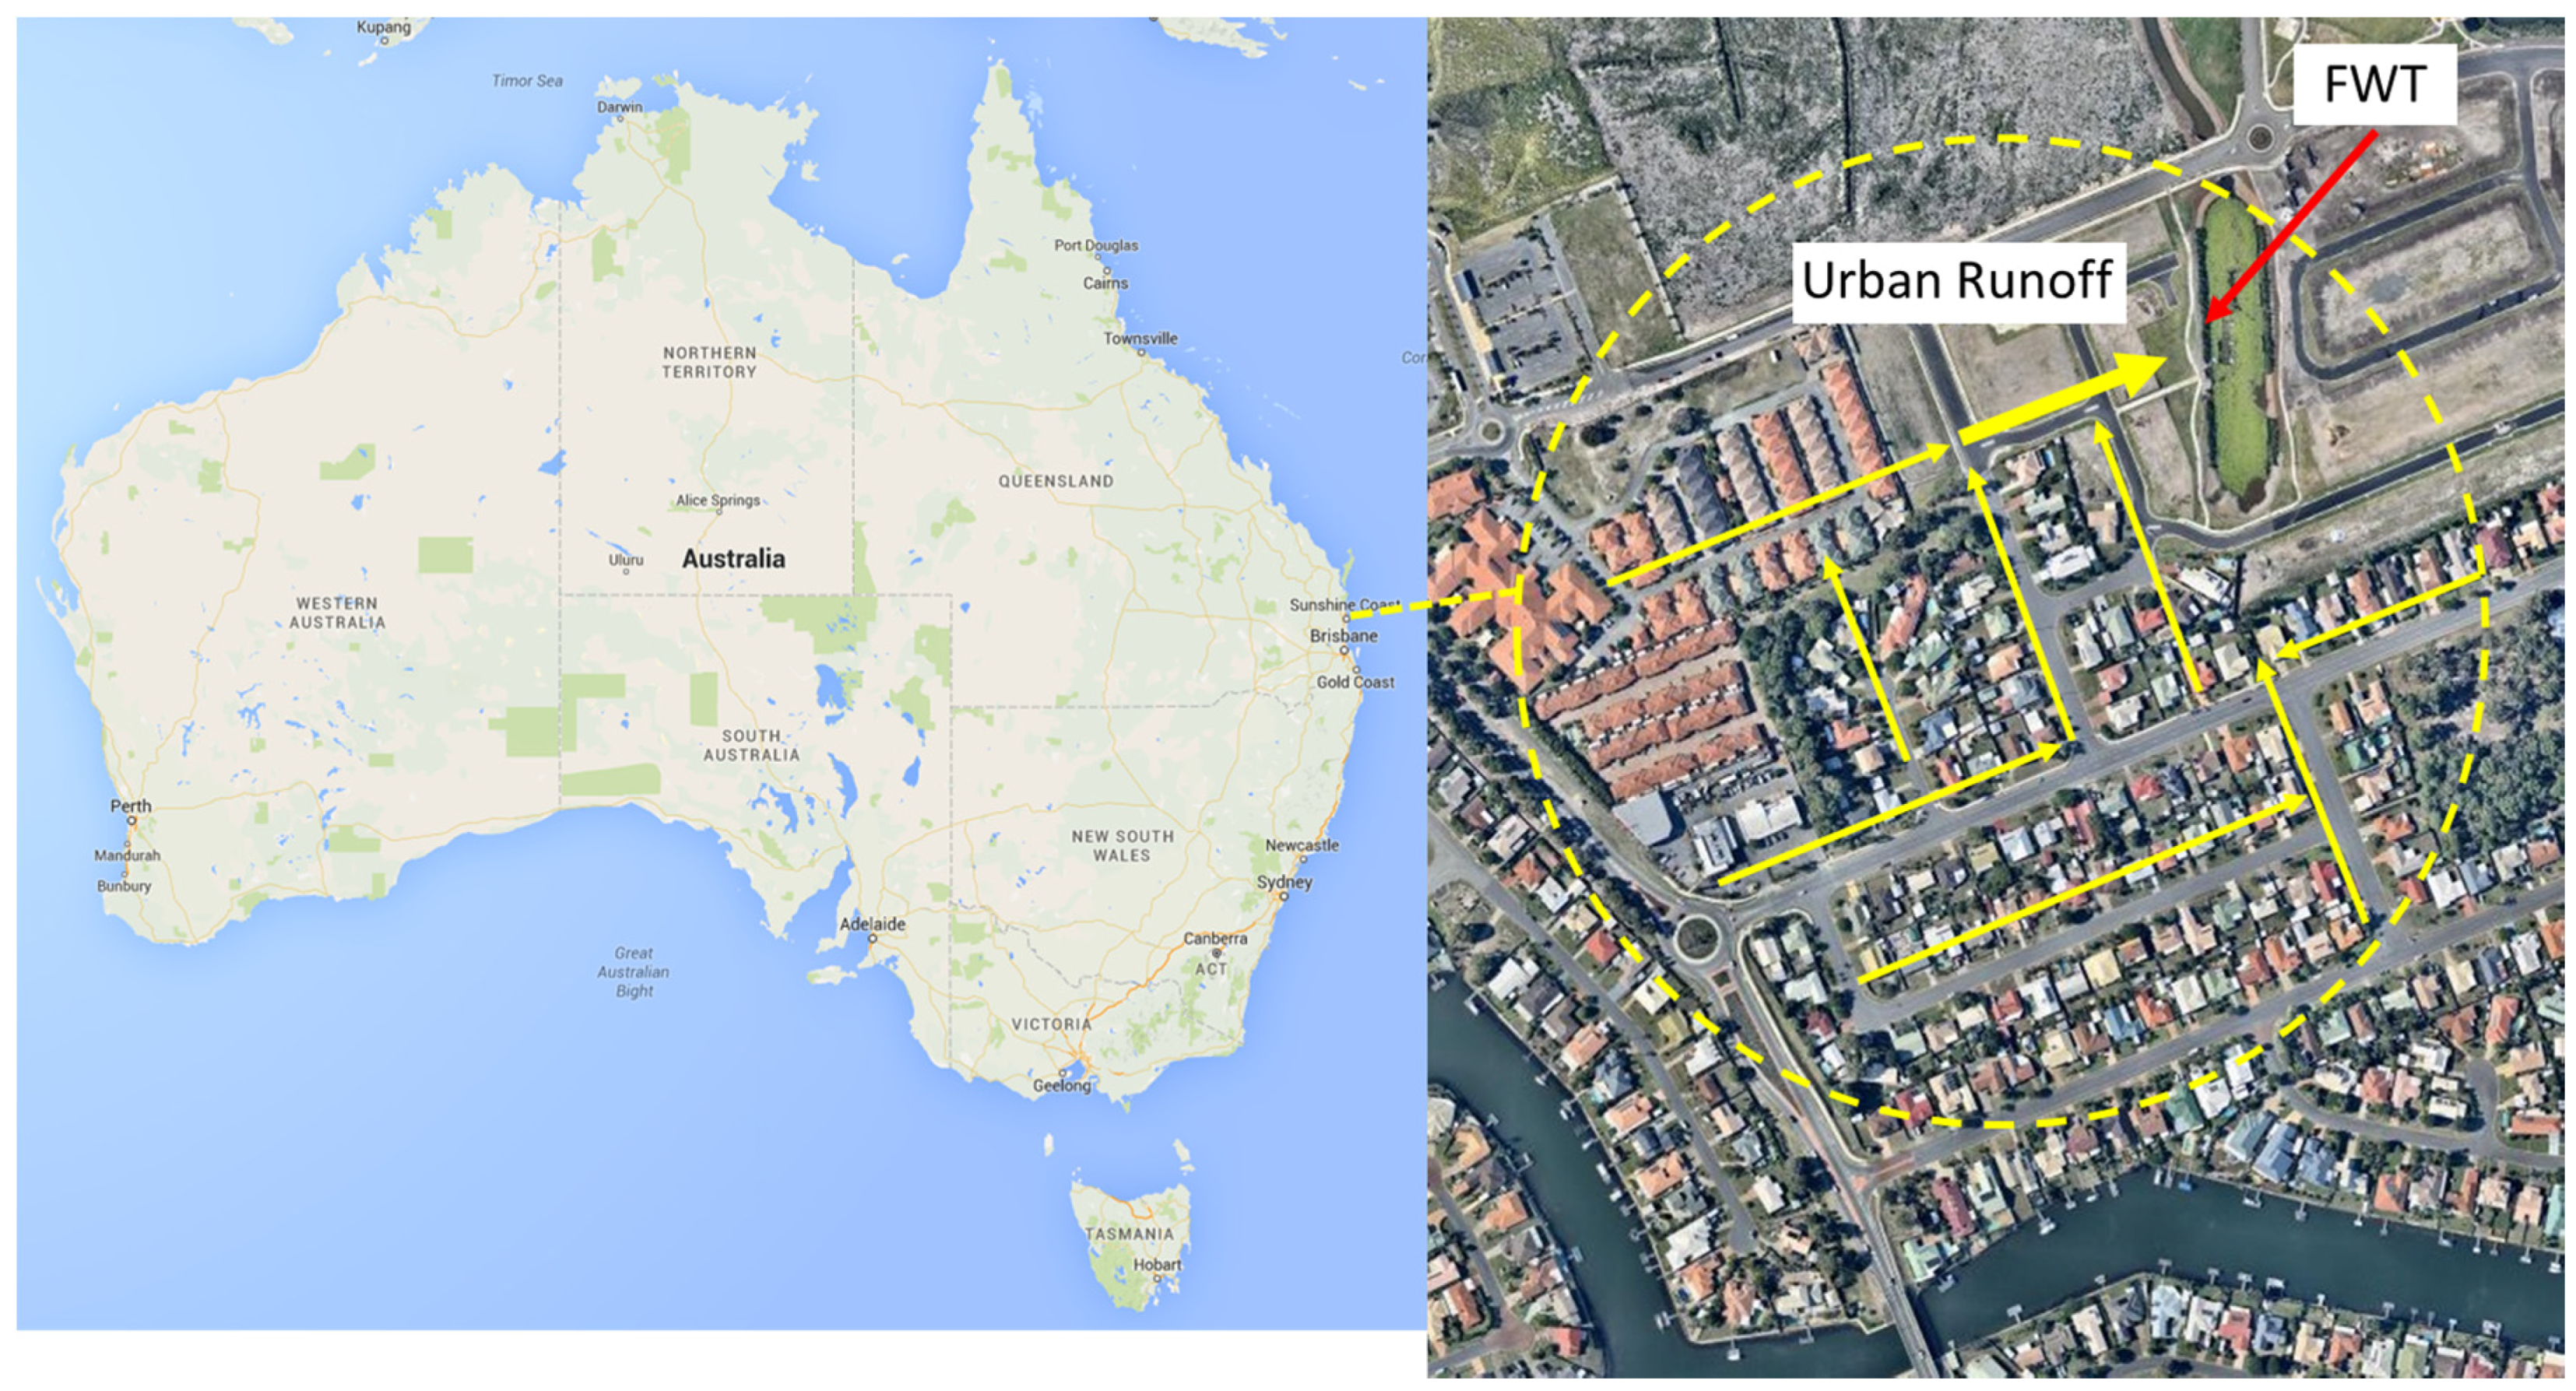
The study site was located on Bribie Island, Queensland, Australia (Figure 3). The entire site is zoned low-density residential, and has a total area of 42.3 ha. The contributing catchment area of the development site treated by the FTW is 7.46 ha (Figure 3), with 2.2 ha comprised of a development under construction. The FTW installation (101 m2) was sized as approximately 0.14% of the contributing catchment area.
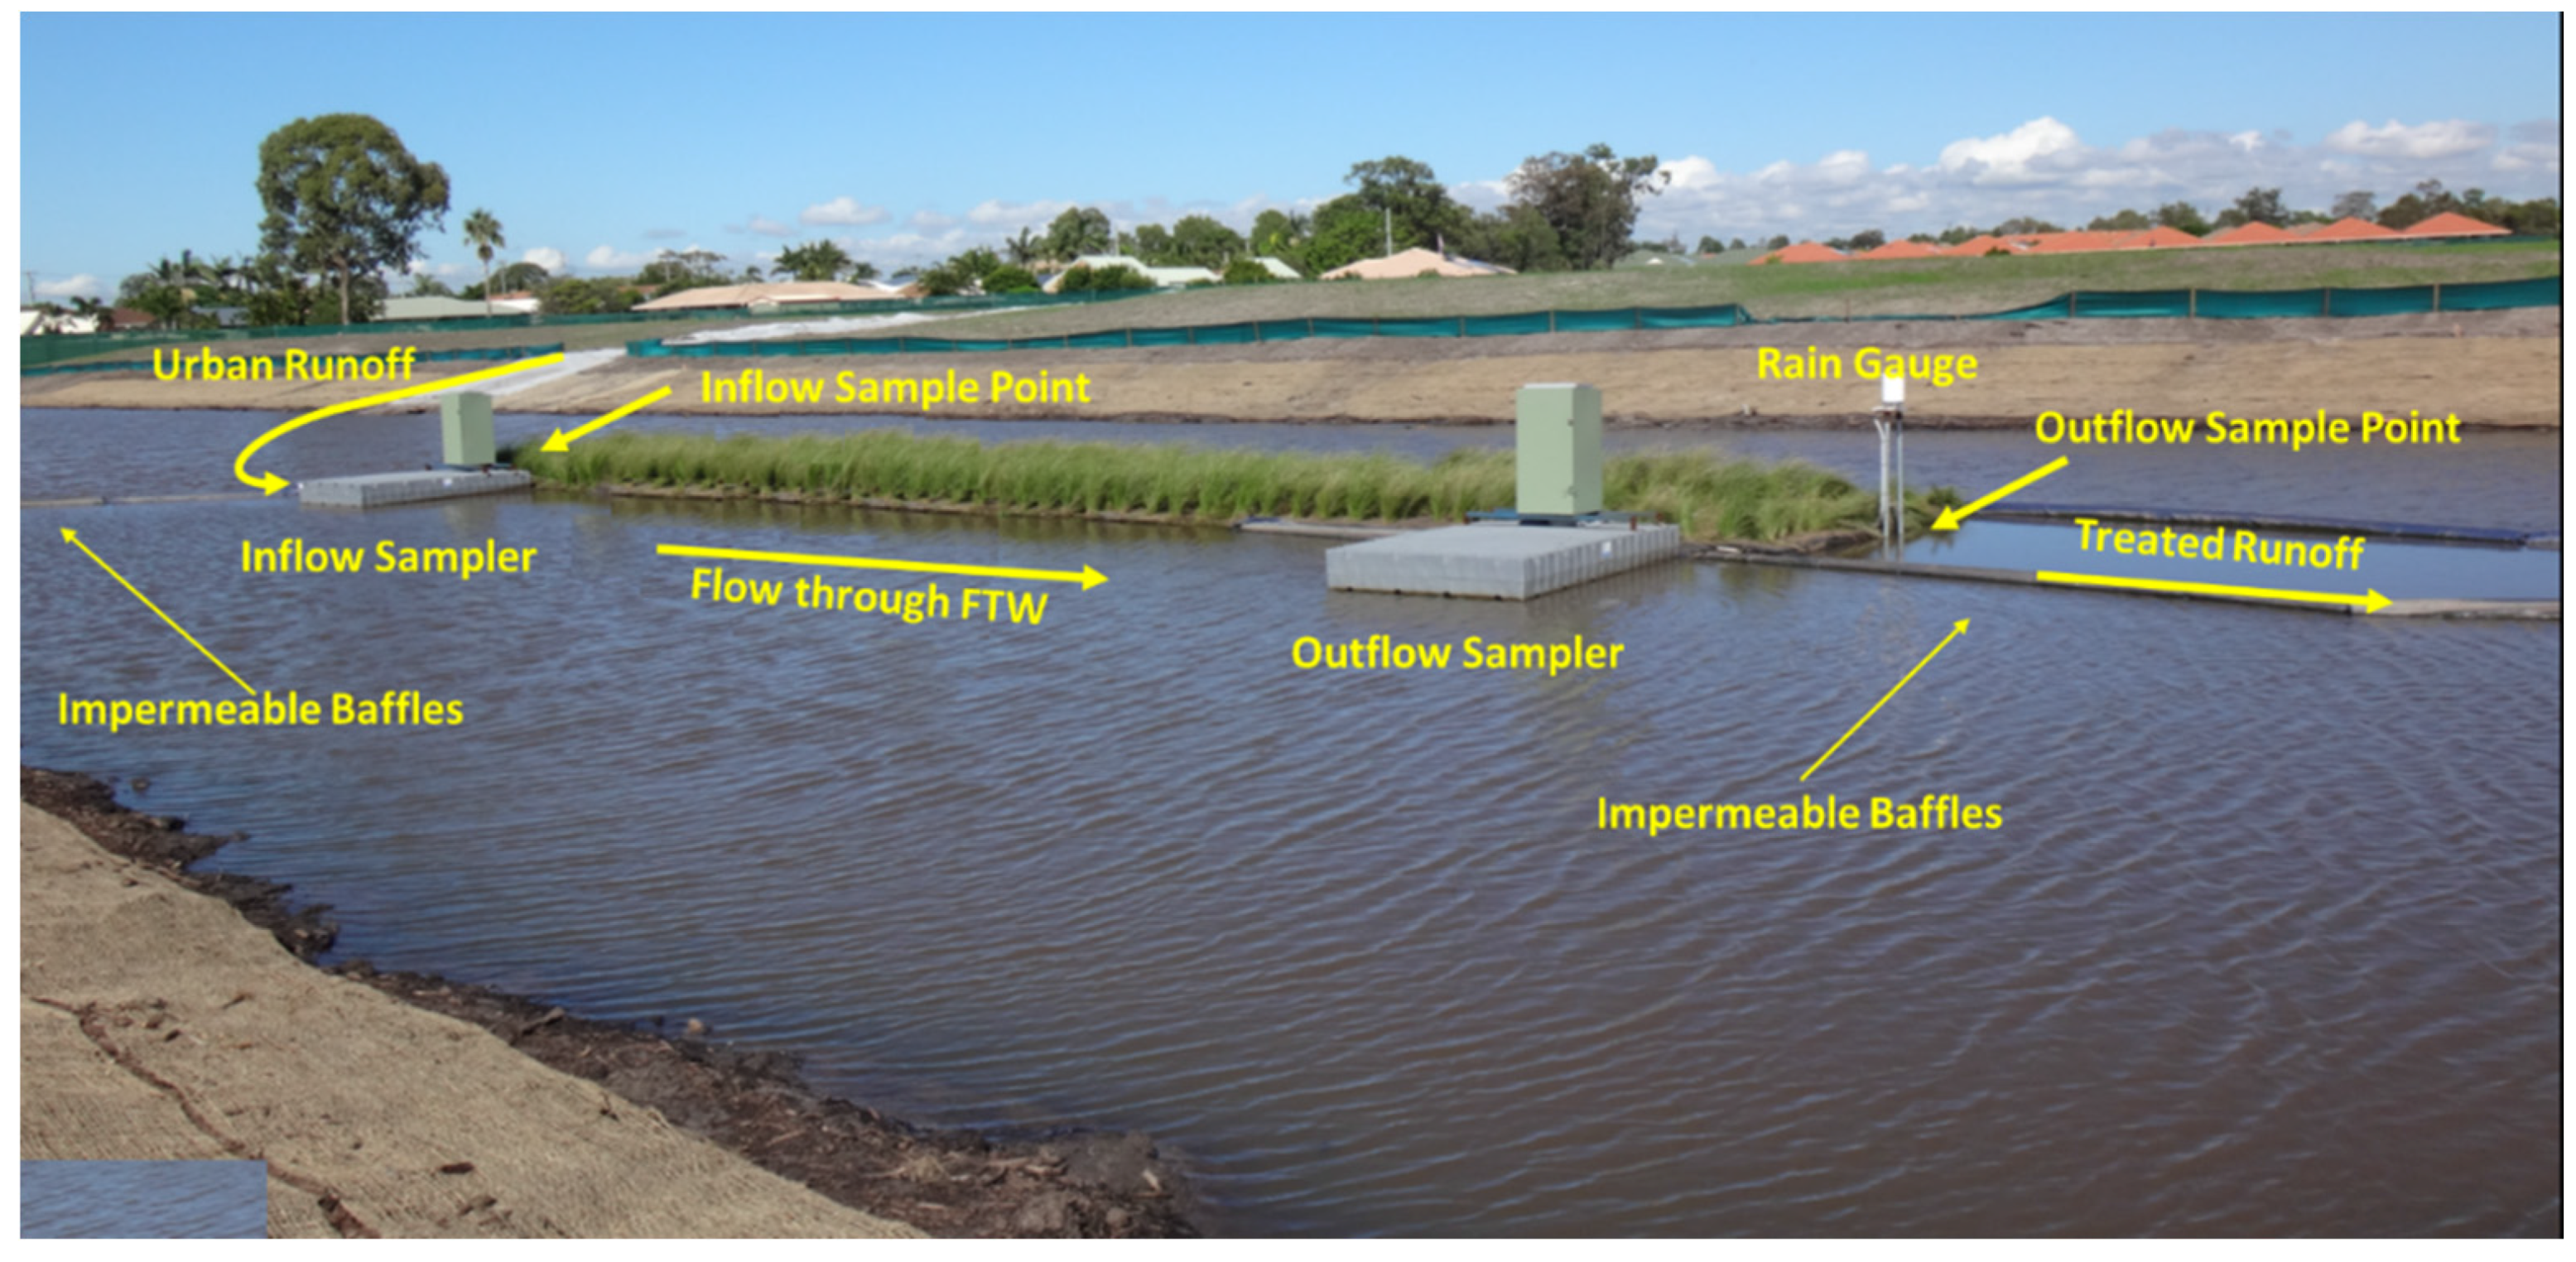
Rainfall and runoff from the catchment is directed via road kerb inlets (catch basins), and a piped drainage network to a stormwater channel leading to the lake containing the FTW. Flow from the channel was immediately directed to the FTW treatment zone with flexible, impermeable polyvinyl chloride (PVC) curtains which were secured to the sides of the FTW and the pond bed. This was done to prevent short-circuiting of the flows (a problem identified in previous studies). Water samples were taken at the FTW inlet and outlet points shown in Figure 4.
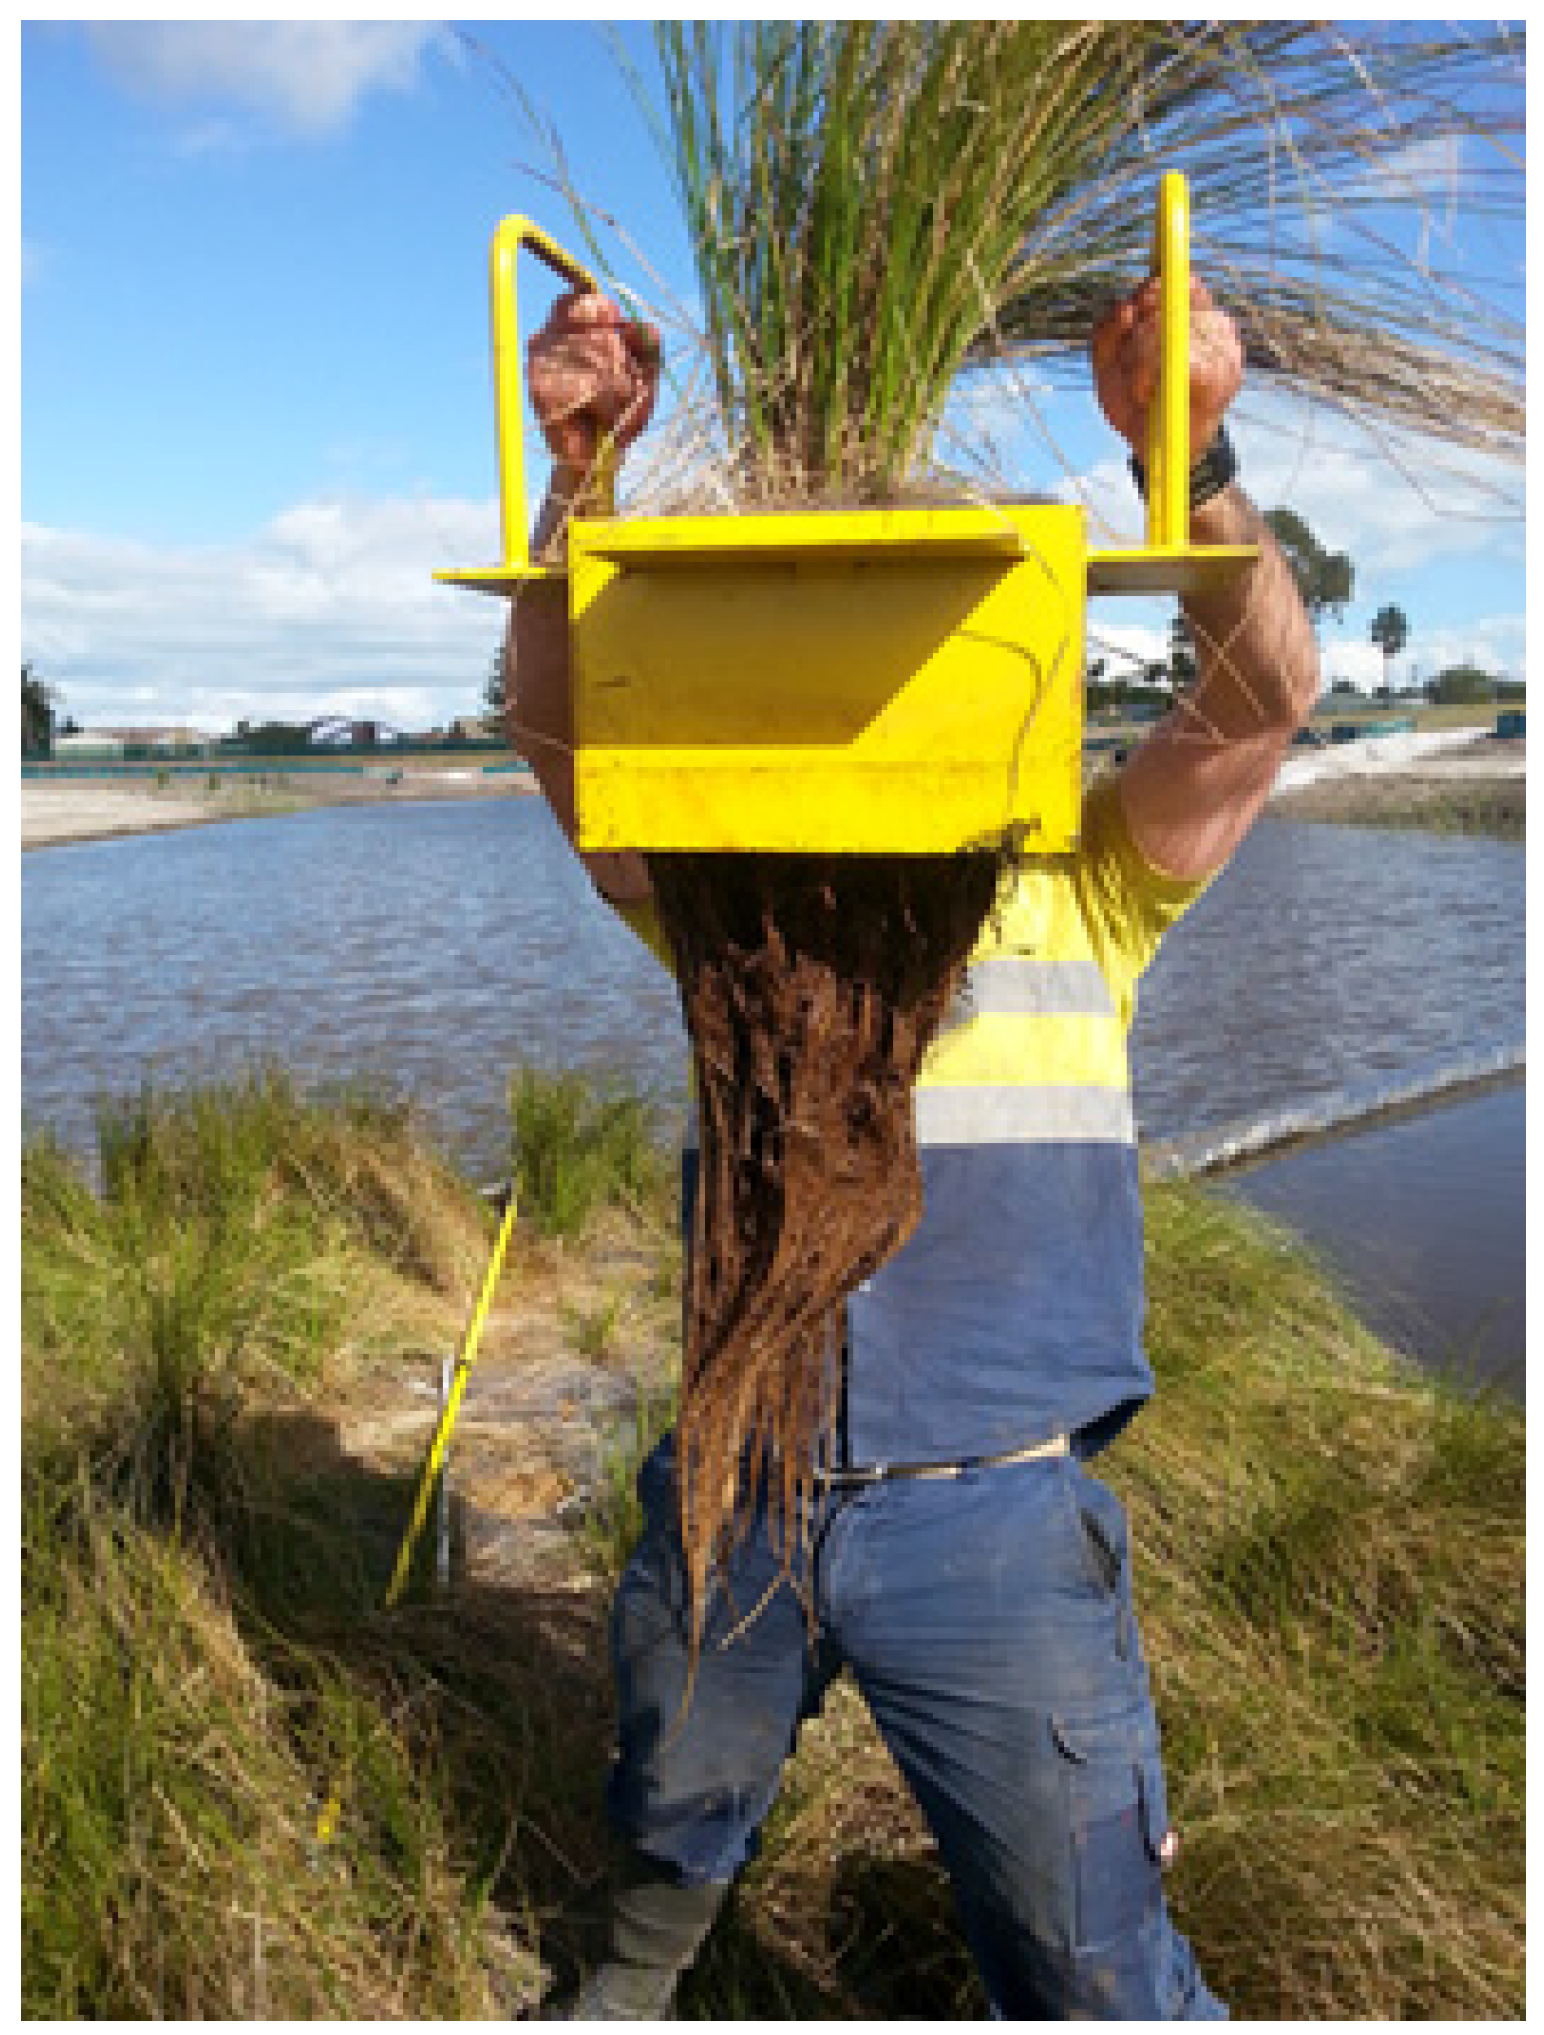
The modular FTW was constructed using four, 50 mm thick layers of recycled plastic fibre, with injected marine grade foam to provide buoyancy (Figure 4). This matrix was then covered with a natural coir mat, and initially planted out with a sedge mono-culture (Carex appressa) at a density of approximately three plants/m2. Each of the 11 individual FTW modules was 9.2 m2 in area (total area of 101 m2). The size of the forebay area during testing was 130 m2. Because of the installation of the impermeable baffles, the FTW covered 100% of the treated surface area. The overall size of the pond was 5048 m2.

3. Sampling Protocol and Methodology

A predetermined sampling protocol was used to identify qualifying rainfall events (Table 1). This protocol was developed in order to support an objective evaluation of the FTW pollution removal performance, which could be viewed as “representative performance” across the wide range of variable inflow pollution concentration likely to be experienced by the FTW in an urban residential setting. This protocol was developed based on the protocol methodology prescribed by the United States Environmental Protection Agency’s (USEPA) Stormwater BMP Monitoring Manual [17] and Auckland Regional Council’s Proprietary Device Evaluation Protocol (PDEP) for Stormwater Quality Treatment Devices [18].
Automatic sampling equipment was triggered when a tipping bucket rain gauge recorded >2 mm rainfall in 30 min, and the flow meter (Starflow ultrasonic probe) simultaneously recorded >0.5 L/s. Samples were collected by the auto-samplers at 5000 L intervals thereafter until flow ceased. To account for the potential lag in flow beneath the FTW, a further two sub-samples were taken after flow had dropped below 0.5 L/s for 60 min. Sample aliquots (200 mL) were composited within the automatic sampler in a nine litre glass bottle for analysis.

Performance Metrics

A range of metrics were used in order to provide a representative performance evaluation to account for the highly-variable results that were expected in the study. These included: Event Mean Concentration (EMC) (Equation (1)), Concentration Removal Efficiency (CRE) (Equation (2)), and Efficiency Ratio (ER) (Equation (3)). The value of CRE as an effective metric has been reduced as a reliable metric since minor variation (±1 mg/L) observed in the analytical variability has significant influence on the metric at low influent concentrations, and so ER has been used as the primary metric in this study [19]. Prior to statistical testing, concentrations of TN and TP were log transformed (Equation (4)) to achieve normal distribution (Shapiro-Wilks p > 0.05 alpha).
E M C = i = 1 n V i C i i = 1 n V i
where: Vi = Volume of flow during period I, Ci = Concentration associated with period I, n = Total number of aliquots collected during event.
Avg.CRE = [ EMC in E M C o u t E M C i n ] n o .   o f   e v e n t s
E R = M e a n   E M C o u t M e a n   E M C i n
X = log 10   ( X + 1 )
The average reduction of pollutant mass was calculated using a Sum of Load equation, based on pollutant loads from multiple storm events. The Sum of Loads for both influent and effluent samples was calculated using Equation (5).
M = i 1 n V i C i
where: M = total mass of pollutant (kg), Vi = discharge amount corresponding to sample I (m3 or L), Ci = pollutant concentration in sample I (mg/L), i = sample number.
Calculations to estimate the number of samples required for statistical validation given the high variability in the data followed Burton and Pitt [20] (Equation (6)).
n = 2 [ Z 1 α + Z 1 β μ 1 μ 2 ] 2 σ 2
where: n = number of sample pairs needed; α = false positive rate (1 − α is the degree of confidence. A value of α of 0.05 is usually considered statistically significant, corresponding to a 1 − α degree of confidence or 95%); β = false negative rate (1 − β is the power. If used, a value of β of 0.2 is common but it is frequently ignored, corresponding to a β of 0.5); Z1 − α = Z score (associated with area under normal curve) corresponding to 1 − α; Z1 − β = Z score corresponding to 1 − β value; µ1 = mean of dataset one; µ2 = mean of dataset two; σ = standard deviation (same for both datasets, assuming normal distribution).

4. Results and Discussion

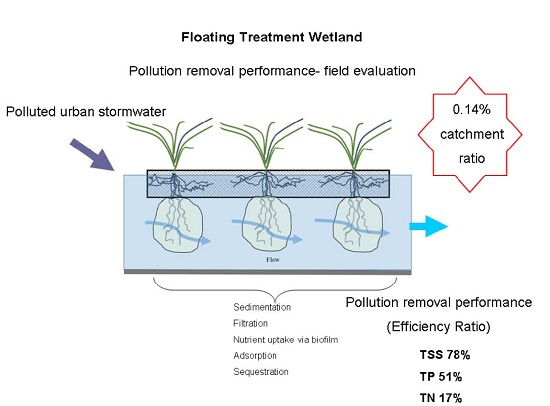
During twelve months of monitoring, 10 qualifying events were recorded (Table 2 and Table 3) with rainfall depths ranging between 2.0 mm and 25.6 mm. As expected, the observed pollution removal efficiencies were highly-variable between individual rainfall events for the parameters measured. The measured pollution removal performance (ER) of the FTW was calculated to be 80% for TSS, 53% for TP, and 17% for TN (Table 2. These removal rates are encouraging when compared to findings of previous stormwater FTW pond studies [11,12,13,14]. The improved removal rates are believed to be the result of the unique experimental design that excluded potential short-circuiting and specifically focused on evaluating the pollution removal performance of the field-scale FTW alone, rather than as part of a stormwater treatment train. The calculated pollution removal proportions from outflows were found to be less than the values specified by the local Queensland State Planning Policy and regulations (TSS 80%, TP 60%, and TN 45%) [21], and this is likely a reflection of the small FTW footprint as a percentage of the contributing catchment [22]. Calculations of the ER for TN were particularly variable. This may have been due to very low pollution influent concentrations during some of the qualifying events and the strong dependence of nutrient removal rate on loading rate as found in previous studies [11].
Rainfall, peak flow rates and cumulative flow volumes were used to calculate the Sum of Loads for evaluating the performance of the FTW in removing pollution loads from urban stormwater from the study site (Table 4). The low load removal for TN is thought to be a result of the highly variable TN inflows. More qualifying sampling events (> 150) are required to fully incorporate this variability.
A paired Student’s t test (log transformed data) was performed to test for differences between inflow and outflow pollution concentrations. The results showed that TSS and TP outflow concentrations were significantly lower than inflow concentrations (p < 0.05) (Table 5).
These results demonstrate how highly-variable environmental data may require very large datasets to establish pollution removal efficiencies that are statistically significant using the traditional calculations [22]. Equation (6) was used to estimate the number of samples required to ensure a statistical relevant result (Table 6).
An estimated 23-year period would be required to adequately demonstrate statistical significance for the results of the full range of parameters investigated in this study (Table 6). Given the high establishment and running costs of research projects such as this, and the low proportion of qualifying events arising from natural rainfall that were able to be successfully sampled (<20%), this time frame was considered to be unrealistic.

5. Conclusions

This research investigated the pollution removal performance of a FTW receiving stormwater runoff from a 7.46 ha urban residential catchment. The FTW installation (101 m2) was sized as approximately 0.14% of the contributing catchment. The FTW was initially planted with a sedge mono-culture (Carex appressa). The installation of impermeable baffles ensured the FTW covered 100% of the water treatment zone, and also prevented short-circuiting of the flows.
As anticipated, there was a high degree of variation in FTW treatment performance between individual rainfall events. Overall Efficiency Ratio was calculated to be 80% TSS removal, 53% TP removal and 17% TN removal for a FTW footprint of 0.14% of the contributing catchment. TSS and TP outflow concentrations were found to be significantly reduced after FTW treatment (p < 0.05). Sum of loads calculations based on flow resulted in pollution load reductions of TSS 76%, TP 55%, and TN 17%. Treatment performance (particularly for TN) was found to be affected by very low and highly variable inflow concentrations. Because of this high degree of variability, an estimated 23-year period would be required to adequately demonstrate statistical significance for the full range of parameters investigated in this study.
This study has demonstrated that FTWs are an effective treatment solution for the removal of pollution from urban stormwater runoff, though may need to be larger than 0.14% of the contributing catchment to achieve 80% TSS, 60% TP and 45% TN locally regulated water quality objectives. Using a simple linear assumption mathematical model, the minimum proportional size of the FTW to catchment required to achieve the required pollution removal rates was calculated to be 0.37% or at this site, 124 m2. As FTWs do not require additional earthworks or land uptake, they may also offer pollution removal at substantially lower costs than other more traditional treatment options. It is expected that the performance of FTWs could be even further improved when used in conjunction with additional treatment components as part of a “treatment train” approach.
Given the potential for FTWs to successfully treat stormwater runoff and the few reported field studies specifically relating the performance of FTWs and nutrient removal [9,10], this study makes a notable contribution to the current body of knowledge in this area. The Stormwater Research Group University of the Sunshine Coast currently has a number of additional study trials underway which are investigating the long-term pollution removal performance of FTW systems in urban settings. It is anticipated that the effective pollution removal performance of FTWs will be clearly demonstrated in future as more results from these ongoing studies are evaluated.

Acknowledgments

The authors acknowledge the contribution to this research by Kristin Reeves, Renee Melis, Troy Mansinger, Ty Wardner, Clint Mead, Andy Hornbuckle and Cameron Hales. The authors also acknowledge the officers at Moreton Bay Regional Council for their support, and willingness to facilitate the field test of FTWs in Australia.

Author Contributions

All authors have contributed equally to the research project, and preparation of this article.

Conflicts of Interest

The research was undertaken by the Stormwater Research Group at the University of the Sunshine Coast under a research funding agreement with SPEL Environmental Pty Ltd.

References

  1. Hogg, E.H.; Wein, R.W. The contribution of Typha components to floating mat buoyancy. Ecology 1988, 69, 1025–1031. [Google Scholar] [CrossRef]
  2. Mitsch, W.J.; Gosselink, J.G. Wetlands; Van Nostrand Reinhold: New York, NY, USA, 1993. [Google Scholar]
  3. Hoeger, S. Schwimmkampen: Germany’s artificial floating islands. J. Soil Water Conserv. 1988, 43, 304–306. [Google Scholar]
  4. Burgess, N.D.; Hirons, G.J. Creation and management of artificial nesting sites for wetland birds. J. Environ. Manag. 1992, 34, 285–295. [Google Scholar] [CrossRef]
  5. Smith, M.P.; Kalin, M. Floating wetland vegetation covers for suspended solids removal, in Treatment Wetlands for Water Quality Improvement. In Proceedings of the Quebec 2000 Conference, Quebec City, QC, Canada, 6–12 August 2000; CH2MHILL: Quebec City, QC, Canada, 2000. [Google Scholar]
  6. Dunlop, C.L.; Blokpoel, H.L.; Jarvie, S. Nesting rafts as a management tool for a declining common tern (Sterna hirundo) colony. Colonial Waterbirds 1991, 14, 116–120. [Google Scholar] [CrossRef]
  7. Lundholm, J.T.; Simser, W.L. Regeneration of submerged macrophyte populations in a disturbed Lake Ontario coastal marsh. J. Gt. Lakes Res. 1999, 25, 395–400. [Google Scholar] [CrossRef]
  8. Kerr-Upal, M.; Seasons, M.; Mulamoottil, G. Retrofitting a stormwater management facility with a wetland component. J. Environ. Sci. Health 2000, 35, 1289–1307. [Google Scholar] [CrossRef]
  9. Headley, T.R.; Tanner, C.C. Floating treatment wetlands: An innovative option for stormwater quality applications. In Proceedings of the 11th International Conference on Wetland Systems for Water Pollution Control, Indore, India, 1–7 November 2008.
  10. Tanner, C.C.; Sukias, J.; Park, J.; Yates, C.; Headley, T.R. Floating Treatment Wetlands: A new tool for nutrient management in lakes and waterways. Methods 2011, 2008, 2011. [Google Scholar]
  11. Borne, K.E. Floating treatment wetland influences on the fate and removal performance of phosphorus in stormwater retention ponds. Ecol. Eng. 2014, 69, 76–82. [Google Scholar] [CrossRef]
  12. Borne, K.E.; Fassman, E.A.; Tanner, C.C. Floating treatment wetland retrofit to improve stormwater pond performance for suspended solids, copper and zinc. Ecol. Eng. 2013, 54, 173–182. [Google Scholar] [CrossRef]
  13. Borne, K.; Fassman-Beck, E.; Tanner, C. Floating Treatment Wetland influences on the fate of metals in road runoff retention ponds. Water Res. 2014, 48, 430–442. [Google Scholar] [CrossRef] [PubMed]
  14. Bartucca, M.L.; Mimmo, T.; Cesco, S.; Del Buono, D. Nitrate removal from polluted water by using a vegetated floating system. Sci. Total Environ. 2016, 542, 803–808. [Google Scholar] [CrossRef] [PubMed]
  15. Winston, R.J.; Hunt, W.F.; Kennedy, S.G.; Merriman, L.S.; Chandler, J.; Brown, D. Evaluation of floating treatment wetlands as retrofits to existing stormwater retention ponds. Ecol. Eng. 2013, 54, 254–265. [Google Scholar] [CrossRef]
  16. Stewart, F.M.; Mulholland, T.; Cunningham, A.B.; Kania, B.G.; Osterlund, M.T. Floating islands as an alternative to constructed wetlands for treatment of excess nutrients from agricultural and municipal wastes-results of laboratory-scale tests. Land Contam. Reclam. 2008, 16, 25–33. [Google Scholar] [CrossRef]
  17. Technical Guidance Manual for Evaluating Emerging Stormwater Treatment Technologies, Technology Assessment Protocol-Ecology (TAPE); Washington Department of Ecology: Washington, WA, USA, 2011.
  18. Wong, G. Proprietary Devices Evaluation Protocol (PDEP) for Stormwater Quality Treatment Devices; Auckland Regional Council: Auckland, New Zealand, 2012. [Google Scholar]
  19. Lenhart, H.A.; Hunt, W.F. Evaluating four storm-water performance metrics with a North Carolina Coastal Plain storm-water wetland. J. Environ. Eng. 2011, 137, 155–162. [Google Scholar] [CrossRef]
  20. Burton, A.; Pitt, R. Stormwater Effects Handbook: A Toolbox for Watershed Managers, Scientists and Engineers. 2015. Available online: http://unix.eng.ua.edu/~rpitt/Publications/BooksandReports/ (accessed on 6 June 2016).
  21. State Planning Policy; State of Queensland: Brisbane, Australia, 2013.
  22. Nichols, P.; Lucke, T.; Drapper, D. Field and Evaluation Methods Used to Test the Performance of a Stormceptor® Class 1 Stormwater Treatment Device in Australia. Sustainability 2015, 7, 16311–16323. [Google Scholar] [CrossRef]
Figure 1. Specially fabricated removable planter boxes to assess root length.
Water 08 00244 g001
Figure 2. Schematic of Floating Treatment Wetland (FTW) system.
Water 08 00244 g002
Figure 3. (a) Bribe Island location; (b) Study site catchment area.
Water 08 00244 g003
Figure 4. FTW experimental setup.
Water 08 00244 g004
Table 1. Sampling protocol.
ParameterBribie Lakes
Minimum storm duration5 min
Catchment typeUrban Residential
Stormwater treatment device typeFloating Treatment Wetlands (101.2 m2) (variable water depth, 1.5 m)
Desired number of valid sampling events15
Minimum rainfall depth2.0 mm
Minimum antecedent dry period6 h, depending on influent concentrations
Minimum hydrograph samplingFirst 60% of hydrograph
Desired number of water sub-samplesMinimum 8 influent and 8 effluent subsamples per event
Sampling methodAuto-sampler (ISCO), flow-weighted in 5000 L intervals
Data managementCampbell Scientific CR800 Data logger with Ethernet Modem
Total suspended solids (TSS)APHA (2005) 2540 D
Total Nitrogen and speciesAPHA (2005) 4500 N, APHA (2005) 4500 NH3, APHA (2005) 4500 NO3
Total Phosphorus and OrthophosphateAPHA (2005) 4500 P
Note: APHA = American Public Health Association.
Table 2. FTW pollution removal performance.
Event DateParameterTSSTPTN
In (mg/L)Out (mg/L)In (mg/L)Out (mg/L)In (mg/L)Out (mg/L)
LOD (mg/L)Rain Depth (mm)10.0050.1
28 September 20152.0323510.280.11.000.25
23 October 20153.81140.030.020.700.30
7 November 201513.2414240.280.033.200.70
14 November 201516.626160.050.051.100.70
29 November 201512.4270280.140.022.201.30
30 January 20163.450260.040.041.102.20
1 February 201620.419360.040.070.801.60
6 February 201610.819240.050.030.600.80
13 February 201625.637190.050.031.402.10
6 March 20166.256150.100.111.201.10
Mean122.524.30.1060.051.331.105
Efficiency Ratio80%53%17%
Note: LOD, Limit of detection.
Table 3. FTW Rainfall volume and flow.
EventPeak Flow (L/s)Volume (kL)
28 September 2015 1
23 October 2015100279.3
7 November 20151340511.9
14 November 20152335531.0
29 November 20151160361.0
30 January 201624234.9
1 February 201693281.0
6 February 2016126611.6
13 February 2016320563.0
6 March 2016151148.6
Note: 1 Data not recorded.
Table 4. Sum of Loads.
TSSTPTN
76%55%17%
Table 5. Student’s t test (log-transformed) (α = 0.05).
FTWp-Value (Two-Tailed)
ParameterTSSTPTN
0.015 *0.042 *0.35
* Significant (p < 0.05).
Table 6. Number of samples required to ensure statistically relevant results.
ParameterTSSTPTN
Number of samples required2636150

