1. Introduction
Climate change is often measured by changes in the main climate variables, such as global surface air temperature and precipitation [
1]. Global climate model (GCM) projections of these variables show that the Earth will be warmer in the future [
2,
3,
4]. This implies an increasing rate of evapotranspiration, which could bring a distortion (imbalance) of water content in the atmosphere and surface water [
5]. Hence, studies of the impact of global climate change on different sectors (water resource management, agriculture and ecosystems) become an important scientific research area across the world besides their economic and social importance [
6,
7,
8]. This is because changes in precipitation and temperature have a direct impact on drought and flood occurrence [
9,
10,
11] and therefore, may have a serious impact on humans, infrastructure, and environment [
12,
13].
According to [
12] the definition of drought is categorized into four concepts: meteorological, hydrological, agricultural, and socioeconomic. The first three definitions are related to physical phenomena and climate variables [
14,
15]. The last is based on water supply and demand through socioeconomic systems. The concepts behind the first three categories are similar; a drought is defined as an extended period of abnormally dry weather, sufficiently prolonged for the lack of water to cause a serious hydrologic imbalance (
i.e., precipitation deficit, soil moisture deficit, water level decline, water supply shortage,
etc.) in the affected area [
16] and is caused mainly by a lack of precipitation and rise air temperature (high evapotranspiration), and depletion of soil moisture level over a long time period [
17,
18].
In the future both precipitation and evapotranspiration are expected to change with global warming at different scales across the globe. Many researchers in Poland have studied historical drought characteristics [
19,
20,
21], the relationship between the state of the atmosphere and the occurrence of meteorological drought [
22,
23] and drought changes in the future using different climate model projections [
24]. A review of these and many other similar studies indicates that the relative precipitation index (RPI), the effective drought index (EDI), the standardized precipitation index (SPI) and the climatic water balance (CWB) methods have been employed for the identification of historical drought and the estimation of future drought conditions in Poland. The SPI method has been the favoured choice of most studies due to its simplicity. According to [
24,
25], an increase in temperature and changes in rainfall are expected in future in Poland, which might have a strong impact on different sectors (water resource, agriculture, health). However, the idea that increased evaporative demand in a warmer world might enhance drought has been missed in Polish research. This issue is relevant not only to Polish research but also globally. Little has been done to quantify and explicitly separate the relative contribution of changes in precipitation and evaporative demand to the magnitude and extent of global warming-induced drought [
14]. Therefore, using the standardized precipitation Index (SPI), standardized precipitation evapotranspiration index (SPEI) and standardized runoff index (SRI) can lead to understanding the effects separately,
i.e., the SPI might help us to understand the implications of precipitation for meteorological drought conditions in the selected catchments, the SPEI also considers the evapotranspiration, whereas the SRI considers the catchment dynamics [
26,
27].
The use of drought indices which include precipitation, air temperature, evapotranspiration and flow data in their formulation (such as the SPI, SPEI and indirectly, SRI) might be preferable for applications involving future climate scenarios [
27]. These types of indices are essential for assessing drought in relation to different hydrological systems, and differentiating among different drought conditions. The SPI, SPEI, and SRI indices are used for detecting, monitoring and exploring the consequences of climate change on drought conditions [
26,
28,
29].
The aims of this paper are: (i) to compare SPI, SPEI and SRI indices in order to evaluate their ability to describe historical drought, including the transformation of meteorological drought into hydrological drought and the spatial characteristics of both, (ii) to investigate how drought is expected to change in the 21th century, using the SPI, SPEI and SRI drought indices and the newest source of climate projections (EURO-CORDEX initiative) for ten catchments in Poland. These aims are novel in respect of the use of data from EURO-CORDEX in Poland and the development and comparison of SPI, SPEI and SRI projections into the 21st century in Polish catchments.
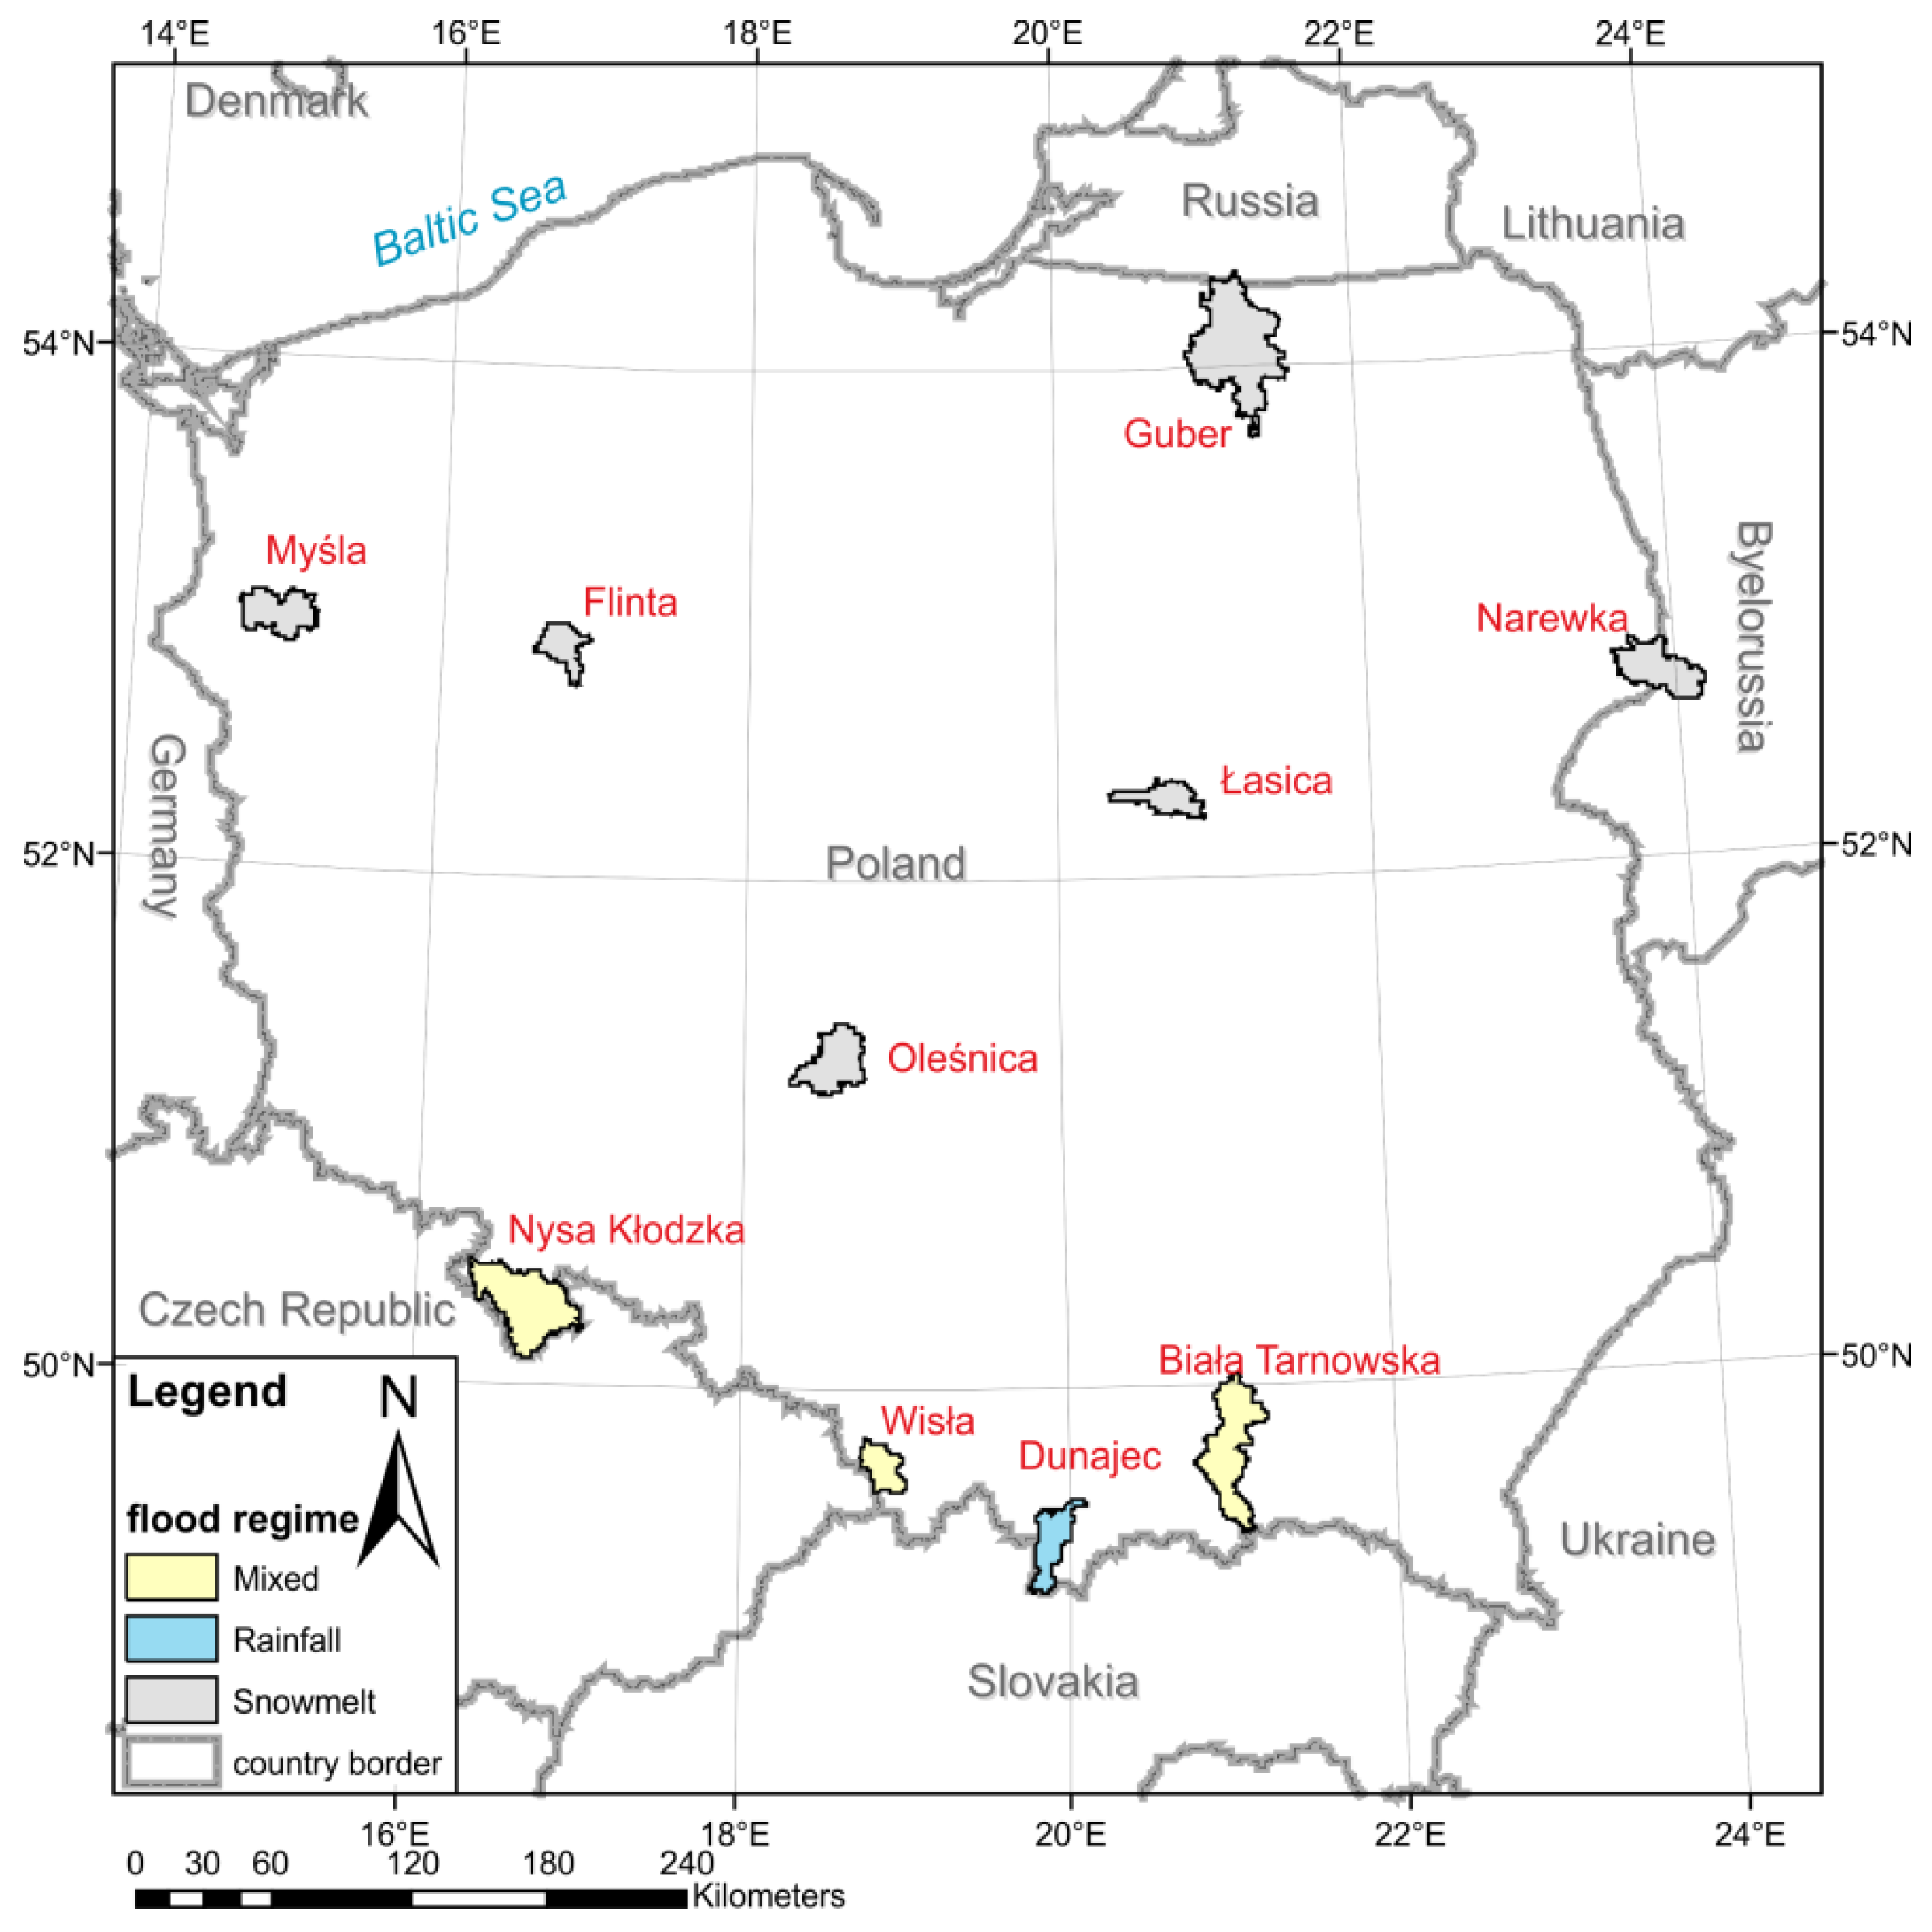
A description of the study area and the hydro-climatic characteristics of the selected catchments and input data are included in
Section 2.
Section 3 presents the applied drought indices SPI, SPEI, and SRI. The results of drought projections using seven RCM/GCM climate models are presented in
Section 4. Finally, we summarize the results and conclude our research findings in
Section 5.
5. Discussion and Conclusions
The drought occurrence is influenced by changes in air temperature and precipitation. Those issues motivate further research on understanding and quantifying drought characteristics and the consequences for surface water, river flow, agricultural production, the hydrologic cycle, and ecosystems for the future. The study has provided a discussion on changes in three hydro-meteorological drought indices, SPI-12, SPEI-12 and SRI-12, due to climate change in ten catchments in Poland, in the 21st century. The catchments have different hydro-climate conditions and soil water holding capacity.
The SPI-12 is based on precipitation, the SPEI-12 and SRI-12 follow an approach similar to that of the SPI but the first takes into account losses due to the potential evapotranspiration and the second is based on river discharge. The SRI-12 has the largest potential for identifying hydrological drought in the catchment. However, its projections in future climate conditions are based on hydrological model simulations, which increases the uncertainty of its estimates. In this study we applied the HBV hydrological model to derive future flow projections.
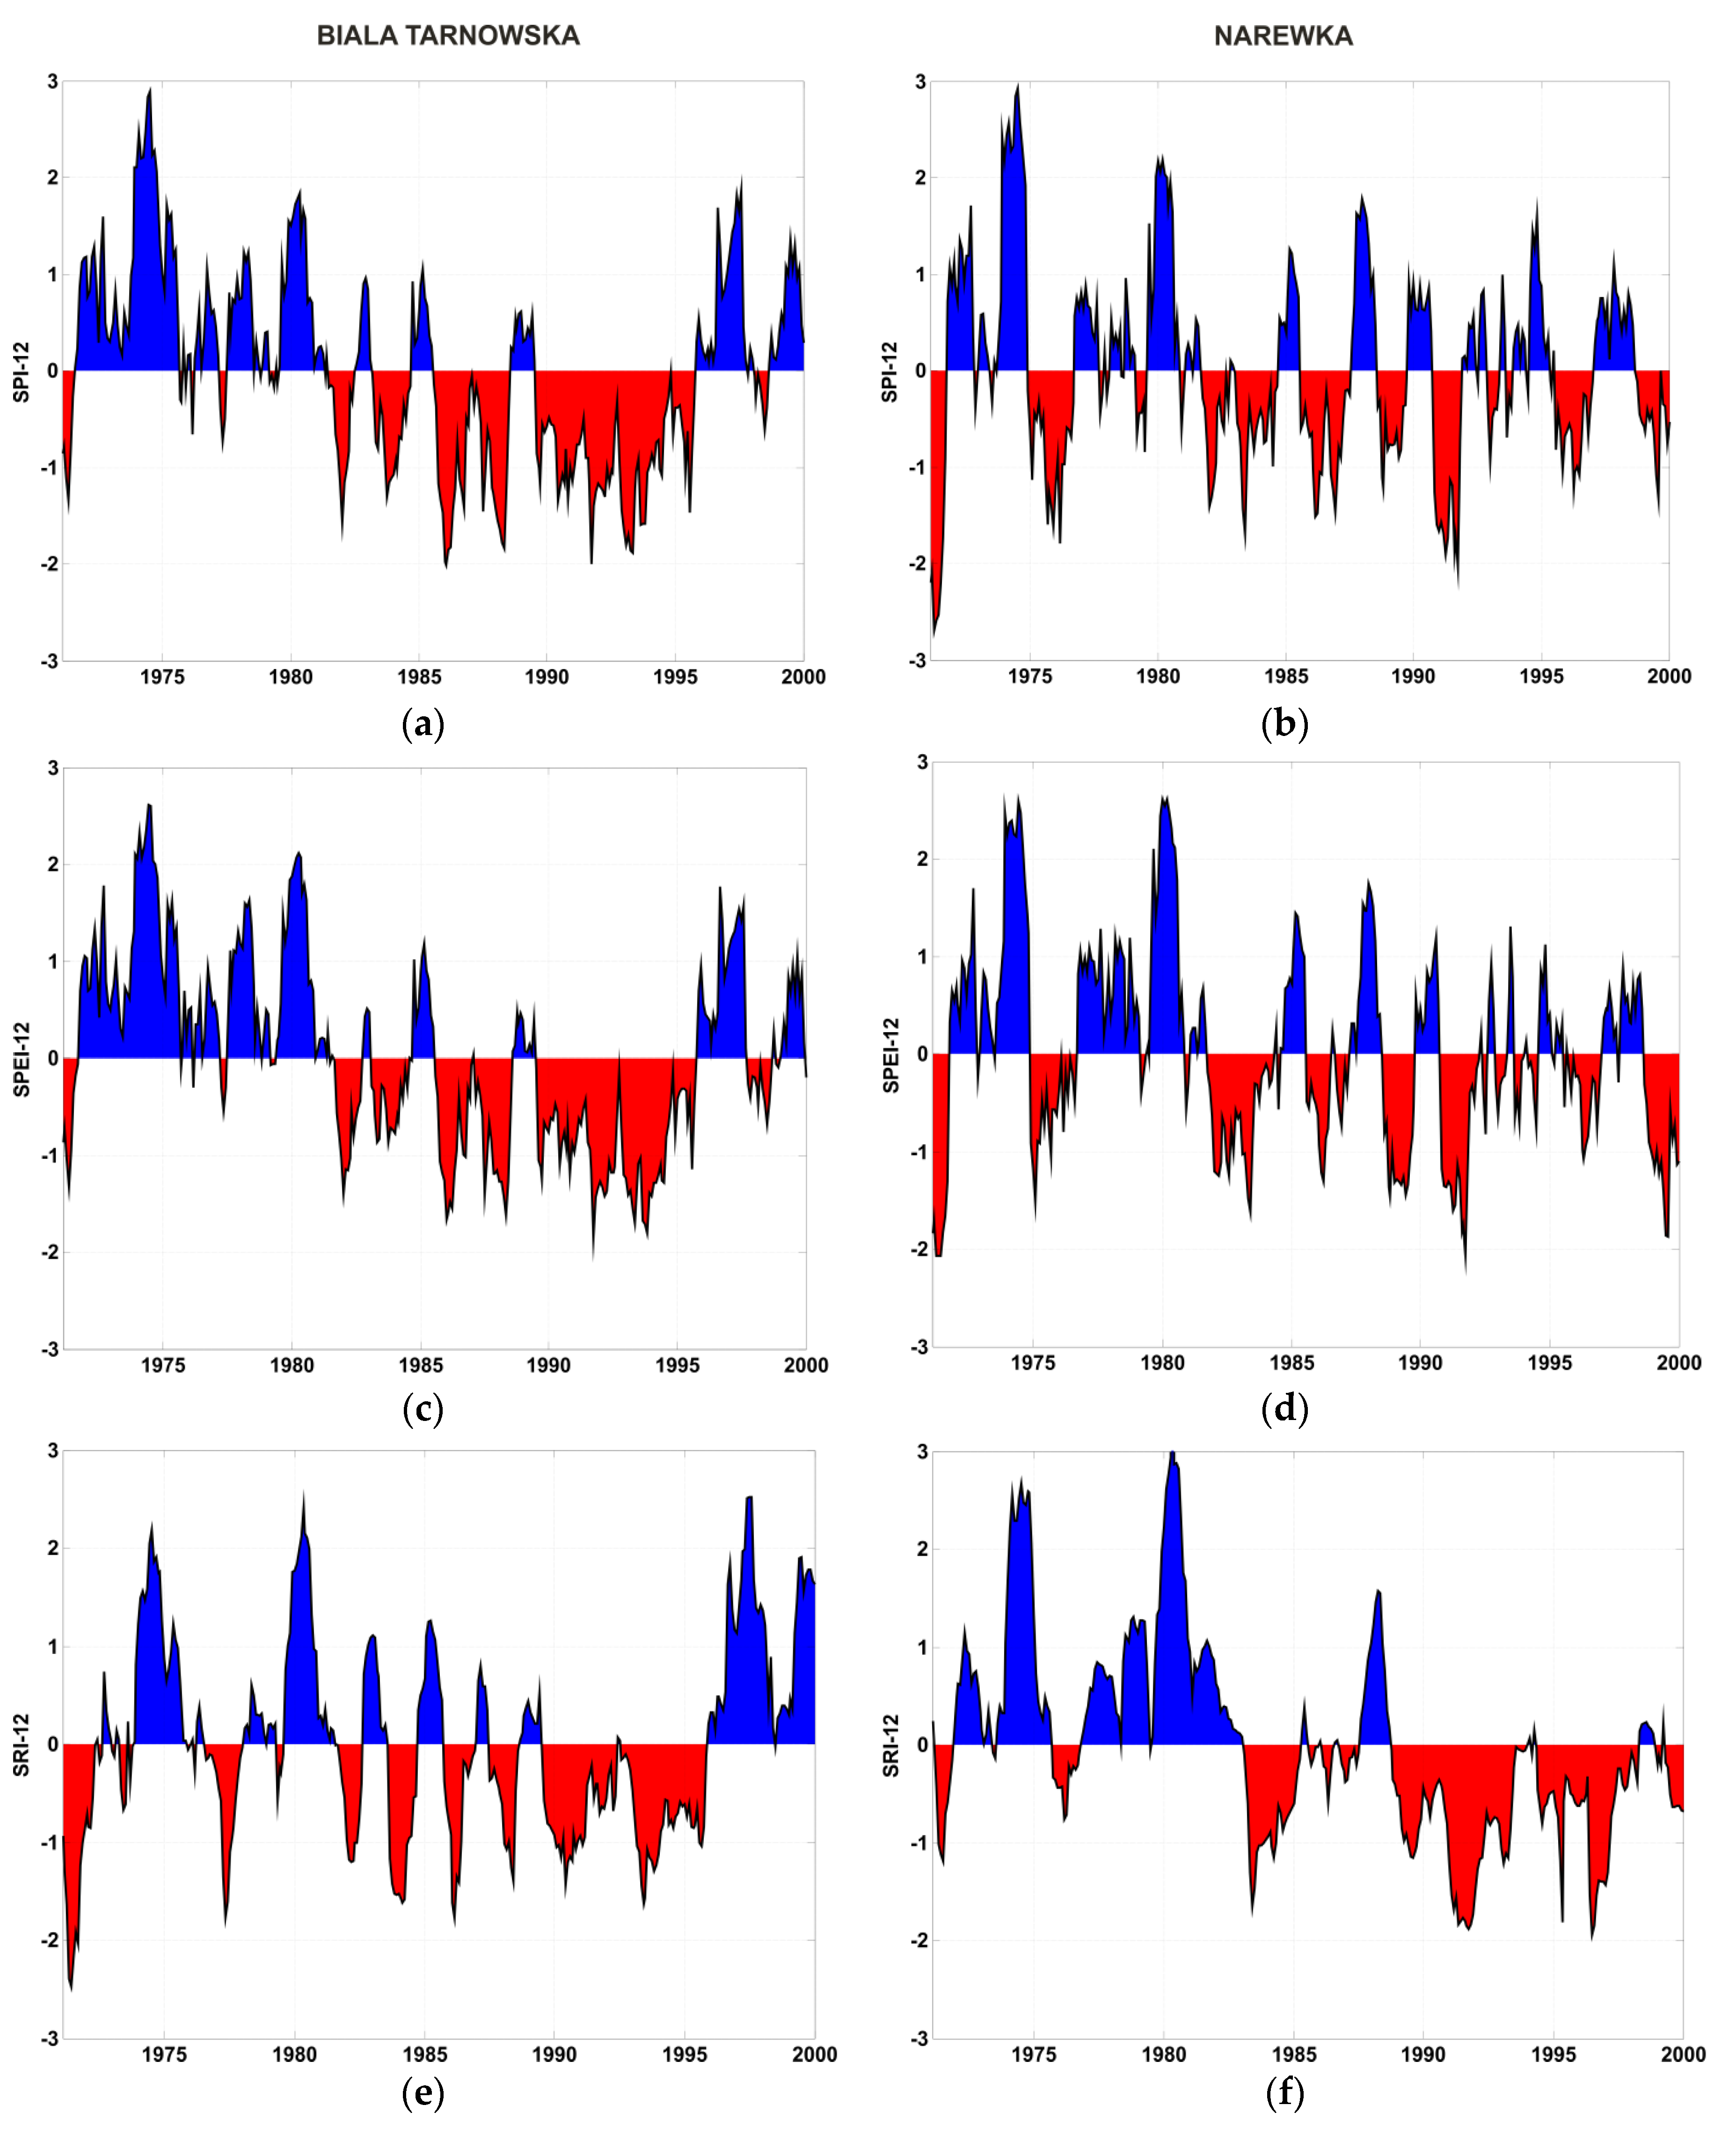
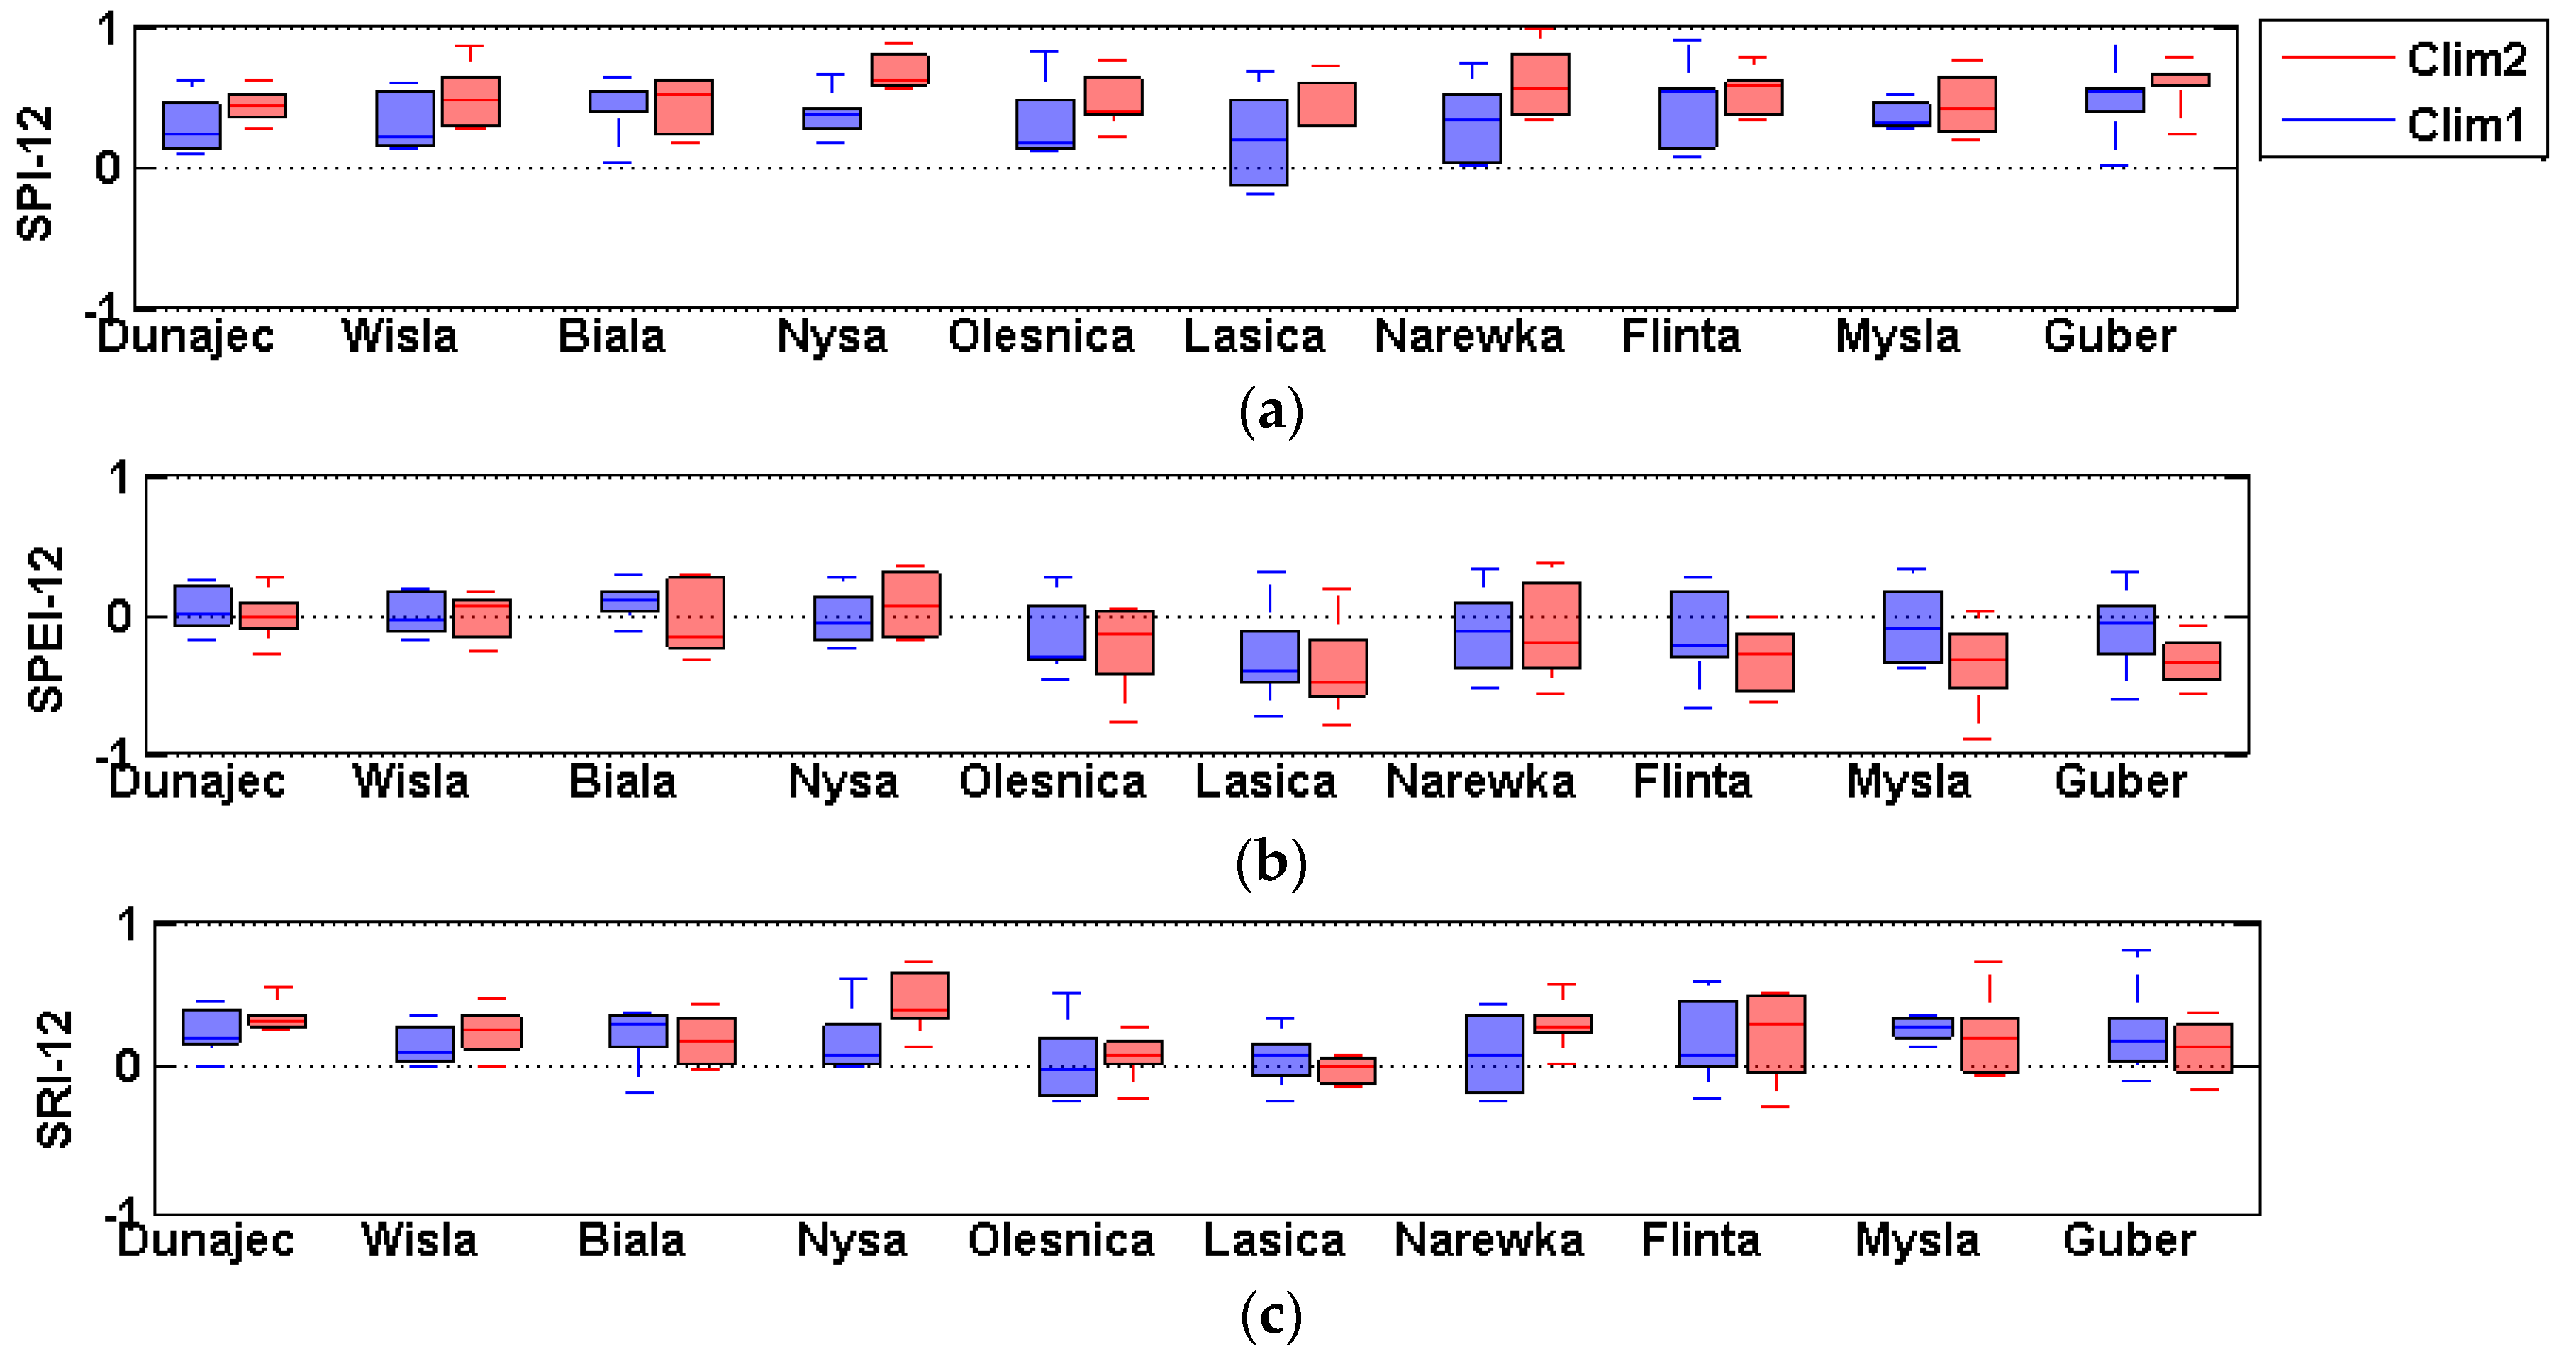
The discussion was conducted in two stages. At first, the differences and similarities between the three drought indices, namely SPI-12, SPEI-12 and SRI-12, (indices with twelve month accumulation period) were assessed using observations of temperature, precipitation and flow from the reference period 1971–2000. At this stage the consistency of the drought indices studied was also tested. A comparison of the temporal patterns of the indices was performed using as an example two geomorphologically different catchments, Biała Tarnowska and Narewka. The indices show consistency in drought assessment but only SRI-12 was able to reproduce the transformation of meteorological drought into hydrological drought. SPI-12 and SPEI-12 give very similar assessments of catchment dryness and/or wetness in both catchments, whilst the SRI-12 results depend on the catchment. In Narewka (a lowland catchment) the SRI-12 shows a more pronounced drought than the two other indices, whilst for Biała Tarnowska (a mountainous catchment) the simulations of all three indices are similar. Narewka has a larger water storage capacity than Biała Tarnowska, which results in differences in the SRI-12 estimates. The spatial characteristics of the indices for the ten catchments were studied using the Pearson correlation coefficient (
Table 4,
Table 5 and
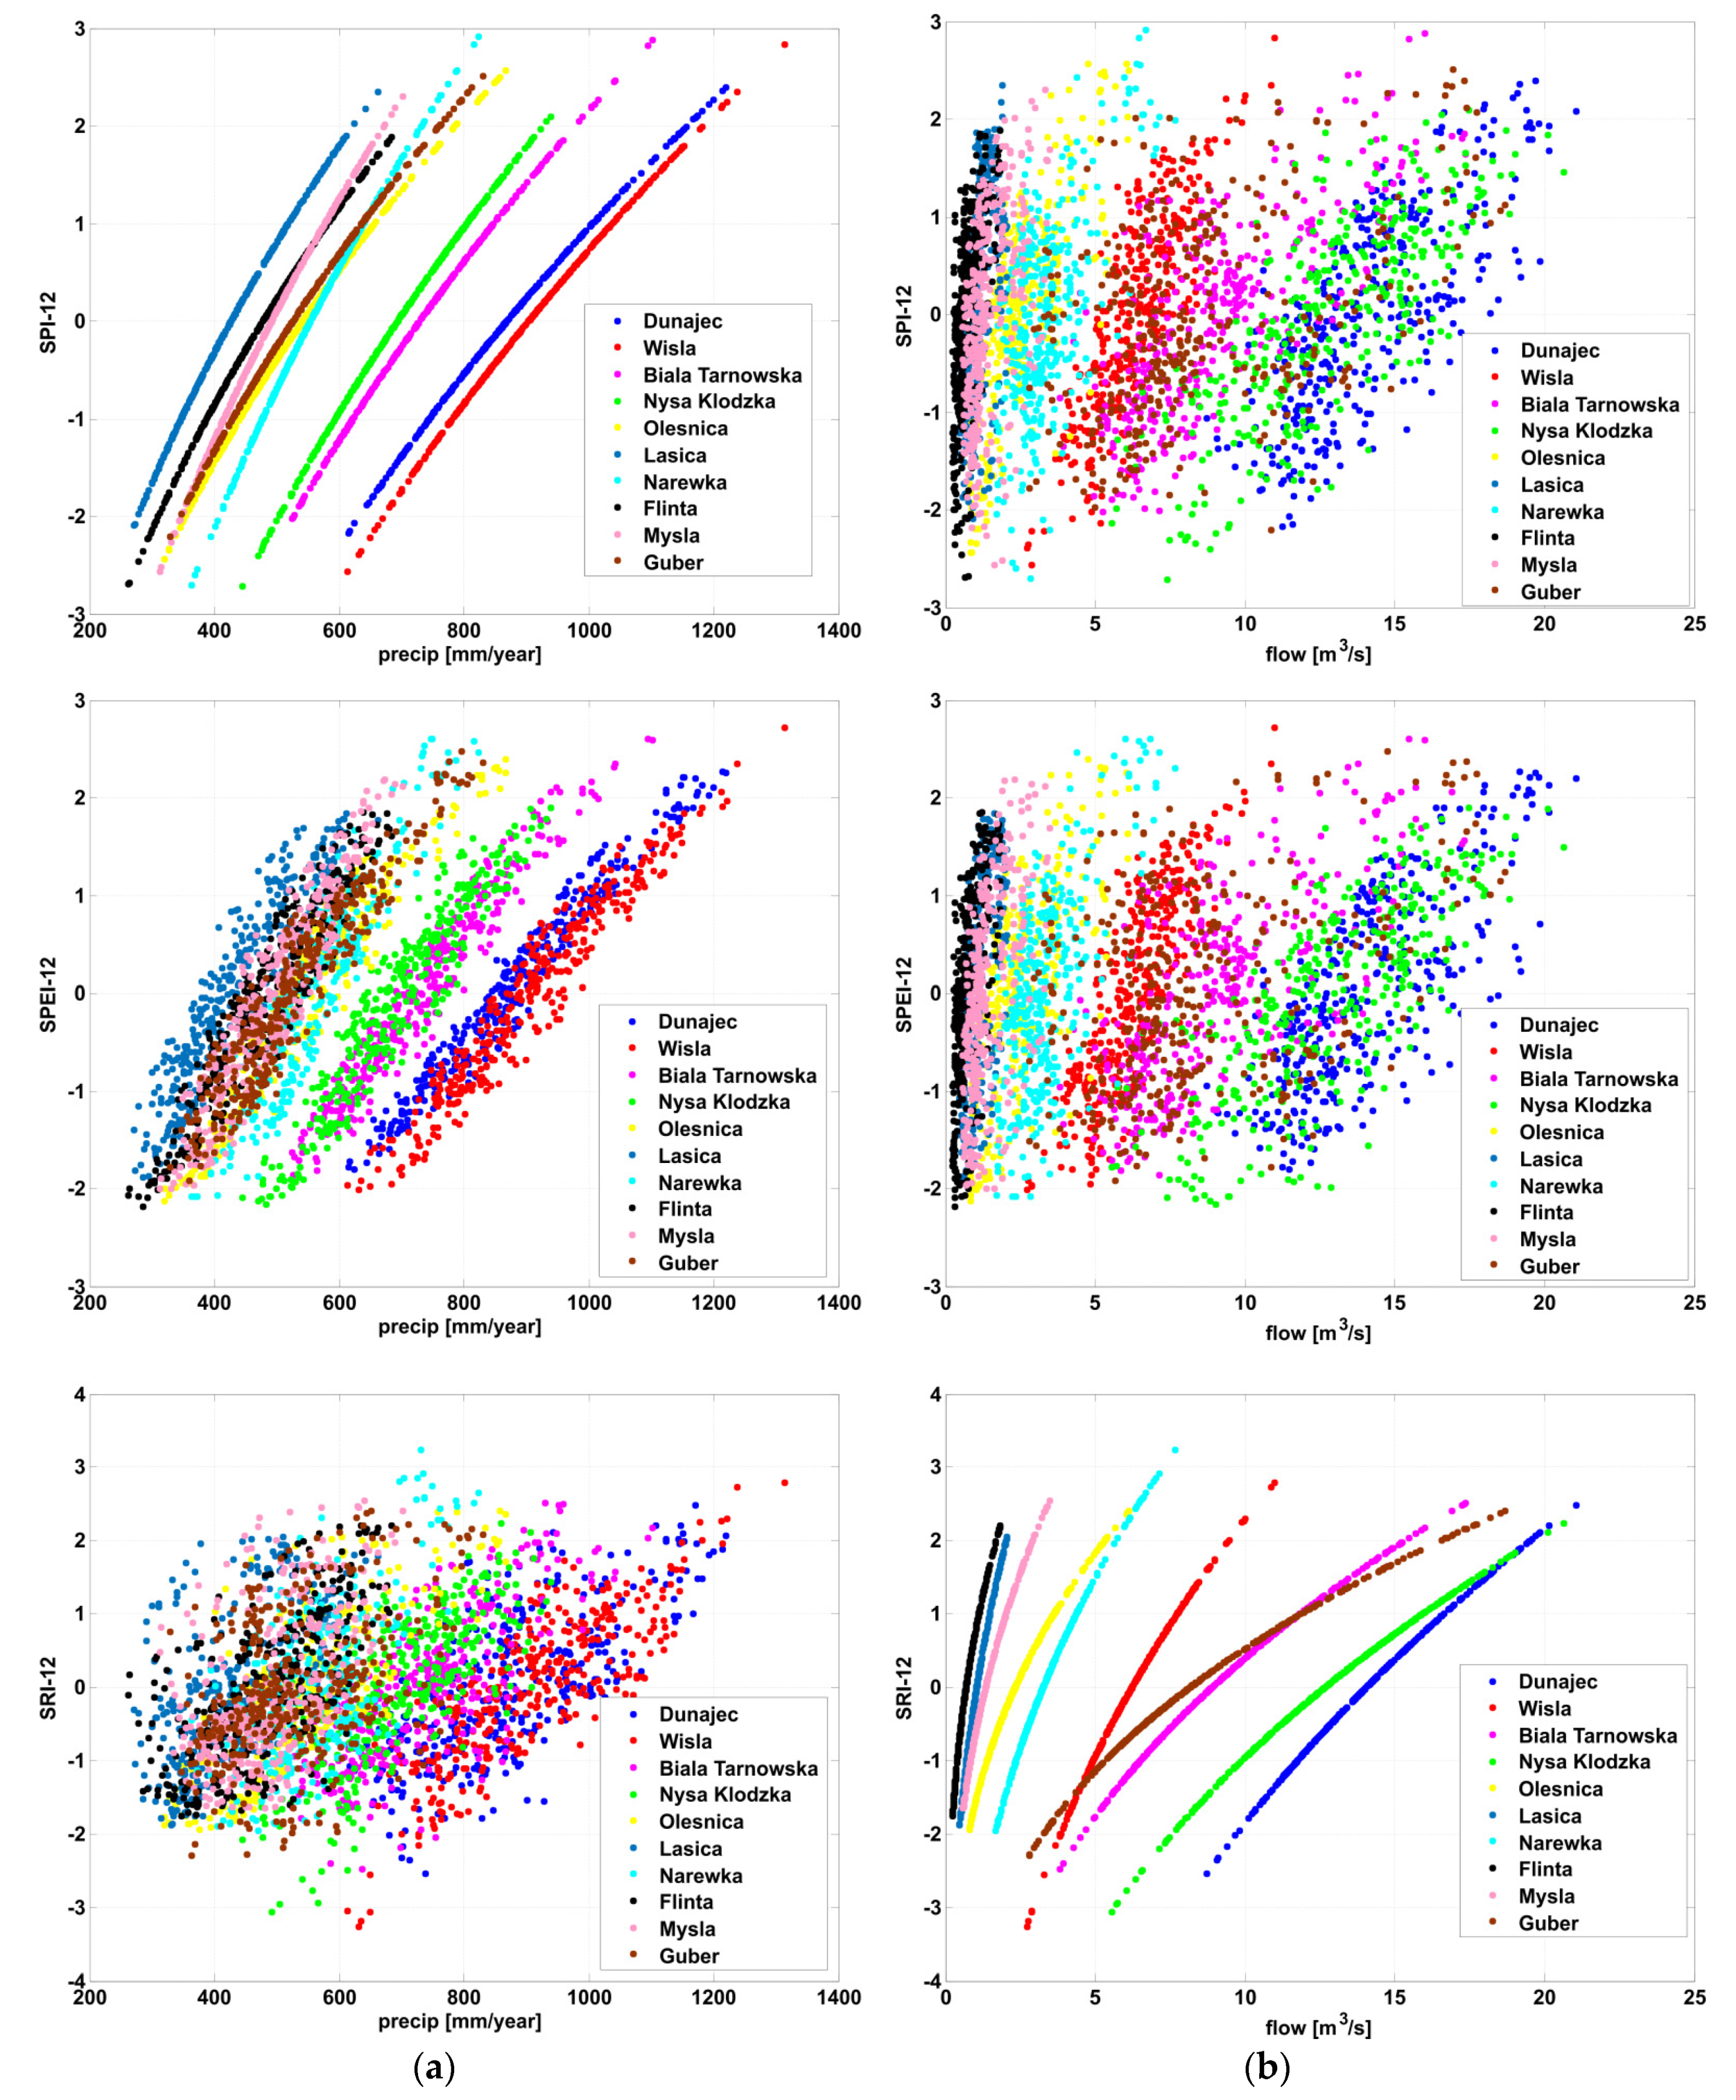
Table 6). The highest correlation coefficient was obtained for the neighbouring catchments for all the indices. However SRI-12 showed a higher correlation than the other indices for the lowland catchments, probably due to their larger water storage capacity and the ability for snow accumulation to be taken into account. The sensitivity of the indices to changes in precipitation and flow was also tested. Following their definitions, SPI-12 is most strongly correlated with precipitation and SRI-12 with flow. However, there is also a statistically significant correlation of SPI-12 with flow and SRI-12 with precipitation, but its strength depends on the catchment. SPEI-12 depends strongly on precipitation and to lesser degree on flow, with large differences between catchments. Both SPI-12 and SPEI-12 show better correlation with flow for the mountainous rather than lowland catchments.
In the second stage, projections into the 21st century for two time periods, the near-future (2021–2050), and the far-future (2071–2100) were assessed. Climatic variables (daily sums of precipitation and mean daily air temperatures) were obtained from the EURO-CORDEX project from seven different climate models: CNRM-CM5-CCLM4-8-17, EC-EARTH-CCLM4-8-17, EC-EARTH-HIRHAM5,EC-EARTH-RACMO22E,EC-EARTH-RCA4,MPI-ESM-LR-CCLM4-8-17 and MPI-ESM-LR RCA4CNRM-CERFACS-CNRM-CM5-CCLM4-8-17, EC-EARTH-CCLM4-8-17, EC-EARTH-HIRHAM5, EC-EARTH-RACMO22E, EC-EARTH-RCA4, MPI-ESM-LR-CCLM4-8-17 and MPI-ESM-LR-RCA4, with a resolution of 12.5 km. A bias correction of EURO-CORDEX simulations was performed using the quantile mapping (QM) approach.
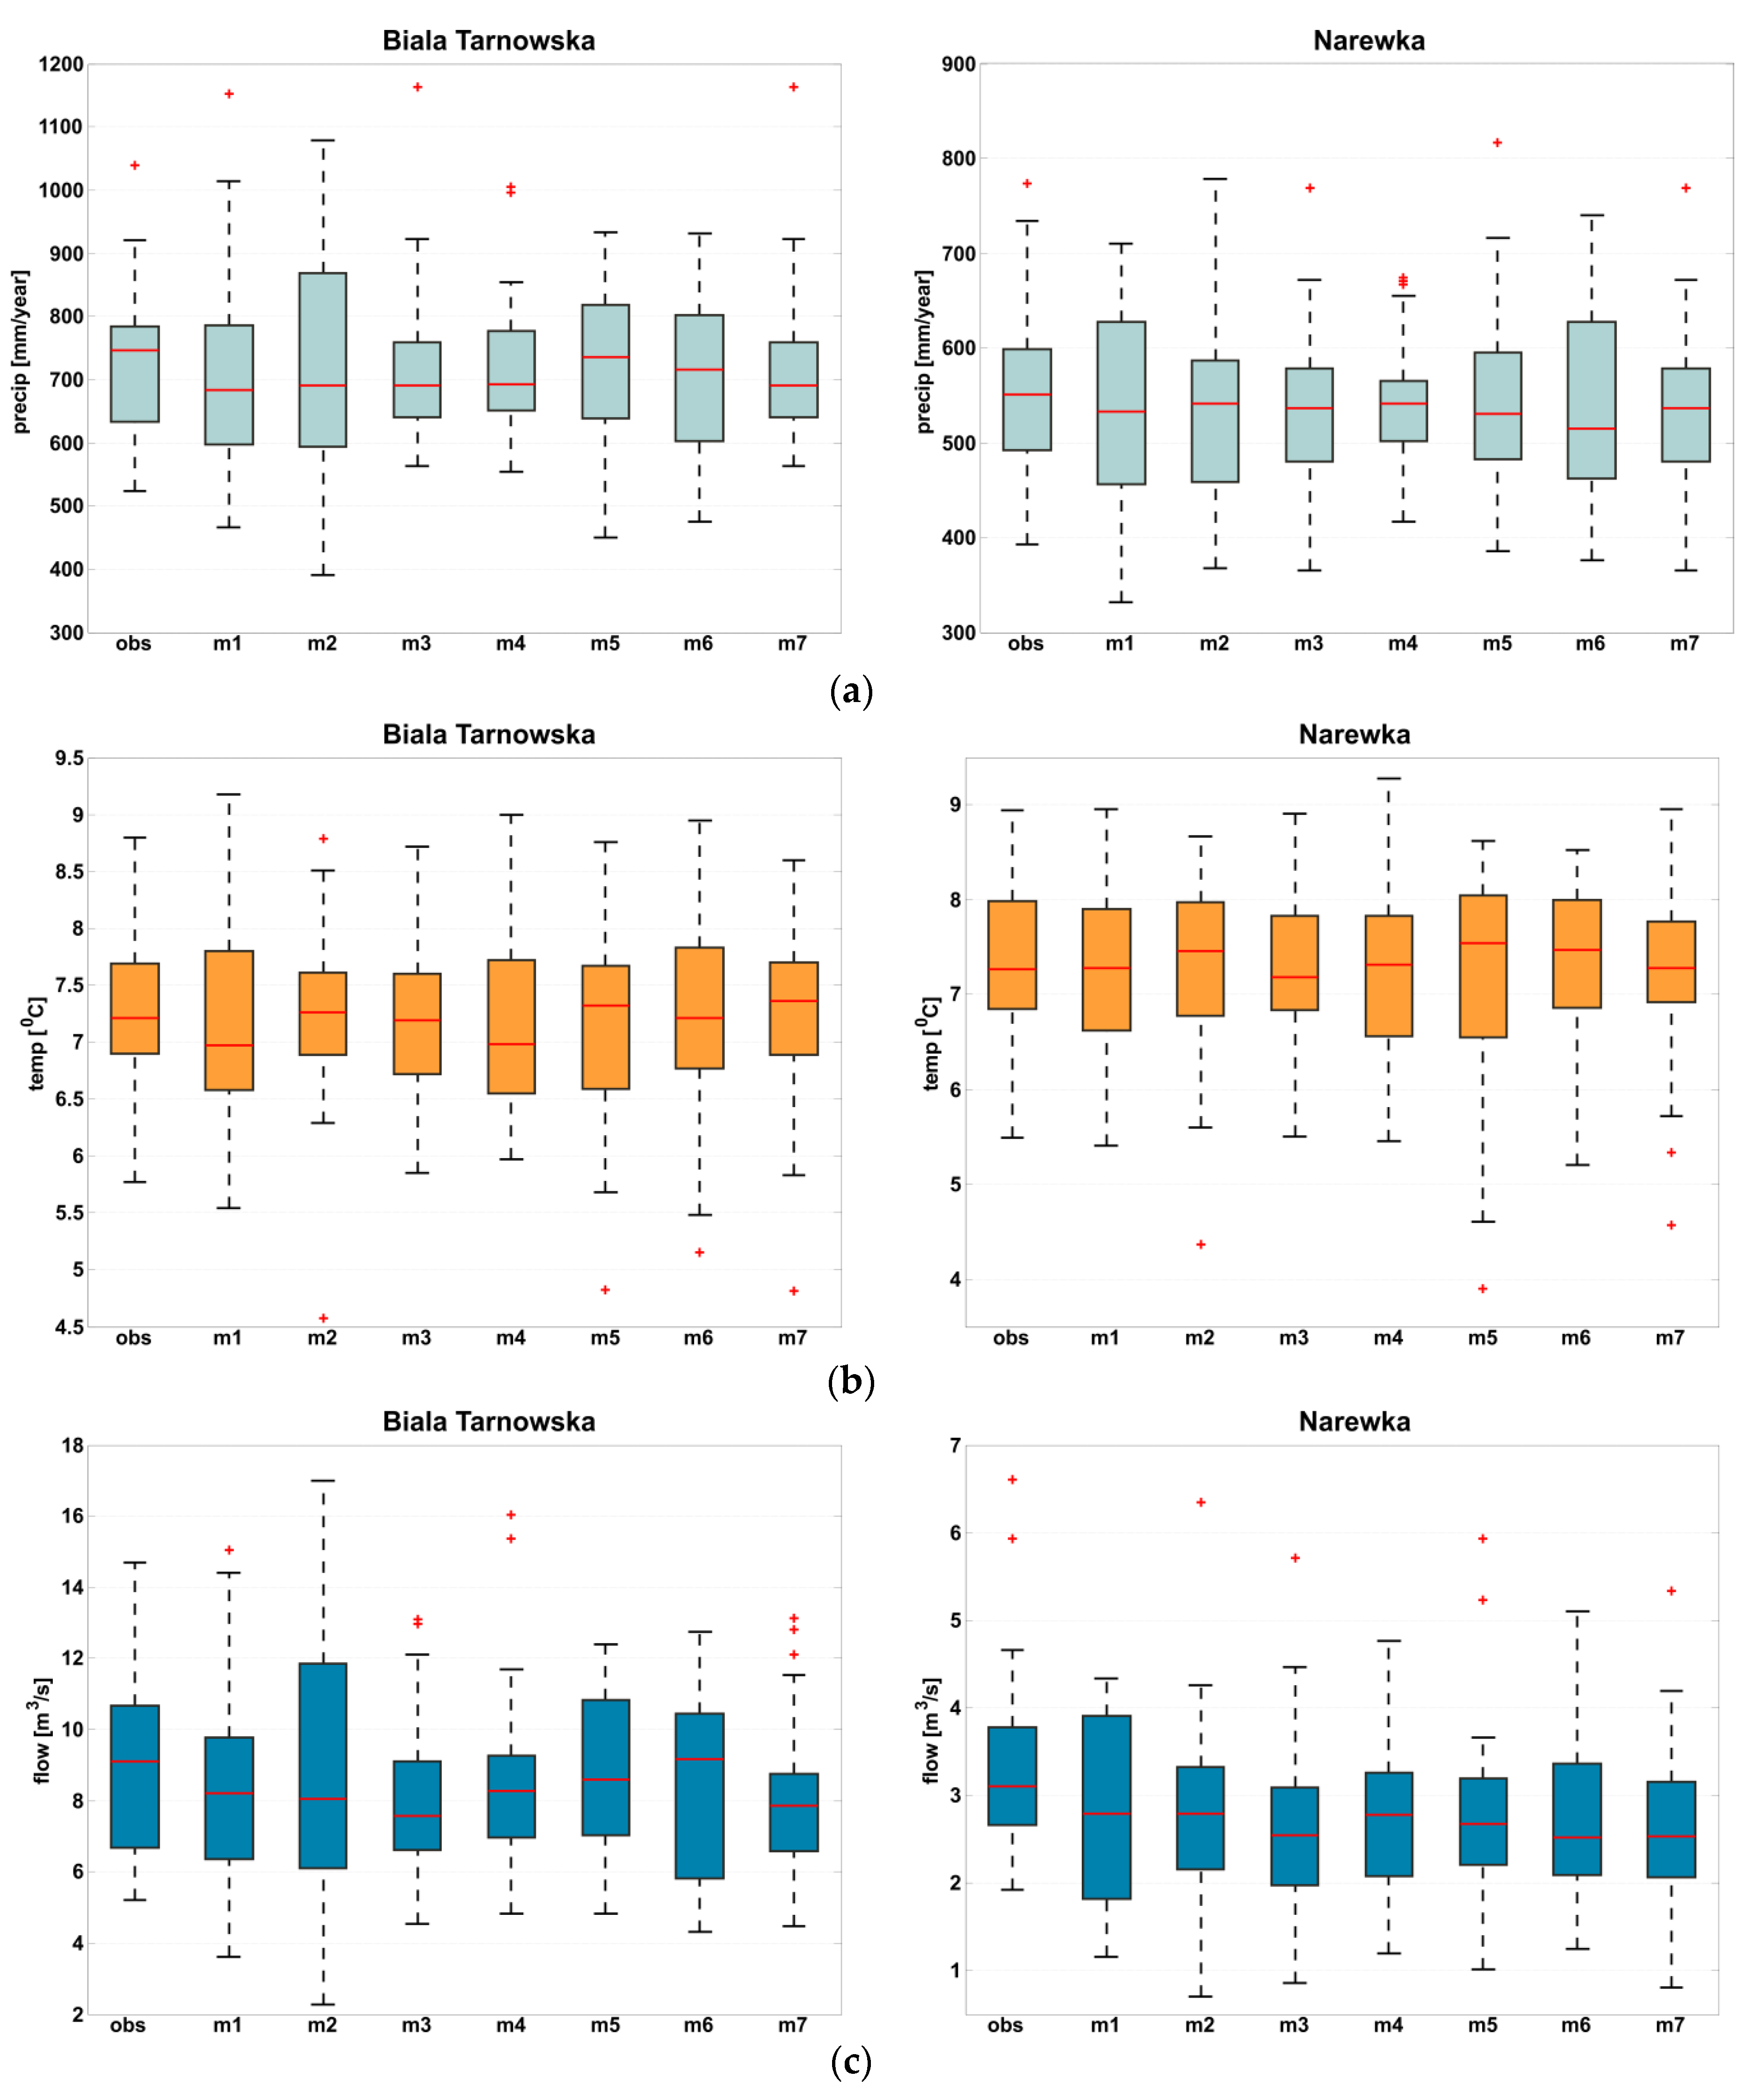
The consistency of the bias-corrected seven climate model projections, the estimated catchment discharge using the HBV model and the observed precipitation and flow values, was tested for the reference period. The results indicate that there are some differences between mean values of climate model simulations and observations. The results of simulations of mean annual flow indicate that the median value is underestimated for almost all climate models. Also the variability of sum/mean annual hydro-climatic variables in the period 1971–2000 shows differences between climate models.
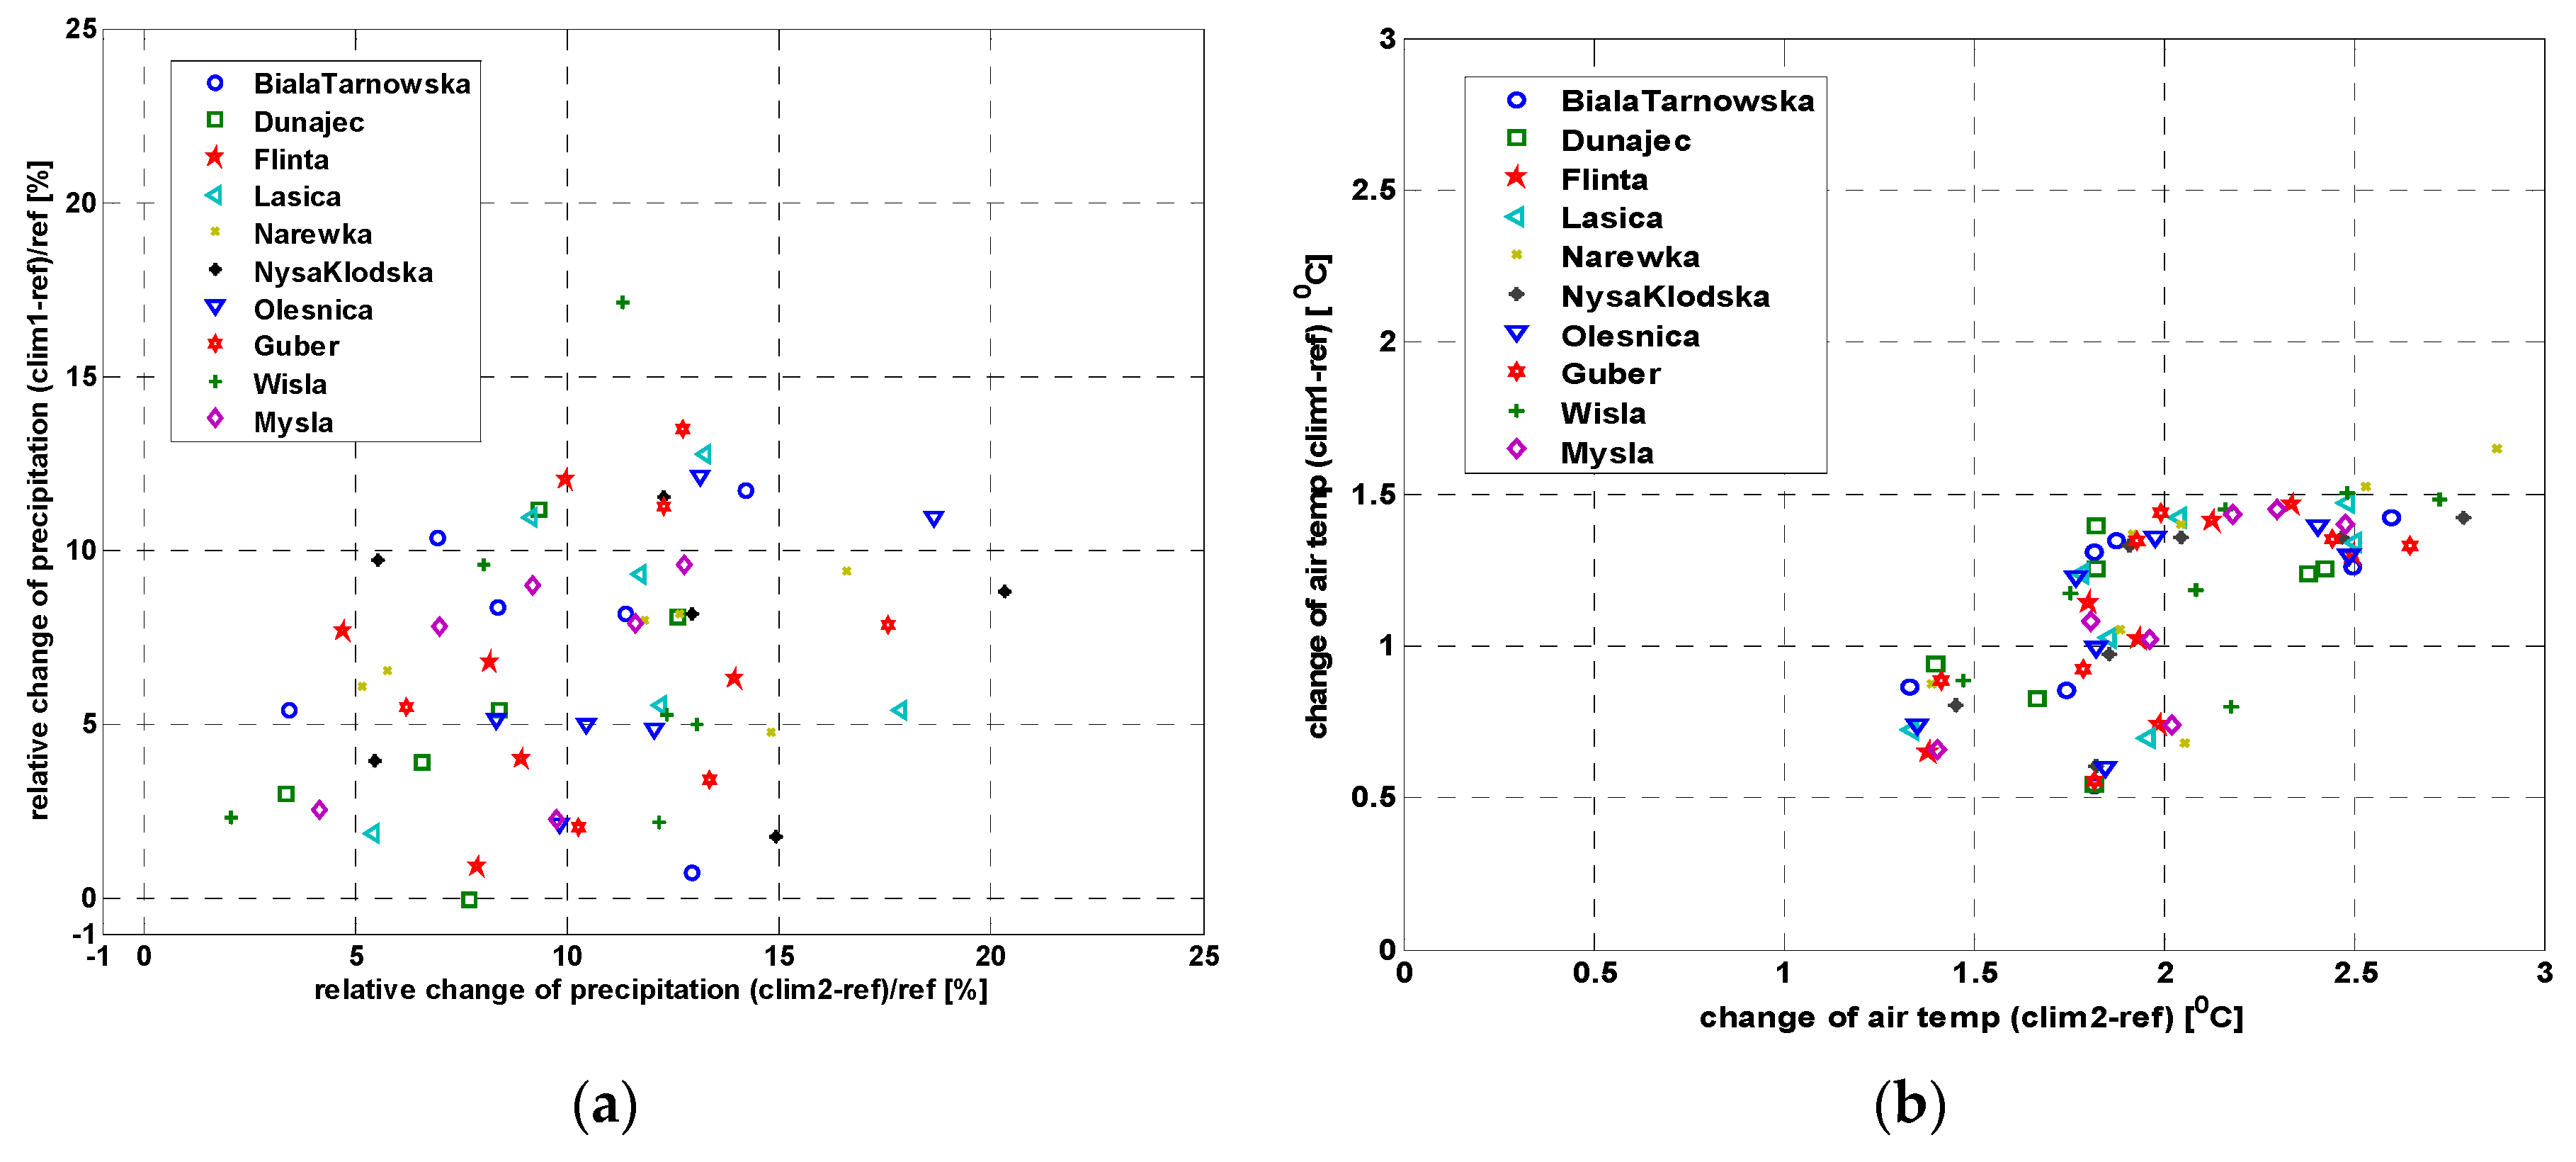
The changes of projected temperature and precipitation into the near- and far-future were analysed. There is a visible increase in the temperatures in the two future time periods and evidence of an increase of precipitation in both future periods against the reference period. In particular, the results indicate increases of air temperature (from 1.3 to almost 3 °C) for the far-future. The difference in mean annual air temperature between near future and reference periods is smaller and ranges from 0.5 to slightly above 1.5 °C. The results indicate that there are differences in the magnitude of changes between catchments, climate models and two future periods. The largest changes estimated using the median from the ensemble of climate models are projected for Myśla, Narewka and Guber catchments located in northern Poland.
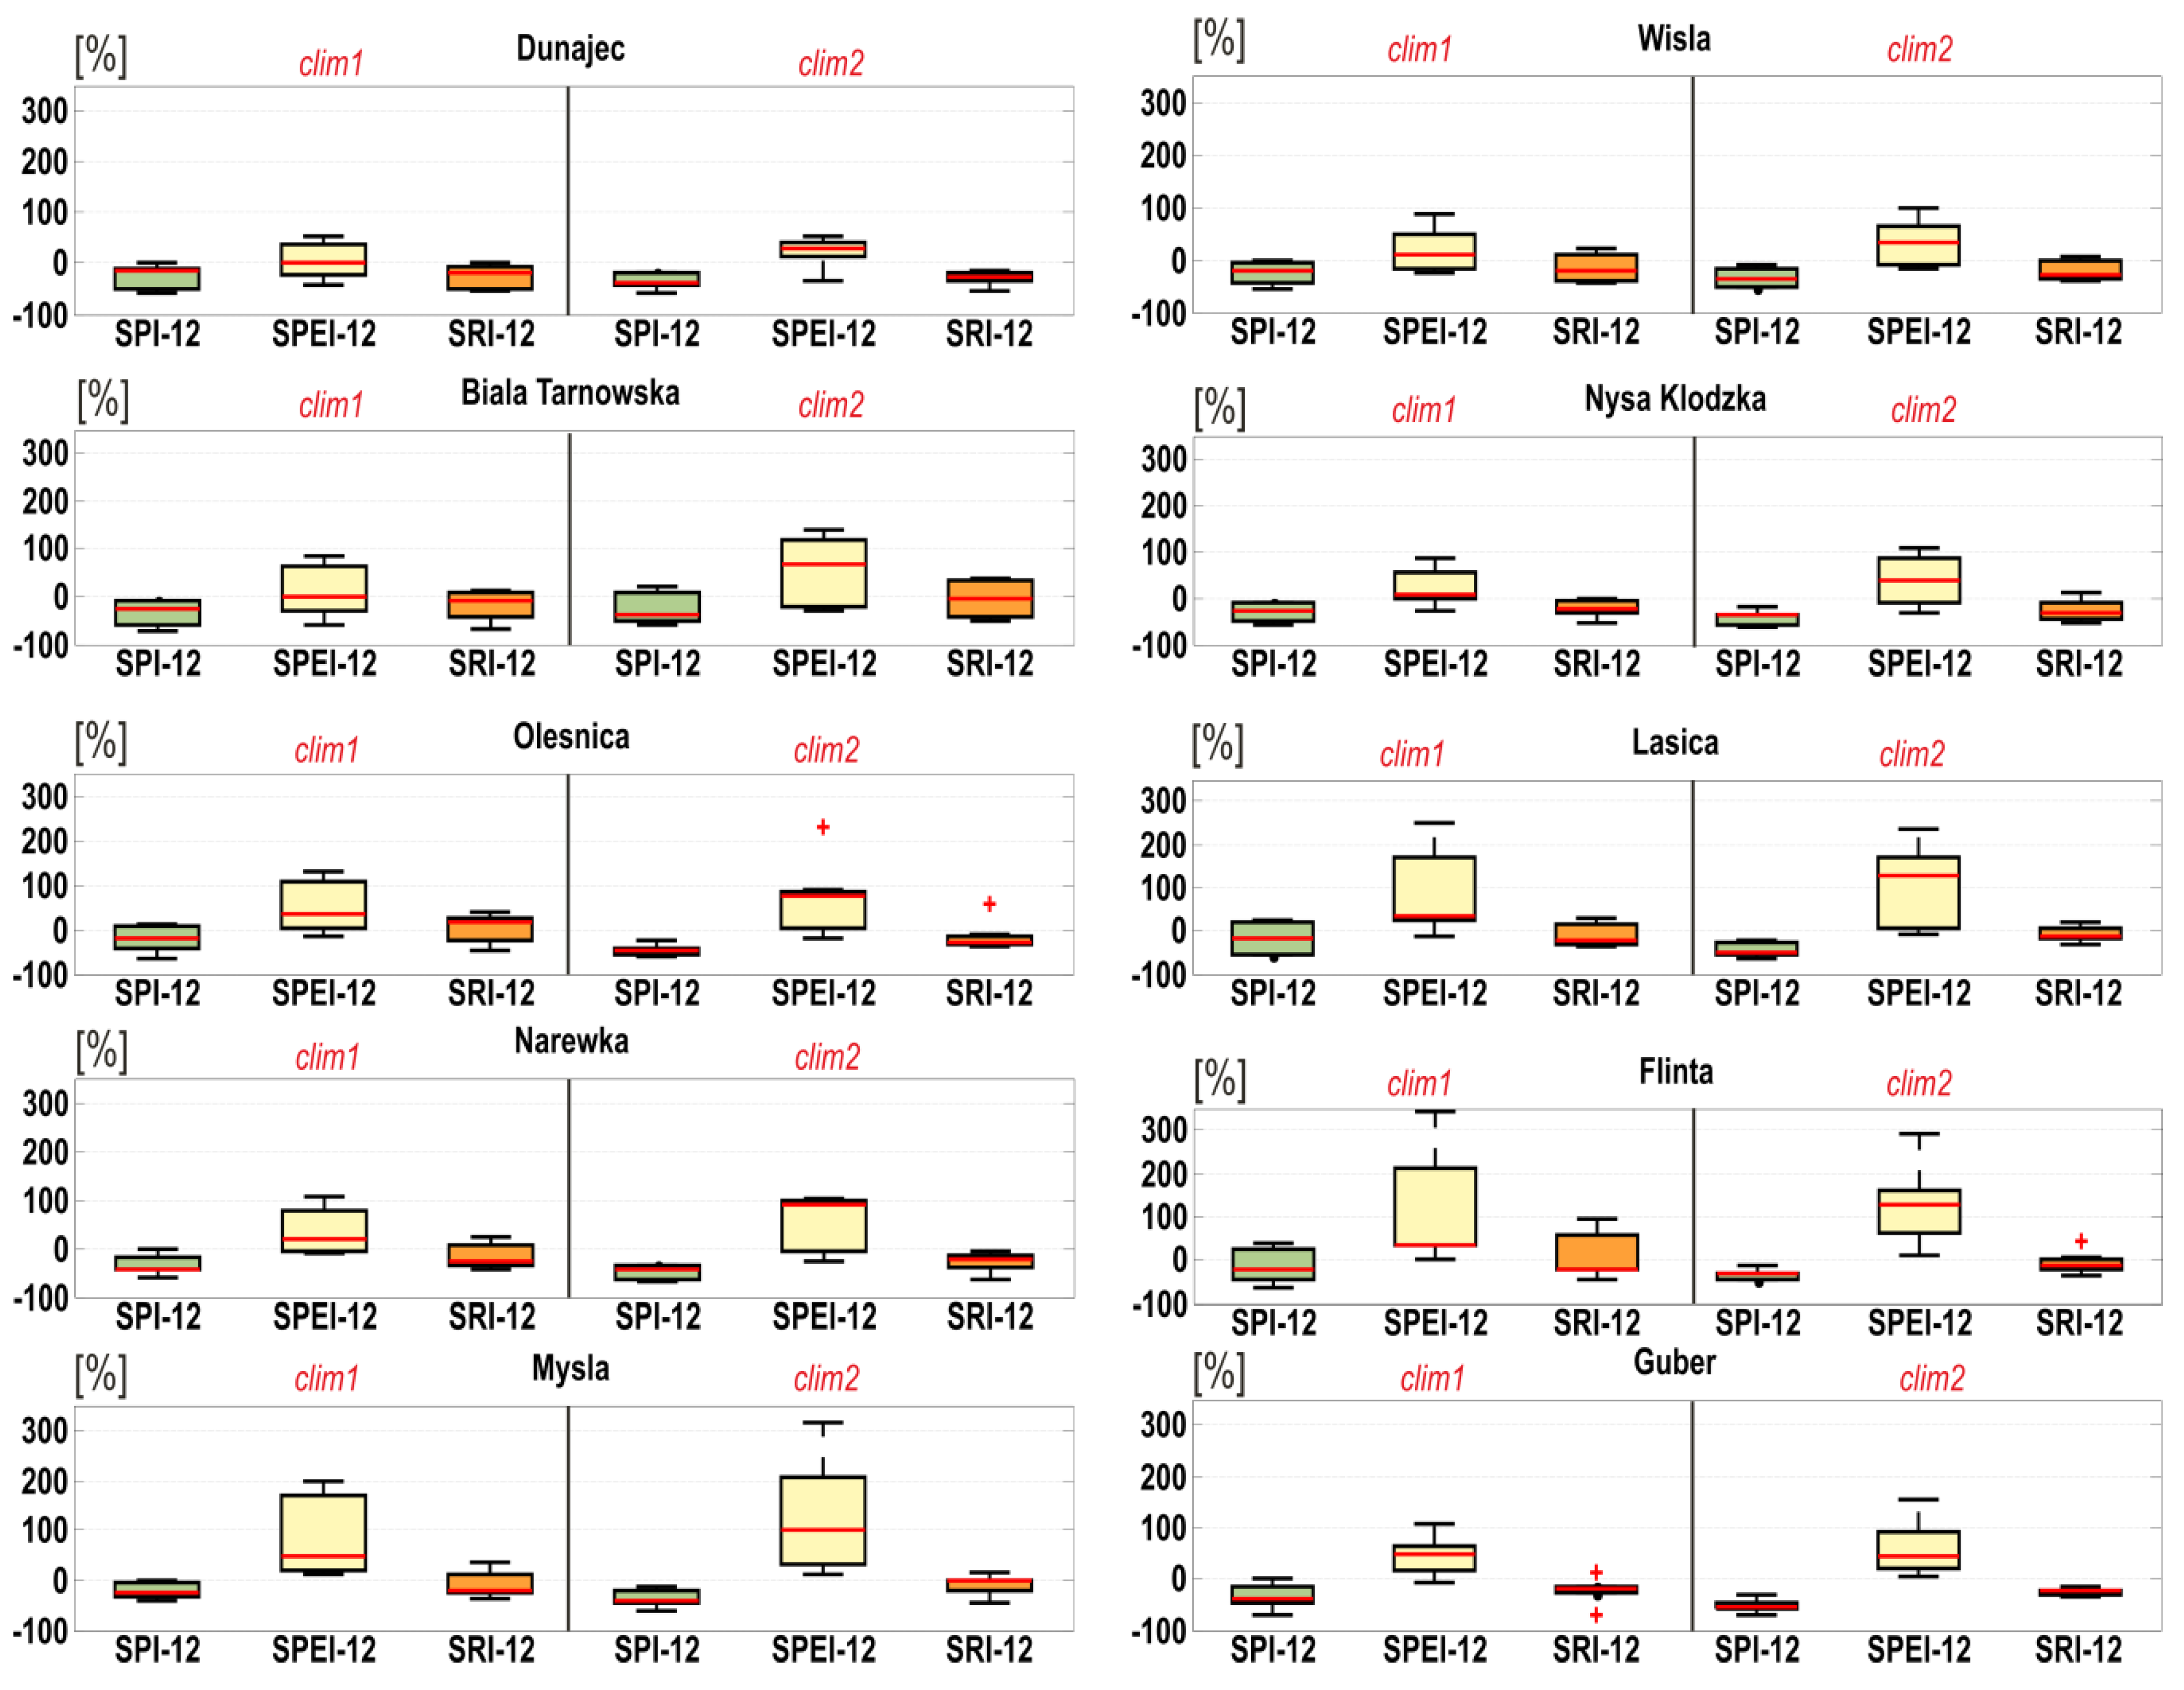
The relative differences in the mean annual sum of precipitation between the near-future and reference periods vary from 0 to 17% whilst for the far-future, the differences range from 2% to slightly above 20%. There is a significant variability of the projected changes between climate models and catchments. A comparison of projected relative changes between catchments for the far-future with reference to 1971–2000 periods indicates higher changes in lowland catchments and smaller changes in those located in a mountainous area.
A comparison of the changes of the SPI-12, SPEI-12 and SRI-12 projections into the near-future (2021–2050) and the far-future (2071–2100) relative to the reference period (1971–2000), was carried out using the statistical assessment of changes in median condition, probability of drought recurrence and drought severity.
The changes of median values of the SPI-12 in the near-future and far-future periods in comparison with the reference period show positive values, indicating wetter conditions in all catchments. In contrast, the SPEI-12 changes are negative, indicating drier future conditions in the catchments. The SRI-12 projections follow the SPI-12 patterns, indicating wetter catchment conditions.
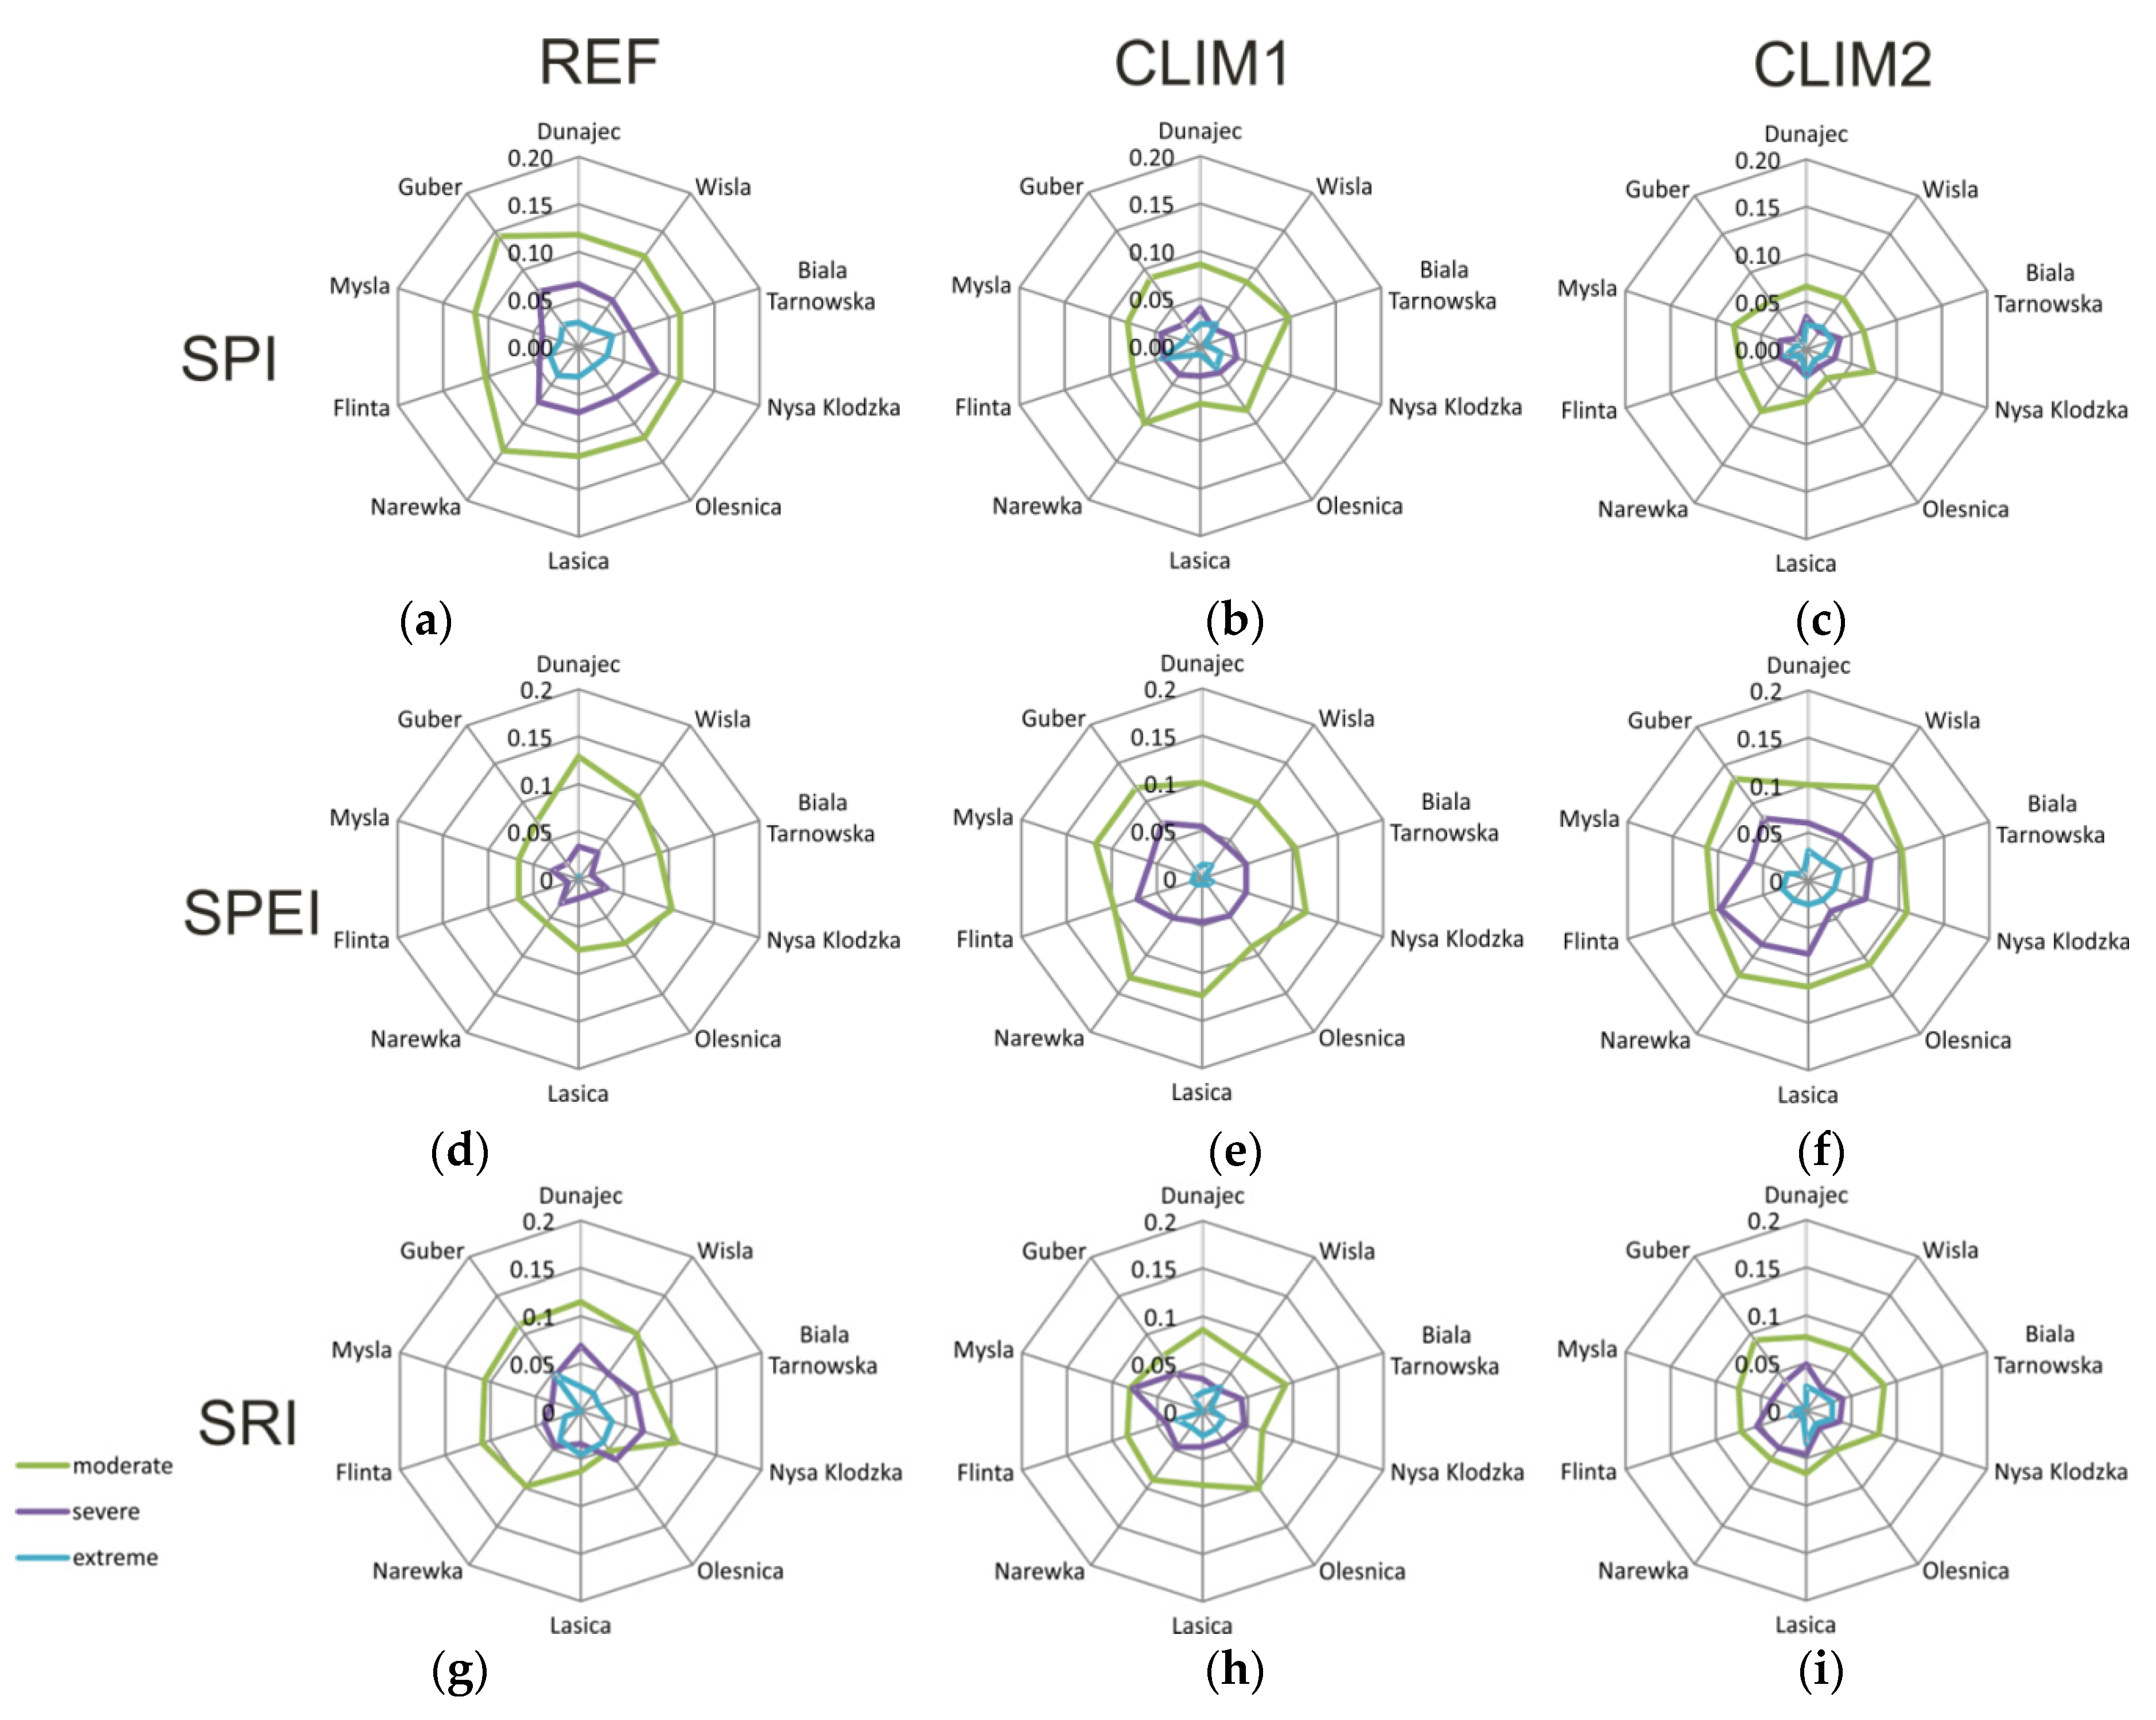
The probabilities of drought for three periods: the reference, near-future and far-future for ten catchments were evaluated for four classes of dryness. The results for two future periods were compared with the reference period (1971–2000). SPI-12 and SRI-12 show a decrease of probability of drought ocurrence from the reference period to the future, but these estimates differ between the catchments. The opposite findings were achieved for the SPEI-12 where the probability of drought ocurrence is increasing with time in nearly all catchments.
Changes in drought severity are similar to the previous measures. The SPI-12 and SRI-12 show a decrease in drought severity in all catchments in the near- and far-future periods. However, SPEI-12 shows an increase of drought severity in both future periods for all catchments studied.
In summary, our results show that taking only precipitation into account (SPI-12), the wetter conditions are projected to prevail in the future in the catchments. However, when potential evapotranspiration is taken into account (SPEI-12), the situation is reversed and drier conditions are projected. The SRI-12 seems to follow the SPI-12 patterns, but it has a potential to take into account the catchment response to climatic forcing. Its projections are bounded by physical conditions in the catchment, i.e. water availability, whereas losses projected by SPEI-12 have no physical limits as potential evapotranspiration is taken into account instead of actual evapotranspiration.
The analysis presented included the variability of future climate projections in the form of an ensemble of seven GCM/RCMs but did not take into account the uncertainty related to future climate scenarios, climate model simplifications, and hydrological model uncertainty. Work on these issues is the subject of our future research.


