Review

Nutrient Retention in Restored Streams and Rivers: A Global Review and Synthesis

by
Tamara A. Newcomer Johnson
1,2,*,
Sujay S. Kaushal
2,
Paul M. Mayer
3,
Rose M. Smith
2 and
Gwen M. Sivirichi
4
1
US Environmental Protection Agency, Coastal Management Branch, Oceans and Coastal Protection Division, Washington, DC 20460, USA
2
Department of Geology & Earth System Science Interdisciplinary Center, University of Maryland, College Park, MD 21201, USA
3
US Environmental Protection Agency, National Health and Environmental Effects Research Lab, Western Ecology Division, Corvallis, OR 97333, USA
4
AKRF, Inc., Hanover, MD 21076, USA
*
Author to whom correspondence should be addressed.
Water 2016, 8(4), 116; https://doi.org/10.3390/w8040116
Submission received: 27 November 2015 / Revised: 6 February 2016 / Accepted: 29 February 2016 / Published: 25 March 2016
(This article belongs to the Special Issue Land Use, Climate, and Water Resources)

Abstract

:
Excess nitrogen (N) and phosphorus (P) from human activities have contributed to degradation of coastal waters globally. A growing body of work suggests that hydrologically restoring streams and rivers in agricultural and urban watersheds has potential to increase N and P retention, but rates and mechanisms have not yet been analyzed and compared across studies. We conducted a review of nutrient retention within hydrologically reconnected streams and rivers, including 79 studies. We developed a typology characterizing different forms of stream and river restoration, and we also analyzed nutrient retention across this typology. The studies we reviewed used a variety of methods to analyze nutrient cycling. We performed a further intensive meta-analysis on nutrient spiraling studies because this method was the most consistent and comparable between studies. A meta-analysis of 240 experimental additions of ammonium (NH4+), nitrate (NO3), and soluble reactive phosphorus (SRP) was synthesized from 15 nutrient spiraling studies. Our results showed statistically significant relationships between nutrient uptake in restored streams and specific watershed attributes. Nitrate uptake metrics were significantly related to watershed surface area, impervious surface cover, and average reach width (p < 0.05). Ammonium uptake metrics were significantly related to discharge, velocity, and transient storage (p < 0.05). SRP uptake metrics were significantly related to watershed area, discharge, SRP concentrations, and chl a concentrations (p < 0.05). Given that most studies were conducted during baseflow, more research is necessary to characterize nutrient uptake during high flow. Furthermore, long-term studies are needed to understand changes in nutrient dynamics as projects evolve over time. Overall analysis suggests the size of the stream restoration (surface area), hydrologic connectivity, and hydrologic residence time are key drivers influencing nutrient retention at broader watershed scales and along the urban watershed continuum.

1. Introduction

Managing nutrient pollution, restoring urban infrastructure, and providing clean drinking water represent grand challenges for human society [1]. Excess nitrogen (N) and phosphorus (P) from urban and agricultural areas contribute to these grand challenges [2,3]. Currently, the amount of N and P transported through streams and rivers to the ocean has increased by 2 to 20-fold [4,5]. This increase in aquatic N has resulted from the doubling of terrestrial N inputs from a mixture of fertilizer production, cultivation of N-fixing crops, and combustion of fossil fuels [6,7]. Likewise, P levels have increased because P-rich rock deposits have been mined to produce fertilizer and detergents which are transported with runoff and wastewater inputs [5,8,9]. In the United States, nearly two-thirds of coastal rivers and estuaries have been significantly impacted by excess nutrients [10,11]. Excess N and P have contributed to contamination of drinking water supplies, the proliferation of harmful algal blooms (HABs), and over 400 hypoxic “dead zones” in coastal waters [12,13,14,15]. Such water quality problems can impact the ecology and economy of coastal regions by decreasing the productivity of fisheries and reducing recreational appeal [12]. Here, we review how effective stream and river restoration are at reducing watershed N and P loads at a global scale.
Increasing urbanization, agricultural intensification, and climate change will likely exacerbate future N and P loads to coastal areas [16,17]. The growing environmental impacts of N and P pollution have motivated efforts to track sources and manage nutrient loads in streams and rivers [18,19,20,21]. Watershed N and P loads can be reduced through multiple strategies including reducing fertilizer inputs, fixing leaky sewer systems, and banning phosphate detergent [22,23,24,25]. Unfortunately, in many regions there are social, political, and economic difficulties associated with reducing sources and inputs to watersheds [26]. Thus, there is expanding interest in restoring the ability of streams, rivers, wetlands, and floodplains to retain and transform watershed N and P inputs.
Stream restoration is not a panacea for watershed nutrient management. Tracking and managing watershed sources is also an essential component of the solution. Despite some valid criticisms, stream restoration is a practice that is likely to continue for the primary goals of bank stabilization, upgrading aging infrastructure, and repairing property damage. In order to sustainably manage watersheds, it is important to determine whether stream restoration practices can also improve water quality by influencing the transport and transformation of both N and P. Thus, we must place efforts towards empirically understanding the possibilities and limitations of restoration across a range of environmental conditions (e.g., land use, watershed size, stream flow, restoration type).

1.1. Stream Processes Driving Nutrient Cycling

Restoration practices including floodplain reconnection in streams and rivers may enhance N and P retention processes. These retention processes include: temporary storage through assimilation, adsorption, or permanent removal through coupled nitrification and denitrification. Plants, fungi, and certain bacteria in the stream and riparian zone can temporarily assimilate inorganic N and P into biomass [27,28]. Assimilation rates increase with retention time and the availability of sunlight and nutrients [29,30,31]. NH4+ and SRP are readily assimilated forms of inorganic N and P [32]. NH4+ and SRP can also be retained through adsorption onto negatively charged soil particles. Under aerobic conditions, water column P concentrations are kept low because of strong bonds to natural clay particles [33]. Thus, P is typically transported in particulate form. Biomass assimilation and sediment adsorption are temporary forms of N and P retention. N and P in assimilated biomass may be recycled back into the environment through excretion or death and decomposition. Likewise, N and P adsorbed to sediments can be resuspended due to turbulence and mixing or remobilized from anaerobic sediments [34,35]. Another possible fate for N and P (that has been assimilated into biomass or adsorbed onto sediment particles) may be long-term burial in sediments.
In contrast to P, N can be permanently removed through coupled nitrification-denitrification, a process that transforms inorganic compounds (NH4+, NO2, and NO3) into inert gaseous products (N2O and N2) [36]. The first step, nitrification oxidizes ammonium to nitrite and then nitrate (NH4+ → NO2 → NO3). Nitrification requires aerobic conditions. The second step, denitrification reduces nitrate to nitrous oxide and N gas (NO3 → N2O → N2). Denitrification requires anoxic conditions and an electron donor such as organic carbon [37,38]. Saturated soils with oxygenating root surfaces promote coupled nitrification and denitrification. Thus, restored streams and floodplains may have high rates of N retention and removal because conditions can be favorable for both coupled nitrification-denitrification and assimilation [39,40,41]. As the mechanisms controlling N and P retention are different, the inclusion of macrophytes in stream and river restoration designs may be beneficial for retention of both N and P. This is because roots can oxygenate soil for coupled nitrification-denitrification and P immobilization [42,43].

1.2. Stream Impairment in Human Dominated Watersheds

Anthropogenic activities have hydrologically disconnected streams and rivers from floodplains and impacted their ability to retain N and P [44]. In both urban and agricultural watersheds, streams and rivers have been straightened, channelized, and buried, which increases how efficiently water is transported away. Furthermore, increased N and P inputs from fertilizer and sewage can saturate in-stream biological demand [45]. Overall, human activities have dramatically altered both the hydrologic plumbing and nonpoint sources of nutrients in many urban and agricultural watersheds, which contributes to amplified pulses of water and nutrient export from watersheds [17]. Below, we discuss the nature of stream degradation from an agricultural and urban perspective and its relevance to stream and river restoration.
Agricultural practices have led to both physical and chemical alterations to streams globally. In the eastern United States, the legacy of 19th-century sediment erosion can be a defining feature of stream channel geomorphology. During this time, clearing, burning, tilling, and grazing of hillsides led to soil erosion and filled valley bottoms with fine sediment [46,47,48]. In some valleys, layers of post-settlement alluvium eventually filled in floodplains with as much as 3 m of “legacy” sediments, which are being transported downstream in places where stream incision occurs [49,50]. Fine sediments can clog interstitial voids within a gravel bed and obstruct groundwater-surface water hydrologic connectivity [51,52]. In addition to raising the elevation of the floodplain surface, transport of fine sediments from land development (e.g., agriculture and residential use) has led to a massive loss of wetlands globally [53]. Furthermore, ditching, diking, and tile drains have been used to artificially lower groundwater levels in former wetlands (in order to increase agricultural productivity and efficiently transport water away). This reduction in groundwater levels decreases hydrologic connectivity between surface water and groundwater in floodplains and decreases hydrologic residence time and soil moisture levels.
Similarly, urban drainage networks have been “re-plumbed” with storm drains to efficiently transport runoff away from buildings and into streams [44,54]. In some urban areas, natural streams have been either lined in concrete or buried in underground pipes [31,55]. These artificial drainage networks can limit hydrologic connectivity between streams and floodplains and increase the flashiness of runoff events and promote erosion and downcutting of stream banks. After decades of trying to quickly move runoff away from urban landscapes, perceptions regarding managing urban runoff have changed. There can be important water quality and flood safety benefits associated with reducing the velocity of runoff and retaining water on the landscape [56].
Stream restoration and floodplain reconnection have been employed as potential strategies to restore ecosystem functions, although degradation may be difficult or impossible to reverse [57]. Stream restoration and floodplain reconnection have been used in an attempt to influence water quality by slowing stream flow by altering channel/floodplain morphology and riparian vegetation [29,40,41,58,59]. The objective of this review and synthesis was to evaluate the effectiveness of stream restoration and floodplain reconnection practices for restoring ecosystem functions such as N and P retention. We reviewed and synthesized peer-reviewed literature studies that provide N and P retention data for projects. We found that stream restoration and floodplain reconnection projects encompassed a plethora of designs and took place at a wide range of scales from headwater streams to large rivers like the Mississippi [60]. Additionally, there were many different methods used to evaluate the effects of restoration on water quality. Our objectives were to (1) develop a typology of different forms of stream and river restoration, (2) examine the methods used for evaluating stream and river restoration, and (3) estimate the effectiveness of various restoration practices in order to inform future restoration and monitoring efforts. This review and synthesis was aimed at evaluating factors contributing to restoration outcomes across various scales.

2. Review of Empirical Nutrient Studies

2.1. Selection Criteria and Typology Development

We performed a systematic search using literature database search engines, primarily ISI Web of Knowledge, to amass potentially relevant studies published from 1970 to 2014. We also searched for technical papers and examined reference lists within selected papers. Our initial search identified papers containing at least one key word from each of three areas of interest: (1) study ecosystem (river, wetland, ditch, stream, floodplain); (2) management actions (restor*, engineering, rehabilitation); and (3) nutrients measured (nitr* or phos*). The asterisk (*) inserted at the end of some of these terms enables all variations of the key word to be included in the search. An initial screening of titles and abstracts for relevance yielded 550 papers after excluding: (1) those not meeting basic selection criteria (e.g., explicitly examining stream/river restoration projects); and (2) studies of isolated wetlands and of systems that are tidally influenced (our focus was on restoration of flowing waters connected to a stream or river network). We examined these results and recorded the number of restoration studies over time (Figure 1).
For the remainder of this review, we restricted our scope so that it only includes empirical case studies with actual nutrient monitoring data. After excluding any review papers or modeling studies that did not include new empirical nutrient data, we ultimately included 79 peer-reviewed studies. For each study, we documented the following: monitoring method, land use, management action, summary of results (e.g., uptake metrics, denitrification rates, etc.), and geographic location (Table S1). Additionally, we developed a typology (classification according to general type) for the restoration projects and evaluated the diversity of methods used to examine how these projects influenced nutrient retention. We standardized metric units for retention rates across studies and regions in order to analyze and compare studies with common methods.

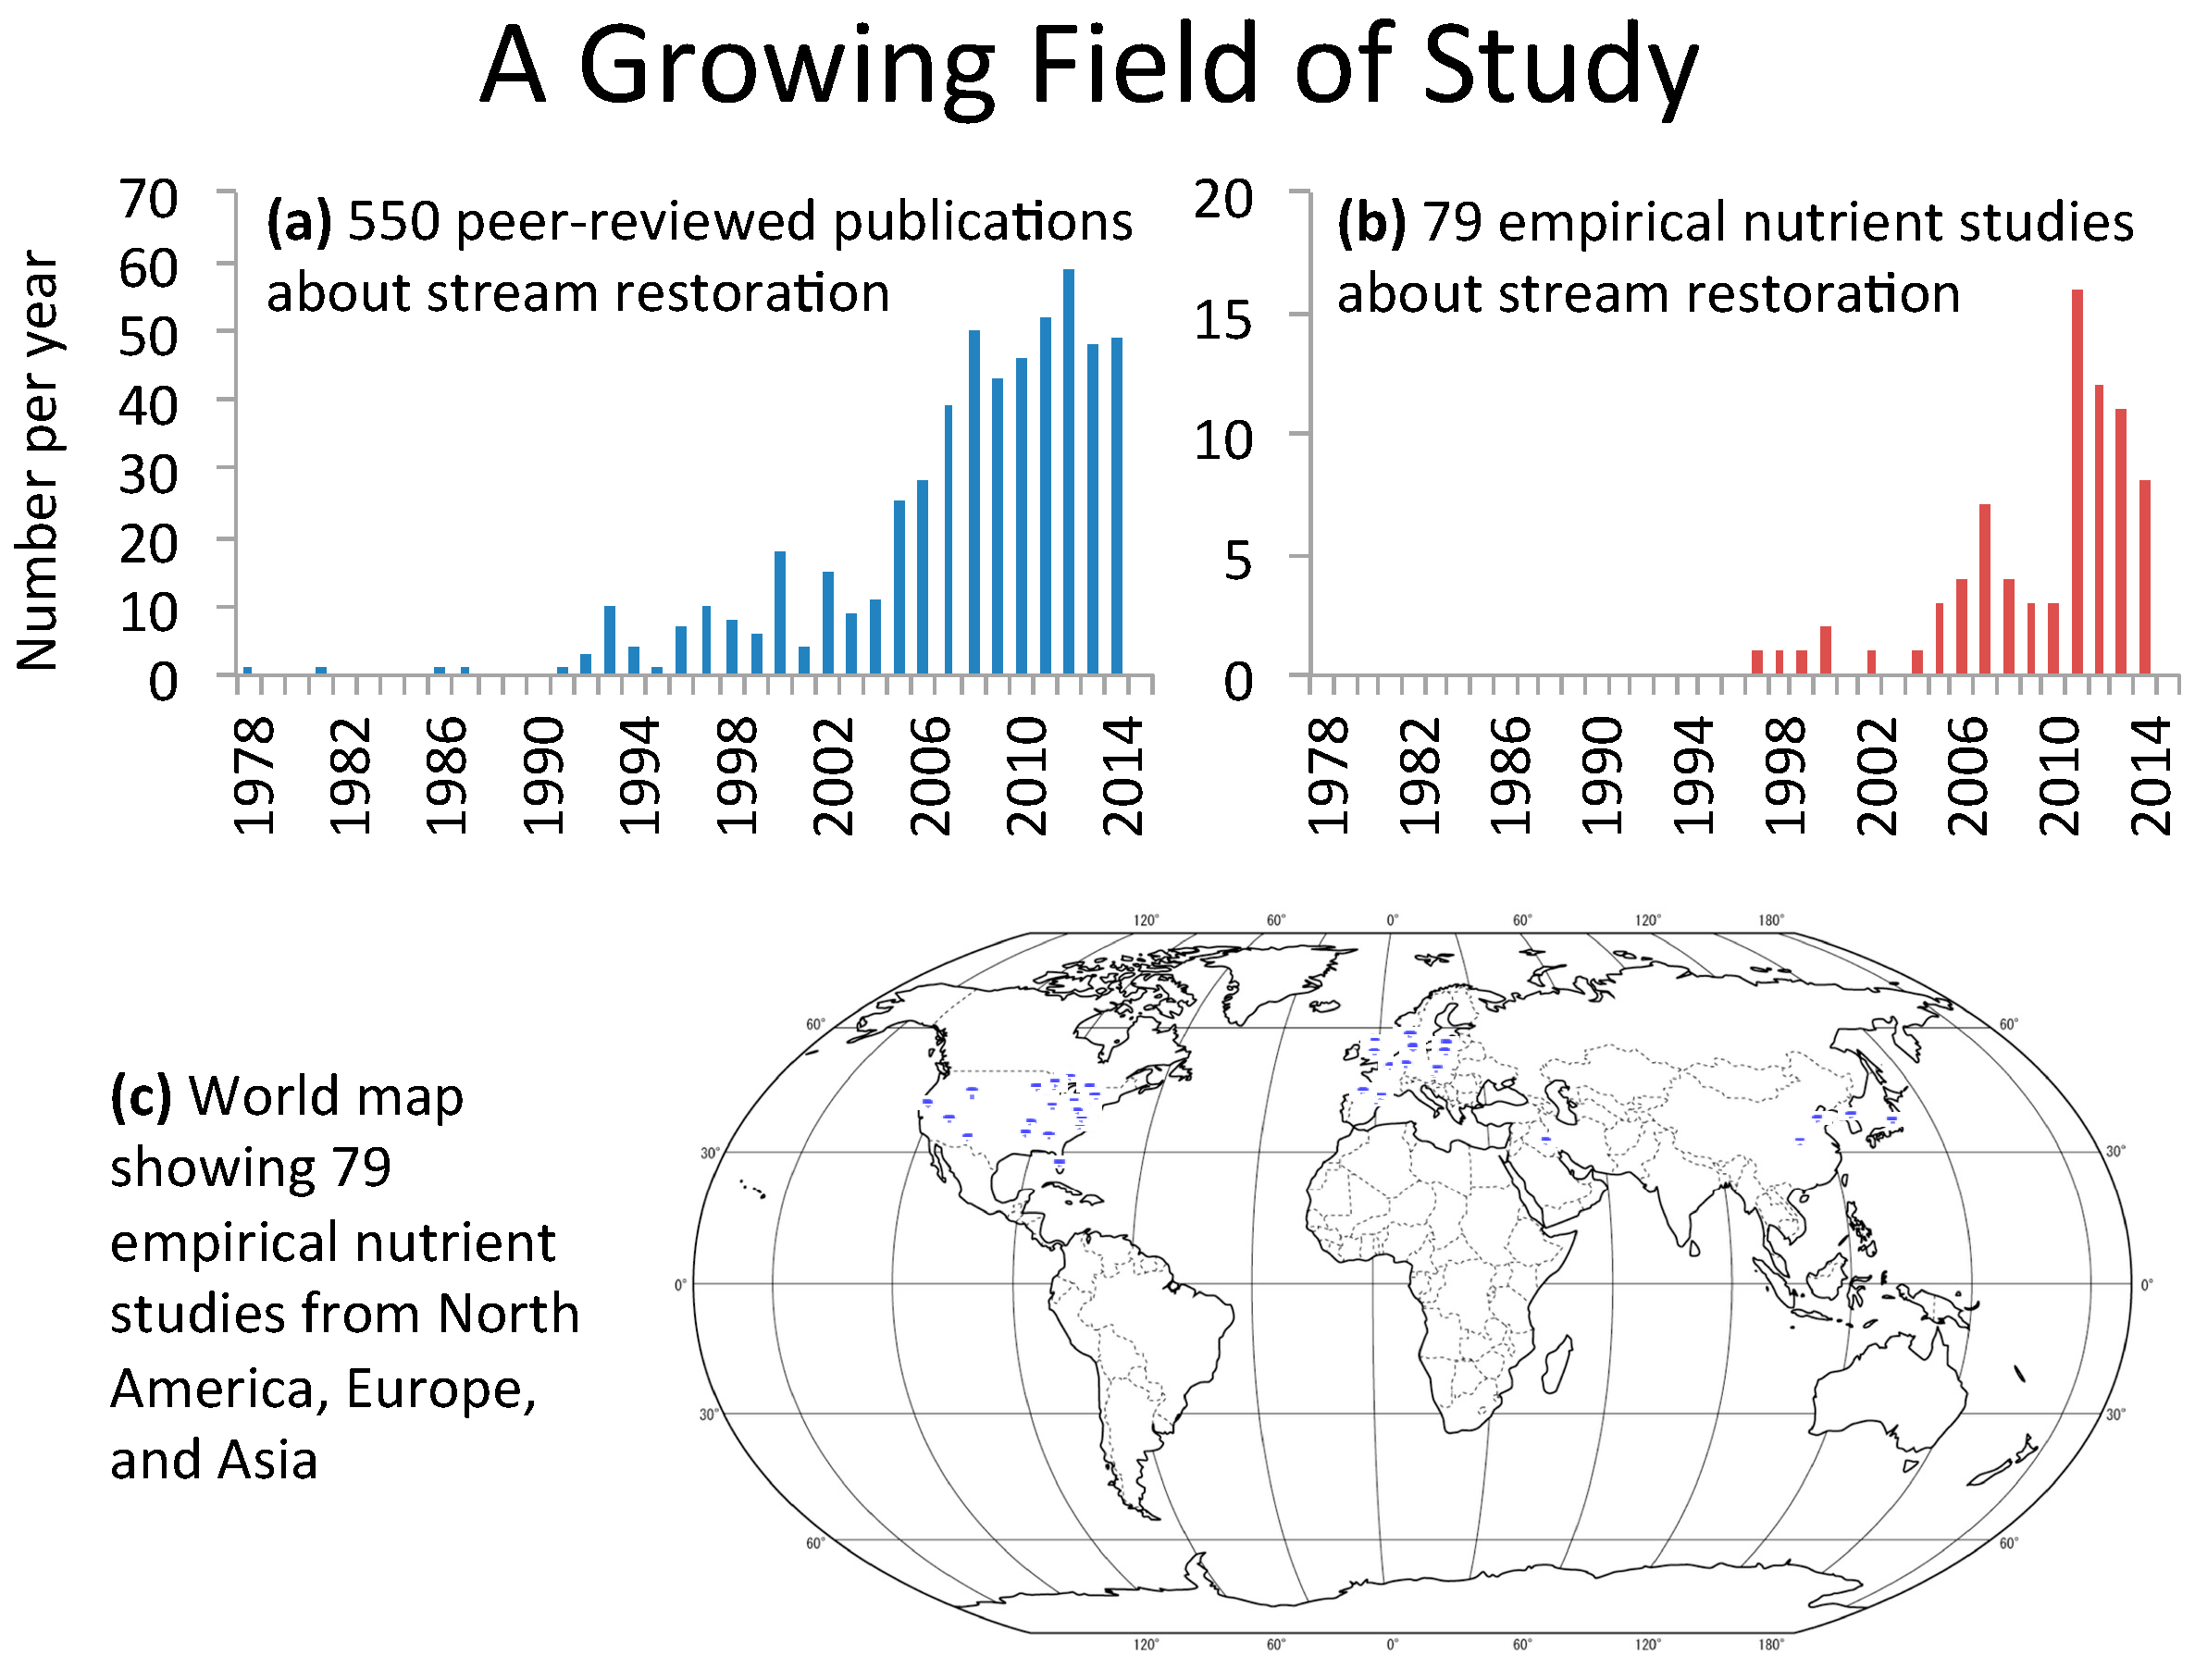
2.2. Growth in Stream Restoration Studies over Time

Based on our analysis of peer-reviewed literature, the average number of articles regarding stream restoration in general (nutrient retention, biodiversity, hydrology, etc.) published each year increased from 0.3 studies per year in the 1980s, to 5 per year in the 1990s, to 24 per year in the 2000s, to 51 per year during 2010–2014 (Figure 1a). Out of these 550 publications, we determined that 79 studies contained empirical nutrient monitoring data for stream restoration projects that implemented hydrologic and/or geomorphic changes to increase stream-floodplain hydrologic connectivity. The average number of empirical nutrient retention studies (based on original data) published each year increased from 0.3 studies per year in the 1990s, to 2.5 studies per year in the 2000s, to 10 studies per year during 2010–2014 (Figure 1b).

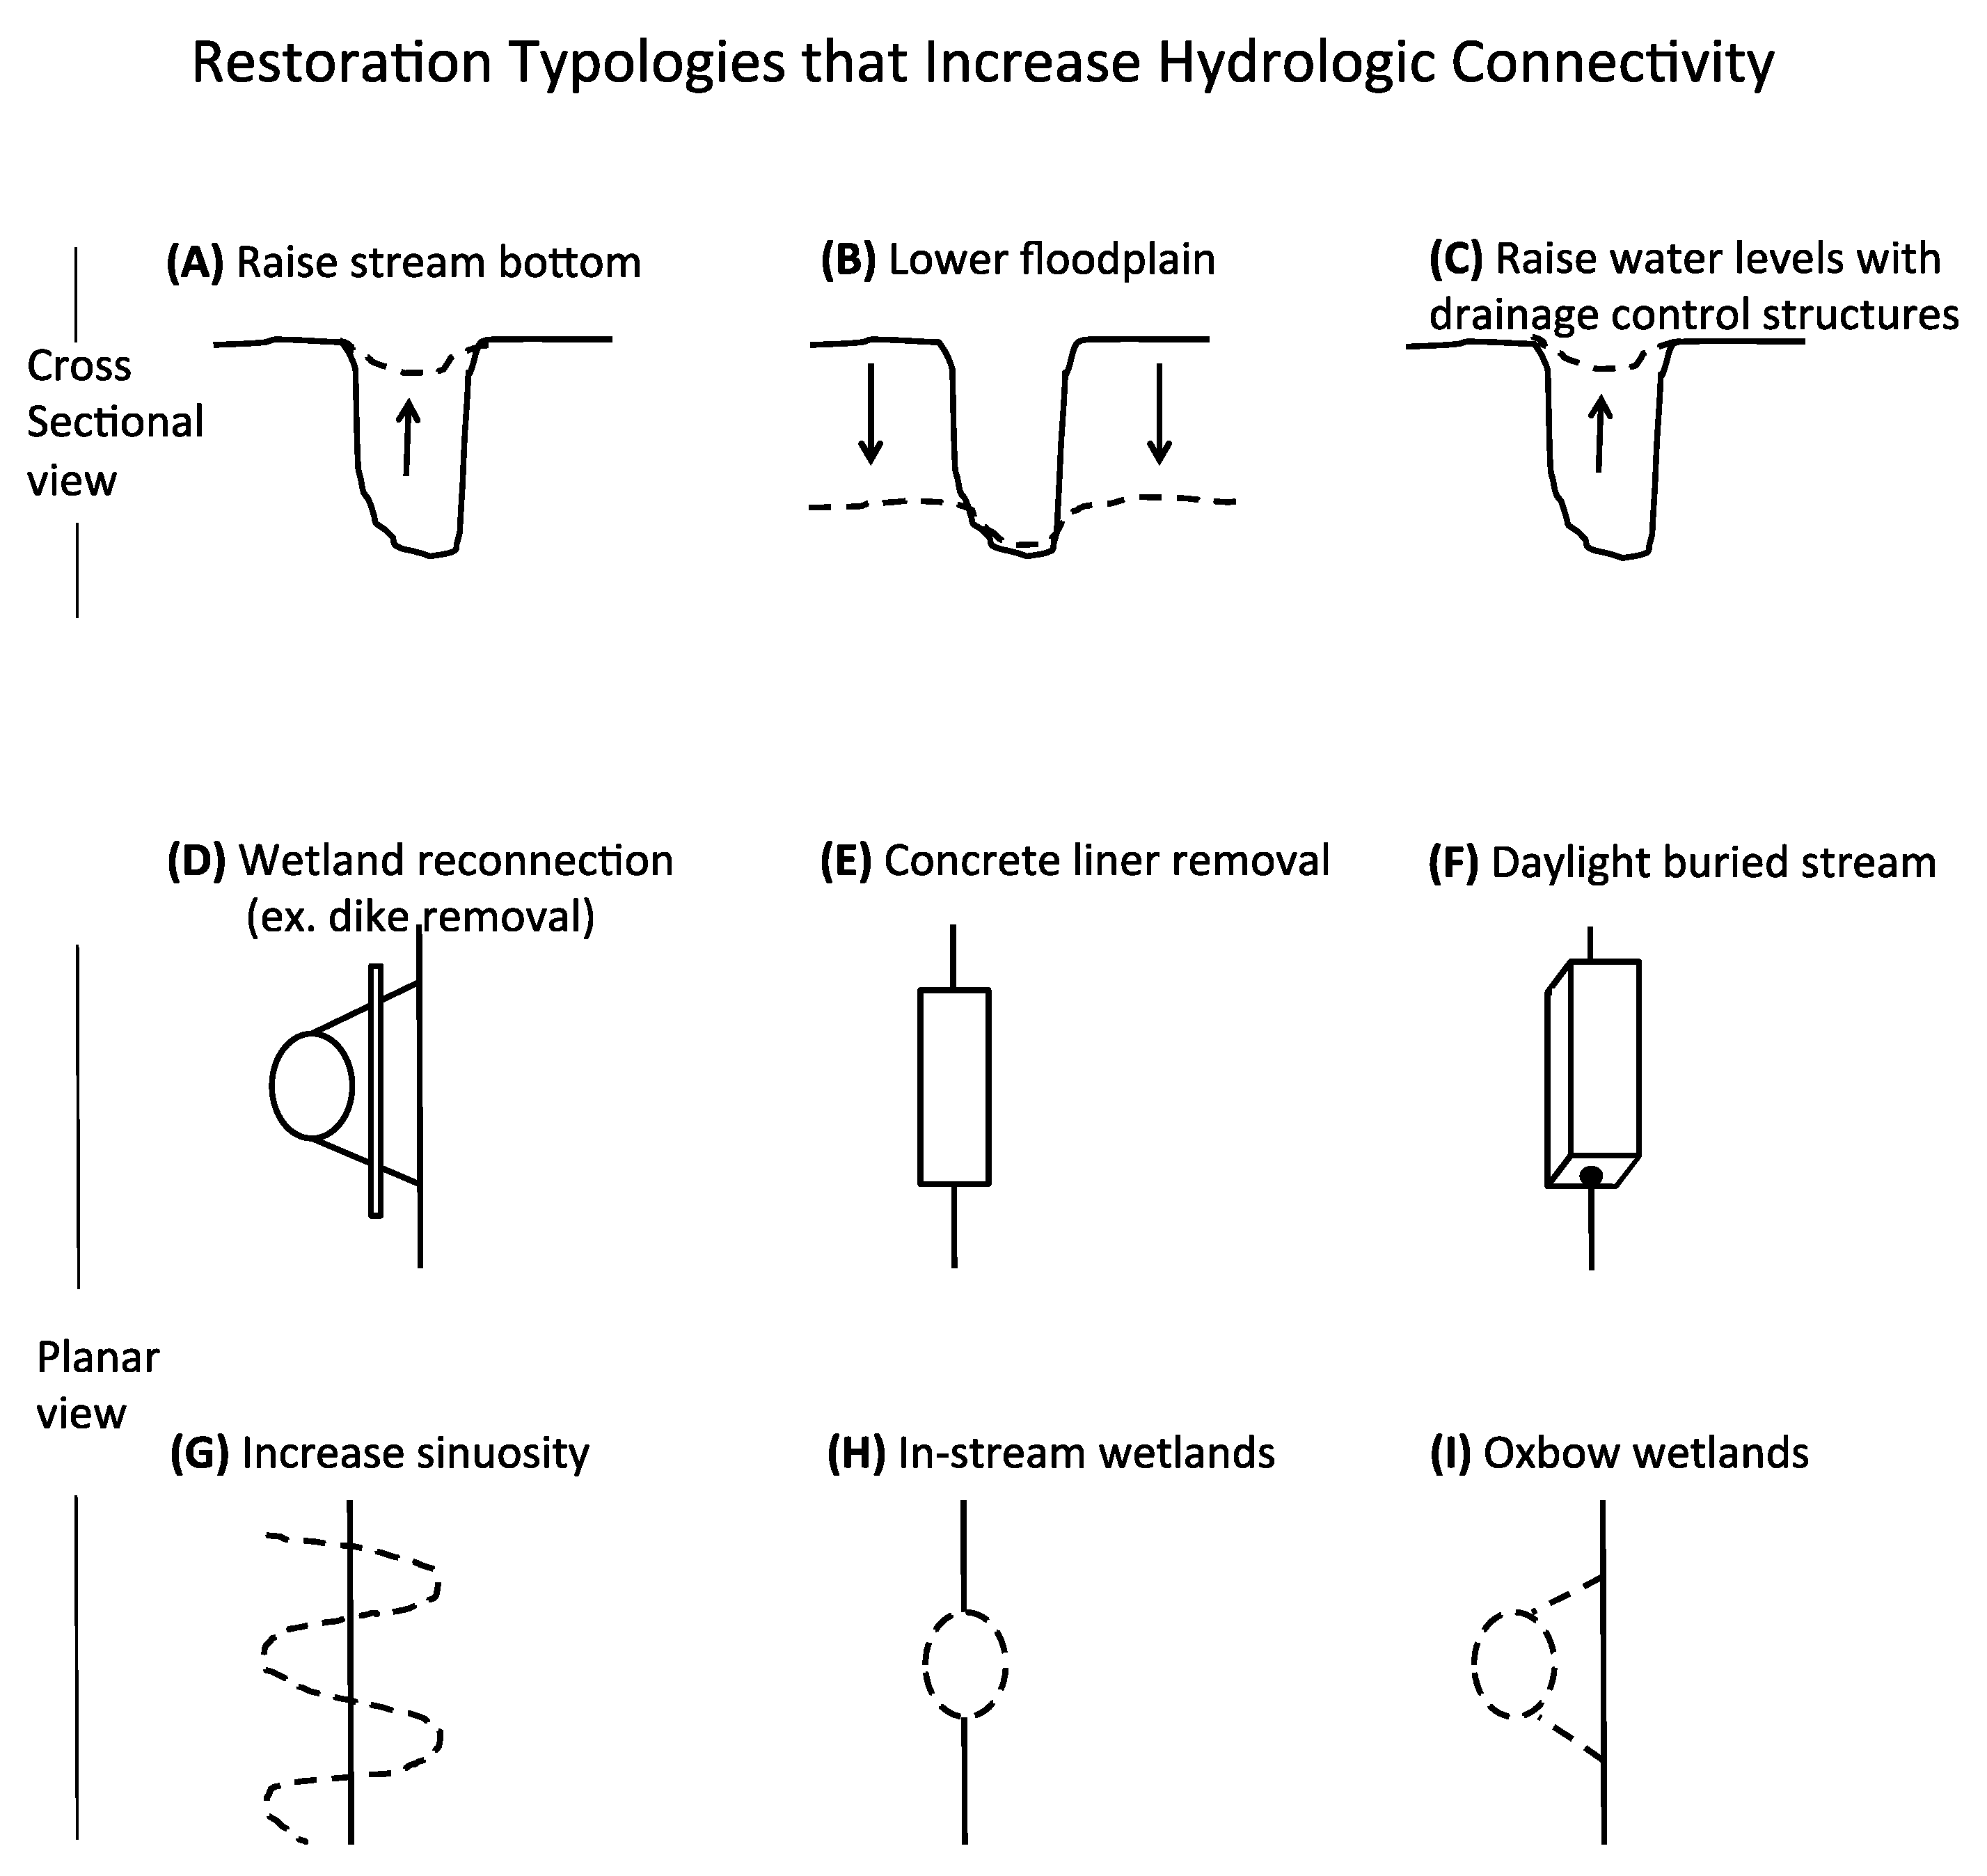
2.3. Restoration Typologies That Increase Hydrologic Connectivity

Based upon the approaches we found in the literature, stream and river restoration practices were divided into nine typologies that increase hydrologic connectivity (Figure 2). We grouped these typologies into strategies based on how they specifically increase hydrologic connectivity: typologies ABCD lead to floodplain reconnection; typologies EF lead to streambed hyporheic reconnection; typology G increases stream surface area; and typologies HI lead to increased wetland surface area (Table 1).
When we analyzed the 79 empirical nutrient studies, we found that there were 27 unique combinations of the nine typologies (Table S1; Figure 3; Supplementary Figure S1). For each study, we examined whether stream restoration produced a positive, neutral, or negative result when compared to a pre-restoration condition or to a reference condition (Table S1). Depending upon the study, the reference condition could be a degraded reference or a natural reference. Natural references are nearby streams of similar size and geology that are considered to be in good ecological condition. Degraded references are considered to be similar to the pre-restoration condition of the stream that was restored. We assigned a study a positive rating if restoration increased retention rates or if restoration decreased nutrient concentrations or loads when compared with a pre-restoration or reference condition. We assigned a neutral rating if restoration did not change retention rates, nutrient concentrations or loads. We assigned a negative rating if restoration decreased retention rates or if restoration increased nutrient concentrations or loads. Many of the negative ratings were for comparisons against natural references. If studies had mixed results (e.g., a positive result during the summer and a neutral result during the winter), we listed both positive and neutral results (which is how we ended up with 114 results from 79 studies in Table 1). Overall, 62% of results were positive, 26% were neutral, and 12% were negative (Table 1). The most frequent combinations of our restoration typologies (from Figure 2) were: reconnect oxbow wetlands (I; 11 studies), raise stream bottom (A; 9 studies), raise water levels with drainage control structures (C; 8 studies), and lower floodplain (B; 7 studies). Most studies listed a single restoration typology (N = 45 studies) or two typologies (N = 20 studies). There were also studies that listed three, four, and five typologies (N = 6, 7, and 1 studies, respectively).

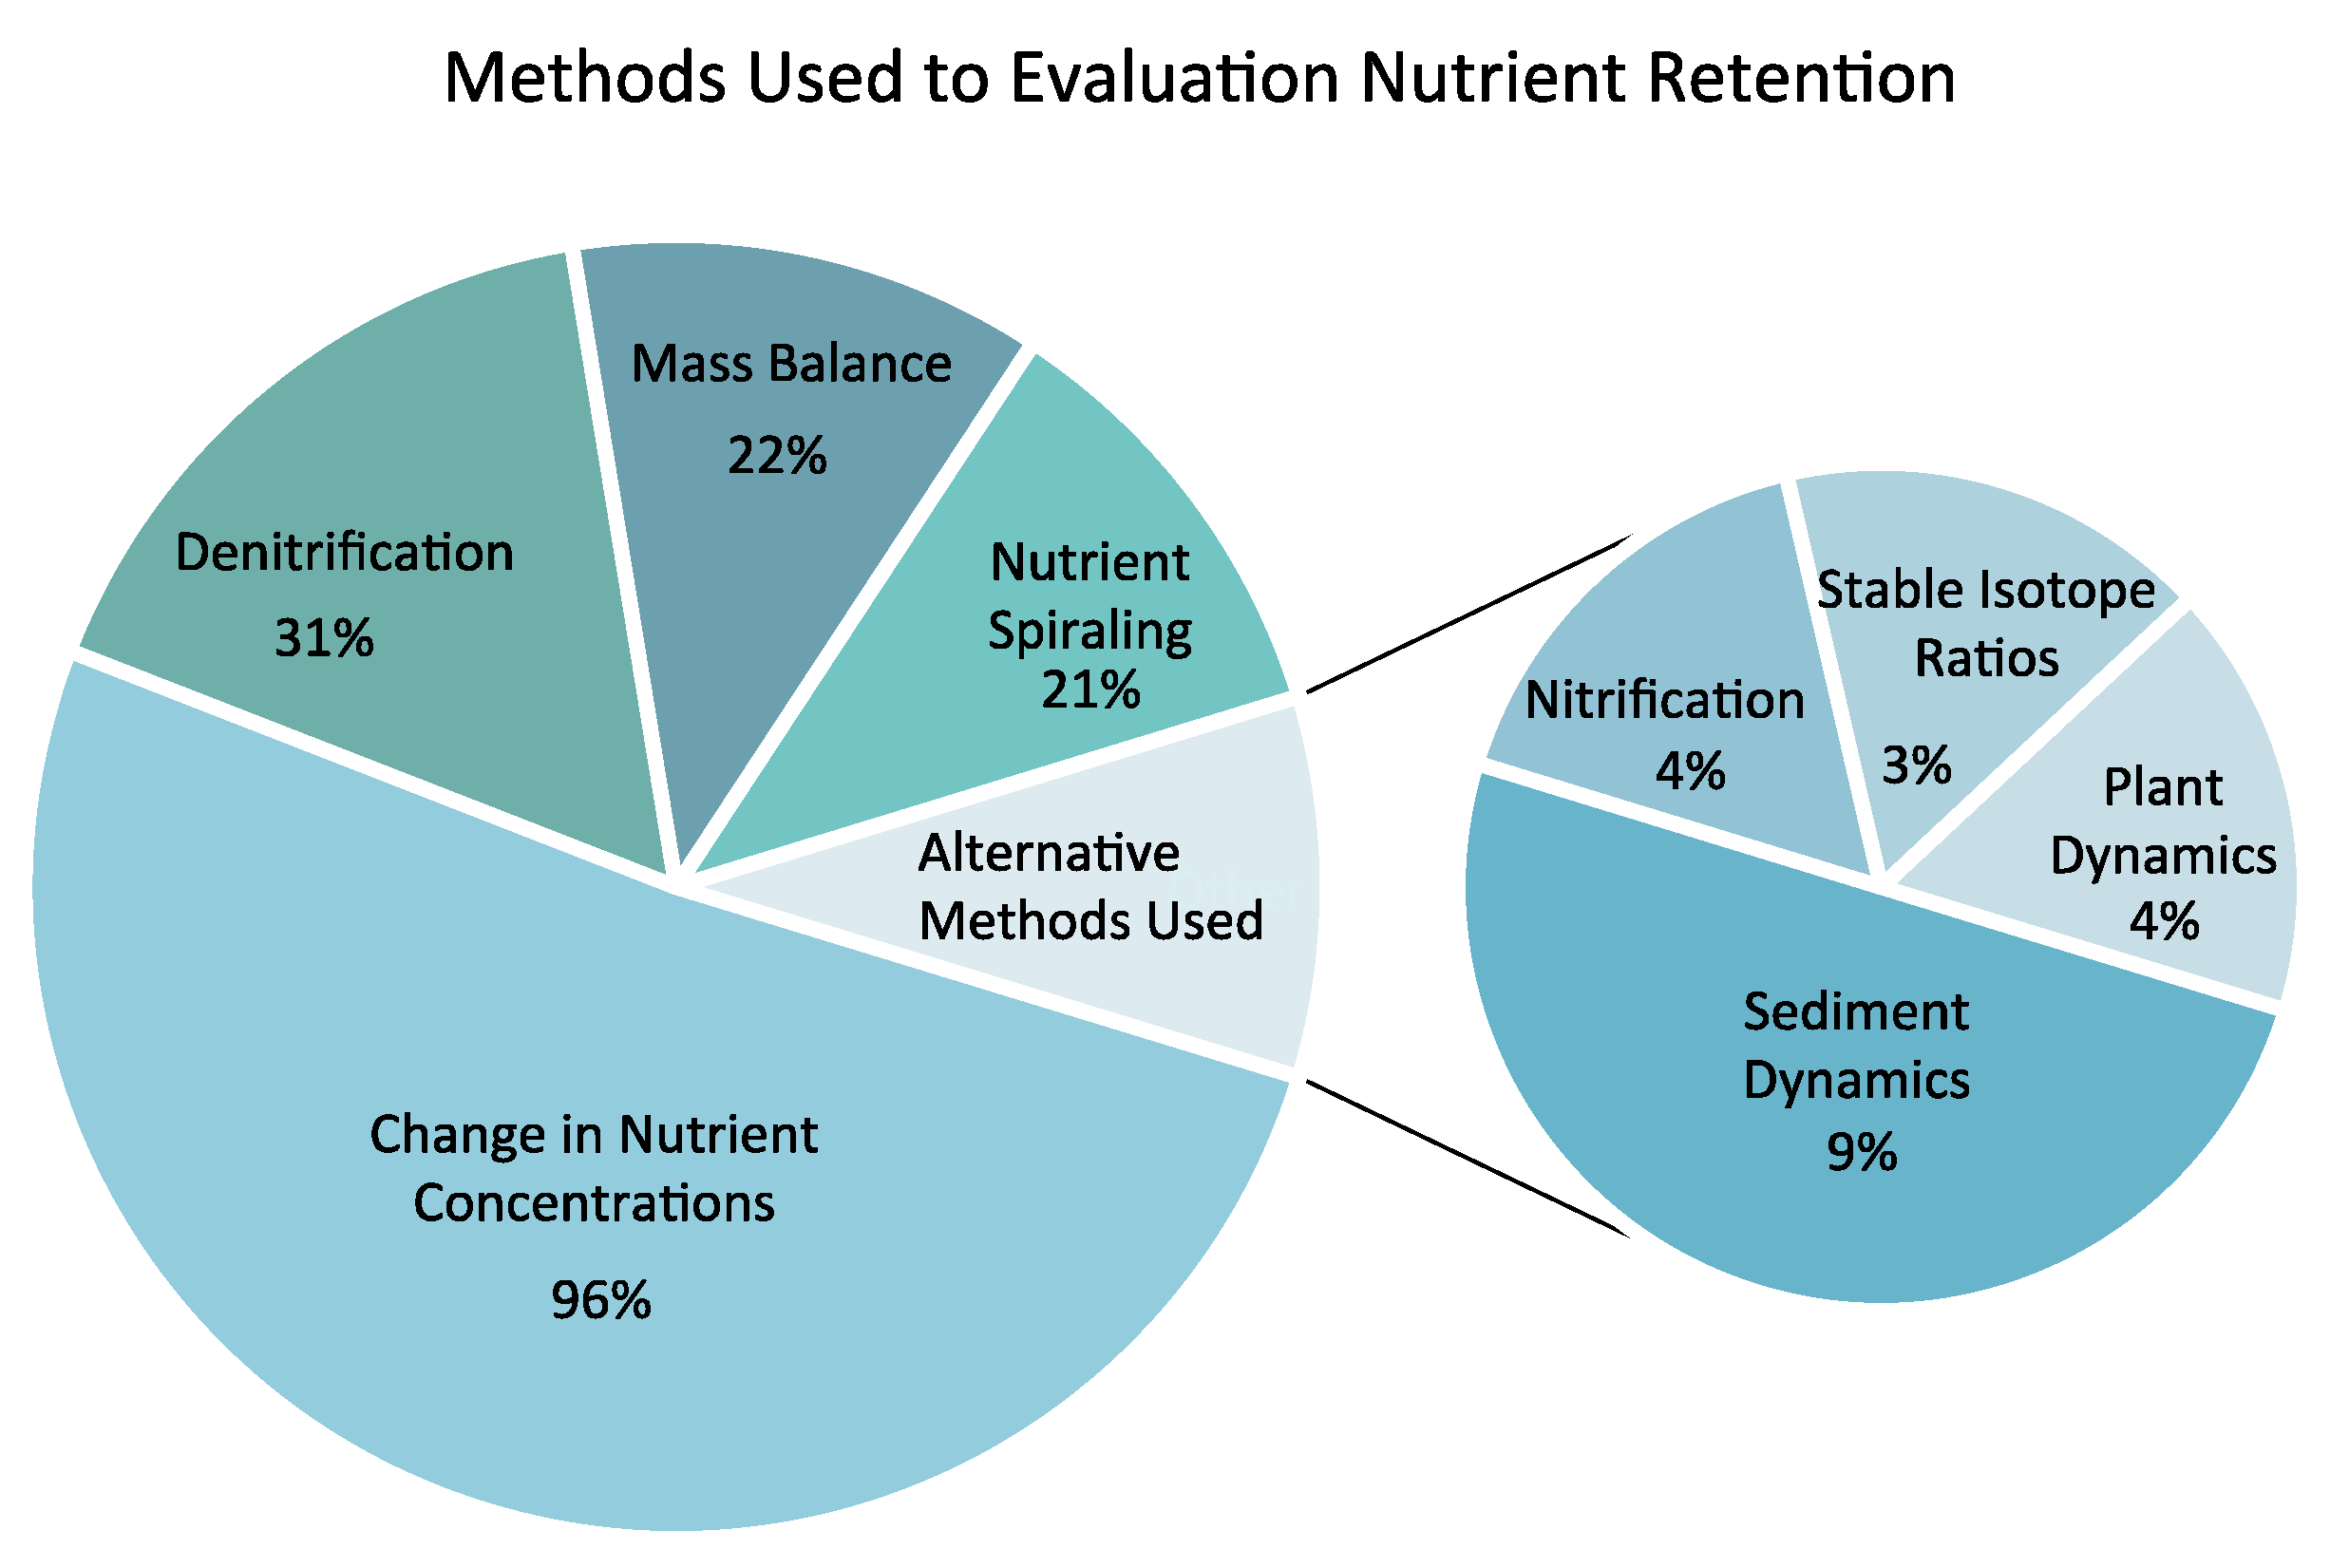
2.4. Comparison of Methods Used for Evaluating Stream Restoration Effectiveness

There were many diverse methods used to evaluate the effects of stream and river restoration on nutrient retention (Figure 3). The most common methods were changes in nutrient concentrations, mass balances, nutrient spiraling rates, and denitrification measurements. For a more detailed examination of common methods used to monitor restoration projects please see Supplementary Materials. Alternative methods used for evaluating stream and river restoration included: sediment dynamics, plant dynamics, nitrification, stable isotope ratios, dissimilatory nitrate reduction to ammonia (DNRA), anammox, microbial biomass nitrogen (MBN) and potentially mineralizable nitrogen (PMN). Sediment dynamics ranged from measuring concentrations [61] to N sedimentation and turnover rates [62], and experimentally evaluating changes like N release from sediments deposited on the floodplain [63]. Plant dynamics included measurements of biomass, plant uptake, and nutrient utilization efficiency [64,65]. Stable isotope ratios were used to determine composition and microbial utilization of particulate organic material [65,66,67].
Further examination revealed that a diversity of methods were used for measuring denitrification and mass balances, which made it challenging to compare rates. Thus, we chose to focus a more intensive meta-data analysis on the nutrient spiraling results. We reviewed the results from each nutrient spiraling study and recorded the potential controlling factors and removal metrics for N and P. We used regression analysis to test for relationships between nutrient removal metrics and potential controlling factors. We used ANOVA analysis to test nutrient removal metrics for differences between restored, degraded, and more pristine reference streams. WebPlotDigitizer (Version 3.6) was used to extract data from graphs when it was not available in text form [68]. Statistical analyses were performed using R [69].

3. Nutrient Spiraling Meta-Data Analysis

We tried to find a standardized metric that could be extracted from the maximum number of studies in order to make the broadest comparisons.In other words, studies are not always done using comparable methods and results are not always expressed in similar units, but nutrient spiraling gave us an opportunity to include more studies and compare results with a common metric. Results are based on 240 individual experimental additions of ammonium (NH4+), nitrate (NO3), and SRP from 15 published studies (Table 2 and Table 3). Nutrient uptake was measured by 19% of the studies reviewed here. All of the studies that measured nutrient uptake took place within the channel of a restored stream (except for Bukaveckas 2007, which occurred in a backwater oxbow of a remnant channel).
Nutrient spiraling is a term that describes the cycling of nutrients as they are assimilated from the water column into benthic biomass, temporarily retained, and mineralized back into the water column [70]. Nutrient spiraling rates are influenced by a variety of abiotic and biotic factors. Abiotic factors such as channel size and the surface area to channel volume ratio influence the duration (residence time) that water is exposed to biochemically reactive substrates [71]. Biotic factors such as bacteria, fungi, algae, and macrophytes can control nutrient uptake rates. Stream restoration and other restoration projects are able to modify both abiotic (e.g., channel width, transient storage, temperature, and sunlight availability) and biotic factors (by altering flow, substrate composition, and plantings) important to nutrient spiraling.
Out of the 15 nutrient spiraling studies we reviewed, various study designs were employed to identify factors controlling nutrient flux (Table 2 and Table 3). Some studies injected a single nutrient while others injected multiple nutrients. There were 66 single ammonium injections [59,72,73,74], 45 single nitrate injections [30,75,76,77,78], 38 combined ammonium and phosphate experiments [79,80], 59 combined nitrate and phosphate experiments [29,81], and 30 combined ammonium, nitrate and phosphate experiments [82,83]. Based on the type of nutrient injection, the total number of experiments was 134 ammonium, 134 nitrate, and 127 phosphate injections.
Nutrient spiraling is typically described by four terms: uptake rate coefficient (k), uptake length (SW), areal uptake (U), and uptake velocity (Vf). Uptake rate coefficient (k) describes uptake on a volumetric basis in units of s−1. Uptake length (SW) is the average downstream distance that a nutrient atom travels in meters in its dissolved form in the water column before it is consumed by biota or sorbed onto sediments. Areal uptake (U) is the nutrient uptake rate per unit area of stream bottom in μg/m2/s. Uptake velocity (Vf) is the vertical velocity of nutrient molecules through the water column towards the benthos in mm/min. Vf is useful for measuring the absolute demand by a stream’s benthos for a nutrient. In contrast to SW and U, Vf is independent of hydrologic characteristics and concentration [84]. The most commonly reported metric was Vf which was reported by 80% of nutrient spiraling studies reviewed, followed by U (60%), SW (47%), k (27%), and % removal (20%). If stream restoration was successful in improving nutrient retention we should expect to see shorter uptake lengths, higher areal uptake rates, and higher uptake velocities. Additional metrics analyzed were amount of nutrient removed in g/day [75] and uptake coefficient in the main channel (λ) vs. uptake coefficient in the transient storage zone (λs; s−1; [79]). Nutrient spiraling studies can represent a “snapshot” of nutrient retention in a particular stream at a specific time and discharge [84].

3.1. Evaluating Potential Controlling Factors of Nutrient Uptake

We examined 34 different possible controlling factors to determine potential drivers of nutrient spiraling rates (Table S2). There were substantial inconsistencies from study to study in terms of what was measured, recorded, and reported. Some of the potential controlling factors were commonly available (e.g., discharge) while others were only recorded in a single study (e.g., % woody debris). Thus our meta-data analysis of nutrient spiraling controlling factors required that we draw upon different studies and sites for different metrics. Therefore, sample size for each variable varied considerably. We divided these variables into five categories: watershed scale variables, reach characteristics, water chemistry, transient storage, and stream productivity (for more details see Supplementary Materials).

3.2. Nutrient Spiraling Results

3.2.1. Nitrate

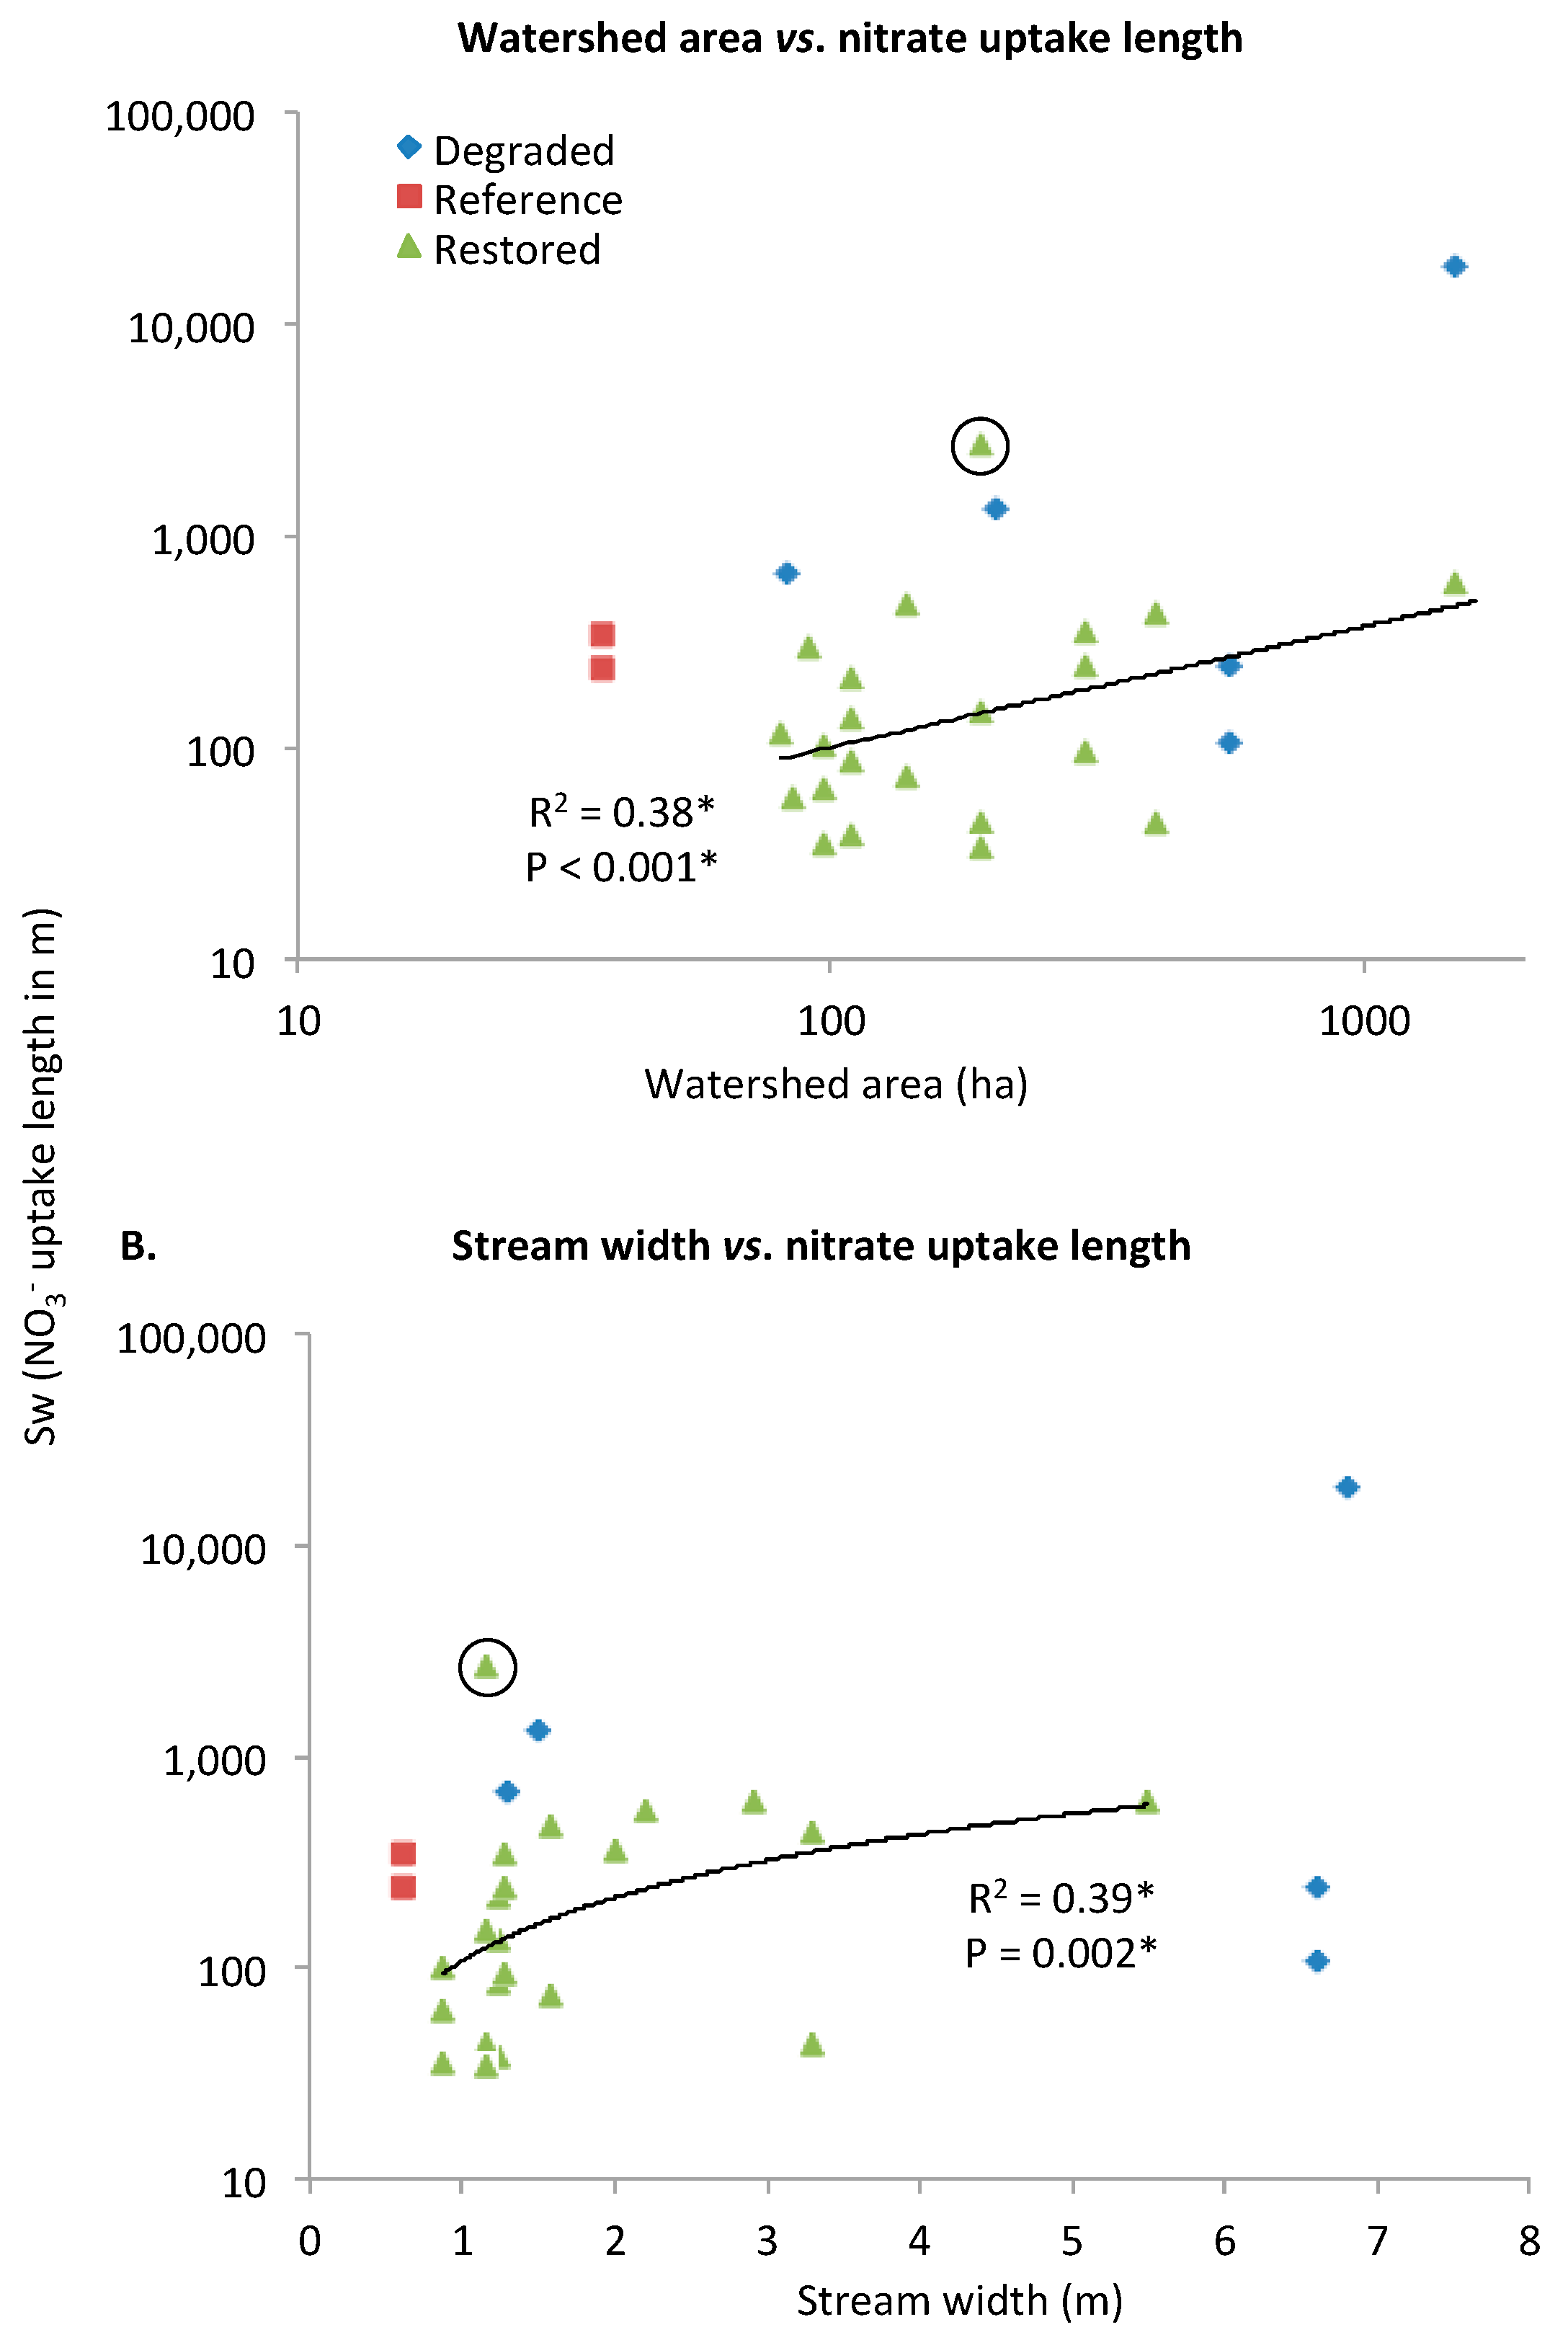
Nitrate Uptake Length (SW)

Nitrate uptake lengths (SW) in restored streams ranged from 34 to 2668 m (mean: 316 m, median: 136 m, N = 25 measurements, Table 3). In comparison to restored streams, nitrate molecules had to travel on average 10 times further (p = 0.03) before being assimilated in the degraded streams, which ranged from 108 to 18,632 m (mean: 3107 m; median: 1,341 m; N = 13 measurements). Note that most study reaches are usually under 1000 m; therefore, uptake lengths greater than 1000 m indicate that nutrient molecules are transported downstream with minimal uptake.
Likewise, nitrate molecules tended to travel further before being assimilated in larger and faster rivers [84]. We found that nitrate SW was best correlated with watershed area (R2 = 0.13; Figure 4; Table 4). When a winter value of 2,668 m from McMillan et al. (2014) was excluded, linear regression showed a significant positive relationship between nitrate uptake length (m) and two factors related to size: watershed area (ha, F1, 19 = 5.0, n = 21, p < 0.001) and average stream width (m, F1, 19 = 13.7 n = 21, p = 0.002).

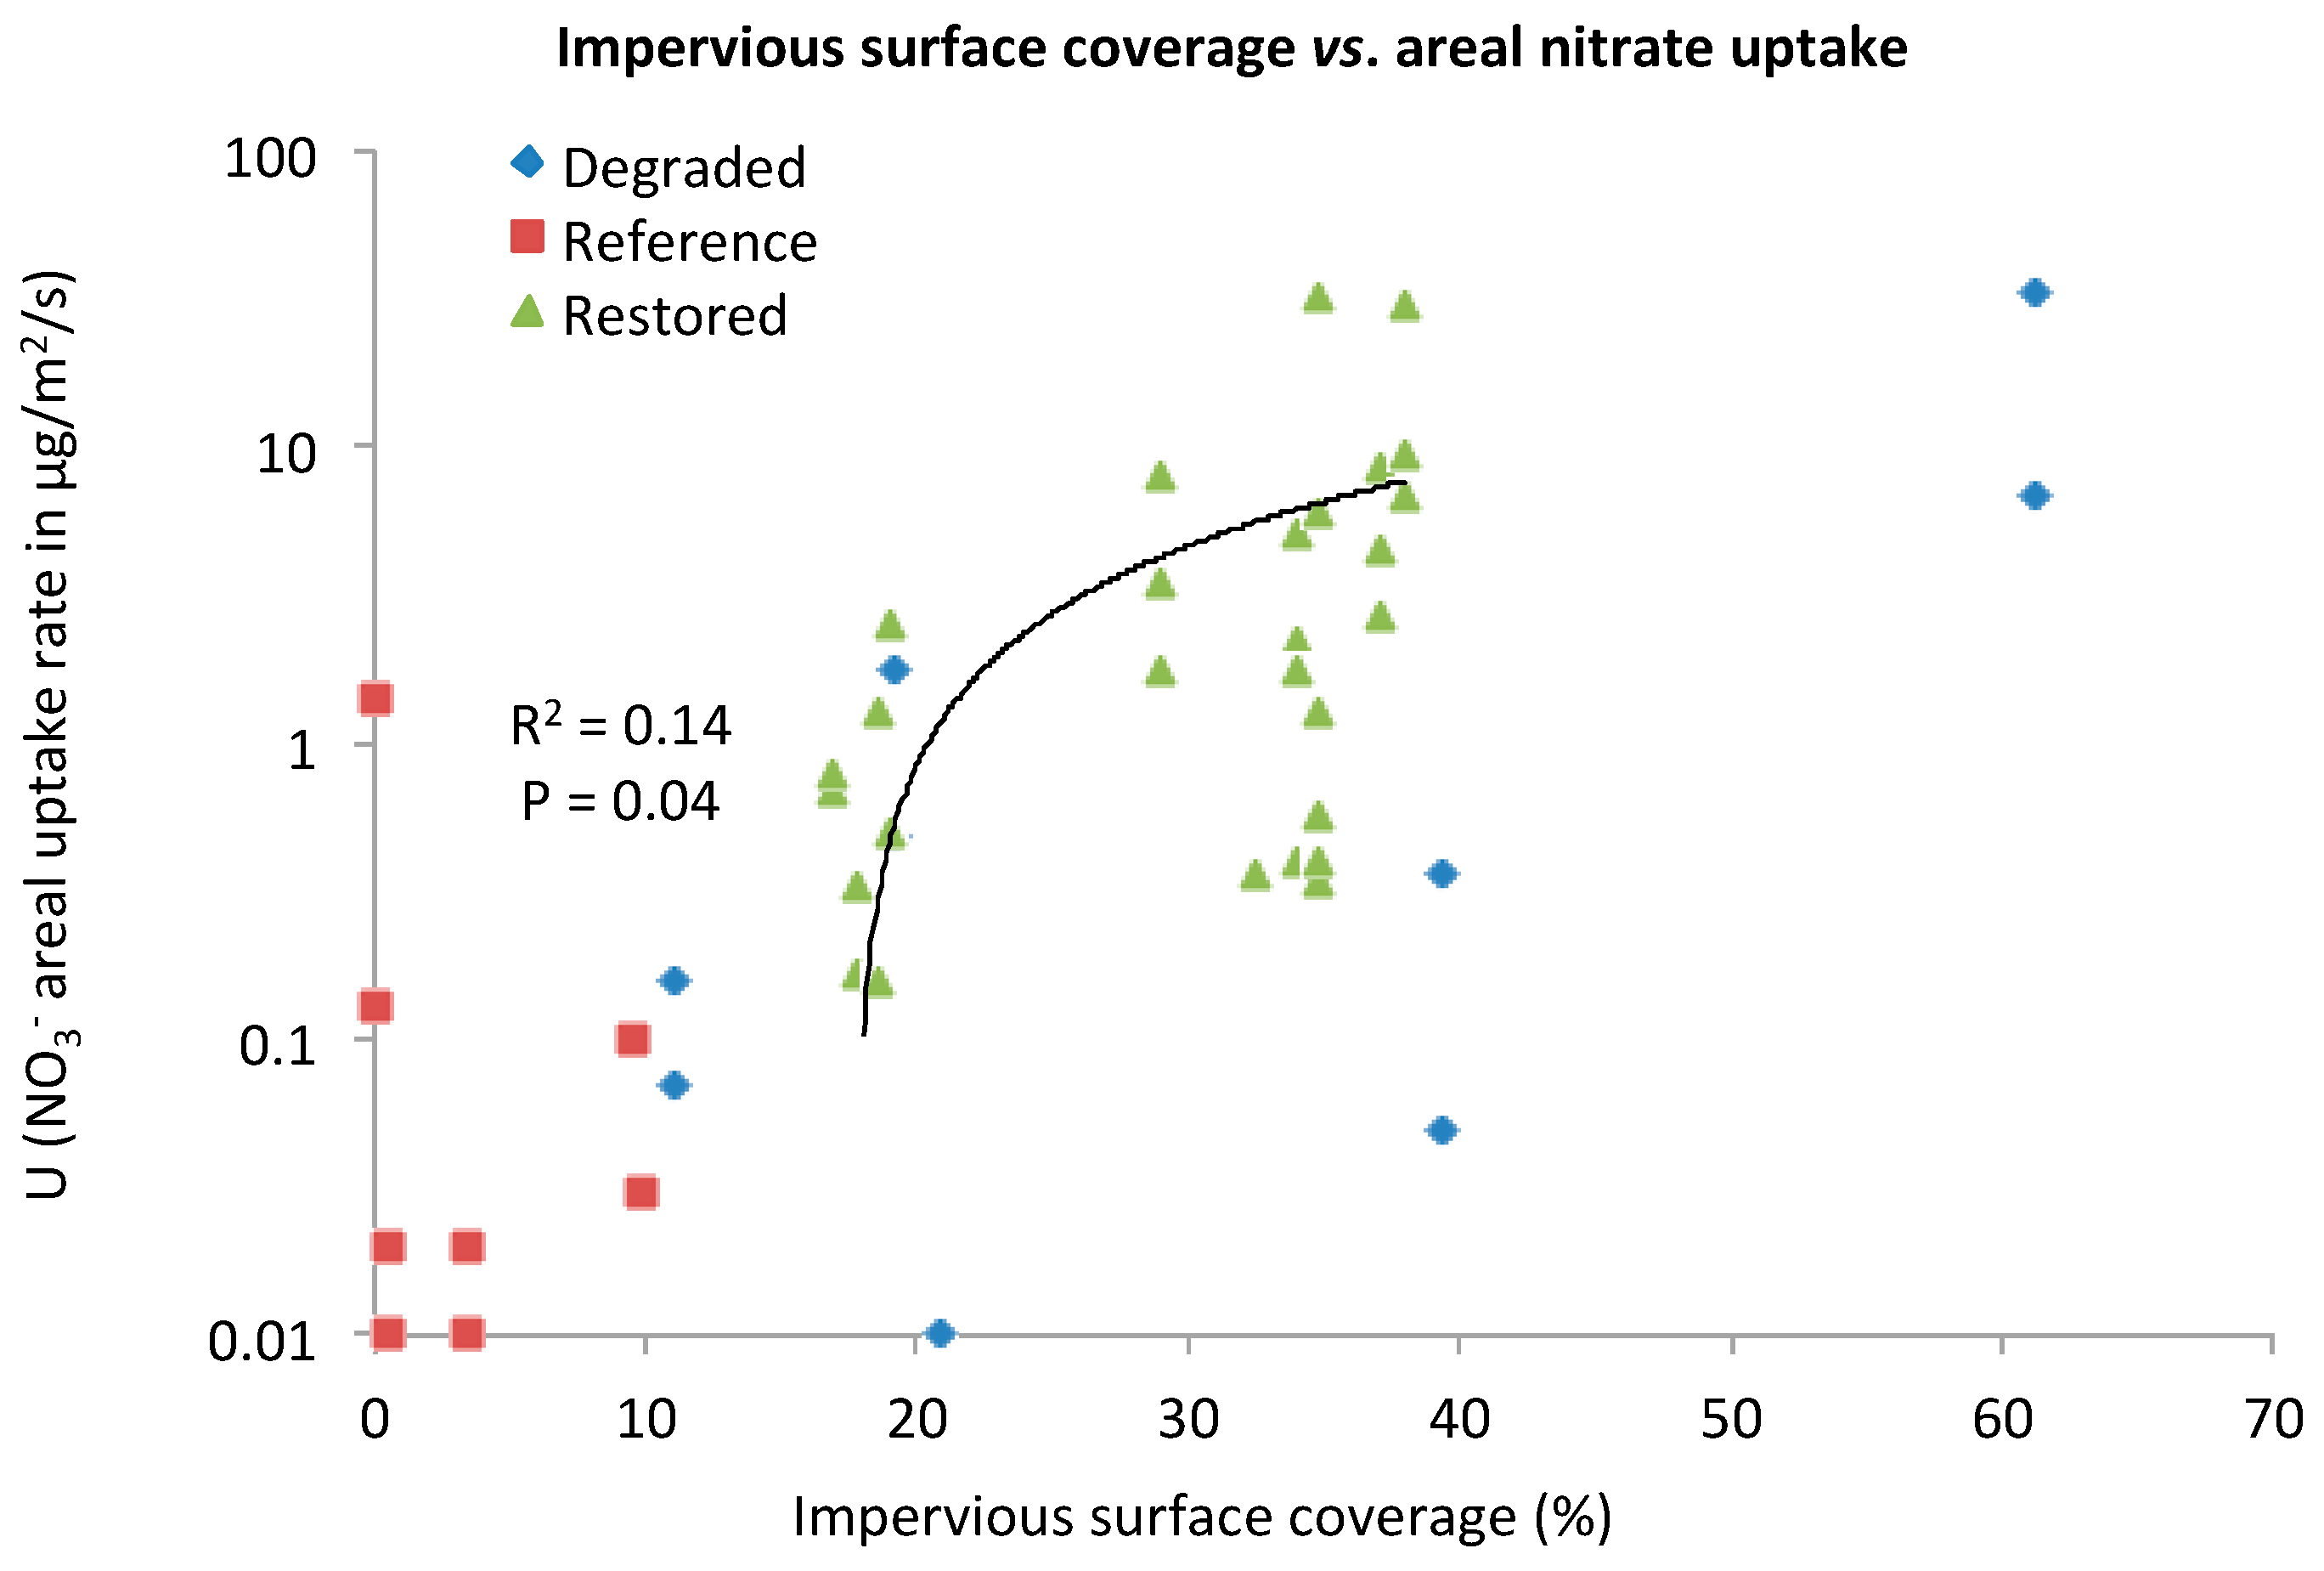
Nitrate Areal Uptake Rate (U)

Areal nitrate uptake rates (U) in restored streams ranged from 0.15 to 32.3 μg/m2/s (mean: 5.2 μg/m2/s; median: 1.8 μg/m2/s; N = 32 measurements). There was a significant positive relationship between areal nitrate uptake rate (μg/m2/s) and % impervious surface coverage (Figure 5, F1, 28 = 4.9, n = 30, p = 0.04). As imperviousness is often used as a proxy for urbanization [85], this relationship may indicate higher rates in urban streams receiving higher nutrient loads.

Nitrate Uptake Velocity (Vf)

In the restored reaches, nitrate uptake velocity (Vf) ranged from 0.0 to 8.9 mm/min (mean: 2.2 mm/min; median: 1.1 mm/min; N = 36 measurements). The two lowest values were from restored acid mine drainage (AMD) impacted streams [83].

3.2.2. Ammonium

Ammonium Uptake Length (SW)

Ammonium uptake lengths (SW) averaged 70 m and 421 m in restored streams based on a total of 43 experiments from Weigelhofer et al. (2013) and Hines and Hersey (2011).

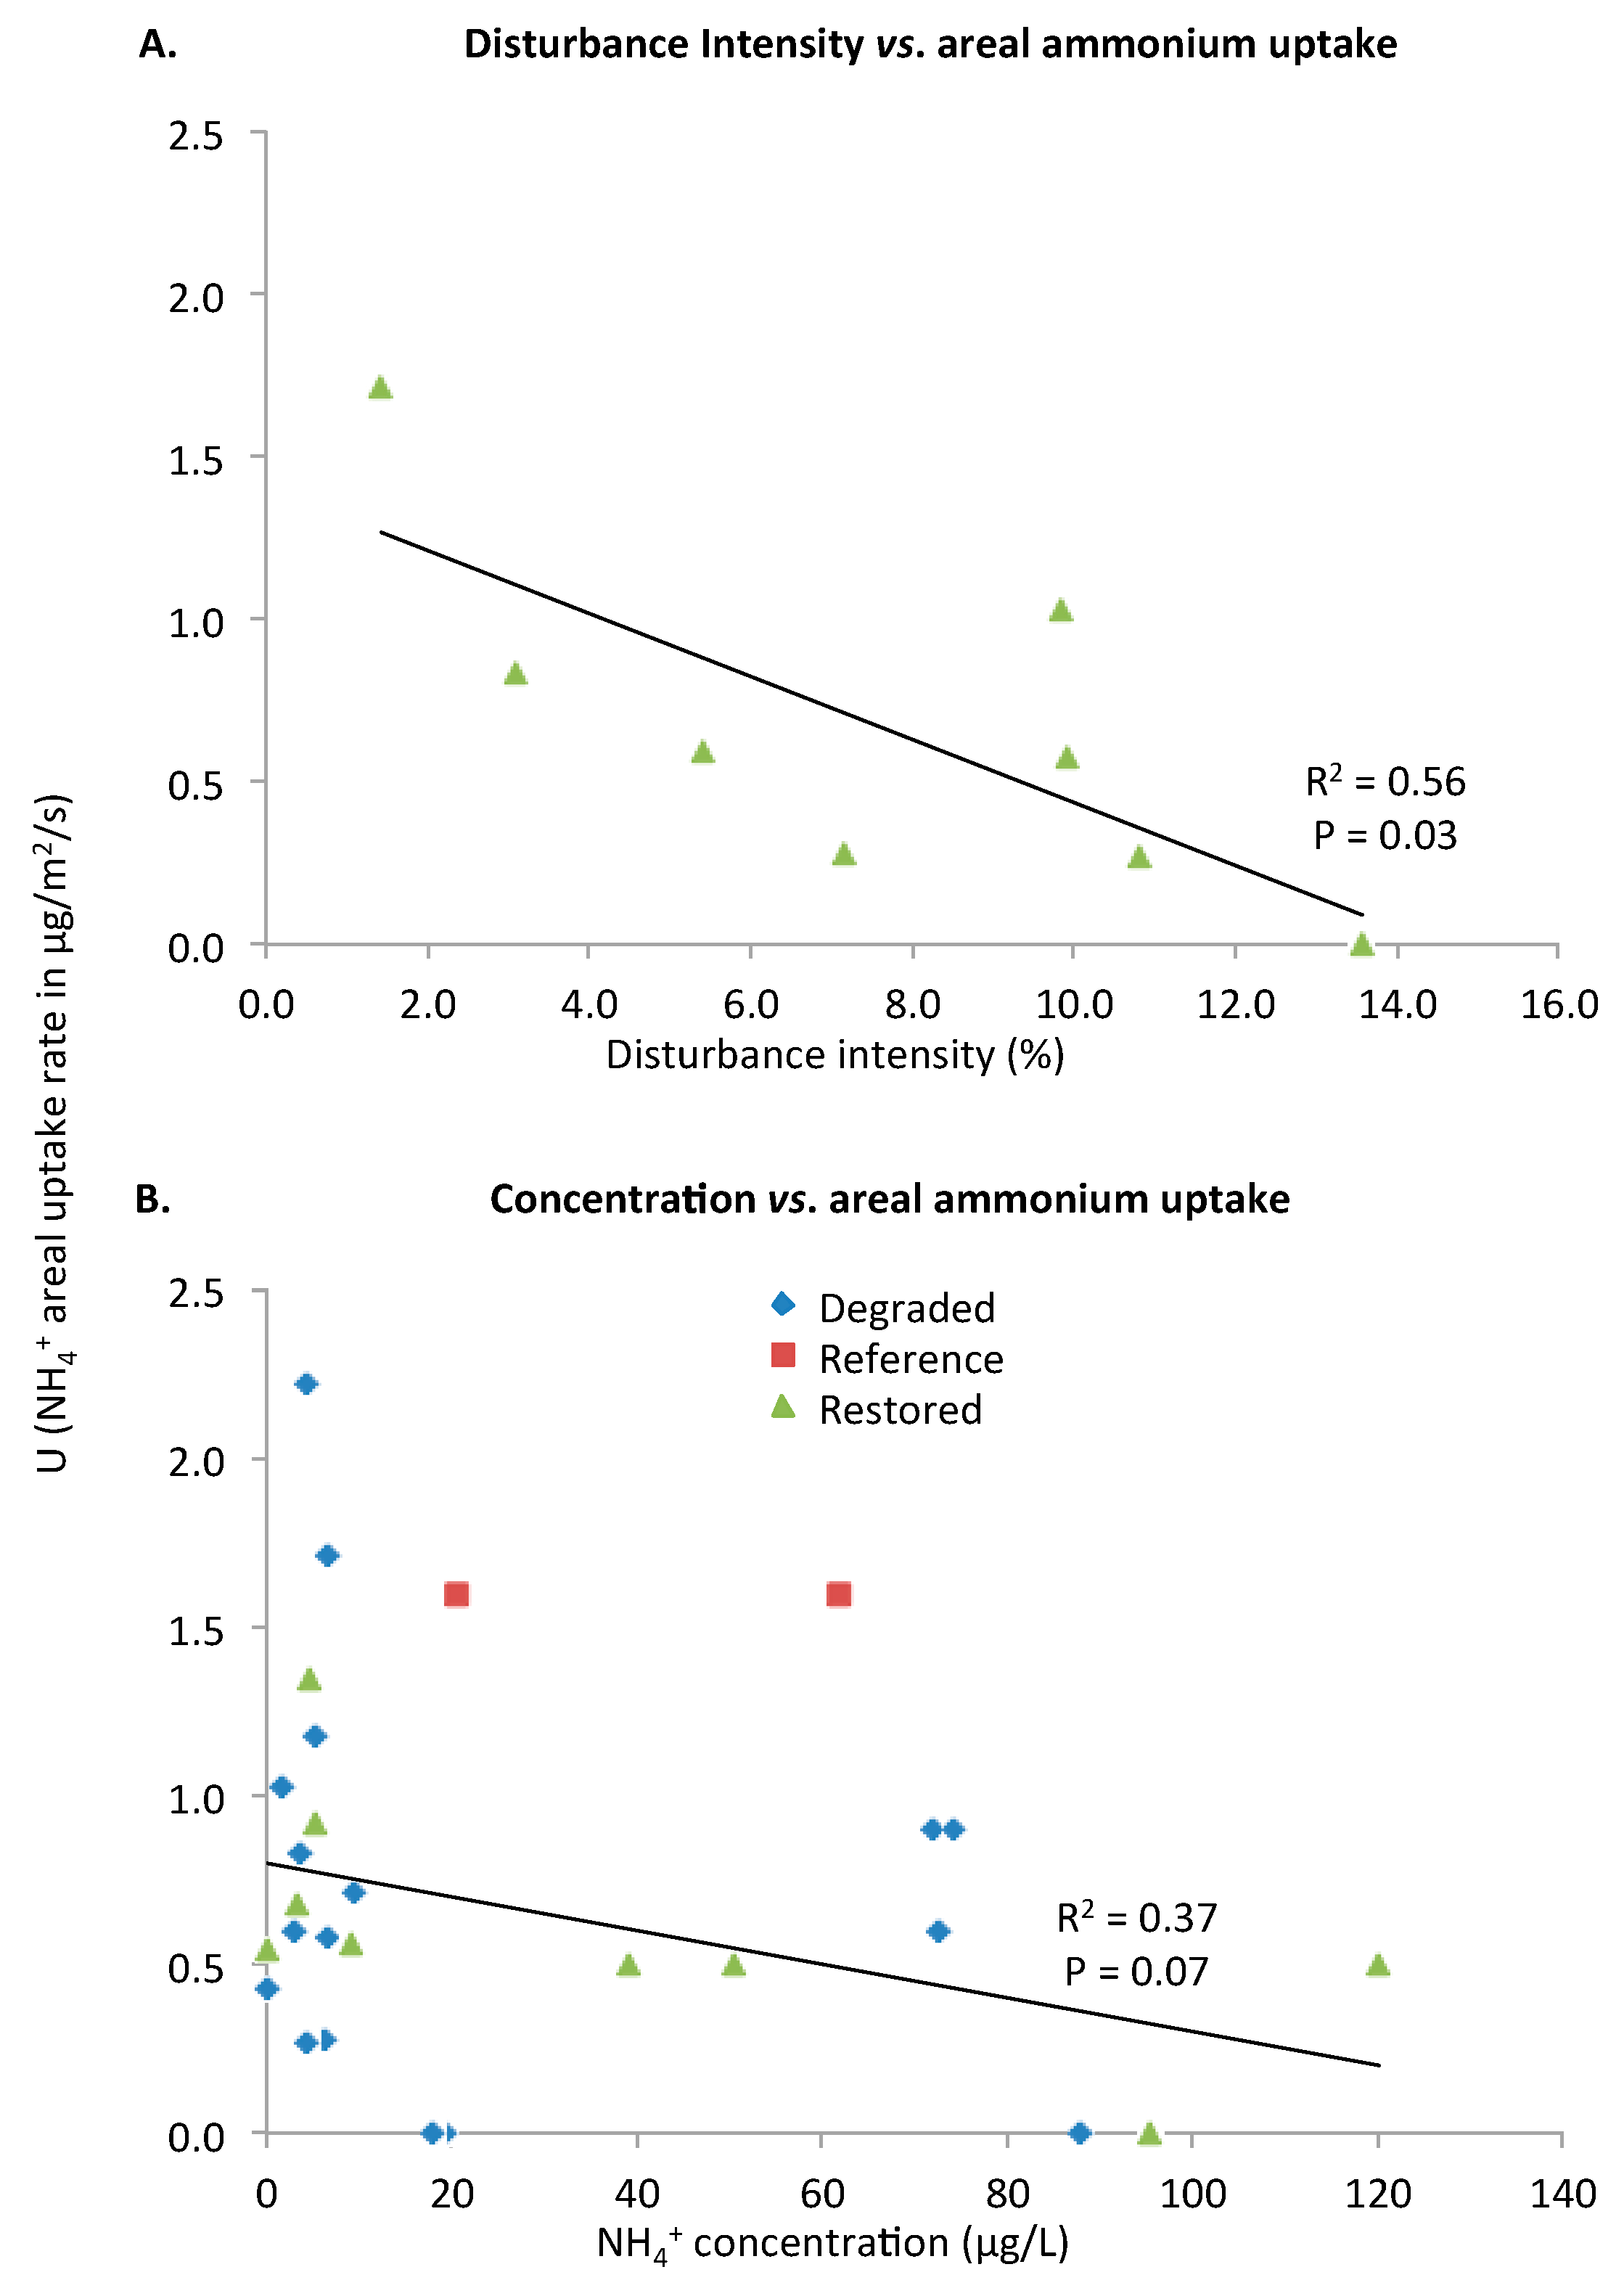
Ammonium Areal Uptake Rate (U)

Areal ammonium uptake rates (U) in restored streams ranged from 0.0 to 1.4 μg/m2/s (mean: 0.6 μg/m2/s; median: 0.5 μg/m2/s; N = 9 measurements), which were marginally significantly different than rates in degraded streams (p = 0.07). Rates in degraded streams ranged from 0.0 to 2.2 μg/m2/s (mean: 0.7 μg/m2/s; median: 0.6 μg/m2/s; N = 17 measurements).
There was a significant negative relationship between areal ammonium uptake rate (μg/m2/s) and disturbance intensity (Figure 6; F1,6 = 7.6, n = 8, p = 0.03) and a marginally significant negative relationship with ammonium concentration (μg/L; Figure 6; F1,6 = 4.7, n = 8, p = 0.07). This relationship is based on Roberts et al. (2007) which studied eight streams at Fort Benning Military Installation. These streams had some of the smallest transient storage zones and lowest ammonium uptake rates in the literature [59]. They found that disturbance intensity ranged from 3%–14% and when they experimentally added coarse woody debris they observed a short-term (within 1 month) increase in transient storage and increase in ammonium uptake.

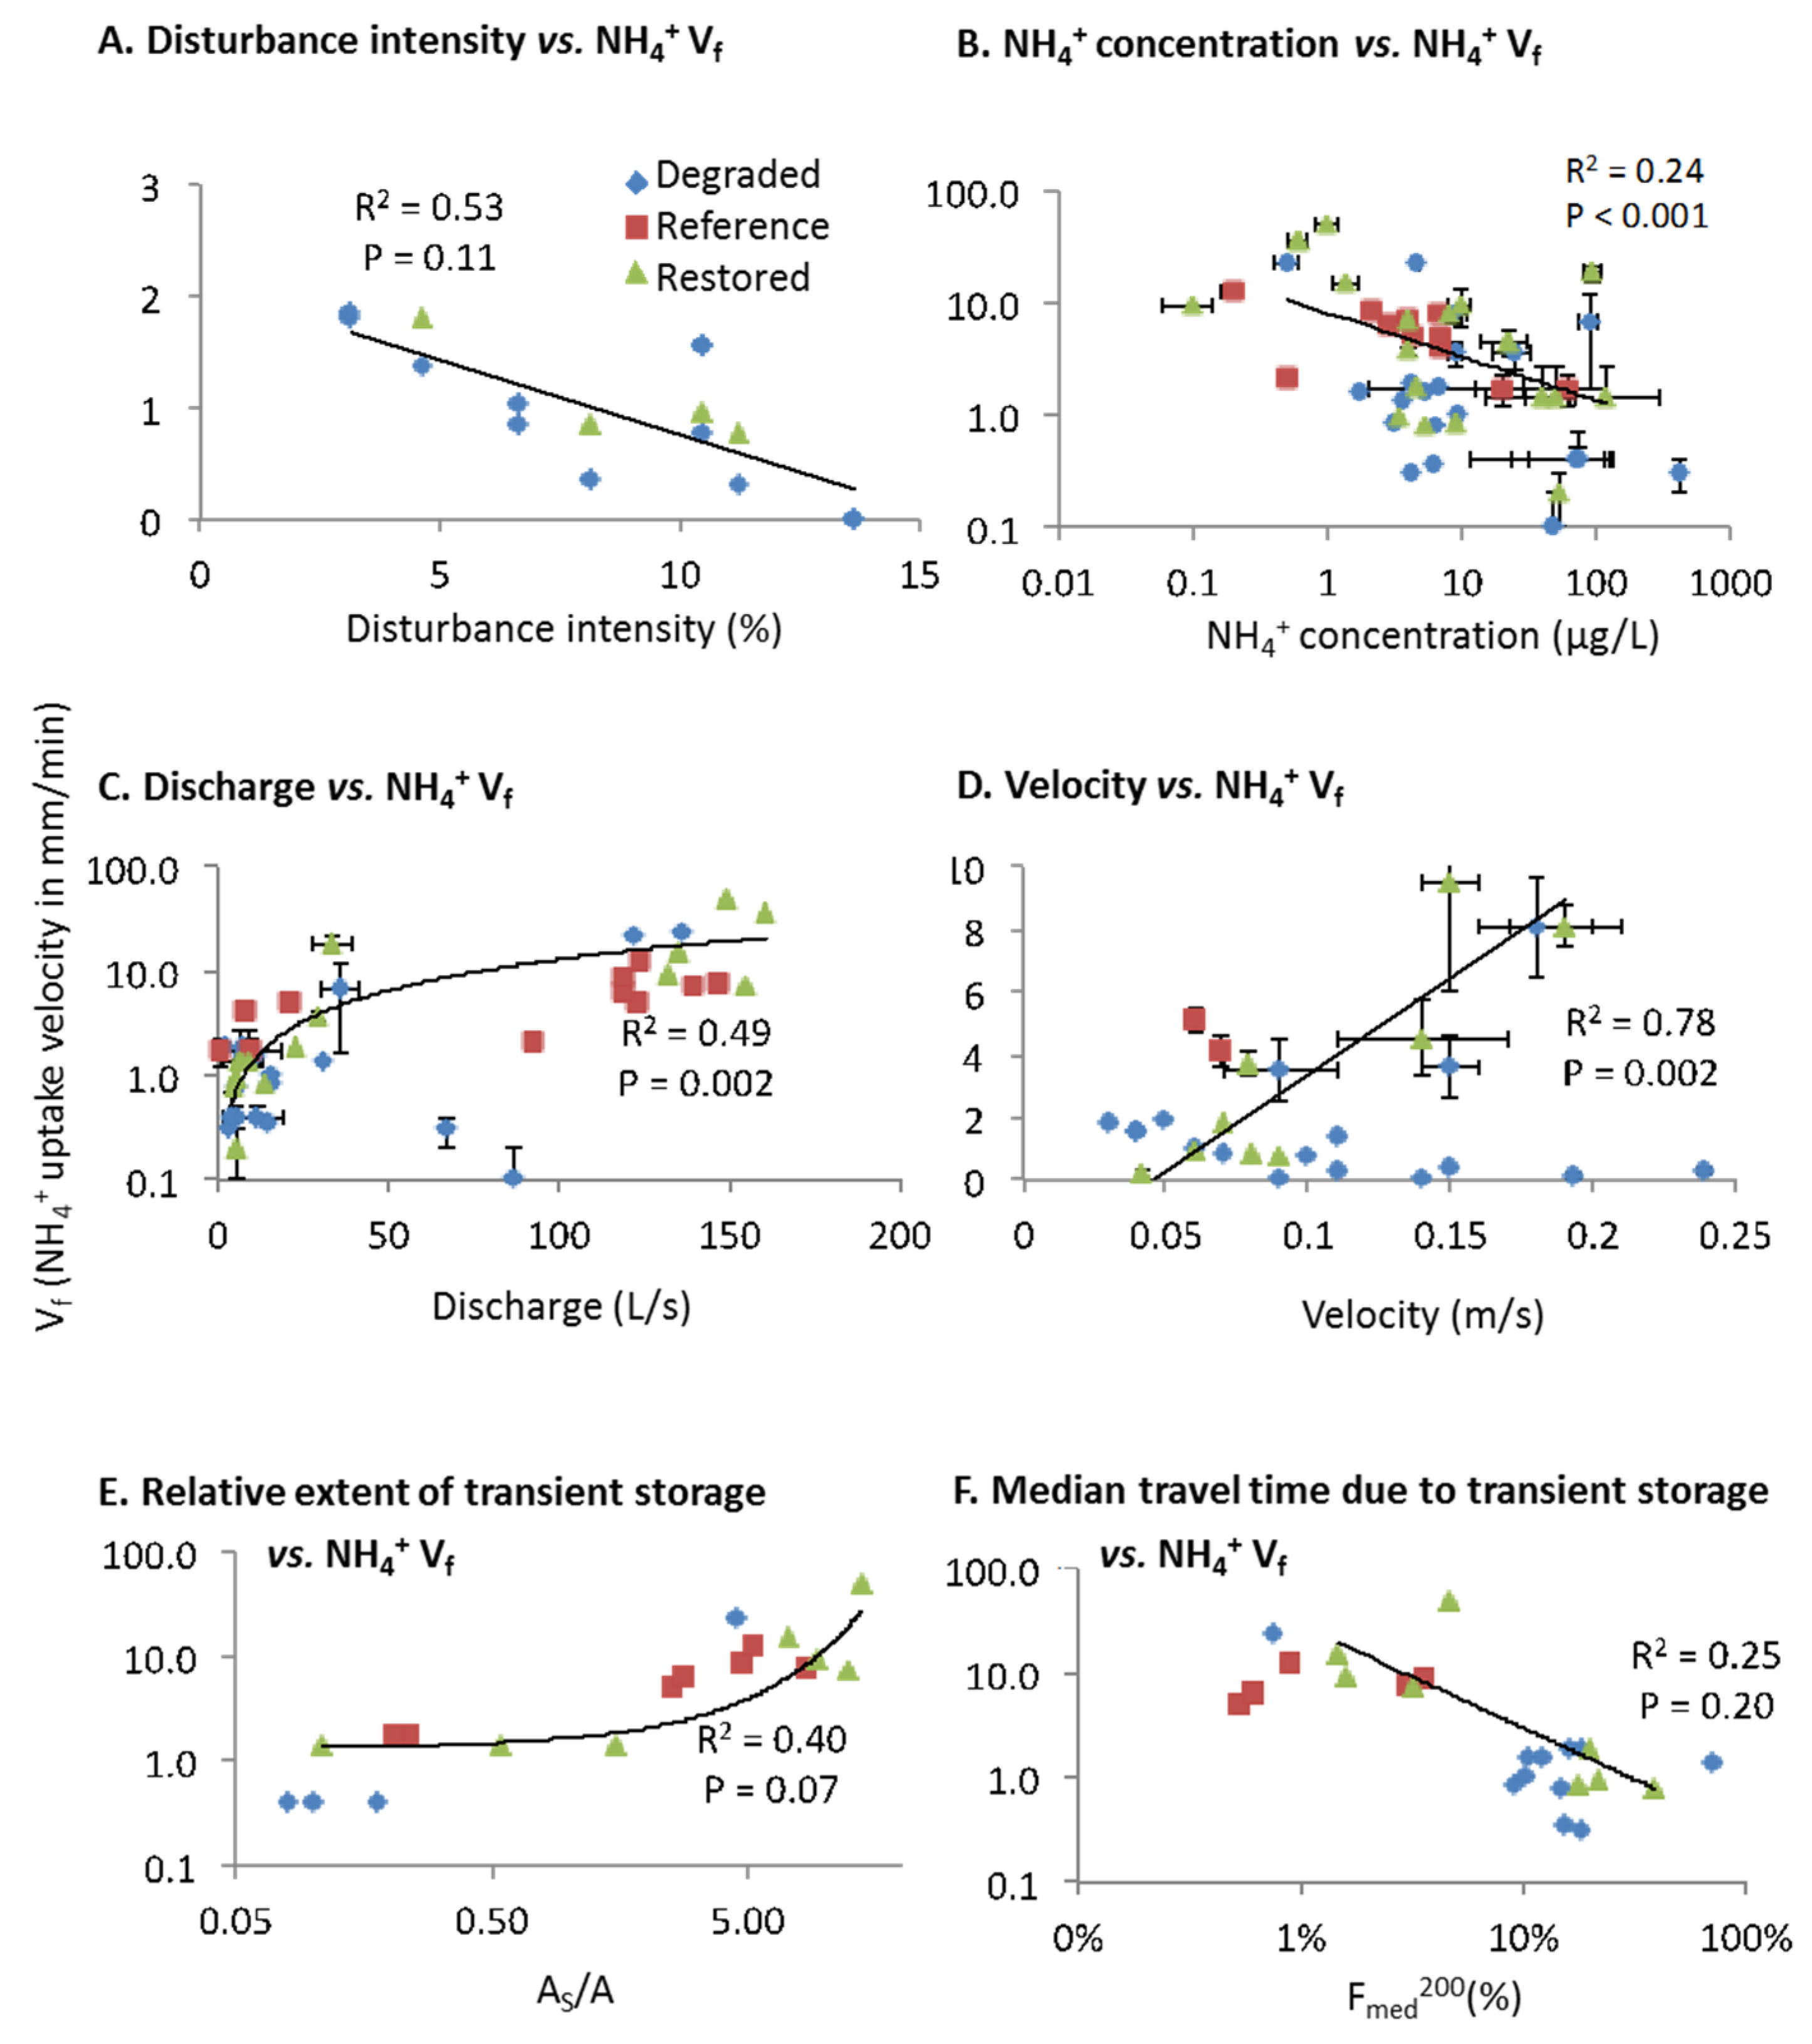
Ammonium Uptake Velocity (Vf)

In the restored reaches, ammonium uptake velocity (Vf) ranged from 0.2 to 48.9 mm/min (mean: 9.4 mm/min; median: 4.1 mm/min; N = 18 measurements). The highest values of Vf occurred in Arango et al. (2015) directly after reconstruction of a new channel (which increased sinuosity and adding two backwater oxbow channels). Ammonium uptake velocities were marginally significantly higher in restored streams than in the degraded streams (p = 0.11), which ranged from 0.0 to 22.8 mm/min (mean: 3.5 mm/min; median: 1.0 mm/min; N = 23 measurements).
In restored streams, ammonium uptake velocity has a negative linear relationship with disturbance intensity (%, F1,13 = 14.3, n = 15, p = 0.002) and a negative power function relationship with ammonium concentration (μg/L, F1,16 = 178, n = 18, p < 0.001, Figure 7). There was also a positive linear correlation with discharge (L/s, F1,13 = 14.3, n = 15, p = 0.002) and velocity (m/s, F1,7 = 25.1, n = 9, p = 0.002). The positive relationship between ammonium uptake velocity and discharge (which ranged from 5–161 L/s in restored streams) was heavily influenced by the high uptake velocity values reported by Arango et al. (2015) directly following stream restoration. Ammonium uptake velocity also had a weak positive correlation with the ratio of transient storage area to stream area (AS/A, F1,5 = 5.1, n = 7, p = 0.07) and a weak negative correlation with median travel time due to transient storage over a standardized 200 m reach (Fmed200(%), F1,6 = 2.0, n = 8, p = 0.20).

3.2.3. Soluble Reactive Phosphorus (SRP)

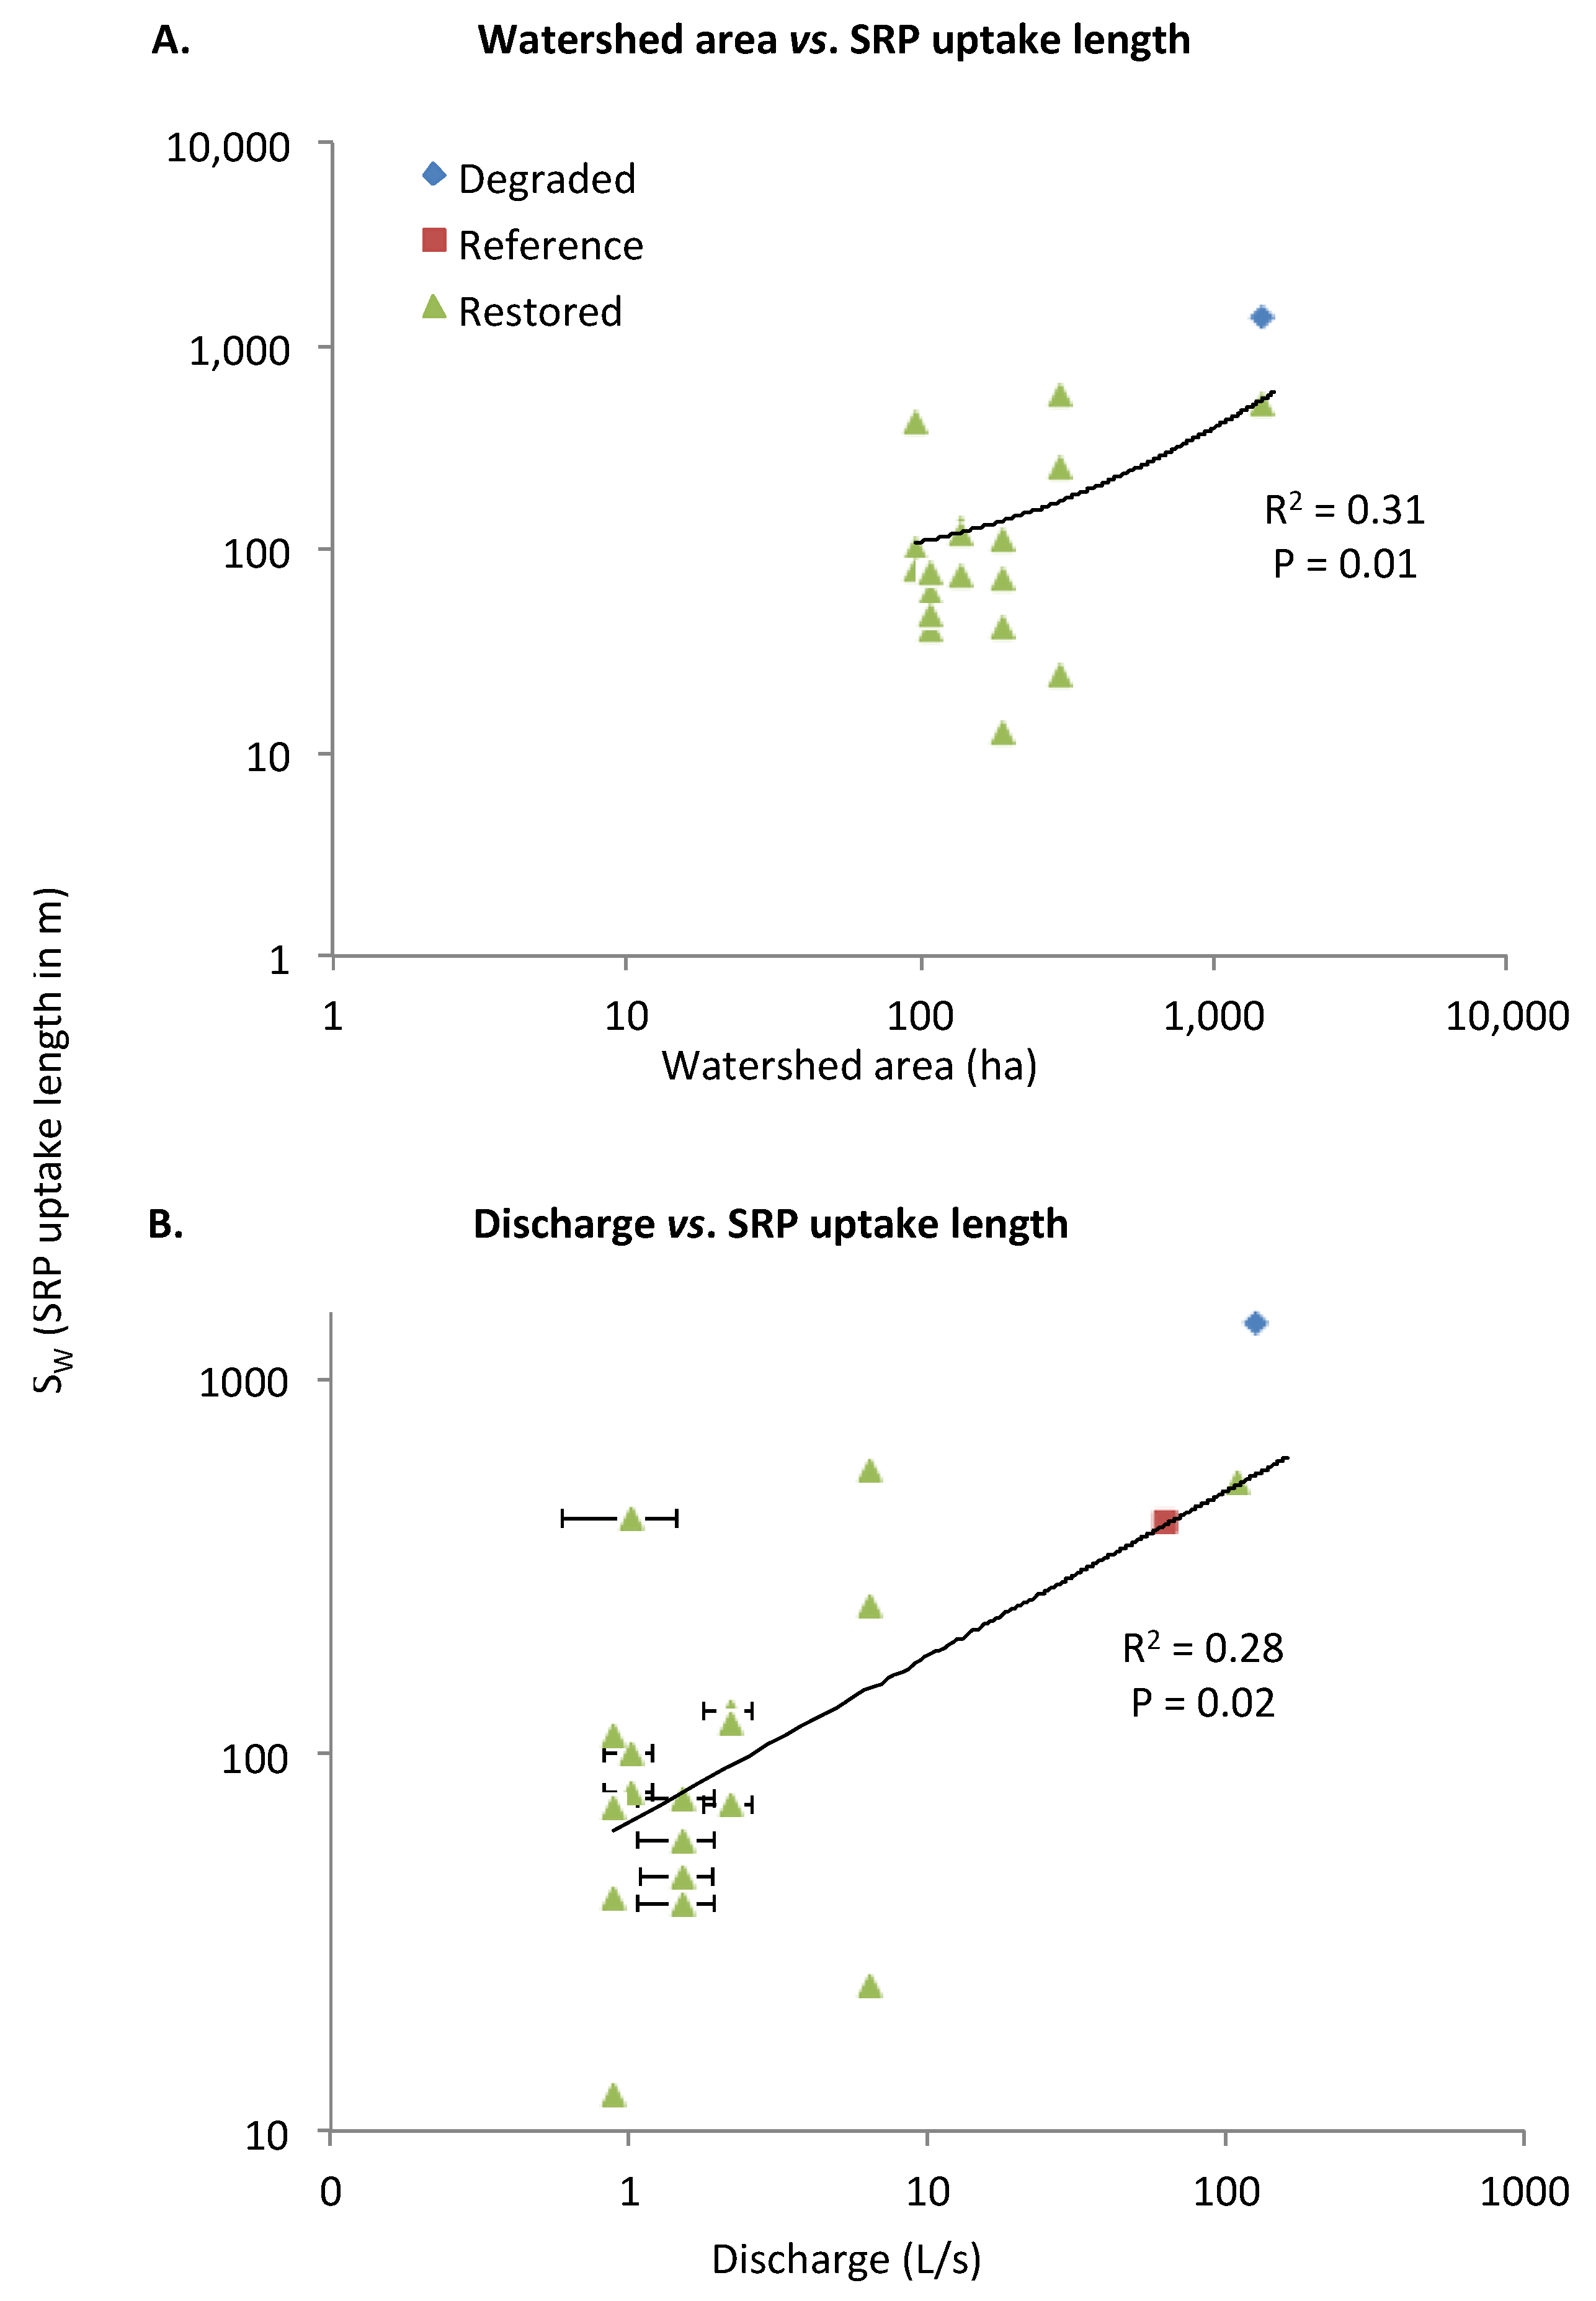
SRP Uptake Length (SW) and Areal Uptake Rate (U)

SRP uptake lengths (SW) ranged from 12.4 to 1,403 m (mean: 229 m; median: 90 m; N = 20). The highest value was for a channelized stream prior to restoration [29]. Based on linear regression, there was a significant positive relationship between phosphate uptake length (m) and two factors related to size: watershed area (ha, F1, 16 = 8.5, n = 18, p = 0.01) and discharge (L/s, F1, 16 = 7.6, n = 18, p = 0.01, Figure 8).
SRP areal uptake rate (U) ranged from 0.3 to 117 μg/m2/s (mean: 14 μg/m2/s, median: 3 μg/m2/s, n = 17, [29]). Based on such a small sample size, there was not enough data to determine the influence of other potential controlling factors on SRP areal uptake rates.

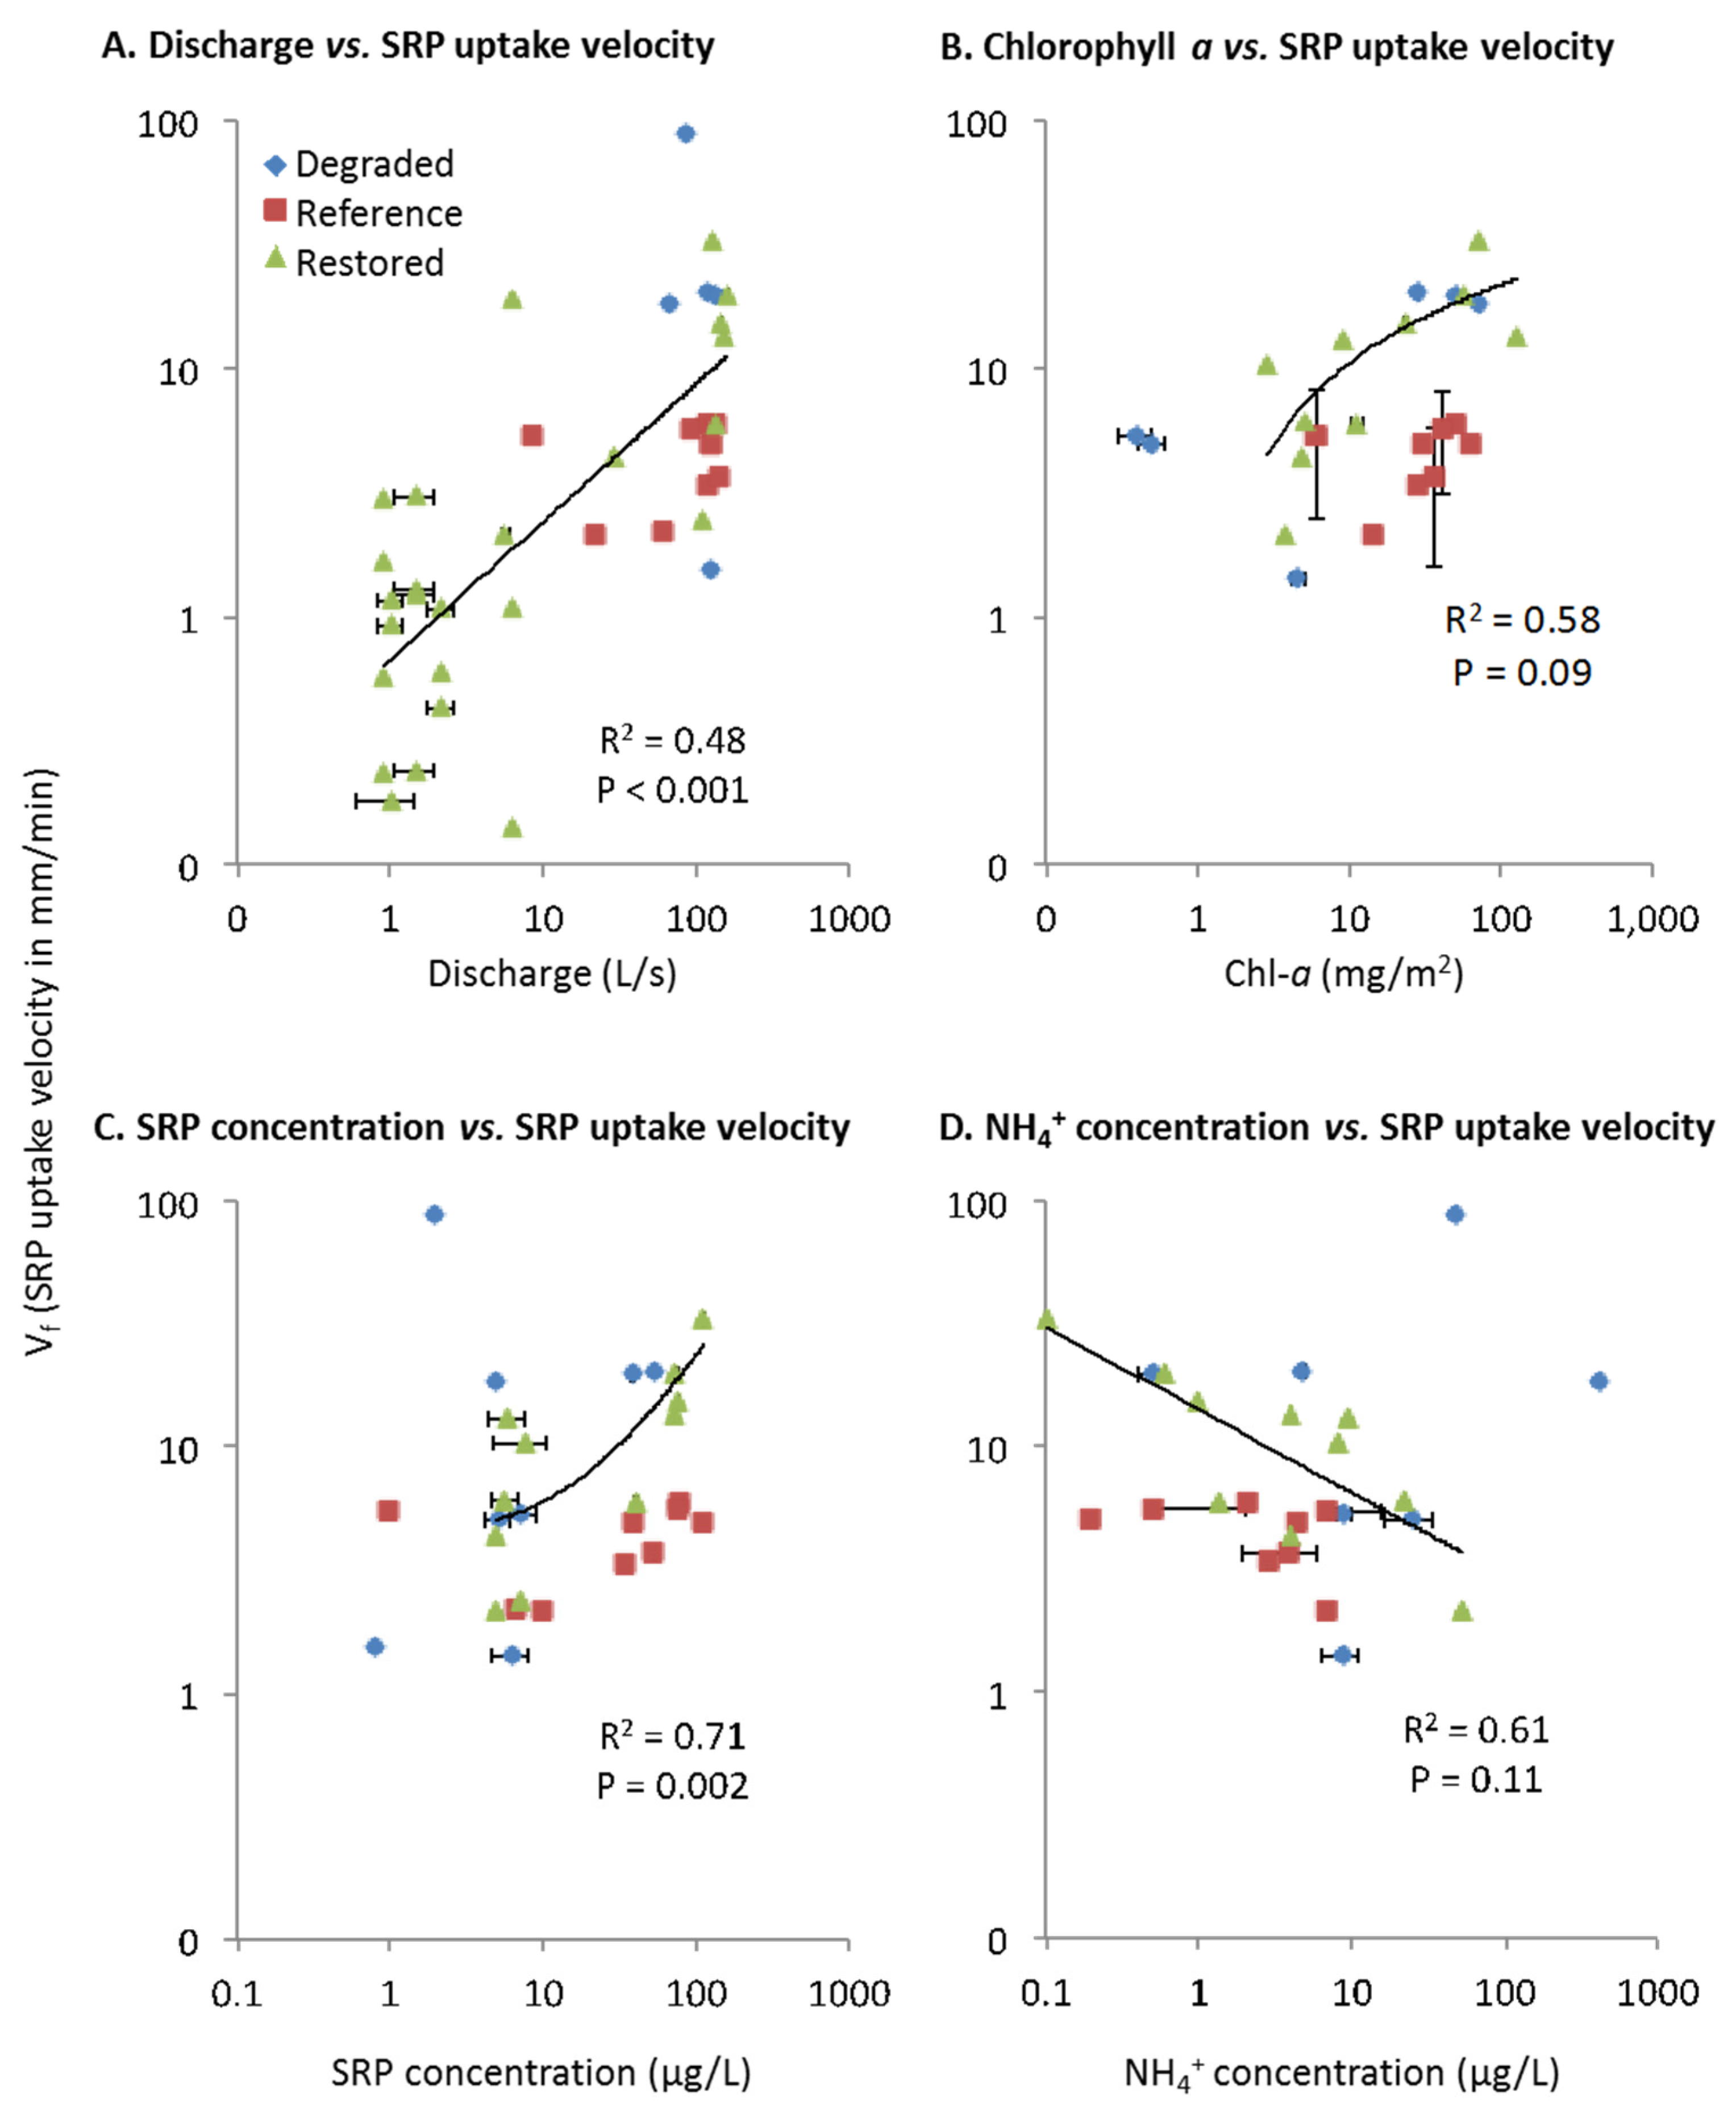
SRP Uptake Velocity (Vf)

In the restored reaches, SRP uptake velocity (Vf, mm/min) ranged from 0.1 to 32.9 mm/min (mean: 5.7 mm/min; median: 1.9 mm/min; n = 28 measurements). The degraded streams, which ranged from 1.4 to 87.4 mm/min (mean: 19.9 mm/min; median: 11.8 mm/min; N = 8 measurements) had significantly higher SRP Vf than restored (p = 0.03) and reference streams (p = 0.05), which ranged from 2.2 to 5.9 mm/min (mean: 4.2 mm/min; median: 4.9 mm/min; N = 9 measurements). The highest values of Vf occurred in Bott et al. (2012) in a degraded AMD impacted anthracite stream, a value higher than any other in the literature [83].
There were significant positive linear relationships between phosphate uptake velocity and discharge (L/s, F3, 6 = 3.6, n = 25, p < 0.001) and SRP concentration (μg/L, F1, 8 = 19.6, n = 10, p = 0.002, Figure 9). There was also a marginally significant positive correlation with chlorophyll a concentration (mg/m2, F1, 8 = 21.6, n = 10, p = 0.09) and a marginally significant negative correlation between phosphate uptake velocity and ammonium concentration (μg/L, F1, 8 = 3.2, n = 10, p = 0.11). When chlorophyll a, SRP concentration, and ammonium concentration were used for a multiple linear regression analysis, only SRP concentration remained a significant predictor (μg/L, F1, 8 = 19.6, n = 10, p = 0.002). It also appears that for a given concentration of SRP or Chl-a, there was higher Vf in the restored streams than in the reference streams.

4. Discussion

Human-dominated watersheds can have less geomorphic complexity than natural stream ecosystems because of many of the following alterations: straightening meanders, armoring banks with stone gabions, removal of woody debris and bank vegetation, lining channels in concrete, and burying channels in underground pipes [86]. Such actions can reduce temporary retention of water in pools, eddies, channel margins, and other backwater transient storage zones [59]. Here, we conducted a review of the current state of stream restoration and nutrient retention monitoring studies. We used this review to synthesize a typology of different practices that can hydrologically reconnect streams and rivers and enhance the removal of nutrients. Overall, we found mostly positive and neutral results for a variety of strategies that can reconnect the floodplain and the streambed and increase the reactive surface area of flowing water and connected wetlands. However, it is important to note limitations in our understanding of stream restoration during baseflow vs. high flow. Nonetheless, stream restoration planners and practitioners should consider multiple diverse strategies for working towards nutrient removal goals. It is important to note that many of the actions undertaken in these typologies do more than address improving N and P management. Restoring groundwater-surface water connectivity also provides ecological benefits, amenity values, and improved erosion and siltation control. Stream restoration represents an adaptation to urban water quality issues and degradation, and is one component of urban evolution of the form and function of cities over time [87,88].
From a temporal perspective, some of the highest NH4+ and P uptake rates seen in nutrient spiraling literature were measured shortly after a restoration project that converted Wilson Creek in Okanogan-Wenatchee National Forest of Central Washington, USA from a narrow, high velocity stream devoid of wood to a wide, low velocity channel with large wood and boulder structures [80]. This study was unique in that it captured the immediate ecosystem response to restoration [80]. A common aim of restoration is to stabilize streams to reduce erosion of sediments and infrastructure [89]. However, the physical process of bringing in heavy machinery like bulldozers to restore a stream can be a major disturbance. Some other possible restoration related disturbances include redirecting the channel to a new location, bringing in new rock and other substrate, and removing large canopy trees that used to shade the channel. After the major physical disturbance of stream restoration related to the construction phase, there can be rapid urban succession as periphyton and other biota rapidly recover [90].
Overall, we found highest rates of nutrient uptake in newly restored sites, which suggested the need to evaluate and compare nutrient retention over time (please see section further below). There were high rates of nutrient uptake in urban [30,74,75,77,78,80,81] and agricultural watersheds [29,72,79,91], which are likely linked to positive relationships with nutrient and Chl-a concentrations [76]. There were lower rates of nutrient uptake in forested and acid mine drainage watersheds. There were shorter uptake lengths of N and P in smaller streams, which have higher surface-to-volume ratios (Figure 4 and Figure 8), and some conflicting trends with transient storage (Figure 7).

4.1. Nutrient Retention in Restored Streams Over Time: Urban Succession

Streams and stormwater management wetlands may experience “urban succession” in biological communities and ecosystem functions following phases of construction and disturbance over time [87,88]. Several studies linked elevated nutrient uptake rates in newly restored streams to increased light availability and coarser substrate composition following construction [74,78,81]. Increased light availability from reduced canopy cover can temporarily increase stream temperature and the abundance of algal biofilms in streams with ample nutrients [78]. The notably high rates in Wilson Creek were attributed to rapid algal growth causing a transient spike in whole system nutrient demand which leveled off 35 days after restoration [80]. An 8-year chronosequence of five restored urban streams in North Carolina, USA found that P uptake was greater in newly restored sites; this finding was primarily attributed to assimilation by algal biofilms [78]. Coarser substrates (e.g., cobbles, rocks, and boulders) can serve as a more stable surface for biofilms because they are less likely to be disturbed by turbulence during high flow events than finer substrates like sand and silt [92]. Likewise, larger substrates enhance stream–subsurface water exchange and the transfer of dissolved solutes from the stream to the streambed [82,84].
Elevated nutrient uptake rates due to increased sunlight availability are likely to be temporary as the canopy regrows during urban succession. Elevated uptake rates due to coarser sediment composition may be temporary, if interstitial spaces are clogged with finer sediments from upstream erosion. However, a comprehensive watershed management plan that integrates diverse stormwater management, wetlands, and conservation practices that reduce effective imperviousness and retain runoff may be able to reduce erosion rates. These studies demonstrate that stream restoration projects evolve over time. Thus, it is important to continue monitoring efforts past when the canopy regrows to determine the duration for increased nutrient retention as well as potential maintenance needs.

4.2. Low Nutrient Uptake Rates in AMD Remediated Streams

Some of the lowest nutrient uptake velocity rates in restored streams were in watersheds receiving acid mine drainage (AMD) from coal mines [73,83]. In the United States, coal companies are mandated to complete compensatory mitigation for mining related watershed disturbances and many choose to restore sections of stream in older coal mining areas [73]. One study of AMD stream remediation showed increased NH4+ uptake, reduced NO3 uptake to undetectable level, and increased SRP uptake to near normal rates [83]. In contrast, another study of AMD remediated streams found no site differences for any measured physicochemical or functional variables [73]. Likewise, a seasonal analysis showed no differences between restored and unrestored streams during the winter [73].

4.3. Size Matters: Optimizing Reactive Sediment Volume and Transient Storage

Restored urban and agricultural streams can have high nutrient uptake rates. However, mass removal rates can be limited in tile drains and buried or straightened concrete channels due to limited surface area, hyporheic exchange, and transient storage [31,93]. Our analysis of watershed and reach scale controlling factors demonstrated that size matters. It takes longer for a nutrient molecule to be removed from the water column in a larger river than a small headwater stream as demonstrated by the positive relationships seen between uptake length and the variables that demonstrate size: watershed area, discharge, and velocity [30]. This size dependency has been attributed to larger surface-to-volume ratios in smaller headwater streams favoring rapid N uptake and processing.
Through stream restoration, managers can increase nutrient removal rates by optimizing the surface area and depth of reactive sediments and lengthening transient storage times [77]. For example, two narrow, incised rivers were restored to structurally diverse, meandering channels with step-pool sequences and considerable accumulation of woody debris [72]. Weigelhofer et al. (2013) found 4–5 times higher transient storage in both morphologically pristine and restored reaches than in channelized sections, resulting in significantly shorter uptake lengths and higher mass transfer coefficients. Hyporheic exchange in this study was restricted by fine sediments clogging interstitial spaces so the increased transient storage was attributed to surface retention in debris dams and pools, similar to findings by [29,59,91].
We found that relationships linking transient storage with nutrient uptake are not always consistent because diverse stream compartments such as algal mats, hyporheic zones, and backwater areas can all contribute to transient storage and these compartments can have distinct biological communities with different uptake rates and processes [79]. Some studies showed significant relationships between transient storage and nutrient uptake [91,94,95,96], while others show weaker relationships [29,97], or contrasting findings for phosphate (e.g., [98]), and some studies found no trends (e.g., [84,99]). Thus, there is a need to better understand the structure and function of different types of transient storage zones [79].

4.4. Restored Riffles, Substrate, and Coarse Woody Debris

When restoring streams, projects can be designed to improve nutrient uptake by raising water levels, lowering velocity, increasing transient storage, and increasing organic matter accumulation. Installing rocky riffles and raising channel bed elevation in the restored reach of the Truckee River increased transient storage zone cross-sectional area (AS). Increased transient storage leads to increased hyporheic residence time and hydrologic retention in the vicinity of channel reconstruction. Therefore, model simulations predicted greater N retention [93]. Likewise, a study that examined constructed riffles and a step in restored reaches of several N-rich agricultural and urban streams in southern Ontario found a range of 50% to 99% N removal in hyporheic zones composed of less than 25% stream water [75]. Though the natural riffle had greater % NO3 removal than the constructed riffle, the constructed riffle removed 3 times more N mass because of larger hyporheic exchange flux [75]. These small constructed features removed 0.003%–0.06% of daily stream load.
In studies that raised the stream bottom with experimental flow deflectors, transient storage increased and stream velocity decreased thus increasing the residence time of water within benthic communities [59,79,91]. The addition of baffles, structures added to the stream to obstruct flow, significantly increased both phosphate and ammonium uptake velocity [91]. Ammonium uptake significantly increased when enough coarse woody debris was added to double transient storage [59]. In contrast, substrate packs (containing cobbles, sand, or mud) added to an irrigation canal near Barcelona, Spain doubled transient storage but did not significantly influence whole-stream phosphate and ammonium uptake. This lack of relationship between stream restoration and NH4+ or phosphate uptake was attributed to the short 20 m study reaches and relatively low levels of transient storage even after addition of the substrate packs) [79]. When the substrate packs were compared, mud packs had the highest uptake coefficients. This was attributed to greater organic matter content, greater water residence time, and lower dissolved oxygen concentrations [79]. However, the authors of this study did not advocate adding mud to streams because excess soil inputs from the watershed can clog sediments and inhibit the exchange between interstices and stream water.
Coarse woody debris (CWD) treatments increased ammonium uptake velocity (Vf) by 23%–154% and uptake rate (U) by 61%–235% when compared to the control reaches [59]. As wood is characterized by higher C:N ratios than biofilms or microorganisms [100], its decomposition requires additional N sources, thereby increasing the nutrient demand of microbial decomposers [67]. Carbon limitation of N uptake typically occurs below DOC levels of 2 mg/L [101]. Flashy hydrology in degraded channelized streams can prevent formation of organic debris dams [37], which have been shown, along with pools, to have higher denitrification potential than other in-stream features [102].

5. Conclusions and Management Implications

Stream restoration strategies can potentially foster nutrient retention within hydrologically disconnected streams and floodplains. The commonality between all of these stream restoration practices is that they reconnect surface and groundwater, foster connectivity between N sources and C-rich soils, and increase retention time in order to promote N retention. Limited hydrologic connectivity can reduce the effectiveness of floodplains and other transient storage zones as nutrient sinks [103]. From our database of hydrologic stream restoration studies, we learned that the effect of all of the typologies was an overall retention of nutrients. Most of the restoration projects implemented only one or two typologies. However, combining multiple typologies increased the likelihood of a positive performance (Figure S2). Therefore, if a watershed is impaired by nutrient pollution, restoration practitioners may able to “hedge their bets” and increase the odds that their project will successfully reduce nutrient loads by implementing multiple hydrologic reconnection strategies.
In order to optimize watershed nutrient retention, it is important to increase hydrologic residence time and the volume of water interacting with reactive biofilms and sediments. It is essential to consider all four dimensions of a stream network or urban watershed continuum: lateral, longitudinal, vertical, and temporal [44,104]. Laterally, channels can be widened, connected to their floodplains, and oxbow wetlands or side-channels can be integrated. Longitudinally, sinuosity can be increased to attenuate excess energy and increase residence time. Vertically, step pool sequences can foster turbulence and mixing between surface water and groundwater. Urban and agricultural land use can clog channels with fine sediments that limit hyporheic exchange. Thus, it is important to incorporate stormwater management and other structures that can limit the flux of fine sediments from clogging newly restored reaches. When considering time, it is important to provide sufficient hydrologic residence time for baseflow and high flow events and to consider maintenance needs for the future. An efficient time to conduct stream restoration is during already planned sewer and drinking water infrastructure upgrades. We recommend better planning and coordination at a watershed scale when using stream restoration to address adapting to land use change, climate change, and aging urban infrastructure failures.

Knowledge Gaps and Future Directions

Our review of the literature illustrates that there are few long-term studies of stream restoration, even though nutrient retention dynamics in streams may change over time. Furthermore, most studies have sampled during baseflow while the majority of the annual load is often delivered during high flow events. This sampling gap may have led to our study finding a more positive conclusion than what is occurring in reality. Floodplain processes are also vital to nutrient retention but largely missing from the current literature on restoration. When peak flows are reduced, streams may act more as transformers rather than transporters of nutrients. This type of adaptive watershed management is especially important in regions where climate change is affecting precipitation patterns and increasing storm frequency. More studies that examine retention across a range of streamflow conditions including extreme events are necessary to better elucidate the role of restoration in nutrient management. Additionally, we found that using a “degraded reference” stream or reach is more useful than a “pristine reference” for examining the impact of restoration on nutrient retention. Stream restoration for nutrient retention is unlikely to ever reach pristine conditions without also reducing watershed inputs. Thus, stream restoration projects should be seen as a way to re-engineer the system for better performance. Another suggestion for future studies is to seek out failed stream restoration projects to determine what went wrong and how such failures can be prevented in the future. There is also a need to expand geographically to areas beyond North America, Europe, and the few studies found in Asia. Likewise modeling studies are an essential complement to field studies for demonstrating how stream restoration may be applied at a watershed scale and what effect restoration may have in reducing loads to coastal zones and estuaries [105,106,107,108]. Finally, there is a need to connect more to the social sciences to understand the social, political, and economic forces driving stream restoration practices [89].

Supplementary Materials

The following are available online at www.mdpi.com/2073-4441/8/4/116/s1. Figure S1: Restoration projects were divided into 9 typologies: (A) raise stream bottom, (B) lower floodplain, (C) raise water levels with drainage control structures, (D) reconnect wetlands, (E) remove concrete liner, and (F) daylighting urban streams buried in pipes, (G) increase sinuosity, (H) add in-stream wetlands, and (I) reconnect oxbow wetlands. Positive results (green) indicate that restoration either increased nutrient retention or decreased nutrient concentrations compared to pre-restoration or reference condition. Neutral results (yellow) indicate that restoration did not change nutrient retention or concentrations. Negative results (red) indicate that restoration either reduced nutrient retention or increased concentrations. Figure S2: Top panel: As the number of typologies per study increased from 1 to 5, the number of studies declined exponentially from 45 to 1. Bottom panel: In contrast, as the number of typologies per study increased from 1 to 5, the % of positive results increased from 59% to 100%. Table S1: Method, land use (LU), typology (from Figure 2), management action, rating, summary of results, location and citation for 79 empirical nutrient case studies. Table S2: The 15 nutrient spiraling studies measured 45 diverse potential controlling variables. We divided these variables into 5 categories: watershed, reach, water chemistry, transient storage, and metabolism characteristics. Shaded boxes indicate that a variable was measured in the specific study. The two columns on the right show the total number and percent of studies that recorded each variable.

Acknowledgments

This research was supported by MD Sea Grant Awards SA7528085-U, R/WS-2 and NA05OAR4171042, NSF Awards CBET 1058502, EAR 1426844, and EAR 1521224, EPA NNEMS Award 2010-308, the U.S. EPA Office of Research and Development, and Baltimore Ecosystem Study LTER project (NSF DEB-0423476). We thank Michael Pennino, Walter Boynton, Peter Groffman, Jeff Cornwell, Philippe Vidon, Jim Markwiese, and three anonymous reviewers for improving earlier drafts. We thank Shuiwang Duan for help with translation from Chinese to English. Melanie Harrison Okoro, Jonathan Jeschke, and Michael Craghan provided valuable discussions. The information in this document has been subjected to Agency peer and administrative review, and it has been approved for publication as an Agency document. Mention of trade names or commercial products does not constitute endorsement or recommendation for use.

Author Contributions

Tamara A. Newcomer Johnson, Sujay S. Kaushal, Paul M. Mayer, Rose M. Smith, and Gwen M. Sivirichi contributed to writing the manuscript and editing.

Conflicts of Interest

The authors declare no conflict of interest.

References

  1. National Academy of Engineering Manage the nitrogen Cycle—Engineering Challenges. Available online: http://www.engineeringchallenges.org/cms/8996/9132.aspx (accessed on 25 October 2014).
  2. Conley, D.J.; Paerl, H.W.; Howarth, R.W.; Boesch, D.F.; Seitzinger, S.P.; Havens, K.E.; Lancelot, C.; Likens, G.E. Ecology: Controlling Eutrophication: Nitrogen and Phosphorus. Science 2009, 323, 1014–1015. [Google Scholar] [CrossRef] [PubMed]
  3. Zhang, X.; Davidson, E.A.; Mauzerall, D.L.; Searchinger, T.D.; Dumas, P.; Shen, Y. Managing nitrogen for sustainable development. Nature 2015, 528, 51–59. [Google Scholar] [CrossRef] [PubMed]
  4. Green, P.A.; Vörösmarty, C.J.; Meybeck, M.; Galloway, J.N.; Peterson, B.J.; Boyer, E.W. Pre-industrial and contemporary fluxes of nitrogen through rivers: A global assessment based on typology. Biogeochemistry 2004, 68, 71–105. [Google Scholar] [CrossRef]
  5. Caraco, N.F. Disturbance of the phosphorus cycle: A case of indirect effects of human activity. Trends Ecol. Evol. 1993, 8, 51–54. [Google Scholar] [CrossRef]
  6. Vitousek, P.M.; Aber, J.D.; Howarth, R.W.; Likens, G.E.; Matson, P.A.; Schindler, D.W.; Schlesinger, W.H.; Tilman, D.G. Human Alteration of the Global Nitrogen Cycle: Sources and Consequences. Ecol. Appl. 1997, 7, 737–750. [Google Scholar] [CrossRef]
  7. Galloway, J.N.; Aber, J.D.; Erisman, J.W.; Seitzinger, S.P.; Howarth, R.W.; Cowling, E.B.; Cosby, B.J. The nitrogen cascade. BioScience 2003, 53, 341–356. [Google Scholar] [CrossRef]
  8. Conley, D.J. Biogeochemical nutrient cycles and nutrient management strategies. Hydrobiologia 1999, 410, 87–96. [Google Scholar] [CrossRef]
  9. Bennett, E.M.; Carpenter, S.R.; Caraco, N.F. Human impact on erodable phosphorus and eutrophication: A global perspective increasing accumulation of phosphorus in soil threatens rivers, lakes, and coastal oceans with eutrophication. BioScience 2001, 51, 227–234. [Google Scholar] [CrossRef]
  10. Howarth, R.W.; Sharpley, A.; Walker, D. Nutrient Pollution to Coastal Waters in the United States: Implications for Achieving Coastal Water Quality Goals. Estuaries 2002, 25, 656–676. [Google Scholar] [CrossRef]
  11. Kemp, W.M.; Boynton, W.R.; Adoli, J.E.; Boesch, D.F.; Boicourt, W.C.; Brush, G.S.; Cornwell, J.C.; Fisher, T.R.; Glibert, P.M.; Hagy, J.D.; et al. Eutrophication of Chesapeake Bay: Historical trends and ecological interactions. Mar. Ecol. Prog. Ser. 2005, 303, 1–29. [Google Scholar] [CrossRef]
  12. Boesch, D.F.; Brinsfield, R.B.; Magnien, R.E. Chesapeake Bay eutrophication: Scientific understanding, ecosystem restoration, and challenges for agriculture. J. Environ. Qual. 2001, 30, 303–320. [Google Scholar] [CrossRef] [PubMed]
  13. Kaushal, S.S.; Groffman, P.M.; Band, L.E.; Shields, C.A.; Morgan, R.P.; Palmer, M.A.; Belt, K.T.; Swan, C.M.; Findlay, S.E.G.; Fisher, G.T. Interaction between Urbanization and Climate Variability Amplifies Watershed Nitrate Export in Maryland. Environ. Sci. Technol. 2008, 42, 5872–5878. [Google Scholar] [CrossRef] [PubMed]
  14. Diaz, R.J.; Rosenberg, R. Spreading Dead Zones and Consequences for Marine Ecosystems. Science 2008, 321, 926–929. [Google Scholar] [CrossRef] [PubMed]
  15. Yang, J.; Yu, X.; Liu, L.; Zhang, W.; Guo, P. Algae community and trophic state of subtropical reservoirs in southeast Fujian, China. Environ. Sci. Pollut. Res. 2012, 19, 1432–1442. [Google Scholar] [CrossRef] [PubMed]
  16. Howarth, R.W.; Swaney, D.P.; Boyer, E.W.; Marino, R.; Jaworski, N.; Goodale, C. The influence of climate on average nitrogen export from large watersheds in the Northeastern United States. Biogeochemistry 2006, 79, 163–186. [Google Scholar] [CrossRef]
  17. Kaushal, S.S.; Mayer, P.M.; Vidon, P.G.; Smith, R.M.; Pennino, M.J.; Newcomer, T.A.; Duan, S.; Welty, C.; Belt, K.T. Land Use and Climate Variability Amplify Carbon, Nutrient, and Contaminant Pulses: A Review with Management Implications. J. Am. Water Resour. Assoc. 2014, 50, 585–614. [Google Scholar] [CrossRef]
  18. Collins, K.A.; Lawrence, T.J.; Stander, E.K.; Jontos, R.J.; Kaushal, S.S.; Newcomer, T.A.; Grimm, N.B.; Cole Ekberg, M.L. Opportunities and challenges for managing nitrogen in urban stormwater: A review and synthesis. Ecol. Eng. 2010, 36, 1507–1519. [Google Scholar] [CrossRef]
  19. Kaushal, S.S.; Groffman, P.M.; Band, L.E.; Elliott, E.M.; Shields, C.A.; Kendall, C. Tracking nonpoint source nitrogen pollution in human-impacted watersheds. Environ. Sci. Technol. 2011, 45, 8225–8232. [Google Scholar] [CrossRef] [PubMed]
  20. Duan, S.; Kaushal, S.S.; Groffman, P.M.; Band, L.E.; Belt, K.T. Phosphorus export across an urban to rural gradient in the Chesapeake Bay watershed. J. Geophys. Res. 2012, 117, G01025. [Google Scholar] [CrossRef]
  21. Stets, E.G.; Kelly, V.J.; Crawford, C.G. Regional and Temporal Differences in Nitrate Trends Discerned from Long-Term Water Quality Monitoring Data. J. Am. Water Resour. Assoc. 2015, 51, 1394–1407. [Google Scholar] [CrossRef]
  22. Moomaw, W.R. Energy, industry and nitrogen: Strategies for decreasing reactive nitrogen emissions. AMBIO J. Hum. Environ. 2002, 31, 184–189. [Google Scholar] [CrossRef]
  23. Dinnes, D.L.; Karlen, D.L.; Jaynes, D.B.; Kaspar, T.C.; Hatfield, J.L.; Colvin, T.S.; Cambardella, C.A. Nitrogen management strategies to reduce nitrate leaching in tile-drained midwestern soils. Agron. J. 2002, 94, 153–171. [Google Scholar] [CrossRef]
  24. Maxted, J.T.; Diebel, M.W.; Vander Zanden, M.J. Landscape Planning for Agricultural Non-Point Source Pollution Reduction. II. Balancing Watershed Size, Number of Watersheds, and Implementation Effort. Environ. Manag. 2009, 43, 60–68. [Google Scholar] [CrossRef] [PubMed]
  25. Lee, G.F.; Jones, R.A. Detergent phosphate bans and eutrophication. Environ. Sci. Technol. 1986, 20, 330–331. [Google Scholar] [CrossRef] [PubMed]
  26. Howarth, R.W. Coastal nitrogen pollution: A review of sources and trends globally and regionally. Harmful Algae 2008, 8, 14–20. [Google Scholar] [CrossRef]
  27. Søvik, A.K.; Syversen, N. Retention of particles and nutrients in the root zone of a vegetative buffer zone: Effect of vegetation and season. Boreal Environ. Res. 2008, 13, 223–230. [Google Scholar]
  28. Weigelhofer, G.; Fuchsberger, J.; Teufl, B.; Welti, N.; Hein, T. Effects of Riparian Forest Buffers on In-Stream Nutrient Retention in Agricultural Catchments. J. Environ. Qual. 2012, 41, 373–379. [Google Scholar] [CrossRef] [PubMed]
  29. Bukaveckas, P.A. Effects of channel restoration on water velocity, transient storage, and nutrient uptake in a channelized stream. Environ. Sci. Technol. 2007, 41, 1570–1576. [Google Scholar] [CrossRef] [PubMed]
  30. Klocker, C.A.; Kaushal, S.S.; Groffman, P.M.; Mayer, P.M.; Morgan, R.P. Nitrogen uptake and denitrification in restored and unrestored streams in urban Maryland, USA. Aquat. Sci. 2009, 71, 411–424. [Google Scholar] [CrossRef]
  31. Pennino, M.P.; Kaushal, S.S.; Beaulieu, J.J.; Mayer, P.M.; Arango, C.P. Effects of urban stream burial on nitrogen uptake and ecosystem metabolism: Implications for watershed nitrogen and carbon fluxes. Biogeochemistry 2014, 121, 247–269. [Google Scholar] [CrossRef]
  32. Melzer, A.; Exler, D. Nitrate and Nitrite Reductase Activities in Aquatic Macrophytes. Stud. Aquat. Vasc. Plants Royal Botanic Society of Belgium, Brussels. 1982, 128–135. [Google Scholar]
  33. Froelich, P. Kinetic Control of Dissolved Phosphate in Natural Rivers and Estuaries—A Primer on the Phosphate Buffer Mechanism. Limnol. Oceanogr. 1988, 33, 649–668. [Google Scholar] [CrossRef]
  34. House, W.A.; Denison, F.H. Exchange of inorganic phosphate between river waters and bed-sediments. Environ. Sci. Technol. 2002, 36, 4295–4301. [Google Scholar] [CrossRef] [PubMed]
  35. Duan, S.; Kaushal, S.S. Warming increases carbon and nutrient fluxes from sediments in streams across land use. Biogeosciences 2013, 10, 1193–1207. [Google Scholar] [CrossRef]
  36. Davidson, E.A.; Schimel, J.P. Microbial processes of production and consumption of nitric oxide, nitrous oxide and methane. In Biogenic Trace Gases: Measuring Emissions from Sediment and Water; Matson, P.A., Harriss, R.C., Eds.; Blackwell Science: Cambridge, MA, USA, 1995; pp. 327–357. [Google Scholar]
  37. Groffman, P.M.; Dorsey, A.M.; Mayer, P.M. N processing within geomorphic structures in urban streams. J. N. Am. Benthol. Soc. 2005, 24, 613–625. [Google Scholar] [CrossRef]
  38. Boyer, E.W.; Alexander, R.B.; Parton, W.J.; Li, C.; Butterbach-Bahl, K.; Donner, S.D.; Skaggs, R.W.; Grosso, S.J.D. Modeling denitrification in terrestrial and aquatic ecosystems at regional scales. Ecol. Appl. 2006, 16, 2123–2142. [Google Scholar] [CrossRef]
  39. Hedin, L.O.; von Fischer, J.C.; Ostrom, N.E.; Kennedy, B.P.; Brown, M.G.; Robertson, G.P. Thermodynamic constraints on nitrogen transformations and other biogeochemical processes at soil-stream interfaces. Ecology 1998, 79, 684–703. [Google Scholar] [CrossRef]
  40. Kaushal, S.S.; Groffman, P.M.; Mayer, P.M.; Striz, E.; Gold, A.J. Effects of stream restoration on denitrification in an urbanizing watershed. Ecol. Appl. 2008, 18, 789–804. [Google Scholar] [CrossRef] [PubMed]
  41. Mayer, P.M.; Groffman, P.M.; Striz, E.A.; Kaushal, S.S. Nitrogen dynamics at the groundwater-surface water interface of a degraded urban stream. J. Environ. Qual. 2010, 39, 810–823. [Google Scholar] [CrossRef] [PubMed]
  42. Forshay, K.J.; Dodson, S.I. Macrophyte presence is an indicator of enhanced denitrification and nitrification in sediments of a temperate restored agricultural stream. Hydrobiologia 2011, 668, 21–34. [Google Scholar] [CrossRef]
  43. Roley, S.S.; Tank, J.L.; Williams, M.A. Hydrologic connectivity increases denitrification in the hyporheic zone and restored floodplains of an agricultural stream. J. Geophys. Res. 2012, 117, G00N04. [Google Scholar] [CrossRef]
  44. Kaushal, S.S.; Belt, K.T. The urban watershed continuum: Evolving spatial and temporal dimensions. Urban Ecosyst. 2012, 15, 409–435. [Google Scholar] [CrossRef]
  45. Mulholland, P.J.; Helton, A.M.; Poole, G.C.; Hall, R.O.; Hamilton, S.K.; Peterson, B.J.; Tank, J.L.; Ashkenas, L.R.; Cooper, L.W.; Dahm, C.N.; et al. Stream denitrification across biomes and its response to anthropogenic nitrate loading. Nature 2008, 452, 202–205. [Google Scholar] [CrossRef] [PubMed]
  46. Costa, J.E. Effects of agriculture on erosion and sedimentation in the Piedmont Province, Maryland. Geol. Soc. Am. Bull. 1975, 86, 1281–1286. [Google Scholar] [CrossRef]
  47. Magilligan, F.J. Historical floodplain sedimentation in the Galena River basin, Wisconsin and Illinois. Ann. Assoc. Am. Geogr. 1985, 75, 583–594. [Google Scholar] [CrossRef]
  48. Knox, J.C. Historical valley floor sedimentation in the Upper Mississippi Valley. Ann. Assoc. Am. Geogr. 1987, 77, 224–244. [Google Scholar] [CrossRef]
  49. Parola, A.C.; Vesely, W.S.; Croasdaile, M.A.; Hansen, C.; Jones, M.S. Geomorphic Characteristics of Streams in the Bluegrass Physiographic Region of Kentucky; Technical Report for Nonpoint Source Implementation Program of University of Louisville: Louisville, KY, USA, 2007. [Google Scholar]
  50. Walter, R.C.; Merritts, D.J. Natural streams and the legacy of water-powered mills. Science 2008, 319, 299–304. [Google Scholar] [CrossRef] [PubMed]
  51. Nogaro, G.; Datry, T.; Mermillod-Blondin, F.; Descloux, S.; Montuelle, B. Influence of streambed sediment clogging on microbial processes in the hyporheic zone. Freshw. Biol. 2010, 55, 1288–1302. [Google Scholar] [CrossRef]
  52. Kasahara, T.; Hill, A. Modeling the effects of lowland stream restoration projects on stream–subsurface water exchange. Ecol. Eng. 2008, 32, 310–319. [Google Scholar] [CrossRef]
  53. Verhoeven, J.T. A.; Arheimer, B.; Yin, C.Q.; Hefting, M.M. Regional and global concerns over wetlands and water quality. Trends Ecol. Evol. 2006, 21, 96–103. [Google Scholar] [CrossRef] [PubMed]
  54. Walsh, C.J.; Roy, A.H.; Feminella, J.W.; Cottingham, P.D.; Groffman, P.M.; Morgan, R.P., II. The urban stream syndrome: Current knowledge and the search for a cure. J. N. Am. Benthol. Soc. 2005, 24, 706–723. [Google Scholar] [CrossRef]
  55. Elmore, A.J.; Kaushal, S.S. Disappearing headwaters: Patterns of stream burial due to urbanization. Front. Ecol. Environ. 2008, 6, 308–312. [Google Scholar] [CrossRef]
  56. Roley, S.S.; Tank, J.L.; Stephen, M.L.; Johnson, L.T.; Beaulieu, J.J.; Witter, J.D. Floodplain restoration enhances denitrification and reach-scale nitrogen removal in an agricultural stream. Ecol. Appl. 2012, 22, 281–297. [Google Scholar] [CrossRef] [PubMed]
  57. Bernhardt, E.S.; Palmer, M.A. River restoration: The fuzzy logic of repairing reaches to reverse catchment scale degradation. Ecol. Appl. 2011, 21, 1926–1931. [Google Scholar] [CrossRef] [PubMed]
  58. Mayer, P.M.; Reynolds, S.K.; McCutchen, M.D.; Canfield, T.J. Meta-Analysis of Nitrogen Removal in Riparian Buffers. J. Environ. Qual. 2007, 36, 1172–1180. [Google Scholar] [CrossRef] [PubMed]
  59. Roberts, B.J.; Mulholland, P.J.; Houser, J.N. Effects of upland disturbance and instream restoration on hydrodynamics and ammonium uptake in headwater streams. J. N. Am. Benthol. Soc. 2007, 26, 38–53. [Google Scholar] [CrossRef]
  60. Theriot, J.M.; Conkle, J.L.; Reza Pezeshki, S.; DeLaune, R.D.; White, J.R. Will hydrologic restoration of Mississippi River riparian wetlands improve their critical biogeochemical functions? Ecol. Eng. 2013, 60, 192–198. [Google Scholar] [CrossRef]
  61. Garcia-Linares, C.; Martinez-Santos, M.; Martinez-Bilbao, V.; Sanchez-Perez, J.M.; Antiguedad, I. Wetland restoration and nitrate reduction: The example of the peri-urban wetland of Vitoria-Gasteiz (Basque Country, North Spain). Hydrol. Earth Syst. Sci. 2003, 7, 109–121. [Google Scholar] [CrossRef]
  62. Wolf, K.L.; Noe, G.B.; Ahn, C. Hydrologic Connectivity to Streams Increases Nitrogen and Phosphorus Inputs and Cycling in Soils of Created and Natural Floodplain Wetlands. J. Environ. Qual. 2013, 42, 1245–1255. [Google Scholar] [CrossRef] [PubMed]
  63. Audet, J.; Hoffmann, C.C.; Jensen, H.S. Low nitrogen and phosphorus release from sediment deposited on a Danish restored floodplain. Ann. Limnol. Int. J. Limnol. 2011, 47, 231–238. [Google Scholar] [CrossRef]
  64. Troxler Gann, T.G.; Childers, D.L.; Rondeau, D.N. Ecosystem structure, nutrient dynamics, and hydrologic relationships in tree islands of the southern Everglades, Florida, USA. For. Ecol. Manag. 2005, 214, 11–27. [Google Scholar] [CrossRef]
  65. Akamatsu, F.; Shimano, K.; Denda, M.; Ide, K.; Ishihara, M.; Toda, H. Effects of sediment removal on nitrogen uptake by riparian plants in the higher floodplain of the Chikuma River, Japan. Landsc. Ecol. Eng. 2008, 4, 91–96. [Google Scholar] [CrossRef]
  66. Aspetsberger, F.; Huber, F.; Kargl, S.; Scharinger, B.; Peduzzi, P.; Hein, T. Particulate organic matter dynamics in a river floodplain system: Impact of hydrological connectivity. Arch. Hydrobiol. 2002, 156, 23–42. [Google Scholar] [CrossRef]
  67. Newcomer, T.A.; Kaushal, S.S.; Mayer, P.M.; Shields, A.R.; Canuel, E.A.; Groffman, P.M.; Gold, A.J. Influence of natural and novel organic carbon sources on denitrification in forest, degraded urban, and restored streams. Ecol. Monogr. 2012, 82, 449–466. [Google Scholar] [CrossRef]
  68. Rohatgi, A. WebPlotDigitizer: Web Based Tool to Extract Data from Plots, Images, and Maps. Available online: http://arohatgi.info/WebPlotDigitizer/userManual.pdf (accessed on 15 November 2015).
  69. R Core Team. R: A Language and Environment for Statistical Computing; R Foundation for Statistical Computing: Vienna, Austria, 2013. [Google Scholar]
  70. Stream Solute Workshop. Concepts and methods for assessing solute dynamics in stream ecosystems. J. N. Am. Benthol. Soc. 1990, 9, 95–119. [Google Scholar]
  71. Gomez-Velez, J.D.; Harvey, J.W. A hydrogeomorphic river network model predicts where and why hyporheic exchange is important in large basins. Geophys. Res. Lett. 2014, 41, 6403–6412. [Google Scholar] [CrossRef]
  72. Weigelhofer, G.; Welti, N.; Hein, T. Limitations of stream restoration for nitrogen retention in agricultural headwater streams. Ecol. Eng. 2013, 60, 224–234. [Google Scholar]
  73. Northington, R.M.; Benfield, E.F.; Schoenholtz, S.H.; Timpano, A.J.; Webster, J.R.; Zipper, C. An assessment of structural attributes and ecosystem function in restored Virginia coalfield streams. Hydrobiologia 2011, 671, 51–63. [Google Scholar] [CrossRef]
  74. Hines, S.L.; Hershey, A.E. Do channel restoration structures promote ammonium uptake and improve macroinvertebrate-based water quality classification in urban streams? Inland Waters 2011, 1, 133–145. [Google Scholar] [CrossRef]
  75. Kasahara, T.; Hill, A.R. Effects of riffle-step restoration on hyporheic zone chemistry in N-rich lowland streams. Can. J. Fish. Aquat. Sci. 2006, 63, 120–133. [Google Scholar] [CrossRef]
  76. Filoso, S.; Palmer, M.A. Assessing stream restoration effectiveness at reducing nitrogen export to downstream waters. Ecol. Appl. 2011, 21, 1989–2006. [Google Scholar] [CrossRef] [PubMed]
  77. Newcomer Johnson, T.A.; Kaushal, S.S.; Mayer, P.M.; Grese, M.M. Effects of stormwater management and stream restoration on watershed nitrogen retention. Biogeochemistry 2014, 121, 81–106. [Google Scholar] [CrossRef]
  78. Sudduth, E.B.; Hassett, B.A.; Cada, P.; Bernhardt, E.S. Testing the field of dreams hypothesis: Functional responses to urbanization and restoration in stream ecosystems. Ecol. Appl. 2011, 21, 1972–1988. [Google Scholar] [CrossRef] [PubMed]
  79. Argerich, A.; Martí, E.; Sabater, F.; Haggerty, R.; Ribot, M. Influence of transient storage on stream nutrient uptake based on substrata manipulation. Aquat. Sci. 2011, 73, 365–376. [Google Scholar] [CrossRef]
  80. Arango, C.P.; James, P.W.; Hatch, K.B. Rapid ecosystem response to restoration in an urban stream. Hydrobiologia 2015, 749, 197–211. [Google Scholar] [CrossRef]
  81. McMillan, S.K.; Tuttle, A.K.; Jennings, G.D.; Gardner, A. Influence of Restoration Age and Riparian Vegetation on Reach-Scale Nutrient Retention in Restored Urban Streams. JAWRA J. Am. Water Resour. Assoc. 2014, 50, 626–638. [Google Scholar] [CrossRef]
  82. Hoellein, T.J.; Tank, J.L.; Entrekin, S.A.; Rosi-Marshall, E.J.; Stephen, M.L.; Lamberti, G.A. Effects of benthic habitat restoration on nutrient uptake and ecosystem metabolism in three headwater streams: Stream restoration and ecosystem function. River Res. Appl. 2012, 28, 1451–1461. [Google Scholar] [CrossRef]
  83. Bott, T.L.; Jackson, J.K.; McTammany, M.E.; Newbold, D.; Rier, S.T.; Sweeney, B.W.; Battle, J.M. Abandoned coal mine drainage and its remediation: Impacts on stream ecosystem structure and function. Ecol. Appl. 2012, 22, 2144–2163. [Google Scholar] [CrossRef] [PubMed]
  84. Ensign, S.H.; Doyle, M.W. Nutrient spiraling in streams and river networks. J. Geophys. Res. Biogeosci. 2006, 111, G04009. [Google Scholar] [CrossRef]
  85. Schueler, T.R.; Fraley-McNeal, L.; Cappiella, K. Is Impervious Cover Still Important? Review of Recent Research. J. Hydrol. Eng. 2009, 14, 309–315. [Google Scholar] [CrossRef]
  86. Allan, J.D. Landscapes and riverscapes: The influence of land use on stream ecosystems. Annu. Rev. Ecol. Evol. Syst. 2004, 35, 257–284. [Google Scholar] [CrossRef]
  87. Kaushal, S.S.; McDowell, W.H.; Wollheim, W.M.; Johnson, T.A. N.; Mayer, P.M.; Belt, K.T.; Pennino, M.J. Urban Evolution: The Role of Water. Water 2015, 7, 4063–4087. [Google Scholar] [CrossRef]
  88. Kaushal, S.S.; McDowell, W.H.; Wollheim, W.M. Tracking evolution of urban biogeochemical cycles: Past, present, and future. Biogeochemistry 2014, 121, 1–21. [Google Scholar] [CrossRef]
  89. Doyle, M.W.; Singh, J.; Lave, R.; Robertson, M.M. The morphology of streams restored for market and nonmarket purposes: Insights from a mixed natural-social science approach. Water Resour. Res. 2015, 51, 5603–5622. [Google Scholar] [CrossRef]
  90. Grimm, N.B. Nitrogen dynamics during succession in a desert stream. Ecology 1987, 68, 1157–1170. [Google Scholar] [CrossRef]
  91. Ensign, S.H.; Doyle, M.W. In-channel transient storage and associated nutrient retention: Evidence from experimental manipulations. Limnol. Oceanogr. 2005, 50, 1740–1751. [Google Scholar] [CrossRef]
  92. Smith, J.J.; Lake, P.S. The breakdown of buried and surface-placed leaf litter in an upland stream. Hydrobiologia 1993, 271, 141–148. [Google Scholar] [CrossRef]
  93. Beaulieu, J.J.; Mayer, P.M.; Kaushal, S.S.; Pennino, M.P.; Arango, C.P.; Balz, D.A.; Fritz, K.M.; Hill, B.H.; Elonen, C.M.; Santo Domingo, J.W.; et al. Effects of urban stream burial on organic matter dynamics and reach scale nitrate retention. Biogeochemistry 2014, 121, 107–126. [Google Scholar] [CrossRef]
  94. Valett, H.M.; Morrice, J.A.; Dahm, C.N.; Campana, M.E. Parent lithology, surface–groundwater exchange, and nitrate retention in headwater streams. Limnol. Oceanogr. 1996, 41, 333–345. [Google Scholar] [CrossRef]
  95. Thomas, S.A.; Valett, H.M.; Webster, J.R.; Mulholland, P.J. A regression approach to estimating reactive solute uptake in advective and transient storage zones of stream ecosystems. Adv. Water Resour. 2003, 26, 965–976. [Google Scholar] [CrossRef]
  96. Jordan, T.E.; Andrews, M.P.; Szuch, R.P.; Whigham, D.F.; Weller, D.E.; Jacobs, A.D. Comparing functional assessments of wetlands to measurements of soil characteristics and nitrogen processing. Wetlands 2007, 27, 479–497. [Google Scholar] [CrossRef]
  97. Lautz, L.K.; Siegel, D.I. The effect of transient storage on nitrate uptake lengths in streams: An inter-site comparison. Hydrol. Process. 2007, 21, 3533–3548. [Google Scholar] [CrossRef]
  98. Hall, R.O., Jr.; Bernhardt, E.S.; Likens, G.E. Relating nutrient uptake with transient storage in forested mountain streams. Limnol. Oceanogr. 2002, 47, 255–265. [Google Scholar] [CrossRef]
  99. Webster, J.R.; Mulholland, P.J.; Tank, J.L.; Valett, H.M.; Dodds, W.K.; Peterson, B.J.; Bowden, W.B.; Dahm, C.N.; Findlay, S.; Gregory, S.V.; et al. Factors affecting ammonium uptake in streams—An inter-biome perspective. Freshw. Biol. 2003, 48, 1329–1352. [Google Scholar] [CrossRef]
  100. Dodds, W.K.; Martí, E.; Tank, J.L.; Pontius, J.; Hamilton, S.K.; Grimm, N.B.; Bowden, W.B.; McDowell, W.H.; Peterson, B.J.; Valett, H.M.; et al. Carbon and nitrogen stoichiometry and nitrogen cycling rates in streams. Oecologia 2004, 140, 458–467. [Google Scholar] [CrossRef] [PubMed]
  101. Goodale, C.L.; Aber, J.D.; Vitousek, P.M.; McDowell, W.H. Long-term decreases in stream nitrate: Successional causes unlikely; possible links to DOC? Ecosystems 2005, 8, 334–337. [Google Scholar] [CrossRef]
  102. Harrison, M.D.; Groffman, P.M.; Mayer, P.M.; Kaushal, S.S. Microbial biomass and activity in geomorphic features in forested and urban restored and degraded streams. Ecol. Eng. 2012, 38, 1–10. [Google Scholar] [CrossRef]
  103. Powers, S.M.; Johnson, R.A.; Stanley, E.H. Nutrient Retention and the Problem of Hydrologic Disconnection in Streams and Wetlands. Ecosystems 2012, 15, 435–449. [Google Scholar] [CrossRef]
  104. Merwade, V.M.; Maidment, D.R.; Hodges, B.R. Geospatial representation of river channels. J. Hydrol. Eng. 2005, 10, 243–251. [Google Scholar] [CrossRef]
  105. Abdelnour, A.; McKane, B.R.; Stieglitz, M.; Pan, F.; Cheng, Y. Effects of harvest on carbon and nitrogen dynamics in a Pacific Northwest forest catchment. Water Resour. Res. 2013, 49, 1292–1313. [Google Scholar] [CrossRef]
  106. Abdelnour, A.; Stieglitz, M.; Pan, F.; McKane, R. Catchment hydrological responses to forest harvest amount and spatial pattern. Water Resour. Res. 2011, 47, W09521. [Google Scholar] [CrossRef]
  107. McKane, R.B. US EPA Sustainable and Healthy Communities Research: A Pacific Northwest Demonstration Study; United States Environmental Protection Agency: Washington, DC, USA, 2014.
  108. McKane, R.B. US EPA Enhanced Version of Velma Eco-Hydrological Modeling and Decision Support Framework to Address Engineered and Natural Applications of Green Infrastructure for Reducing Nonpoint Inputs of Nutrients and Contaminants; United States Environmental Protection Agency: Washington, DC, USA, 2014.
Figure 1. (a) Based on our search criteria, we found 550 publications about stream restoration since 1978 and (b) 79 empirical nutrient studies about stream restoration since 1997. (c) The 79 empirical nutrient studies were located in the United States (45 studies), Austria (6), Denmark (6), Germany (4), England (3), Spain (3), China (3), France (2) and the following countries each had one study: Canada, Iraq/Iran, Japan, Korea, Poland, Taiwan, and Mexico/USA. American states with studies were Maryland (11), North Carolina (7), Indiana (2), Michigan (2), Mississippi (2), Nevada (2), New York (2), Ohio (2), Virginia (2), Wisconsin (2), and the following states each had 1 study: Arkansas, California, Florida, Georgia, Illinois, Kentucky, Tennessee, Wyoming, Washington, Texas and there was a study comparing sites in Maryland, Illinois, and Iowa.
Water 08 00116 g001
Figure 2. Restoration projects were divided into nine typologies: (A) raise stream bottom, (B) lower floodplain; (C) raise water levels with drainage control structures; (D) reconnect wetlands; (E) remove concrete liner; and (F) daylighting urban streams buried in pipes; (G) increase sinuosity; (H) add in-stream wetlands; and (I) reconnect oxbow wetlands.
Water 08 00116 g002
Figure 3. Pie chart representing diverse methods used for evaluating stream and river restoration. The primary methods used were changes in nutrient concentrations, mass balances, denitrification, and nutrient spiraling. Alternative methods were sediment dynamics, plant dynamics, nitrification, stable isotope ratios, dissimilatory nitrate reduction to ammonium (DNRA), anammox, microbial biomass nitrogen (MBN) and potentially mineralizable nitrogen (PMN). The percentage of the 79 studies using each method is listed along with the total number of studies. The total percentages do not add up to 100% because many studies used multiple methods.
Water 08 00116 g003
Figure 4. Meta-analysis of nutrient spiraling metrics showed that nitrate uptake length (m) had a positive correlation with (a) watershed area (ha) and (b) average stream width (m). Nitrate uptake length relationships were only significant after a high winter value of 2668 m from McMillan et al. (2014) was excluded (this high value has been circled).
Water 08 00116 g004
Figure 5. Meta-analysis of nutrient spiraling showed that nitrate areal uptake rate (U; μg/m2/s) had a positive relationship with impervious surface coverage (%) in restored streams. Note that the regression analysis was only conducted on the restored streams.
Water 08 00116 g005
Figure 6. In restored streams, ammonium areal uptake rate (U; μg/m2/s) was negatively correlated with (a) disturbance intensity (%) and (b) ammonium concentration (μg/L).
Water 08 00116 g006
Figure 7. In restored streams, ammonium uptake velocity (Vf; mm/min) was negatively correlated with (a) disturbance intensity (%) and (b) ammonium concentration (μg/L) and positively correlated with (c) discharge and (d) velocity. There was also a marginally significant positive correlation with (e) the relative extent of transient storage (AS/A) and a weak negative correlation with (f) the median travel time due to transient storage over a standardized 200 m reach (%).
Water 08 00116 g007
Figure 8. Meta-analysis of nutrient spiraling showed that SRP uptake length (m) had a positive correlation with (a) watershed area (ha) and (b) discharge (L/s).
Water 08 00116 g008
Figure 9. Meta-analysis of nutrient spiraling showed that SRP uptake velocity (mm/min) had a positive correlation with (a) discharge (L/s), (b) Chl-a (mg/m2) and (c) SRP concentration (μg/L), and a negative correlation with (d) ammonium concentration (μg/L).
Water 08 00116 g009
Table 1. The 79 empirical nutrient studies were divided into four strategies used to increase hydrologic connectivity. We recorded the number of results for each strategy as well as a percentage of nutrient retention results that were positive, neutral, and negative. Note that the total number of results is higher than the total number of studies because many studies used multiple strategies and many studies had multiple results based upon seasonality and nutrient species (Table S1). For a more detailed evaluation by typology please see Figure S1.
Strategies Used to Increase Hydrologic ConnectivityTypologies Included from Figure 2Number of Results from 79 StudiesPositive Results (%)Neutral Results (%)Negative Results (%)
Floodplain ReconnectionABCD6260%28%12%
Streambed ReconnectionEF970%20%10%
Increased Stream Surface AreaG1965%22%13%
Increased Wetland Surface AreaHI2475%14%11%
Total 11462%26%12%
Table 2. We recorded the nutrient spiraling tracers (NH4+, NO3, and/or SRP) and uptake metrics (k (uptake rate coefficient; s−1), SW (uptake length; m), U (areal uptake; μg/m2/s), Vf (uptake velocity; mm/min), amount of nutrient removed in g/day, and uptake coefficient in the main channel (λ) vs. uptake coefficient in the transient storage zone (λs; s−1)) that were used as well as a summary for each study.
CitationTracer UsedUptake Metrics RecordedDescription of Study StreamsN(Typology from Figure 2: Rating)—Summary of Nutrient Spiraling Results
NH4+NO3−SRPkSWUVf%Other
[72]X XXXX Pristine, restored, broadened, and incised streams31(ABG: Positive and Negative)—Restored and pristine reaches had significantly shorter SW and larger Vf than channelized reaches, and NH4+ uptake was positively correlated with transient storage.
[59]X X XX Coarse woody debris treatment and control16(A: Positive)—Coarse woody debris treatments had significantly higher uptake than the control (Vf increased by 23%–154% and U by 61%–235%).
[73]X X Acid mine drainage (AMD)9(AC: Neutral)—All streams were net heterotrophic with varying levels of NH4+ uptake. No site differences were found.
[74]X XXX Restored and unrestored reference streams12(AB: Positive)—Significantly shorter NH4+ SW was observed in restored compared to unrestored sites 2 years post-restoration likely due to greater biofilm development on larger substrates with less canopy cover. There was not a significant change to U or Vf.
[79]X X Xλ
λs
Control stream plus 4 treatments24(A: Neutral)—Substrate treatment increased transient storage zone and decreased velocity in 20 m reaches but did not significantly affect larger reach.
[80]X X X Pre-restoration, restored, and reference14(GI: Positive and Neutral)—After stream restoration, nutrient demand spiked to levels that have rarely been reported, but demand recovered within 35 days.
[75] X Xg/dayMan-made riffles/step vs. natural riffle4(A: Positive)—Natural riffle had greater NO3− % removal than constructed riffle, but constructed riffle removed 3 times more due to larger hyporheic exchange flux.
[76] X XXX 3 restored streams6(AC: Positive and Neutral)—Doubling tracer N concentration increased SW and decreased U & Vf
[30] X XXXXX 2 degraded and 2 restored streams5(ABEG: Positive)—SW increased with velocity
[77] X XXX Restored, urban, and forest streams6(ABEH: Positive)—Vf and U were greater in stream reaches than adjacent stormwater control measures
[78] X XX 3 restored, 3 urban degraded, & 3 forest streams24(A: Positive and Neutral)—In summer, restored reaches had higher uptake rates than unrestored/forested reaches; Temperature and % canopy cover explained 80% of the variation in uptake.
[29] XXXX X Channelized, restored, and reference reach44(AGI: Positive)—Lowering velocity and raising transient storage in restored stream increased uptake but difference was not statistically significant.
[81] XX XXX
5 streams restored from 2002–2010
15(CG: Positive and Neutral)—P uptake was greater in newly restored sites (attributed to assimilation by algal biofilms), whereas NO3− uptake was highest in older sites potentially due to greater channel stability and establishment of microbial communities.
[82]XXX X Restored and reference24(A: Positive and Neutral)—Increases in gravel, cobble and boulder habitat in the restoration reaches were correlated with higher rates of nutrient uptake and metabolism.
[83]XXX X Acid mine drainage (AMD) degraded, restored, and reference6(HI: Positive and Negative)—Acid Mine Drainage (AMD) remediation restored NH4+ uptake, reduced NO3− uptake to undetectable level, and restored SRP uptake to near normal rates.
Sum8964791232
Table 3. Mean, median, range, and number of studies reporting each nutrient spiraling metric by stream type (restored, degraded, and reference). Uptake metrics included: SW (uptake length in m), U (areal uptake in μg/m2/s), and Vf (uptake velocity in mm/min). We listed P-values for ANOVA comparisons between stream types that are at least marginally significant (p < 0.12) and n.s. indicates not significant.
Stream TypeNO3NH4+SRP
SWUVfSWUVfSWUVf
(m)(μg/m2/s)(mm/min)(m)(μg/m2/s)(mm/min)(m)(μg/m2/s)(mm/min)
RestoredMean3165.22.2245.60.69.4153.213.85.7
Median1361.81.1 0.54.177.83.41.9
Range34–26680.15–320.0–8.970–4210.0–1.40.2–4912–5720.3–1170.1–33
Number2532362918181728
DegradedMean31075.33.0609.50.73.5 19.9
Median13410.421.0789.50.61.01403 11.8
Range108–18,6320.01–33.60.02–38.2197–8420.0–2.20.0–22.8 1.4–87.4
Number13122431723108
ReferenceMean27140.193.3 3.9 4.2
Median3450.030.4210.51.60.4413 4.9
Range238–75580.00–1.430.03–35 0.03–35 2.2–5.9
Number310131111109
ANOVA Comparisons Between Stream Types (p Value < 0.12)
Restored vs. Degradedp = 0.03n.s.n.s.n.s.p = 0.07p = 0.11n.s.n.s.p = 0.03
Degraded vs. Referencen.s.n.s.n.s.n.s.n.s.n.s.n.s.n.s.p = 0.05
Reference vs. Restoredn.s.n.s.n.s.n.s.n.s.n.s.n.s.n.s.n.s.
Table 4. The 15 nutrient spiraling studies measured 45 diverse potential controlling variables. We found 12 significant relationships between controlling variables and nutrient spiraling metrics (p ≤ 0.05). A plus sign (+) indicate a positive relationship and a minus sign (−) indicate a negative relationship. We also listed relationships that were marginally significant (p = 0.05 – 0.20). * Nitrate SW relationships were only significant after a high winter value of 2668 m from McMillan et al. (2014) was excluded.
Tracer UsedUptake Metrics RecordedWatershedReachConcentrationTransient StorageMetabolism
Watershed Area% Impervious% DisturbanceWidthDischargeVelocityNH4+SRPAS/AFmed200(%)Chl-a
NO3SW<0.001 * (+) 0.002 * (+)
U 0.04 (+)
Vf
NH4+SW
U 0.03 (−) 0.07 (−)
Vf 0.11 (−) 0.002 (+)0.002 (+)<0.001 (−) 0.07 (+)0.20 (−)
SRPSW0.01 (+) 0.02 (+)
U
Vf <0.001 (+) 0.11 (−)0.002 (+) 0.04 (+)
No. of Correlations:21213131111

