Article

Partitioning of Cotton Field Evapotranspiration under Mulched Drip Irrigation Based on a Dual Crop Coefficient Model

1
Department of Hydraulic Engineering, State Key Laboratory of Hydroscience and Engineering, Tsinghua University, Beijing 100084, China
2
Power China Kunming Engineering Corporation Limited, Kunming 650000, China
*
Author to whom correspondence should be addressed.
Water 2016, 8(3), 72; https://doi.org/10.3390/w8030072
Submission received: 7 December 2015 / Revised: 14 February 2016 / Accepted: 17 February 2016 / Published: 25 February 2016
(This article belongs to the Special Issue Water Resources Assessment and Management in Drylands)

Abstract

:
Estimation of field crop evapotranspiration ( E T c ) and its partitioning into evaporation and transpiration, are of great importance in hydrological modeling and agricultural water management. In this study, we used a dual crop coefficient model SIMDualKc to estimate the actual crop evapotranspiration ( E T c  act ) and the basal crop coefficients over a cotton field in Northwestern China. A two-year field experiment was implemented in the cotton field under mulched drip irrigation. The simulated E T c  act is consistent with observed E T c  act as derived based on the eddy covariance system in the field. Basal crop coefficients of cotton for the initial, mid-season, and end-season are 0.20, 0.90, and 0.50, respectively. The transpiration components of E T c  act are 96% (77%) and 94% (74%) in 2012 and 2013 with (without) plastic mulch, respectively. The impact of plastic mulch cover on soil evaporation is significant during drip irrigation ranging from crop development stage to mid-season stage. The extent of the impact depends on the variation of soil moisture, available energy of the soil surface, and the growth of the cotton leaves. Our results show that the SIMDualKc is capable of providing accurate estimation of E T c  act for cotton field under mulched drip irrigation, and could be used as a valuable tool to establish irrigation schedule for cotton fields in arid regions as Northwestern China.

1. Introduction

Crop evapotranspiration ( E T c ) consumes a large amount of irrigation water, especially in arid areas; thus, accurate estimation of evapotranspiration is the basis of hydrological modeling and agricultural water management [1]. Transpiration ( T ) through plant stomata is a desirable component because this process is usually associated with plant productivity; evaporation ( E ) over bare soil is usually considered as water loss but sometimes also provides a benefit for maintaining a micro-climate around the crop under conditions of high irrigation levels [2]; therefore, E T c partitioning is essential for agriculture water resource management as well as hydrological modeling [3,4]. Common ways to partition E T c include experimental methods or simulation methods. For the experimental methods, lysimeters [5,6], soil water budget [7], sap flow [8,9], and stable isotope [10,11] methods are usually adopted to evaluate E and T individually in previous studies.
However, these experimental methods usually require costly equipment and can only be carried out at point scale, which provides poor spatial representation [10]. Therefore, a number of models have been developed to predict E and T conveniently and to simulate evapotranspiration for agricultural management [12,13,14]. In these models, the FAO-56 crop coefficient reference evapotranspiration methods [12], including single and dual crop coefficient methods, are commonly used to calculate E T c [6,15,16,17]. The FAO-56 dual crop coefficient method separately calculates transpiration and evaporation, which has been widely used in agriculture science [5,18,19,20,21,22,23]. The SIMDualKc model is based on the FAO-56 dual crop coefficient approach and combined with the hydrological extension for complete water balance, which can be used to support general irrigation scheduling needs [24]. The modelemploys a graphic- and menu-driven user interface that can serve as a convenient and effective tool to calculate actual crop E T c [24]. The model has been used worldwide for different crops, such as wheat, maize, barley, soybean, cotton, vineyard, and other kinds of ecosystems [22,23,25,26,27,28,29,30]; the model also exhibits good adaptation and efficiency under various irrigation methods [22,23,24,26,31] and ground cover [32,33,34]. Hence, the model was utilized in our study to implement the use of the dual crop coefficient of cotton under mulched drip irrigation in Northwest China. The model should be properly calibrated and validated before use when management options have not been initially tested, and the observed soil moisture and E T c are common variables used for this purpose [22,30,35].
The eddy covariance (EC) system, which can directly measure E T c , is widely used in the field and is recognized as the standard method to measure E T c [1,36,37,38]. This system can accurately and continuously estimate crop coefficients in real time [11]. Studies on E T c and crop coefficient by EC, have been conducted on cropland, as well as other ecosystems [39,40]. In our study, the EC system was used to measure E T c in 2012 and 2013, and the measurements were used to calibrate the SIMDualKc model.
Cotton is an important and widely cultivated fiber crop in the United States, India, Pakistan, Uzbekistan, and China [41]. In 2012, the cultivated area for cotton production in Xinjiang Uygur Autonomous Region occupied more than 50% of China [42]. Xinjiang is in an arid area, thus, irrigation is critical for cotton growth [43,44,45]. Increased water consumption for irrigation leads to groundwater overexploitation and surface water overuse, which accelerates the deterioration of ecological environment especially in the downstream of inland rivers; excessive irrigation in arid areas can also induce secondary salinization which is harmful to the growth of crops [46,47,48]. The limited water resources and salinization constrain agriculture development in the region; thus, drip irrigation and plastic mulch are developed to conserve water [3]. Mulched drip irrigation is a useful and economic way to improve the soil micro-climate condition and increase the water efficiency [15,27,49,50]. Agricultural water consumption accounts for more than 90% of all water withdrawal from the Kaidu-Kongqi River Basin (a source basin of Tarim River in Xinjiang), and most cotton fields in the Kaidu-Kongqi River Basin are cultivated under mulched drip irrigation [38]. Mulched drip irrigation is a potential water-saving method also in other districts in China [20], as well as in Central Asia, where cotton is also heavily grown; these regions also exhibit a similar dry climate [41,51,52].
A few researchers have investigated dual crop coefficients under drip irrigation with mulching [15,27,49,53]. Nevertheless, research on cotton dual crop coefficient under mulched drip irrigation has been rarely reported. This study aimed to use an EC system and a SIMDualKc model to partition cotton field evapotranspiration under mulched drip irrigation and to evaluate the effect of plastic mulch on E T c . The SIMDualKc model was calibrated on the basis of the observed evapotranspiration data; recommended parameters, including crop coefficients proposed by the FAO [12], were also evaluated to determine applicable values in our study area.
The objectives of this study are as follows: (a) to validate the SIMDualKc model by using the observed data obtained by eddy covariance system; (b) to analyze the temporal variations of dual crop coefficients and the partition of cotton field E T c under mulched drip irrigation in different growth periods based on the simulated results; and (c) to estimate the effect of plastic mulch on E T c .

2. Materials and Methods

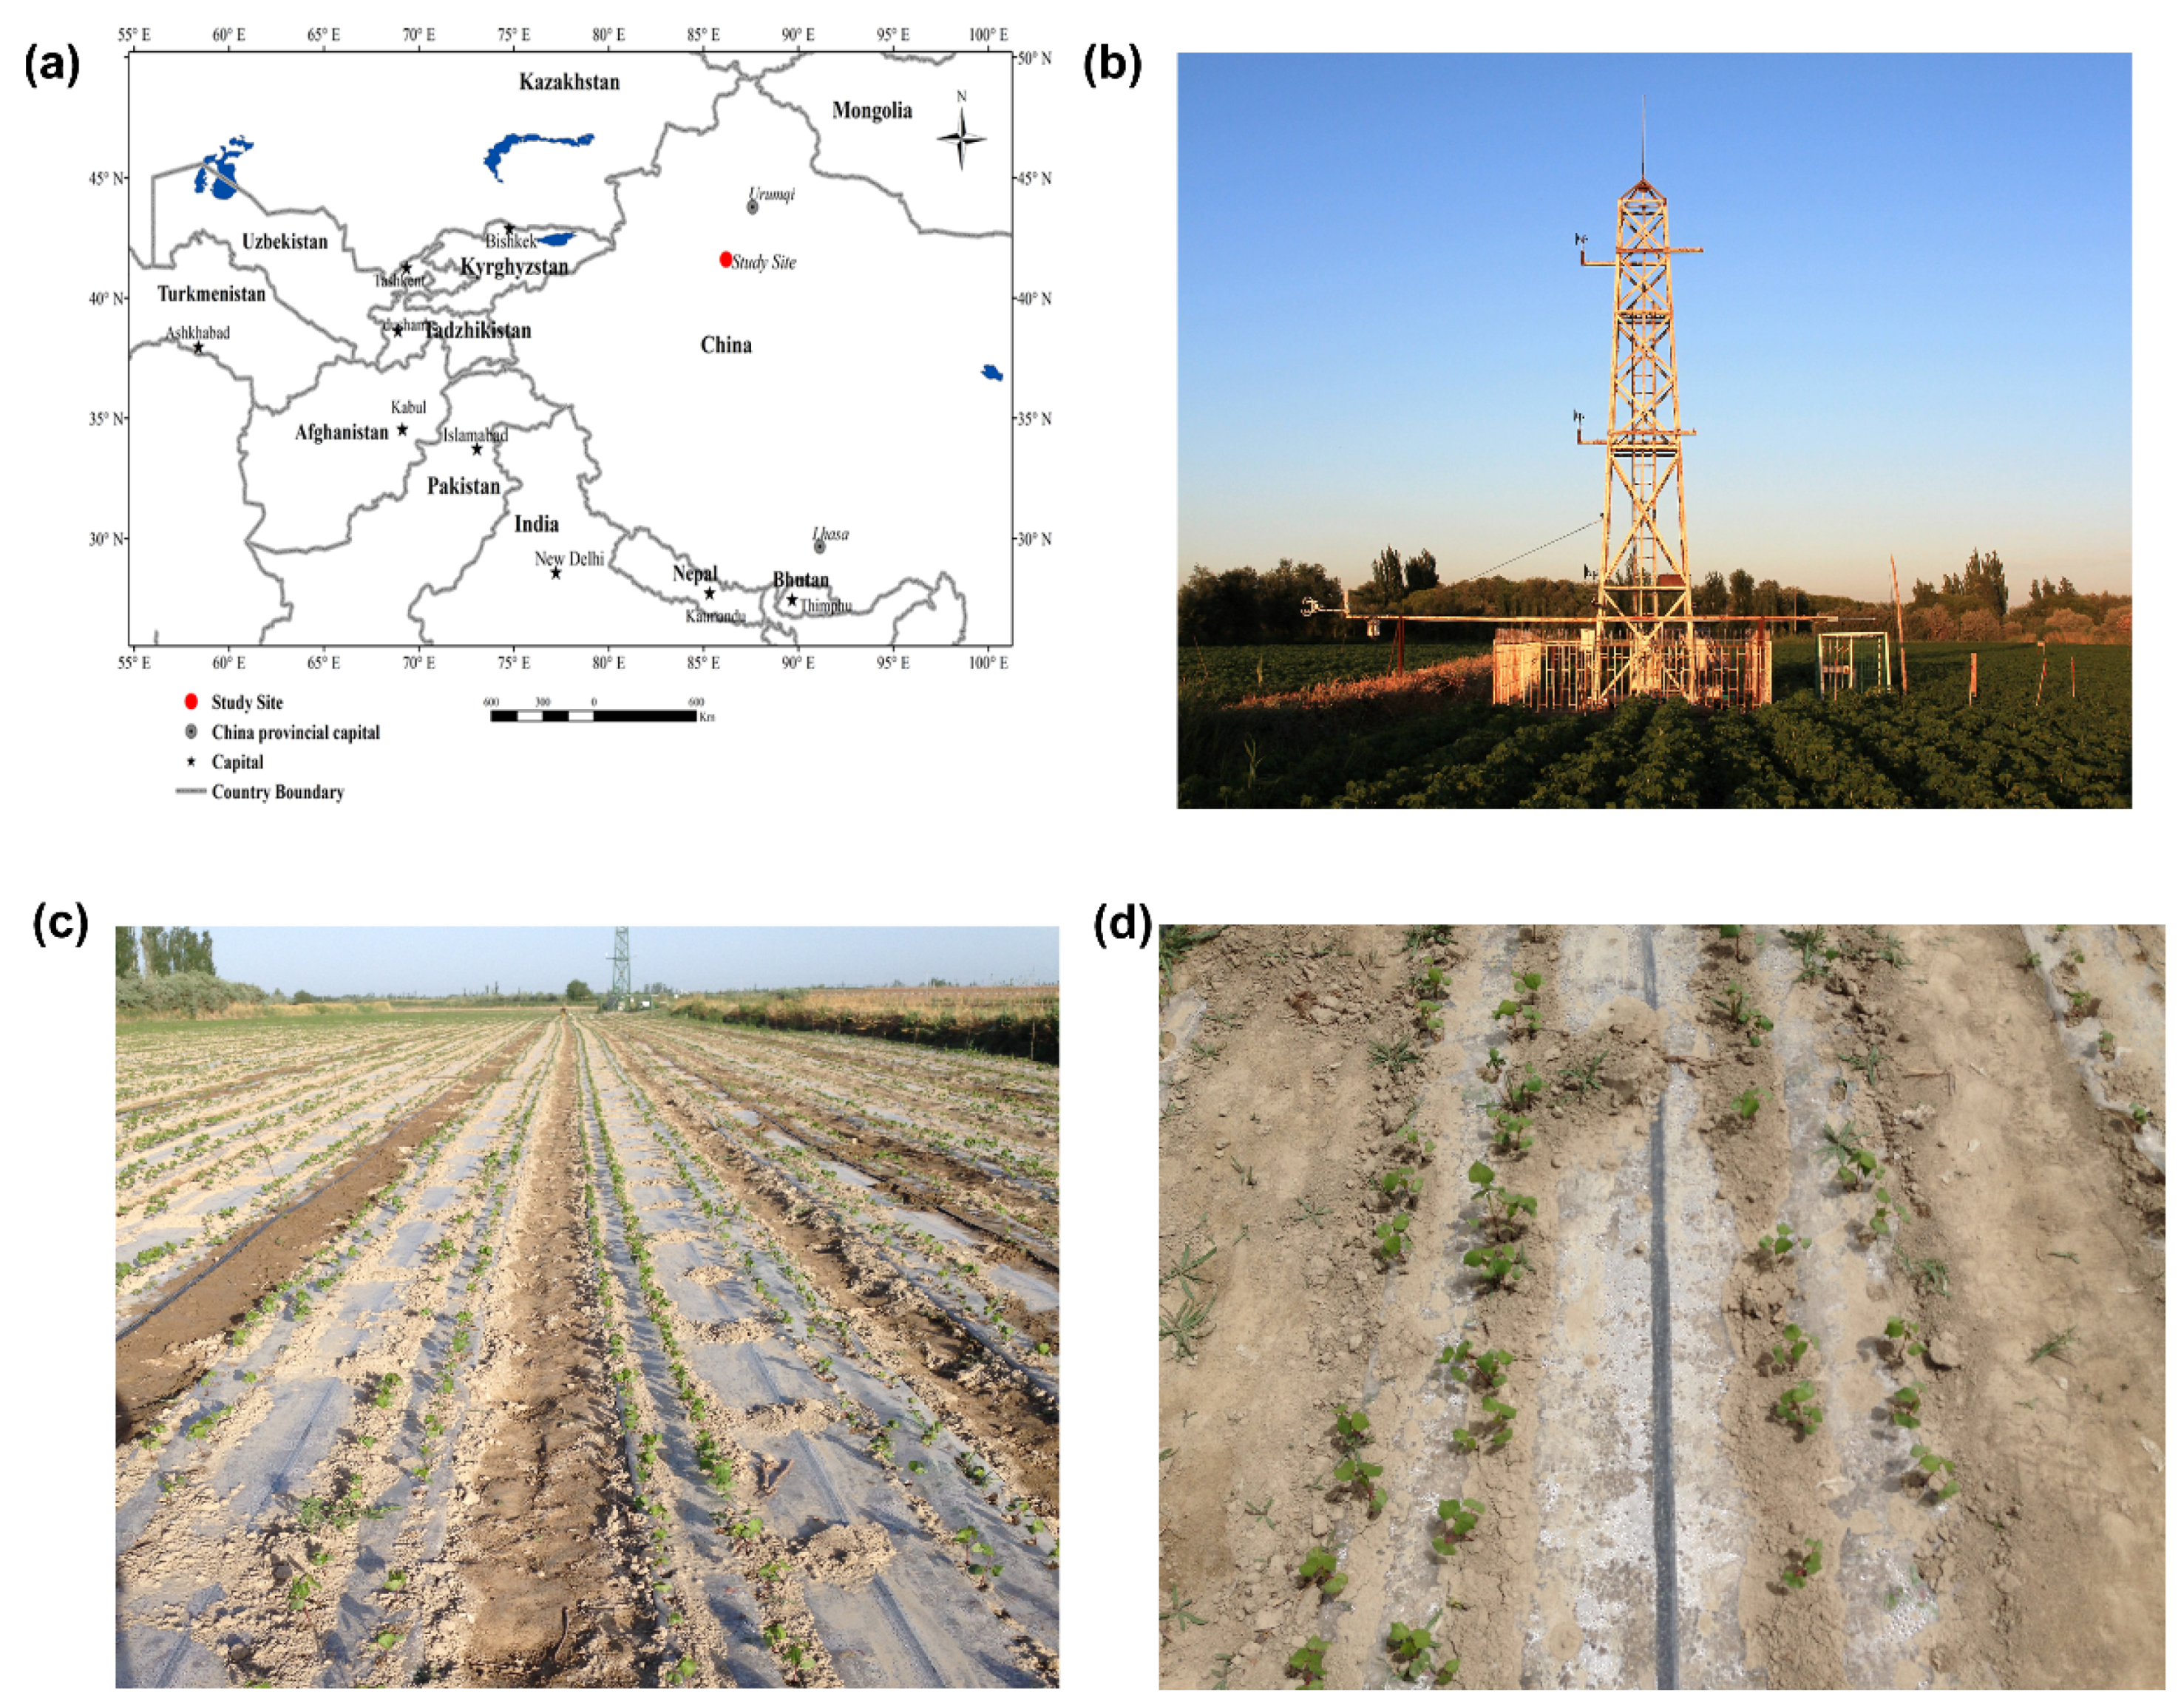
2.1. Experimental Site

The study area is located in the Tsinghua University-Korla Oasis Eco-hydrology Experimental Research Station, which is 22 km away from the town of Xiborni in Korla City, Xinjiang Uygur Autonomous Region (Figure 1). This area lies on the alluvial plain of Kaiqu-Kongqi River, at the southern foot of the Tian Shan Mountains. The average elevation is 897–902 m. The study area has a continental desert climate with a warm temperate zone, scarce precipitation and intense potential evapotranspiration. The annual mean precipitation is approximately 60 mm, and annual mean potential evaporation is approximately 2800 mm. Average annual temperature is 11.5 °C and sunshine duration is 3036 h. The average relative humidity, net radiation, and wind speed during the cotton growth period were 40%, 110 w·m−2, and 1.90 m·s−1, respectively. We carried out a two-year (2012–2013) experiment in this field. The reference evapotranspiration ( E T o ) is calculated based on the Peman-Monteith equation (as suggested by the FAO-56 [12]), using the observations from an automatic weather station within the experiment field. The variations of E T o are shown in Figure 2.
The groundwater table level was measured using an automatic water depth sensor (model HOBO U20 Titanium Water Level Data Logger, Onset Computer Corporation, Inc., Pocasset, MA, USA) installed in a groundwater well near the observation tower. The groundwater level varied from 1.0 m to 4.0 m throughout the entire growth period, reaching a high value at the beginning of cotton growth after flood irrigation. The flood irrigation was usually about two weeks before seeding, and from 25–29 March 2012 and from 22–26 March 2013 [54]. The total amount of the spring irrigation is about 375 mm for both the two years. The texture of the soil is loam, which is made up of 30% sand, 5% silt, and 65% loam. The soil bulk density of the experiment field is from 1.40 g·cm−3 to 1.64 g·cm−3 in the 1.5 m soil profile. The depth of frozen soil is approximately 60 cm. The saturated water content of soil is nearly 0.42 [50].

2.2. Cotton Planting

Cotton (Gossypium hirsutum L.) is planted under mulched drip irrigation in the entire growth period and the experimental field covers an area of 3.48 ha (see Figure 1). Mulched drip irrigation involves plastic mulch covering the drip tape and the surface soil. The cotton planting and drip irrigation tape employs one-film, one-pipe, four-row mode [38,44]. The drip irrigation tape is located beneath the middle of the mulch. Two cotton rows are symmetrically distributed on both sides of the tape. The mulch width is 110 cm, and the inter-mulch zone width is 40 cm. The widths of the cotton row spaces are 20, 44, and 20 cm (Figure 1). The irrigation schedules in the two-year experimental period are summarized in Table 1. Irrigation was performed roughly once a week starting in mid-June and ending in late August for both years. The irrigation lasts for about 12 h for each irrigation event and the flow is about 15 m3·h−1 with the meter measurement. The irrigation tape is made of plastic and the external diameter of the irrigation tape is 16mm, the wall thickness is about 0.2 mm, the space between the drip holes is about 0.3 m, the work pressure is 0.10 MPa, and the flow rate of each tape is 3.2 L·h−1.
Cotton was sown in mid-April and harvested in early October. The growth stages of cotton are shown in Table 2. The seeds were sown with a spacing of 0.1 m between rows, and the planting densities were approximately 89,800 and 95,700 plants ha−1 in 2012 and 2013, respectively. The planting density in 2012 was approximately 6% less than that in 2013 because of sandstorm and freezing damage that caused a low emergence rate of cotton. The crop height, root depth, and leaf area index (LAI) were measured at an interval of two weeks, and the main crop physiological parameters of the growth stage are presented in Table 3. All of the leaves were stripped from each plant, and the leaf area was then obtained by directly scanning all of the leaves using a leaf area meter (model Yaxin-1241, Beijing Yaxinliyi Science and Technology Co., Ltd., Beijing, China). The LAI was calculated by dividing the leaf area by the area that each plant occupied [38].

2.3. EC System

The EC system was installed in a 10 m-high stationary tower (see Figure 1 for more details). The main components of EC system are as follows: a fast response open-path infrared gas (H2O and CO2) analyzer (model EC150, Campbell Scientific Inc., Logan, UT, USA), a fast response 3D sonic anemometer (model CSAT3, Campbell Scientific Inc.), air temperature/humidity sensor (model HMP155A, Vaisala Inc., Woburn, MA, USA), a micro logger (model CR3000, Campbell Scientific Inc.) and net radiometer (model LITE2, Kipp and Zonen, Delft, The Netherlands). The abovementioned equipment was installed at a height of 2.25 m. The soil heat flux plates (model HFP01SC, Hukseflux, The Netherlands) were imbedded 0.05 m below the ground surface under the film-mulched zone and inter-film zone to obtain the soil heat flux (G). Data processing and energy closure have been discussed in the literature [38], and the data over two years from the EC system were used in this study. The latent heat flux was calculated by multiplying vertical velocity fluctuations by a scalar concentration fluctuation [55]:
λ E T = λ ρ a w q ¯
where λ E T is the latent heat flux (W·m−2), λ is the latent heat of vaporization (J·kg−1), ρ a is the air density (kg·m−3), and w q ¯ is the covariance between fluctuations of vertical wind speed w (m·s−1) and air humidity q (kg·kg−1).
The azimuth angle of the CSAT3 sensor is 50° from true north. The maximum height of the crop is approximately 70 cm, which ensures that the EC systems maintain an appropriate footprint. The data were measured at a frequency of 10 Hz and the fluxes were computed in half-hour. Energy closure was used to evaluate the quality of the measurement data. The net radiation ( R n ), G , sensible heat ( H ) and latent heat ( L E ) were all obtained through the EC systems. The slope of the energy balance equation ( L E + H = R n G ) for this site in 2012 and 2013 was 0.72 ( r 2 = 0.90 , n = 21 , 886 ) [38]. The ratio was similar to the values obtained in previous studies (0.70–0.90) [7]. Thus, the data can be regarded as reliable, considering the influence of the plastic mulch to the energy transport between the soil and atmosphere [56]. The calculated ET and variation of radiation and soil heat flux are shown in Figure 2.

2.4. SIMDualKc Model

The actual ET was simulated by using the SIMDualKc model, which is an irrigation scheduling simulation model. The actual crop ET is estimated by the dual crop coefficient equation as follows [12,24]:
E T c   a c t = ( K s K c b + K e ) E T o
where K c b is the basal crop coefficient, K s is the water stress reduction coefficient, K e is the soil evaporation coefficient, E T c  act is the actual crop evapotranspiration and E T o is the reference evapotranspiration (mm·day−1), which is calculated using the FAO Penman-Monteith equation [12,18].
The model considers the different influence of irrigation and precipitation on the variation of soil evaporation. The K e is divided into two parts, K e = K e i + K e p , where K e i is the soil evaporation coefficient induced by irrigation and precipitation that raise soil moisture, and K e p is the soil evaporation coefficient induced by the precipitation only [57]. The effects of crop height, crop density, and canopy architecture on K c b were calculated through the density coefficient ( K d ) [24,32].
Crop management is also considered in the model, such as using mulch to decrease the evaporation; that is, the model considers the fraction of soil covered by the plastic sheet and estimated the influence compared to the fraction of ground cover [24].
The input data of the model consist of the following [24]:
(a)
Soil data: the total available water ( T A W , mm·m−1). It can be calculated with the field soil content and wilting point soil moisture or use the suggested the values; amount and depth of the soil layers; effective depth of the evaporation layer ( Z e , m); readily and total evaporable water ( R E W and T E W , mm); and textural classes of that layer when the values are calculated by the model.
(b)
Meteorological daily data: minimum and maximum air temperature, T max and T min (°C); reference evapotranspiration ( E T o , mm); minimum relative humility ( R H min , %); precipitation ( P , mm); and wind speed at 2 m height ( u 2 , ms−1).
(c)
Crop data: data for the initial, crop development, mid-season, late-season and harvest or end-of-season growth stages; initial and end-of-season data of frozen soil; basal crop coefficient ( K c b ) for the initial, mid-season and harvest growth stages; soil water depletion fraction without stress ( p ), and the fraction of ground cover ( f c ), for all growth stages; root depths ( Z r , m) and crop height ( h , m).
(d)
Irrigation data: irrigation system; irrigation data; fraction of soil surface wetted by irrigation ( f w ) and the depth of each irrigation.
(e)
Other data: data used for the capillary rise and deep percolation equations; mulch data, including related management; active ground cover characteristics; and runoff data.
In this study, the effects of crop density, height, and canopy architecture on K c b are evaluated using a K d and the effect of using mulches is also included for assessing the water saving effect of plastic mulch covering [12]. The model contains a module which can consider the influence of the plastic mulch according to the actual situation. The model provides two alternative methods i.e., a simplified procedure described in Doorenbos and Pruitt [58] and the parametric equation proposed by Liu et al. [1] to evaluate the deep percolation and capillary rise. Considering the available data (soil water parameters, LAI and water table depths) (Figure 3), the parametric equation proposed by Liu et al. [34] was chosen to calculate the deep percolation and capillary rise.

2.5. Model Calibration and Validation

The SIMDualKc model initially simulated the E T c   a c t through the table values of the crop ( K c b and p ), the soil ( Z e , T E W and R E W ), and the percolation equation ( a p and b p ) suggested by the FAO-56 [12] and other previous studies [34]. The model was further calibrated to minimize the differences between the simulated and observed E T c   a c t . Model calibration utilized a trial and error procedure and a gradual change in the parameters from crop to soil, is described with more details in Rosa et al. [35]. The initial and calibrated values for the soil and crop parameters of the growth season are presented in Table 4. In our study, the data observed during the 2012 growth season was used to calibrate the model, and the observed data of 2013 was used for model validation. The real irrigation amount and respective data were used in simulation for calibration and validation.
Several goodness-of-fit indicators were applied in previous studies to evaluate the model predictions [35,59]. The simulated and observed E T c   a c t were compared through the figure, and regression was also calculated throughout the growth season. The linear regression between simulate and observed E T c   a c t was firstly been obtained. The determination coefficient r 2 of the regression is:
r 2 = [ i = 1 n ( O i O ¯ ) ( S i S ¯ ) i = 1 n ( O i O ¯ ) 2 i = 1 n ( S i S ¯ ) 2 ] 2
where O i and S i (i = 1, 2, …, n) represent the observed and simulated E T , and O ¯ and S ¯ are the corresponding mean values, when the value is close to 1.0, the predicted values are statistically close to the observed ones.
The indicators to evaluate the estimation errors are calculated as follows:
(a)
The Nash–Sutcliffe model efficiency coefficient N S E , which is the ratio of the mean square error to the variance in the observed data [27]:
N S E = 1 i = 1 n ( O i S i ) 2 i = 1 n ( O i O ¯ ) 2
(b)
The root mean square error, which characterizes the variance of the errors:
R M S E = [ i = 1 n ( S i O i ) 2 n ] 0.5
(c)
The ratio RSR of the RMSE to the standard deviation of observed data (sd) that standardizes RMSE using the sd of observations:
R S R = [ i = 1 n ( S i O i ) 2 ] 0.5 [ i = 1 n ( S ¯ i O i ) 2 ] 0.5
(d)
The average absolute error, which expresses the magnitude of estimation errors in alternative to R M S E :
A A E = 1 n i = 1 n | S i O i |
(e)
The average relative error, which indicates the size of errors in relative terms and is expressed as a percentage:
A R E = 100 n i = 1 n | S i O i O i |
(f)
The percent bias, which indicates measures the average tendency of the simulated data to be larger or smaller than their corresponding observations:
P B I A S = 100 i = 1 n | S i O i | i = 1 n O i

3. Results and Discussion

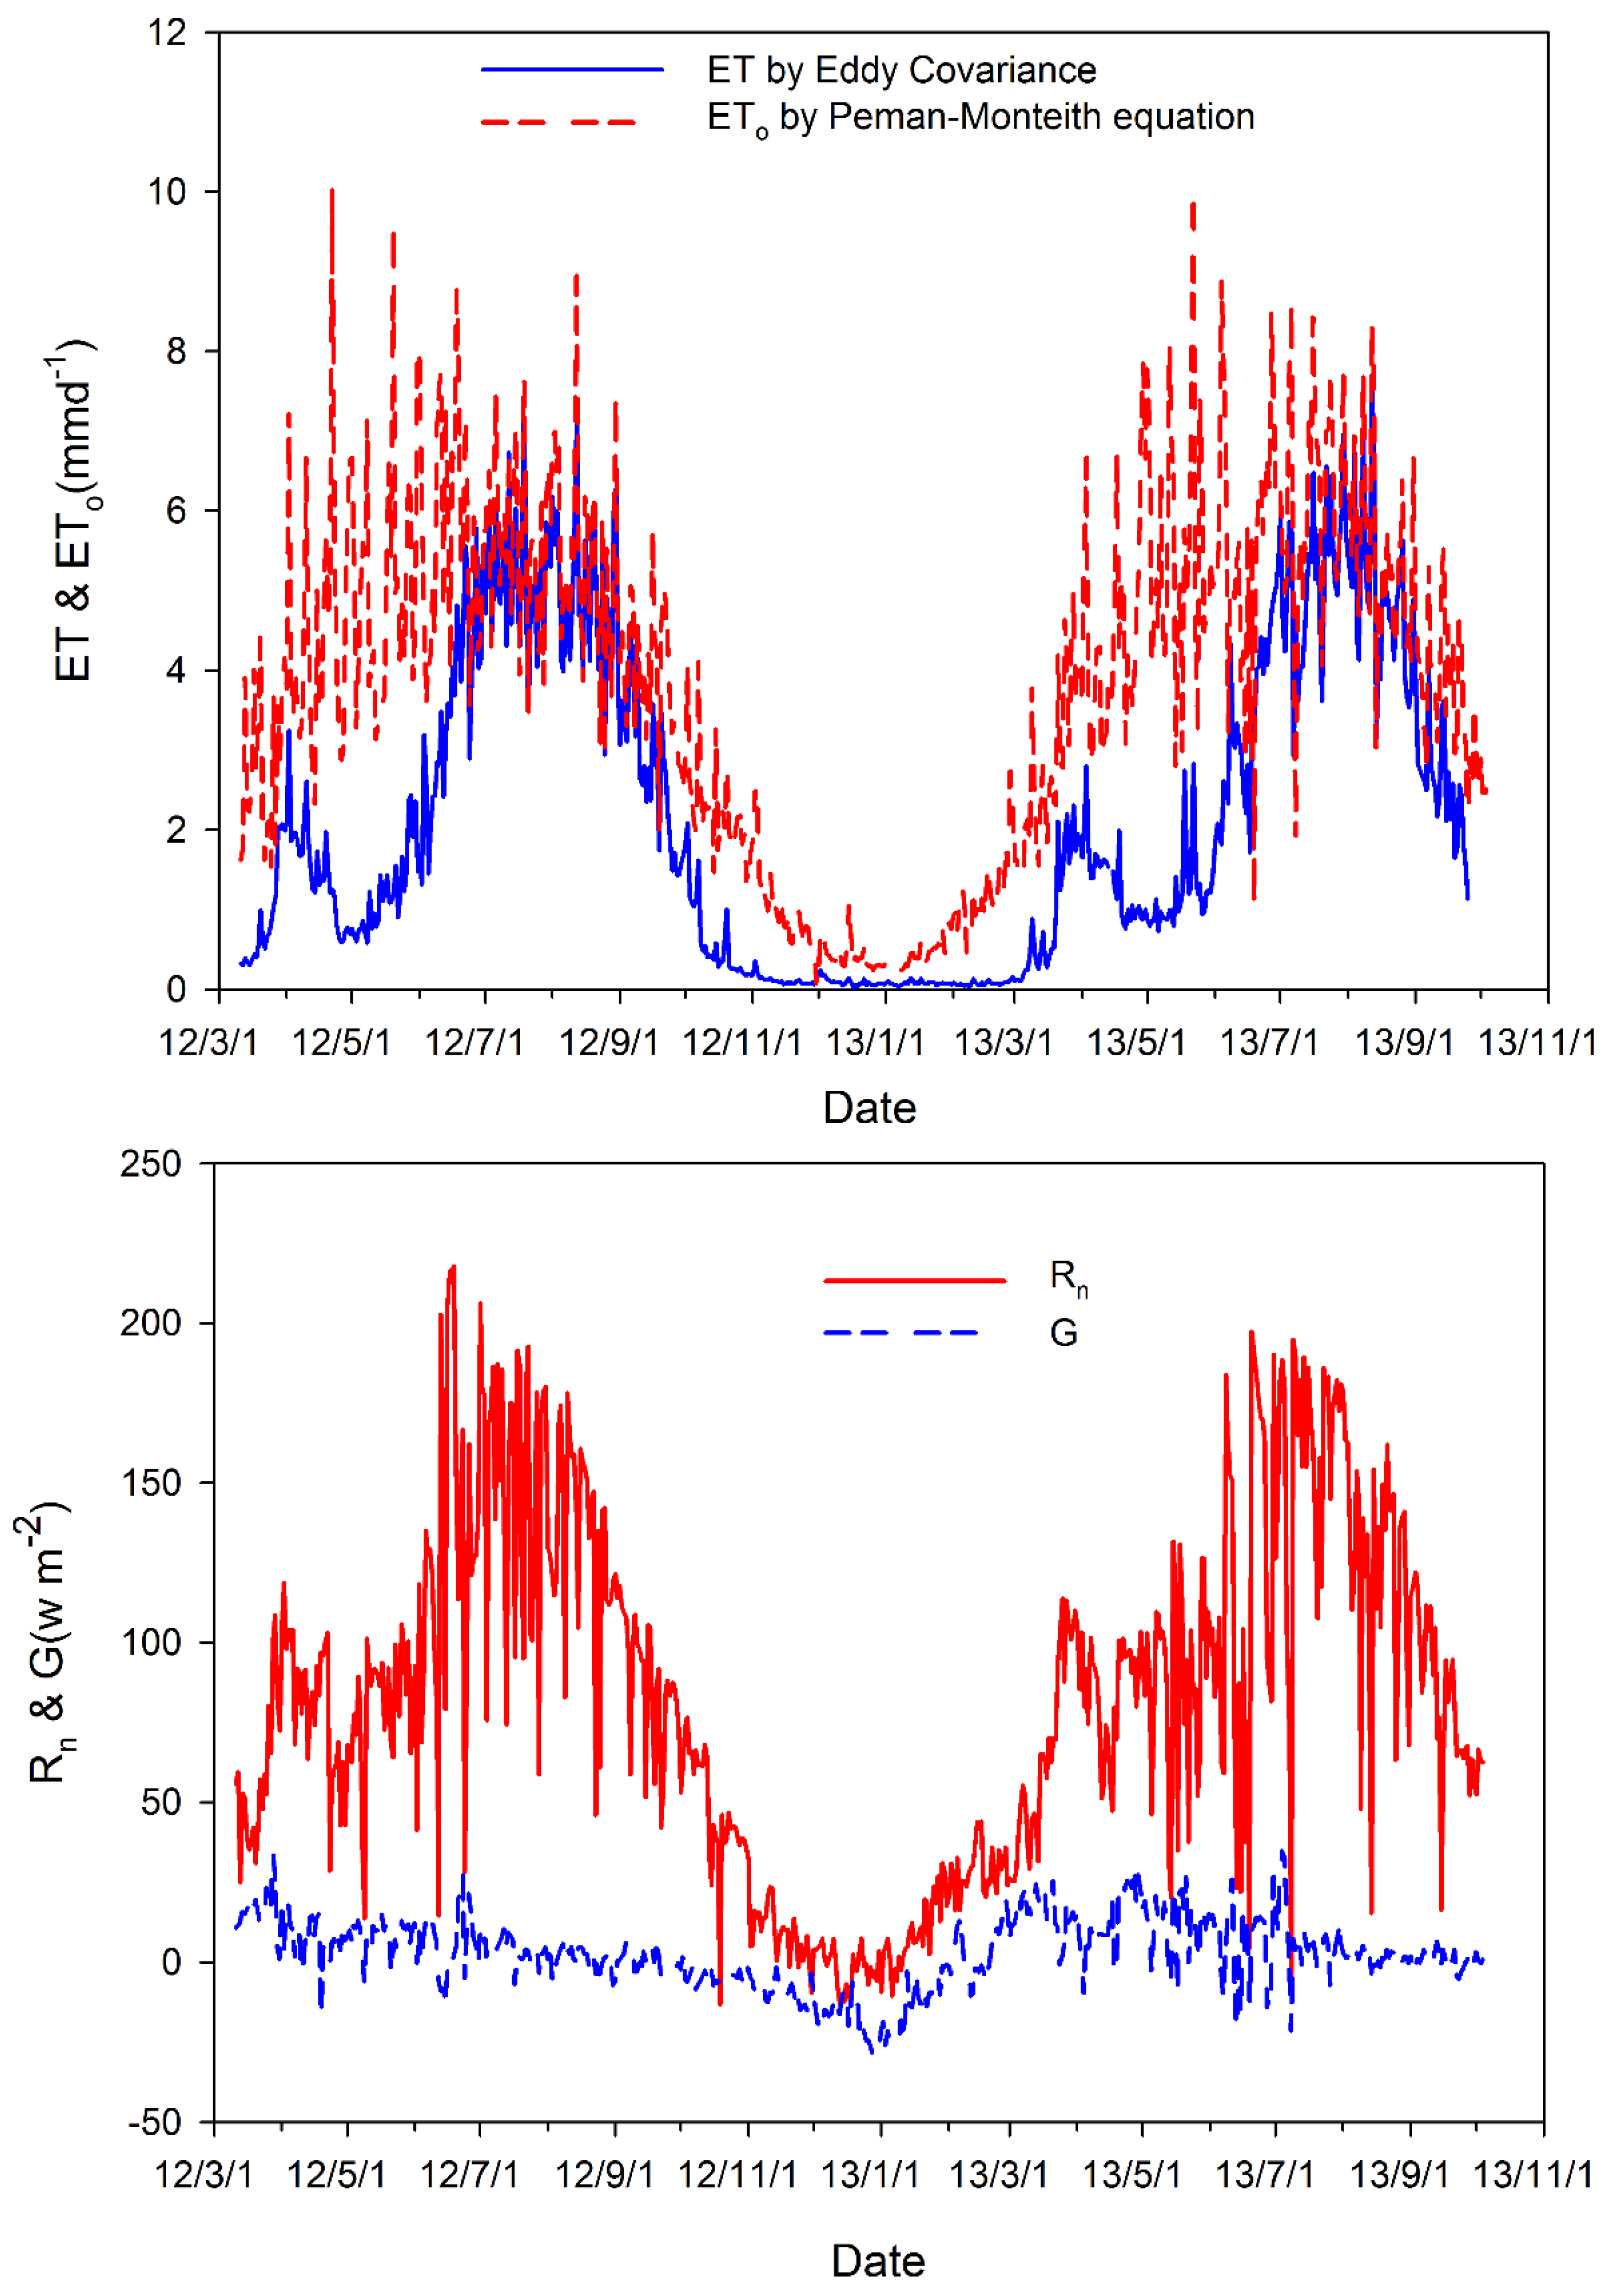
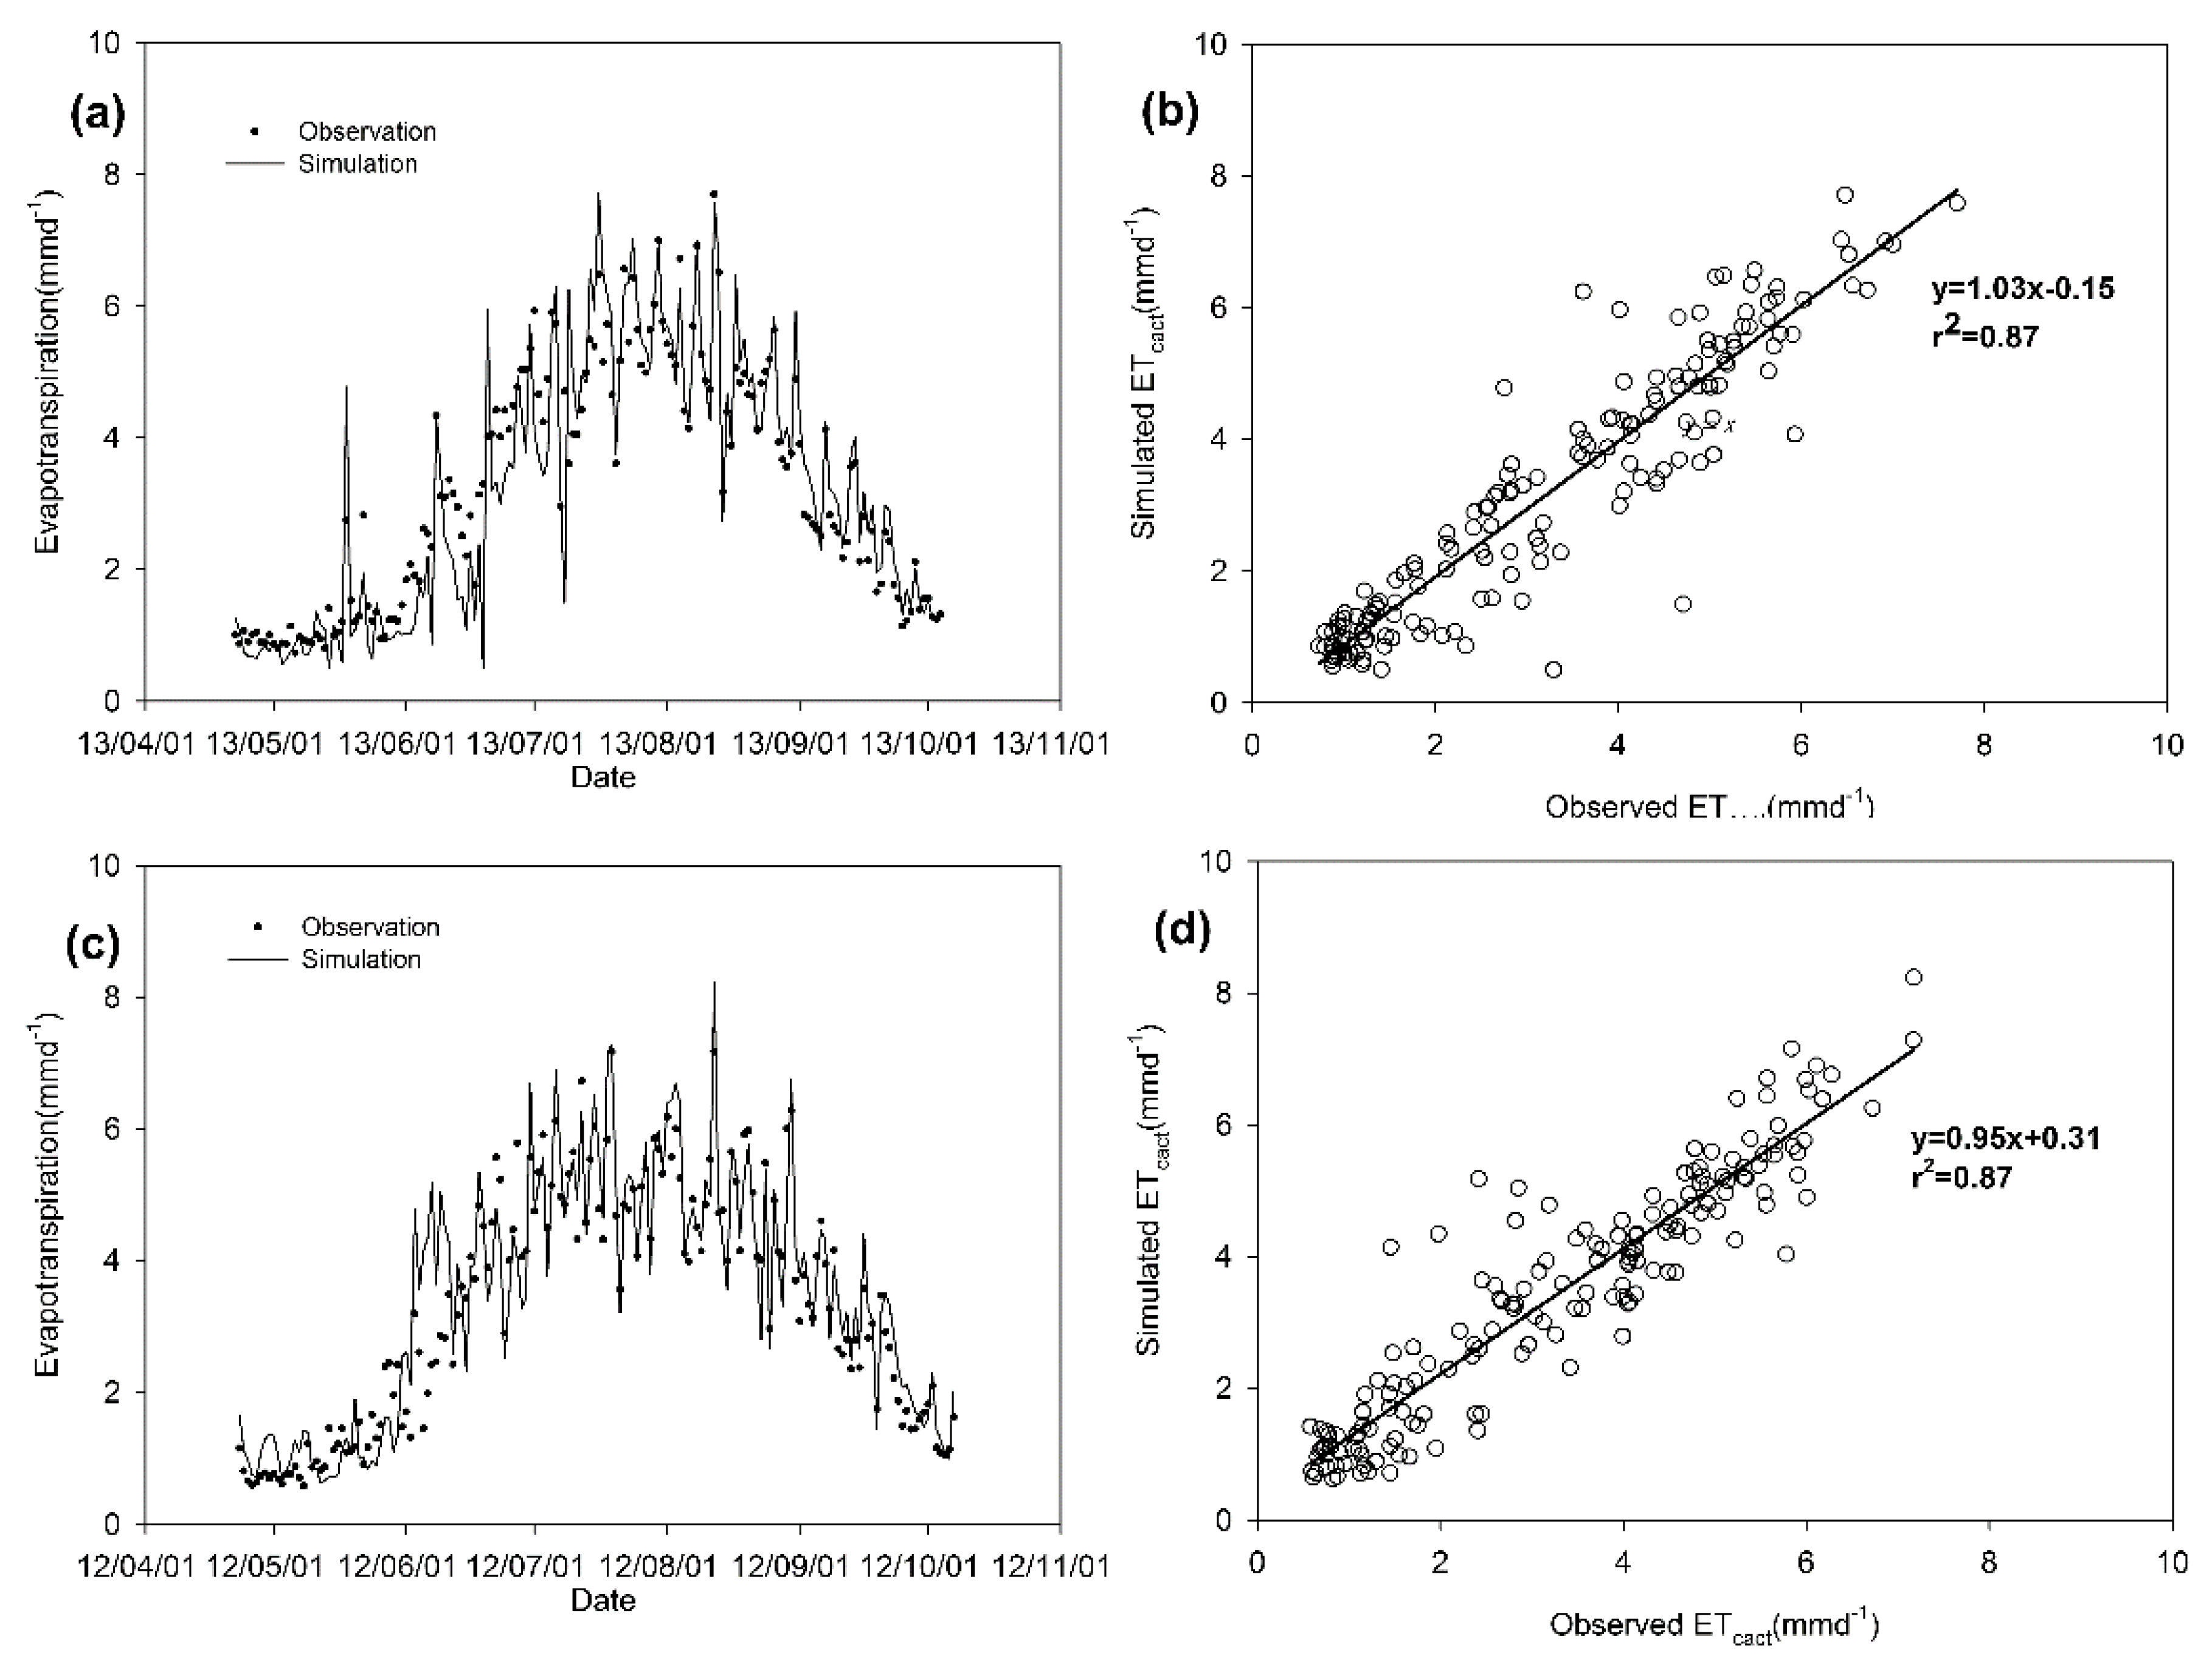
3.1. Model Calibration and Validation

The initial soil related parameters were set according to local conditions. In common farming practice, the spring flush was employed two weeks before cultivation to leach soil salt, which significantly increases soil moisture. Afterward, however, intensive potential evaporation causes a remarkable depletion of surface soil water [17,50]. Accordingly, the initial depletion of the evaporable layer was set at 80% of T E W , and the initial depletion of the root zone of T A W was estimated at 20% in 2012 and 2013.
The capillary rising parameters (a1 = 320.8, a2 = 303.2, a3 = −0.15, a4 = 7.55 and b1 = −0.16, b2 = −0.54, b3 = 2.1, and b4 = −2.03) and deep percolation equation ( a p = 408, b p = −0.0173) are adopted from Liu et al. [34]. LAI and water table depth are shown in Figure 3. The spring flush was applied in March, and the initial water table depth was approximately 1–2 m in April, decreased to approximately 3–4 m in June and varied in the drip irrigation period from June to August during the two experimental years.
The daily variation of the simulated (calibration and validation) and observed E T c  act (mm·day−1) are shown in Figure 4. The results show that the simulation results fit the observed data well and no significant biases were detected. The regression coefficient is 0.95 and 1.08 for 2012 and 2013, respectively. The calibrated parameters of the model are presented in Table 5. The parameters p are close to the suggested values by Allen et al. [12]. K c b  ini , K c b  mid is 33% more, 25% less than the suggested values by Allen et al. [12], while the K c b  end is nearly the same. The minimal variation in the parameters of deep percolation equation in the calibration showed the feasibility of the adopted equation.
The indicators of goodness-of-fit relative to the model tests are presented in Table 5. The observed E T c  act was 3.3 mm·day−1 and 3.2 mm·day−1 in 2012 and 2013, respectively, and the simulated E T c  act was 3.4 mm·day−1 and 3.2 mm·day−1, which were very close to the observed E T c  act . N S E , r 2 , R M S E , A A E , A R E , R S R , and P B I A S in 2012 were 0.89, 0.87, 0.68 mm·day−1, 0.50 mm·day−1, 21.8%, 0.38, and 15.0%, respectively, and 0.84, 0.87, 0.72 mm·day−1, 0.50 mm·day−1, 18.1%, 0.40 and 15.4% in 2013. The goodness-of-fit of the model in this area is close to the study for the maize and wheat in Northern China [22] and the study for peach orchard in Portugal [28].

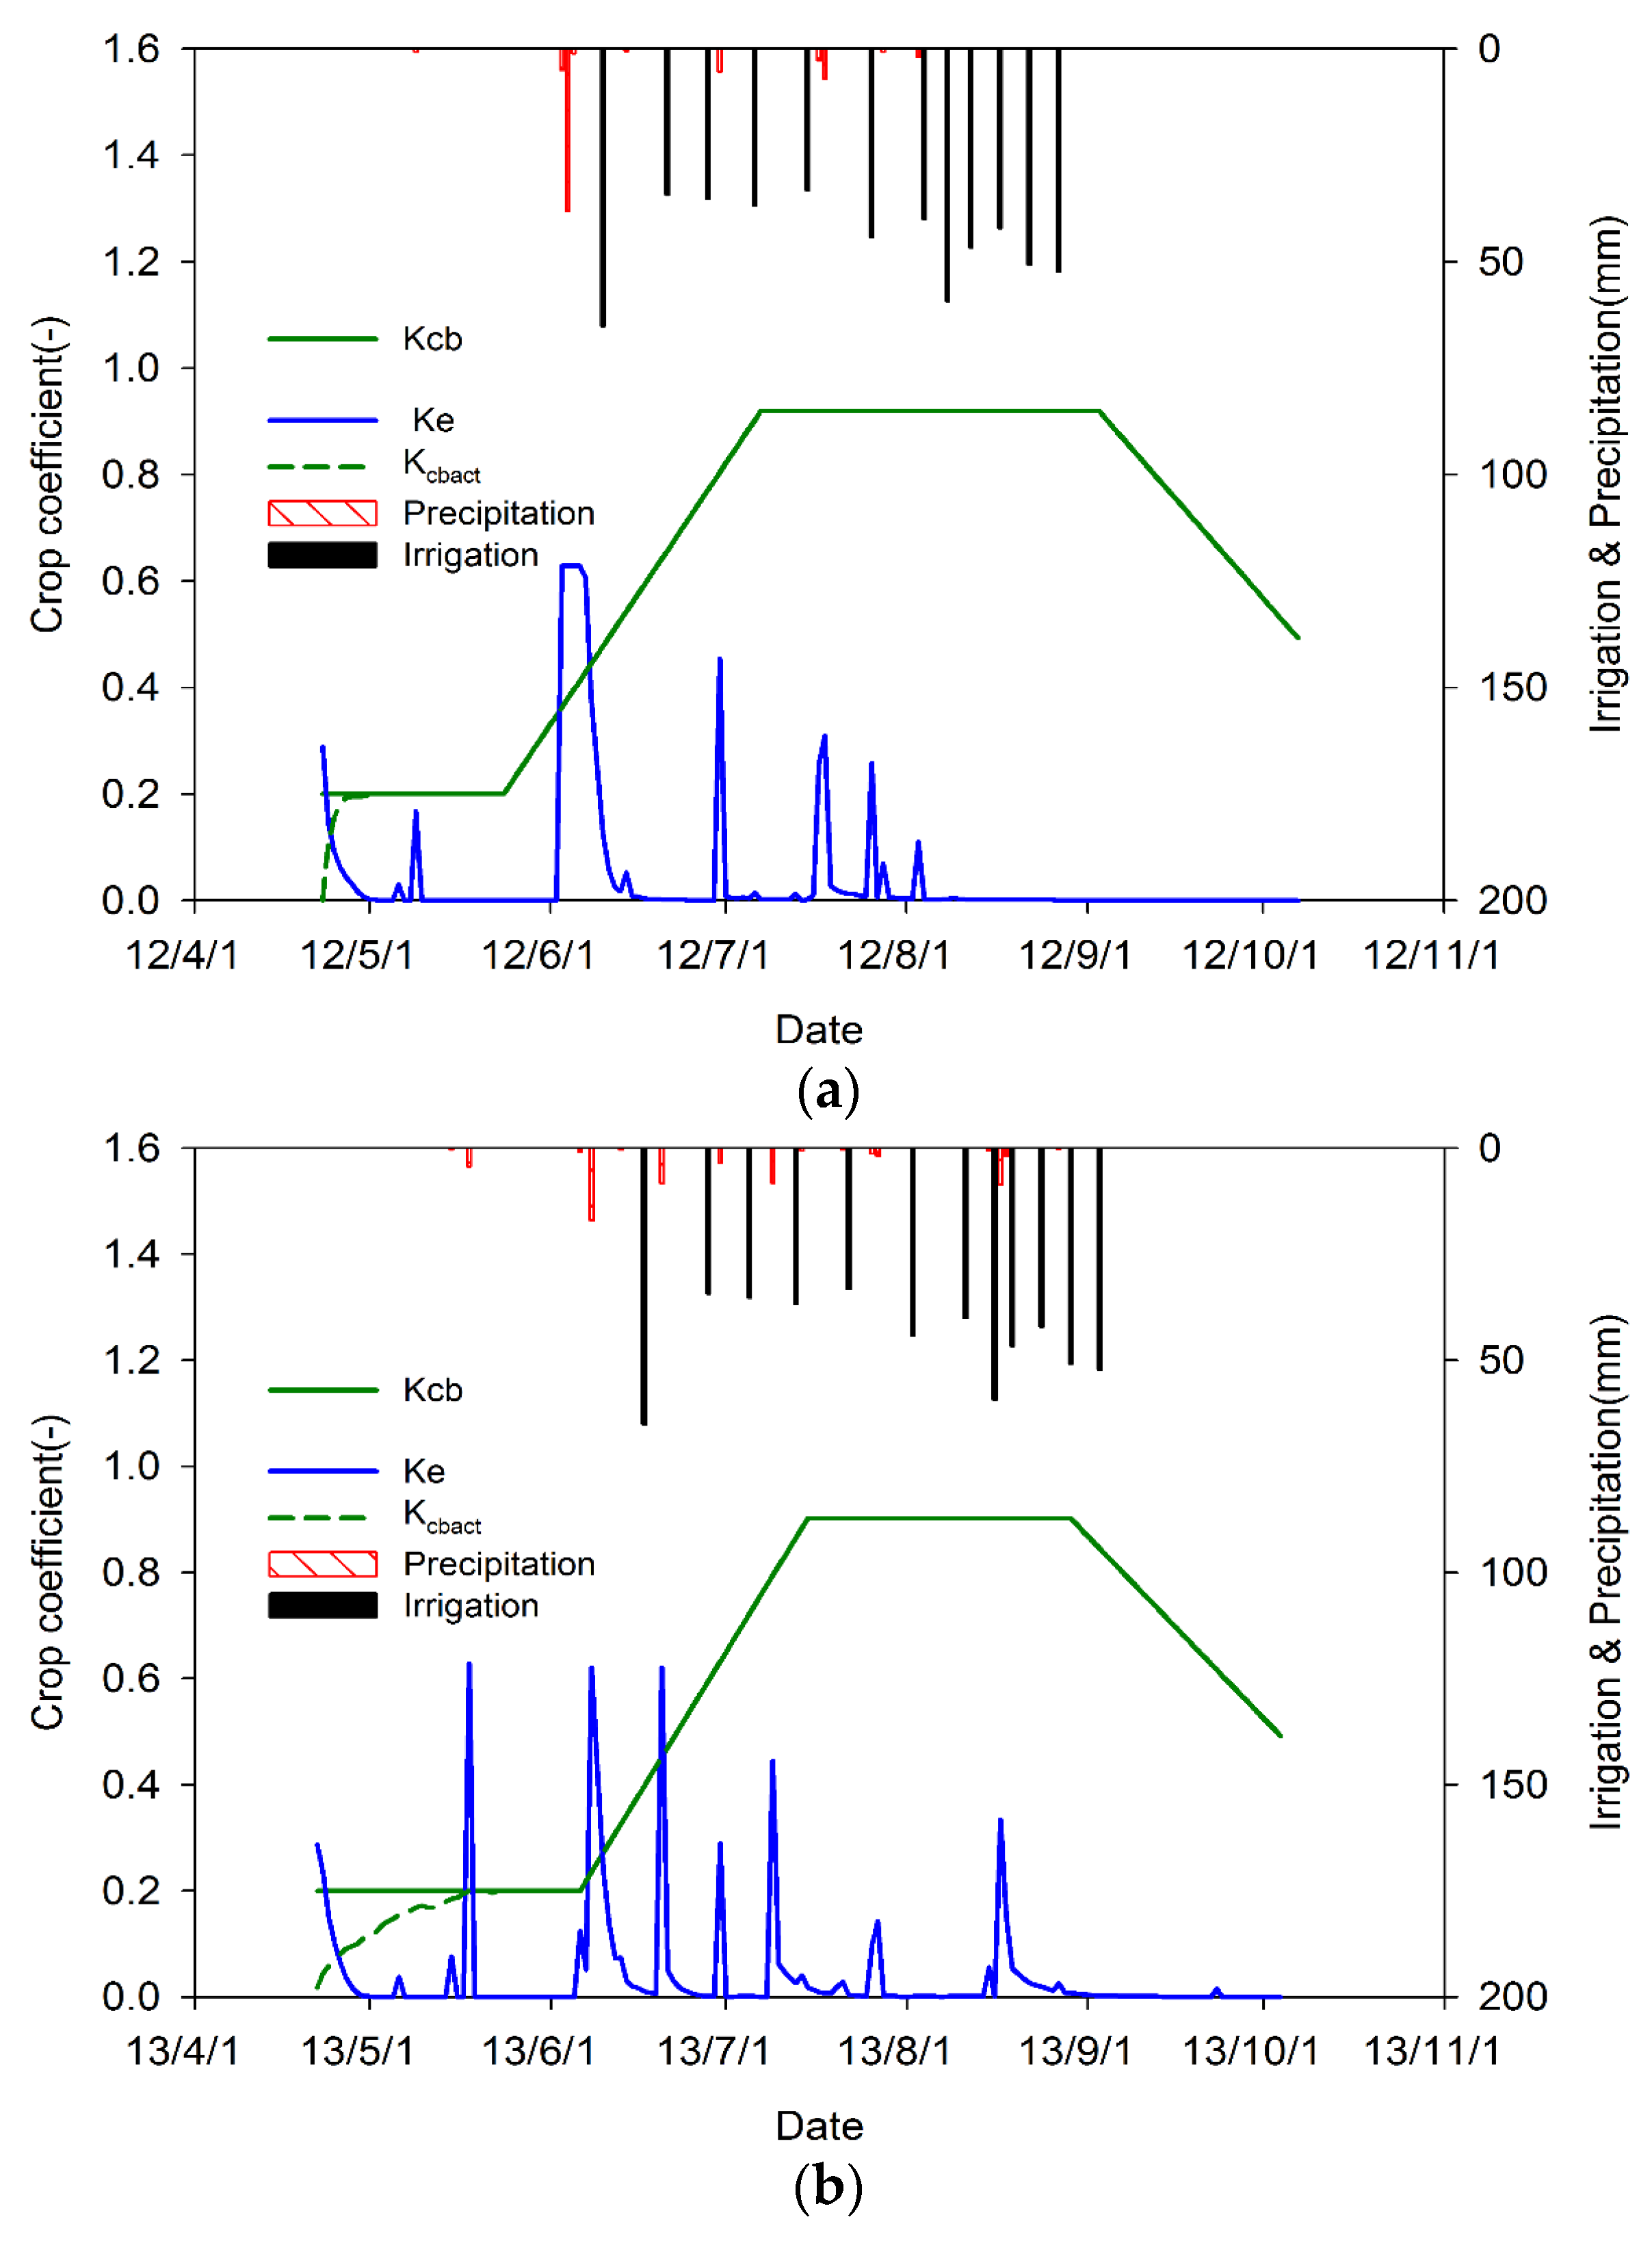
3.2. Crop Coefficients

The seasonal variations of K c b , K c b   a c t , and K e are presented in Figure 5. The calibrated basal crop coefficient K c b  ini = 0.20 was higher than the value of 0.15 (Table 4) proposed by Allen et al. [12]. In fact, K c b  ini is sensitive to irrigation management [16]. In our study area flood irrigation is usually implemented for approximately two weeks before sowing which rapidly increases the soil moisture and, thus, evaporation. Moreover, the soil was ploughed in the sowing period which increased the moisture of the soil surface. The calibrated mid-season basal crop coefficient K c b  ini = 0.90 was lower by 20% than the proposed value of 1.10–1.15. The difference can be attributed to the influence of plastic mulch which may decrease the suggested K c b by 10%–30% [12]. The end basal crop coefficient K c b  end = 0.50 which is within the range of proposed values of 0.40–0.50. The influence of plastic mulch on K c b   e n d is insignificant compared to K c b  mid . In the end growth stage, the ground was fully covered with the cotton, and when the irrigation ended, the influence of plastic mulch was negligible. The K c b increased with the growth stage from start to end, whereas the K c b  act maintained the same values as the calibrated K c b except in the initial stage when the irrigation started. The soil moisture was lower in this periods which may cause the soil water stress of the cotton. The K e values of the cotton were high in the initial stage when the soil moisture was high during sowing (Figure 5).
The parameter Ke was divided into two components in the model, namely, K e i which was related to the exposed fraction of soil wetted by both irrigation and precipitation, and K e p , which was related to the exposed fraction of soil wetted by precipitation only [24]. Considering drip irrigation, the soil wetted conditions with irrigation and precipitation are different. The variations of K e with the precipitation and irrigation are shown in Figure 5. The large variation range of K e before the irrigation is mainly because of the precipitation. K e was sensitive to the irrigation in the initial period which is due to the rapid increase in the surface soil moisture when the irrigation started. The influence of irrigation on K e decreased in the late middle stage as it was affected by the growth of the cotton leaves. The inter-film zone was covered by the leaves in late July, decreasing the soil evaporation. After this stage, the K e value stayed at low levels (close to zero), which implied that almost no soil evaporation occurred in that stage.
Allen [18] reported that K c b  mid equals to 1.0 in Turkey and suggested that the 15% reduction of the tabled values in the FAO-56 report were due to low planting density and non-uniform irrigation. Rosa et al. [24] proposed the K c b  mid equals to 1.15 with furrow irrigation in Uzbekistan. Howell et al. [60] proposed that K c b  mid equal to 1.23 with the lysimeters in the Northern Texas High Plains of the USA with sprinkle irrigation. K c b  mid , in our study, was less than the two cases above by approximately 10% and 25%, respectively. The differences can be mainly attributed to the influence of plastic mulch and location.

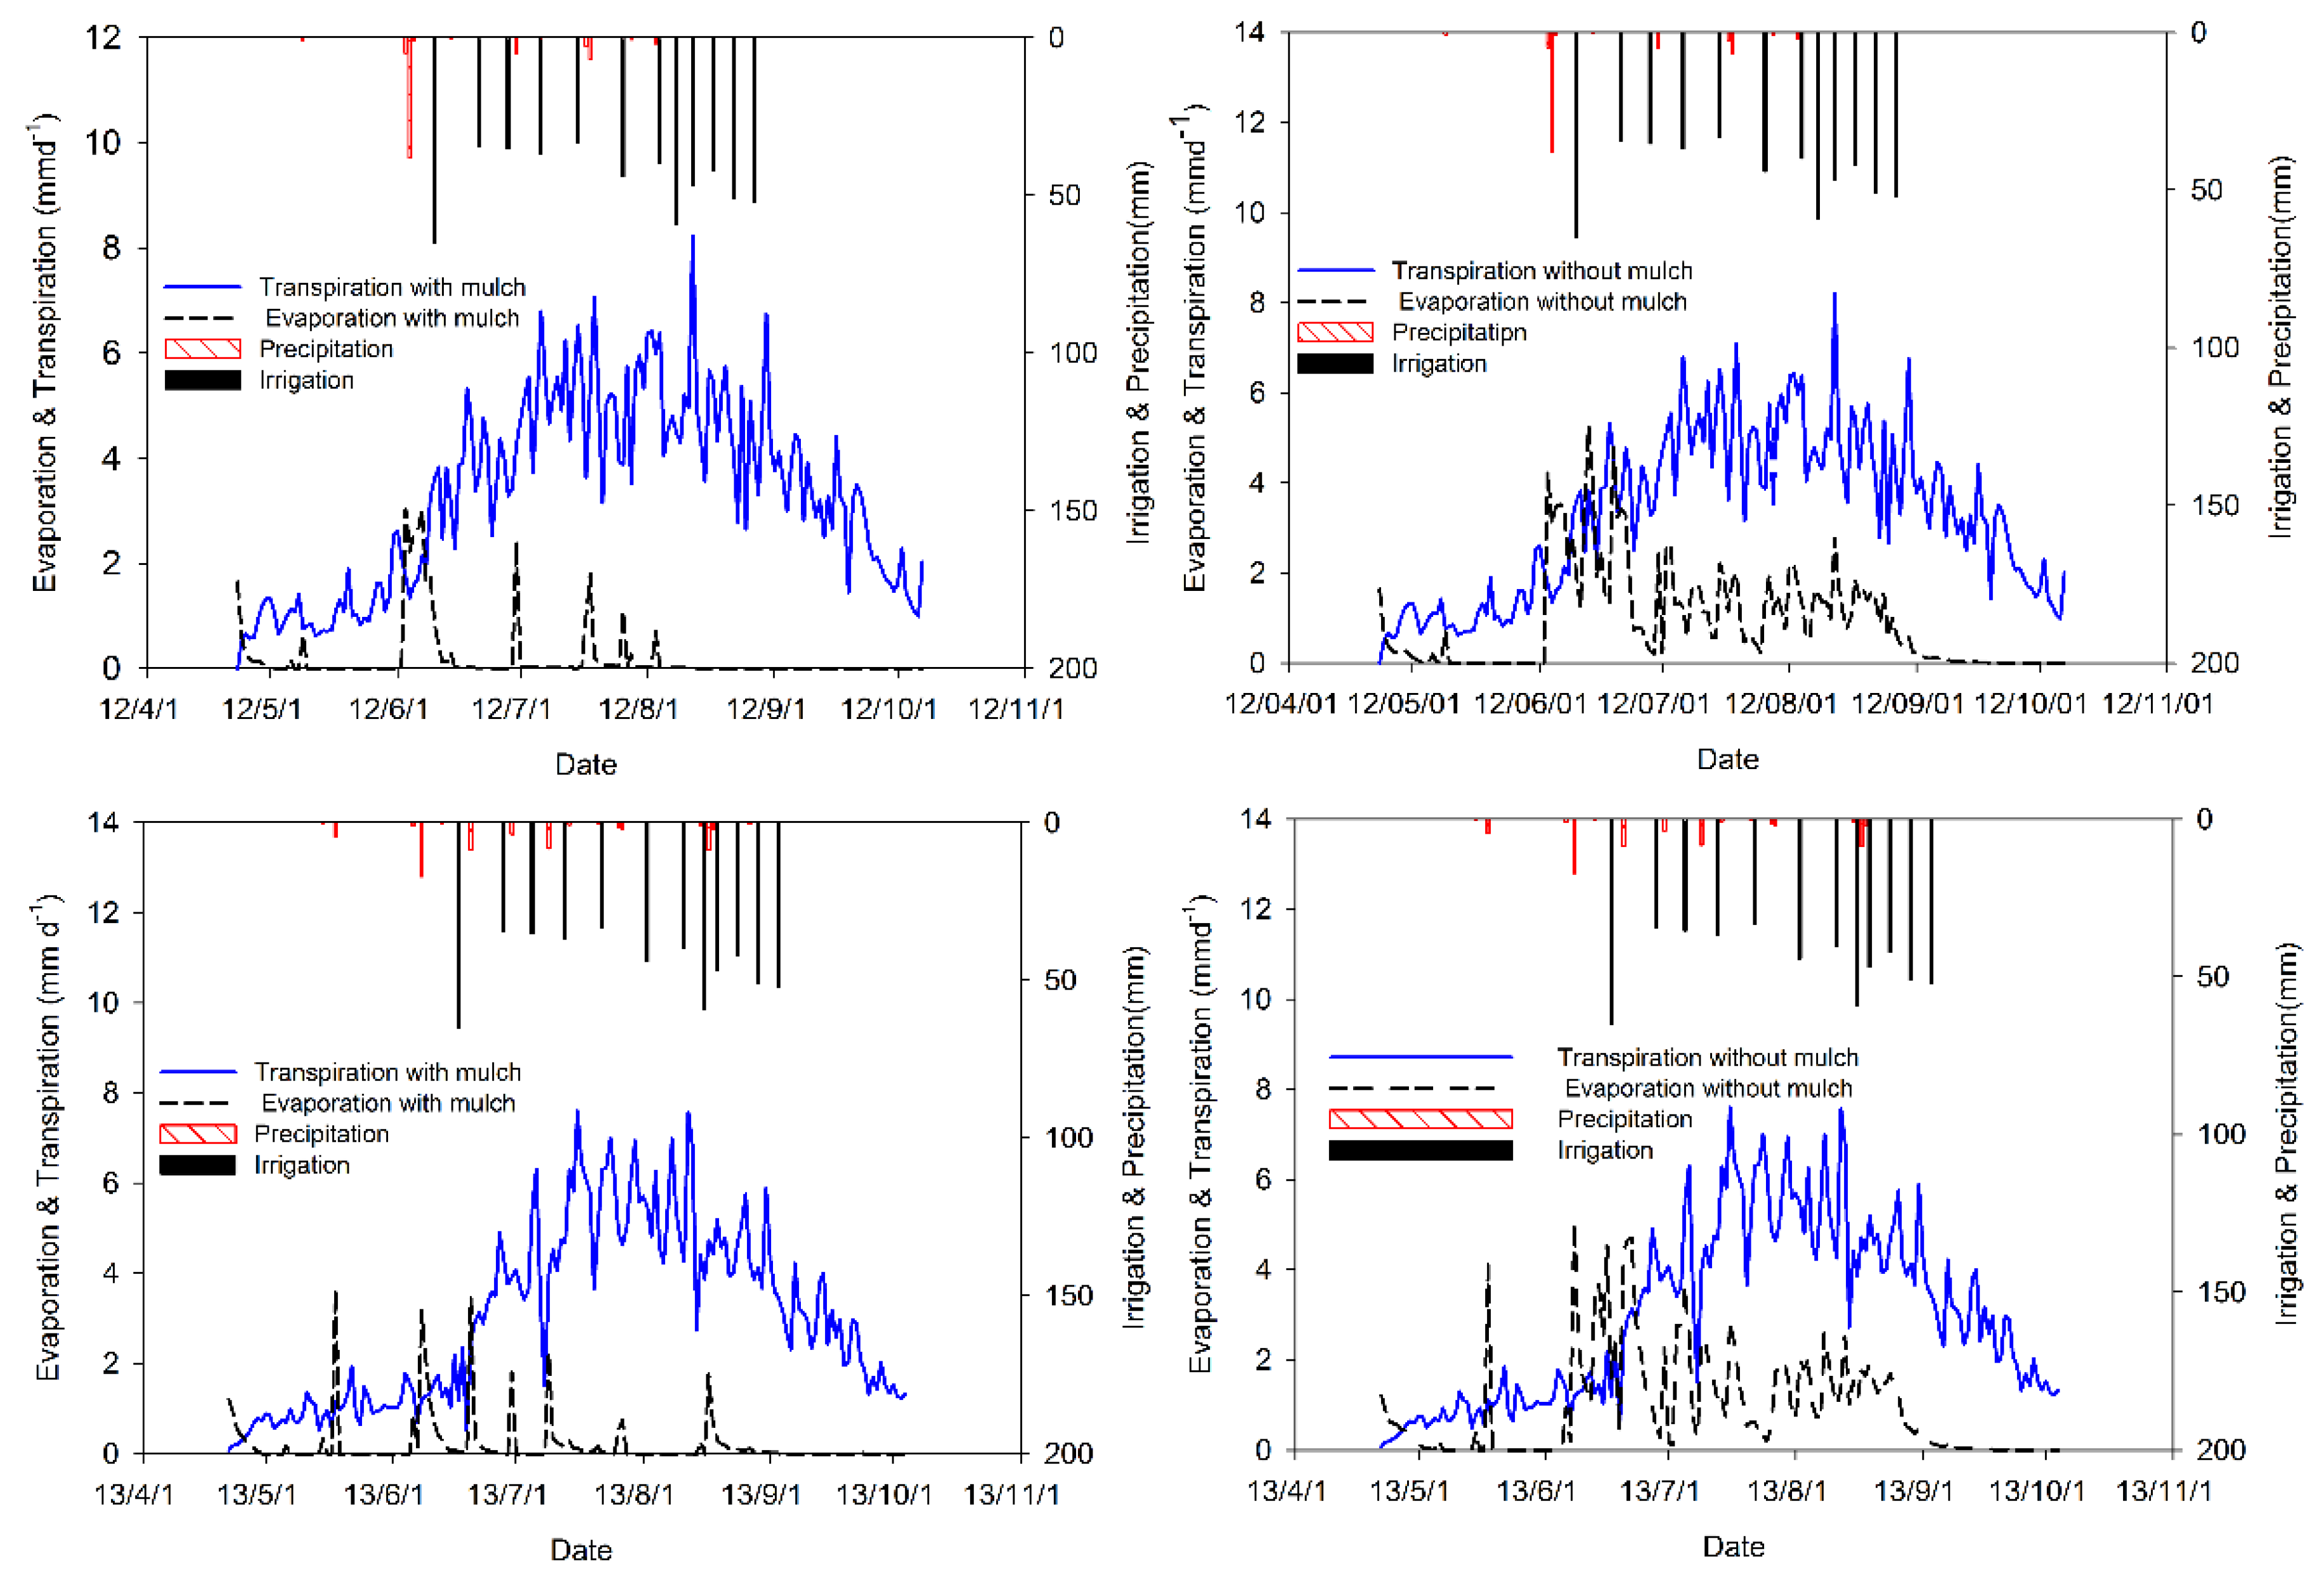
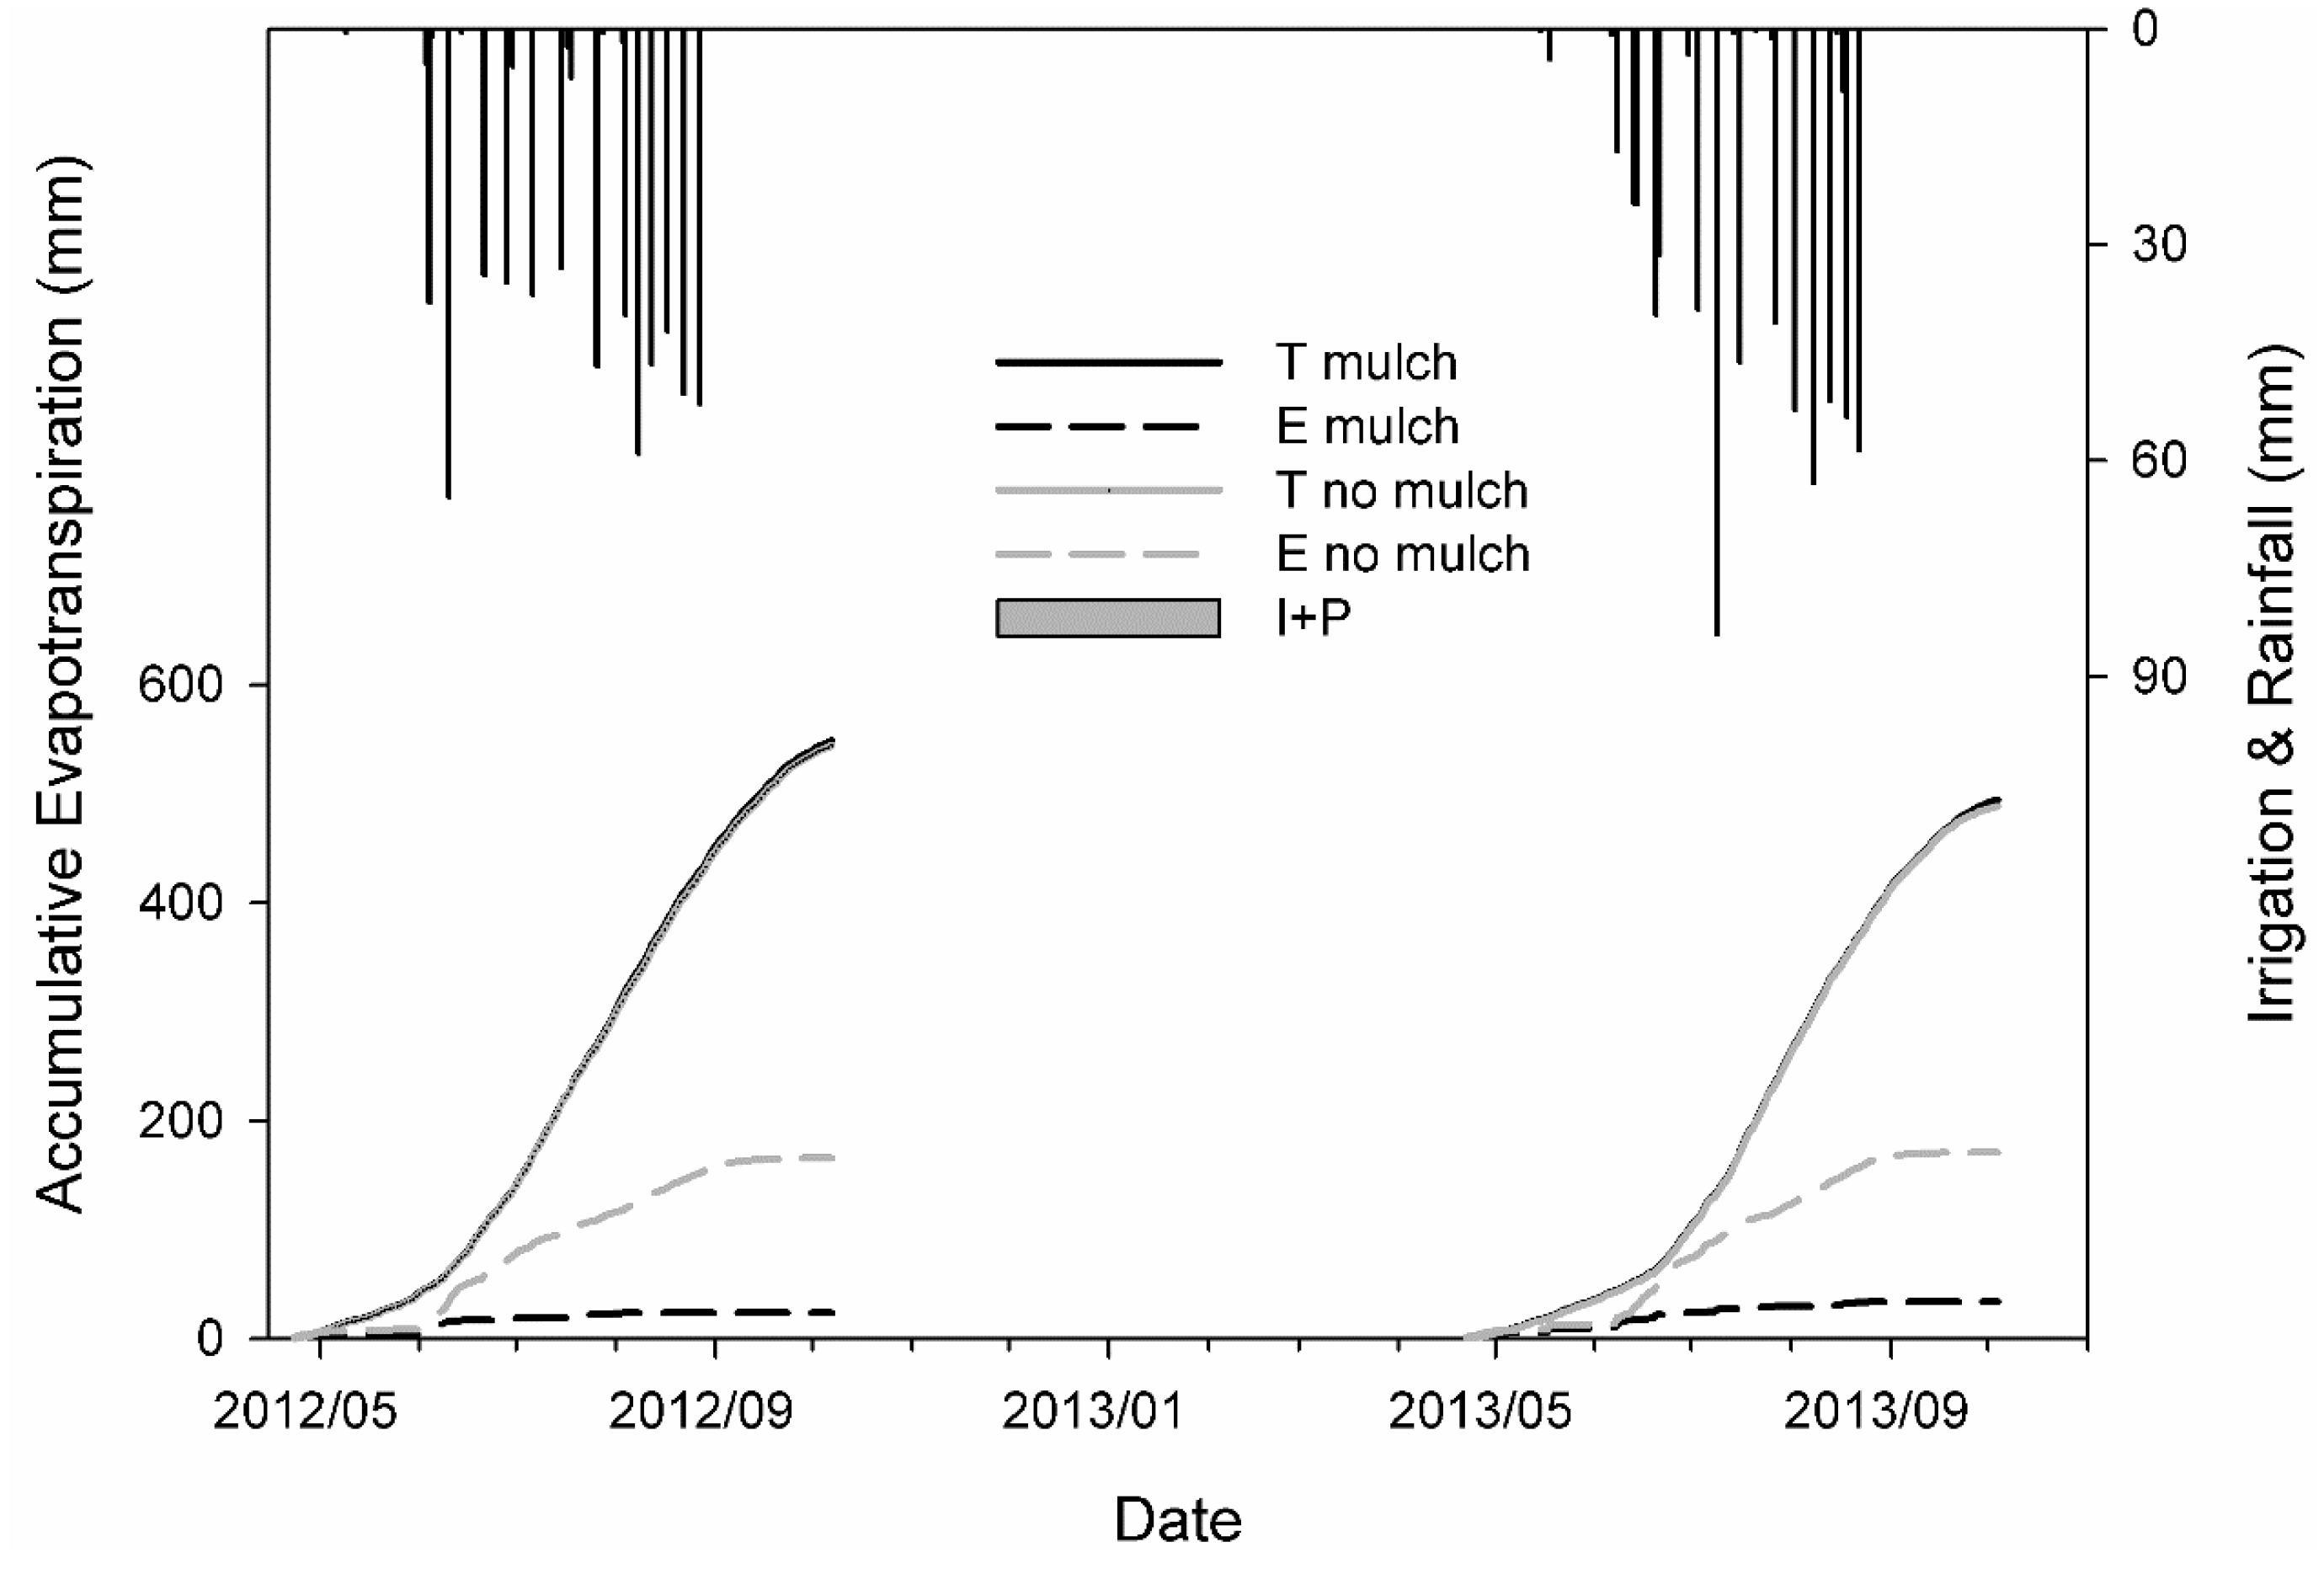
3.3. Partitioning of Evapotranspiration

The E T c  act (mm·day−1) and its components in different growth stages during the two-year experimental period which simulated by the model are shown in Table 6 and Figure 6. In the initial stage, T comprised 80%–90% of the entire E T c  act . In the crop development stage, T accounted for 90% of the entire E T c  act , increasing with crop growth to 100% during the late season. For the full growth season, T under plastic mulch averaged 96% and 94% in 2012 and 2013, respectively. The components of E T c  act , without mulch, are presented in Table 6 according to simulation. The transpiration components of initial stage, crop development stage, mid-season, and late season in the two-year experimental period (2012–2013) are 77%, 61%, 79%, and 94%, respectively. The ratio of E / E T c  act of cotton without mulch was significantly higher than that with mulch, with the highest ratio observed during the crop development stage. The plastic mulch is the main reason for the rapid decrease in soil evaporation. In the initial stage, the soil moisture is low (Figure 7) and the values of E and T were both low. When irrigation started in the crop development stage, T and T both increased, with T increasing more slowly than E because of undeveloped leaves and, therefore, the transpiration component becomes lower in this stage. In the mid-season, the soil was covered by leaves, and the available energy of the soil evaporation decreased, thereby decreasing E / E T c  act . Irrigation usually ends by the end of the mid-season, and the lower soil moisture further decreases the ratio of E / E T c  act .
Sap flow gauges were used to measure individual plant transpiration in our experimental station in 2012, and the obtained ratio T / E T c  act is approximately 87% in June, 82% in August, and nearly 100% in September [38]. Martins et al. [26] indicated that E of E T c  act in sprinkler and drip experiments under mulched soil for maize ranged from approximately 91% to 94%, and Rosa et al. [35] reported that T / E T c  act in furrow-irrigated cotton were 90% and 83% in two different years. These results are similar to those of our study in Xinjiang, and are higher than the other studies in the areas with similar climate, e.g., ~80% in Uzbekistan by Qureshi et al. [52] and 56%–68% by Forkutsa et al. [61] also in Uzbekistan.

3.4. Influence of Plastic Mulch

The influence of plastic mulch cover on E T c  act was simulated by the model, and the results are shown in Table 6 and Figure 6 and Figure 8. The observation E T c  act data, with no mulch, was not obtained in our research. The calibrated and validated parameters with mulch was used to simulate the E T c  act with no mulch. The result is used to analyze the influence of mulch on E T c  act . Plastic mulch has been proven to be able to increase soil temperature and moisture [36], as well as to conserve water [15,26].
T values under plastic mulch cover were 549.2 mm and 495.0 mm in 2012 and 2013, respectively, and 545.2 mm and 493.2 mm without mulch cover, respectively. No significant difference was detected. E values under plastic mulch cover were 23.5 mm and 33.9 mm, in 2012 and 2013, respectively, and 163.1 mm and 170.8 mm without mulch cover, respectively. Thus, E increased by approximately 139.6 mm and 137.0 mm without mulch cover. For the entire growing season, the T components of E T c  act were approximately 96% under plastic mulch and 77% without mulch in 2012; the T components of E T c  act were approximately 94% and 74% in 2013, respectively.
The influence of plastic mulch cover on E is significant during the drip irrigation from the crop development stage to the mid-season stage. These phenomenon can be attributed to the variation of soil moisture and the available energy of the soil surface with the growth of the cotton leaves. Soil moisture is low in the initial stage and E is at a low rate; therefore, no remarkable disparity was detected between mulched and unmulched soil. Under initial irrigation, the soil moisture increases rapidly to promote soil evaporation, which decreases with plastic mulch, compared with unmulched soil. In the mid-season stage, the cotton leaves were enlarged, and the ground was covered by these leaves. The available energy of the soil surface was the key factor affecting soil evaporation instead of soil moisture. The sensitivity of soil evaporation to irrigation with and without mulch decreased, and the evaporation of the mulched soil largely declined to nearly 0 in combination with the impact of the plastic mulch.
The amount of percolation during the drip irrigation was approximately 152.1 mm and 223.6 mm for 2012 and 2013, respectively. The exchange water fluxes between soil and groundwater reservoir at 90 cm were 133.4 and 252.5 mm, respectively, as indicated in the water balance model [38]. These results indicate that simulated percolation is reasonable.

4. Conclusions

ET measurements using the eddy covariance system were conducted in a cotton field for two years, and the dual crop coefficient model SIMDualKc was successfully applied in the study area.
The goodness of fit showed that the predicted and observed values matched quite well. The regression coefficients were 0.95 and 1.08 for the two years, respectively. The T / E T c  act ratio increased with mulched drip irrigation; the ratios were equal to 96% and 94% during the two-year growth seasons, respectively. T occupied approximately 100% in mid-season and maturity stages. The SIMDualKc model can be used to assess ground cover, and the influence of plastic mulch is simulated via two setups; namely, with mulch and without mulch. The simulation results showed that the mulched cover reduced E by approximately 139.6 and 137.0 mm in 2012 and 2013, but barely affected T. The study showed that percolation amounts were approximately 152.08 and 223.62 mm in 2012 and 2013, respectively.
According to our results, the SIMDualKc model can be used to support irrigation schedules for cotton under mulched drip irrigation in Northwest China and other areas with similar climate and irrigation methods. The model can also be a useful tool to evaluate the influence of water saving methods and plastic mulches. Moreover, the validated parameters and basal crop coefficient in this study can be helpful and valuable for the further applications in arid land of Central Asia.

Acknowledgments

This research was support by the National Science Foundation of China (NSFC 51190092, 51222901) and the Foundation of the State Key Laboratory of Hydroscience and Engineering of Tsinghua University (2014-KY-01, 2016-KY-03). We gratefully appreciate their support. We acknowledge the staff at Tsinghua Universtiy-Korla Oasis Eco-hydrology Experimental Research Station for their kindly help and assistant.

Author Contributions

Fuqiang Tian performed the analyses, summarized the results, and outlined the manuscript. Pengju Yang conducted the field experiment, prepared and ran the SIMDualKc model, and prepared and revised the manuscript. Hongchang Hu designed the study, calibrated SIMDualKc model simulations and preprocessed the input data, and drafted the introduction section of the manuscript. Chao Dai conducted the field experiment.

Conflicts of Interest

The authors declare no conflict of interest.

References

  1. Li, S.; Kang, S.; Li, F.; Zhang, L. Evapotranspiration and crop coefficient of spring maize with plastic mulch using eddy covariance in northwest China. Agric. Water Manag. 2008, 95, 1214–1222. [Google Scholar] [CrossRef]
  2. Burt, C.M.; Mutziger, A.J.; Allen, R.G.; Howell, T.A. Evaporation research: Review and interpretation. J. Irrig. Drain. 2005, 131, 37–58. [Google Scholar] [CrossRef]
  3. Hu, X.; Chen, H.; Wang, J.; Meng, X.; Chen, F. Effects of Soil Water Content on Cotton Root Growth and Distribution under Mulched Drip Irrigation. Agric. Sci. China 2009, 8, 709–716. [Google Scholar] [CrossRef]
  4. Kool, D.; Agam, N.; Lazarovitch, N.; Heitman, J.L.; Sauer, T.J.; Ben-Gal, A. A review of approaches for evapotranspiration partitioning. Agric. For. Meteorol. 2014, 184, 56–70. [Google Scholar] [CrossRef]
  5. Benli, B.; Kodal, S.; Ilbeyi, A.; Ustun, H. Determination of evapotranspiration and basal crop coefficient of alfalfa with a weighing lysimeter. Agric. Water Manag. 2006, 81, 358–370. [Google Scholar] [CrossRef]
  6. López-Urrea, R.; de Santa-Olalla, F.M.; Montoro, A.; López-Fuster, P. Single and dual crop coefficients and water requirements for onion (Allium cepa L.) under semiarid conditions. Agric. Water Manag. 2009, 96, 1031–1036. [Google Scholar] [CrossRef]
  7. Wilson, K.B.; Hanson, P.J.; Mulholland, P.J.; Baldocchi, D.D.; Wullschleger, S.D. A comparison of methods for determining forest evapotranspiration and its components: Sap-flow, soil water budget, eddy covariance and catchment water balance. Agric. For. Meteorol. 2011, 106, 153–168. [Google Scholar] [CrossRef]
  8. Poblete-Echeverría, C.; Ortega-Farias, S.; Zuñiga, M. Estimation of Dual Crop Coefficients over a Drip-Irrigated Merlot Vineyard Using Sap Flow Sensors and Eddy Covariance System. ISHS Acta Hortic. VIII Int. Symp. Sap Flow 2011, 951, 269–275. [Google Scholar] [CrossRef]
  9. Zhang, Y.; Shen, Y.; Sun, H.; Gates, J.B. Evapotranspiration and its partitioning in an irrigated winter wheat field: A combined isotopic and micrometeorologic approach. J. Hydrol. 2011, 408, 203–211. [Google Scholar] [CrossRef]
  10. Yepez, E.A.; Williams, D.G.; Scott, R.L.; Lin, G. Partitioning overstory and understory evapotranspiration in a semiarid savanna woodland from the isotopic composition of water vapor. Agric. For. Meteorol. 2003, 119, 53–68. [Google Scholar] [CrossRef]
  11. Zhang, F.; Zhou, G.; Wang, Y.; Yang, F.; Nilsson, C. Evapotranspiration and crop coefficient for a temperate desert steppe ecosystem using eddy covariance in Inner Mongolia, China. Hydrol. Process. 2012, 26, 379–386. [Google Scholar] [CrossRef]
  12. Allen, R.G.; Pereira, L.S.; Raes, D.; Smith, M. Crop Evapotranspiration-Guidelines for Computing Crop Water Requirements—FAO Irrigation and Drainage Paper 56; Food and Agriculture Organization of the United Nations: Rome, Italy, 1998. [Google Scholar]
  13. Monteith, J.L.; Unsworth, M.H. Principles of Environmental Physics; Academic Press: New York, NY, USA, 2008. [Google Scholar]
  14. Utset, A.; Farre, I.; Martinez-Cob, A.; Cavero, J. Comparing Penman–Monteith and Priestley–Taylor approaches as reference-evapotranspiration inputs for modeling maize water-use under Mediterranean conditions. Agric. Water Manag. 2004, 66, 205–219. [Google Scholar] [CrossRef]
  15. Amayreh, J.; Al-Abed, N. Developing crop coefficients for field-grown tomato (Lycopersicon esculentum Mill.) under drip irrigation with black plastic mulch. Agric. Water Manag. 2005, 73, 247–254. [Google Scholar] [CrossRef]
  16. Bezerra, B.G.; da Silva, B.B.; Bezerra, J.R.C.; Sofiatti, V.; dos Santos, C.A.C. Evapotranspiration and crop coefficient for sprinkler-irrigated cotton crop in Apodi Plateau semiarid lands of Brazil. Agric. Water Manag. 2012, 107, 86–93. [Google Scholar] [CrossRef]
  17. Han, S.; Xu, D.; Wang, S.; Yang, Z. Water requirement with irrigation expansion in Jingtai Irrigation District, Northwest China: The need to consider irrigation-induced local changes in evapotranspiration demand. J. Irrig. Drain. Eng. 2014, 140. [Google Scholar] [CrossRef]
  18. Allen, R.G. Using the FAO-56 dual crop coefficient method over an irrigated region as part of an evapotranspiration intercomparison study. J. Hydrol. 2000, 229, 27–41. [Google Scholar] [CrossRef]
  19. Cancela, J.J.; Fandiño, M.; Rey, B.J.; Martínez, E.M. Automatic irrigation system based on dual crop coefficient, soil and plant water status for Vitis vinifera (cv Godello and cv Mencía). Agric. Water Manag. 2015, 151, 52–63. [Google Scholar] [CrossRef]
  20. Ding, R.; Kang, S.; Zhang, Y.; Hao, X.; Tong, L.; Du, T. Partitioning evapotranspiration into soil evaporation and transpiration using a modified dual crop coefficient model in irrigated maize field with ground-mulching. Agric. Water Manag. 2013, 127, 85–96. [Google Scholar] [CrossRef]
  21. Paço, T.A.; Pôças, I.; Cunha, M.; Silvestre, J.C.; Santos, F.L.; Paredes, P.; Pereira, L.S. Evapotranspiration and crop coefficients for a super intensive olive orchard. An application of SIMDualKc and METRIC models using ground and satellite observations. J. Hydrol. 2014, 519, 2067–2080. [Google Scholar] [CrossRef]
  22. Zhang, B.; Liu, Y.; Xu, D.; Zhao, N.; Lei, B.; Rosa, R.D.; Paredes, P.; Paço, T.A.; Pereira, L.S. The dual crop coefficient approach to estimate and partitioning evapotranspiration of the winter wheat-summer maize crop sequence in North China Plain. Irrig. Sci. 2013, 31, 1303–1316. [Google Scholar] [CrossRef]
  23. Zhao, N.; Liu, Y.; Cai, J.; Paredes, P.; Rosa, R.D.; Pereira, L.S. Dual crop coefficient modelling applied to the winter wheat-summer maize crop sequence in North China Plain: Basal crop coefficients and soil evaporation component. Agric. Water Manag. 2013, 117, 93–105. [Google Scholar] [CrossRef]
  24. Rosa, R.D.; Paredes, P.; Rodrigues, G.C.; Alves, I.; Fernando, R.M.; Pereira, L.S.; Allen, R.G. Implementing the dual crop coefficient approach in interactive software. 1. Background and computational strategy. Agric. Water Manag. 2012, 103, 8–24. [Google Scholar] [CrossRef]
  25. Fandiño, M.; Olmedo, J.L.; Martínez, E.M.; Valladares, J.; Paredes, P.; Rey, B.J.; Mota, M.; Cancela, J.J.; Pereira, L.S. Assessing and modelling water use and the partition of evapotranspiration of irrigated hop (Humulus lupulus), and relations of transpiration with hops yield and alpha-acids. Ind. Crop. Prod. 2015, 77, 204–217. [Google Scholar] [CrossRef]
  26. Martins, J.D.; Rodrigues, G.C.; Paredes, P.; Carlesso, R.; Oliveira, Z.B.; Knies, A.E.; Petry, M.T.; Pereira, L.S. Dual crop coefficients for maize in southern Brazil: Model testing for sprinkler and drip irrigation and mulched soil. Biosyst. Eng. 2013, 115, 291–310. [Google Scholar] [CrossRef]
  27. Nash, J.; Sutcliffe, J.V. River flow forecasting through conceptual models part I—A discussion of principles. J. Hydrol. 1970, 10, 282–290. [Google Scholar] [CrossRef]
  28. Paço, T.A.; Ferreira, M.I.; Rosa, R.D.; Paredes, P.; Rodrigues, G.C.; Conceição, N.; Pacheco, C.A.; Pereira, L.S. The dual crop coefficient approach using a density factor to simulate the evapotranspiration of a peach orchard: SIMDualKc model versus eddy covariance measurements. Irrig. Sci. 2012, 30, 115–126. [Google Scholar] [CrossRef]
  29. Pereira, L.S.; Paredes, P.; Rodrigues, G.C.; Neves, M. Modeling malt barley water use and evapotranspiration partitioning in two contrasting rainfall years. Assessing AquaCrop and SIMDualKc models. Agric. Water Manag. 2015, 159, 239–254. [Google Scholar] [CrossRef]
  30. Wu, Y.; Liu, T.; Paredes, P.; Duan, L.; Wang, H.; Wang, T.; Pereira, L.S. Ecohydrology of groundwater-dependent grasslands of the semi-arid Horqin sandy land of inner Mongolia focusing on evapotranspiration partition. Ecohydrology 2015. [Google Scholar] [CrossRef]
  31. Wei, Z.; Paredes, P.; Liu, Y.; Chi, W.W.; Pereira, L.S. Modelling transpiration, soil evaporation and yield prediction of soybean in North China Plain. Agric. Water Manag. 2015, 147, 43–53. [Google Scholar] [CrossRef]
  32. Allen, R.G.; Pereira, L.S. Estimating crop coefficients from fraction of ground cover and height. Irrig. Sci. 2009, 28, 17–34. [Google Scholar] [CrossRef]
  33. Fandiño, M.; Cancela, J.J.; Rey, B.J.; Martínez, E.M.; Rosa, R.G.; Pereira, L.S. Using the dual-K c approach to model evapotranspiration of Albarino vineyards (Vitisvinifera L. cv. Albarino) with consideration of active ground cover. Agric. Water Manag. 2012, 112, 75–87. [Google Scholar] [CrossRef]
  34. Liu, Y.; Pereira, L.S.; Fernando, R.M. Fluxes through the bottom boundary of the root zone in silty soils: Parametric approaches to estimate groundwater contribution and percolation. Agric. Water Manag. 2006, 84, 27–40. [Google Scholar] [CrossRef]
  35. Rosa, R.D.; Paredes, P.; Rodrigues, G.C.; Fernando, R.M.; Alves, I.; Pereira, L.S.; Allen, R.G. Implementing the dual crop coefficient approach in interactive software: 2. Model testing. Agric. Water Manag. 2012, 103, 62–77. [Google Scholar] [CrossRef]
  36. Yaghi, T.; Arslan, A.; Naoum, F. Cucumber (Cucumis sativus, L.) water use efficiency (WUE) under plastic mulch and drip irrigation. Agric. Water Manag. 2013, 128, 149–157. [Google Scholar] [CrossRef]
  37. Yu, G.-R.; Wen, X.-F.; Sun, X.-M.; Tanner, B.D.; Lee, X.; Chen, J.-Y. Overview of ChinaFLUX and evaluation of its eddy covariance measurement. Agric. For. Meteorol. 2006, 137, 125–137. [Google Scholar] [CrossRef]
  38. Zhang, Z.; Tian, F.; Hu, H.; Yang, P. A comparison of methods for determining field evapotranspiration: Photosynthesis system, sap flow, and eddy covariance. Hydrol. Earth Syst. Sci. 2014, 18, 1053–1072. [Google Scholar] [CrossRef]
  39. Er-Raki, S.; Chehbouni, A.; Boulet, G.; Williams, D.G. Using the dual approach of FAO-56 for partitioning ET into soil and plant components for olive orchards in a semi-arid region. Agric. Water Manag. 2010, 97, 1769–1778. [Google Scholar] [CrossRef] [Green Version]
  40. Facchi, A.; Gharsallah, O.; Corbari, C.; Masseroni, D.; Mancini, M.; Gandolfi, C. Determination of maize crop coefficients in humid climate regime using the eddy covariance technique. Agric. Water Manag. 2013, 130, 131–141. [Google Scholar] [CrossRef]
  41. Baffes, J. Cotton: Market Setting, Trade Policies, and Issues; World Bank: Washington, DC, USA, 2004. [Google Scholar]
  42. China National Cotton Information Center (CNCIC). China Cotton Almanac 2012/2013; China Financial & Economic Publishing House: Beijing, China, 2014. [Google Scholar]
  43. Han, S.; Hu, H.; Yang, D.; Liu, Q. Irrigation impact on annual water balance of the oases in Tarim Basin, Northwest China. Hydrol. Process. 2011, 25, 167–174. [Google Scholar] [CrossRef]
  44. Hu, H.; Tian, F.; Hu, H. Soil particle size distribution and its relationship with soil water and salt under mulched drip irrigation in Xinjiang of China. China Technol. Sci. 2011, 54, 1568–1574. [Google Scholar] [CrossRef]
  45. Shen, Y.; Li, S.; Chen, Y.; Qi, Y.; Zhang, S. Estimation of regional irrigation water requirement and water supply risk in the arid region of Northwestern China 1989–2010. Agric. Water Manag. 2013, 128, 55–64. [Google Scholar] [CrossRef]
  46. Chen, M.; Kang, Y.; Wan, S.; Liu, S. Drip irrigation with saline water for oleic sunflower (Helianthus annuus L.). Agric. Water Manag. 2009, 96, 1766–1772. [Google Scholar] [CrossRef]
  47. Chen, W.; Hou, Z.; Wu, L.; Liang, Y.; Wei, C. Evaluating salinity distribution in soil irrigated with saline water in arid regions of northwest China. Agric. Water Manag. 2010, 97, 2001–2008. [Google Scholar] [CrossRef]
  48. Wang, R.; Kang, Y.; Wan, S.; Hu, W.; Liu, S.; Liu, S. Salt distribution and the growth of cotton under different drip irrigation regimes in a saline area. Agric. Water Manag. 2011, 100, 58–69. [Google Scholar] [CrossRef]
  49. Shukla, S.; Shrestha, N.K.; Jaber, F.H.; Srivastava, S.; Obreza, T.A.; Boman, B.J. Evapotranspiration and crop coefficient for watermelon grown under plastic mulched conditions in sub-tropical Florida. Agric. Water Manag. 2014, 132, 1–9. [Google Scholar] [CrossRef]
  50. Zhang, Z.; Hu, H.; Tian, F.; Hu, H.; Yao, X.; Zhong, R. Soil salt distribution under mulched drip irrigation in an arid area of northwestern China. J. Arid Environ. 2014, 104, 23–33. [Google Scholar] [CrossRef]
  51. Forkutsa, I.; Sommer, R.; Shirokova, Y.I.; Lamers, J.P.A.; Kienzler, K.; Tischbein, B.; Martius, C.; Vlek, P.L.G. Modeling irrigated cotton with shallow groundwater in the Aral Sea Basin of Uzbekistan: II. Soil salinity dynamics. Irrig. Sci. 2009, 27, 319–330. [Google Scholar] [CrossRef]
  52. Qureshi, A.S.; Eshmuratov, D.; Bezborodov, G. Determining optimal groundwater table depth for maximizing cotton production in the Sardarya province of Uzbekistan. Irrig. Drain. 2011, 60, 241–252. [Google Scholar] [CrossRef]
  53. Shrestha, N.K.; Shukla, S. Basal crop coefficients for vine and erect crops with plastic mulch in a sub-tropical region. Agric. Water Manag. 2014, 143, 29–37. [Google Scholar] [CrossRef]
  54. Zhang, Z.; Hu, H.; Tian, F.; Yao, X.; Sivapalan, M. Groundwater Dynamics under Water Saving Irrigation and Implications for Sustainable Water Management in an Oasis: Tarim River Basin of Western China. Hydrol. Earth Syst. Sci. 2014, 18, 3951–3967. [Google Scholar] [CrossRef]
  55. Van Dijk, A.; Moene, A.F.; De Bruin, H. The Principles of Surface Flux Physics: Theory, Practice and Description of the ECPACK Library; University of Wageningen: Wageningen, The Netherlands, 2004. [Google Scholar]
  56. Zhou, S.; Wang, J.; Liu, J.; Yang, J.; Xu, Y.; Li, J. Evapotranspiration of a drip-irrigated, film-mulched cotton field in northern Xinjiang, China. Hydrol. Process. 2012, 26, 1169–1178. [Google Scholar] [CrossRef]
  57. Allen, R.G.; Pereira, L.S.; Smith, M.; Raes, D.; Wright, J.L. FAO-56 dual crop coefficient method for estimating evaporation from soil and application extensions. J. Irrig. Drain. 2005, 131, 2–13. [Google Scholar] [CrossRef]
  58. Doorenbos, J.; Pruitt, W.O. Crop Water Requirements. Irrigation and Drainage Paper No. 24; Food and Agriculture Organization of the United Nations: Rome, Italy, 1977. [Google Scholar]
  59. Popova, Z.; Pereira, L.S. Modelling for maize irrigation scheduling using long term experimental data from Plovdiv region, Bulgaria. Agric. Water Manag. 2011, 98, 675–683. [Google Scholar] [CrossRef]
  60. Howell, T.A.; Evett, S.R.; Tolk, J.A.; Schneider, A.D. Evapotranspiration of full-, deficit-irrigated, and dryland cotton on the Northern Texas High Plains. J. Irrig. Drain. Eng. 2004, 130, 277–285. [Google Scholar] [CrossRef]
  61. Farahani, H.J.; Izzi, G.; Oweis, T.Y. Parameterization and Evaluation of the AquaCrop Model for Full and Deficit Irrigated Cotton. Agron. J. 2009, 101, 469–476. [Google Scholar] [CrossRef]
Figure 1. The location and eddy covariance system of the study area: (a) the location of the study areas; (b) the observing tower in the field; (c,d) the cotton under mulched drip irrigation and one-film, one-pipe, four-row mode.
Water 08 00072 g001
Figure 2. Evapotranspiration and energy flux measured by eddy covariance.
Water 08 00072 g002
Figure 3. LAI and water table depth during the growing season for two years.
Water 08 00072 g003
Figure 4. The comparison between observed (EC) and simulated ETc act: (a,b) the results of 2012 (calibration); and (c,d) the results of 2013 (validation).
Water 08 00072 g004
Figure 5. Seasonal variation of Kcb, Kcb act, Ke, irrigation, and precipitation for cotton: (a) in calibration period (2012); and (b) validation period (2013).
Water 08 00072 g005
Figure 6. Daily variation of evaporation and transpiration for cotton in 2012–2013 (with and without mulch).
Water 08 00072 g006
Figure 7. Daily variation of soil moisture under irrigation for cotton in 2012–2013.
Water 08 00072 g007
Figure 8. Evaporation and transpiration by the SIMDualKc during growing season for two years.
Water 08 00072 g008
Table 1. Irrigation schedules adopted for experiments in 2012 and 2013.
Growth StageSquaring StageFlowering StageBolls Stage
2012Irrigation date6–10 & 6–14 *6–216–287–67–157–268–48–88–128–178–228–27
Volume (mm)65.234.435.336.833.344.140.059.346.742.250.852.2
2013Irrigation date6–136–206–287–37–97–167–278–28–88–138–188–22
Volume (mm)48.532.330.739.276.046.539.053.163.251.852.158.8
Note: * The total irrigation on 10 and 14 June 2012 was about 65.2 mm.
Table 2. Cotton growth stages of 2012 and 2013.
Cotton Growth StagesPhenological Growth Stages20122013
Planting/initiationEmergence & Squaring stage23 April–23 May22 April–5 June
Rapid growthSquaring & Flower stage24 May–6 July6 June–14 July
MidseasonFlower & Boll stage7 July–2 September15 July–28 August
MaturityBoll stage3 September–7 October29 August–4 October
Table 3. Main crop parameters of the growth stage.
YearPhysiological ParameterPlantingStart Crop DevelopmentStart Mid-SeasonStart Late-SeasonHarvest
2012Root depth (m)00.40.700.700.70
Crop height (m)00.200.760.760.76
Fraction of ground cover00.20.500.950.85
2013Root depth (m)00.40.620.620.65
Crop height (m)00.40.620.620.67
Fraction of ground cover00.200.500.950.85
Table 4. The initial and calibrated values of the crop and soil parameters of the growth stage.
ParameterInitial Values [12,34]Calibrated
Crop coefficients
Kcb ini0.150.20
Kcb mid1.150.90
Kcb end0.500.50
Depletion fraction
pini0.650.70
pmid0.650.60
pend0.650.60
Soil evaporation
REW (mm)88
TEW (mm)2033
Ze (cm)1015
Deep percolation
ap 408390
bp −0.0173−0.0173
Capillary rise
a1320.8320.8
a2303.2303.2
a3−0.15−0.15
a47.557.55
b1−0.16−0.16
b2−0.54−0.54
b32.12.1
b4−2.03−2.03
Table 5. Indicators of goodness of fit relative to the model tests of the crop evapotranspiration for the cotton under mulched drip irrigation.
Yearb *r2RMSENSERSRAREPBIASAAE
(mm·day−1)(%)(%)(mm·day−1)
2012 (calibration)0.950.870.680.890.3821.815.00.50
2013 (validation)1.030.870.720.840.4018.115.40.50
Note: * The b is the slope of regression line.
Table 6. ETc act and their components for different growth stages.
Growth StagesObservation2012Observation2013
Plastic MulchNo MulchPlastic MulchNo Mulch
ET *ETTET/ETETTET/ETETETTET/ETETTET/ET
Initial0.91.00.90.188.31.10.90.278.41.31.10.90.281.81.20.90.376.1
Crop development3.53.53.20.390.34.93.21.864.34.03.63.10.587.05.33.12.258.4
Mid-season5.05.15.00.198.36.24.91.280.05.25.45.30.197.56.85.31.578.2
Late season2.52.72.70.0100.02.82.60.293.42.42.72.60.099.62.72.50.294.2
Full crop season3.33.43.30.195.94.23.31.077.03.23.23.00.293.64.03.01.074.1
Notes: * The units of the value are below: ET: Evapotranspiration (mm·day−1); T: Transpiration (mm·day−1); E: Evaporation (mm·day−1); T/ET: Fraction of transpiration to evapotranspiration (%).

