
Changes in Stream Flow and Their Relationships with Climatic Variations and Anthropogenic Activities in the Poyang Lake Basin, China


Abstract
:
1. Introduction
2. Data and Method
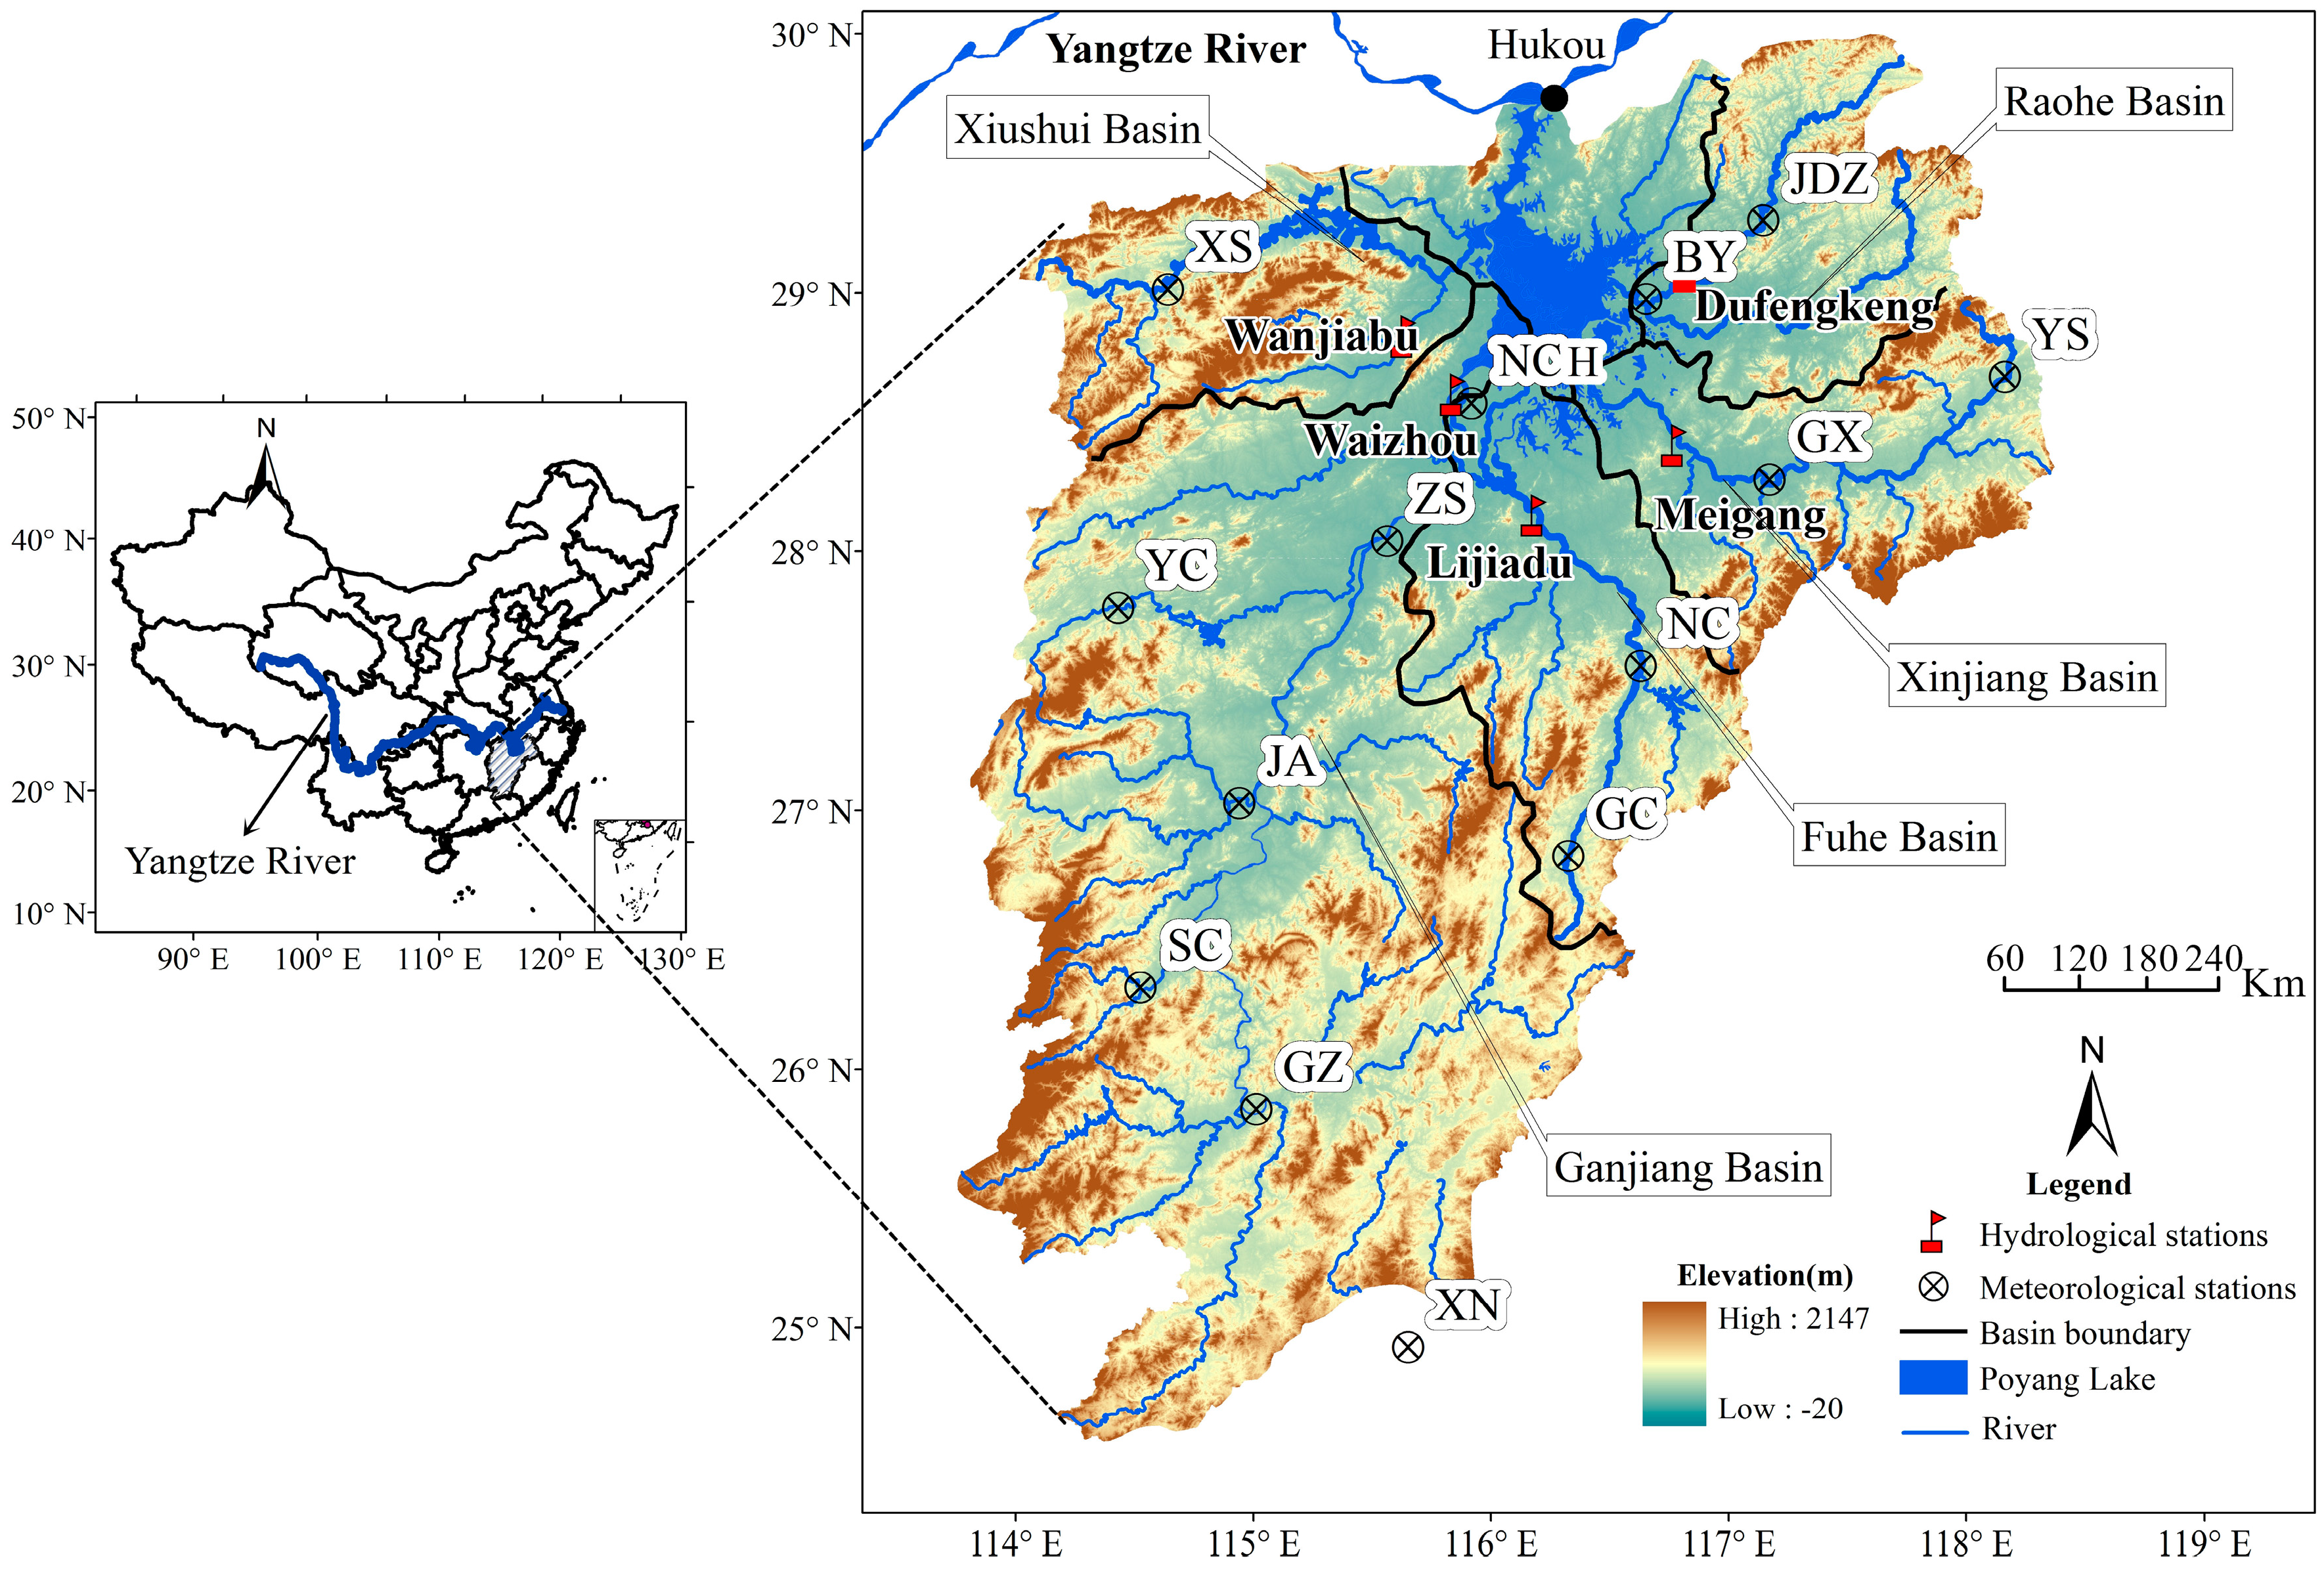
2.1. Study Area
2.2. Hydrological and Meteorological Data
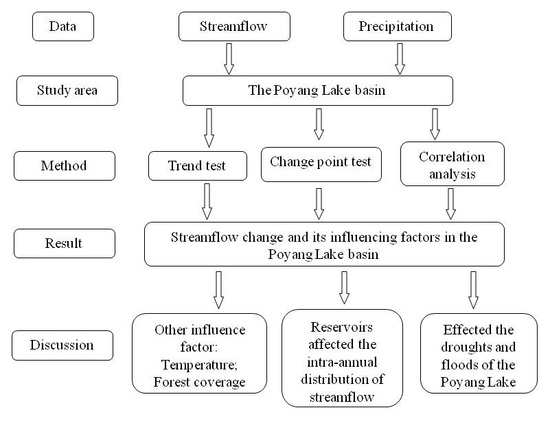
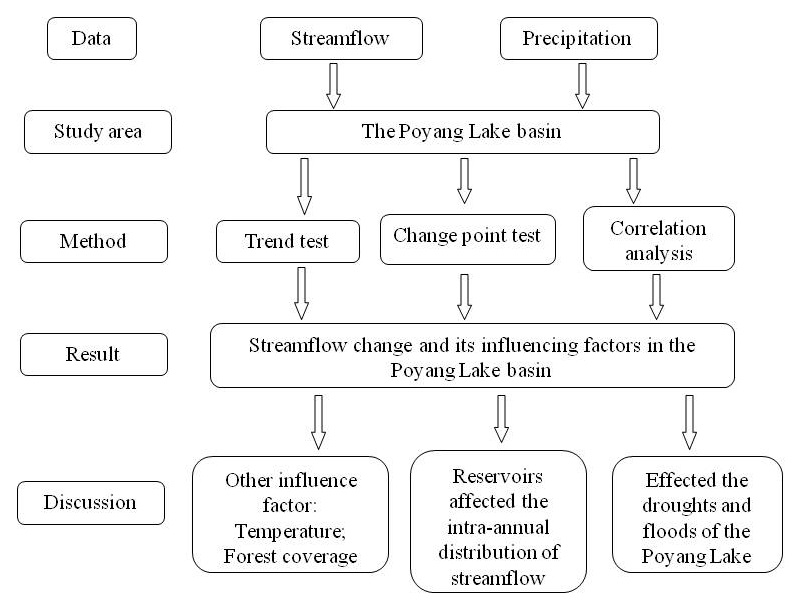
2.3. Method
2.3.1. Concentration Index
2.3.2. Mann–Kendall Test
2.3.3. Pettitt Change Point Test
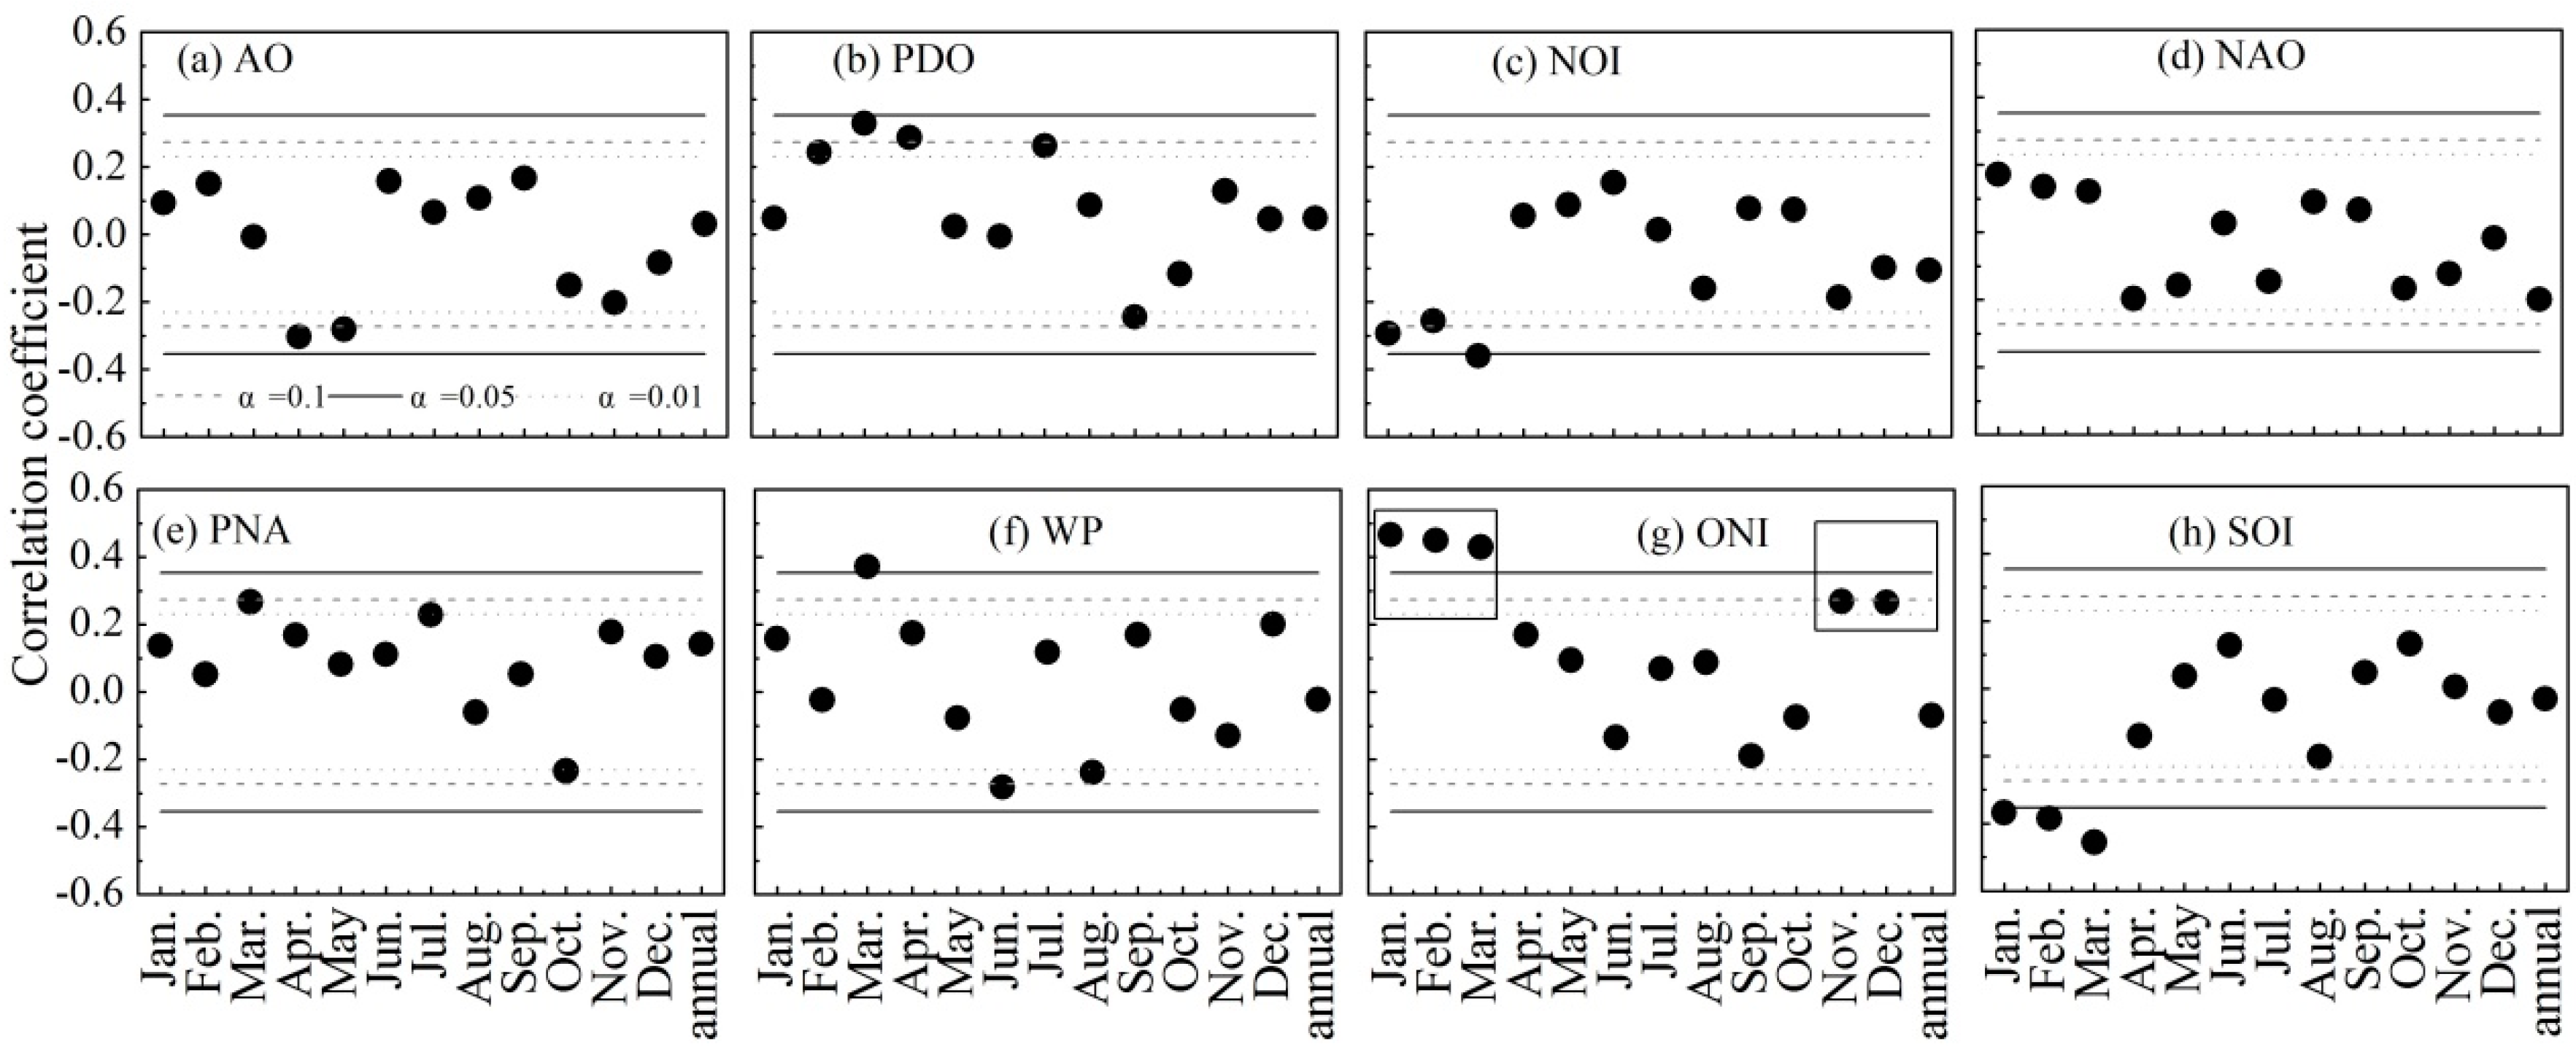
2.3.4. Atmospheric Circulation Index
3. Results
3.1. Change Detections for Stream Flow Time Series
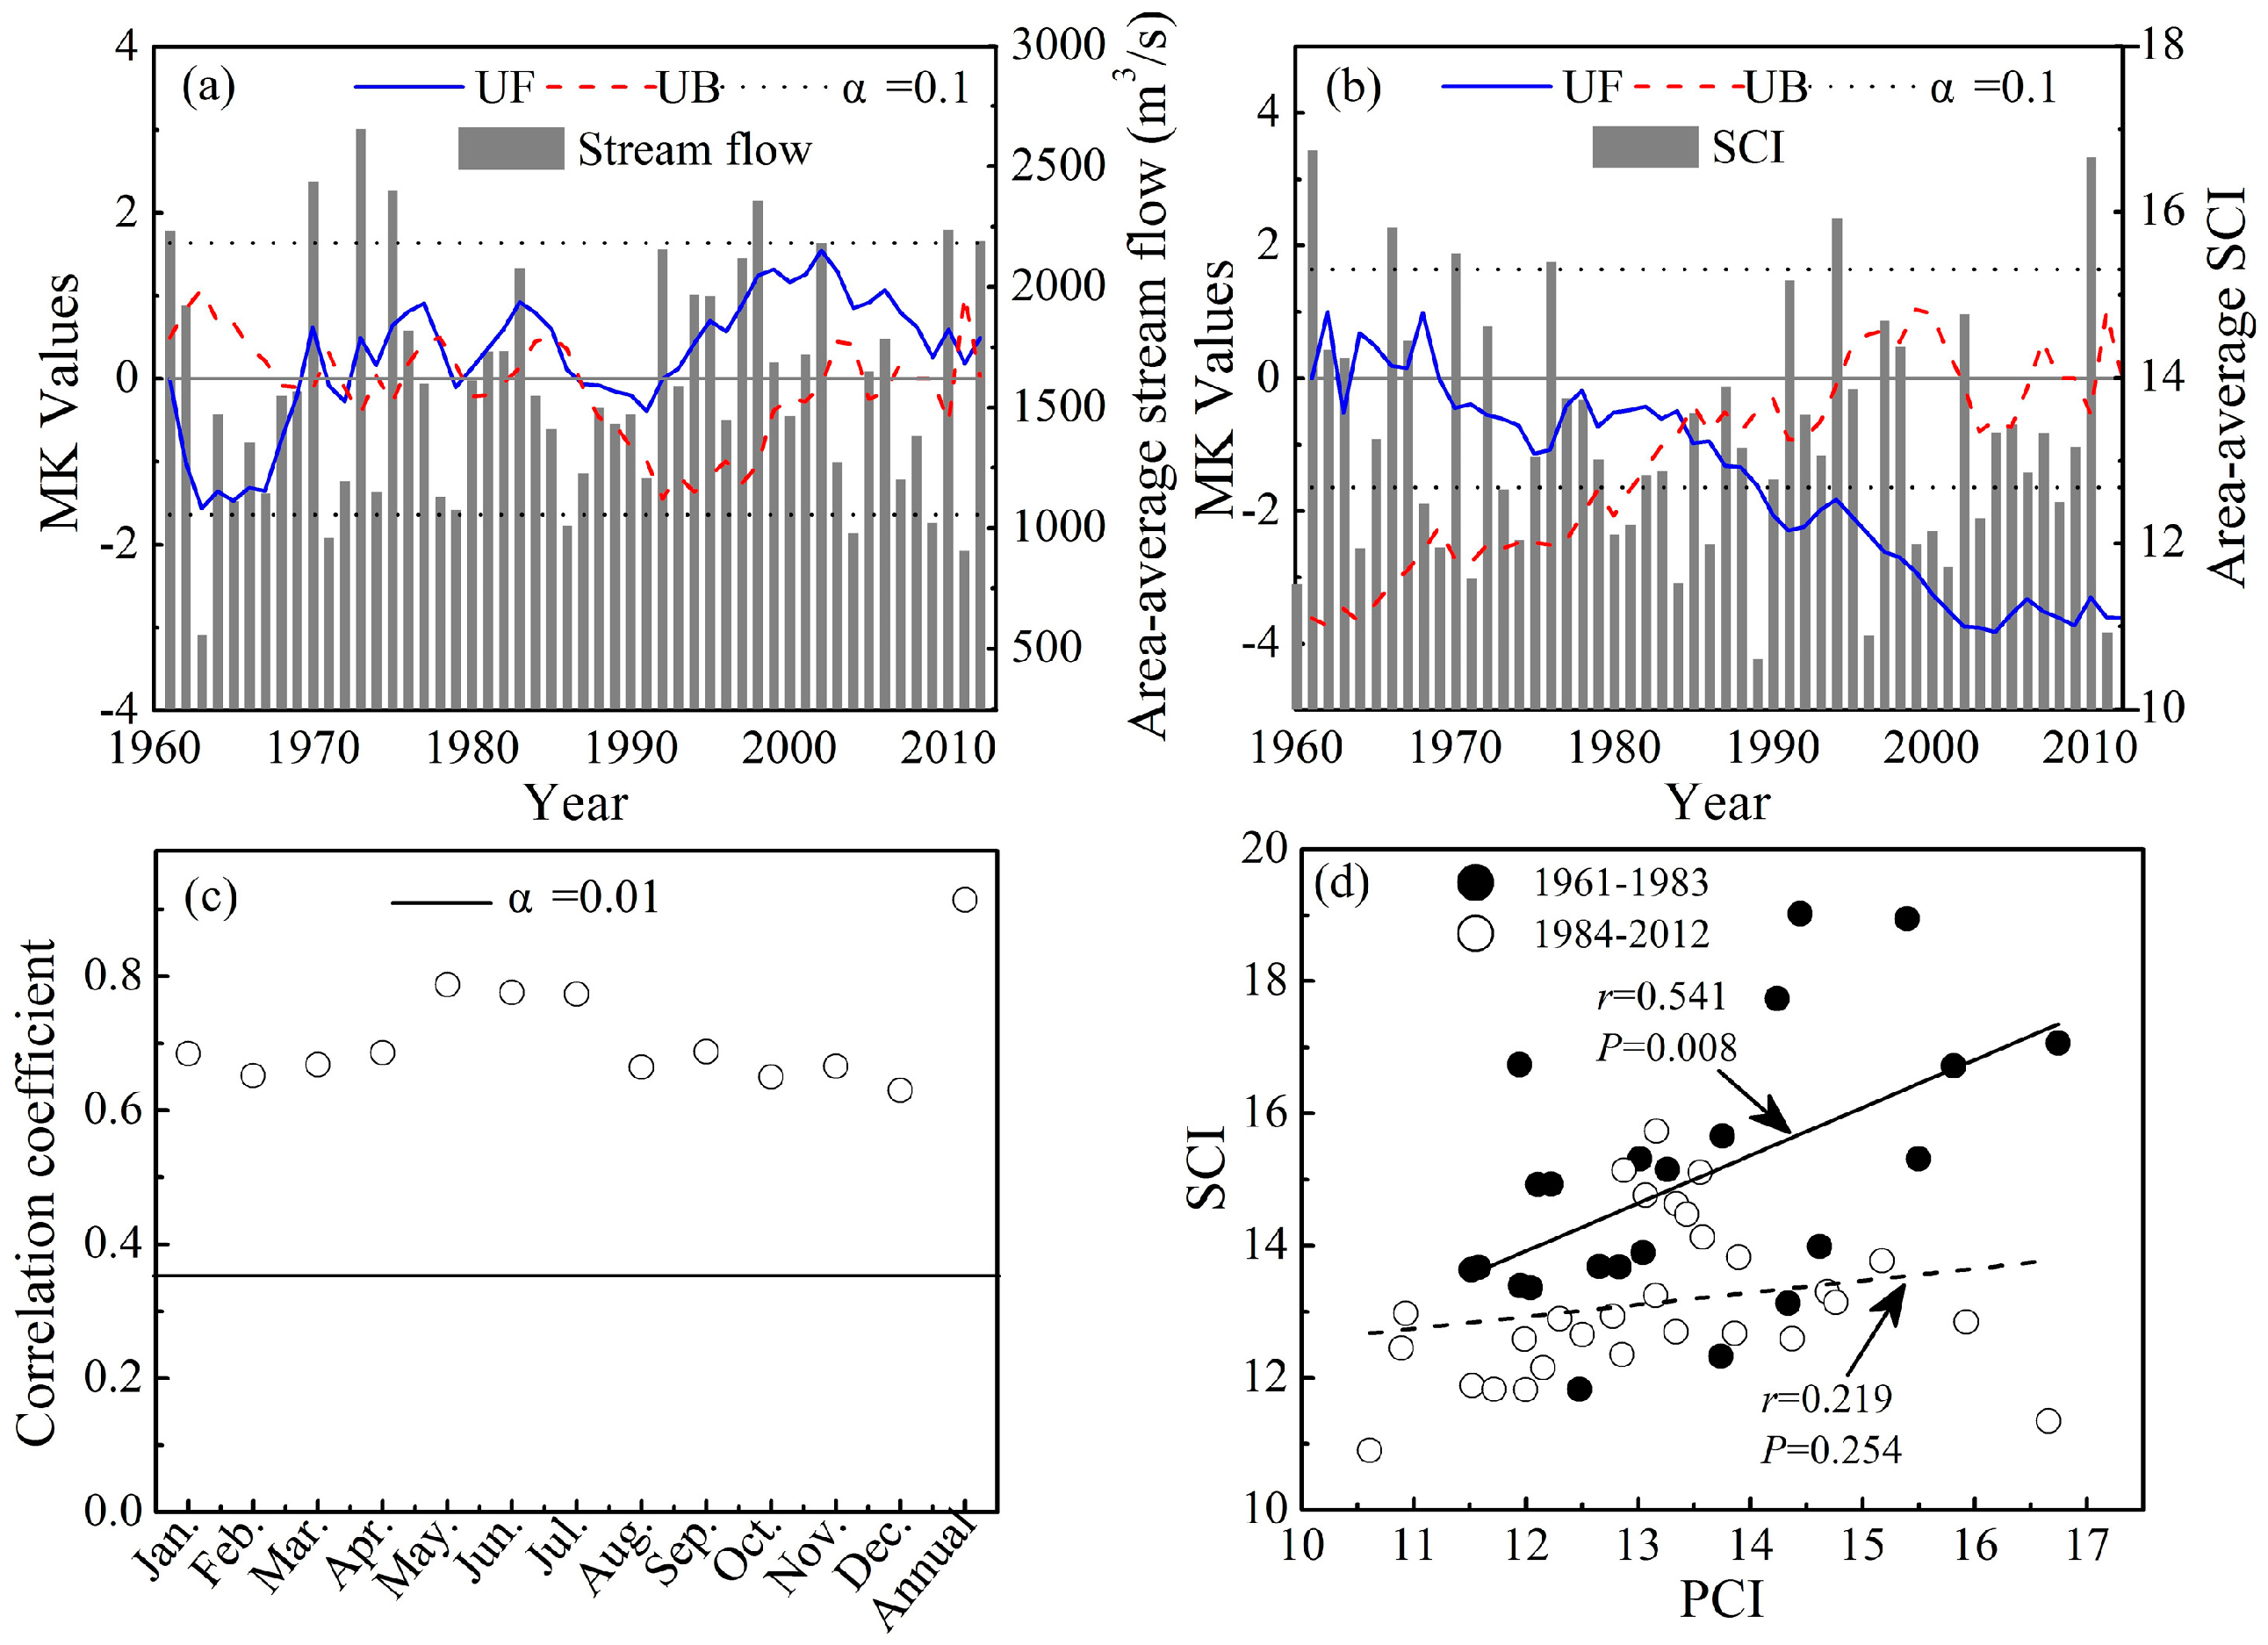
3.1.1. Inter-Annual Variabilities of Stream Flow
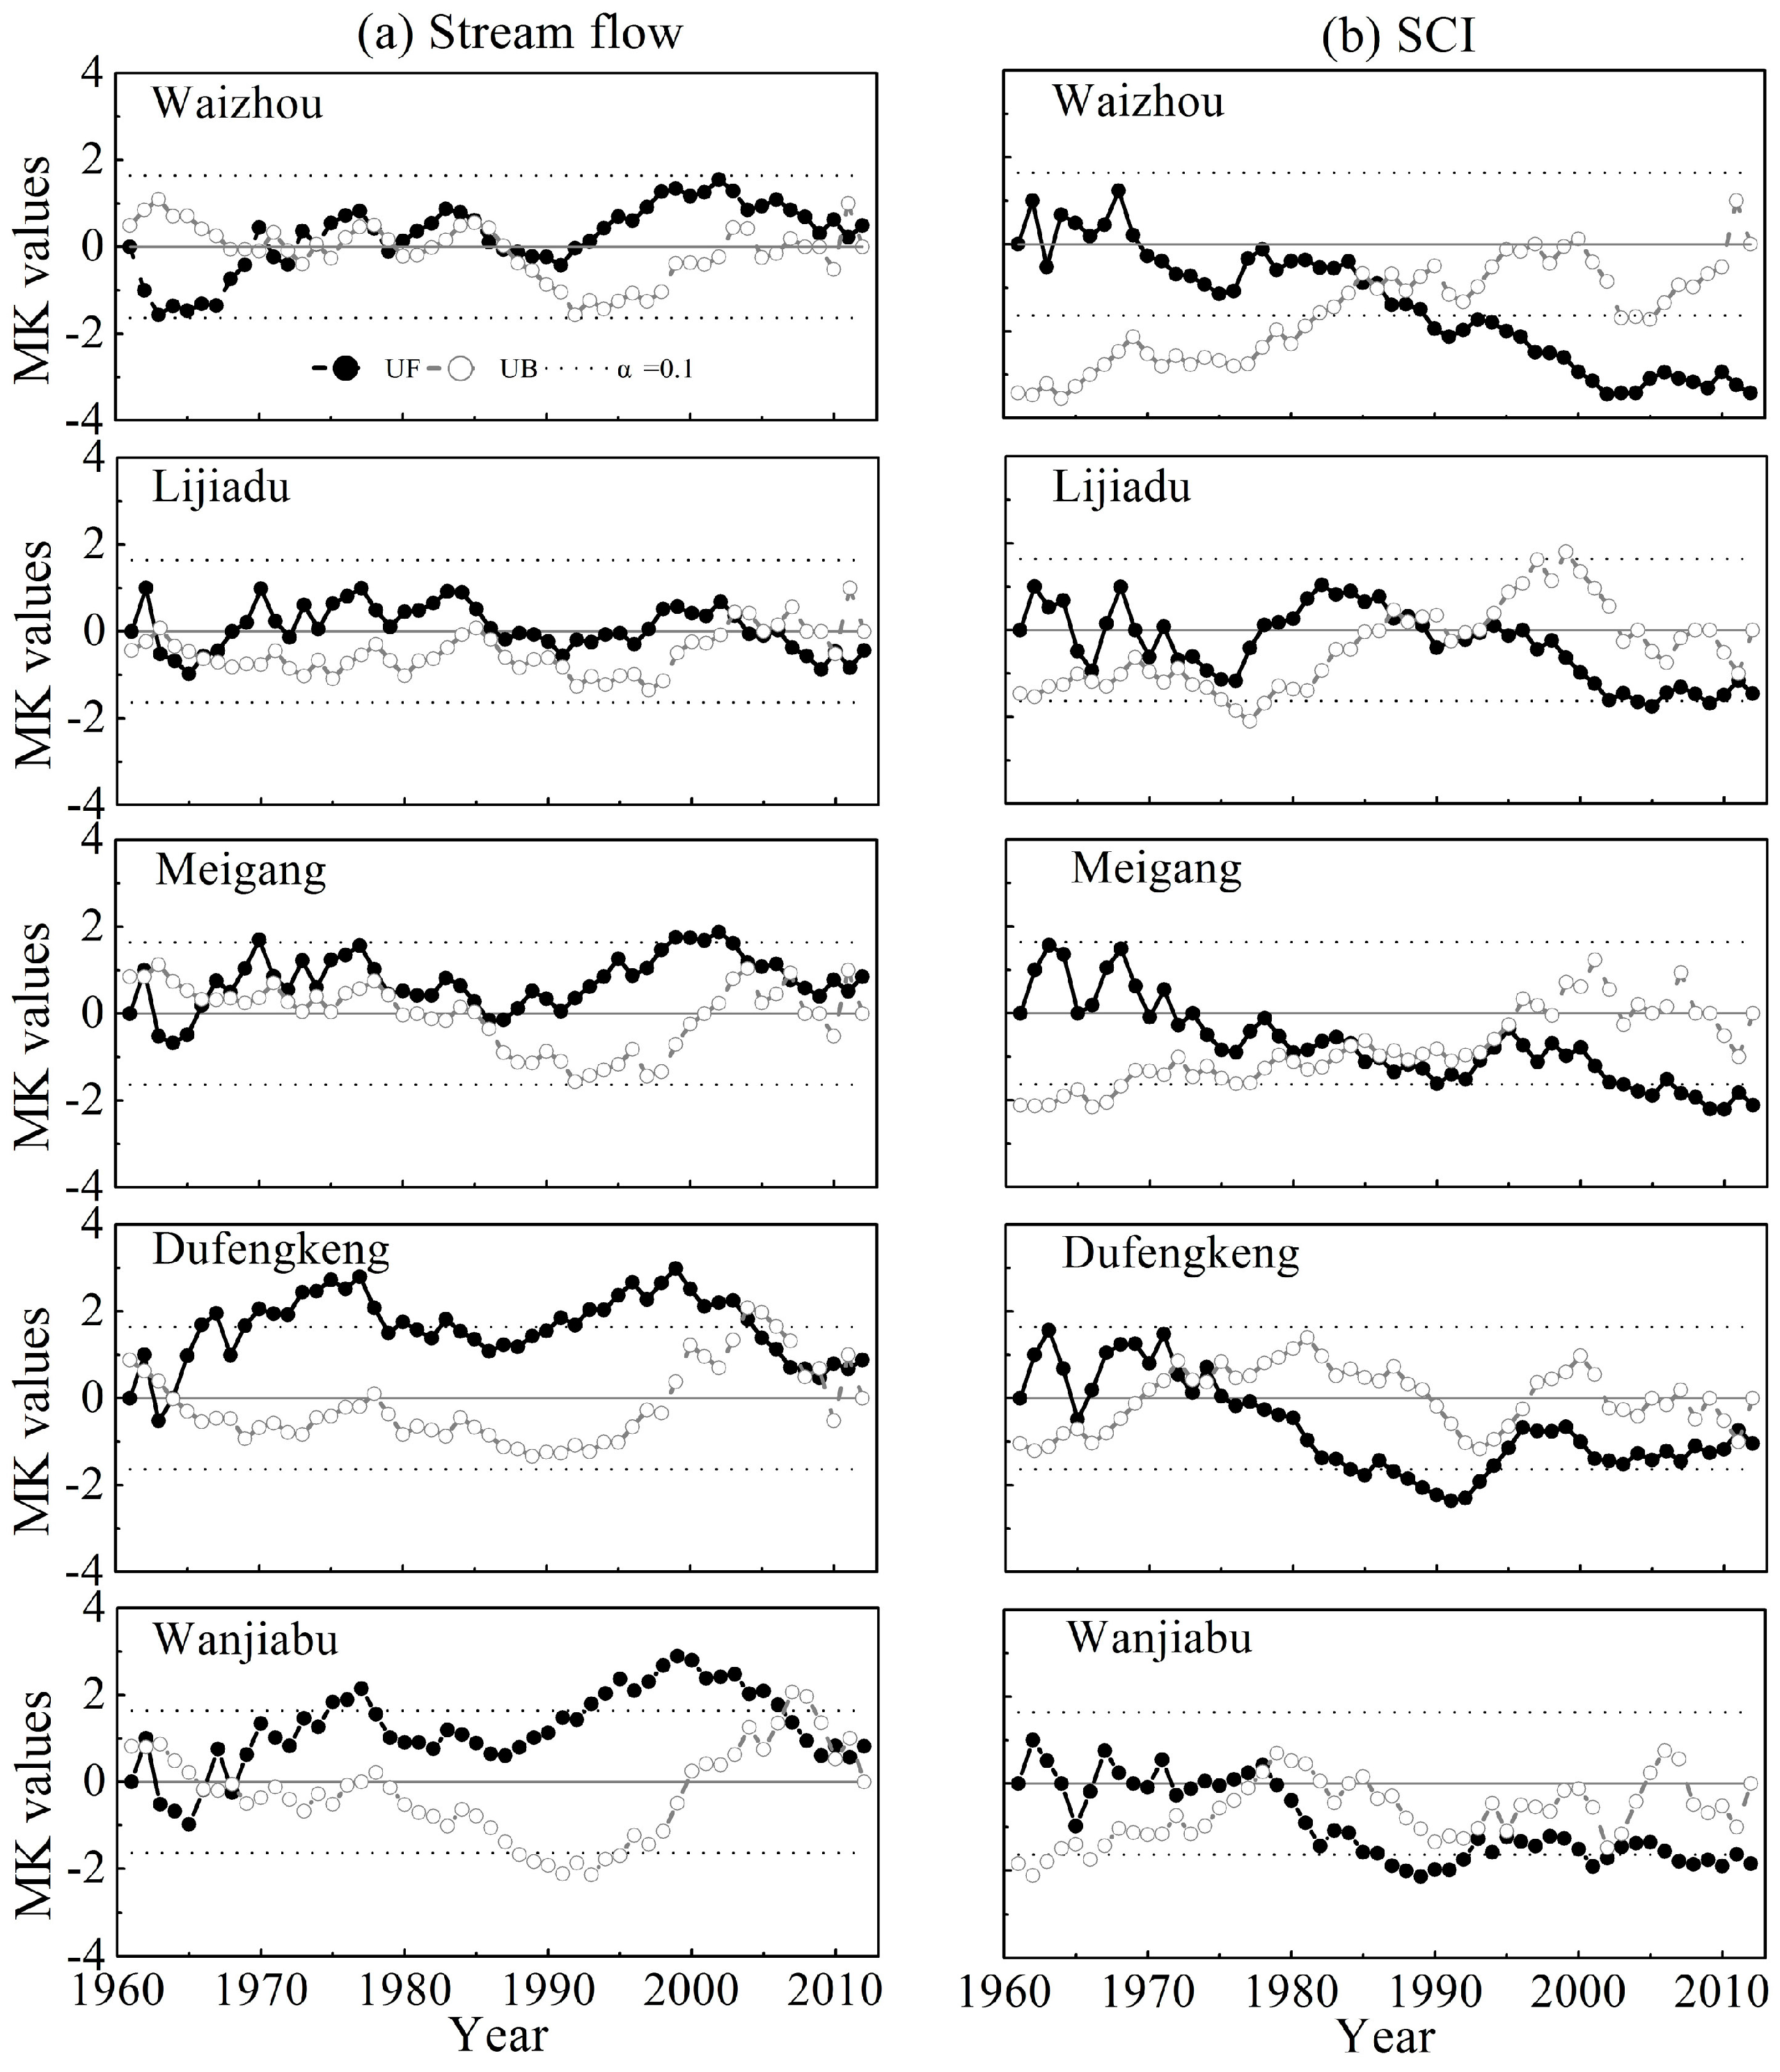
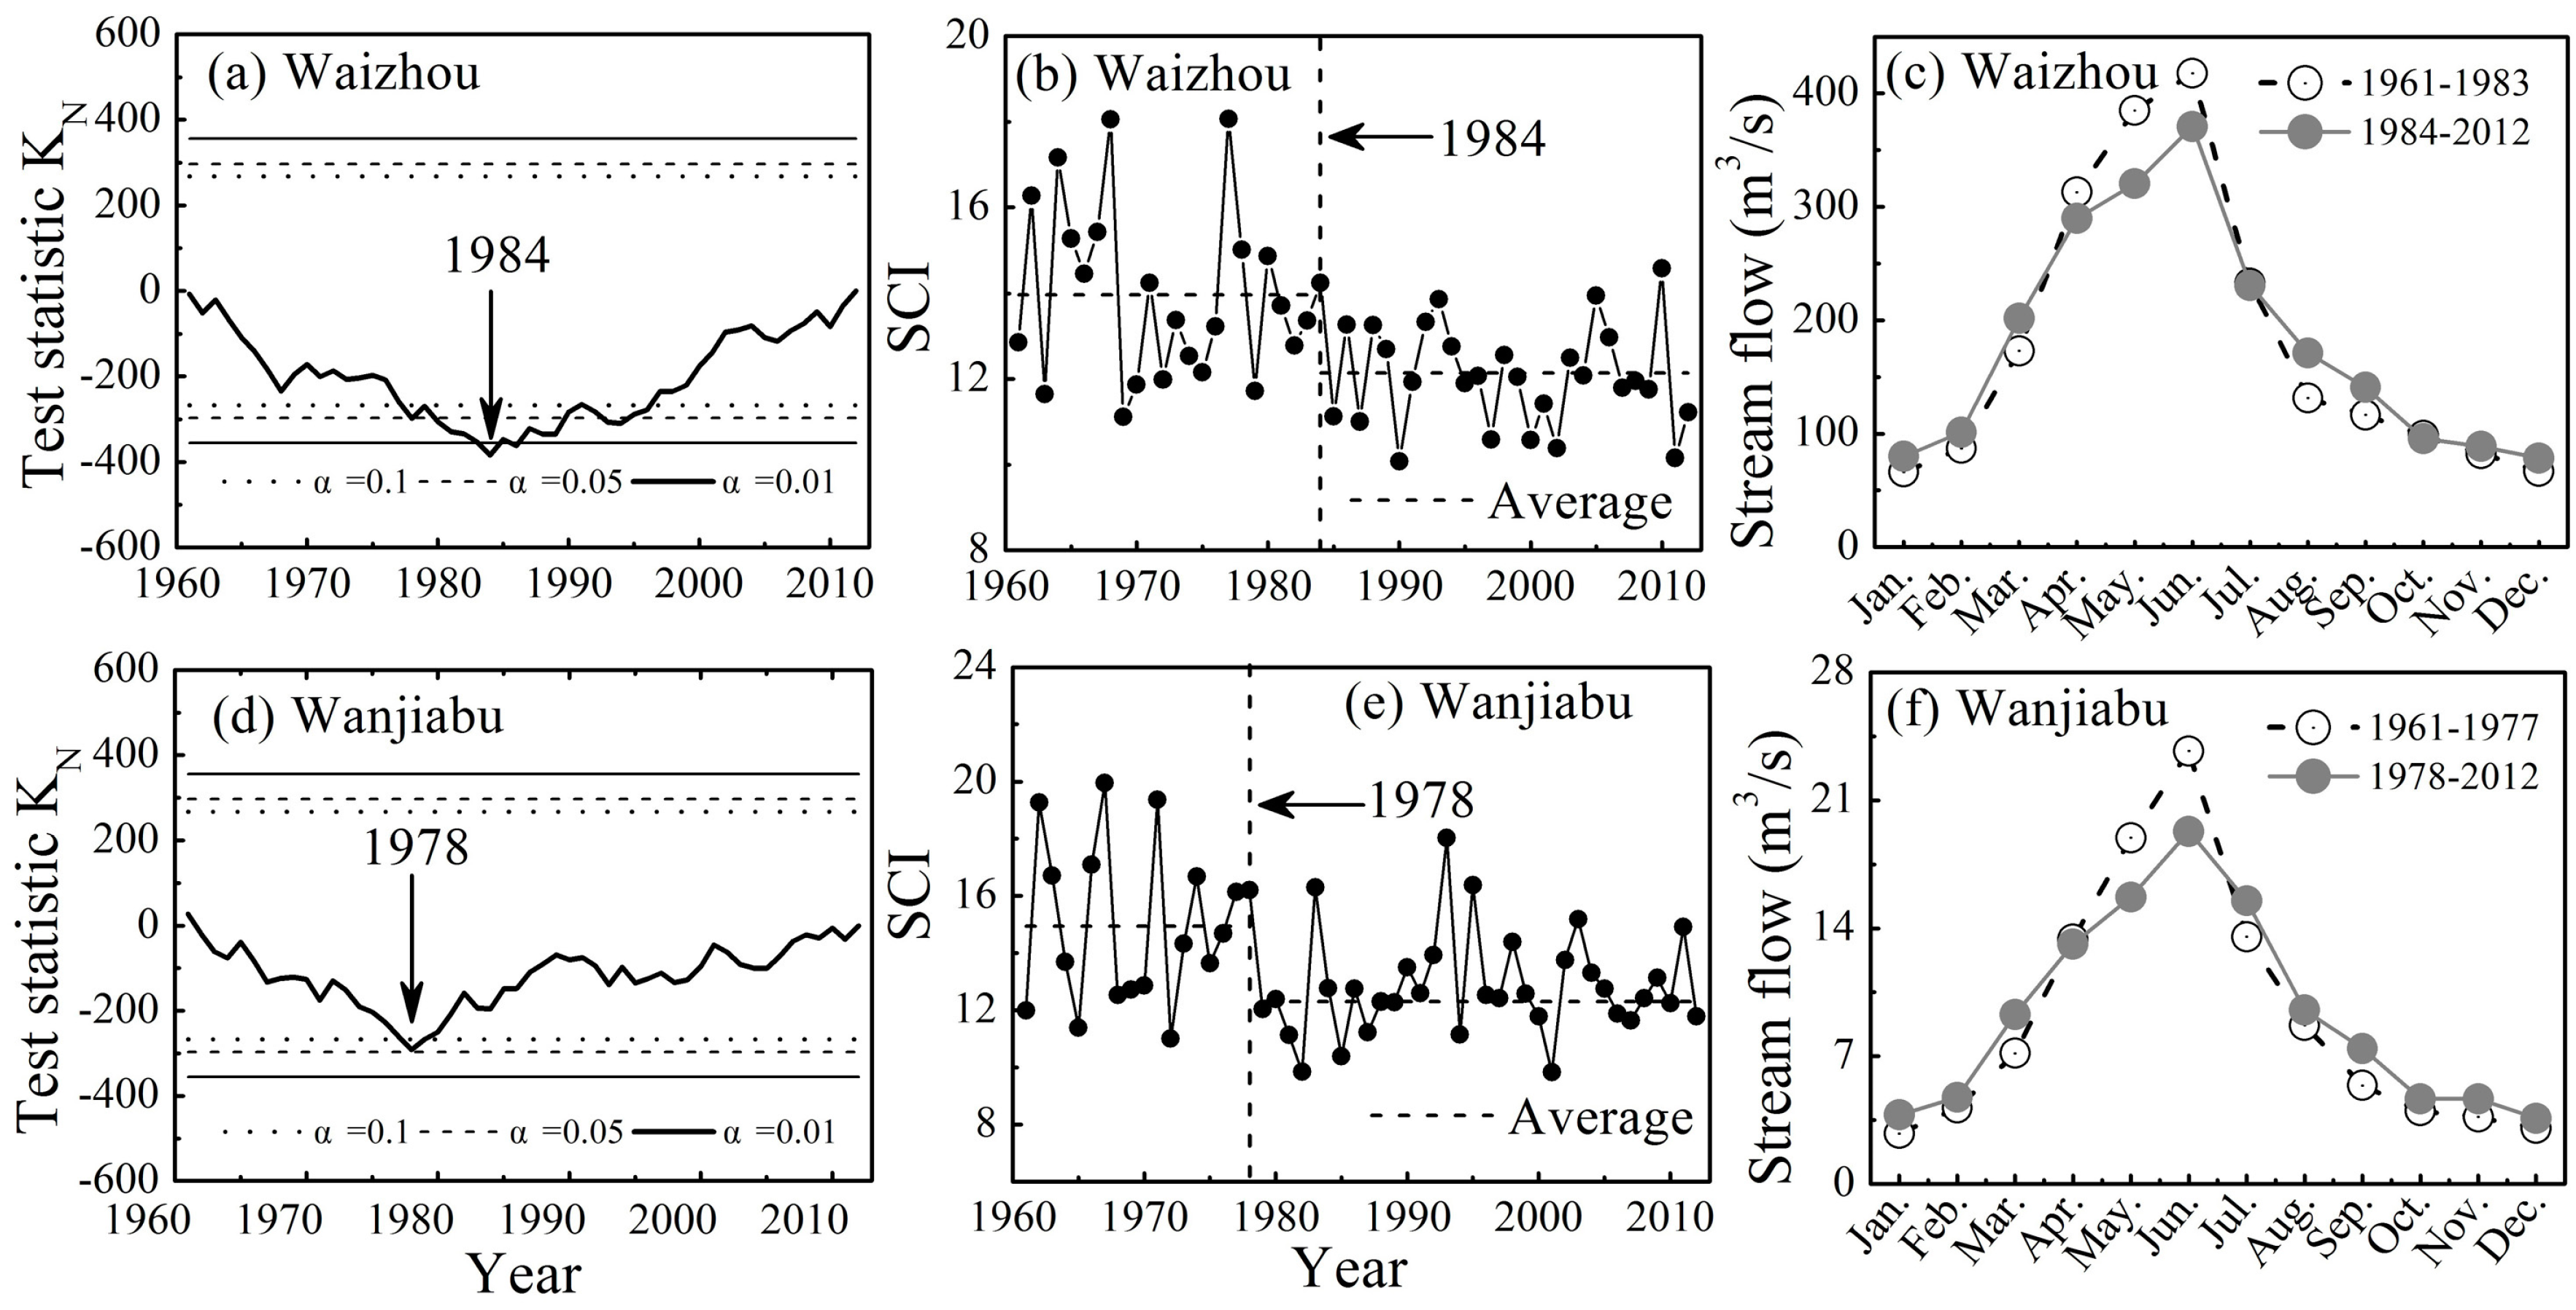
3.1.2. Trends and Change Points of Stream flow
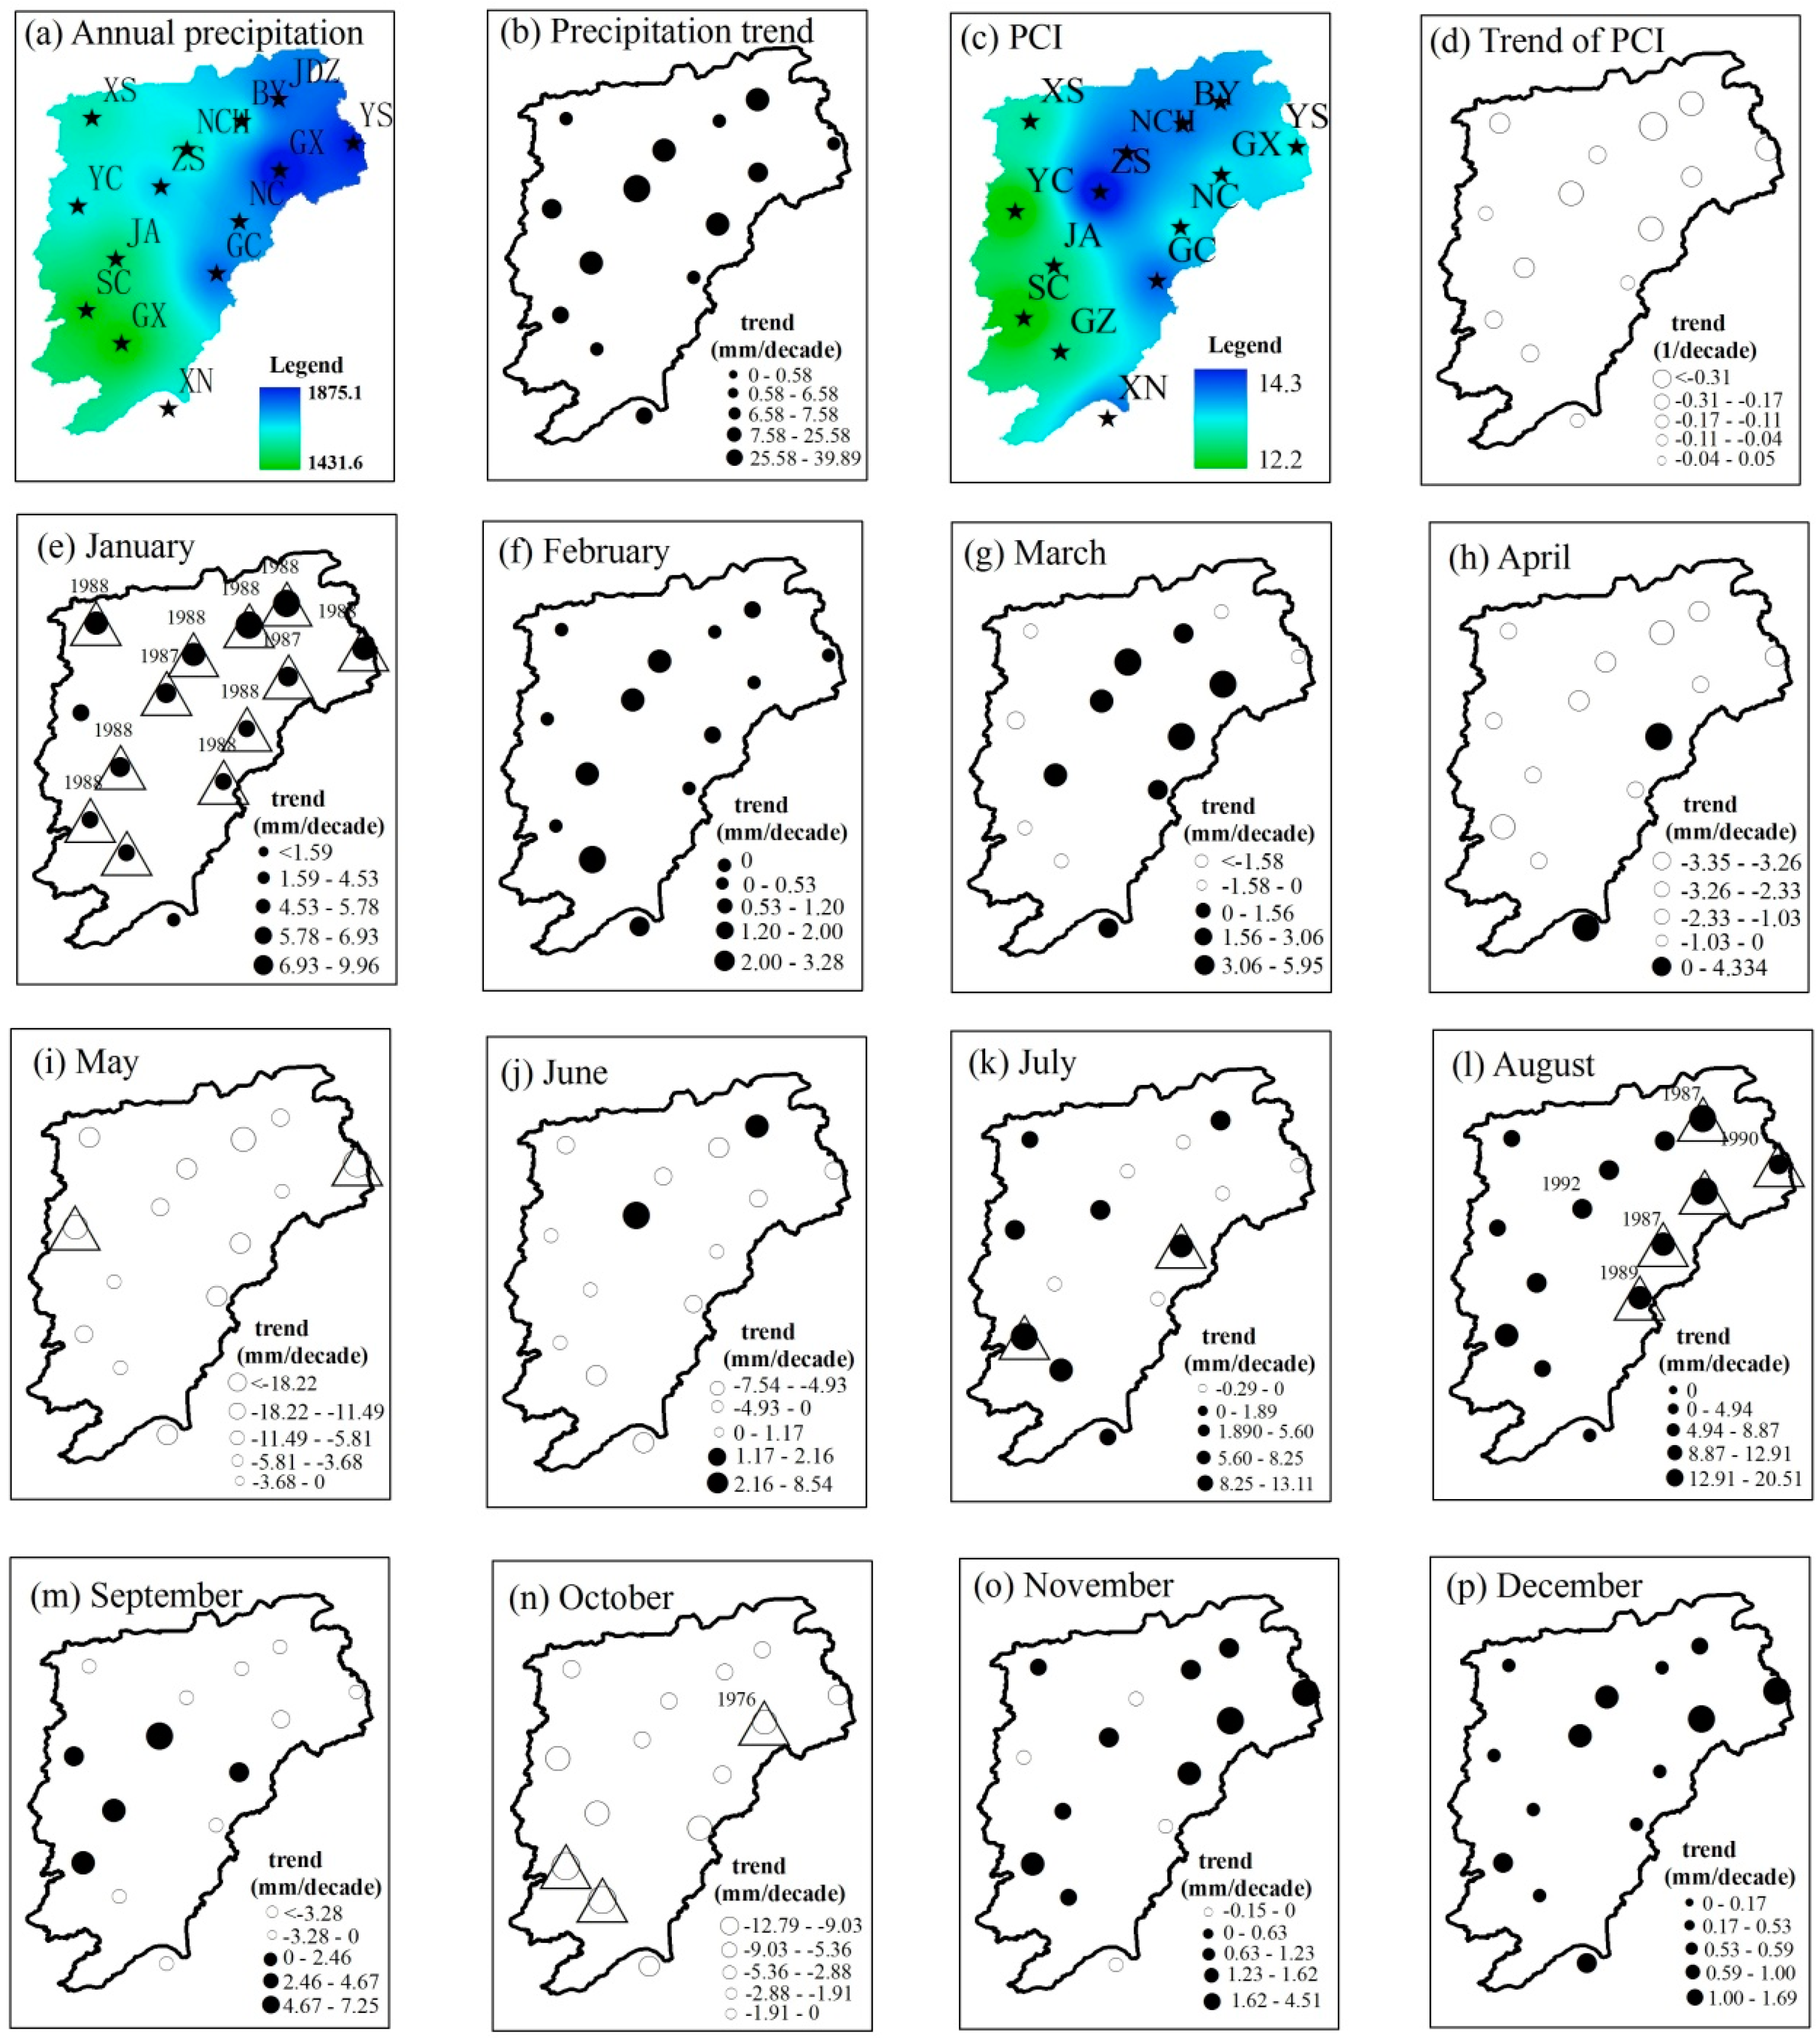
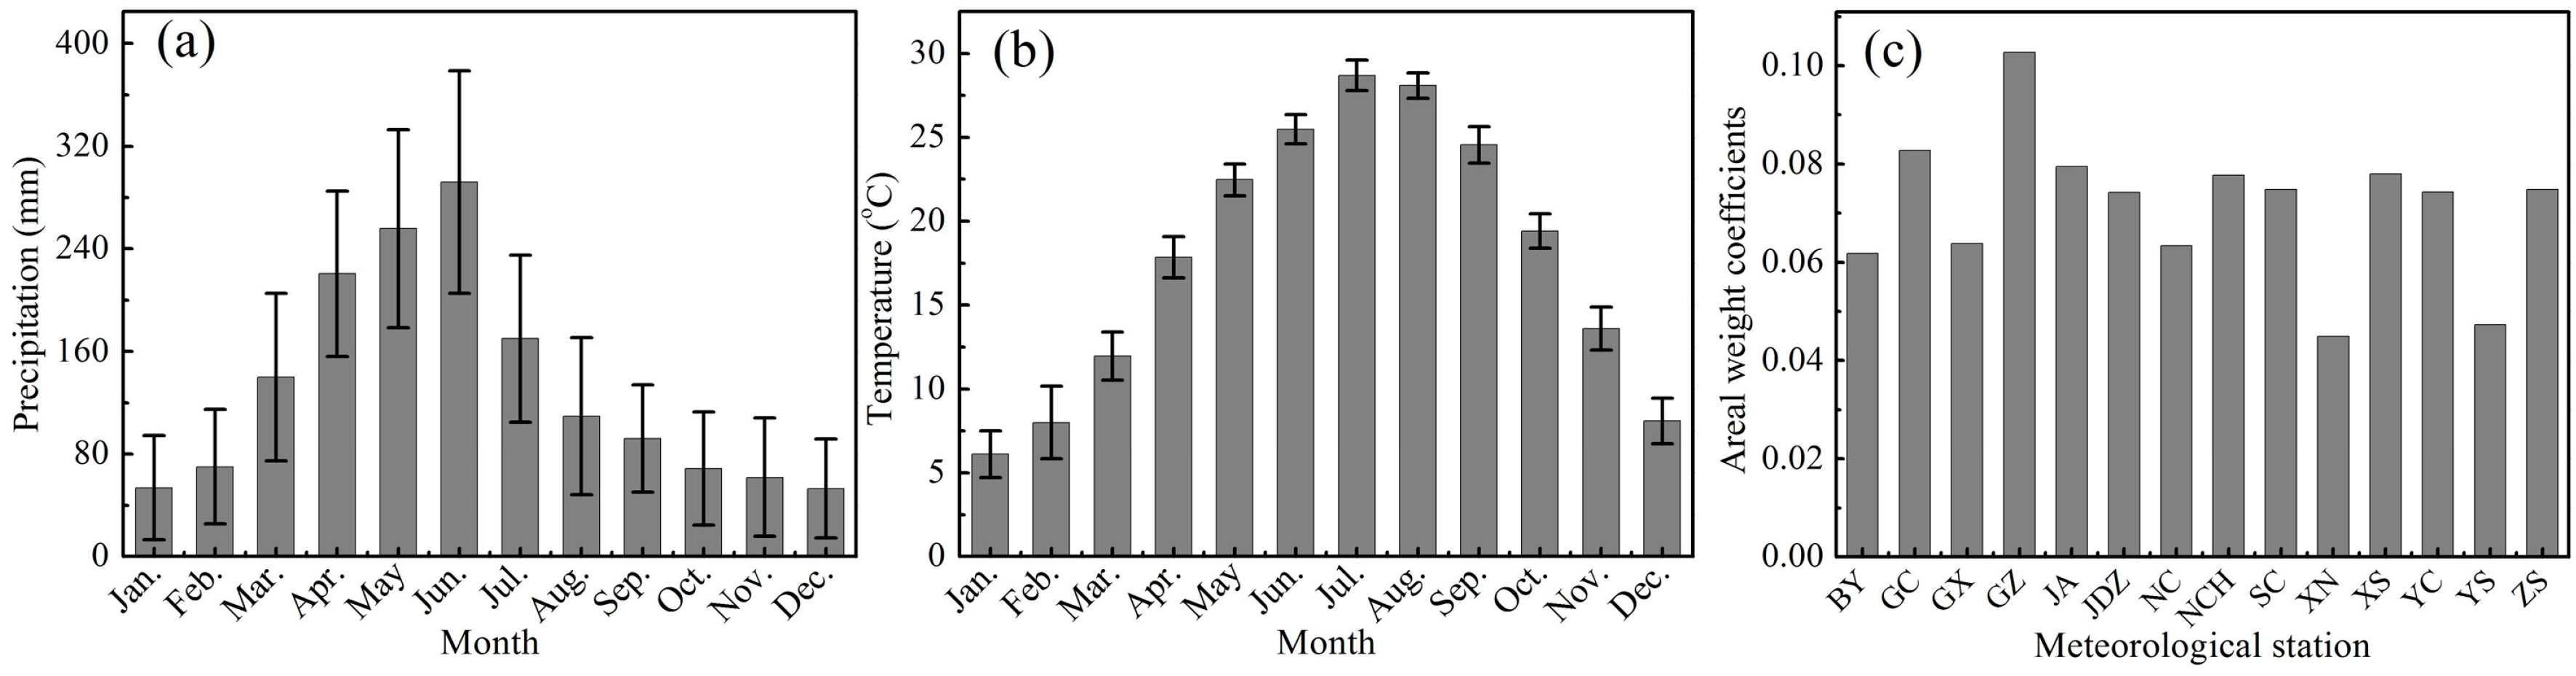
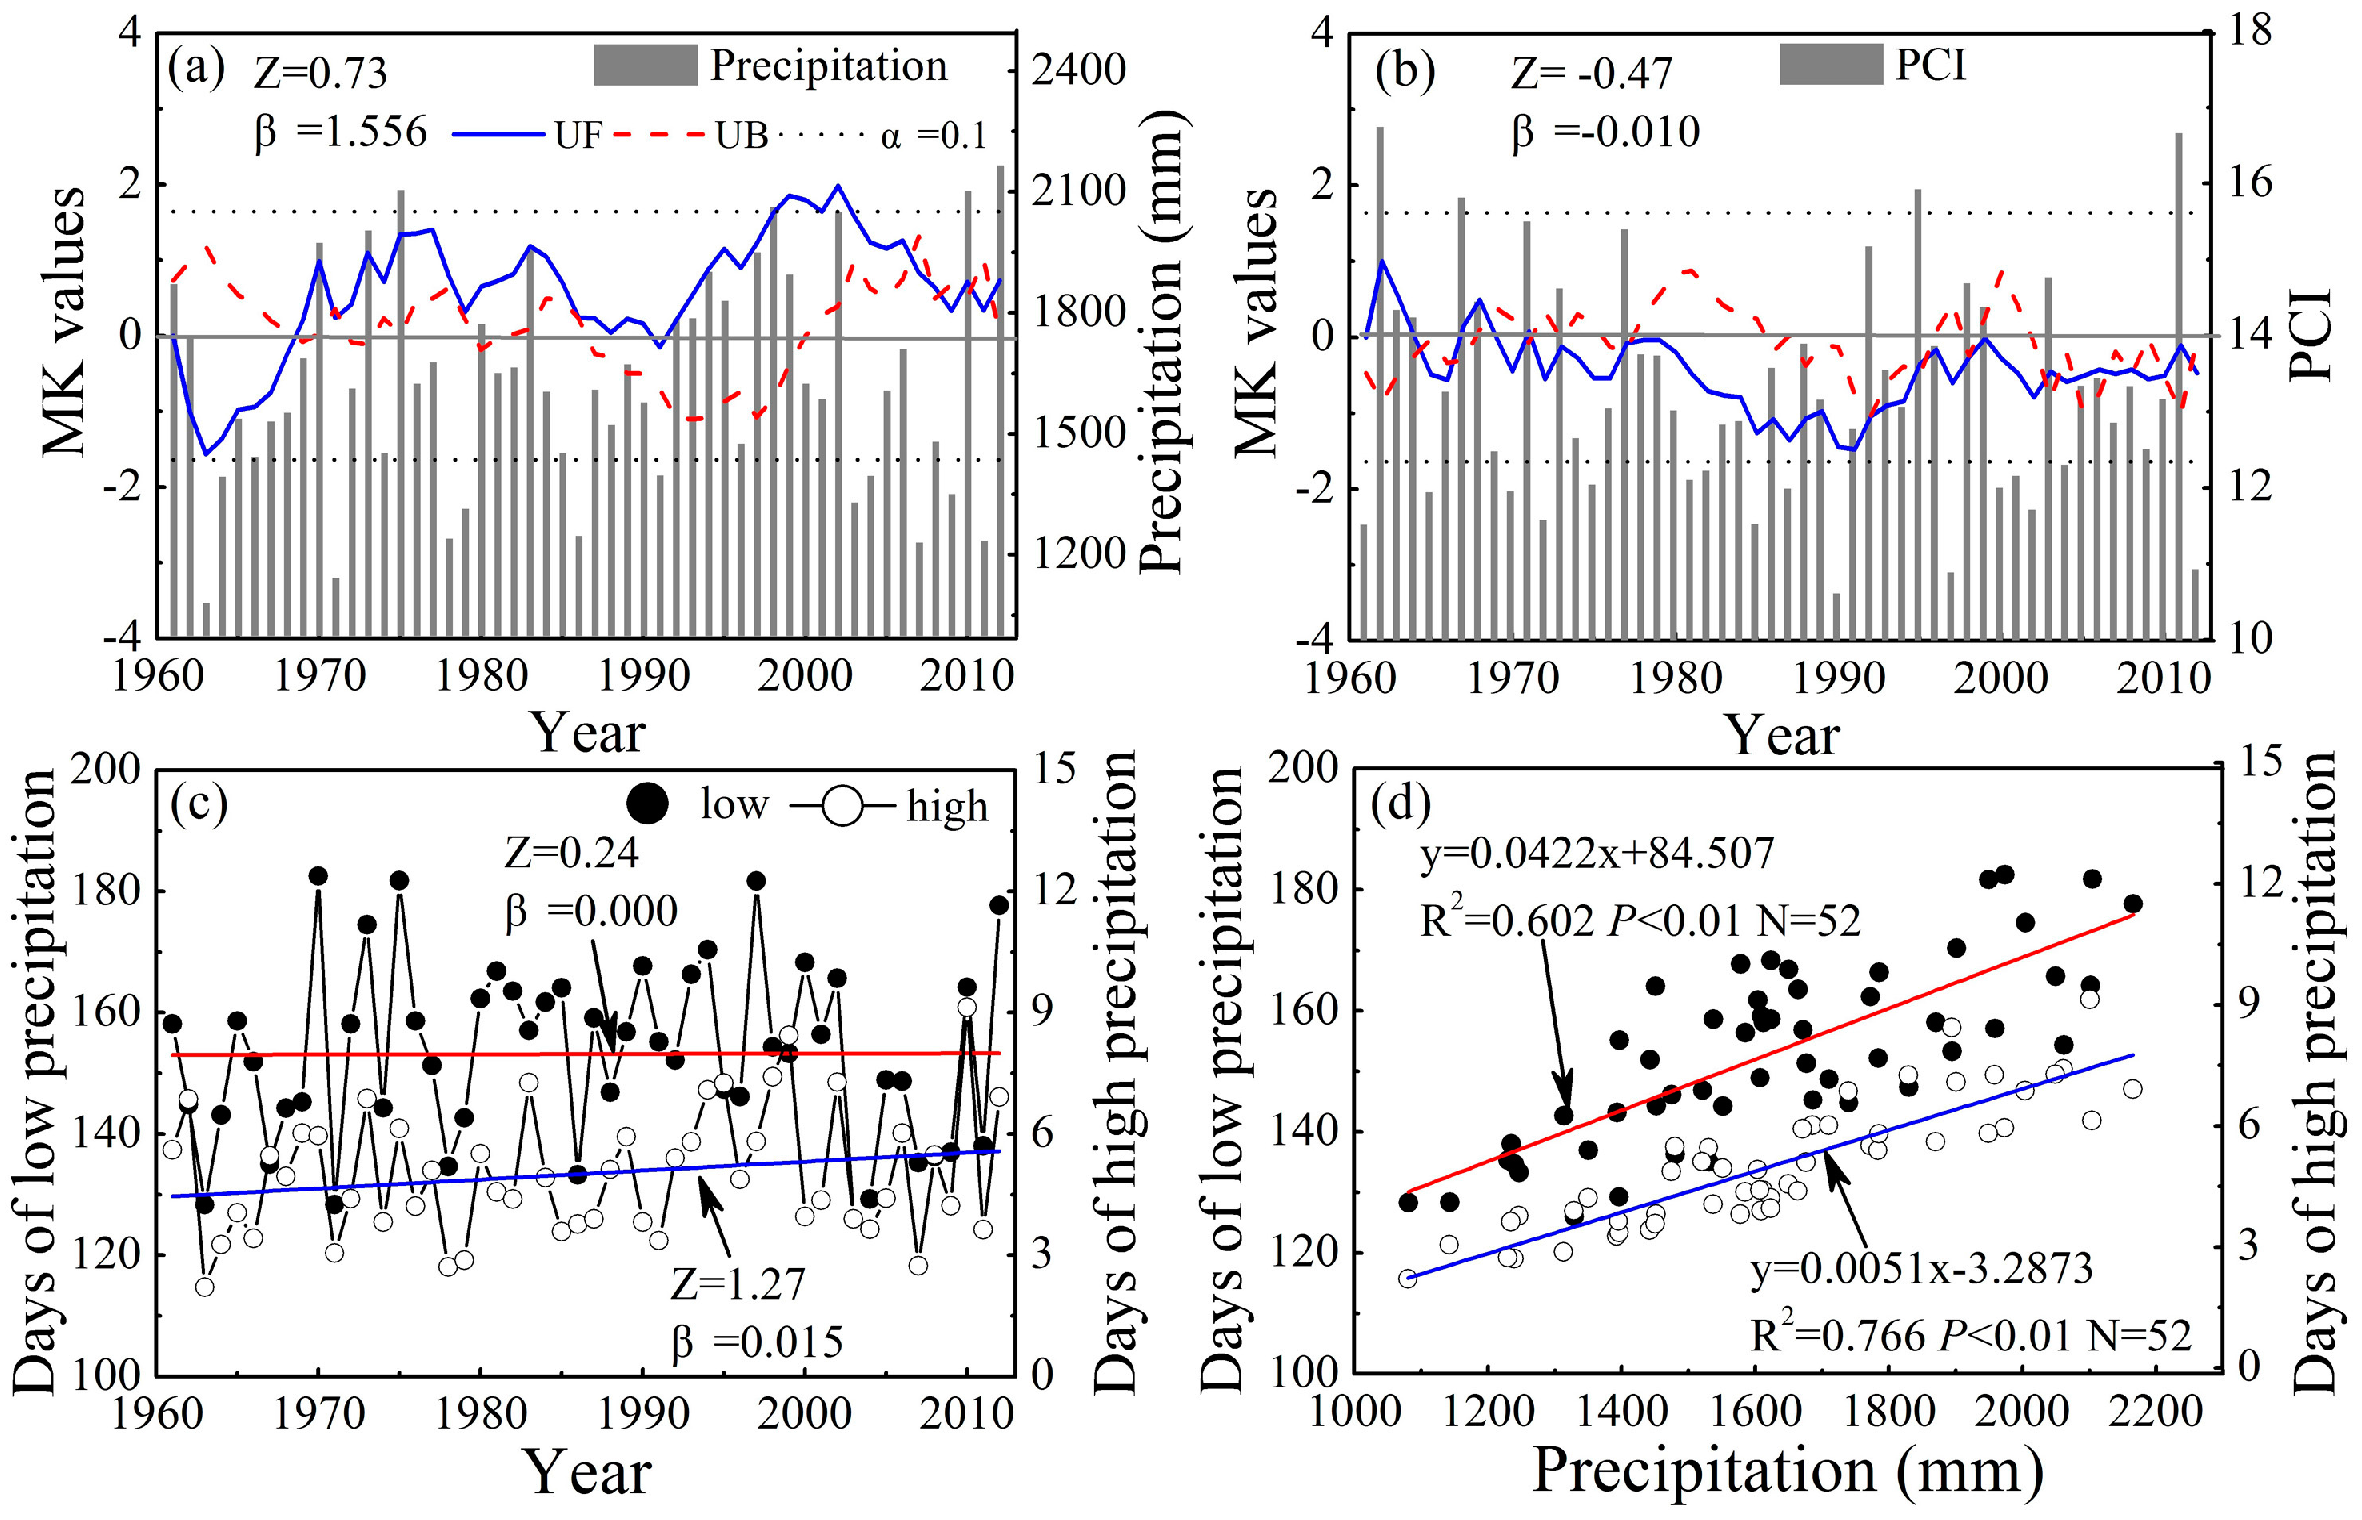
3.2. Change Detection for Precipitation
3.2.1. Annual Precipitation
3.2.2. Monthly Precipitation
3.3. Relationships between Stream Flow and Precipitation
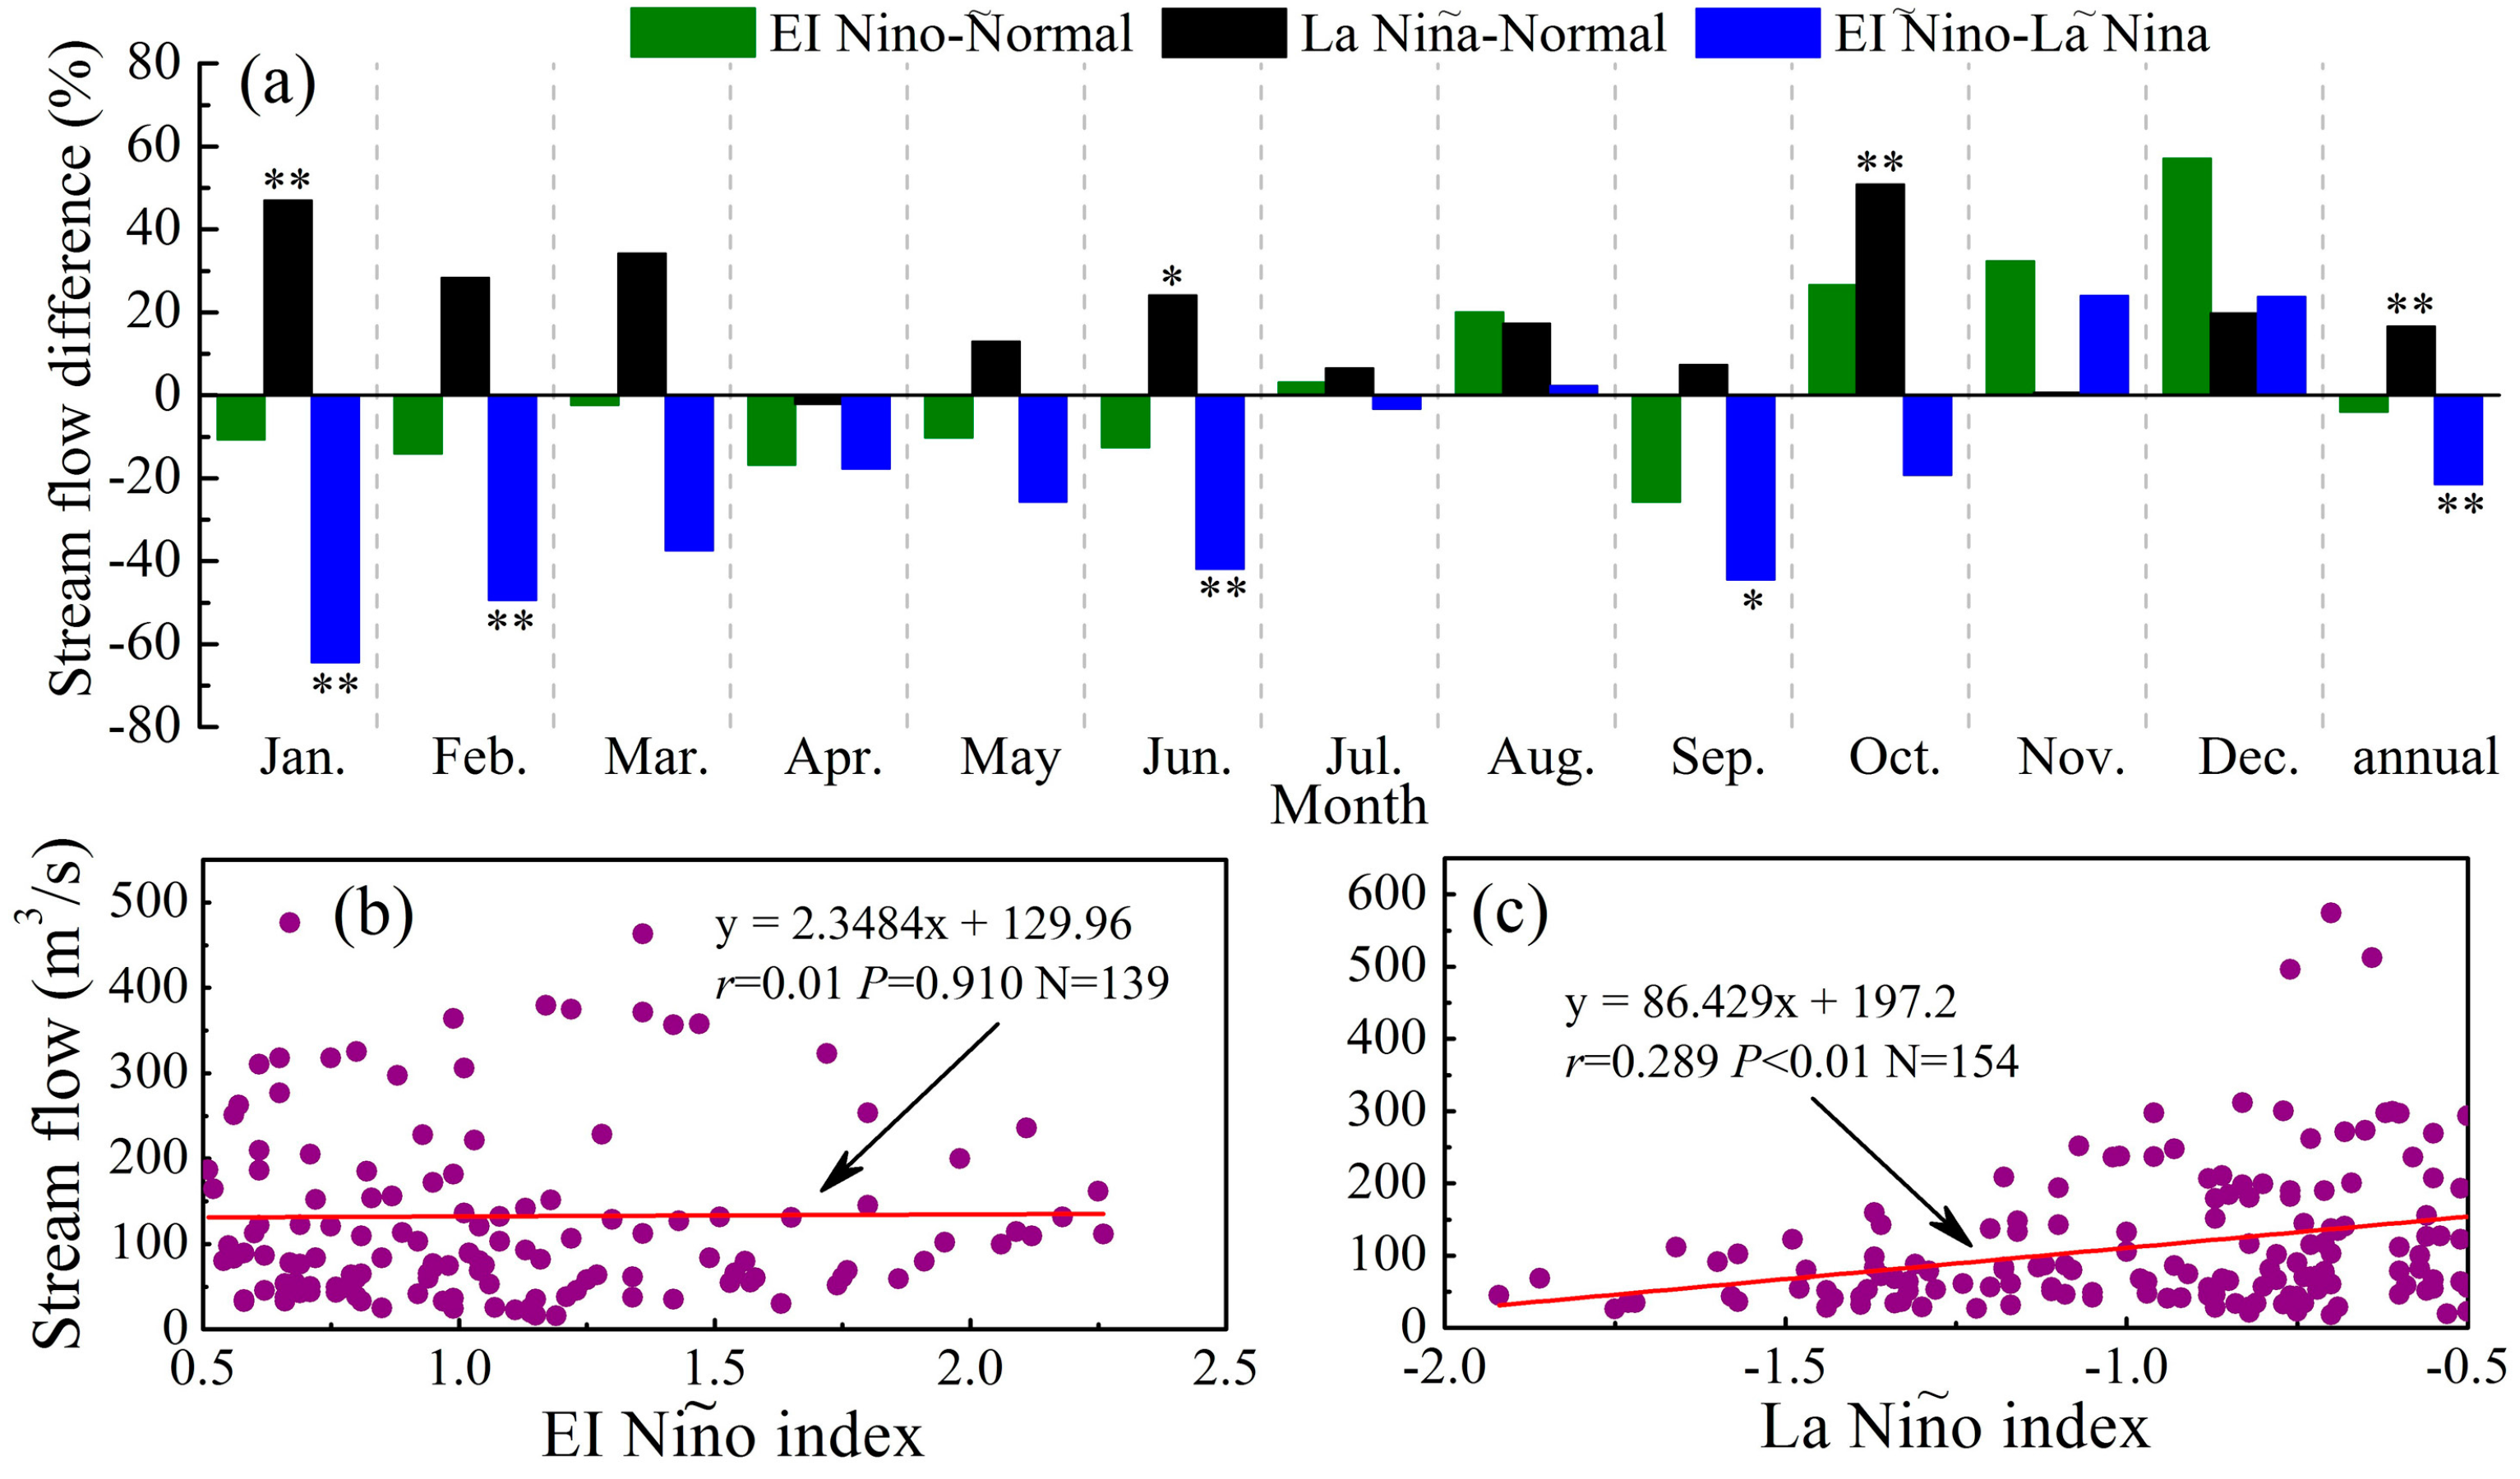
3.4. Linkage between Stream Flow and Climate Indices
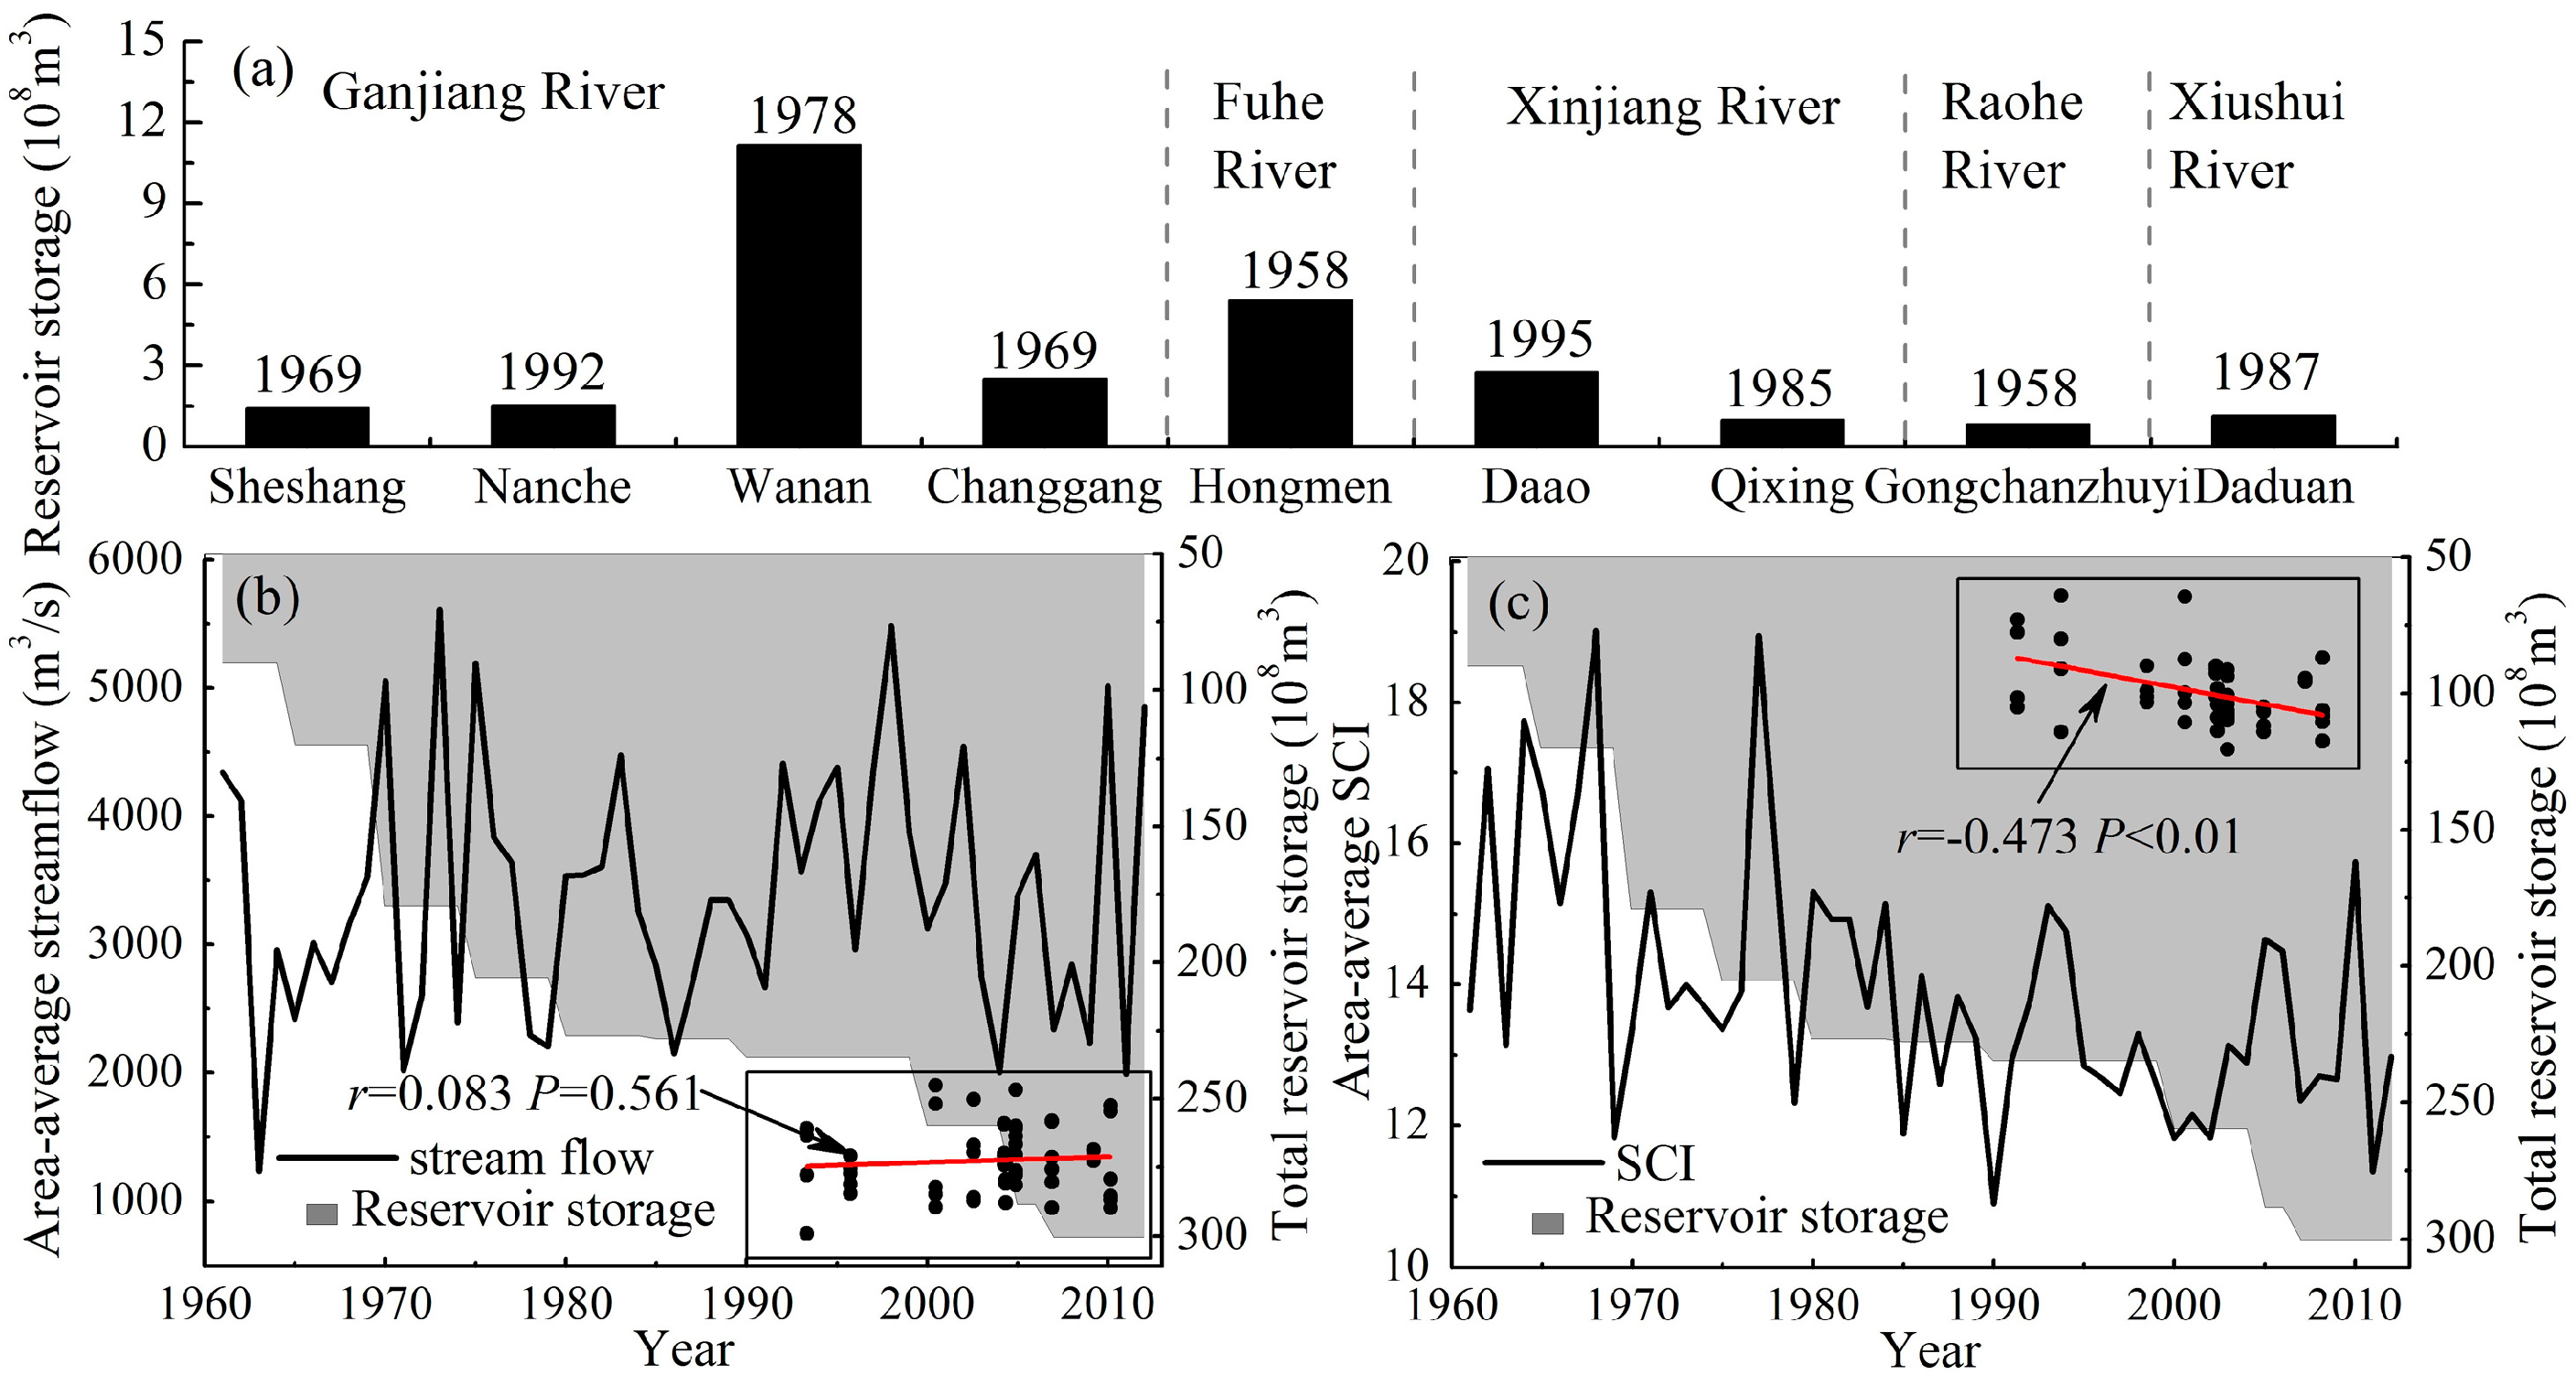
3.5. Relationship between Stream Flow and Reservoir Construction
4. Discussions
4.1. Impacts of Climate Change on Stream Flow Variations
4.2. Potential Anthropogenic Impacts on Stream Flow Changes
4.3. The Effects of Monthly Stream Flow Change on the Droughts and Floods of the Poyang Lake
5. Conclusions
Acknowledgments
Author Contributions
Conflicts of Interest
References
- Feng, L.; Hu, C.; Chen, X.; Cai, X.; Tian, L.; Gan, W. Assessment of inundation changes of Poyang Lake using MODIS observations between 2000 and 2010. Remote Sens. Environ. 2012, 121, 80–92. [Google Scholar] [CrossRef]
- Zhang, Q.; Sun, P.; Chen, X.; Jiang, T. Hydrological extremes in the Poyang Lake Basin, China: Changing properties, causes and impacts. Hydrol. Process. 2011, 25, 3121–3130. [Google Scholar] [CrossRef]
- Zhang, Q.; Ye, X.C.; Werner, A.D.; Li, Y.L.; Yao, J.; Li, X.H.; Xu, C.Y. An investigation of enhanced recessions in Poyang Lake: Comparison of Yangtze River and local catchment impacts. J. Hydrol. 2014, 517, 425–434. [Google Scholar] [CrossRef]
- Feng, L.; Hu, C.; Chen, X.; Li, R. Satellite observations make it possible to estimate Poyang Lake’s water budget. Environ. Res. Lett. 2011, 6, 044023. [Google Scholar] [CrossRef]
- Kanai, Y.; Ueta, M.; Germogenov, N.; Nagendran, M.; Mita, N.; Higuchi, H. Migration routes and important resting areas of Siberian cranes (Grus leucogeranus) between northeastern Siberia and China as revealed by satellite tracking. Biol. Conserv. 2002, 106, 339–346. [Google Scholar] [CrossRef]
- Wu, G.; De Leeuw, J.; Skidmore, A.K.; Prins, H.H.; Best, E.P.; Liu, Y. Will the Three Gorges Dam affect the underwater light climate of Vallisneria spiralis L. and food habitat of Siberian crane in Poyang Lake? Hydrobiologia 2009, 623, 213–222. [Google Scholar] [CrossRef]
- Gao, J.H.; Jia, J.; Kettner, A.J.; Xing, F.; Wang, Y.P.; Xu, X.N.; Yang, Y.; Zou, X.Q.; Gao, S.; Qi, S. Changes in water and sediment exchange between the Changjiang River and Poyang Lake under natural and anthropogenic conditions, China. Sci. Total Environ. 2014, 481, 542–553. [Google Scholar] [CrossRef] [PubMed]
- Nakayama, T.; Shankman, D. Impact of the Three-Gorges Dam and water transfer project on Changjiang floods. Glob. Planet. Chang. 2013, 100, 38–50. [Google Scholar] [CrossRef]
- Zhang, Q.; Liu, J.; Singh, V.P.; Gu, X.; Chen, X. Evaluation of impacts of climate change and human activities on streamflow in the Poyang Lake basin, China. Hydrol. Process. 2016, 30, 2562–2576. [Google Scholar] [CrossRef]
- Guo, H.; Hu, Q.; Jiang, T. Annual and seasonal stream flow responses to climate and land-cover changes in the Poyang Lake basin, China. J. Hydrol. 2008, 355, 106–122. [Google Scholar] [CrossRef]
- Jiang, T.; Shi, Y. Global warming and its consequences in Yangtze River floods and damages. Adv. Earth Sci. 2003, 18, 277–284. [Google Scholar]
- Li, X.; Zhang, Q. Variation of floods characteristics and their responses to climate and human activities in Poyang Lake, China. Chin. Geogr. Sci. 2015, 25, 13–25. [Google Scholar] [CrossRef]
- Hu, Q.; Feng, S.; Guo, H.; Chen, G.; Jiang, T. Interactions of the Yangtze River flow and hydrologic processes of the Poyang Lake, China. J. Hydrol. 2007, 347, 90–100. [Google Scholar] [CrossRef]
- Feng, L.; Hu, C.; Chen, X.; Zhao, X. Dramatic inundation changes of China’s two largest freshwater lakes linked to the Three Gorges Dam. Environ. Sci. Technol. 2013, 47, 9628–9634. [Google Scholar] [CrossRef] [PubMed]
- Liu, Y.; Wu, G.; Zhao, X. Recent declines in China’s largest freshwater lake: Trend or regime shift? Environ. Res. Lett. 2013, 8, 014010. [Google Scholar] [CrossRef]
- Zhao, G.; Hörmann, G.; Fohrer, N.; Zhang, Z.; Zhai, J. Stream flow Trends and Climate Variability Impacts in Poyang Lake Basin, China. Water Resour. Manag. 2010, 24, 689–706. [Google Scholar] [CrossRef]
- Abghari, H.; Tabari, H.; Talaee, P.H. River flow trends in the west of Iran during the past 40 years: Impact of precipitation variability. Glob. Planet. Chang. 2013, 101, 52–60. [Google Scholar] [CrossRef]
- Lu, X.X.; Ashmore, P.; Wang, J.F. Seasonal water discharge and sediment load changes in the Upper Yangtze, China. Mt. Res. Dev. 2003, 23, 56–64. [Google Scholar] [CrossRef]
- Huang, J.; Sun, S.; Zhang, J. Detection of trends in precipitation during 1960–2008 in Jiangxi Province, southeast China. Theor. Appl. Climatol. 2013, 114, 237–251. [Google Scholar] [CrossRef]
- Zheng, H.; Zhang, L.; Liu, C.; Shao, Q.; Fukushima, Y. Changes in stream flow regime in headwater catchments of the Yellow River Basin since the 1950s. Hydrol. Process. 2007, 21, 886–893. [Google Scholar] [CrossRef]
- Baldwin, C.K.; Lall, U. Seasonality of stream flow: The upper Mississippi River. Water Resour. Res. 1999, 35, 1143–1154. [Google Scholar] [CrossRef]
- Zhang, Q.; Liu, Y.; Yang, G.; Zhang, Z. Precipitation and hydrological variations and related associations with large-scale circulation in the Poyang Lake basin, China. Hydrol. Process. 2011, 25, 740–751. [Google Scholar] [CrossRef]
- National Climate Centre of China Meteorological Administration. Available online: http://cdc.cma.gov.cn (accessed on 4 February 2016).
- Min, Q.; Shi, J.; Min, D. Characteristics of sediment into and out of Poyanghu Lake from 1956 to 2005. J. China Hydrol. 2011, 31, 54–58. (In Chinese) [Google Scholar]
- Mann, H.B. Nonparametric tests against trend. Econometrica 1945, 13, 245–259. [Google Scholar] [CrossRef]
- Kendall, M.G. Rank Correlation Methods; Griffin: London, UK, 1975. [Google Scholar]
- Theil, H. A rank-invariant method of linear and polynomial regression analysis. In Henri Theil’s Contributions to Economics and Econometrics; Springer: Berlin, Germany, 1992; pp. 345–381. [Google Scholar]
- Sen, P.K. Estimates of the regression coefficient based on Kendall’s Tau. J. Am. Stat. Assoc. 1968, 63, 1379–1389. [Google Scholar] [CrossRef]
- Pettitt, A. A non-parametric approach to the change-point problem. Appl. Stat. 1979, 28, 126–135. [Google Scholar] [CrossRef]
- Oliver, J.E. Monthly precipitation distribution: A comparative index. Prof. Geogr. 1980, 32, 300–309. [Google Scholar] [CrossRef]
- Yue, S.; Wang, C. The Mann-Kendall test modified by effective sample size to detect trend in serially correlated hydrological series. Water Resour. Manag. 2004, 18, 201–218. [Google Scholar] [CrossRef]
- Bao, Z.; Zhang, J.; Wang, G.; Fu, G.; He, R.; Yan, X.; Jin, J.; Liu, Y.; Zhang, A. Attribution for decreasing streamflow of the Haihe River Basin, northern China: Climate variability or human activities? J. Hydrol. 2012, 460, 117–129. [Google Scholar] [CrossRef]
- Gao, P.; Jiang, G.; Wei, Y.; Mu, X.; Wang, F.; Zhao, G.; Sun, W. Streamflow regimes of the Yanhe River under climate and land use change, Loess Plateau, China. Hydrol. Process. 2015, 29, 2402–2413. [Google Scholar] [CrossRef]
- National Oceanic and Atmospheric Administration. Available online: http://www.esrl.noaa.gov/psd/data/climateindices/list (accessed 26 February 2016).
- Dong, B.; Sutton, R.T.; Highwood, E.J.; Wilcox, L.J. Preferred response of the East Asian summer monsoon to local and non-local anthropogenic sulphur dioxide emissions. Clim. Dyn. 2016, 46, 1733–1751. [Google Scholar] [CrossRef] [Green Version]
- You, Q.; Kang, S.; Aguilar, E.; Pepin, N.; Flügel, W.A.; Yan, Y.; Xu, Y.; Zhang, Y.; Huang, J. Changes in daily climate extremes in China and their connection to the large scale atmospheric circulation during 1961–2003. Clim. Dyn. 2011, 36, 2399–2417. [Google Scholar] [CrossRef]
- Trenberth, K.E. The definition of El Nino. Bull. Am. Meteorol. Soc. 1997, 78, 2771. [Google Scholar] [CrossRef]
- Milly, P.C.; Dunne, K.A.; Vecchia, A.V. Global pattern of trends in streamflow and water availability in a changing climate. Nature 2005, 438, 347–350. [Google Scholar] [CrossRef] [PubMed]
- Zhang, Q.; Xiao, M.; Singh, V.P.; Wang, Y. Spatiotemporal variations of temperature and precipitation extremes in the Poyang Lake Basin, China. Theor. Appl. Climatol. 2016, 124, 855–864. [Google Scholar] [CrossRef]
- Tao, H.; Fraedrich, K.; Menz, C.; Zhai, J. Trends in extreme temperature indices in the Poyang Lake Basin, China. Stoch. Environ. Res. Risk Assess. 2014, 28, 1543–1553. [Google Scholar] [CrossRef]
- He, B.; Miao, C.; Shi, W. Trend, abrupt change, and periodicity of stream flow in the mainstream of Yellow River. Environ. Monit. Assess. 2013, 185, 6187–6199. [Google Scholar] [CrossRef] [PubMed]
- Sun, S.L.; Zhou, S.Q.; Song, J.; Shi, J.H.; Gu, R.Y.; Ma, F.M. Change in pan evaporation and its driving factors in Jiangxi Province. Trans. CSAE 2010, 26, 59–65. (In Chinese) [Google Scholar]
- Xu, J.; Li, W.; Ji, M.; Lu, F.; Dong, S. A comprehensive approach to characterization of the nonlinearity of runoff in the headwaters of the Tarim River, western China. Hydrol. Process. 2010, 24, 136–146. [Google Scholar] [CrossRef]
- Liu, Z.; Yao, Z.; Huang, H.; Wu, S.; Liu, G. Land use and climate changes and their impacts on runoff in the Yarlung Zangbo River Basin, China. Land Degrad. Dev. 2014, 25, 203–215. [Google Scholar] [CrossRef]
- Guo, H.; Ying, B.; Wang, Y.; Jiang, T. Runoff coefficients change and the analysis of the relationships between the climate factors and runoff coefficients in the Poyang Lake Basin (China):1955–2002. J. Lake Sci. 2007, 2, 163–169. (In Chinese) [Google Scholar]
- Shao, J.; Wang, J.; Lv, S.; Bing, J. Spatial and temporal variability of seasonal precipitation in Poyang Lake Basin and possible links with climate indices. Hydrol. Res. 2016, 47. [Google Scholar] [CrossRef]
- Wei, W.; Chang, Y.; Dai, Z. Streamflow changes of the Changjiang (Yangtze) River in the recent 60 years: Impacts of the East Asian summer monsoon, ENSO, and human activities. Quat. Int. 2014, 336, 98–107. [Google Scholar] [CrossRef]
- Ouyang, R.; Liu, W.; Fu, G.; Liu, C.; Hu, L.; Wang, H. Linkages between ENSO/PDO signals and precipitation, stream flow in China during the last 100 years. Hydrol. Earth Syst. Sci. 2014, 18, 3651–3661. [Google Scholar] [CrossRef]
- Chen, W.; Wang, L.; Xue, Y.; Sun, S. Variabilities of the spring river runoff system in East China and their relations to precipitation and sea surface temperature. Int. J. Climatol. 2009, 29, 1381–1394. [Google Scholar] [CrossRef]
- Ye, X.; Zhang, Q.; Liu, J.; Li, X.; Xu, C.Y. Distinguishing the relative impacts of climate change and human activities on variation of streamflow in the Poyang Lake catchment, China. J. Hydrol. 2013, 494, 83–95. [Google Scholar] [CrossRef]
- Liu, J.; Zhang, Q.; Xu, C.; Zhang, Z. Research on runoff variation characteristics of Poyang Lake watershed in the past 50 years. Trop. Geogr. 2009, 29, 213–224. (In Chinese) [Google Scholar]
- Wei, L.X.; Yu, H.; Wang, Z.Y.; Bao, W.J. Characteristics and genesis analysis of variation of Poyang Lake flow into Yangtze River. Yangtze River 2014, 23, 91–97. (In Chinese) [Google Scholar]
- Ye, X.; Zhang, Q.; Liu, J.; Li, L.J.; Guo, H. Impacts of climate change and human activities on runoff of Poyang Lake Catchment. J. Glaciol. Geocryol. 2009, 31, 835–842. (In Chinese) [Google Scholar]


| Stations | Basins | Longitude (E) | Latitude (N) | Gauged Area (km2) | Percentage of Total Poyang Lake Basin (%) | Year |
|---|---|---|---|---|---|---|
| Waizhou | Ganjiang | 115°56′ | 28°38′ | 80,948 | 49.9 | 1961–2012 |
| Lijiadu | Fuhe | 116°37′ | 28°46′ | 15,811 | 9.7 | 1961–2012 |
| Meigang | Xinjiang | 116°48′ | 28°26′ | 15,535 | 9.6 | 1961–2012 |
| Dufengkeng | Raohe | 117°12′ | 29°15′ | 5013 | 3.1 | 1961–2012 |
| Wanjiabu | Xiushui | 115°37′ | 29°01′ | 3548 | 2.2 | 1961–2012 |
| Station | Stream Flow | SCI | ||||||
|---|---|---|---|---|---|---|---|---|
| Max (m3/s) | Min (m3/s) | Mean (m3/s) | CV (%) | Max | Min | Mean | CV (%) | |
| Waizhou | 3642.8 (1973) | 751.6 (1963) | 2169.6 | 28.90 | 18.1 (1977) | 10.1 (1990) | 12.9 | 14.23 |
| Lijiadu | 718.3 (1998) | 116.1 (1963) | 391.7 | 38.25 | 24.6 (1977) | 10.3 (1990) | 16.5 | 19.09 |
| Meigang | 1091.8 (1998) | 253.5 (1963) | 574.5 | 33.61 | 26.8 (1967) | 10.8 (2001) | 15.3 | 20.00 |
| Dufengkeng | 304.2 (1998) | 57.7 (1963) | 143.8 | 38.45 | 31.1 (1971) | 11.7 (1972) | 18.2 | 23.61 |
| Wanjiabu | 227.8 (1998) | 56.0 (1968) | 110.3 | 32.02 | 19.9 (1967) | 9.8 (2001) | 13.6 | 17.56 |
| Time Series | Waizhou | Lijiadu | Meigang | Dufengkeng | Wanjiabu | |||||
|---|---|---|---|---|---|---|---|---|---|---|
| Z | β | Z | β | Z | β | Z | β | Z | β | |
| Annual | 0.50 | 3.716 | −0.43 | −0.829 | 0.86 | 1.634 | 0.89 | 0.450 | 0.83 | 0.272 |
| January | 1.49 | 0.439 | 0.22 | 0.011 | 1.97 ** | 0.157 ** | 2.19 ** | 0.026 ** | 2.03 ** | 0.023 ** |
| Change point | 1987 ** | 1988 ** | 1987 ** | |||||||
| February | 0.65 | 0.312 | −0.20 | −0.023 | 0.31 | 0.062 | 0.78 | 0.021 | 0.58 | 0.013 |
| March | 1.14 | 0.838 | 0.58 | 0.109 | 1.35 | 0.318 | 1.02 | 0.021 | 0.99 | 0.037 |
| April | −0.63 | −0.543 | −1.33 | −0.367 | 0.13 | 0.024 | −0.69 | −0.078 | −0.02 | −0.001 |
| May | −0.69 | −0.661 | −1.21 | −0.426 | −0.99 | −0.394 | −0.24 | −0.028 | −0.61 | −0.057 |
| June | −0.33 | −0.658 | −0.45 | −0.216 | 0.43 | 0.276 | 0.37 | 0.060 | −0.63 | −0.058 |
| July | 0.37 | 0.484 | −0.05 | −0.008 | 0.43 | 0.105 | 1.50 | 0.157 | −0.10 | −0.012 |
| August | 1.99 ** | 1.160 ** | 1.57 | 0.136 | 3.24 *** | 0.402 *** | 1.78 * | 0.069 * | 1.79 * | 0.061 * |
| Change point | 1992 ** | 1992 *** | 1988 * | 1992 * | ||||||
| September | 2.62 *** | 1.421 *** | 1.38 | 0.108 | 1.89 * | 0.206 * | 0.92 | 0.020 | 2.18 ** | 0.070 ** |
| Change point | 1978 ** | 1986 * | ||||||||
| October | 0.25 | 0.076 | −1.17 | −0.069 | 0.21 | 0.011 | 1.20 | 0.012 | 0.85 | 0.014 |
| November | 0.67 | 0.175 | 0.17 | 0.014 | 1.60 | 0.107 | 1.44 | 0.015 | 1.29 | 0.021 |
| December | 1.36 | 0.313 | 0.44 | 0.023 | 1.84 * | 0.102 * | 1.32 | 0.012 | 1.14 | 0.013 |
| SCI | −3.43 *** | −0.053 *** | −1.48 | −0.029 | −2.11 ** | −0.049 ** | −1.03 | −0.034 | −1.84 * | −0.028 * |
| Change point | 1984 *** | 1978 ** | ||||||||
© 2016 by the authors; licensee MDPI, Basel, Switzerland. This article is an open access article distributed under the terms and conditions of the Creative Commons Attribution (CC-BY) license (http://creativecommons.org/licenses/by/4.0/).
Share and Cite
Gu, C.; Mu, X.; Zhao, G.; Gao, P.; Sun, W.; Yu, Q. Changes in Stream Flow and Their Relationships with Climatic Variations and Anthropogenic Activities in the Poyang Lake Basin, China. Water 2016, 8, 564. https://doi.org/10.3390/w8120564
Gu C, Mu X, Zhao G, Gao P, Sun W, Yu Q. Changes in Stream Flow and Their Relationships with Climatic Variations and Anthropogenic Activities in the Poyang Lake Basin, China. Water. 2016; 8(12):564. https://doi.org/10.3390/w8120564
Chicago/Turabian StyleGu, Chaojun, Xingmin Mu, Guangju Zhao, Peng Gao, Wenyi Sun, and Qiang Yu. 2016. "Changes in Stream Flow and Their Relationships with Climatic Variations and Anthropogenic Activities in the Poyang Lake Basin, China" Water 8, no. 12: 564. https://doi.org/10.3390/w8120564