Article

Basin Flood Risk Management: A Territorial Data-Driven Approach to Support Decision-Making

by
Pedro Pinto Dos Santos
1,* and
Alexandre Oliveira Tavares
2
1
Center for Social Studies, University of Coimbra, Colégio de São Jerónimo, Apartado 3087, Coimbra 3001-401, Portugal
2
Center for Social Studies, Earth Sciences Department, University of Coimbra, Largo Marquês de Pombal, Coimbra 3000-272, Portugal
*
Author to whom correspondence should be addressed.
Water 2015, 7(2), 480-502; https://doi.org/10.3390/w7020480
Submission received: 30 October 2014 / Revised: 23 December 2014 / Accepted: 28 January 2015 / Published: 4 February 2015

Abstract

:
This paper explores the applicability of flood impact databases in the flood risk governance process. This study begins with a twofold analysis of three hydrographical basins: one analysis based on the data of a recently constructed flood-impact database for Portugal and another based on selected socioeconomic and biophysical variables that characterize the basins’ territorial context. From these sets of data, two fuzzy inference systems are assembled: one for the resource criteria and another for the time criteria. When plotted, the fuzzy analysis results are associated with distinct flood risk management strategies: operational and strategic, hard and soft measure-based. The three basins differ substantially in terms of flood-impact characteristics, with impacts being distinguished in terms of human and material consequences. Socioeconomic factors seem to be more explicative of flood impacts than the biophysical contexts that generate floods. The fuzzy logic analysis suggested priorities of action: early warning and information for one of the basins (Mondego) and a less operational solution, combining structural mitigation and land-use planning, for the other two basins (Lis and Vouga). Considering the current implementation of the Floods Directive, design of flood risk maps and flood risk management plans can benefit from the integration of the presented methodology.

1. Introduction

1.1. Contextualization

River basin management is discussed according to distinct perspectives seeking compromises between hydrologic, agronomic, ecologic and economic sustainable objectives (e.g., [1,2,3]). The need to harmonize the non-consumptive uses of water—among them flood risk management—and the consumptive uses of water demands a change in the way water management is conducted. This change must consider hydrological boundaries in an integrated approach following the principles of subsidiarity and stakeholder participation [4,5].
The European Water Framework Directive provides the institutional arrangement that is necessary for addressing the planning and management problems that are described by [6] although not considering specifically the flood risk [7]. Thus, the current and future instrumental framework for flood risk management derives from the implementation of the EU Directive 2007/60/EC, the “Floods Directive” [8], which assumes a drift from the solutions that are intended to keep the floodwaters away from the floodplain to the spectrum of non-structural solutions, at the basin scale, which addresses the capacity of natural and social systems to adapt to, respond to and recover from flood disasters [9]. Such a drift in flood risk governance from “flood protection to flood risk management” [10] (p. 510) is recognizable regarding three developments: (1) a shift from an engineering perspective, which is intended to prevent flooding by considering design flood events, to a management perspective, which aims to be prepared for supra-standardized events and assumes the “living with floods” attitude, which leads to action in the vulnerability component of the risk equation; (2) the outset of risk-informed decision-making, which ponders the costs of available options and assesses proportionate responses to risk according to a cost-benefit analysis (cf. [11]); and (3) the replacement of a risk reduction fragmented approach by an integrated systems approach where hard flood defenses are complemented or replaced by measures that mitigate flood impacts [10]. These shifts are crystallized in the EU “Floods Directive”.
The challenges posed to flood risk management at the basin scale include the necessity to deal with uncertainty regarding the probability of events and the severity of their impacts, finding the combination of flood management strategies that provide the best results under an acceptable risk [12,13]. Spatial planning plays a central role in the flood risk management cycle—connecting sectors such as civil protection, environment, industry or transport, although its benefits in flood risk management can be highly variable or even present a missing role [14]. An operational emergency response with a strong focus on the development of technologies and tools for effective early warning systems [15] are also key features of this new framework.
The holistic perspective which embraces the “Floods Directive” constitutes an opportunity to further develop flood risk management at the basin scale in Portugal, although some nonconformities are identified in terms of (a) the mismatch between management and operational resources and (b) the necessity to improve the relationship between the stakeholders who manage the water resources (energy, irrigation, human consumption, ecology, etc.) and those who manage flood risk [16].
The methodology that is presented in this paper is an approach that informs risk managers—with territory data being the basis for decision-making—articulating water management and flood risk management at the basin scale. The effectiveness of risk governance processes depends on the quality of management strategies, which, in turn, are based on the conducted assessments. The presented approach is to be placed in the risk governance model linking judgment and management, filling this gap and proposing a methodology that analyses flood impacts and the territorial context in which they occur to provide relevant data that can support flood risk management decision-making.
Knowledge regarding flood impacts has become a priority, justifying the allocation of resources both from public and private stakeholders in the construction of impact databases not only for flooding but also for hazards in general [17]. Moreover, diverse motivations drive stakeholders to characterize disaster impacts, but less is still known about the rank of the type of data that is more relevant to be collected, although recent research on this subject has been conducted showing, among other findings, the relevance of expressing both direct and indirect damages in monetary terms [18] (p. 121). Additionally, flood impact data collection still lacks standardization and systematization [19,20]. Flood impact data are therefore initial inputs in the definition of risk management strategies, adequate to the river and basin contexts in which the impacts occur. Flood impacts vary according to the location of the exposed elements and their vulnerability and ability to resist, adapt and recover [10]. Assets at risk vary with socioeconomic scenarios that justify that the degree of flood impacts cannot be dissociated from the territorial context in which they occur, particularly with urbanization trends (e.g., [21,22]).
In this paper, flood risk management strategies are assessed using fuzzy inference systems (FIS). Scientific literature exemplifies the application of fuzzy logic in flood risk management with distinct purposes: e.g., real-time forecasting by modeling the rainfall-runoff relationship [23], flood-diversion planning [24], modeling the participation of multi-stakeholders in flood risk management decision-making processes [25], flood risk evaluation and flood risk response measures [26,27].

1.2. Research Goals

In summary, the main goal of this study is to analyze the degree to which the characteristics of different hydrographical basins shape the historical record of flood impacts and how this understanding can result in the production of scientific information with the ability to improve decision-making in flood risk management [28].
Three specific research goals are defined that are sequential in terms of the applied methodology: (1) the analysis and characterization of flood impacts in selected hydrographical basins; (2) the analysis of the relationships between these impact patterns and the territorial contexts and (3) the inference of flood risk management strategies through the application of fuzzy logic analysis as a decision-making tool.

1.3. Selected Region for Analysis

The selected region for this study consists of three hydrographical basins—Vouga, Mondego and Lis in Central Portugal. The total area of the three basins is 11,194 km2 with an estimated population of approximately 1.5 million inhabitants [29], comprehending 86 municipalities and 753 parishes. This region historically registers a differentiation of flood impacts due to different natural and human territorial contexts. Recent dynamics in the following dimensions make the three selected basins an interesting region in which to test the above mentioned research goals:
(i) demographic changes: The area of the three basins is a territory of contrasted dynamics, particularly between a littoral more densely populated region and an inland region that is marked by ageing and depopulation. To a certain degree, this contrast is observed in the difference between Mondego basin’s negative population growth and Vouga and Lis basins’ positive growth (Table 1). In Mondego, 21 municipalities with positive growth are located mainly in the coastal, downstream sector of the basin.
Table 1. Recent dynamics in the three selected basins.
BasinPop. Growth 2001–2009 (%)Municipalities with Positive Pop. Growth 2001–2009Wild and Forest Burned Areas 1990–2009 (%)
Vouga+3.1258.1% (18 in 31)18.2
Mondego−0.0345.7% (21 in 46)36.5
Lis+7.0688.9% (8 in 9)18.4
(ii) urban concentration: Along with urban growth in coastal areas, a decrease in the population of rural settlements is observed everywhere, with people increasingly concentrating in the seat of the municipalities, causing the rapid urban sprawl in medium to small cities and the marked depopulation of small villages. This decrease is particularly significant in the Mondego basin.
(iii) land use changes: As a part of the above processes, agricultural land is reducing, and forest and semi-natural areas are increasing. Additionally, significant areas of each basin (Table 1) were recently affected by wild fires—the Mondego basin being the most affected (36.5% of total basin area), with consequences in the basin hydrological runoff processes.
(iv) water management: Water management in the study area is currently performed at several administrative and sectorial levels. The Vouga, Mondego and Lis basins are part of the same Hydrographical Basin Management Plan (PGBH). This instrument identifies the entities to which each distinct competence (planning, management, licensing, supervision and monitoring) is attributed [29]: (a) national level: Portuary Authority (AP), National Forestry Authority (AFN), Environmental and Spatial Planning General Inspection (IGAOT), Portuguese Environment Agency (APA), Nature and Biodiversity Conservation Institute (ICNB), and Environmental and Conservation Service (SPNA); (b) regional level: Regional Hydrographic Administration (ARH) and Coordination and Regional Development Commission (CCDR); and (c) local level: Local utilization and concession associations (e.g., irrigation and forestry) and municipalities. Several other governmental bodies assume responsibilities in the basin area, regarding fields such as civil protection, health, energy, geology, agriculture, industry, and R & D, both public and private. In total, the management of the three basins is performed by 39 entities with a seat at the Regional Hydrographic Council, representing distinct private and public administration sectors, acting at different geographical levels.
(v) flood risk management: This competence is addressed at the regional level through the PBGH. Each municipality develops multi-risk emergency plans in which flood risks are addressed according to the historical, political and social perception of the risk. For example, Coimbra municipality has a specific emergency plan for floods, but the majority of municipalities do not. The implementation of the Floods Directive [8] is currently in the phase of flood risk assessment, while flood risk management plans are to be completed until the end of 2015. Municipal spatial planning plays a relevant role in risk adaptation and mitigation. Structural flood defenses exist in some of the basins, with 23 dams being classified in terms of risk for population and assets in case of rupture, 14 of which are located in the Mondego basin, 9 in the Vouga basin and none in the Lis basin.
This context and the availability of flood impact data from a recently constructed national disasters database [30] stress the pertinence and challenges of flood risk management at the basin scale.

2. Data and Methods

2.1. Flood Impact Data and Analysis

The DISASTER project [30] provides an unprecedented set of hydro-geomorphologic-related disasters in Portugal, from which flood impact data were collected for the three basins: Vouga, Mondego and Lis.
The temporal scope of the collected data is the period 1930–2010, which is a sub-period of a wider one (1865–2010) that is covered in the DISASTER database. Because the press is the main information source of the database, the selected 80 hydrological years are considered the most robust in terms of regional and national newspaper coverage for the study area—the most relevant regional newspaper, “Diário de Coimbra”, was founded in 1930.
Each record in the DISASTER database is defined has an occurrence, meaning the geographically identifiable place where a harmful process related to flooding took place. The extracted data for this study consider only flood impacts that are caused by fluvial inundation both in rural and urban areas. Coastal flood impacts are not included.
Two categories of occurrences with impacts are considered: occurrences in which human consequences (OHC) are reported, which includes death, injury, disappearance, displacement or evacuation of one or more persons, and occurrences in which uniquely material consequences (OMC) are reported such as impacts in facilities and properties (e.g., farmland; road networks; commercial, industrial and residential buildings; and educational, health and public administration buildings). OMC are naturally more frequent than OHC.
An analysis of impacts from both of these databases is performed via the calculation of basic statistical output, such as histograms regarding the spatial and temporal distribution of occurrences and their characteristics. The historical mean recurrence interval (HMRI) ([31], also used in [32]) which represents the average time lapse between two occurrences is calculated. F-N curves (cf. [33] and, specifically regarding flood risk, [34]), expressing the relation between the frequency of a given OHC and the number of persons affected by it, are also calculated.

2.2. Analysis of the Territorial Basins Context

The three basins are morphologically contrasting, reflecting a wide lithological diversity and structural complexity. In addition, relevant are the climatic variations along with seasonal flow regimes, diverse hydrogeological potentialities, and agricultural and forestry soil capacities. The societal system displays a set of demographic and socioeconomic heterogeneity which reflects in the unequal concentration of productive infrastructures and urban densities [35]).
In this study, a set of variables is selected that attempts to express each basin’s characteristics and specificities, accounting for their linkage with flood impacts and risk management. Variables defined according to hydrographical criteria, i.e., at the basin level, are not abundant. Nevertheless, the PGBH presents a sufficient number of variables at that level that express the socioeconomic and hydrographical context, with the ability of differentiating the three considered basins (Table 2). Data from these 19 variables are compared by their normalized values (i.e., z-scores, which were calculated using the software SPSS®, New York, NY, USA) and analyzed in terms of the Pearson correlations that they present among themselves, and with seven variables extracted from the two impact databases (OHC and OMC) (cf. Section 3.2). The results of this analysis are then used in the evaluation of two relevant criteria for decision-making.
Table 2. Variables considered in the analysis of the territorial basins context. Source: Hydrographical Basin Management Plan—Vouga, Mondego and Lis basins [29].
Socio-Economic VariablesHydrographical Variables
1-Population density (Inhabitants/km2)I-Basin area (km2)
2-Housing density (Houses/km2)II-Compacity Index (Kc)
3-Aging indexIII-Drainage network length (km)
4-Population without qualifications (% of total)IV-Drainage density (km/km2)
5-Unemployment rate (%)V-Average basin slope (%)
6-Purchase power (related to the national mean = 100)VI-Average roughness coefficient
7-Annual turnover (€)VII-Average annual rainfall (mm)
8-Density of companies (No. of companies per km2)VIII-Average annual flow (mm)
9-Urban soil (% of total basin area)IX-Number of dams
X-Flood prone area (% of total basin area)

2.3. Assessment of Flood Risk Decision-Making Criteria

Flood risk management is a complex process involving a large number of interveners and strategies. In this study, a simplification is made in order to consider only two of the diverse criteria that are used for supporting decision-making in flood risk management: time and resources. These criteria must be understood in relative terms between the three basins and under the perspective of their availability and necessity. Time and resources are relevant criteria in a wide range of management decision-making processes (a thorough variety of examples are provided in [36] and specifically in flood risk management (e.g., [28]), from which other sub-criteria can be defined—acceptability level, for example, is a criterion closely related to time. Time expresses both the available time to intervene and the necessary time to implement measures. Time can be defined as the opposite of urgency, i.e., the higher the urgency the lower the time to act. Some flood risk management strategies take longer to be implemented while others can be implemented in the short term. Resources, as a criteria, expresses the necessary means to implement a given strategy or measure. Structural measures like flood defenses and dams usually require greater amount of resources than other strategies classified as “soft” measures. In a given risk management process, resources might exist at an adequate level to tackle the problem, but the decision regarding the time to act can be defined in a medium or long term if the problem is judged to be not urgent.
Fuzzy logic is widely applied in decision-making processes that deal with high levels of uncertainty and ambiguity [37]. In this study, two fuzzy inference systems (FIS) were therefore set up for the two criteria. The FIS is applied using the software FISPRO, which was developed by the French Institut National de la Recherche Agronomique (INRA) [38]. A FIS requires the definition of input and output data, and rules that express the possible combinations of the different input data values in order to obtain a given output.
In this application two FIS are set up: one for the time and other for the resources criteria. Input data for each of them are, respectively, the variables that express the necessity of resources and the characteristics of the impacts (cf. Table 3). The outputs are the two considered criteria. The variables used to represent the time criteria are, at first hand, representing urgency, e.g., the higher the casualties the higher the urgency. In order to achieve the crisp value for the criteria time, the resulting value is subtracted to 1 to express the time to act, i.e., the greater the urgency, the lesser the available or desirable time to act in flood risk management. From the initial set of 19 variables that represent the territorial context (cf. Table 2), only 5 are used in the fuzzy logic analysis. This selection is based (i) on the interpretation of the role of each variable according to the criteria of resources and urgency and (ii) on the Pearson correlation values between the impact variables and the socio-economic and geophysical variables. The other 3 variables represent the characteristics of the flood impacts and were calculated from the raw fields of the considered OHC and OMC database: number of dead, disappeared, evacuated and displaced persons, and number of occurrences with human and material consequences (Table 3).
Table 3. Input data and respective decision-making criteria used in the FIS.
Input DataLisMondegoVougaDecision-Making Criteria
Basin area (km2)850.16658.63685.2Resources
Purchase Power (national mean = 100)84.0067.0073.00
Population density (Inhabitants /km2)222.12105.70174.49
Urban soil (% of total basin area)7.502.405.70
Flood prone area (% of total basin area)2.472.662.52Urgency
No. of dead and disappeared per105 Inhabitants2.654.263.89
No. of evacuated and displaced per 105 Inhabitants99.03225.9175.42
No. of OHC and OMC per km20.240.330.19
Fuzzification is the first step of a FIS in which input data values are transformed into membership degrees. The next step of the FIS consists in setting up inference engines based on rules that express different combinations of the selected variables under the perspective of the two criteria. For example, the population density is valued as a requisite for a low (1), medium (2) and high (3) need for resources. The rules express the relationship between the input variables using conditional statements, where values ranging 1 to 3 are summed. Therefore, each output value will theoretically range between 4 and 12, since each output is explained by four variables. According to the number of variables that represent input data 4 in each FIS, and the values they assume ranging from 1 to 3, a total of 81 rules are defined. Finally, the defuzzification step consists in introducing again the exact value of each basin (cf. Table 3) in the respective FIS and, according to the membership function defined by the rules, a crisp value between 0 and 1 is returned for each of the criteria. This step returns the position (low, medium or high) of each basin in terms of the resources and urgency criteria. As early explained, the crisp value of this later criterion is subtracted by 1 to express the time instead of urgency.

3. Results

3.1. Flood Impacts

Flood impacts are expressed in 3073 occurrences, of which 238 (7.7%) present human consequences (Table 4). In 753 parishes, only 282 registered any of the considered flood impacts, either material or human, in the 80-year period.
Table 4. Resume of flood impacts in the constructed databases.
BasinNo. OHC + OMCNo. OHCNo. Deaths and Disapp.No. EvacuatedNo. Displaced
Vouga689532541768
Mondego217916630750840
Lis20519514245
Total3073238601309953
The inter-annual distribution of these same variables is highly irregular (Figure 1A–D). Nevertheless, the number of occurrences seems to present a wave oscillation with fewer occurrences in the 1930s, partially in the 1940s, and again in the 1970s, 1980s and partially in the 1990s. This pattern is not as clear in the last two graphics (Figure 1C,D). In fact, the number of dead and disappeared persons (D & D) shows a decrease tendency during the period, while the number of evacuated and displaced persons (E & D) increased (Figure 2B–D).
Figure 1. Inter-annual distribution of total occurrences (A); number of OHC (B); number of D & D persons (C); and number of E & D persons (D).
Water 07 00480 g001
Figure 2. Relative frequencies by decade of the No. of occurrences with human consequences (OHC) (A); and No. of occurrences with only material consequences (OMC) (B).
Water 07 00480 g002
Figure 2B confirms the general existence of two periods with a high No. of OMC: the 1950s and 1960s, and the 1990s and 2000s. The relevance of these last two decades is especially notable in the Vouga and Lis basins.
The Lis basin was more affected by OHC in the 1960s and 2000s, while OMC became more frequent in the last two decades. The worst decade for the Mondego basin in terms of the number of occurrences of both OHC and OMC was 2001–2010.
The number of occurrences is not, however, correlated with the number of affected people either by death, disappearance, evacuation or displacement (cf. Figure 3 and Figure 4). The deaths and disappearances show a reducing trend, except in the Lis basin (although this basin only registered 5 D & D persons during this period), while the number of evacuations and displacements increased significantly in the last decade. This reading is generally confirmed by the relative frequencies (Figure 4A,B).
Figure 3. Absolute frequency by decade of dead and disappeared (D & D) persons (A) and evacuated and displaced (E & D) persons (B).
Water 07 00480 g003
Figure 4. Relative frequency by decade of dead and disappeared (D & D) persons (A) and evacuated and displaced (E & D) persons (B).
Water 07 00480 g004
In absolute terms, the Mondego basin presents the lowest HMRI, i.e., the necessary number of years so that one D & D, one evacuated or one displaced person might occur (Table 5). With the exception of the occurrence of D & D in the Lis basin, the probability of registering at least one of these losses from the 5-year return period forward is always higher than 0.79. Evacuations are more frequent than displacements in the Vouga and Lis basins but not in the Mondego basin.
Table 5. HMRI and probability from 1 to 100 year return period of having at least one D & D, one evacuated and one displaced person.
BasinsVariablesHMRI *Probability by Return Period
1-Year5-Year10-Year25-Year50-Year100-Year
VougaD & D3.200.2680.7900.9561.0001.0001.000
Evac0.190.9951.0001.0001.0001.0001.000
Disp1.180.5730.9861.0001.0001.0001.000
MondegoD & D2.580.3210.8560.9791.0001.0001.000
Evac0.091.0001.0001.0001.0001.0001.000
Disp0.101.0001.0001.0001.0001.0001.000
LisD & D16.000.0610.2680.4650.7900.9560.998
Evac0.560.8311.0001.0001.0001.0001.000
Disp1.780.4300.9400.9961.0001.0001.000
Three basinsD & D1.310.5340.9781.0001.0001.0001.000
Evac0.061.0001.0001.0001.0001.0001.000
Disp0.081.0001.0001.0001.0001.0001.000
Note: * HMRI: Historic Mean Recurrence Interval, in years (Coe et al., 2000 [31]).
Considering the proximity and contiguity of the three basins, it is interesting to note the distinct monthly distribution of the percentage of OMC as well as of the number of D & D and E & D persons (Table 6).
Table 6. Absolute and relative frequencies of the number of D & D and E & D persons, and number of occurrences uniquely with material consequences (OMC), by month.
TypeBasins OctoberNovemberDecemberJanuaryFebruaryMarchAprilMayJuneJulyAugustSeptemberTotal
OHC: D & DVougaAbs104126100100025
%4.00.016.048.024.04.00.00.04.00.00.00.0100.0
MondegoAbs43734210220230
%13.310.023.310.013.36.73.30.06.76.70.06.7100.0
LisAbs0000210020005
%0.00.00.00.040.020.00.00.040.00.00.00.0100.0
OHC: E & DVougaAbs513982418435063000485
%1.02.720.249.717.37.20.01.20.60.00.00.0100.0
MondegoAbs2602610610499021911153001590
%16.41.66.766.05.71.30.60.70.90.20.00.0100.0
LisAbs5036756180020000187
%26.719.340.13.29.60.00.01.10.00.00.00.0100.0
OMCVougaAbs5870992299529171711146636
%9.111.015.636.014.94.62.72.71.70.20.60.9100.0
MondegoAbs3372202033722281465511812833301432013
%16.710.910.118.511.37.32.75.96.41.61.57.1100.0
LisAbs563219111085442332186
%30.117.210.25.95.44.32.72.22.21.11.617.2100.0
After summer, the number of OMC begins to increase earlier (in September) than does the number of OHC, particularly in the Lis basin. This pattern may require local planners and basin managers to define regular, seasonal measures of risk reduction and prevention. In general, OHC are more frequent from October to February, with the exception of November.
Based on the database of OHC, F-N curves were calculated (Figure 5). The worst hydrological years regarding D & D persons occurred in the Vouga basin—two OHC with four fatalities each—to which a 0.025 annual frequency is attributed. Mondego basin assumes preponderance in the OHC with one fatality. Regarding E & D persons, the three basins display similar patterns in the F-N curve regardless of the number of affected persons. Lis basin is the less severe in both cases in terms of these impacts.
Figure 5. F-N curves for the number of fatalities (D & D) (A); and evacuated and displaced persons (B).
Water 07 00480 g005
As expected, the geographical distribution of flood impacts in the three basins shows a strong localized and linear pattern, according to the location of the main floodplains and cities. This concentration is, however, more notable in relation to material impacts (OMC) than to human consequences, particularly regarding occurrences with casualties which occur more sparsely (cf. Figure 6 and Figure 7). Of the 42 parishes with D & D persons, 15 are located in the Vouga basin, while this type of loss affects 4 parishes in the Lis basin and 23 in the Mondego basin.
Inside each basin, the regional dichotomy between the downstream and upstream areas is more evident in terms of D & D persons than with regard to evacuated and especially displaced persons. All of the occurrences with D & D persons that were described in newspapers allow for their georeferencing at least to the level of the parish, which allows concluding about the high completeness and quality of the database.
Figure 7 represents the number of times each of the six types of material impacts is mentioned. Impacts in roads are proportionally higher in the Mondego basin, while the Vouga presents a higher proportion of references to farmland impacts and the Lis in regard to residential building impacts.
Figure 6. Relation between the main cities and rivers and the occurrences with human consequences, by parish, 1930/1931–2009/2010. (A) Vouga, Mondego and Lis basins; (B) No. of D & D persons; (C) No. of displaced persons; (D) No. of evacuated persons.
Water 07 00480 g006
Figure 7. Occurrences with material consequences by parish (A) and type of material impact by basin (B).
Water 07 00480 g007

3.2. Relationship between Flood Impacts and Basin Characteristics

The establishment of relationships between impacts and basin characteristics is attempted by analyzing the z-scores of the three considered categories of variables: socioeconomic and hydrographical context data, and impact data (Figure 8). In contrast, the Mondego basin presents the most serious impacts regarding both human and material consequences. Mondego is also the basin in which socioeconomic conditions are generally the worst—this basin presents the highest unemployment rates, lowest economic dynamics and purchase power, although it is not the most densely populated or urbanized. Hydrographical conditions seem to play unclear and opposite roles in the explanation of the registered flood impacts: while the Mondego basin presents the highest percentage of flood-prone area, mean slope, area and drainage length, some other variables should contribute to the attenuation of flood frequencies and impacts in this basin, such as compacity (higher Kc values tend theoretically to reduce peak flows), roughness coefficient and number of dams.
Figure 8. Comparison of Vouga, Mondego and Lis basins in terms of socio-economic (red shadow); hydrographic (green shadow) and impact variables (blue shadow).
Water 07 00480 g008
Although the number of individuals is reduced, the Pearson correlation coefficients (Table 7) are significant between (1) variables that express urban and demographic dynamics and variables that are related to the distribution of mortality (D & D persons) and (2) flood-prone areas and the total number of E & D persons (but not when E & D is related to the area). In several other pairs of variables, the correlation is at least greater than 0.9. It is interesting to note that when the impact variables are related to the area (sq.km) or population (105 inhabitants), Pearson coefficients are weak, except for the number of D&D persons.
Figure 9 presents the relationship between the impacts, area and population. The area and population strongly define the pattern of the distribution of the number of occurrences—both total and OHC only—with a higher linearity regarding the area (Figure 9A) and an exponential type correlation regarding the population (Figure 9D). The total number of fatalities appears to be more correlated with the population than with the area (Figure 9B,E), although the opposite occurs regarding the frequency of occurrences with one fatality (Figure 9C,F).
Table 7. Pearson correlation matrix between territorial forcers and impact variables.
VariablesNo. of OHC Per km2No. of OHC and OMC per km2No. of D & D PersonsNo. of D & D Per 105 InhabitantsNo. of E & D PersonsNo. of E & D Persons Per km2No. of E & D Persons Per 105 Inhabitants
1-Population density−0.35−0.69−0.91−0.92−0.98−0.27−0.84
2-Housing density0.04−0.36−1.00 *−1.00 *−0.820.12−0.57
3-Aging index0.200.570.960.970.930.120.76
4-Pop. without qualifications−0.170.231.000.990.74−0.250.46
5-Unemployment rate0.510.810.810.831.00 *0.440.93
6-Purchase power−0.08−0.47−0.99−0.99−0.880.00−0.67
7-Annual turnover0.24−0.17−0.99−0.98−0.690.31−0.40
8-Density of companies0.17−0.23−1.00−0.99−0.740.25−0.46
9-Urban soil−0.40−0.73−0.88−0.89−0.99−0.33−0.88
I-Basin area0.260.620.940.950.950.180.79
II-Compacity Index (Kc)0.640.890.720.740.990.570.97
III-Drainage network length0.220.590.950.960.940.140.77
IV-Drainage density−0.45−0.060.930.920.51−0.520.19
V-Mean basin slope0.320.670.920.930.970.250.83
VI-Mean roughness coefficient0.160.540.970.980.920.080.73
VII-Mean annual rainfall−0.87−0.610.560.53−0.06−0.91−0.40
VIII-Mean annual flow−0.65−0.300.810.790.29−0.71−0.06
IX-Number of dams0.090.470.990.990.890.000.67
X-Flood prone area0.470.780.840.861.00*0.400.91
Note: * Correlation is significant at the 0.05 level (2-tailed).
Figure 9. Relation between area and population and the number of occurrences (A,D); the number of fatalities (D & D persons) (B,E); and the frequency of occurrences with one fatality (C,F).
Water 07 00480 g009

3.3. Criteria Evaluation for Flood Risk Management Strategies

The main output of this section is the result of the two designed FIS (Figure 10). This figure represents the crisp values that are returned for each criterion—Resources and urgency—Based on the established rules. Using the value that each basin presents in the considered variables, their respective degree of membership in terms of resources and urgency is returned. Therefore, for example, it is possible to verify that the Lis basin would comparatively be the most demanding in terms of resources, which is justifiable by the higher population density and urbanized area. Nevertheless, this basin is the least urgent in terms of addressing flood risk management because impact data, such as the No. of D & D persons and the No. of E & D persons per 105 inhabitants, do not represent the same seriousness of the other basins. Mondego basin features the opposite scenario in terms of these criteria: it is comparatively less exposed—i.e., considering its higher area, it has comparatively less assets to protect—But human and material consequences represented by the No. of OHC and OMC and the No. of D & D and E & D persons per 105 inhabitants, as well as the percentage of flood-prone areas, are also comparatively higher, thus requiring more immediate action.
The presented results are further developed and discussed in the following section, where flood risk management strategies are identified and prioritized according to the position of the three basins in regard to these two outputs.
Figure 10. Defuzzification step using the FISPRO program.
Water 07 00480 g010

4. Discussion

The discussion will focus both on the results and the adopted methodology.
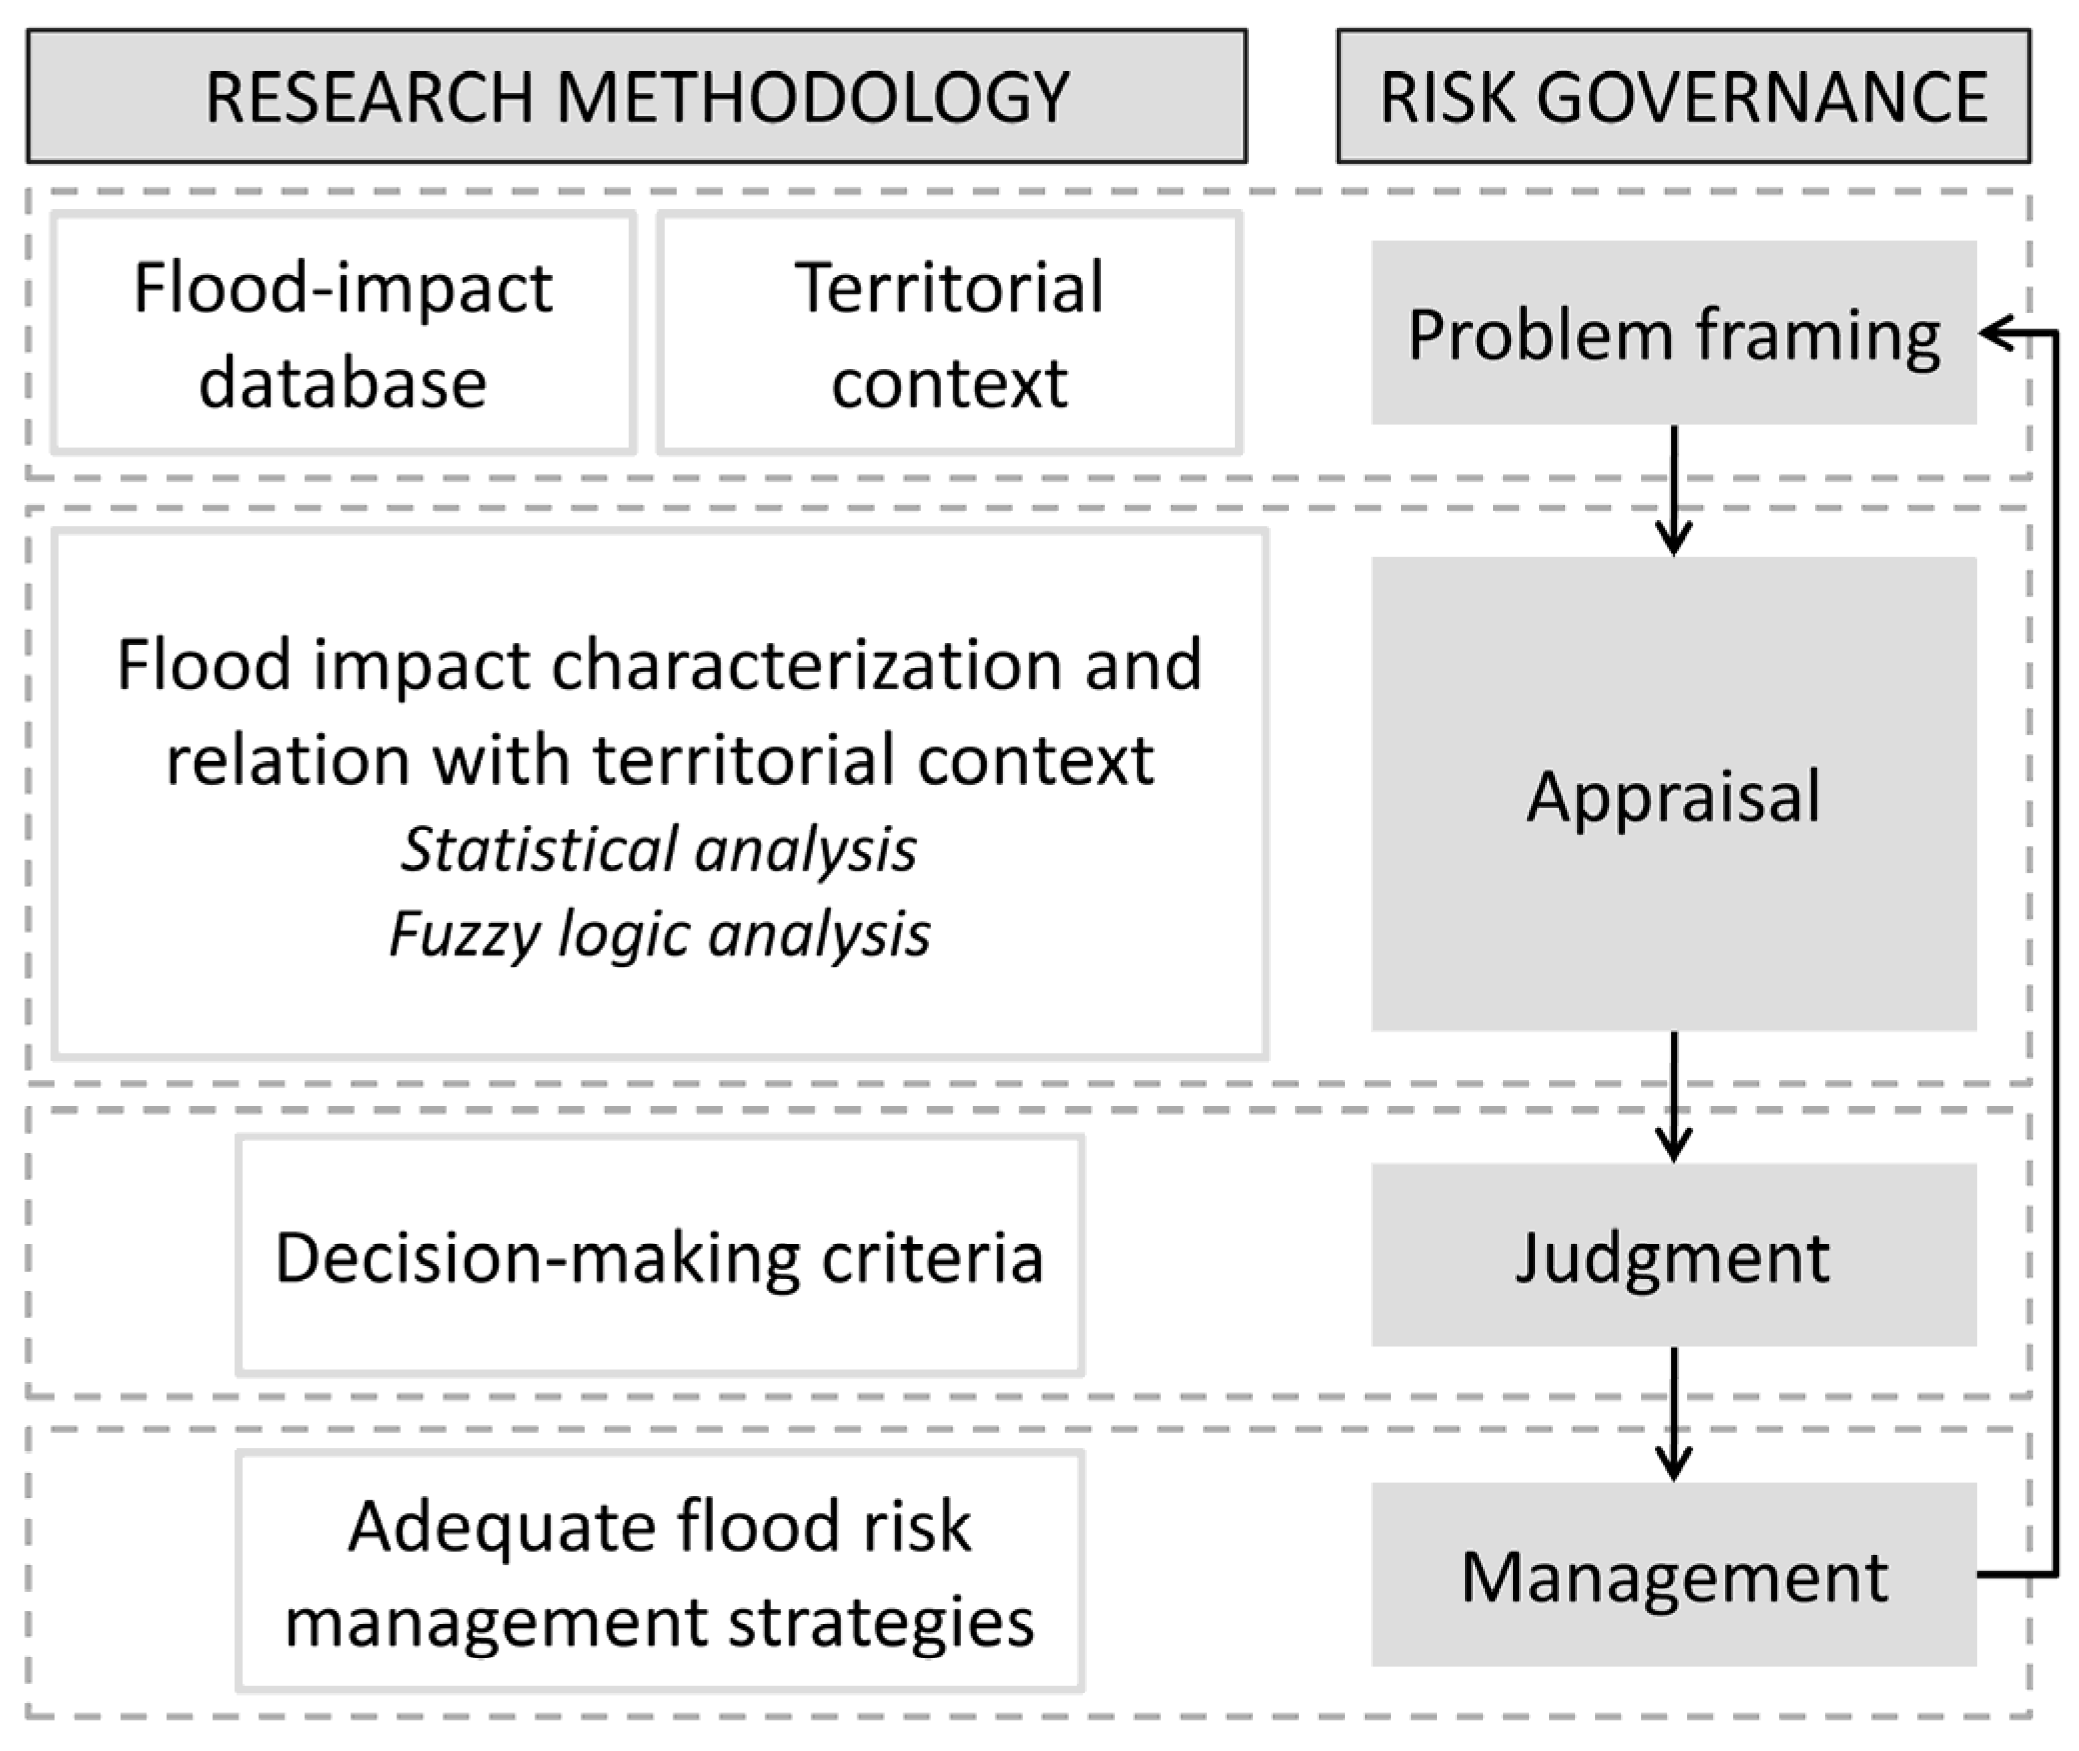
A parallel between the risk governance components [39] and the research methodological approach that was followed in this study is illustrated in Figure 11. Flood risk governance is not obviously as simple as this representation may suggest (e.g., [40]); nevertheless, the purpose of establishing this parallelism is to support the relevance of visioning and to provide theoretical guidance over the entire research process from the point of view of risk governance.
Figure 11. Risk management framework of the study methodological approach.
Water 07 00480 g011
Cyclicity is a key feature of risk governance models. In the adopted methodology, cyclicity is understood as the continuous monitoring and evaluation of the efficiency of the preconized flood risk management strategies. This is achievable through basin differentiation based either on the updating of the flood impact database or on the monitoring of changes that occur in the territorial characteristics of the basin. Once again, many other factors (e.g., social, political and economic) influence the decision about flood risk management strategies; however, this fact does not negate the validity of the established correspondence.
Flood risk governance in Portugal is experiencing a shift within the implementation of the “Floods Directive”, following a holistic approach combining assessment, management and participation benchmarks. Concerning the assessment component, the role of flood impact databases can be determined based on the perspective of the elaboration of flood risk maps. This type of databases assist in the characterization of the location, type and recurrence of a given set of impacts that can be incorporated in risk maps, adding value to the content required in the Floods Directive. However, caution must exist when using impact data in the cartography of flood hazard. This means, on the knowledge of the physical process of the flood and its probability, because the nature of impact databases is rooted on the consequence and not on the flood process.
Considering that a more operational use of historical impact databases by decision-makers is constrained partly by the lack of practical guidelines about their potential applications [41], the presented methodology can be further explored in order to assist the preparation of flood risk planning instruments. This lack is a concern also expressed in the UNISDR consultations regarding the post Hyogo Framework for Action 2005–2015, where a need to improve and standardize data-supported decision-making is identified [42].
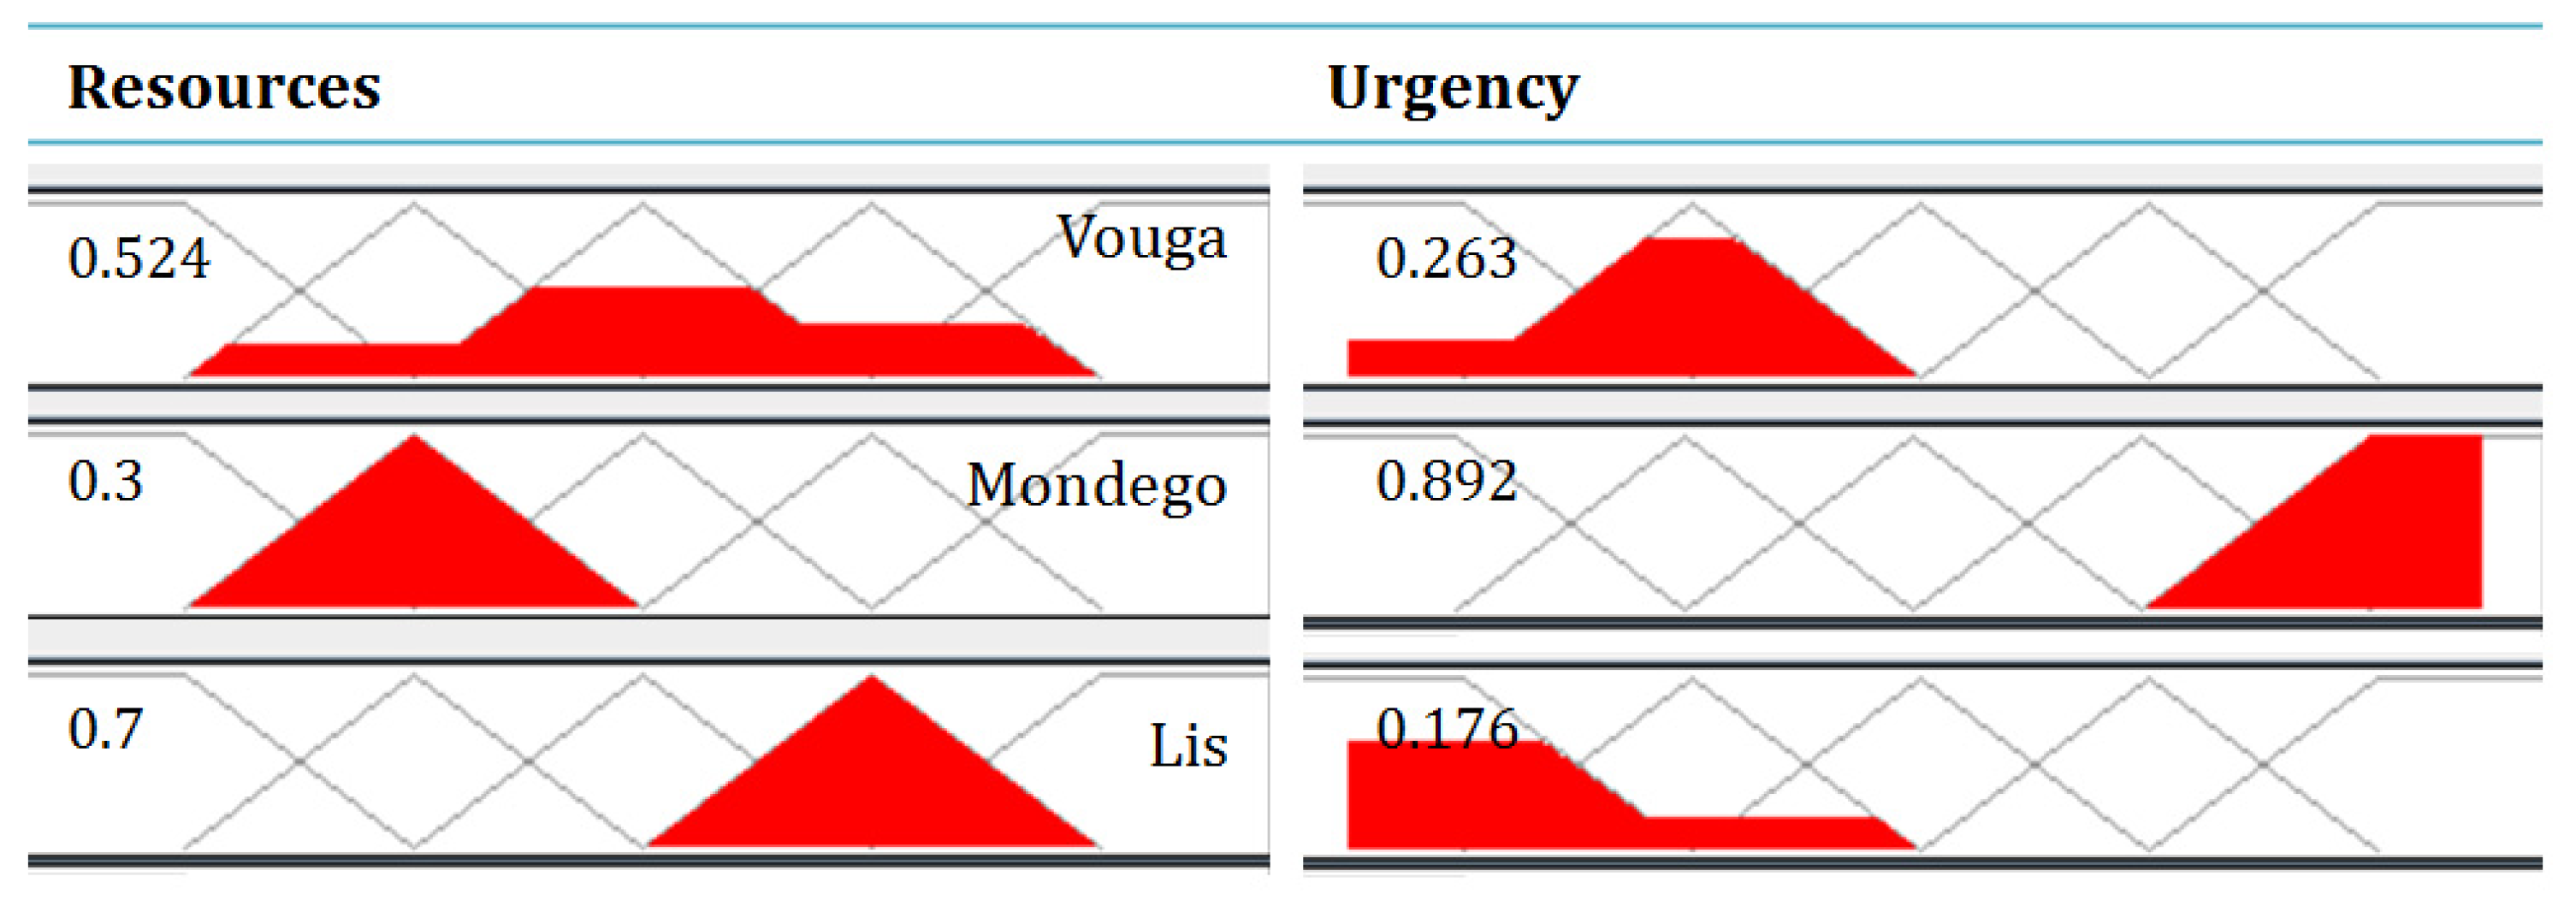
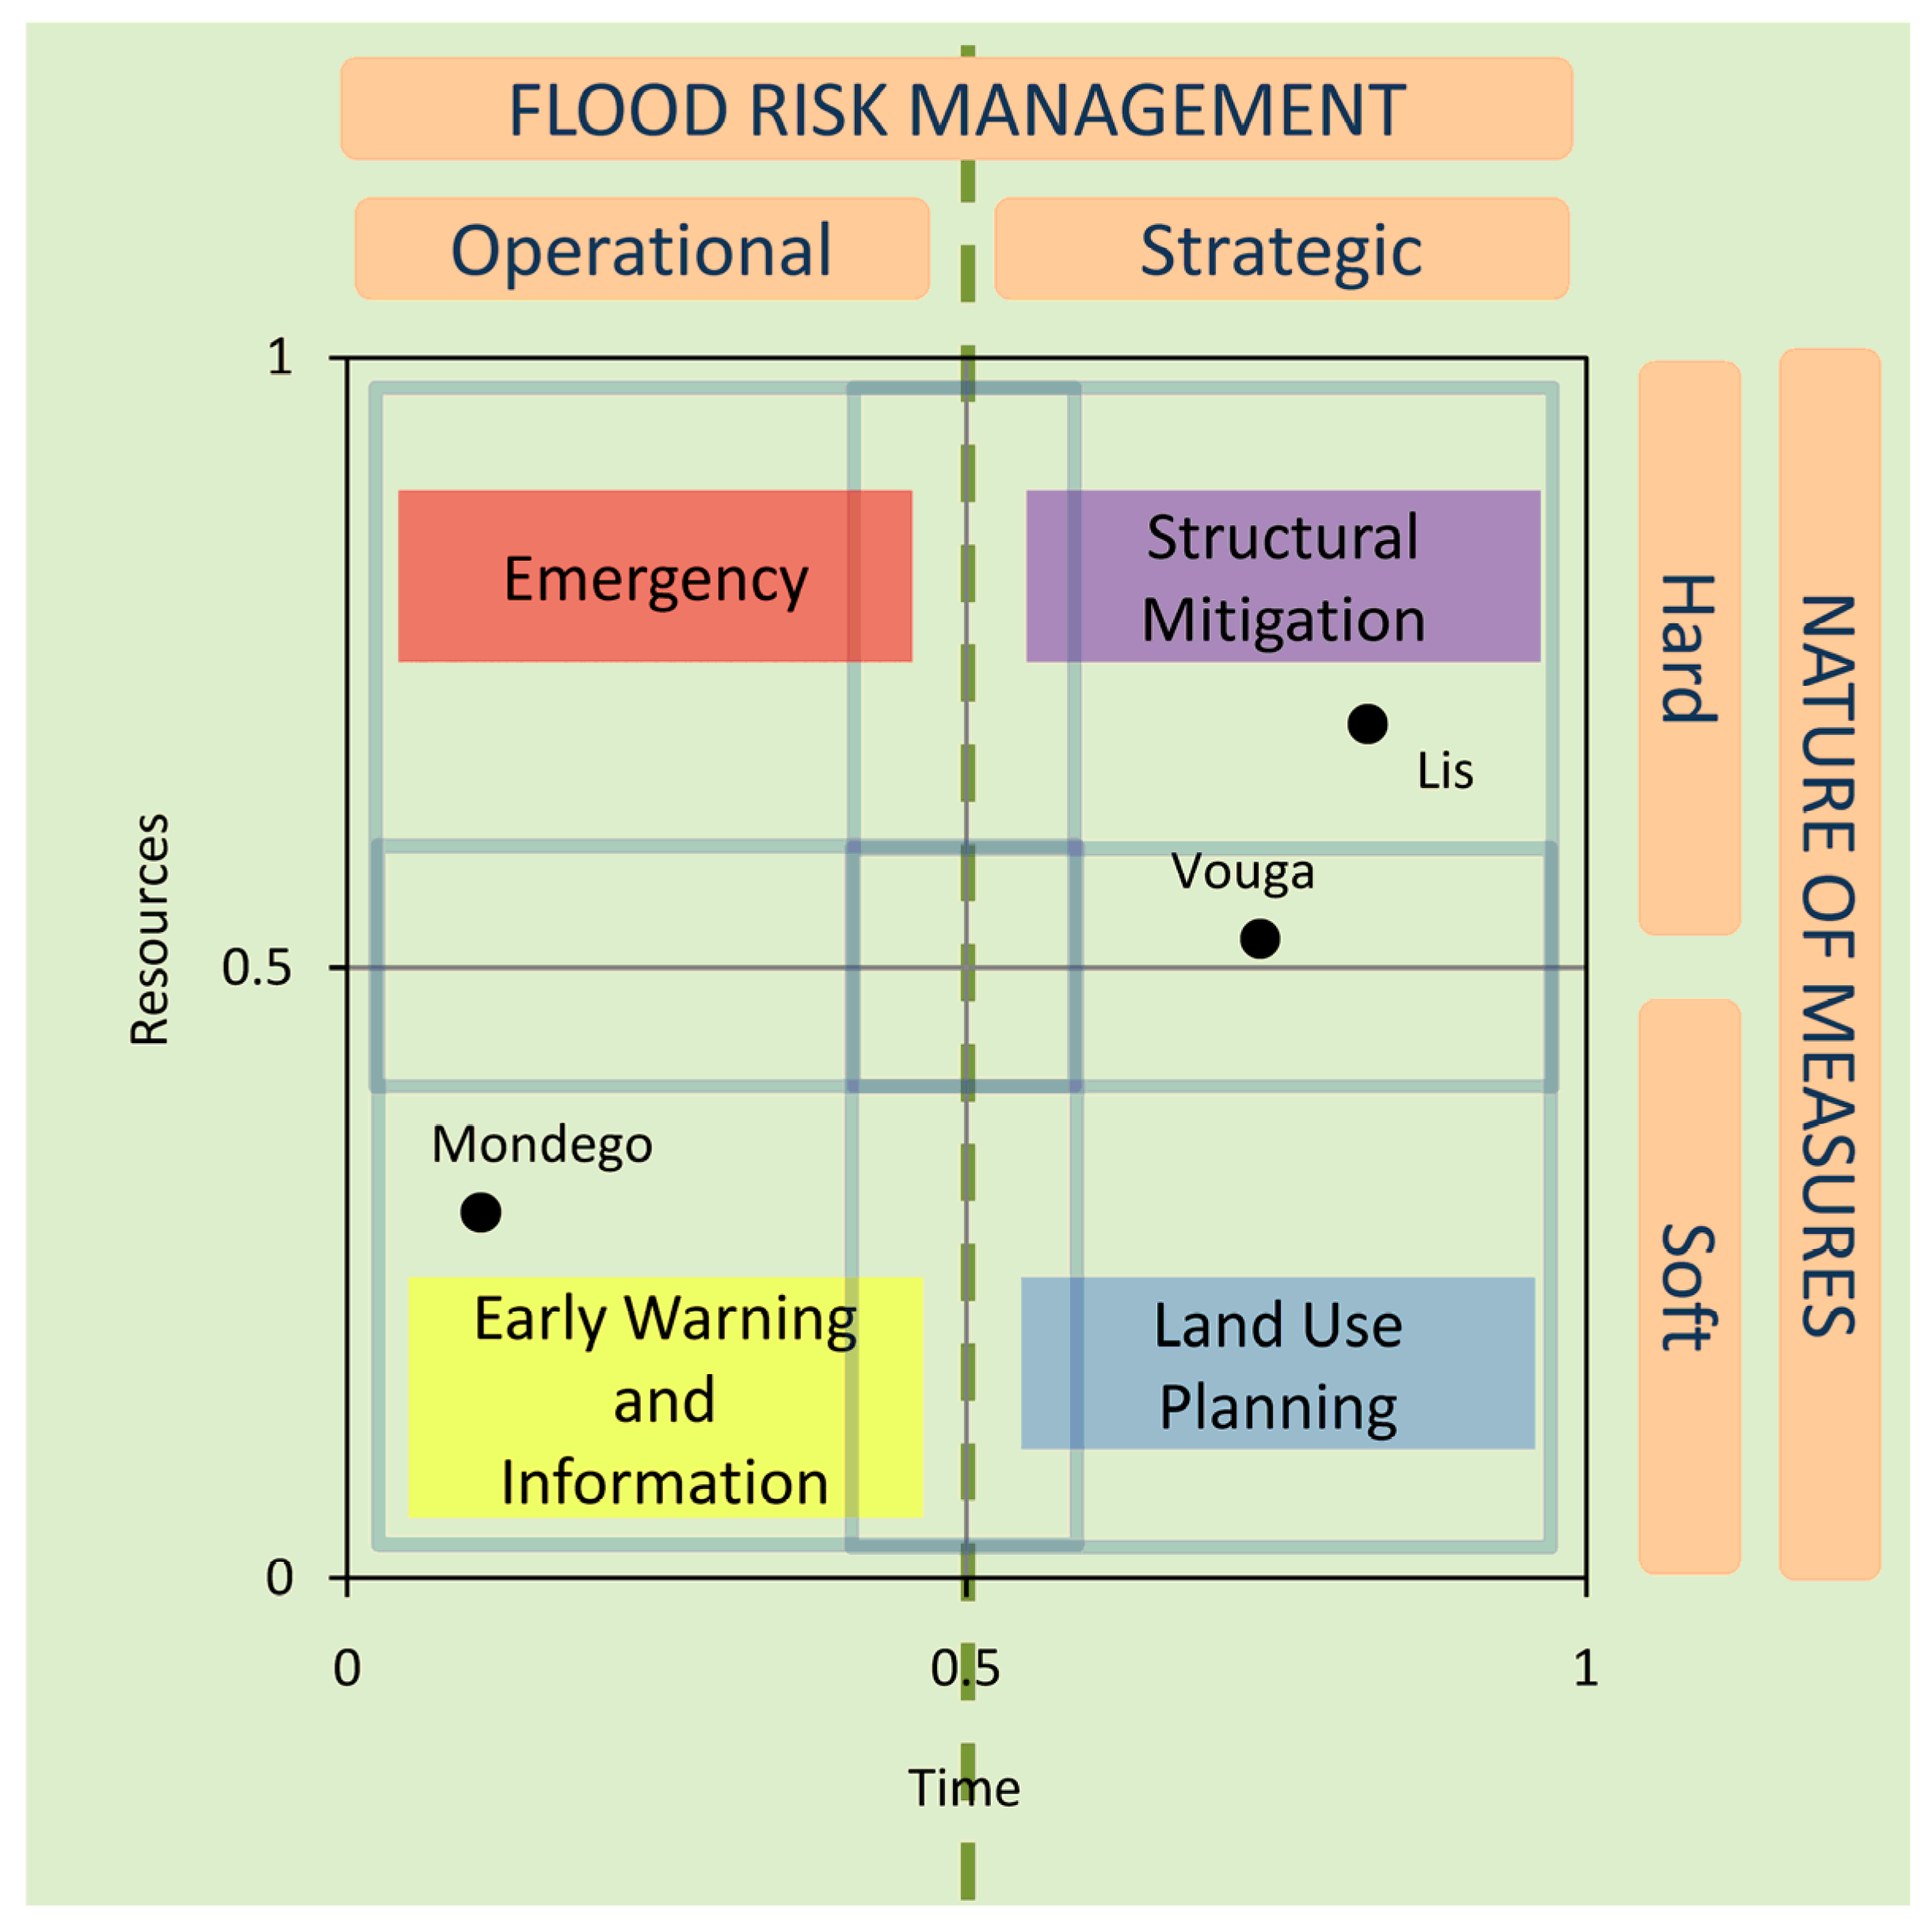
One of the proposed research goals was the inference of flood risk management strategies through the application of fuzzy logic analysis as a decision-making tool. This attempt is illustrated in Figure 12, in which fuzzy membership crisp values for resources and time criteria are expressed. As referred in Section 2.3, the criteria time is derived from urgency.
Figure 12. Inference of flood risk management strategies upon the FIS results.
Water 07 00480 g012
The strategies presented in Figure 12 are classified according to the nature of the measure—hard and soft, and to the type of risk management—perational and strategic. The four considered strategies: emergency, early warning and information, structural mitigation and land use planning are identified and recognized as major supporting tools in flood risk management (e.g., [43] (pp. 8–9), [44] (pp. 82–83)). Other strategies could be foreseen, such as insurance, but the presented perspective is that of the public sector practitioners who are responsible for the management of flood risk at the hydrographic basin scale. The position of each basin in Figure 12, given by the respective membership crisp value, represents more a prioritization of strategies than an “all-or-nothing” type interpretation, meaning that none of the strategies should be completely disregarded in favor of the others.
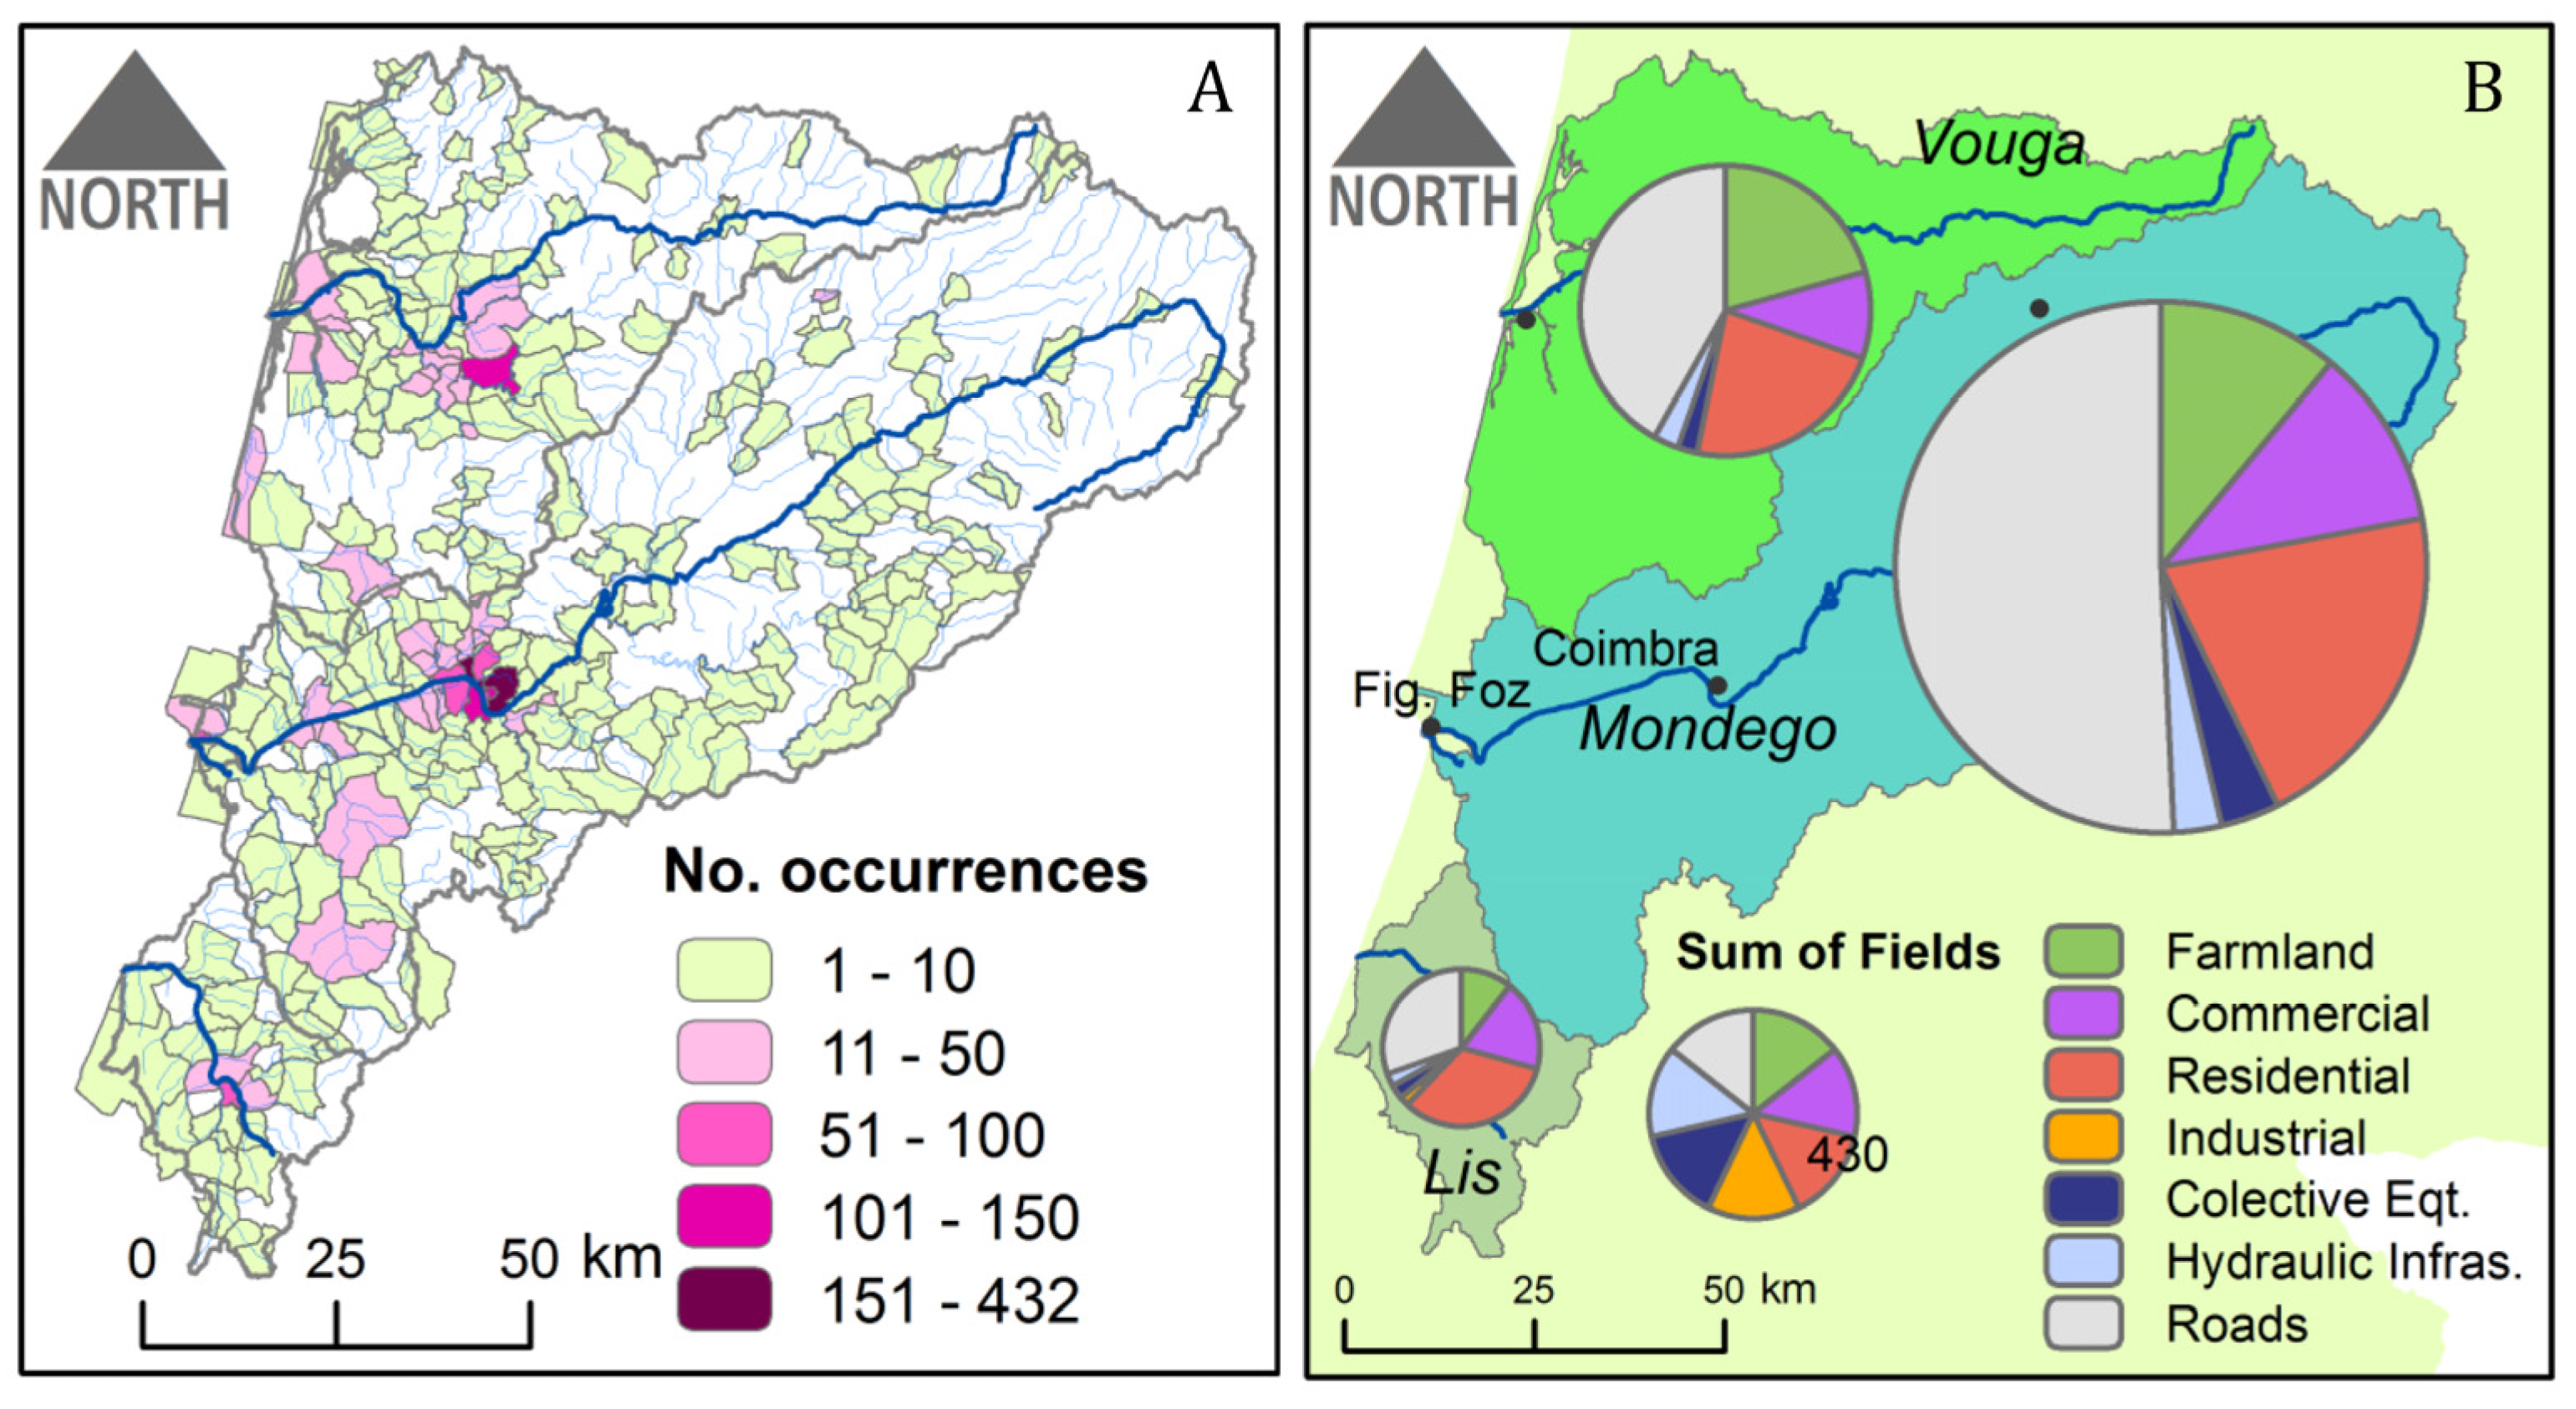
The territorial dynamics and the flood impact pattern of the Mondego basin would require comparatively less resources, i.e., low capitally intensive solutions, but of rapid implementation due to the high severity of impacts, such as early warning systems. These systems face the constraints of data availability and readiness. In this regard, the PGBH assumes the objective of improving the network of river flow gauge stations—currently, only 12 river flow gauge stations dispose of more than 20 years’ worth of records of maximum peak flows (8 in Mondego, 4 in Vouga and none in the Lis). By improving the network of river flow gauge stations, early warning systems can depend less on the meteorological forecast and on data provided by rain gauge stations, and more on real-time river flow data. Along with this priority and based on the availability of resources, emergency strategies must continue to be combined with the other risk management strategies. With time, relocation and other land-use planning measures could also contribute to the reduction of impacts, namely those with severe human consequences—as the DISASTER database mortality figures appear to suggest—by reducing the percentage of urbanized areas in floodplains. For this basin, structural mitigation, as a strategic approach and a hard measure, is the least recommended.
The Lis basin represents somewhat the Mondego basin’s opposite context. Lis is marked by comparatively greater exposure, although the impacts are mostly related to material consequences instead of human consequences. Given the small area and the economic vitality of this basin, priority can be attributed to structural mitigation. Structural defenses, such as small dams, can play a moderate role in risk reduction for progressive floods, but in small basins, they can have a significant role regarding flash floods by reducing and delaying flood peak flows. According to the PGBH [29], only one dam in the study area located in the Mondego basin has the capacity to attenuate progressive floods, while the remaining dams, mostly located in the Mondego basin as well, can act during flash floods. The obtained results may indicate that the decision-makers of the Lis and Vouga basins can ponder to articulate this type of strategy with other regional water resources strategies in the energy sector, for example. Nevertheless, a strategy that relies on demanding an allocation of resources must be compatible with medium- to long-term emergency and land-use planning.
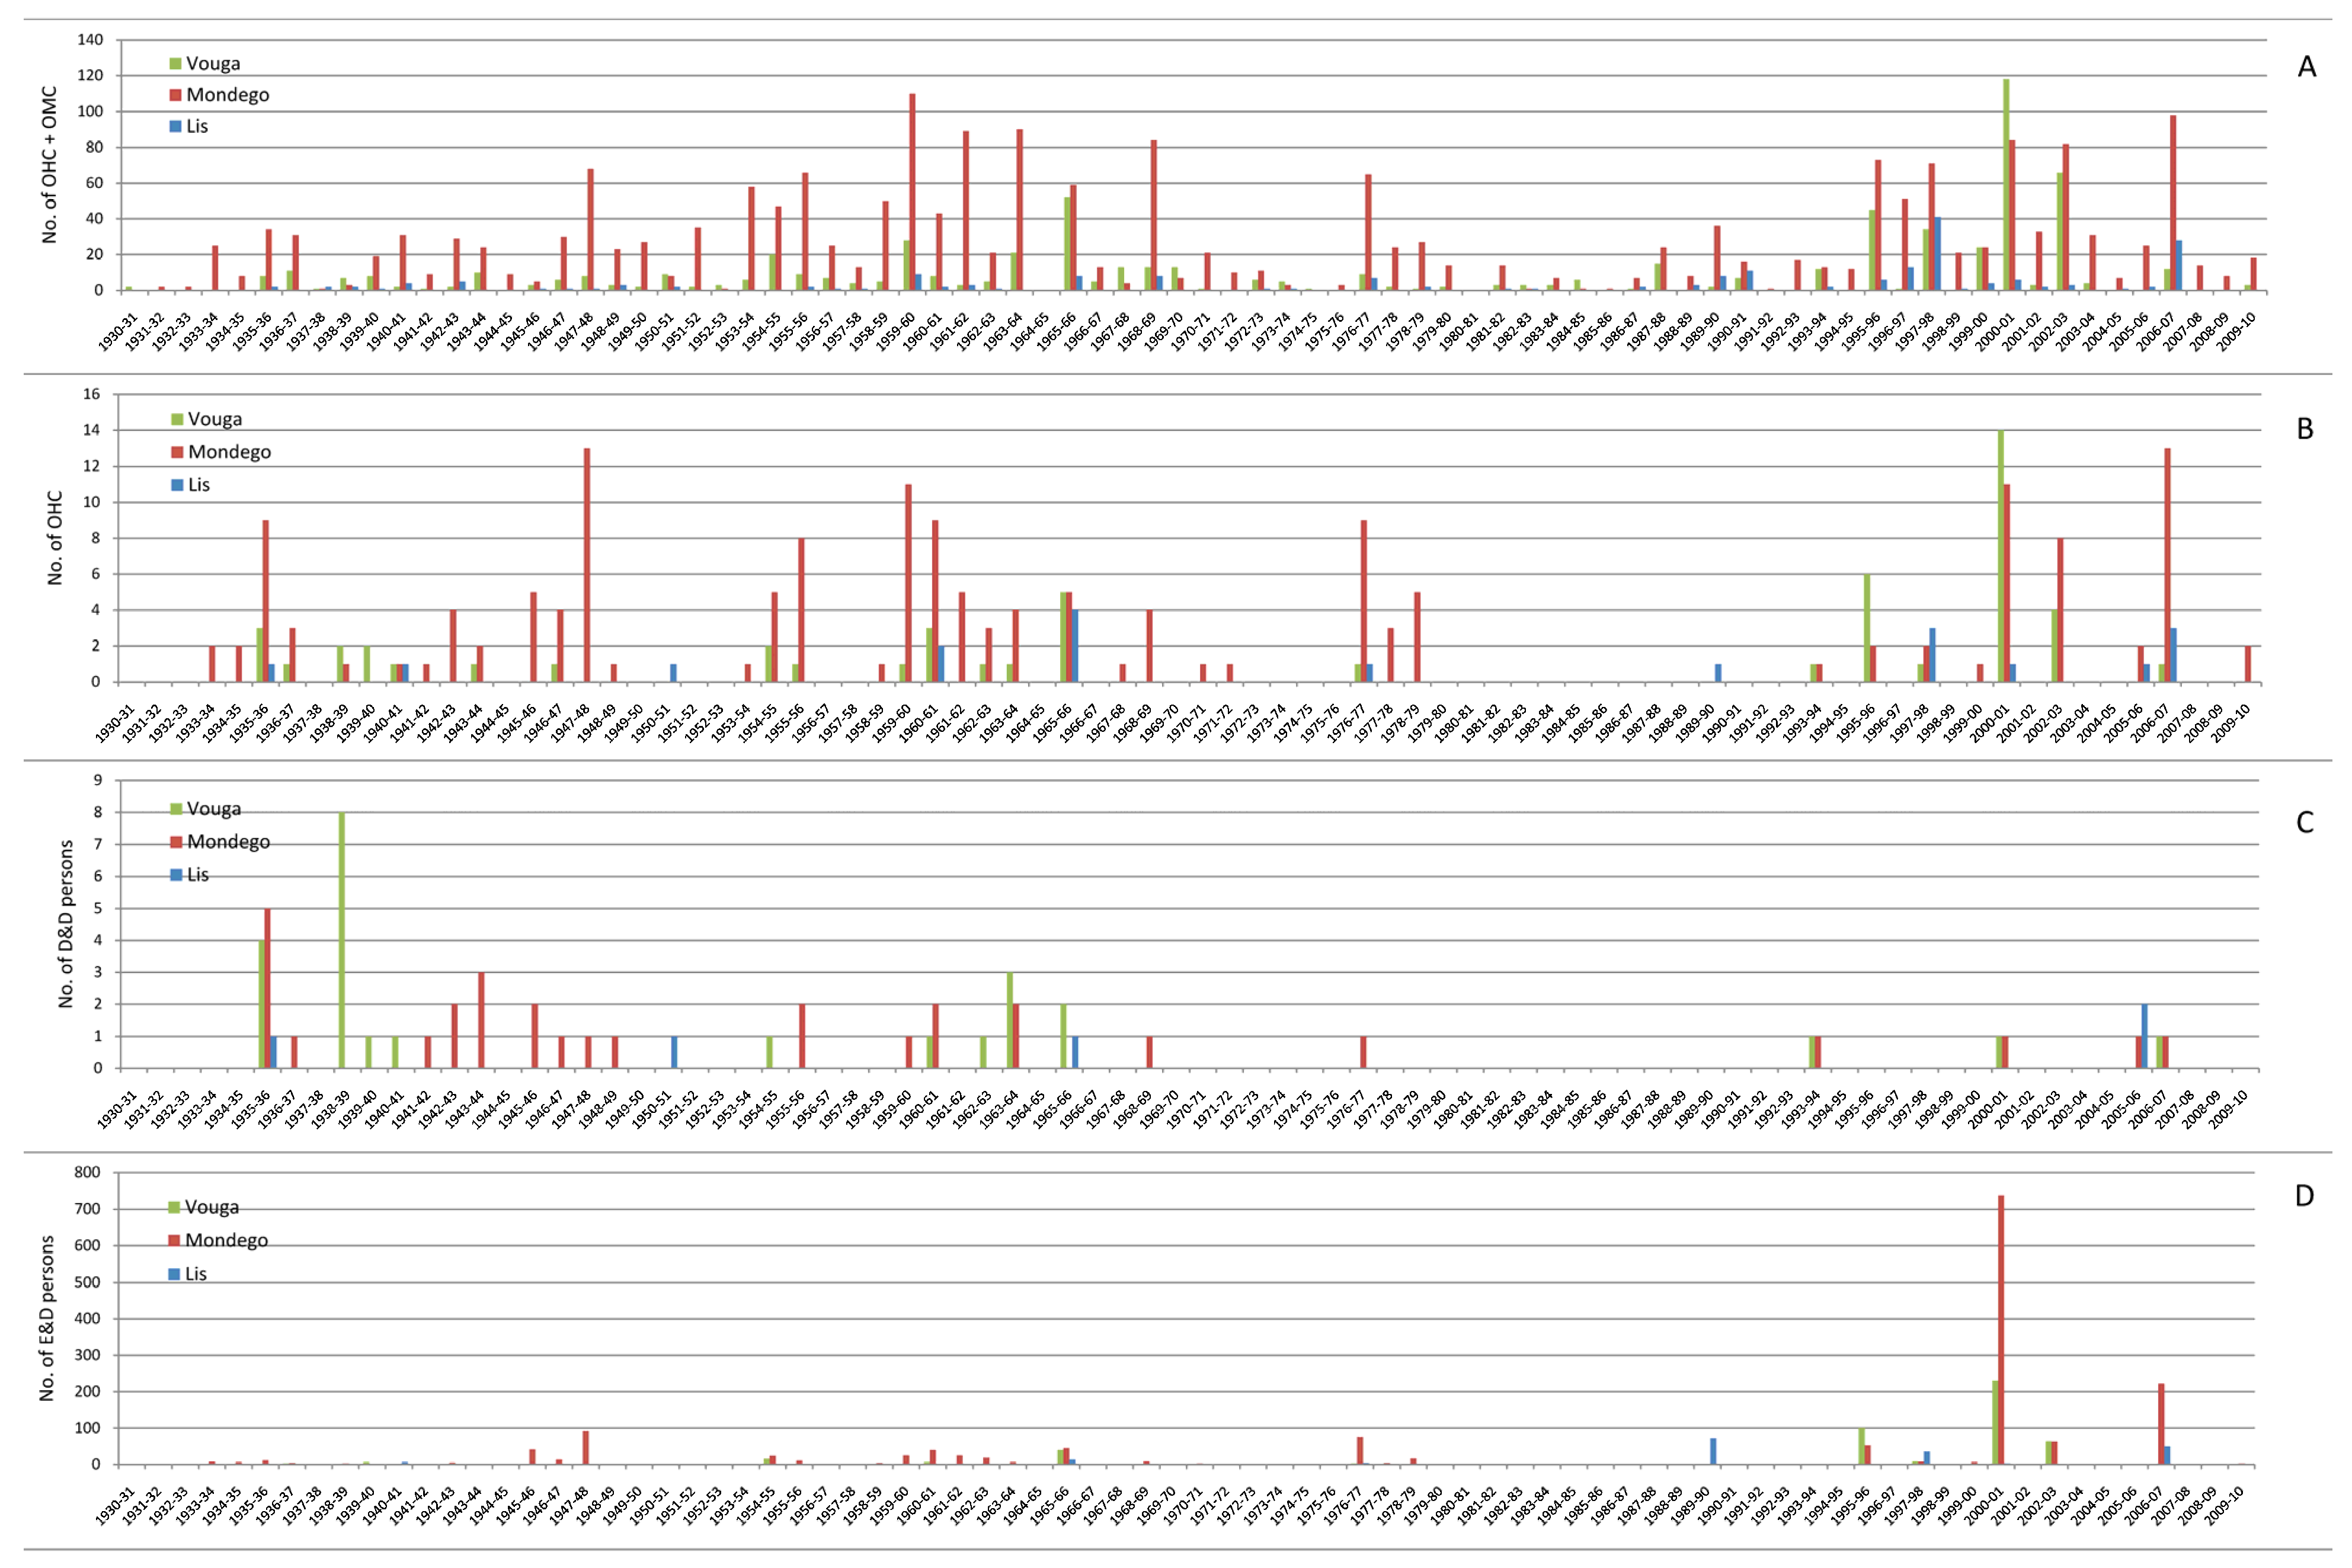
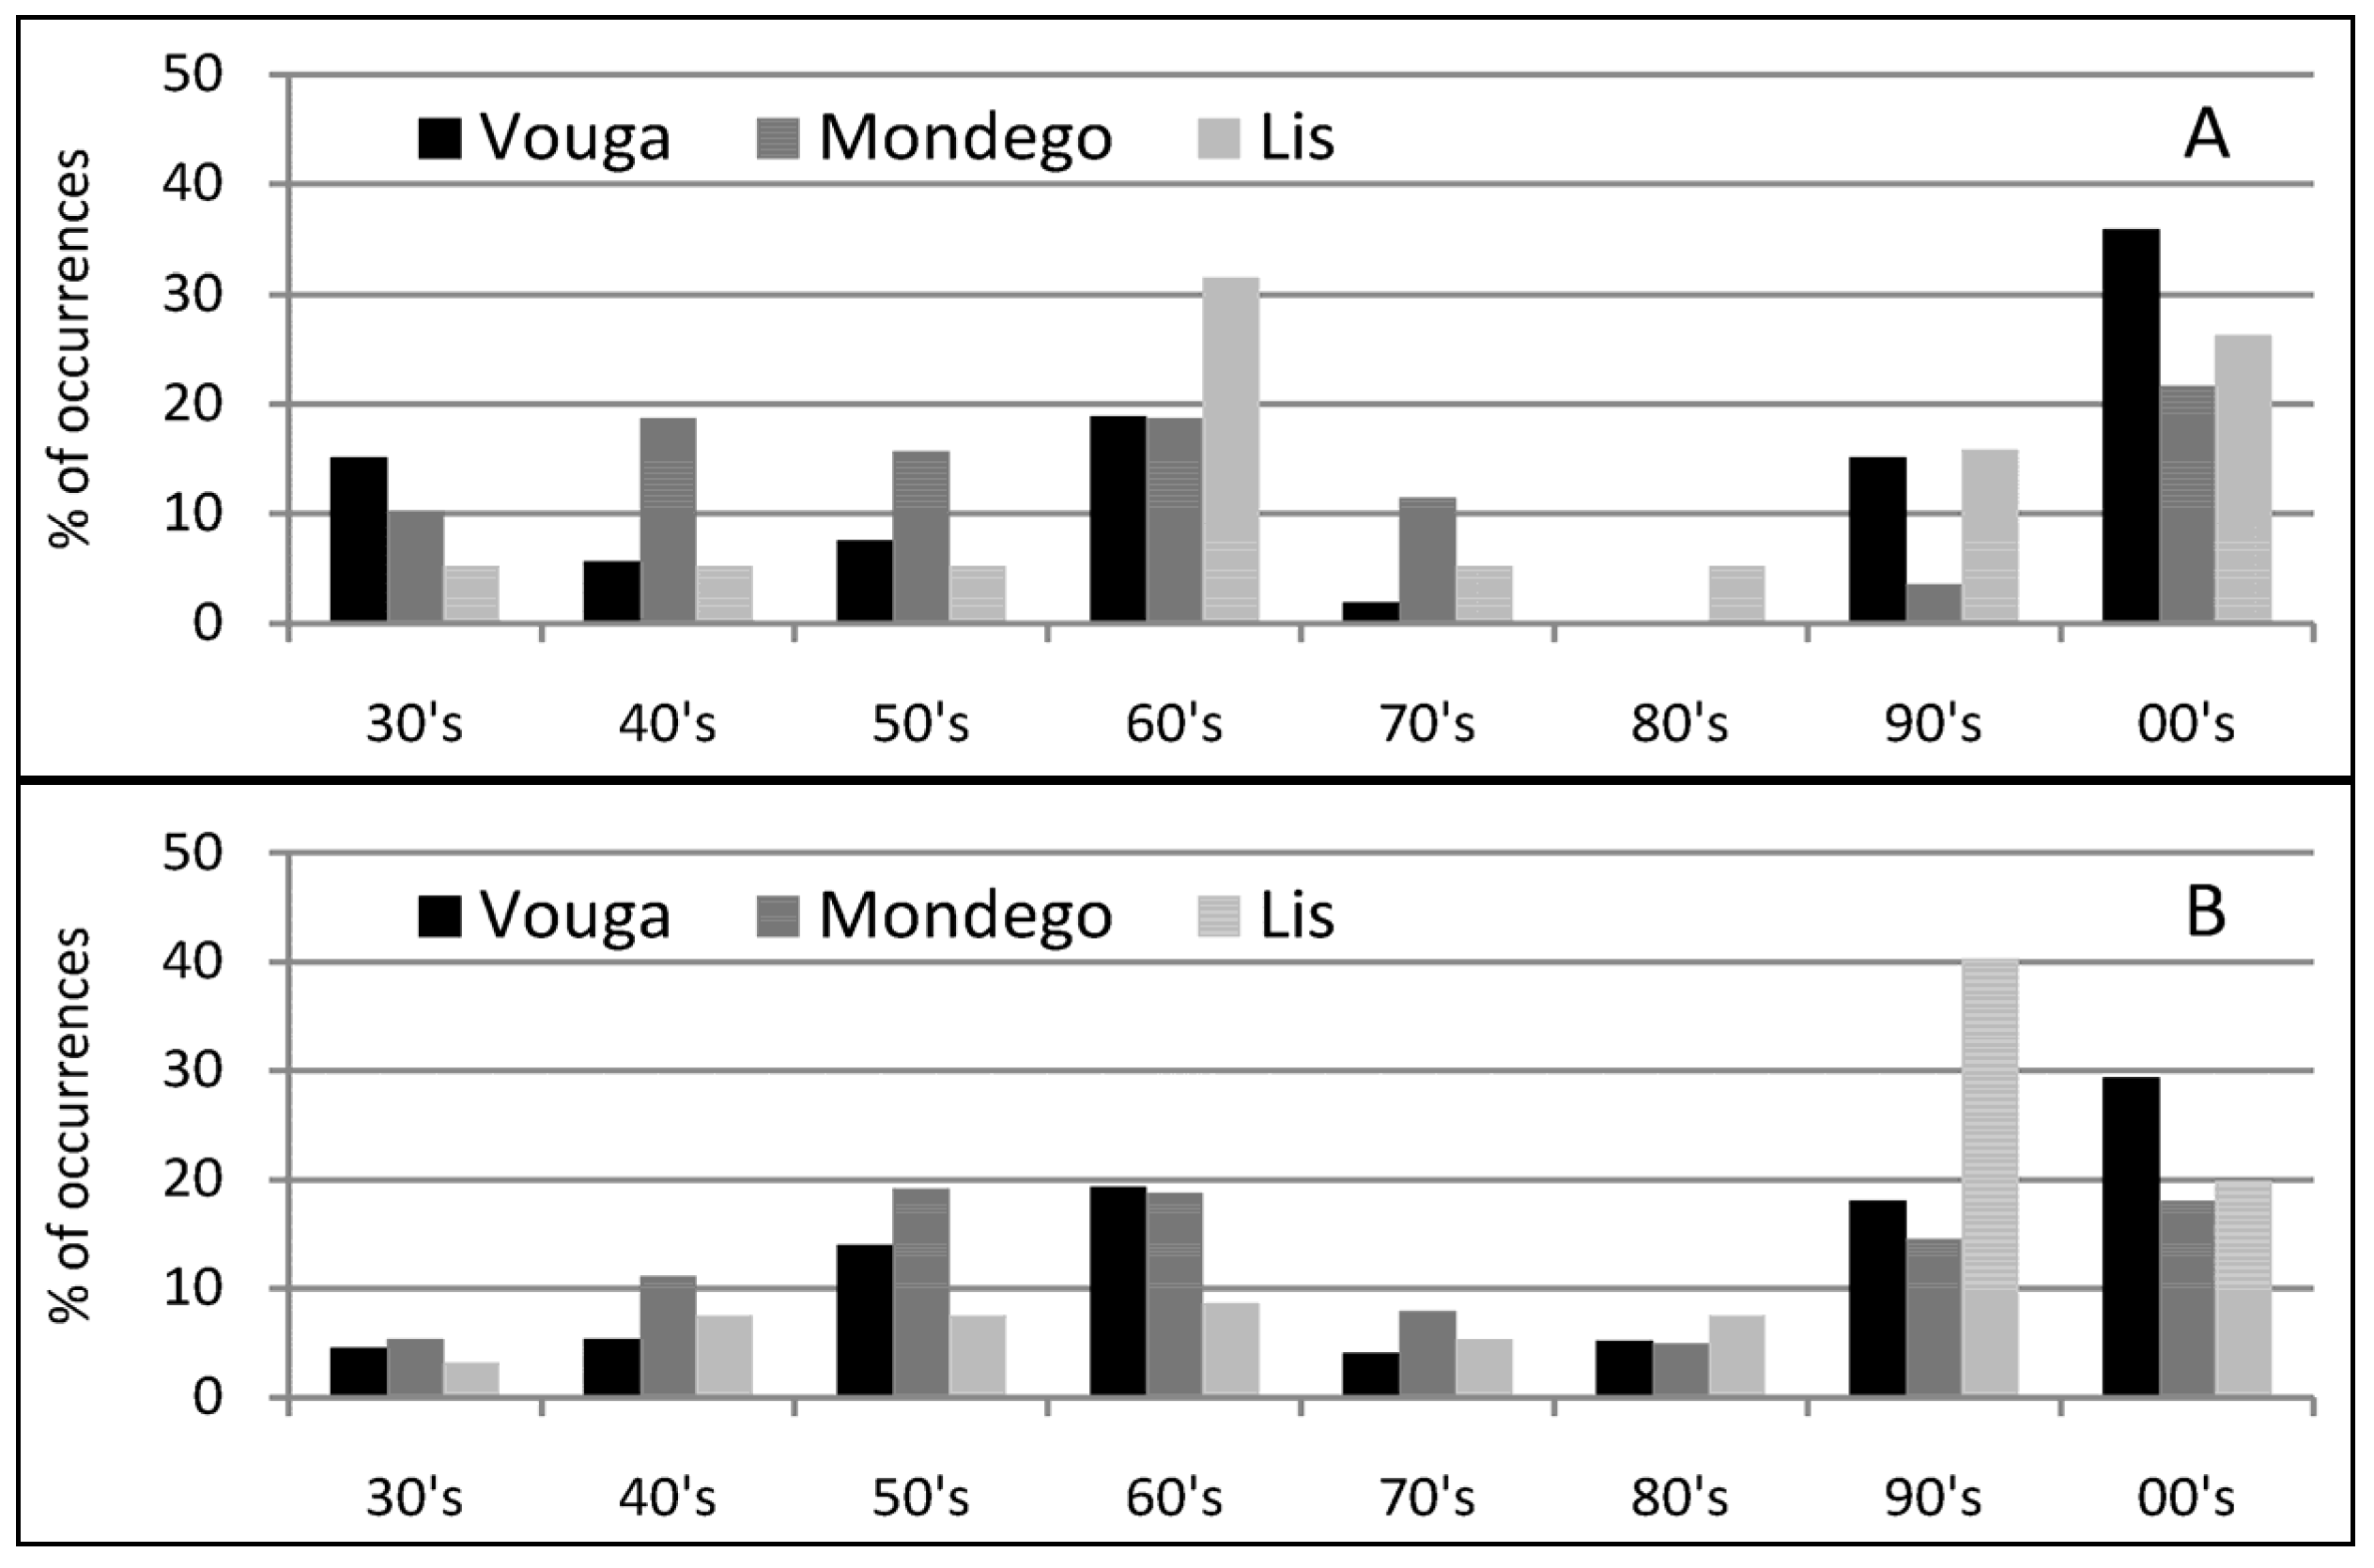
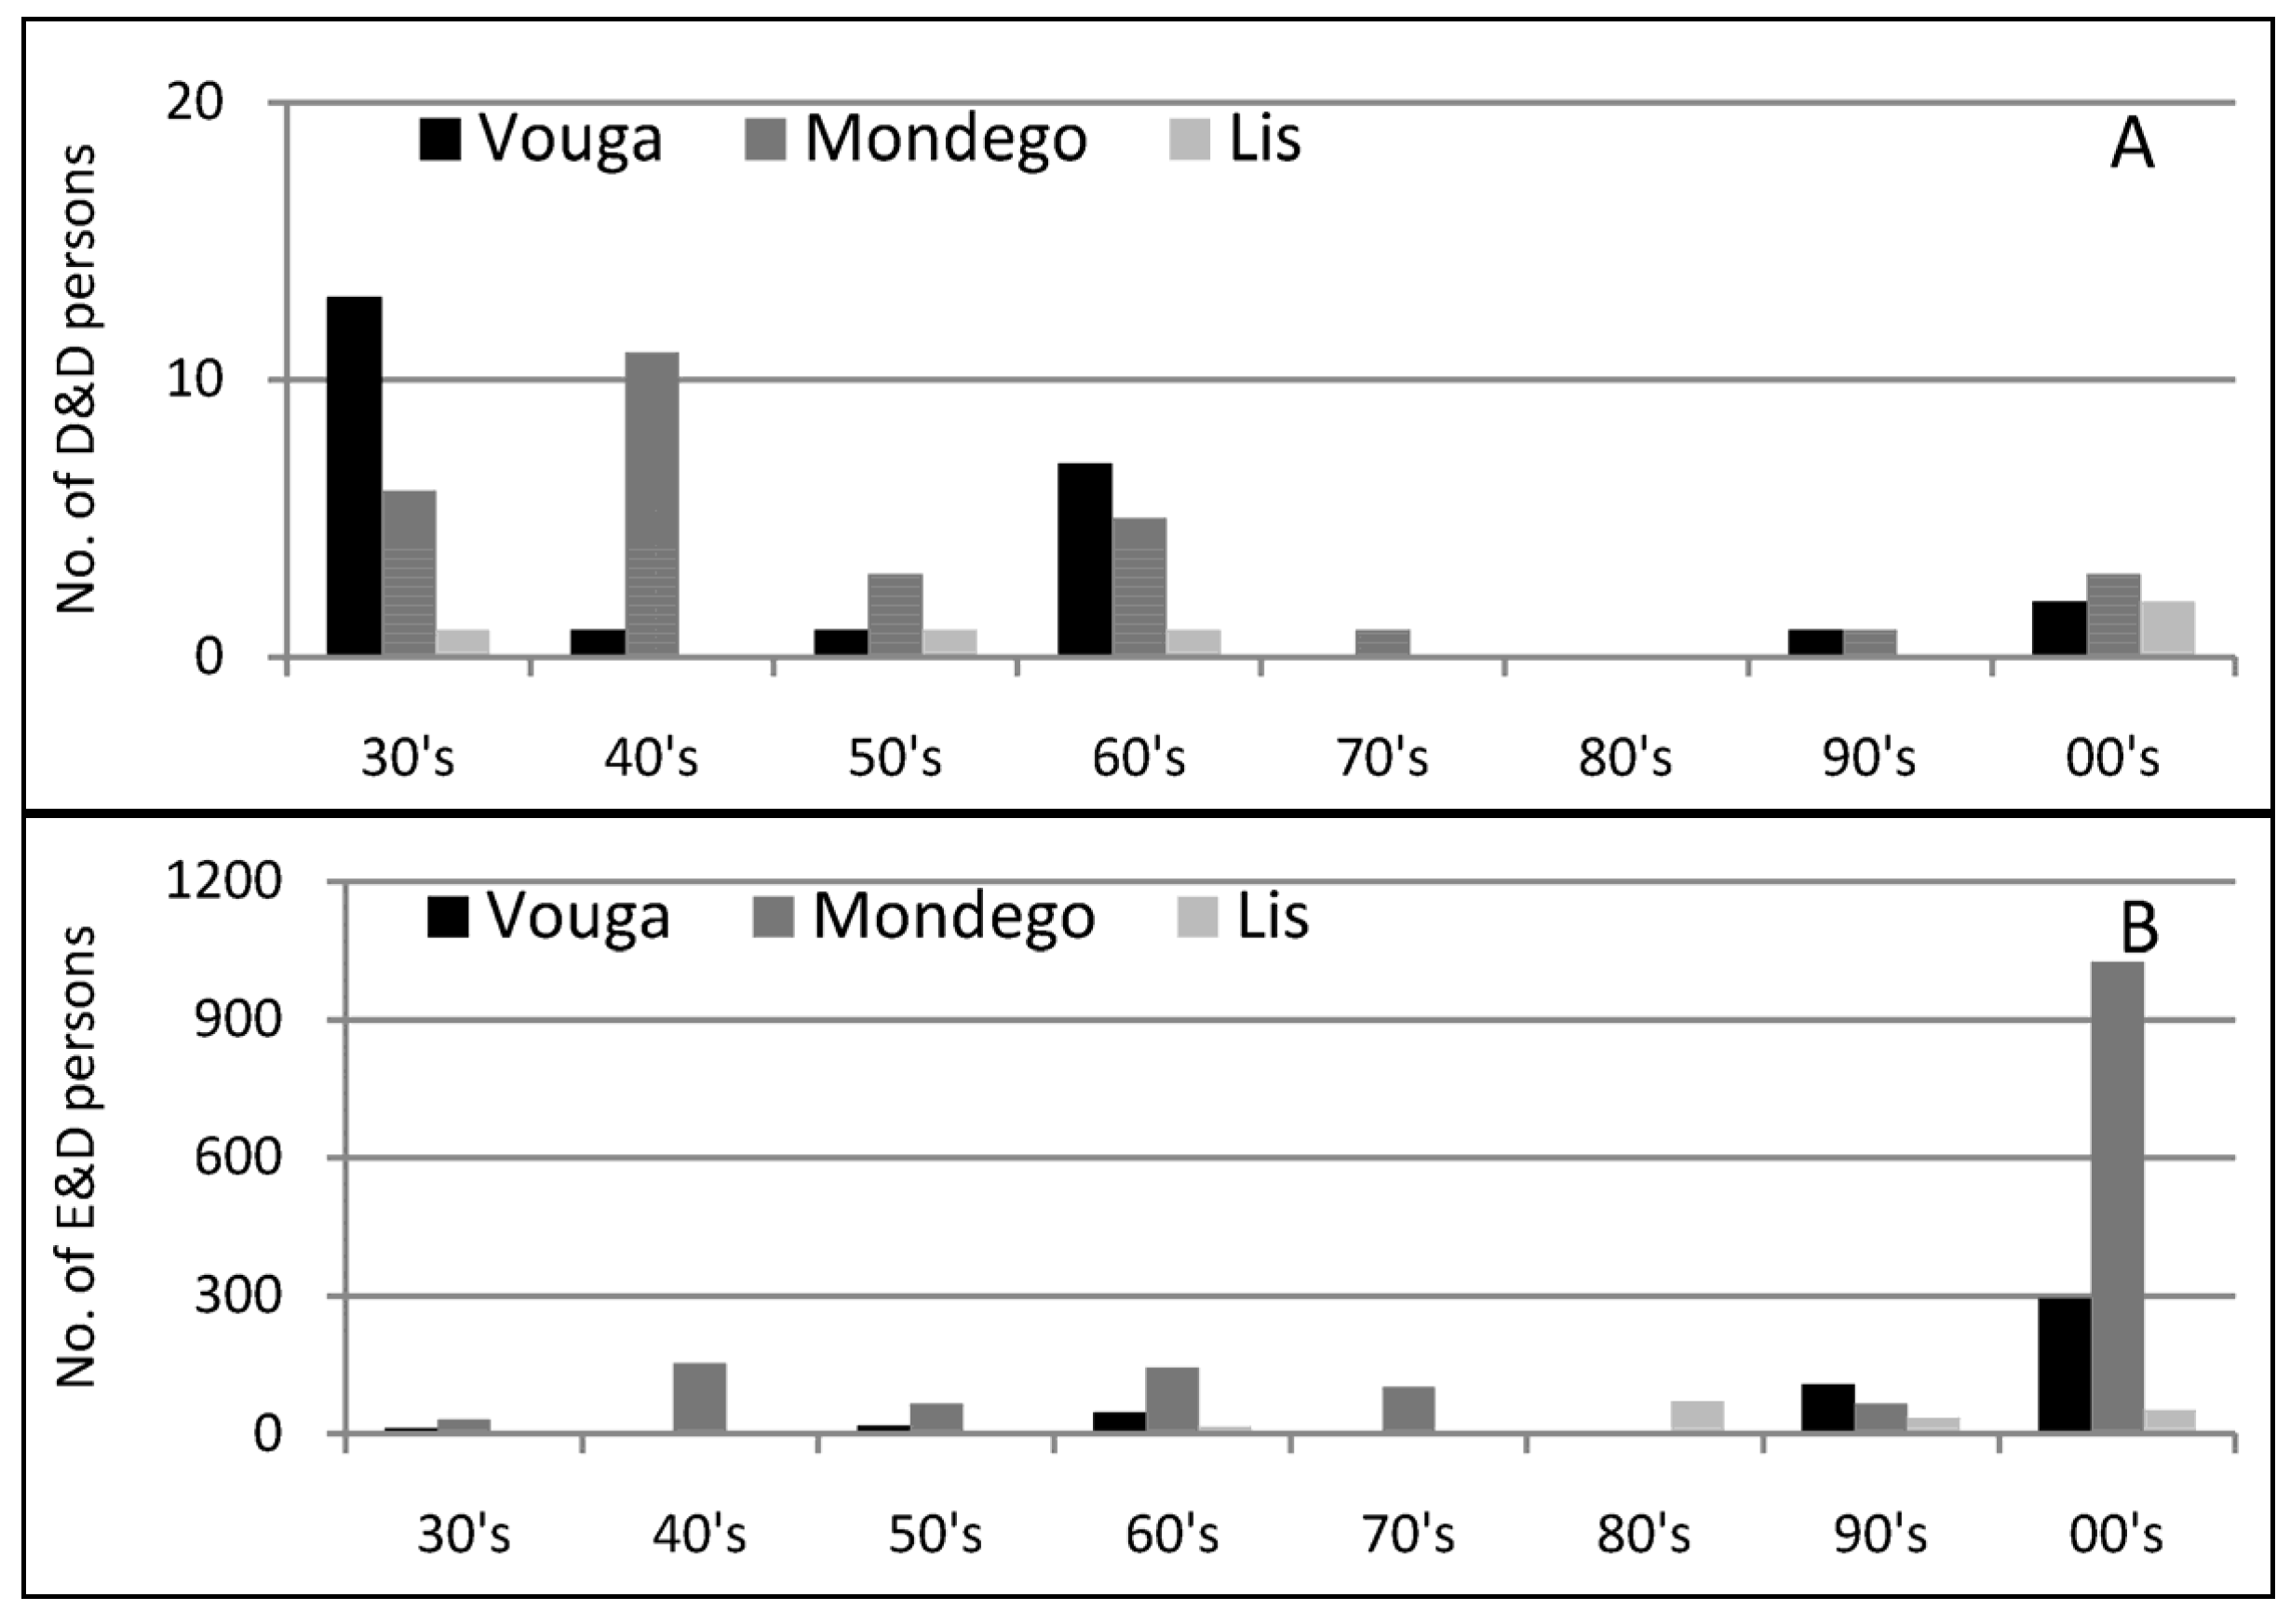
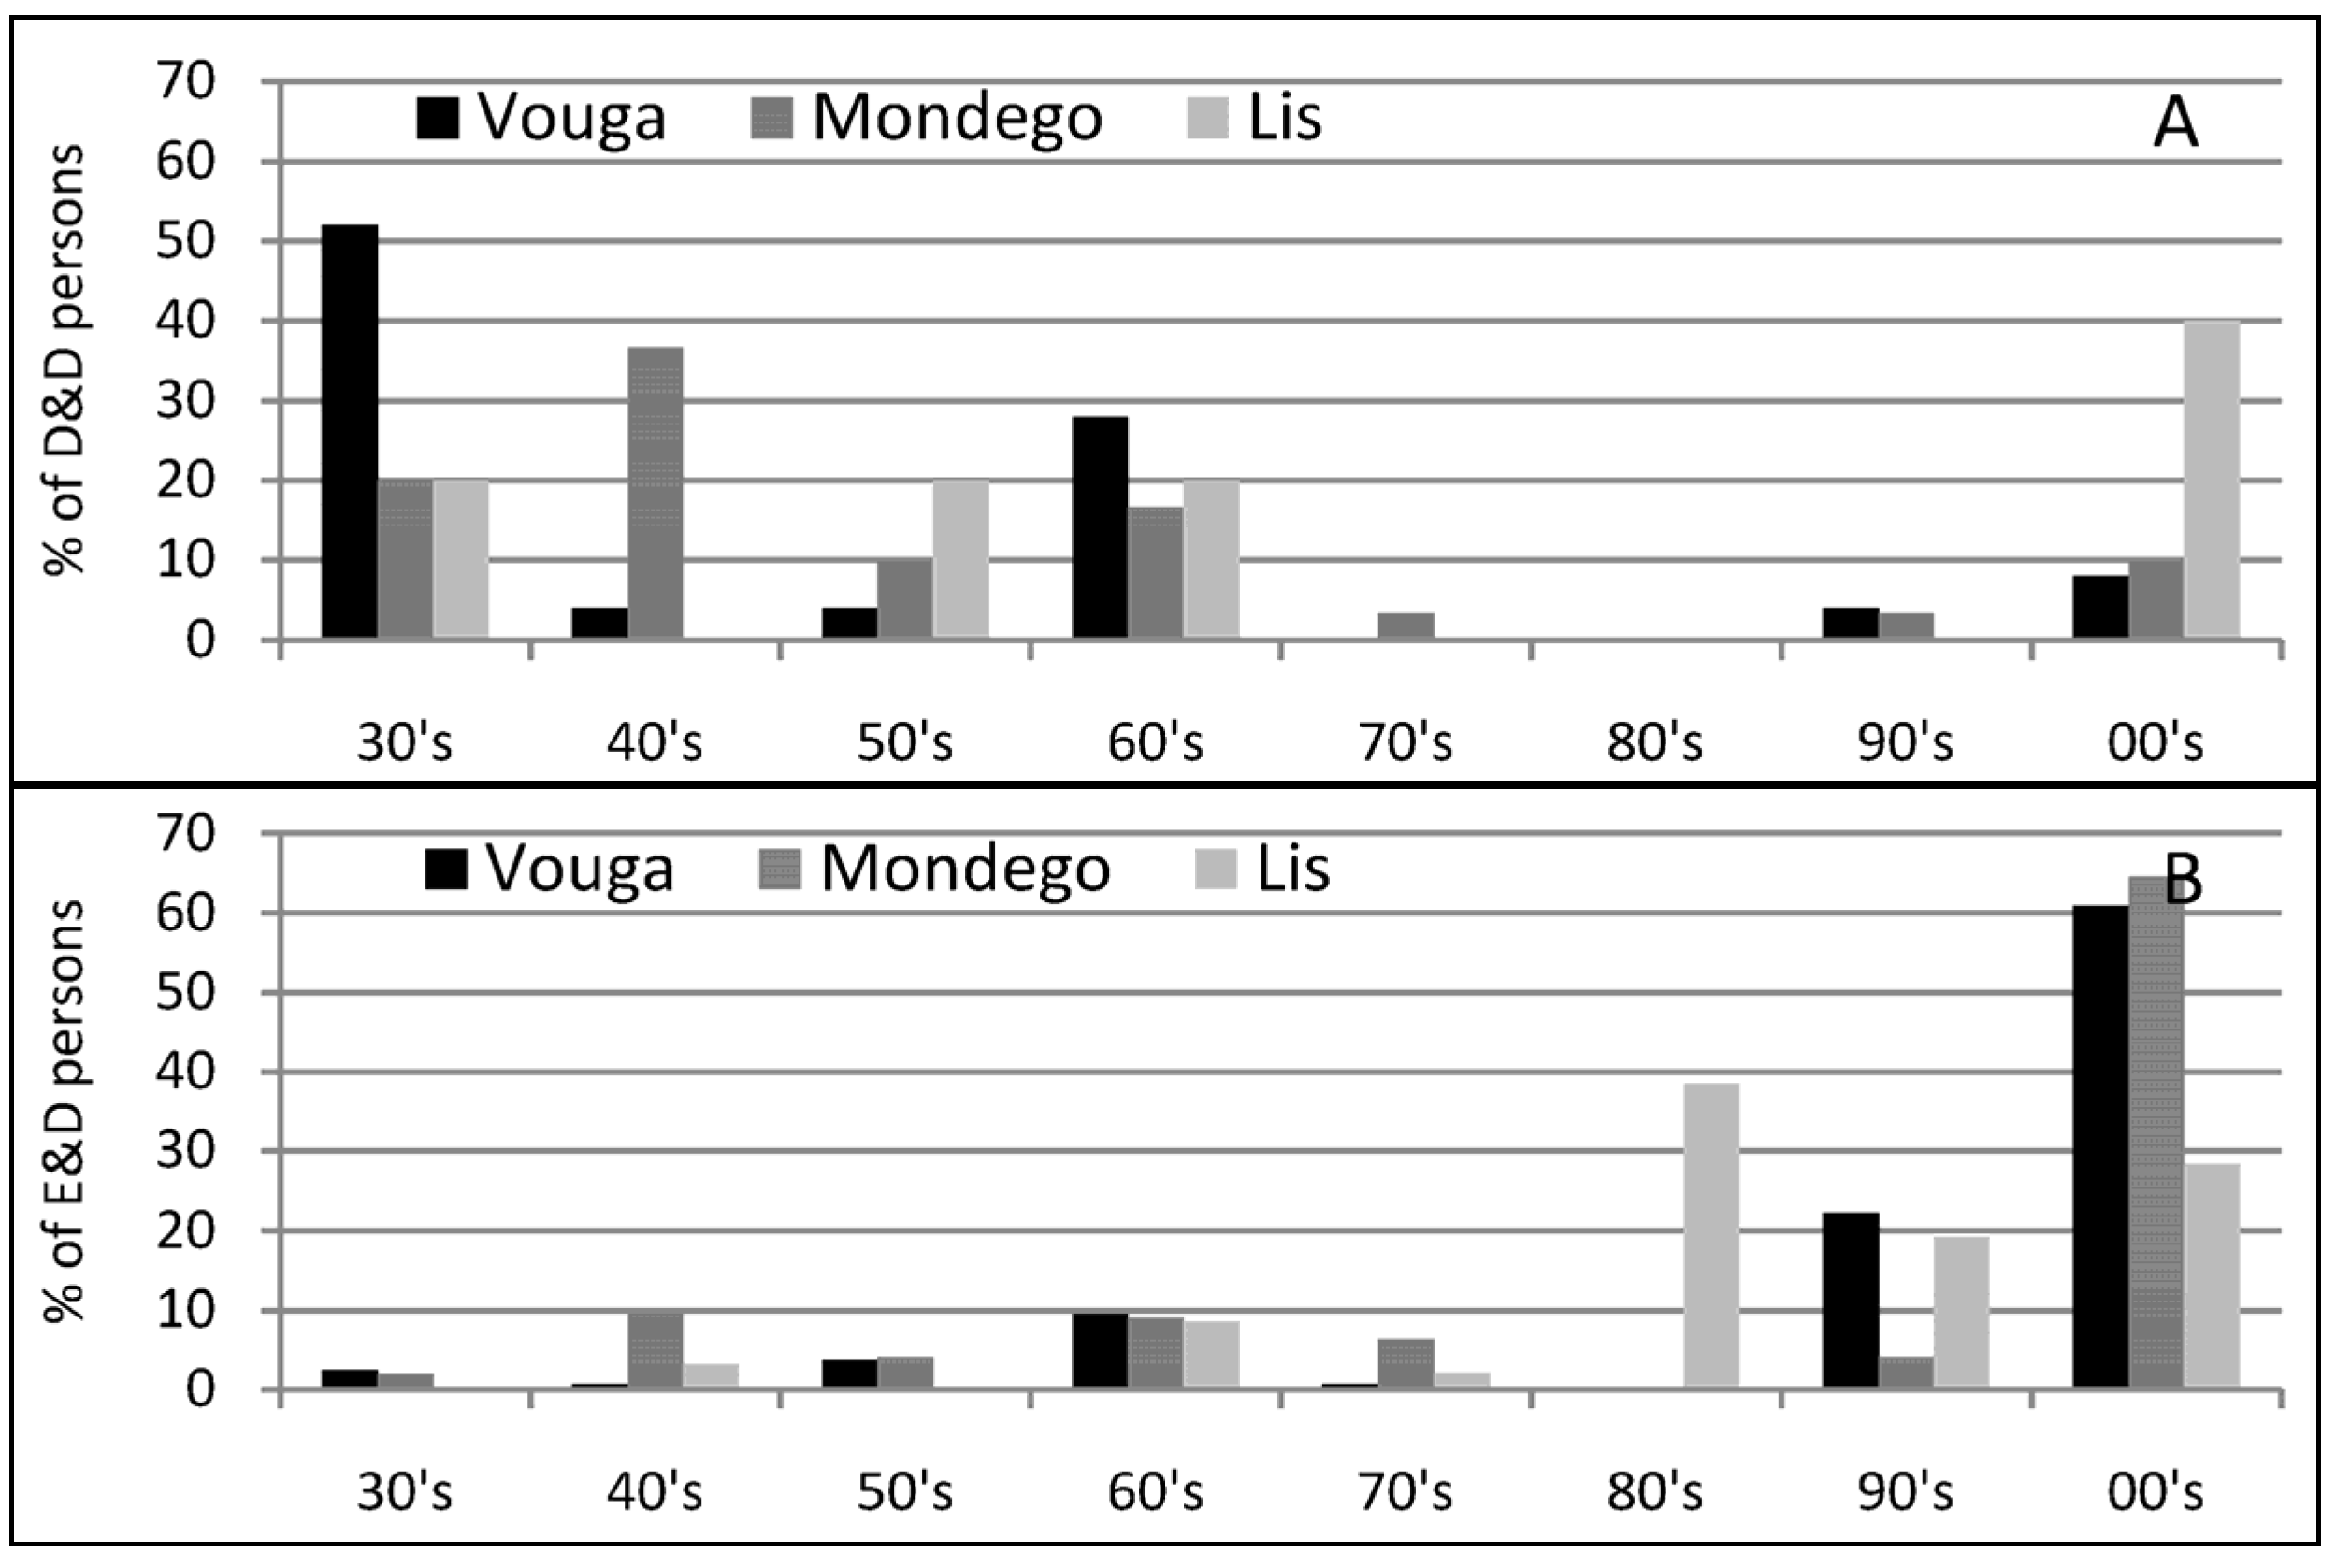
Finally, the Vouga basin constitutes an intermediate situation. This basin is less impacted in terms of the number of E & D persons per 105 inhabitants and the total number of OHC and OMC per km2. The flood risk management strategy may rely on hard and soft measures, but the urgency in action is more similar to the urgency in the Lis basin than with the Mondego basin.
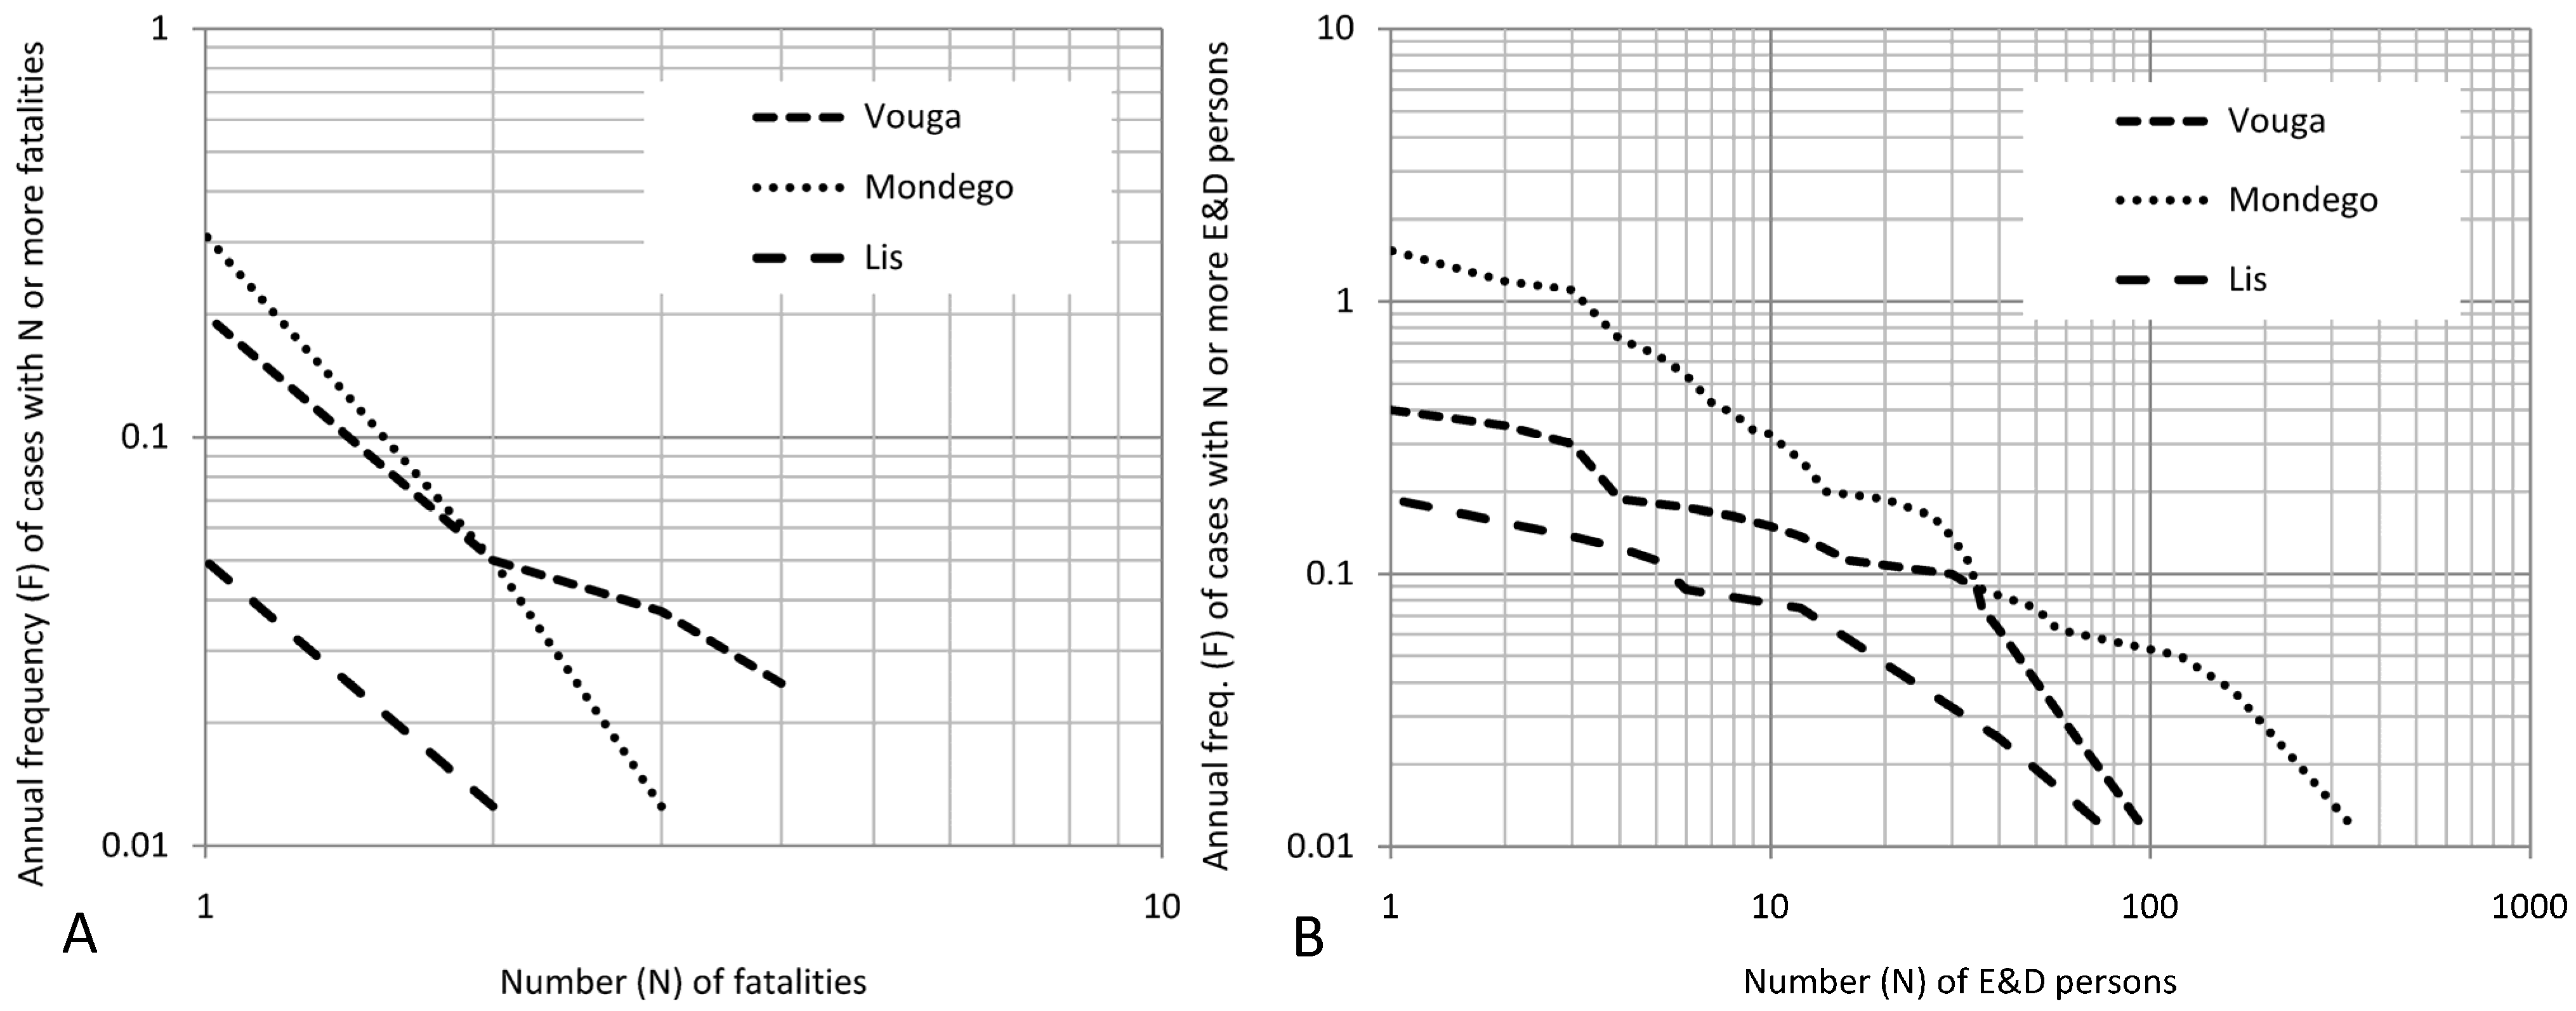
Both of the F-N curves (cf. Figure 5) support the information that was obtained through the fuzzy logic analysis, contributing to the differentiation of selected basins with potential implications in risk management. For example, the Vouga and Mondego basins exhibit identical behavior in terms of occurrences with D & D persons but are distinguished by the different magnitudes of evacuated and displaced persons. This difference is expressed in the distinct position of these basins in Figure 12, with the Mondego basin requiring more immediate management responses (i.e., shorter in terms of time). The Lis basin is less severe in terms of human consequences (OHC) but is relatively more severe in terms of material consequences (OMC), which is why it is positioned in Figure 12 as longer in time (lesser urgency) but requiring more resources because of the greater exposure (cf. Table 3 and Figure 8).
At a different perspective and scale from the one that is presented in this paper, [45] also investigated the appropriateness of risk-based flood hazard management strategies. The sources, pathways and receptors of the hazards that they considered can be equated to the characterization of the territorial context that was performed in our study, while the focus on the “harm” or impact is equally crucial in both.

5. Conclusions

This study demonstrates the applicability of flood impact databases in the appraisal and management components of flood risk governance, going beyond the assessment of individual and societal risk. The potential for their coupled use with data that express the territorial context of each basin was exemplified and, based on such results, the application of fuzzy logic analysis allowed the identification of specific priorities of action in flood risk management.
Methodologically, the analysis of the flood impact database and the territorial context allow for the differentiation of three contiguous basins that are part of the same water management planning instrument, the PGBH. Such distinct behavior results in contrasting fuzzy membership values in regard to the criteria of time and resources, which supports the prioritization of specific flood risk management strategies. Fuzzy logic analysis could have considered other decision-making criteria, such as the implementation cost, legal complexity, institutional capacity or durability, although, to some extent, these criteria depend ultimately on time and resources.
The results show that the Vouga, Mondego and Lis basins behave differently in terms of flood impacts, both when impacts are distinguished between human and material consequences as well as when they are analyzed together. The observed patterns of flood impacts appear to be more related to socioeconomic factors than to biophysical factors.
The European Union Floods Directive requires member-states to elaborate flood risk management plans until the end of 2015, which must articulate with other sector planning instruments related to water resources, conservation, spatial and emergency planning. The methodology presented in this manuscript can provide a holistic and regional approach in supporting decision-making, based on a long record of flood impacts and on socioeconomic and geophysical data. The coupled analysis of impact databases with territorial analysis can, therefore, contribute to improve the knowledge and management of flood risk.

Acknowledgments

This research was supported by the Portuguese Foundation for Science and Technology (FCT) through the project DISASTER-GIS database on hydro-geomorphologic disasters in Portugal: A tool for environmental management and emergency planning (PTDC/CS-GEO/103231/2008), and the project MOLINES-MODELING floods in estuaries: From the hazard to the critical management (PTDC/AAG-MAA/2811/2012).

Author Contributions

The methodological approach was designed and written by the two authors. While data collection, statistical analysis and figures were conducted by Pedro Pinto dos Santos, the introduction, the discussion and conclusions were discussed and written by the two authors.

Conflicts of Interest

The authors declare no conflict of interest.

References

  1. Cai, X.; McKinney, D.; Lasdon, L.S. Integrated hydrologic-agronomic-economic model for river basin management. J. Water Resour. Plan. Manag. 2003, 129, 4–17. [Google Scholar] [CrossRef]
  2. Hooper, B.P. Integrated water resources management and river basin governance. Water Resour. 2003, 126, 12–20. [Google Scholar]
  3. Heinz, I.; Pulido-Velazquez, M.; Lund, J.R.; Andreu, J. Hydro-economic modeling in river basin management: Implications and applications for the European Water Framework Directive. Water Resour. Manag. 2003, 21, 1103–1125. [Google Scholar] [CrossRef]
  4. Jaspers, F.G.W. Institutional arrangements for integrated river basin management. Water Policy 2003, 5, 77–90. [Google Scholar]
  5. Giupponi, C.; Sgobbi, A. Decision support systems for water resources management in developing countries: Learning from experiences in Africa. Water 2013, 5, 798–818. [Google Scholar] [CrossRef] [Green Version]
  6. Barrow, C.J. River basin development planning and management: A critical review. World Dev. 1998, 26, 171–186. [Google Scholar] [CrossRef]
  7. Quevauviller, P. European water policy and research on water-related topics—An overview. J. Hydrol. 2014, 518B, 180–185. [Google Scholar] [CrossRef]
  8. European Union. Directive 2007/60/EC on the Assessment and Management of Flood Risks: EU 2007/60/EC; European Parliament and European Council: Brussels, Belgium, 2007. [Google Scholar]
  9. Hartmann, T.; Driessen, P. The flood risk management plan: Towards spatial water governance. Available online: http://dx.doi.org/10.1111/jfr3.12077 (accessed on 29 January 2015).
  10. Merz, B.; Hall, J.; Disse, M.; Schumann, A. Fluvial flood risk management in a changing world. Nat. Hazards Earth Syst. Sci. 2010, 10, 509–527. [Google Scholar] [CrossRef]
  11. Kull, D.; Mechler, R.; Hochrainer-Stigler, S. Probabilistic cost-benefit analysis of disaster risk management in a development context. Disasters 2012, 37, 374–400. [Google Scholar] [CrossRef]
  12. Aerts, J.C.J.H.; Botzen, W.; van der Veen, A.; Krywkow, J.; Werners, S. Dealing with uncertainty in flood management through diversification. Ecol. Soc. 2008, 13, 41. [Google Scholar]
  13. Broekx, S.; Smets, S.; Liekens, I.; Bulckaen, D.; de Nocker, L. Designing a long-term flood risk management plan for the Scheldt estuary using a risk-based approach. Nat. Hazards 2011, 57, 245–266. [Google Scholar] [CrossRef]
  14. Sapountzaki, K.; Wanczura, S.; Casertano, G.; Greiving, S.; Xanthopoulos, G.; Ferrara, F.F. Disconnected policies and actors and the missing role of spatial planning throughout the risk management cycle. Nat. Hazards 2011, 59, 1445–1474. [Google Scholar] [CrossRef]
  15. Borga, M.; Anagnostou, E.N.; Blöschl, G.; Creutin, J.-D. Flash flood forecasting, warning and risk management: The HYDRATE project. Environ. Sci. Policy 2011, 14, 834–844. [Google Scholar] [CrossRef]
  16. Tavares, A.O. Riscos Naturais e Ordenamento do Território—Modelos, Práticas e Políticas Públicas a partir de uma reflexão para a Região Centro de Portugal. Prospect. Planeam. 2010, 17, 33–55. [Google Scholar]
  17. Kron, W.; Steuer, M.; Löw, P.; Wirtz, A. How to deal properly with a natural catastrophe database—Analysis of flood losses. Nat. Hazards Earth Syst. Sci. 2012, 12, 535–550. [Google Scholar] [CrossRef]
  18. Elmer, F.; Seifert, I.; Kreibich, H.; Thieken, A.H. A Delphi Method Expert Survey to Derive Standards for Flood Damage Data Collection. Risk Anal. 2010, 30, 107–123. [Google Scholar] [CrossRef] [PubMed]
  19. Downton, M.W.; Pielke, R.A. How accurate are disaster loss data? The case of U.S. flood damage. Nat. Hazards 2005, 35, 211–228. [Google Scholar]
  20. Gall, M.; Borden, K.A.; Cutter, S.L. When do losses count? Six fallacies of natural hazards loss data, B. Am. Meteorol. Soc. 2009, 90, 799–809. [Google Scholar]
  21. Cammerer, H.; Thieken, A.H.; Verburg, P.H. Spatio-temporal dynamics in the flood exposure due to land use changes in the Alpine Lech Valley in Tyrol (Austria). Nat. Hazards 2013, 68, 1243–1270. [Google Scholar] [CrossRef]
  22. Santos, P.P.; Tavares, A.O.; Zêzere, J.L. Risk analysis for local management from hydro-geomorphologic disaster databases. Environ. Sci. Policy 2014, 40, 85–100. [Google Scholar] [CrossRef]
  23. Lohani, A.K.; Goel, N.K.; Bhatia, K.K.S. Improving real time flood forecasting using fuzzy inference system. J. Hydrol. 2014, 509, 25–41. [Google Scholar] [CrossRef]
  24. Wang, S.; Huang, G.H. A two-stage mixed-integer fuzzy programming with interval-valued membership functions approach for flood-diversion planning. J. Environ. Manag. 2013, 117, 208–218. [Google Scholar] [CrossRef]
  25. Akter, T.; Simonovic, S.P. Aggregation of fuzzy views of a large number of stakeholders for multi-objective flood management decision-making. J. Environ. Manag. 2005, 77, 133–143. [Google Scholar] [CrossRef]
  26. Ouma, Y.O.; Tateishi, R. Urban flood vulnerability and risk mapping using integrated multi-parametric AHP and GIS: Methodological overview and case study assessment. Water 2014, 6, 1515–1545. [Google Scholar] [CrossRef]
  27. Yang, X.-L.; Ding, J.-H.; Hou, H. Application of a triangular fuzzy AHP approach for flood risk evaluation and response measures analysis. Nat. Hazards 2013, 68, 657–674. [Google Scholar] [CrossRef]
  28. Morss, R.E.; Wilhelmi, O.V.; Downton, M.W.; Gruntfest, E. Flood risk, uncertainty, and scientific information for decision making. Lessons from and interdisciplinary project. Am. Meteorol. Soc. 2005, 86, 1593–1601. [Google Scholar]
  29. Portuguese Environment Agency (APA). APA Plano de Gestão das Bacias Hidrográficas dos rios Vouga, Mondego e Lis (Hydrographical Basin Management Plan—Vouga, Mondego and Lis Basins); APA: Coimbra, Portugal, 2013. [Google Scholar]
  30. Zêzere, J.L.; Pereira, S.; Tavares, A.O.; Bateira, C.; Trigo, R.M.; Quaresma, I.; Santos, P.P.; Santos, M.; Verde, J. DISASTER: A GIS database on hydro-geomorphologic disasters in Portugal. Nat. Hazards 2014, 72, 503–532. [Google Scholar] [CrossRef]
  31. Coe, J.A.; Michael, J.A.; Crovelli, R.A.; Savage, W.Z. Preliminary Map Showing Landslide Densities, Mean Recurrence Intervals, and Exceedance Probabilities as Determined from Historic Records; Open-File Report 00-303; U.S. Geological Survey: Seattle, WA, USA, 2000. [Google Scholar]
  32. Guzzetti, F.; Tonelli, G. Information system on hydrological and geomorphological catastrophes in Italy (SICI): A tool for managing landslide and flood hazards. Nat. Hazards Earth Syst. Sci. 2004, 4, 213–232. [Google Scholar] [CrossRef]
  33. Bedford, T. Decision making for group risk reduction: Dealing with epistemic uncertainty. Risk Anal. 2013, 33, 1884–1898. [Google Scholar] [PubMed]
  34. Maaskant, B.; Jonkman, S.N.; Bouwer, L.M. Future risk of flooding: An analysis of changes in potential loss of life in South Holland (The Netherlands). Environ. Sci. Policy 2009, 12, 157–169. [Google Scholar] [CrossRef]
  35. Commission for the Coordination and Regional Planning of Central Portugal (CCDR-C). Plano Regional do Ordenamento do Território do Centro. Regional Plan for Spatial Planning for the Central Portugal Region; CCDR-C: Coimbra, Portugal, 2011. [Google Scholar]
  36. Comes, T.; Hiete, M.; Schultmann, F. An approach to multi-criteria decision problems under severe uncertainty. J. Multi Criteria Decis. Anal. 2013, 20, 29–48. [Google Scholar] [CrossRef]
  37. Ahmad, S.S.; Simonovic, S.P. A three-dimensional fuzzy methodology for flood risk analysis. J. Flood Risk Manag. 2011, 4, 53–74. [Google Scholar]
  38. Guillaume, S.; Charnomordic, B. Learning interpretable fuzzy inference systems with FISPRO. Inf. Sci. 2011, 181, 4409–4427. [Google Scholar] [CrossRef]
  39. Aven, T.; Renn, O. Risk Management and Governance: Concepts, Guidelines and Applications; Springer-Verlag: Berlin, Germany, 2010. [Google Scholar]
  40. Viglione, A.; di Baldassarre, G.; Brandimarte, L.; Kuil, L.; Carr, G.; Salinas, J.L.; Scolobig, A.; Blöschl, G. Insights from socio-hydrology modelling on dealing with flood risk—Roles of collective memory, risk-taking attitude and trust. J. Hydrol. 2014, 518A, 71–82. [Google Scholar] [CrossRef]
  41. Kjeldsen, T.R.; Macdonald, N.; Lang, M.; Mediero, L.; Albuquerque, T.; Bogdanowicz, E.; Brázdil, R.; Castellarin, A.; David, V.; Fleig, A.; et al. Documentary evidence of past floods in Europe and their utility in flood frequency estimation. J. Hydrol. 2014, 517, 963–973. [Google Scholar] [Green Version]
  42. UNISDR Synthesis Report: Consultations on a Post-2015 Framework in Disaster Risk Reduction (HFA2); The United Nations Office for Disaster Risk Reduction: Geneva, Switzerland, 2013.
  43. Sayers, P.; Li, Y.; Galloway, G.; Penning-Rowsell, E.; Shen, F.; Wen, K.; Chen, Y.; le Quesne, T. Flood Risk Management: A Strategic Approach; UNESCO: Paris, French, 2013. [Google Scholar]
  44. Australia Emergency Management Institute (AEMI). Managing the Floodplain: A Guide to Best Practice in Flood Risk Management in Australia; Australian Emergency Management Handbook Series—Handbook 7; Australia Emergency Management Institute: Mount Macedon, VA, Australia, 2013. [Google Scholar]
  45. Sayers, P.B.; Hall, J.W.; Meadowcroft, I.C. Towards risk-based flood hazard management in the UK. Proc. ICE Civil Eng. 2002, 150, 36–42. [Google Scholar] [CrossRef]

