Article

Marketing Household Water Treatment: Willingness to Pay Results from an Experiment in Rural Kenya

1
Department of Environmental Sciences & Engineering, University of North Carolina at Chapel Hill, 148 Rosenau Hall, Chapel Hill, NC 27516, USA
2
Rollins School of Public Health, Emory University, 1518 Clifton Road, Atlanta, GA 30322, USA
3
International Food Policy Research Institute, 2033 K Street NW, Washington, DC 20006, USA
*
Author to whom correspondence should be addressed.
Water 2014, 6(7), 1873-1886; https://doi.org/10.3390/w6071873
Submission received: 29 April 2014 / Revised: 7 June 2014 / Accepted: 11 June 2014 / Published: 26 June 2014
(This article belongs to the Special Issue Water Treatment and Human Health)

Abstract

:
Despite increasing availability of household water treatment products, demand in developing countries remains low. Willingness to pay for water treatment products and factors that affect demand are not well understood. In this study, we estimate willingness to pay for WaterGuard, a dilute chlorine solution for point-of-use water treatment, using actual purchase decisions at randomly assigned prices. Secondly, we identify household characteristics that are correlated with the purchase decision. Among a sample of 854 respondents from 107 villages in rural Kenya, we find that mean willingness to pay is approximately 80% of the market price. Although only 35% of sample households purchased WaterGuard at the market price, 67% of those offered a 50% discount purchased the product. A marketing message emphasizing child health did not have a significant effect on purchase behavior, overall or among the subset of households with children under five. These findings suggest that rural Kenyans are willing to pay for WaterGuard at low prices but are very sensitive to increasing price. Households with young children that could benefit the most from use of WaterGuard do not appear to be more likely to purchase the product, and a marketing message designed to target this population was ineffective.

1. Introduction

Diarrheal disease, due in large part to the consumption of contaminated water, is the second leading infectious cause of death in children under five [1,2]. Household water treatment has been found to significantly reduce diarrheal disease and may be more effective than interventions to improve water quality at the source [3]. Despite growing availability of household water treatment products, demand remains low. A recent study of 67 low and middle-income countries found that only a third of surveyed households treated their water before drinking, with boiling being the method used by the majority of households [4].
Robust evidence on willingness to pay (WTP) for improved water quality is limited [5]. Much of the literature on demand for improved water quality relies on stated preference methods in which respondents are asked hypothetical questions about their WTP for a good. These stated preference methods are subject to a number of biases stemming from the fact that there are rarely any direct consequences that incentivize honest and accurate answers [6]. A meta-analysis of twenty-eight stated preference valuation studies found the median ratio of hypothetical to actual values to be 1.35 (mean of 2.6) [7]. By varying prices in real purchase decisions, experimental methods allow researchers to estimate WTP for water quality improvements while reducing many of the biases associated with stated preference methods. In a recent review of the literature, Null et al. [5] found only five studies focused on WTP for water quality improvements that used experimental methods in developing countries. By observing the proportion of respondents who purchased a product at various randomly assigned prices, all of these studies (in Bangladesh, Ghana, Kenya, and Zambia) found demand to be highly sensitive to price, with WTP below market prices in most cases [8,9,10,11,12].
Factors that affect demand and WTP for household drinking water treatment are also not well understood [5]. Some studies have found wealth and education to be positively associated with demand for improved water quality [13], but others have found no relationship [8,9]. Households are more likely to treat their drinking water if they perceive it to be of low quality [14]. Providing households with personalized information about their water quality may increase demand for household water treatment products [13]. Exploiting naturally-occurring variation in arsenic levels in tubewells in Bangladesh, a number of papers have documented that households respond to information about water quality by switching sources, although overly simplified information (such as reducing continuous variation in arsenic levels to a binary “safe/not safe” rating) can lead to perverse responses [15,16,17].
Finally, little is known about the effect of marketing the benefits of water treatment (or other preventive health inputs) for child health specifically. Studies of mosquito net usage provide suggestive evidence that households may prioritize the health of adult members over that of children. In observational data, mosquito nets are often used by adults when a household does not have enough nets for all of its members [18,19]. In an experimental study in Uganda, Hoffmann [20] found that adult household members were more likely to use a mosquito net received through the study than children, despite being given information about the particular health risks of malaria and associated benefits of net use for young children at the time nets were distributed. While health messaging used in the promotion of water treatment typically focuses on the health benefits for young children, it may thus be possible that emphasizing benefits to adults is more effective at stimulating sales. In the case of chlorine solution, use is at the household level, so motivating behavior change through a focus on adult health is not expected to have adverse effects on within-household targeting.
In this paper we estimate average WTP for WaterGuard in rural Kenya using randomly assigned prices and real purchase decisions. We also identify factors affecting demand based on household characteristics correlated with WaterGuard purchase decisions, and test the relative impacts of marketing messages designed to emphasize the importance of water treatment for child versus adult health. Information about how much households are willing to pay, the characteristics associated with demand, and the effect of marketing messages tailored to specific populations can inform improved safe water policy and water treatment solution marketing strategy.
The paper is organized as follows: in the next section we explain the methods, including the study site and details of the water treatment product and purchase offer; in the third section we describe the study population and provide results on purchases, average WTP, household characteristics correlated with purchase decisions, and the effects of the child health marketing message; the conclusion section summarizes the key findings and places this study in the context of the larger literature.

2. Methods

2.1. Study Site

The study was conducted in the rural Rachuonyo district of Kenya’s Nyanza Province. Residents of this area rely on communal water sources, such as springs and wells, for drinking water. The area is subject to water shortages and turbidity during the annual dry season and water quality at unprotected sources is poor year-round.

2.2. Sampling

Enumerators worked with village elders to collect data on all springs and wells in rural parts of the district. Enumerators then visited those sources which, based on village elders’ reports, met the following criteria: water was available at the source year-round, the water was never too turbid to drink, there were at least 20 households using the source during both the rainy and dry seasons, and users could use the source for free. A list of households using each source was generated through consultation with village elders and other water source users. Based on the confirmed eligibility criteria, plus an additional requirement that chosen sources must be at least 600 m from the next nearest chosen source, 107 sources were selected for inclusion in the study and 854 households were randomly selected from among the list of users at each water source. Household questionnaires, including sections on demographics, primary drinking water source, household health, and the WaterGuard purchase offer, were conducted during October and November, 2011.

2.3. Product and Purchase Offer

Point-of-use chlorination of drinking water has been shown to decrease the risk of child diarrhea by 29% [21]. Since 2003, Population Services International has socially marketed WaterGuard in Kenya, ensuring that the product is available in shops at a standardized price and covering the costs of advertising and quality control [22]. A 150 mL bottle of WaterGuard (shown in Figure 1) is enough to treat one month of drinking water for the average family (or 1000 liters of water). At the time of the study, the bottle was sold at shops in towns near the rural study area in Kenya for 20 Kenyan shillings (Ksh), or approximately 21 US cents. Instructions for use are simple. The process requires very little active time and relatively little wait time: add one capful of solution to 20 liters of non-turbid water (or two caps if turbid), agitate, and wait 30 min before consuming. If used within 48 h, sufficient chlorine residual remains to protect against recontamination of stored water.
Figure 1. 150 mL bottle of WaterGuard as sold in Kenya [22]
Water 06 01873 g001
Following the demographic component of the survey, respondents were given the opportunity to purchase a bottle of WaterGuard at a randomly assigned price. To demonstrate the WaterGuard offer, the enumerator first conducted a “practice” round in which respondents could purchase a packet of biscuits at a randomly assigned price. To introduce the WaterGuard product, half of the respondents were randomly selected to receive a “child message” and the other half an “adult message”, which emphasized the effect of the product on each group respectively. Enumerators were instructed to emphasize the bolded words in the messages presented below.
For respondents receiving the child-focused message, the enumerator said: “Remember, WaterGuard makes your water clean and safe. CHILDREN ARE ESPECIALLY LIKELY to become sick from drinking untreated water. You can protect your family by always treating your water with WaterGuard.” For respondents receiving the adult-focused message, the enumerator said, “Remember, WaterGuard makes your water clean and safe. EVEN ADULTS can become sick from drinking untreated water. You can protect yourself by always treating your water with WaterGuard.”
Respondents were randomly assigned to one of five offer prices: 5, 10, 15, 20, or 25 Ksh (5, 10, 15, 21, or 26 US cents based on 97 Ksh to the USD, the average exchange rate during study). The price was removed from an envelope and shown to the respondent. The enumerator explained: “The number in this envelope is the price at which you will be able to buy this bottle of WaterGuard. Would you like [and be able] to buy this bottle of WaterGuard for [offer price] KSH?” Only respondents who were able to pay the offer price at the time of the survey were allowed to purchase the bottle of WaterGuard from the enumerator; anyone could purchase the product in town for 20 Ksh. Although one of the offer prices exceeded the market price, respondents might nonetheless have purchased at the price of 25 Ksh if they had a high WTP and valued the convenience of the product being sold to them directly at their home.

2.4. Modeling Mean WTP and Correlates of Demand

The take-it-or-leave-it (TIOLI) format described above generates data comparable in structure to that elicited through the hypothetical scenarios presented in stated preference contingent valuation studies. Similar analytical methods can thus be used to estimate average WTP. This “referendum format” provides a dichotomous outcome: whether the household purchased the bottle of WaterGuard. Since we do not directly observe WTP, it must be inferred from the range which is known for each respondent. For instance, if the respondent accepts the price offered, we can assume that their WTP is equal to or greater than the offered price. If they reject the offered price, we assume that their WTP is below the offered price or zero.
To avoid the prediction of negative WTP, traditionally-used parametric estimators can be truncated at zero; however, this makes the models highly sensitive to distributional assumptions regarding the upper tail [23]. As explained by Haab et al. [23], non-parametric estimation methods, such as the Turnbull estimator, provide a straightforward method of estimating mean WTP without distributional assumptions. We estimate three non-parametric estimates for average willingness to pay: Turnbull lower bound, a corresponding upper bound estimate, and Kristom mid-point.
The Turnbull lower-bound estimate for average WTP is calculated by multiplying the fraction of the sample within each range of WTP by the lower bound of these two prices. The WTP estimates within each price range are then summed to estimate average WTP. We extend this model to an “upper-bound” estimate in which it is assumed that respondents who refused to pay a given offer price would have been willing to pay just below the offer price. Kristom [24] suggested a “mid-point” estimator that assumes that WTP is uniformly distributed between two offer prices. We also present mean WTP based on a probit model for comparison.
To examine the characteristics correlated with WTP, a multivariate probit model is used. Analysis of the data was conducted using Stata11 (StataCorp LP, College Station, TX, USA) and was clustered at the village level.

3. Results

3.1. Respondent and Household Characteristics

Table 1 provides summary statistics for the 854 respondents in the sample. A typical respondent in the sample was a thirty-seven year-old female who had completed seven years of schooling. There was one child under five in the household. Her family owned their house, which was constructed with mud or cow dung walls and an iron sheet roof, and did not have electricity. Typical households owned two cows, one cell phone, and one radio or cassette player.
Nearly all respondents reported to use a naturally-occurring spring as their primary water source. Only 34% of respondents reported to perceive their water as “very clean”. In addition to individual perception, village average of perceived drinking water quality for the source was used as an estimate of water quality, removing some of the measurement error inherent in individual perceptions. Almost half of the respondents reported that they were aware of nearby cholera or typhoid outbreaks in the last year and 11% reported that a member of the household had been sick in the last two weeks due to bad water. Nearly all respondents had heard of WaterGuard or another type of chemical treatment and 81% reported using chemical water treatment previously. Forty-two percent of respondents reported that they had used WaterGuard or another type of chemical household water treatment product in the last month.
Table 1. Mean and standard deviation of respondent and household characteristics, perceptions of water and health, and water treatment knowledge and use.
VariableDescriptionMean (SD)
Respondent and household characteristics
Age of respondentCalculated based on year born36.88 (11.13)
Years of EducationRespondent years of education7.03 (2.91)
Member of active savings group1 if respondent is a member of an active savings group0.66 (0.47)
Children under 51 if there is at least 1 child under 5 in the household0.70 (0.46)
Cell phonesAverage number of cell phones owned by households1.02 (0.80)
Radios/cassette playersAverage number of radios/cassette players owned by household0.91 (0.48)
CowsAverage number of cows owned by households2.22 (2.30)
Water and health
Individual perception of water source as “very clean”1 if respondent ranked their selected drinking water source as “very clean”0.34 (0.48)
Village average perceived water source qualityScale of 1–5 where 1 is very clean and 5 is very unclean2.05 (0.52)
Knowledge of cholera or typhoid1 if respondent is aware of cholera or typhoid outbreaks nearby in last year0.42 (0.49)
Sick from contaminated water1 for anyone sick from contaminated water in last 14 days0.11 (0.31)
Has heard of WaterGuard product1 if respondent has ever heard of WaterGuard0.98 (0.12)
Has ever treated drinking water with a chemical product1 if respondent has ever used a chemical product to treat drinking water0.81 (0.39)
Treated drinking water in last month with a chemical product1 if respondent has used a chemical product to treat drinking water in last month 0.42 (0.49)
Randomization of households was successful; household and respondent characteristics are similar across the assigned price cohorts: out of 60 means tests conducted, only two differed at the p < 0.05 level. This is slightly fewer than the 3% expected to differ based on chance (see Appendix 1).

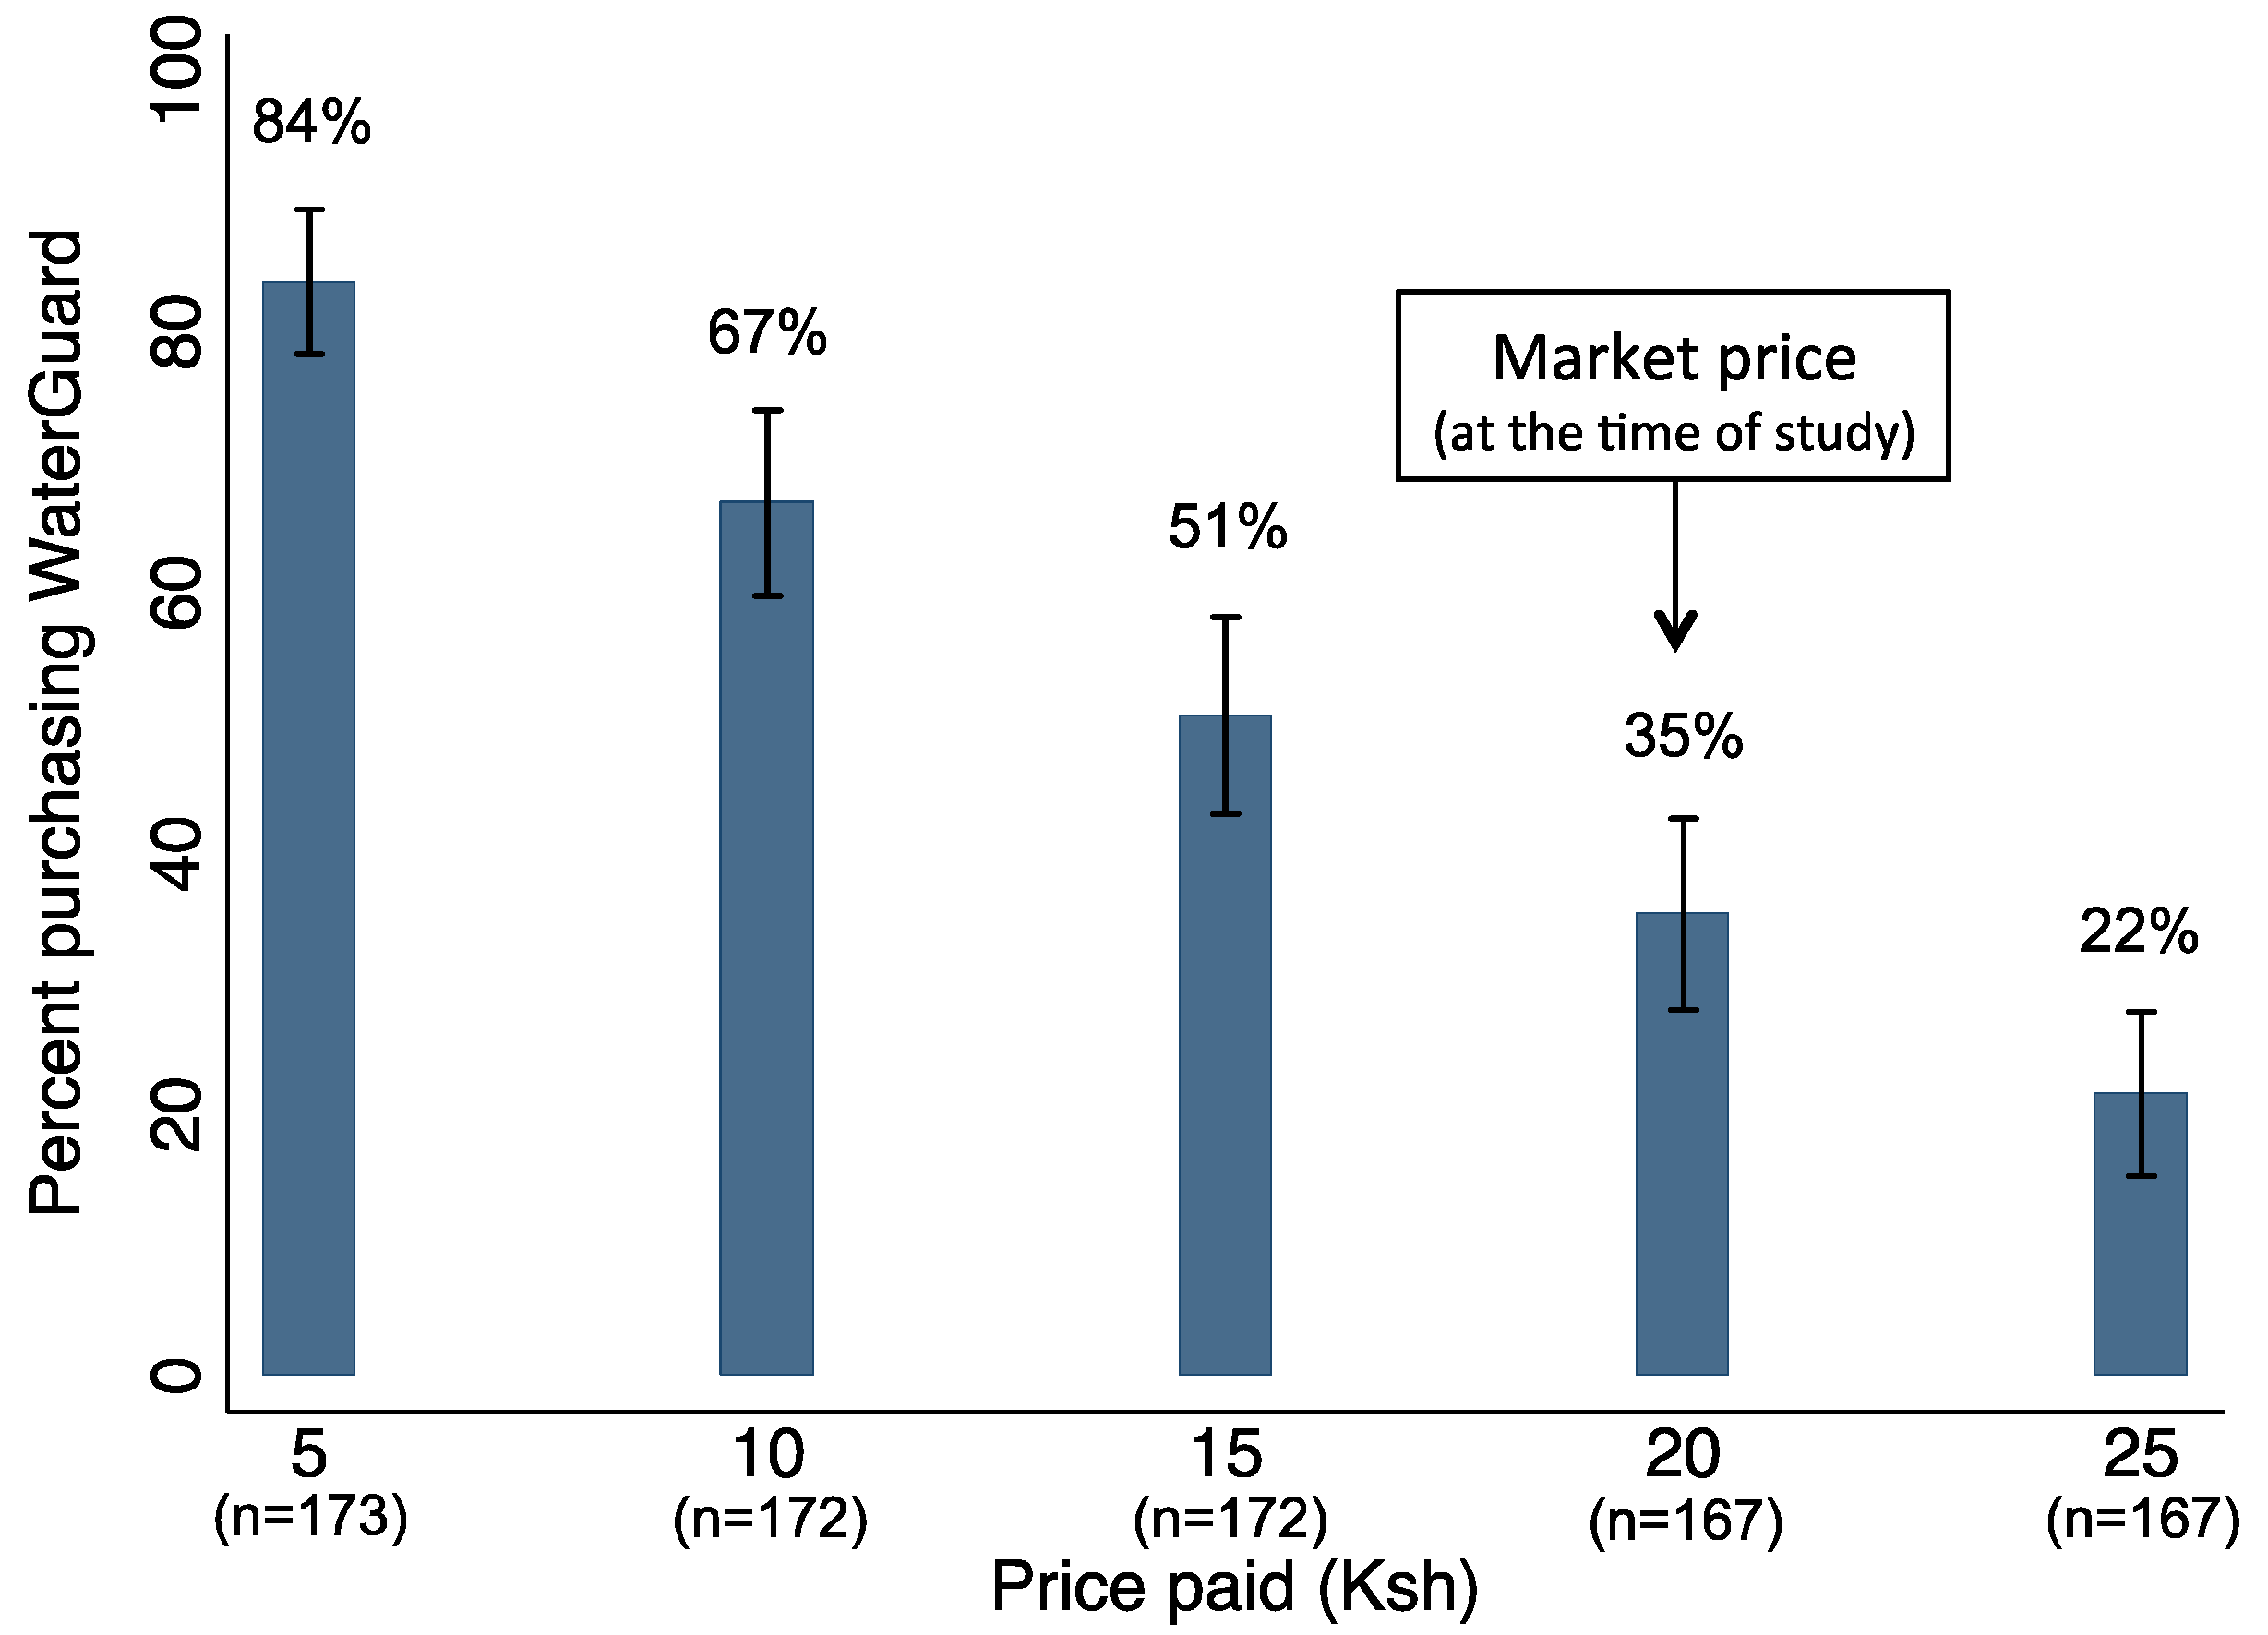
3.2. Estimated Average WTP

Eight hundred fifty one respondents participated in the willingness to pay module. Fifty-two percent of respondents purchased the bottle of WaterGuard at the price assigned to them. Figure 2 shows the percentage of respondents who purchased WaterGuard at each of the offered prices. The percent of households purchasing the product decreased from 84% at a price of 5 Ksh to 35% at the market price of 20 Ksh.
Table 2 presents four estimates of average WTP: three based on non-parametric models (Turnbull and Kristom) and one parametric probit model. We estimate average WTP to be approximately 16 Kenyan Shillings or 16 US cents. WaterGuard was sold for 20 Ksh at the time of the study so mean WTP represented 80% of the market price.
Figure 2. Percentage of respondents purchasing WaterGuard at the offered prices.
Water 06 01873 g002
Table 2. Non-parametric and parametric estimates of average willingness to pay (WTP) in Kenyan Shillings (Ksh).
Non-parametricParametric
Turnbull Lower boundKristomUpper boundProbit
Mean WTP 13.26 Ksh16.17 Ksh19.07 Ksh15.58 Ksh

3.3. Household Characteristics Correlated with WTP

Table 3 gives the probit model for purchase of WaterGuard. Relative to a price of 5 Ksh, households were statistically significantly less likely to purchase WaterGuard at higher prices, as we would expect. Respondents who are part of an active savings group are statistically significantly more likely to purchase WaterGuard at the offered price (p < 0.01). This makes sense, as these respondents are likely more careful about managing money. Not having money in the house was the reason given by all respondents who were interested in purchasing WaterGuard but were not able to do so at the time of the survey. Respondents reporting to have used WaterGuard or another chemical treatment in the last month were also more likely to purchase the product (p < 0.05).
We do not find a statistically significant relationship between having attended primary school and the purchase decision. Alternative specifications for education (number of years of education or categories of low, middle, or high education) were similarly not found to have a statistically significant relationship with purchase decision. The coefficient on the principal components analysis (PCA) wealth score based on household assets is positive and weakly statistically significant. As an alternative measure to proxy for wealth, the number of cell phones owned by the household (which ranged from 0 to 7 in the sample) was also modeled. The coefficient on number of cell phones owned by the household was found to be positive and statistically significant, which may reflect wealth or perhaps interest in “new” or “modern” products. Probit models including these additional education and wealth specifications are provided in Appendix 2.
Table 3. Full probit regression model for the purchase of WaterGuard.
Dependent Variable: Paid for WaterGuardProbit
Price Offered (relative to 5 Ksh)
Offer Price 10 Ksh−0.563 ***
(0.178)
Offer Price 15 Ksh−1.012 ***
(0.162)
Offer Price 20 Ksh−1.355 ***
(0.148)
Offer Price 25 Ksh−1.841 ***
(0.174)
Respondent characteristics
Has attended primary school (dummy)−0.0519
(0.0990)
PCA normalized wealth score0.665 *
(0.377)
Member of an active savings group0.315 ***
(0.103)
Has ever used chemical water treatment(0.125)
(0.120)
Used chemical water treatment last month0.247 **
(0.103)
Health and water characteristics
Individual perception of drinking water as “very clean” −0.00419
(0.108)
Village average perceived water quality0.0347
(0.115)
Children under 5 in the household−0.0240
(0.156)
Illness from bad water last 2 weeks0.228
(0.151)
Knowledge of cholera or typhoid0.0479
(0.107)
Received the child message0.0344
(0.148)
Interaction: child under 5 × child message−0.145
(0.154)
Constant0.520
(0.354)
Observations813
Notes: Robust standard errors in parentheses. *** p < 0.01; ** p < 0.05; * p < 0.1.
None of the health and water characteristics, including having a child under the age of five in the household or reporting recent household illness due to poor quality water, are statistically significant in any of the models. The randomly assigned marketing message emphasizing children’s vulnerability and the ability of WaterGuard to protect their drinking water had no effect, even among households with children in this age group.
To investigate the correlates of purchasing WaterGuard at the highest prices, we added a term interacting whether a household was offered a high price and the wealth score. This term is thus equal to zero for households offered a price for WaterGuard below 20 Ksh and equal to the wealth score for those households that were offered a price of 20 or 25 Ksh. Table 4 presents the coefficients on the interaction term and its components. We find that the coefficient on the interaction term is statistically significant at the 5% level, indicating that wealthier households were more likely to purchase WaterGuard at the two highest offer prices than poorer households. In addition, the same independent variables as listed in Table 3 are included in the model, but coefficients are not reported here as they are qualitatively identical to those shown in Table 3.
Table 4. Wealth score and high offer price interaction term and component variables from probit regression model for the purchase of WaterGuard.
Dependent variable: paid for WaterGuardProbit
Additional independent variables from Table 3 not shown
Interaction: wealth score × offer high price (20 Ksh or 25 Ksh)1.358 **
(0.645)
Offer Price 20 Ksh (relative to 5 Ksh offer price)−1.564 ***
(0.157)
Offer Price 25 Ksh (relative to 5 Ksh offer price)−2.067 ***
(0.179)
PCA normalized wealth score0.148
(0.477)
Observations813
Notes: Robust standard errors in parentheses. Control variables shown in Table 3 are also included but not reported here. *** p < 0.01; ** p < 0.05; * p < 0.1.

4. Conclusions

This study used randomly assigned prices and real purchase decisions to estimate average WTP for WaterGuard and identify characteristics associated with demand in rural Kenya. We find that average WTP for WaterGuard is approximately 16 Kenyan shillings or 16 US cents, 80% of the local market price. Households that report to have used WaterGuard or another chlorine treatment product in the last month are more likely to purchase the bottle of WaterGuard. Similar to Ashraf et al. [8] and Kremer et al. [10], we find that respondents are willing to pay for WaterGuard at prices below the market price, but they are highly price sensitive. It should be noted that 34% of respondents reported that they perceived their drinking water to be very clean, which may have led to lower WTP; however, these respondents reported to have used chemical water treatment products in the last month at nearly the same rate as the rest of the sample (40% and 44% respectively).
Wealth is weakly correlated with the purchase decision across prices, and we find that wealthier households are significantly more likely than poorer households to purchase WaterGuard at the market price. Membership in an active savings group is highly statistically significantly associated with the decision to purchase WaterGuard. However, none of the health or water variables are statistically significantly associated with purchase decision. This is consistent with findings by Kremer et al. [10] and Berry et al. [9] that households with young children that could benefit the most from use of household water treatment do not appear to be more likely to purchase these products. A message emphasizing children’s vulnerability to waterborne disease had no effect on the decision of such households to purchase WaterGuard, relative to those who received a message stressing that even adults can become sick from drinking untreated water. It is not clear whether this message was ineffective because it did not provide respondents with new information (they were already aware that water treatment disproportionately benefits children), or whether different or more strongly worded child or adult-focused messages would have been more effective at influencing purchase decisions.
The fact that respondents faced an actual purchase decision reduces a number of the biases associated with hypothetical stated preference work. Nevertheless, social desirability bias is still a threat in this experimental design, as respondents may have felt a social cost of refusing to buy WaterGuard in the face-to-face interactions with study enumerators. In this study, WaterGuard was sold to respondents by enumerators that came door-to-door, making it more convenient to purchase. WTP might be lower if respondents had to travel to a shop to purchase the product. However, WaterGuard is sold in the shops where respondents buy other goods, so purchasing WaterGuard would be relatively convenient for many respondents. There are also organizations such as the Safe Water and AIDS Program (SWAP) and LivingGoods, which use this model of selling health products (including WaterGuard) door-to-door in the study area. Finally, this study sold subsidized WaterGuard as a one-time offer. Respondents may have been less interested in purchasing the product if they thought that they would need to continue to purchase the product at the higher market price in the future to achieve the desired health outcomes. The fact that WaterGuard was offered at a discount relative to the known market price may also have increased demand relative to a situation in which the market price itself changed.
A limitation of this work is that we do not have information about whether these respondents understood the connection between diarrheal disease and water quality. A recent study also in western Kenya found that 70% of respondents attributed “dirty water” to be a cause of diarrhea [10], and given the high rates of prior use of WaterGuard among our study population, it seems unlikely that lack of understanding about the benefits of water treatment is a primary explanation for low WTP.
This study is one of the first rigorous estimations of average WTP for household drinking water treatment in which consumers faced an actual purchase decision. The rate of purchase was 32% higher among households offered WaterGuard at half of the market price at the time of the study compared to those offered WaterGuard at the full market price. Given that diarrheal disease accounts for 20.5% of child deaths in Kenya [25], reducing the price of WaterGuard could have substantial public health significance. Additional research is needed on ways to provide consumers safe drinking water at prices they are willing and able to pay.

Acknowledgments

Thanks to Olga Rostapshova for helping to design and oversee a related study, Renaud Lapeyre for supervising the data collection, the enumerators, the rest of the Innovations for Poverty Action-Kenya staff for administrative and logistical field support, Eric Dodge for data cleaning, and the participants in the study for their time.
This material is based upon work supported by the National Science Foundation Graduate Research Fellowship Program under Grant No. DGE-1144081, the International Initiative for Impact Evaluation, the Spanish Impact Evaluation Fund, the Japanese International Cooperation Agency, and the Radcliffe Institute for Advanced Study.

Author Contributions

Clair Null and Vivian Hoffmann designed the study and remotely supervised data collection. Annalise G. Blum analyzed the data and wrote the first draft of the manuscript, with input from Clair Null and Vivian Hoffmann. All authors reviewed the final manuscript.

Appendix 1. Summary Statistics for Offered Price Groups

Table A1. Summary statistics of respondent and household characteristics across assigned promotional prices. Mean and standard deviation is reported for those offered a price of 5 Ksh. For groups offered 10, 15, 20, or 25 Ksh, the coefficient and standard error of each price dummy in a regression predicting each independent variable is displayed. Statistically significant differences between the groups are marked *** p < 0.01; ** p < 0.05; * p < 0.1.
VariableKsh5 mean (SD)Ksh10 (SE)Ksh15 (SE)Ksh20 (SE)Ksh25 (SE)
Village average perceived quality of drinking water source2.000.090.040.060.06
(0.52)(0.06)(0.06)(0.06)(0.06)
Children under 5 in the household0.690.040.000.010.02
(0.46)(0.05)(0.05)(0.05)(0.05)
Illness in the household from bad water in the last 2 weeks0.11−0.030.02−0.010.03
(0.31)(0.03)(0.03)(0.03)(0.03)
Knowledge of cholera or typhoid0.48−0.06−0.05−0.15 ***0.01
(0.50)(0.05)(0.05)(0.05)(0.05)
Received the child message0.50−0.010.020.010.03
(0.50)(0.05)(0.05)(0.05)(0.05)
Interaction of having a child under 5 and child message0.320.030.070.020.03
(0.47)(0.05)(0.05)(0.05)(0.05)
Age of respondent35.900.880.902.15 *0.92
(10.77)(1.20)(1.20)(1.20)(1.20)
Has ever used chemical treatment0.770.040.000.020.10 **
(0.42)(0.04)(0.04)(0.04)(0.04)
Used chemical treatment in the last month0.45−0.080.00−0.080.04
(0.50)(0.05)(0.05)(0.05)(0.05)
Has attended primary school (dummy)0.52−0.04−0.06−0.06−0.06
(0.50)(0.05)(0.05)(0.05)(0.05)
Number of cell phones owned by household0.970.09−0.010.040.10
(0.74)(0.09)(0.09)(0.09)(0.09)
Member of an active savings group0.620.09 *0.060.020.00
(0.49)(0.05)(0.05)(0.05)(0.05)

Appendix 2. Additional Probit Regression Models

Table A2. Probit regression models for the purchase of WaterGuard: alternative education specifications (Models 1 and 2) and number of cell phones as a proxy for wealth (Model 3).
Dependent Variable: Paid for WaterGuard(1)(2)(3)
Price Offered (relative to 5 Ksh)
Offer Price 10 Ksh-0.565***-0.556***-0.598***
(0.179)(0.178)(0.179)
Offer Price 15 Ksh-1.024***-1.003***-1.038***
(0.163)(0.161)(0.163)
Offer Price 20 Ksh-1.365***-1.345***-1.401***
(0.149)(0.147)(0.149)
Offer Price 25 Ksh-1.852***-1.832***-1.904***
(0.176)(0.172)(0.179)
Respondent characteristics
Years of education-0.0199
(0.0168)
Mid-education category dummy (7–8 years)-0.0419
(0.102)
High-education category dummy (>8 years)0.0670
(0.140)
Has attended primary school (dummy)-0.104
(0.0995)
PCA normalized wealth score0.724*0.585
(0.386)(0.382)
Number of cell phones owned by the HH0.259***
(0.0693)
Member of an active savings group0.319***0.317***0.301***
(0.104)(0.103)(0.103)
Used chemical water treatment last month0.261**0.237**0.227**
(0.102)(0.102)(0.102)
Health and water characteristics
Individual perception: “very clean” water-0.00876-0.00782-0.0164
(0.109)(0.108)(0.110)
Village average perceived water quality0.03380.03530.0296
(0.115)(0.114)(0.115)
Children under 5 in the household-0.0396-0.0745-0.0873
(0.163)(0.161)(0.161)
Illness from bad water last 2 weeks0.2260.2250.227
(0.151)(0.151)(0.152)
Knowledge of cholera or typhoid0.04470.05050.0791
(0.108)(0.107)(0.112)
Received the child message-0.00661-0.0240-0.00401
(0.195)(0.195)(0.196)
Interaction: child under 5 × child message-0.0842-0.0714-0.0906
(0.228)(0.230)(0.227)
Constant0.657*0.5700.498
(0.387)(0.377)(0.382)
Observations813813820
Notes: Robust standard errors in parentheses. *** p < 0.01; ** p < 0.05; * p < 0.1.

Conflicts of Interest

The authors declare no conflict of interest.

References

  1. Liu, L.; Johnson, H.L.; Cousens, S.; Perin, J.; Scott, S.; Lawn, J.E.; Rudan, I.; Campbell, H.; Cibulskis, R.; Li, M.; et al. Global, regional, and national causes of child mortality: An updated systematic analysis for 2010 with time trends since 2000. Lancet 2012, 379, 2151–2161. [Google Scholar] [CrossRef]
  2. Walker, C.L.F.; Rudan, I.; Liu, L.; Nair, H.; Theodoratou, E.; Bhutta, Z.A.; O’Brien, K.L.; Campbell, H.; Black, R.E. Global burden of childhood pneumonia and diarrhoea. Lancet 2013, 381, 1405–1416. [Google Scholar] [CrossRef]
  3. Clasen, T.; Cairncross, S.; Haller, L.; Bartram, J.; Walker, D. Cost-effectiveness of water quality interventions for preventing diarrhoeal disease in developing countries. J. Water Health 2007, 5, 599–608. [Google Scholar] [CrossRef]
  4. Rosa, G.; Clasen, T. Estimating the scope of household water treatment in low- and medium-income countries. Am. J. Trop. Med. Hyg. 2010, 82, 289–300. [Google Scholar]
  5. Null, C.; Kremer, M.; Miguel, E.; Hombrados, J.G.; Meeks, R.; Zwane, A.P. Willingness to Pay for Cleaner Water in Less Developed Countries: Systematic Review of the Experimental Evidence; The International Initiative for Impact Evaluation: London, United Kingdom, 2012; pp. 1–46. [Google Scholar]
  6. Whittington, D. What have we learned from 20 years of stated preference research in less-developed countries? Annu. Rev. Resour. Econ. 2010, 2, 209–236. [Google Scholar] [CrossRef]
  7. Murphy, J.J.; Allen, P.G.; Stevens, T.H.; Weatherhead, D. A meta-analysis of hypothetical bias in stated preference valuation. Environ. Resour. Econ. 2005, 30, 313–325. [Google Scholar] [CrossRef]
  8. Ashraf, N.; Berry, J.; Shapiro, J.M. Can higher prices stimulate product use? evidence from a field experiment in Zambia. Am. Econ. Rev. 2010, 100, 2383–2413. [Google Scholar] [CrossRef]
  9. Berry, J.; Fischer, G.; Guiteras, R. Eliciting and Utilizing Willingness to Pay: Evidence from Field Trials in Northern Ghana; Working Paper; International Growth Centre: London, United Kingdom, 2011; pp. 1–43. [Google Scholar]
  10. Kremer, M.; Miguel, E.; Sendhil, M.; Null, C.; Zwane, A.P. Making Water Safe: Price, Persuasion, Peers, Promoters, or Product Design? Working Paper; Harvard University: Cambridge, MA USA, 2009; pp. 1–59. [Google Scholar]
  11. Kremer, M.; Leino, J.; Miguel, E.; Zwane, A.P. Spring cleaning: Rural water impacts, valuation, and property rights institutions. Q. J. Econ. 2011, 126, 145–205. [Google Scholar] [CrossRef]
  12. Luoto, J.; Mahmud, M.; Albert, J.; Luby, S.; Najnin, N.; Unicomb, L.; Levine, D.I. Learning to dislike safe water products: Results from a randomized controlled trial of the effects of direct and peer experience on willingness to pay. Environ. Sci. Technol. 2012, 46, 6244–6251. [Google Scholar]
  13. Jalan, J.; Somanathan, E. The importance of being informed: Experimental evidence on demand for environmental quality. J. Dev. Econ. 2008, 87, 14–28. [Google Scholar] [CrossRef]
  14. Jessoe, K. Improved source, improved quality? Demand for drinking water quality in rural India. J. Environ. Econ. Manag. 2013, 66, 460–475. [Google Scholar] [CrossRef]
  15. Bennear, L.; Tarozzi, A.; Pfaff, A.; Soumya, H.B.; Ahmed, K.M.; van Geen, A. Bright Lines, Risk Beliefs, and Risk Avoidance: Evidence from a Randomized Intervention in Bangladesh; ERID Working Paper Number 77; Economic Research Initiatives at Duke: Durham, NC, USA, 2011; pp. 1–34. [Google Scholar]
  16. Opar, A.; Pfaff, A.; Seddique, A.A.; Ahmed, K.M.; Graziano, J.H.; van Geen, A. Responses of 6500 households to arsenic mitigation in Araihazar, Bangladesh. Health Place 2007, 13, 164–172. [Google Scholar] [CrossRef]
  17. Madajewicz, M.; Pfaff, A.; van Geen, A.; Graziano, J.; Hussein, I.; Momotaj, H.; Sylvi, R.; Ahsan, H. Can information alone change behavior? Response to arsenic contamination of groundwater in Bangladesh. J. Dev. Econ. 2007, 84, 731–754. [Google Scholar] [CrossRef]
  18. Korenromp, E.L.; Miller, J.; Cibulskis, R.E.; Cham, M.K.; Alnwick, D.; Dye, C. Monitoring mosquito net coverage for malaria control in Africa: Possession vs. use by children under 5 years. Trop. Med. Int. Health 2003, 8, 693–703. [Google Scholar] [CrossRef]
  19. Mugisha, F.; Arinaitwe, J. Sleeping arrangements and mosquito net use among under-fives: Results from the Uganda Demographic and Health Survey. Malar. J. 2003, 2, 1–10. [Google Scholar] [CrossRef]
  20. Hoffmann, V. Intrahousehold allocation of free and purchased mosquito nets. Am. Econ. Rev. 2009, 99, 236–241. [Google Scholar] [CrossRef]
  21. Arnold, B.; Colford, J.M. Treating water with chlorine at point-of-use to improve water quality and reduce child diarrhea in developing countries: A systematic review and meta-analysis. Am. J. Trop. Med. Hyg. 2007, 76, 354–364. [Google Scholar]
  22. Centers for Disease Control. Preventing Diarrheal Disease in Developing Countries: The CDC/PSI/Rotary Safe Water System Project in Western Kenya; Centers for Disease Control and Prevention: Atlanta, GA, USA, 2005; p. 1. [Google Scholar]
  23. Haab, T.C.; McConnell, K.E. Referendum models and negative willingness to pay—Alternative solutions. J. Environ. Econ. Manag. 1997, 32, 251–270. [Google Scholar] [CrossRef]
  24. Kristom, B. A non-parametric approach to the estimation of welfare measures in discrete response valuation studies. Land. Econ. 1990, 66, 135–139. [Google Scholar] [CrossRef]
  25. Black, R.E.; Cousens, S.; Johnson, H.L.; Lawn, J.E.; Rudan, I.; Bassani, D.G.; Jha, P.; Campbell, H.; Walker, C.F.; Cibulskis, R.; et al. Global, regional, and national causes of child mortality in 2008: A systematic analysis. Lancet 2010, 375, 1969–1987. [Google Scholar] [CrossRef]

