Article

Feasibility Study of a Simple and Low-Cost Device for Monitoring Trihalomethanes Presence in Water Supply Systems Based on Statistical Models

1
Department of Electronics and Computer Technology, University of Granada, Granada 18012, Spain
2
Department of Civil Engineering, Section of Environmental Technology, University of Granada, Granada 18012, Spain
3
Institute of Water Research, University of Granada, Granada 18012, Spain
4
Department of Civil Engineering, Section of Electrical Engineering, University of Granada, Granada 18012, Spain
*
Author to whom correspondence should be addressed.
Water 2014, 6(12), 3590-3602; https://doi.org/10.3390/w6123590
Submission received: 28 July 2014 / Revised: 6 November 2014 / Accepted: 17 November 2014 / Published: 25 November 2014

Abstract

:
This paper describes a new method for predicting trihalomethanes (THMs) presence in networks of water supply systems, using a low-cost device that permits a fast monitoring of concentrations without need of complex analysis made in laboratories. This method, based on statistical models, allows the estimation of THM concentration by monitoring parameters whose determination is direct and easy, and therefore, THM presence can be carried out in real-time. These parameters values are introduced in a multiple regression model resulting in the concentration of THMs levels. This model has taken into account parameters compulsory in water quality analysis and it has been shown that six parameters are enough to determine accurately THM concentration. In addition, the feasibility of a low-cost device that directly gives THM concentration is demonstrated. This device can be easily designed to be transported to different points of the water supply network where it is intended to make control campaigns.

Graphical Abstract

1. Introduction

The use of chlorine revolutionized water treatment at the beginning of the 20th century; in fact the chlorination is currently the most extended system for disinfection throughout the world. However, recent research has shown that chlorine, when added to the water supply, can produce dangerous compounds, which may cause cancer [1,2,3]. More specifically, chlorine reacts with natural organic carbon in the water to form trihalomethanes (THMs) [4]. The THMs is a disinfection by-product (DBP) that is produced by the reaction of the naturally occurring organic compound in the water and the chlorine added as a disinfection agent [5].
In addition to this, compliance with the European Council Directive 98/83/CE [6] and the deeper understanding in the society about environmental conservation and preservation has brought as a result the establishment of strict requirements for wastewater treatment plants as well as drinking water plants. These regulations pursue to diminish the negative impact on ecosystems and human health. As a consequence of these huge and fast changes, water and wastewater treatment have had to make great effort to achieve the new requisites. Among these new requirements introduced by the Directive 98/83/CE, the obligation to control the presence of THMs in water supply systems is included. Because of the impact on human health and changes in existing supply facilities that this requires, without a doubt, its monitoring and control will be of great importance.
DBP monitoring is usually time consuming and involves expensive techniques such as gas chromatography analysis. Hence, particular interest has grown on the development of models to estimate the formation of DBP, which may be an alternative for the monitoring of DBPs in the field. Conversely, the models can also be very useful in verifying key operational and water quality parameters, which may help to explain the DBP formation potential. So another possibility is to predict THMs concentration indirectly by mathematical models based on other materials and substances present in the water, that are much easier to measure. Such models can be applied in areas where it is difficult to perform the analyses required [7,8]. Indeed, the analysis of disinfection by-products is expensive and developing a simple tool that will allow knowing the concentrations of THMs, particularly in small or poorly resourced water supplies, is a worthy intention.
Therefore, the main objective of this work consisted in the search of a simple system that will allow us to quickly estimate the amount of THMs present in water without requiring their analyses in the laboratory. For this purpose, we have developed a statistical model based on multiple regression from real water samples and confirmed its suitability for the studied water. This kind of model has been chosen due to the fact that, according to Kulkarni and Chellam [9], DBP mass concentrations are typically modeled empirically by linearly regressing each of the water quality parameters influencing DBP formation. In addition, log-linear power functions are extensively employed to model THM and Haloacetic acid (HAA) formation [10,11,12,13,14].
As mentioned before, measurement of DBP concentration in drinking water usually requires tedious techniques which are time consuming and significantly expensive. There have been many efforts in development predictive models for DBPs. Initial models included univariate analysis where DBPs were correlated with Total Organic Carbon (TOC) content in raw waters [15]. Other works have looked for relationships between precursor and operational indicators and DBPs as well as between different species of DBPs [16,17,18,19,20]. There have been also developed multivariate models to correlate DBPs with different combinations of explanatory variables, such as water quality and parameters related to disinfection. Furthermore, predictive models for DBPs are based on data from field and laboratory-scaled studies. These data are collected at different sampling points. Most of these models have been based on empirical relationships among different parameters and DBPs concentrations, whilst a limited number of studies based on kinetic relationships have been performed [21,22,23,24,25,26]. These models have been usually developed using multivariate regression techniques while some studies are based on first- and second-order kinetic models and the coefficients have been estimated using multivariate regression analyses.
In relation to measuring instruments, electronic tongues and noses have emerged as a fast, low-cost and easy system for the automated detection and classification of odor, vapors, gases and liquid analysis. The strategy is based on the employment of specific sensors that generates a signal pattern related to either a quality aspect or a specific component when it is exposed to a sample. Although the output of only one sensor is not enough to provide a complete characterization of the sample, the combination of several different devices can give lot of valuable information. Due to the versatility of electronics tongues and noses, there is a lot of research interest in their development for a wide range of applications, such as food industry (milk, wine, beer, fish, etc.) [27,28,29,30,31,32,33], environmental analyses, water quality monitoring, etc. [27,34,35,36,37]. For instance, Campos et al. [27] show an electronic tongue that is able to analyze COD (Chemical Oxygen Demand), BOD (Biochemical Oxygen Demand), ammonia (NH4–N), orthophosphate (PO3–P), sulphate (SO4–S), acetic acid (HCA) and alkalinity (Alk) from an array of metallic electrodes and using a partial least squares (PLS) analysis. Another example of electronic tongue for water analysis is proposed by Kundu et al. [38]. In that work a system for water sample authentication is presented based on a back-propagation learning based neuronal network (BPNN). Finally, not only chemical and physical properties can be determined, but also biological parameters, for example, Nayak et al. [35] present an electronic nose for Escherichia coli (E. coli) applying a pattern recognition.
In particular, we propose a device with different integrated sensors that measure several simple parameters on-site. The values obtained from these measures are automatically introduced into a mathematical model based on multiple regression, obtaining the value of THMs concentration estimated by the model. As on-site measurements are made in continuous, data acquisition procedure can be programmed with the model with the desired frequency.
The device is designed to be easily transported to different points of the water supply system, where it is intended to carry out a control campaign. In case of detection of high concentrations of THMs, it could be reasonable taking samples and to make an exhaustive analysis in the laboratory, but having the certainty that there is actually a problem.
It is also important to keep in mind that the problems with the THMs in the water supply systems are usually seasonal, having the higher risk of concentration in summer. This means that the device designed is useful to transport it from one place to another, as indicated above, but it is also interesting if it is installed for a prolonged period at a specific point in the network, in order to alert us in case of an upward trend of the THMs concentration, and thus avoiding costly campaigns of laboratory analysis or measures to control them.

2. Materials and Methods

2.1. Characterization of Data

The analyses upon which this study is based were composed of a total of 87 parameters, which should be included in the complete analyses described in current regulations [6]. The analyses were performed on real samples collected from different water distribution networks. A total of 892 analyses were performed on populations in a regional community in Spain. This regional community is located on the Mediterranean coastline, where the drinking water has high levels of THMs. These data have been provided by the AGBAR Corporation (Aguas de Barcelona, Barcelona, Spain), a multinational holding company of water management.
From these 892 analyses and 87 different parameters, only those parameters included in all of the analyses were finally taken into account for the model. In addition, some potentially important parameters could not be taken into account because they are not included in the complete analysis described in the European Council Directive 98/83/CE.
Multiple regressions and analysis of variance were performed to model the dependency of total THMs values with these 87 parameters, but finally, (as described in Section 2.2 and Section 3), seven parameters showed the most significant relation: Total Organic Carbon (TOC), Combined Residual Chlorine (CRC), Free Residual Chlorine, Bicarbonates, Conductivity, Chloride and Temperature (Table 1).
Table 1. Summary of most significant parameters measured in the 892 network water samples.
ParameterAverageStandard Deviation
Total Organic Carbon (mg/L)2.100.66
Combined Residual Chlorine (mg/L)0.800.31
Free Residual Chlorine (mg/L)0.610.29
Bicarbonates (mg/L)229.9476.40
Conductivity (μS/cm)1172.76615.89
Chloride (mg/L)221.56153.67
Temperature (°C)19.54.2
Total THM (μg/L)105.8063.61
Note: Analytical methods according to Annexes I and III of the Council Directive 98/83/CE (3 November 1998), the regulation where health criteria of the quality of water for human consumption are established.

2.2. Statistical Method

Multiple regression was performed to model the dependency of THMs values as well as One-way Analysis of Variance (ANOVA). The software SPSS (Version 15.0; SPSS Inc. Chicago, IL, USA) was used to manage and analyze data from the considered samples.
There are several examples where models based on multiple regressions were performed to predict Trihalomethanes formation [39,40,41,42]. It is true that the characteristics in the THMs formation makes it difficult to develop an equation that can be applied universally, but it is completely feasible to quickly obtain an equation that can be applied to water supply systems with similar environmental conditions. If the environmental conditions change, the same procedure can be applied, being this procedure fast, and the model easily adaptable.
Obviously, the relationships between the THMs levels and factors analyzed (total organic carbon, conductivity, combined residual chlorine, pH, temperature, bicarbonates) are not linear; therefore it was necessary to use statistical tools that allow us to correct the nonlinearity between variables.
One of these tools is known like “the bulging rule of Mosteller and Tukey” [43] that help to find existent linear relations between functions whose variables were used in the statistical analysis:
F(yi) = a0 + a1·G1(x1,i) +···+ap·Gp(xp,i) + εi; i = 1···N
where yi is the expected value directly related with the THMs concentration, aj are the coefficients as result of the regression analysis, xi,j are the observed values of the independent variables and εi is the error of the model. These independent variables are used to decide in which of a set of pre-established groups should be classified each sample.
With the data (yi, x1i, x2i, ..., xpi), 1 < i < n, we used an algorithm that allows us to find the transformations F y G, such that the empirical correlation of the transformed data (F(yj), G1(x1i), ..., Gp(xpi)) is approximately maximized. The procedure was made by using the above mentioned software and others algorithms like ACE (alternating conditional expectations), AVAS (additive and variance stabilization) and the Box-Cox transformations technique, obtaining similar results.
In any case, the procedure provides the coefficients aj and εi of Equation (1) with the data acquired from local samples, allowing the recalibration of the model when conditions change, in other words, shift the values of the equation coefficients but not the transformations F y G, therefore, there is only a general model where the values of the coefficients depend on the local characteristics of a region or group of water supply systems.

2.3. Device Description

The algorithm proposed as a result of the multiple regression analysis could be easily integrated in autonomous systems for monitoring the presence of total trihalomethanes in water. To do that, we have designed an electronic platform that integrates all the required sensors as well as the microcontroller with the proper matching networks to directly and fast obtain the value of THMs in water.
According to the algorithm of determination of THM presented in the following section, it is necessary to include six different sensors to detect the following properties:
  • pH
  • TOC
  • Cl
  • Bicarbonate
  • Conductivity
  • Temperature
In addition to these sensors, the platform must include all the required circuitry to match the output signal of the sensors to the microcontroller. There are many different transduction effects and each of them results in a different way to manipulate the signal. The manipulated signal has also to be between the operating ranges of the microcontroller. All this additional circuitry is referred as matching networks. Note that a block to provide power to the platform is also required.
Moreover, it is necessary to add mechanisms to acquire data. For this purpose a display to show results, a memory to store data and a user interface to be connected to a computer, are also included.
There are several of these sensors available in the market, so the development of the proposed platform should be immediate. Further research work can be done by design an integrated platform [44]. A first approach could be a TOC analyzer similar to the one described by Su et al. [45]. This analyzer is based on a Bulk Acoustic Wave (BAW) impedance sensor, where the Total Inorganic Carbon (TIC) value is directly measured and TOC value is obtained by oxidation of the sample. Another option could be the sensor one [46] based on a capacitance membrane.
In order to measure the pH, we propose a system similar to Fraser et al. [47] which provides directly a color barcode of the water pH. Another option is presented by Diamond et al. [48] with a pH sensor and the complete needed circuitry. Regarding the bicarbonate value, this sensor would be based on the patent of Benco et al. [49]. This sensor requires the measurement of the pH to determine bicarbonates, but this problem is solved due to the previous explained sensor.
Moreover, a chlorine sensor is also required. This device could be similar to the one described by Wang et al. [50], which is a resistance sensor, or similar to the one introduced by Chou et al. [51]. A conductivity sensor is also required, one example of this kind of transducer is shown by Hilhorst [52] where conductivity is related to changes in the electrical permittivity. Finally, a thermometer is also needed; there are several examples in the literature for this sensor [53]. Therefore, all these sensors are commercially available and also can be custom-manufactured.
As it has been mentioned above, each of these sensors requires a particular matching network to adapt its output signal to the input signal in the microcontroller. Furthermore, it is necessary to optimally program the microcontroller to calculate from the input signals, the corresponded values of each parameter and finally determine the THM value of the sample following Equation (1).
Finally, as it has been mentioned before, it is necessary to include a memory to store data, an interface to extract these data and/or a display to visualize the current measure to functionalize the electronic equipment.
According to the European Council Directive 98/83/CE, these data are requested 4–10 times/year depending on the volume of water distributed or produced each day within a supply zone; thus, this value would fix the minimum frequency to register these variables. Anyway, in order to have a more representative measure, it would be recommended to take at least three water samples but users could monitor as many times as they consider necessary taking into account the ease of measuring and calculations. Furthermore, there is no restriction on a specific point in the water network because this device is portable and operators can analyze water where they need it. Moreover, this feasibility is a key feature to detect anomalies in the network.

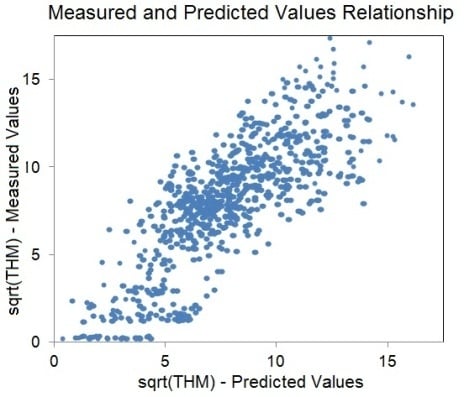
3. Results and Discussion

Multiple regressions and analysis of variance were performed to model the dependency of total THMs values with 87 parameters included in the Annexes I and III of the Council Directive 98/83/CE [6] but finally, seven parameters showed the most significant relation: Total Organic Carbon (TOC), Combined Residual Chlorine (CRC), Free Residual Chlorine, Bicarbonates, Conductivity, Chloride and Temperature.
For obtaining the statistical model, a transformation of the dependent variable (THMs) was proposed in order to improve the fit of the model. The first obtained model indicated that the fit was not appropriate enough (r = 0.686). However, the residual contains a certain functional dependence, which can be resolved by proposing a transformation of the dependent variable (THMs). This transformation consisted of a quadratic function.
Therefore, a model with transformed values provided a better fit (r = 0.923) with the next adjusted model:
THM = 28.826 + 1.583 · TOC + 2.713 · ln ( σ ) 1.307 · ln ( B c ) + 2.427 · pH + 3.744 · CRC + 0.102 · T ) ε ( THM ) = 1.8
where TOC is the Total concentration of Organic Carbon, Bc is the concentration of Bicarbonate, σ is the conductivity, CRC corresponds to Combined Residual Chlorine, T is the temperature at Celsius degree and ε is the mean absolute error. Similar studies [4,54] have shown values of the correlation coefficient r in the same order of magnitude than the one obtained in our model.
In this model, the total THMs values were transformed by means of the square root. Bivariate correlations between the different variables show that one of the most striking correlations is that between chlorides and conductivity (r = 0.945); therefore, both parameters should not be simultaneously included in the model to avoid multicollinearity problems, for this reason, chlorides were excluded since it was found that this variable is determined almost exactly by conductivity.
Furthermore, the variables, conductivity and concentrations of bicarbonates, were transformed by logarithms since the coefficients of the model were significantly low.
As a result, the different models studied were composed of the following variables, which showed the most significant relation to THMs:
  • TOC (Total Organic Carbon)
  • TOC and ln(σ)
  • TOC, ln(σ) and Combined Residual Chlorine (CRC)
  • TOC, ln(σ), CRC, and pH
  • TOC, ln(σ), CRC, pH and ln(Bc)
  • TOC, ln(σ), CRC, pH, ln(Bc) and Temperature
Of these six possibilities, the best was option 6 (TOC, conductivity, combined residual chlorine, pH, bicarbonates, and temperature) though the difference in goodness-of-fit was very similar in options 2 to 6, increasing the r values from 0.742 to 0.923.
A statistical summary of coefficients for the variables in the regression model is shown in Table 2, where aj are the coefficients of the linear equation and in brackets their associated standard error, βj are the associated standardized coefficient that show which of the independent variables have a greater effect on the dependent variable and finally, values t and associated significance indicated that the former coefficients were significantly different from zero, that is to say, all of them are statistically significant for the model. This Table shows that, statistically speaking, the most important predictor was TOC, followed by ln(conductivity), and then CRC. On another order of magnitude, with a similar significance but at some distance from the first three, are pH, ln(Bicarbonates), and temperature; in that order. Moreover, the sign of ln(Bicarbonates) is different from the rest. This means that the sense of its influence, implying its presence or absence, is the inverse of the other variables.
Table 2. Statistical summary of coefficients for the variables in the regression model.
Dependent Variable THM ajβjtSignificance
Total Organic Carbon (TOC)1.583 (0.071)0.53322.2290.000
ln(σ)2.713 (0.131)0.45920.7360.000
ln(Bc)−1.307 (0.192)−0.153−6.8040.000
Combined residual chlorine (CRC)3.744 (0.253)0.39914.7730.000
pH2.427 (0.270)0.2068.9920.000
Temperature0.102 (0.021)0.1154.7830.000
The relationship between measured values and predicted values by the model is shown in Figure 1. As can be seen, the prediction band of the fit was acceptable. The data were fairly homogeneous, but compatible with the prediction of the model.
Figure 1. Relationship between measured values and predicted values by the model.
Water 06 03590 g001
Some authors [42,43] also included the factor of season in their models because the seasons affect the THM formation. In our case, a statistical study of a climate factor indicated that the greatest differences were between the dry season and the rainy season. The dry season includes the moths of August, September, and October, and the rainy season is the rest of the year. During the dry season, a higher THMs concentration was expected. Nevertheless, regarding to the model, the differences were not statistically significant in the THM prediction and the factor of season was not included.

4. Conclusions

A new multiple regression model for total THMs formation was generated, and the feasibility of a device for its measurements was performed. The mathematical formulation can be integrated in an autonomous system for predicting total THM presence in networks of water supply systems.
The complexity of the trihalomethanes formation reaction makes it difficult to develop a universally applicable formula, but with this model it is completely feasible to obtain quickly an equation that can be applied to water supply systems with similar environment conditions. When environmental conditions change, a recalibration procedure is performed in order to recalculating coefficients, being this process fast and the model easily adaptable.
Regarding to the model, the most significant variables to predict the concentration of total THMs by order of importance were following:
-
Total organic carbon (TOC)
-
Combined residual chlorine (CRC)
-
Conductivity
-
pH
-
Bicarbonates
-
Temperature.
TOC was found to be the most significant parameter, followed by CRC and conductivity. The other parameters (pH, bicarbonates and temperature) were at a greater distance from the others. The seasonality was not included in the model although it is directly related with the temperature.
Chlorides were excluded since it was found that this variable is determined almost exactly by conductivity. This meant that if they had both been included in the model, this could have produced an overestimation of the importance of these variables.
Therefore, the designed electronic device has six different sensors that are commercially available and can also be custom-manufactured. Each of these sensors requires a particular matching network to adapt its output signal to the input signal in the microcontroller, then it is necessary to optimally program the microcontroller to calculate from the input signals, the corresponded values of each parameter and finally determine the total THM value of the sample. Finally, the system includes a memory to store data, an interface to extract these data and/or a display to visualize the current measure to functionalize the electronic equipment.
The device can be measuring in real time, sending an alert signal to the users in advance, allowing them to take appropriate measures before there are excessive concentrations of THM, which are not permitted by law. It is important to keep analyzing directly THM several times per year in order to verify or to recalibrate the model.
Preliminary experimental results show good agreement with the model.

Acknowledgments

We gratefully acknowledge financial support for this work from AGBAR Group (Aguas de Barcelona, Water Works Holding).

Author Contributions

Almudena Rivadeneyra has been primarily responsible for the compiled information and the development of the device configuration; Maria Jesús García-Ruiz and Alejandro González-Martínez have been responsible for the data treatment and the development of the model; Fernando Delgado-Ramos has been responsible for the technical supervision of the article, with knowledge in water management and planification; Francisco Osorio has been responsible for the technical supervision of the article, with knowledge in water treatment technologies and water networks; Ovidio Rabaza is the general coordinator of the work.

Conflicts of Interest

The authors declare no conflict of interest.

References

  1. Cantor, K.P.; Hoover, R.; Hartge, P.; Mason, T.J.; Silverman, D.T.; Levin, L.I. Drinking water source and risk of bladder cancer: A case—Control study. In Water Chlorination, Volume VI: Chemistry, Environmental Impact and Health Effects; Jolley, R.L., Bull, R.J., Davisw, W.P., Katz, S., Roberts, M.H., Jacobs, V.A., Eds.; CRC Press: Boca Raton, FL, USA, 1985; pp. 145–152. [Google Scholar]
  2. Cantor, K.P.; Lynch, C.F.; Hildesheim, M. Chlorinated drinking water and risk of glioma: A case—Control study in Iowa, USA. Epidemiology 1996, 7, S83. [Google Scholar] [CrossRef]
  3. Monarca, S.; Zani, C.; Richardson, S.D.; Thruston, A.D.; Moretti, J.M.; Feretti, D.; Villarini, M.A. New approach to evaluating the toxicity and genotoxicity of disinfected drinking water. Water Res. 2004, 38, 3809–3819. [Google Scholar] [CrossRef] [PubMed]
  4. Abdullah, M.D.; Yew, C.H.; Ramli, M.S. Formation, modeling and validation of trihalomethanes (THM) in Malaysian drinking water: A case study in the districts of Tampin, Negeri Sembilan and Sabak Bernam, Selangor, Malaysia. Water Res. 2003, 37, 4637–4644. [Google Scholar] [CrossRef] [PubMed]
  5. Sadiq, R.; Rodriguez, M.J. Fuzzy synthetic evaluation of disinfection by-products—A risk-based indexing system. J. Environ. Manag. 2004, 73, 1–13. [Google Scholar] [CrossRef]
  6. Directive, C. 98/83/EC of 3 November 1998 on the quality of water intended for human consumption. Off. J. Eur. Communities 1998, 5, 1–23. [Google Scholar]
  7. Sadiq, R.; Rodriguez, M.J. Disinfection by-products (DBPs) in drinking water and predictive models for their occurrence: A review. Sci. Total Environ. 2004, 321, 21–46. [Google Scholar] [CrossRef] [PubMed]
  8. Nokes, C.J.; Fenton, E.; Randall, C.J. Modelling the Formation of Brominated Trihalomethanes in Chlorinated Drinking Waters. Water Res. 1999, 33, 3557–3568. [Google Scholar] [CrossRef]
  9. Brown, D.; West, J.R.; Courtis, B.J.; Bridgeman, J. Modelling THMs in Water Treatment and Distribution Systems. ICE Proc. Water Manag. 2010, 163, 1–10. [Google Scholar] [CrossRef]
  10. Kulkarni, P.; Chellam, S. Disinfection by-product formation following chlorination of drinking water: Artificial neural network models and changes in speciation with treatment. Sci. Total Environ. 2010, 408, 4202–4210. [Google Scholar] [CrossRef] [PubMed]
  11. Westerhoff, P.; Debroux, J.; Amy, G.L.; Gatel, D.; Mary, V.; Cavard, J. Applying DBP models to full-scale plants. J. Am. Water Works Assoc. 2000, 92, 89–102. [Google Scholar]
  12. Sohn, J.; Amy, G.; Cho, J.; Lee, Y.; Yoon, Y. Disinfectant decay and disinfection by-products formation model development: Chlorination and ozonation by-products. Water Res. 2004, 38, 2461–2478. [Google Scholar] [CrossRef]
  13. Hong, H.C.; Liang, Y.; Han, B.P.; Mazumder, A.; Wong, M.H. Modeling of trihalomethane (THM) formation via chlorination of the water from Dongjiang River (source water for Hong Kong’s drinking water). Sci. Total Environ. 2007, 385, 48–54. [Google Scholar] [CrossRef]
  14. Uyak, V.; Ozdemir, K.; Toroz, I. Multiple linear regression modeling of disinfection by products formation in Istanbul drinking water reservoirs. Sci. Total Environ. 2007, 378, 269–280. [Google Scholar] [CrossRef] [PubMed]
  15. Singer, P.C.; Chang, S.D. Correlations between trihalomethanes and total organic halides formed during water treatment. J. Am. Water Works Assoc. 1989, 81, 61–65. [Google Scholar]
  16. Singer, P.C.; Obolensky, A.; Greiner, A. DBPs in chlorinated North Carolina drinking water. Am. Water Works Assoc. 1995, 87, 83–92. [Google Scholar]
  17. Chen, W.J.; Weisel, C.P. Halogenated DBP concentrations in a distribution system. J. Am. Water Works Assoc. 1998, 90, 151–163. [Google Scholar]
  18. Arora, H.; le Chevallier, M.W.; Dixon, K.L. DBP occurrence survey. J. Am. Water Works Assoc. 1997, 89, 60–68. [Google Scholar]
  19. Gallard, H.; von Gunten, U. Chlorination of natural organic matter: Kinetics of chlorination and of THM formation. Water Res. 2002, 36, 65–74. [Google Scholar] [CrossRef] [PubMed]
  20. Gang, D.; Clevenger, T.E.; Banerji, S.K. Relationship of chlorine decay and THMs formation to NOM size. J. Hazard. Mater. 2003, A96, 1–12. [Google Scholar] [CrossRef]
  21. Engerholm, B.A.; Amy, G.L. A predictive model for chloroform formation from humic acid. J. Am. Water Works Assoc. 1983, 75, 418–423. [Google Scholar]
  22. Adin, A.; Katzhendler, J.; Alkaslassy, D.; Rav-Acha, C. Trihalomethane formation in chlorinated drinking water: A kinetic model. Water Res. 1991, 25, 797–805. [Google Scholar] [CrossRef]
  23. Clark, R.M.; Sivaganesan, M. Predicting chlorine residuals and formation of TTHMs in drinking water. J. Environ. Eng. 1998, 124, 1203–1210. [Google Scholar] [CrossRef]
  24. Clark, R.M.; Thurnau, R.C.; Sivaganesan, M.; Ringhand, P. Predicting the formation of chlorinated and brominated by-products. J. Environ. Eng. 2001, 127, 493–501. [Google Scholar] [CrossRef]
  25. Golfinopoulos, S.K.; Arhonditsis, G.B. Quantitative assessment of trihalomethane formation using simulations of reaction kinetics. Water Res. 2002, 36, 2856–2868. [Google Scholar] [CrossRef] [PubMed]
  26. Gang, D.D.; Segar, R.L., Jr.; Clevenger, T.E.; Banerji, S.K. Using chlorine demand to predict THM and HAA9 formation. J. Am. Water Works Assoc. 2002, 94, 76–86. [Google Scholar]
  27. Campos, I.; Alcañiza, M.; Aguado, D.; Barat, R.; Ferrer, J.; Gil, L.; Marrakchi, M.; Martínez-Mañez, R.; Soto, J.; Vivancos, J.L. A voltammetric electronic tongue as tool for water quality monitoring in wastewater treatment plants. Water Res. 2012, 46, 2605–2614. [Google Scholar] [CrossRef] [PubMed]
  28. Gil, L.; Barat, J.M.; García-Breijo, E.; Ibañez, J.; Martínez-Máñez, R.; Soto, J.; Llobet, E.; Brezmes, J.; Aristoy, M.C.; Toldrá, F. Fish freshness analysis using metallic potentiometric electrodes. Sens. Actuators B Chem. 2008, 131, 362–370. [Google Scholar] [CrossRef]
  29. Paixão, T.R.L.C.; Bertotti, M. Fabrication a disposable voltammetric electronic tongues by using Prussian Blue films electrodeposited onto CD-R gold surfaces and recognition of milk adulteration. Sens. Actuators B Chem. 2009, 137, 266–273. [Google Scholar] [CrossRef]
  30. Parra, V.; Arrieta, A.; Fernández-Escudero, J.A.; García, H.; Apetrei, C.; Rodríguez-Méndez, M.L.; de Saja, J.A. E-Tongue based on a hybrid array of voltammetric sensors based on phthalocyanines, perylene derivatives and conducting polymers: Discrimination capability towards red wines elaborated with different variety of grapes. Sens. Actuators B Chem. 2006, 115, 54–61. [Google Scholar] [CrossRef]
  31. Parra, V.; Arrieta, A.A.; Fernández-Escudero, J.A.; Rodríguez-Mendez, M.L.; de Saja, J.A. Electronic tongue based on chemically modified electrodes and voltammetry for the detection of adulterations in wines. Sens. Actuators B Chem. 2006, 118, 448–453. [Google Scholar] [CrossRef]
  32. Francioso, L.; Bjorklund, R.; Krantz-Rulcker, T.; Siciliano, P. Classification of multiple defect concentrations in white wine by platinum microelectrode voltammetry. Sens. Actuators B Chem. 2007, 125, 462–467. [Google Scholar] [CrossRef]
  33. Winquist, F.; Bjorklund, R.; Krantz-Rülcker, C.; Lundström, I.; Östergren, K.; Skoglund, T. An electronic tongue in the dairy industry. Sens. Actuators B Chem. 2005, 111, 299–304. [Google Scholar] [CrossRef]
  34. Collier, W.A.; Baird, D.B.; Park-Ng, Z.A.; More, N.; Hart, A.L. Discrimination among milks and cultured dairy products using screen-printed electrochemical arrays and an electronic nose. Sens. Actuators B Chem. 2003, 92, 232–239. [Google Scholar] [CrossRef]
  35. Mimendia, A.; Gutierrez, J.M.; Leija, L.; Hernandez, P.R.; Favari, L.; Muñoz, R.; del Valle, M.A. Review of the use of the potentiometric electronic tongue in the monitoring of environmental systems. Environ. Model. Softw. 2010, 25, 1023–1030. [Google Scholar] [CrossRef]
  36. Nayak, K.; Supreetha, B.S.; Deccaraman, M.; Nayak, V. E-Nose System to Detect E-Coli in Drinking Water of Udupi District. Int. J. Eng. Res. Dev. 2012, 1, 58–64. [Google Scholar]
  37. Winquist, F.; Olsson, J.; Eriksson, M. Multicomponent analysis of drinking water by a voltammetric electronic tongue. Anal. Chim. Acta 2011, 683, 192–197. [Google Scholar] [PubMed]
  38. Kundu, P.K.; Chatterjee, A.; Panchariya, P.C. Electronic Tongue System for Water Sample Authentication: A Slantlet-Transform-Based Approach. IEEE Trans. Instrum. Meas. 2011, 60, 1959–1966. [Google Scholar] [CrossRef]
  39. Urano, K.; Wada, H.; Takemasa, T. Empirical rate equation for Trihalomethane formation with chlorination of humic substances in water. Water Res. 1983, 17, 1797–1802. [Google Scholar] [CrossRef]
  40. Morrow, C.M.; Minear, R.A. Use of regression models to link raw water characteristics to Trihalomethane concentrations in drinking water. Water Res. 1987, 21, 41–48. [Google Scholar] [CrossRef]
  41. Golfinopoulus, S.K.; Xilourgidis, N.K.; Kostopoulou, M.N.; Lekkas, T.D. Use of a multiple regression model for predicting trihalomethane formation. Water Res. 1998, 32, 2821–2829. [Google Scholar] [CrossRef]
  42. Golfinopoulus, S.K.; Arhonditsis, G.B. Multiple regression models: A methodology for evaluating trihalomethane concentrations in drinking water for raw water characteristics. Chemosphere 2002, 47, 1007–1018. [Google Scholar] [CrossRef] [PubMed]
  43. Mosteller, F.; Tukey, J.W. Data Analysis and Regression; Addison-Wesley: Reading, MA, USA, 1977. [Google Scholar]
  44. Chowdhury, S.; Champagne, P.; McLellan, P.J. Models for predicting disinfection by product (DBP) formation in drinking waters: A chronological review. Sci. Total Environ. 2009, 407, 4189–4206. [Google Scholar] [CrossRef] [PubMed]
  45. Sanz, D.A.; Unigarro, E.A.; Osma, J.F.; Segura-Quijano, F. Low cost wireless passive microsensors for the detection of hazardous compounds in water systems for control and monitoring. Sens. Actuators B Chem. 2013, 178, 26–33. [Google Scholar] [CrossRef]
  46. Tian, K.; Dasgupta, P.K. A permeable membrane capacitance sensor for ionogenic gases application to the measurement of total organic carbon. Anal. Chim. Acta 2009, 652, 245–250. [Google Scholar] [CrossRef] [PubMed]
  47. Fraser, K.J.; Curto, V.F.; Coyle, S.; Byrne, R.; Benito-Lopez, F.; Diamond, D.; Schazmann, B.; Owens, R.M.; Malliaras, G.G. Wearable electromechamical sensors for monitoring performance athletes. In Proceedings of the SPIE 8118 Organic Semiconductors in Sensors and Bioelectronics IV, San Diego, CA, USA, 21–25 August 2011.
  48. Diamond, D.; Coyle, S.; Scarmagnani, S.; Hayes, J. Wireless Sensor Networks and Chemo-Biosensing. Chem. Rev. 2008, 108, 652–679. [Google Scholar] [CrossRef] [PubMed]
  49. Benco, J.S.; Foos, J.S. Planar Bicarbonate Sensor. United States Patent 5554272, 10 August 1995. [Google Scholar]
  50. Wang, D.; Hu, P.; Xu, J.; Dong, X.; Pan, Q. Fast response chlorine gas sensor based on mesoporous SnO2. Sens. Actuators B Chem. 2009, 140, 383–389. [Google Scholar] [CrossRef]
  51. Chou, J.C.; Ye, G.C.; Wu, D.G.; Chen, C.C. Fabrication of the array chlorine ion sensor based on microfluidic device framework. Solid-State Electron. 2012, 77, 87–92. [Google Scholar] [CrossRef]
  52. Hilhorst, M.A. A Pore Water Conductivity Sensor. Soil Sci. Soc. Am. J. 2000, 64, 1922–1925. [Google Scholar]
  53. Vaz, A.; Ubarretxena, A.; Zalbide, I.; Pardo, D.; Solar, H.; García-Alonso, A. Full Passive UHF Tag with a Temperature Sensor Suitable for Human Body Temperature Monitoring. IEEE Trans. Circuits Syst. II Express Briefs 2010, 57, 95–99. [Google Scholar] [CrossRef]
  54. Rodriguez, M.J.; Sérodes, J.B. Spatial and temporal evolution of trihalomethanes in three water distribution systems. Water Res. 2001, 35, 1572–1586. [Google Scholar] [CrossRef] [PubMed]

