Article

Application of the SUSTAIN Model to a Watershed-Scale Case for Water Quality Management

1
Department of Natural Resources, Chinese Culture University, 55, Hwa-kang Rd., Yang-Ming-Shan, Taipei 11114, Taiwan
2
Department of Civil Engineering, National Taipei University of Technology, No1, Sec3, Chung-Hsiao E. Rd., Taipei 10608, Taiwan
3
Department of Water Resources Engineering and Conservation, Feng Chia University, No. 100 Wenhwa Rd., Seatwen, Taichung 40724, Taiwan
4
Department of Water Resources and Environmental Engineering, Tamkang University, 151, Ying-Chuan Rd., Tamsui, New Taipei City 25137, Taiwan
5
Department of Civil Engineering, National Taipei University of Technology, No1, Sec3, Chung-Hsiao E. Rd., Taipei 10608, Taiwan
*
Author to whom correspondence should be addressed.
Water 2014, 6(12), 3575-3589; https://doi.org/10.3390/w6123575
Submission received: 17 June 2014 / Revised: 14 November 2014 / Accepted: 17 November 2014 / Published: 25 November 2014

Abstract

:
Low impact development (LID) is a relatively new concept in land use management that aims to maintain hydrological conditions at a predevelopment level without deteriorating water quality during land development. The United States Environmental Protection Agency (USEPA) developed the System for Urban Stormwater Treatment and Analysis Integration model (SUSTAIN) to evaluate the performance of LID practices at different spatial scales; however, the application of this model has been limited relative to LID modeling. In this study, the SUSTAIN model was applied to a Taiwanese watershed. Model calibration and verification were performed, and different types of LID facilities were evaluated. The model simulation process and the verified model parameters could be used in other cases. Four LID scenarios combining bioretention ponds, grass swales, and pervious pavements were designed based on the land characteristics. For the SUSTAIN model simulation, the results showed that pollution reduction was mainly due to water quantity reduction, infiltration was the dominant mechanism and plant interception had a minor effect on the treatment. The simulation results were used to rank the primary areas for nonpoint source pollution and identify effective LID practices. In addition to the case study, a sensitivity analysis of the model parameters was performed, showing that the soil infiltration rate was the most sensitive parameter affecting the LID performance. The objectives of the study are to confirm the applicability of the SUSTAIN model and to assess the effectiveness of LID practices in the studied watershed.

1. Introduction

Water quality is not only degraded by direct wastewater pollution but is also threatened by runoff from urbanization and land use change. Identifying sustainable land development practices that do not impair water quality is an issue of international relevance. Best Management Practices (BMPs) are well-known measures for controlling polluted runoff. BMPs control diffuse pollution from different types of land, especially runoff from agricultural land. Currently, many integrated water and land management policies have been proposed to address both water quality and water quantity problems in their early stages, for example, low impact development (LID) in the U.S. [1,2], sustainable urban drainage systems (SUDS) in the UK [3,4], water sensitive urban design (WSUD) in Australia, low impact urban design and development (LIUDD) in New Zealand, and comprehensive urban river basin management in Japan [5]. The objective of these integrated water and land management policies is to apply water management practices to land planning and reduce water impact while pursuing social and economic development.
In this study, we used the term LID to encompass the aforementioned ideas. LID is similar to BMPs in having both structural facilities and nonstructural practices. Nonstructural LID focuses on spatial land design, where structural facilities usually include bioretention ponds, grass swales, pervious pavements, green roofs, rain gardens, and rain barrels. Some LID facilities are the same as structural BMPs, which has motivated the use of the term LID/BMP [6,7,8]. The structural control facilities simultaneously provide both water quality improvement and water quantity adaptations.
Conventionally, structural LID practices have served as micro-scale control measures to sustain the predevelopment hydrological properties of developed sites. Structural LID facilities have been demonstrated to reduce the runoff volume and the peak flow and to extend the concentration time [2,9]. Doubleday et al. (2013) [10] demonstrated a real case in which LID practices successfully preserved the undeveloped hydrologic conditions. In addition to site-scale practices, LID could also play a significant role in watershed management. LID practices can be regarded as decentralized measures that can contribute to the management of the entire watershed in terms of improving the water quality and quantity. However, there are still no scale-up cases, perhaps because adequate assessment tools are not available. Assessing the contributions of LID practices to a watershed needs large scale computations and considers more mechanisms than those on a site. In a review by Ahiablame et al. (2012) [9], simulations in which plot scales are scaled up to larger scales were identified as critical for advancing LID practices. Elliott and Trowsdale (2007) [11] reviewed 10 stormwater models that were relevant to LID simulations and concluded that up-scaling at the catchment level and catchment scale predictions are needed for further model development. To support decision-making in watershed-scale design, the USEPA developed a decision-support system called the System for Urban Stormwater Treatment and Analysis Integration (SUSTAIN) [12,13,14]. The SUSTAIN model is a powerful model that can evaluate LID performance at different spatial scales and determine the optimal LID design based on cost efficiency. A major limitation of the model is that the system has to run on an ArcGIS platform [15], which may be unavailable or unfamiliar to users.
The SUSTAIN model is a relatively new model that has been applied to U.S. [14] and South Korea cases [16]. In this study, the SUSTAIN model was applied to a Taiwanese watershed to test the applicability of the model to cases outside the United States. The case study was performed for the Yuanshanyan watershed, which is a drinking water supply area where the untreated water quality does not meet the required standards and has a strong need for water treatment. Therefore, the local government sought to develop new policies to improve water contamination in tandem with watershed development. We tested four LID scenarios for the Yuanshanyan watershed and evaluated the performance of these LID practices using the verified SUSTAIN model to support watershed management.

2. Materials and Methods

2.1. Brief Description of SUSTAIN Model
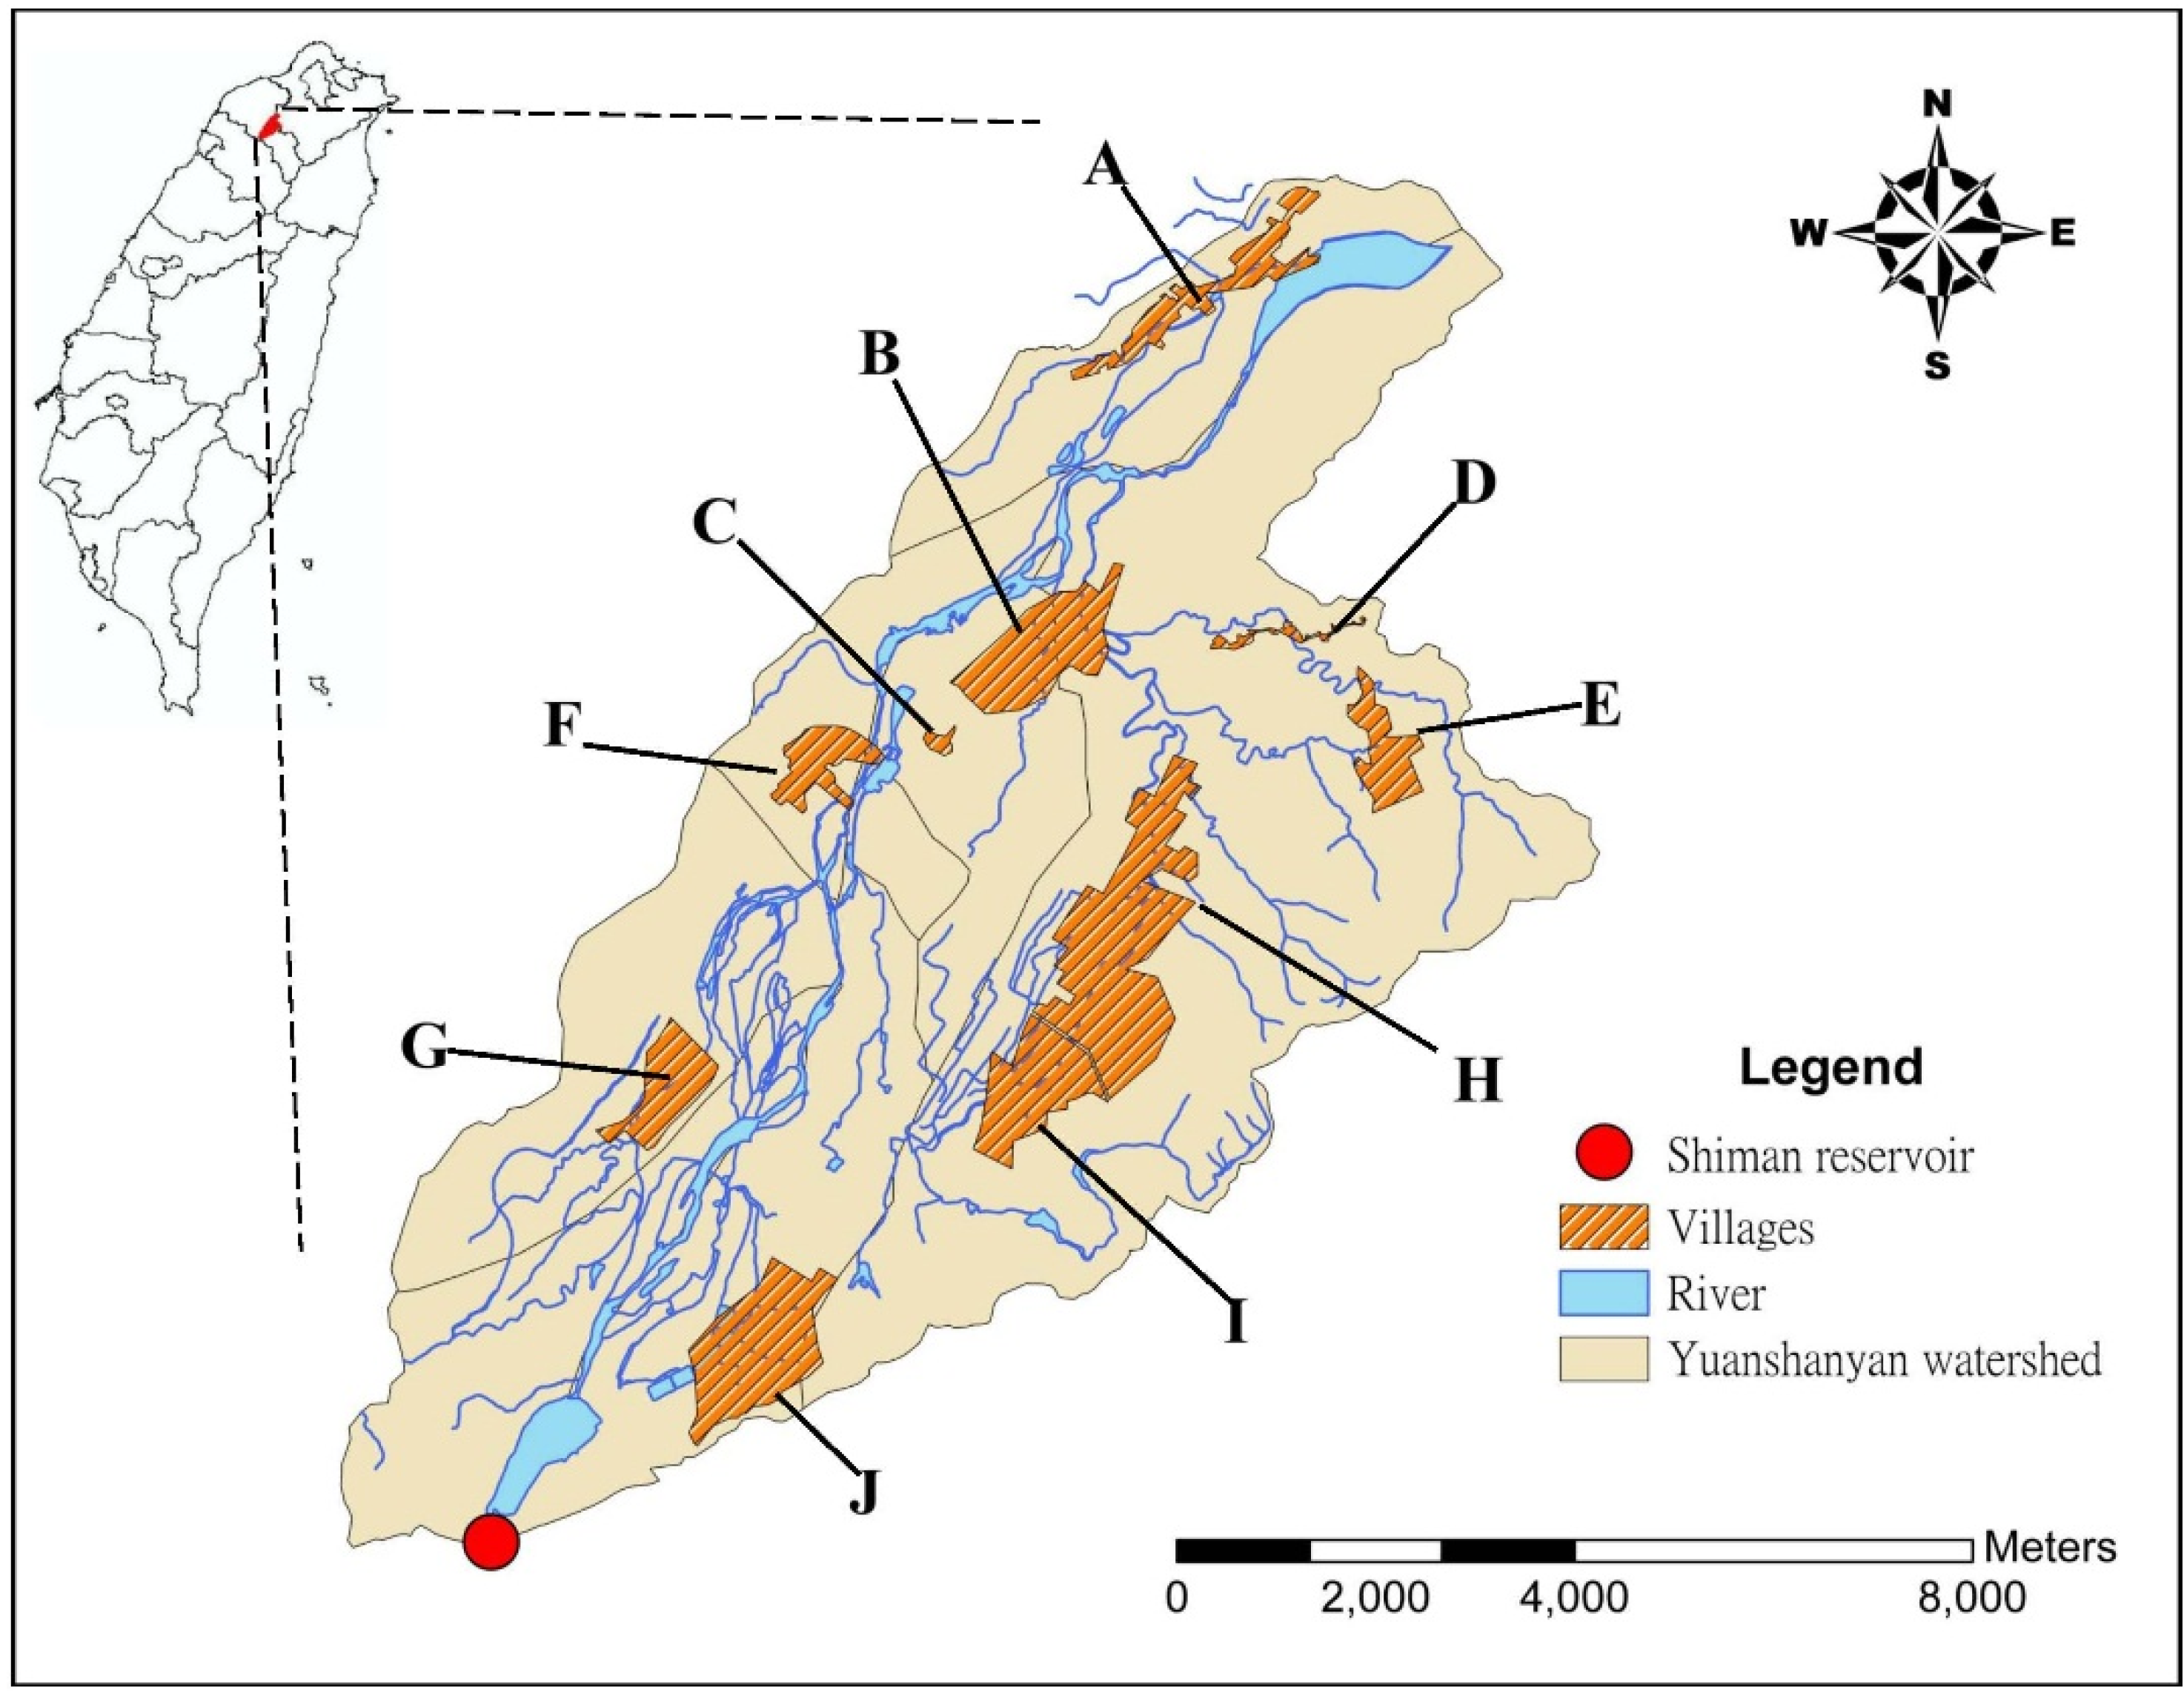
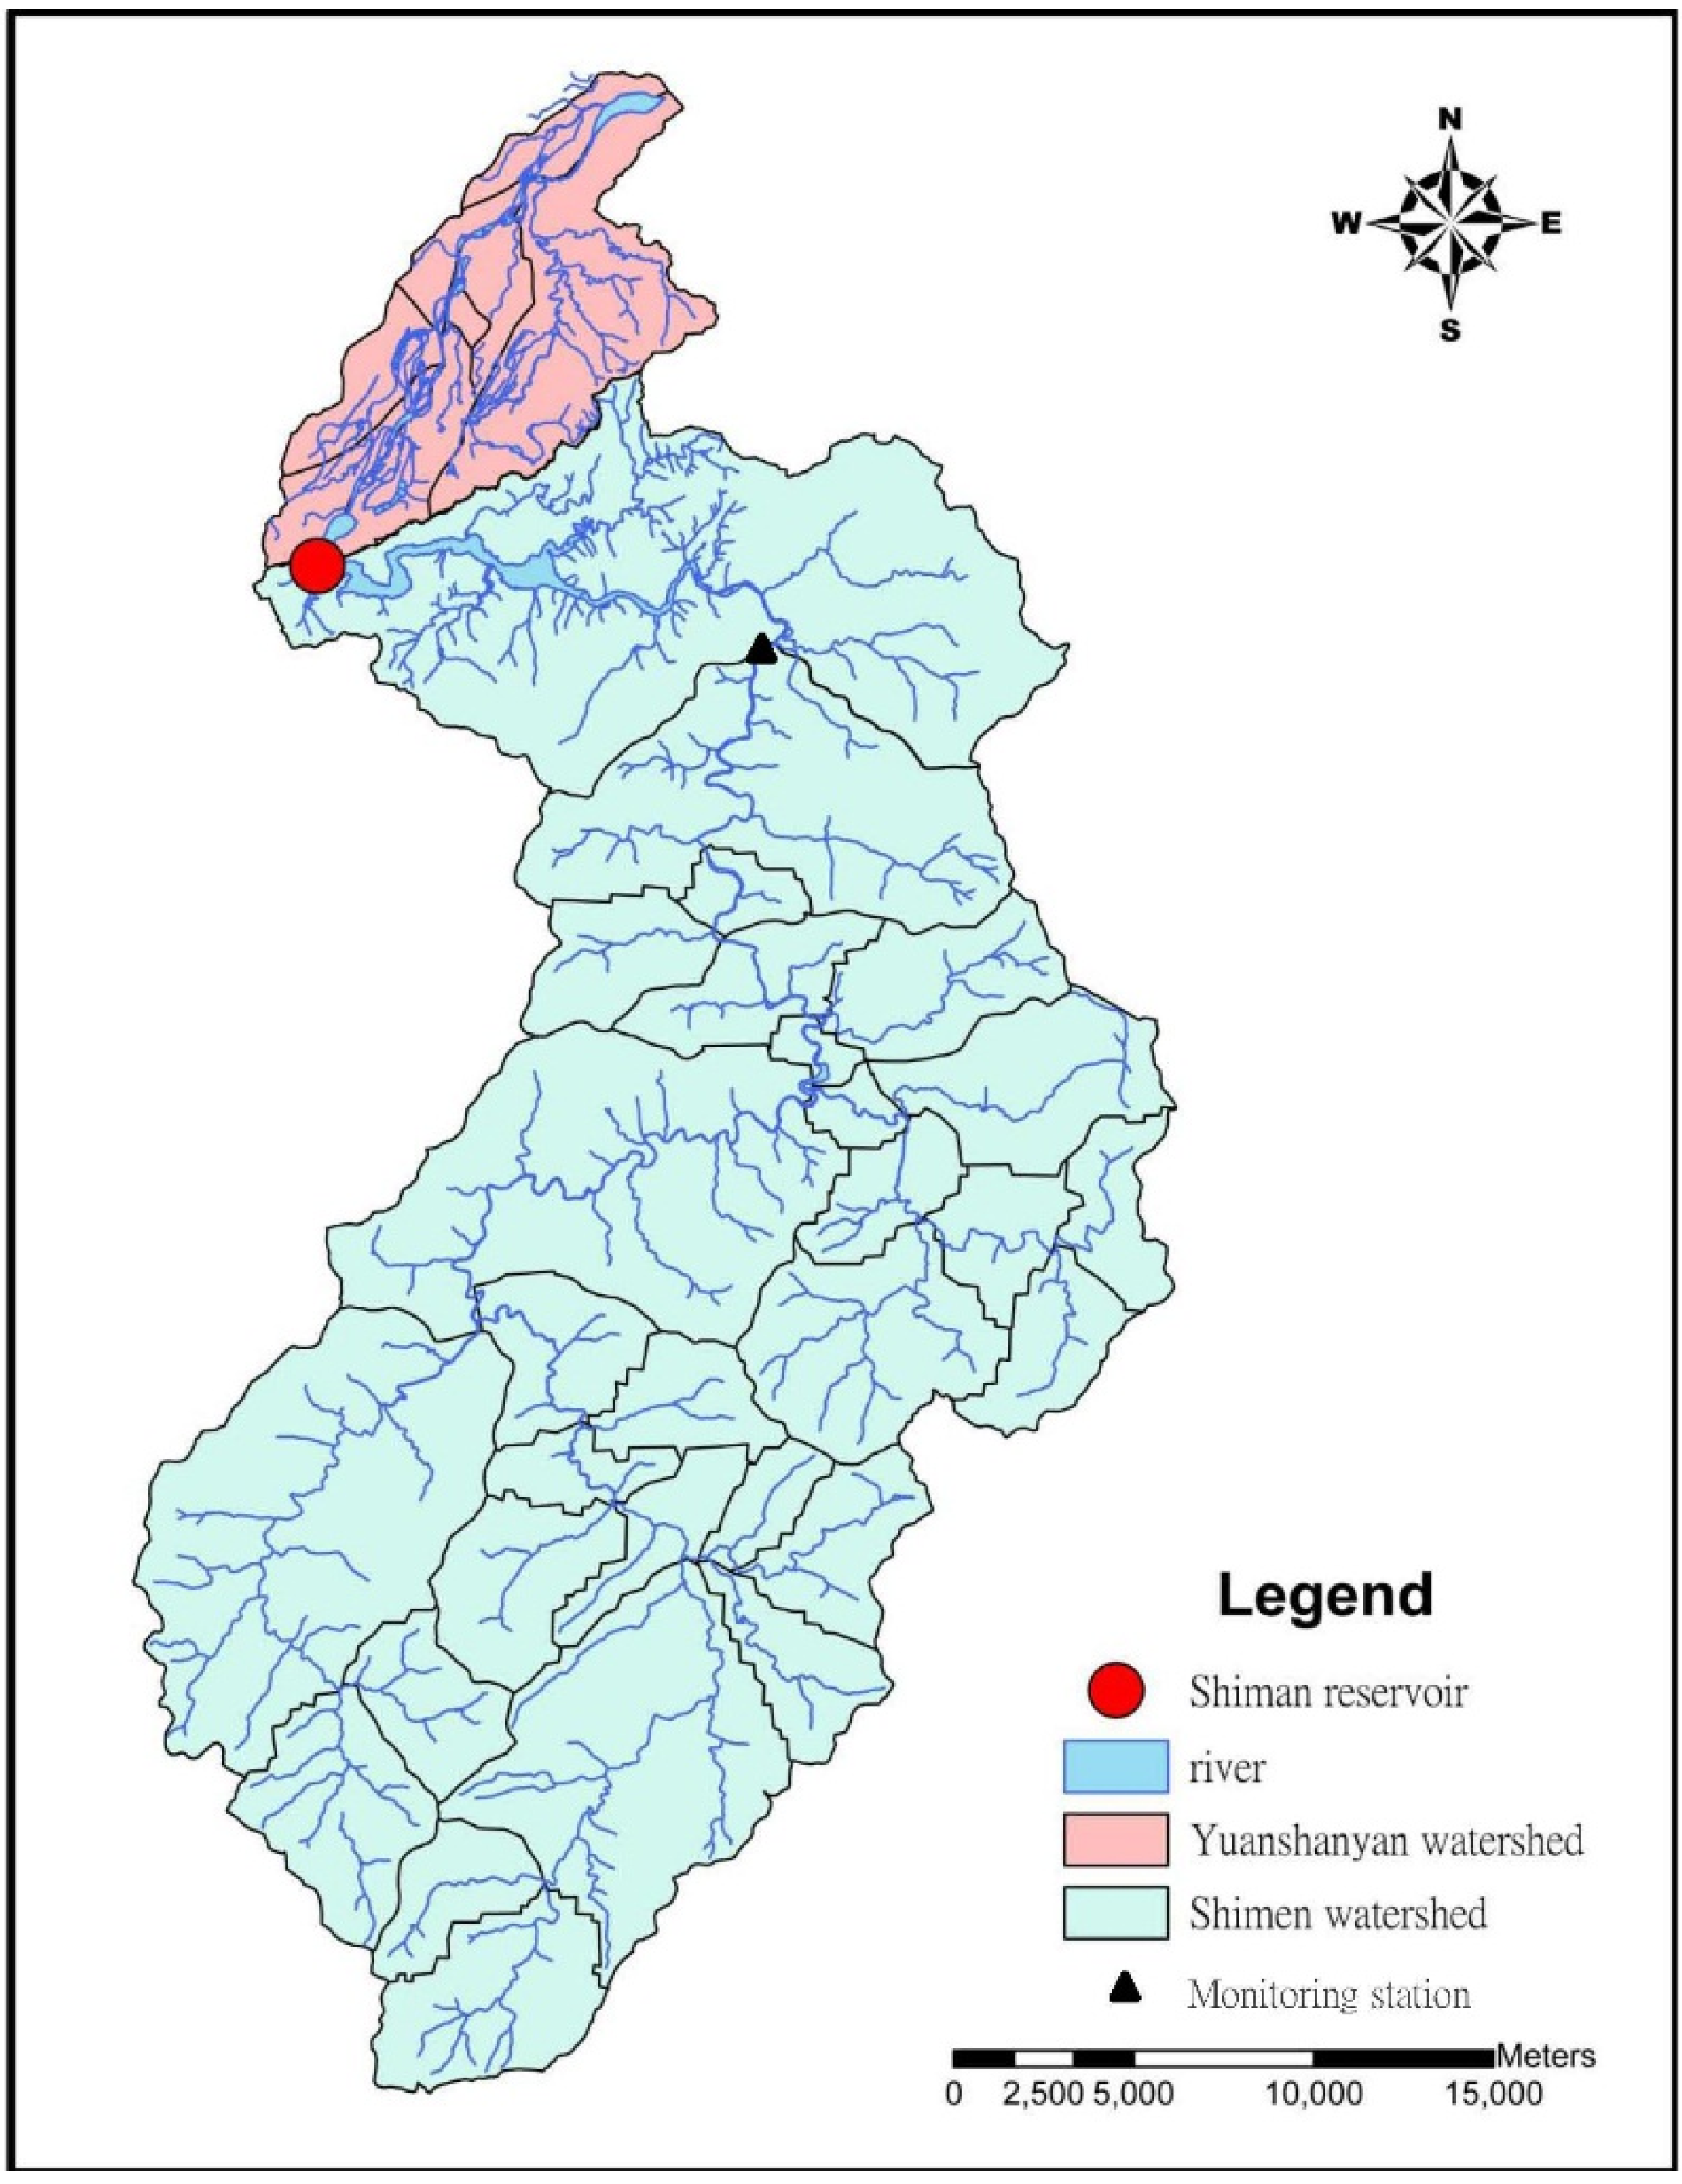
The SUSTAIN model was developed by the USEPA to integrate hydrologic, hydraulic, and water quality simulations to assess LID performance [12,14]. An optimization programming module was included in the model to compare different LID design scenarios. Because the computations in the LID model need a number of watershed characteristics, such as boundaries, elevations, land use, etc., these watershed factors are transformed using geographic information systems (GIS), which have to run on an ArcGIS platform.
The SUSTAIN model consists of a framework manager, a post-processor, and five simulation modules, i.e., a siting tool, a land module, a LID module, a conveyance module, and an optimization module. The land module and conveyance module are used to simulate water quantity and quality in the watershed. GIS data of the watershed and climatic data are required. The LID module and the siting tool are specific features of this model. A total of 14 LID facilities can be chosen and are classified into three types: point, linear, and area. In the SUSTAIN model, bioretention cells, cisterns, constructed wetlands, dry ponds, infiltration basins, rain barrels, sand filters (surface), and wet ponds are classified as point facilities. Grassed swales, infiltration trench, and sand filter (non-surface) are linear facilities; green roofs and porous pavement are area facilities. The users can choose one of the facilities and adjust the structure and dimensions for their site design.
The runoff and pollutants produced from the land simulation modules are conveyed to the LID facilities, and the processes inside the watershed, including infiltration, evapotranspiration, and pollutant removal, are simulated to evaluate runoff and pollution reduction from the LID design. The detailed computational procedure can be found in the SUSTAIN manual [12]. The optimization module helps users test different LID designs in terms of cost and performance and select the most cost-effective LID design and location [17]. However, the optimization module was not used in this study because local cost functions for LIDs are not available for Taiwan.

2.2. Study Area

The Yuanshanyan watershed is located in Taoyuan County, Taiwan (Figure 1). The total area of the watershed is 88 square kilometers. The downstream water is withdrawn to a water treatment plant to provide drinking water for the entire Taoyuan area. The Yuanshanyan watershed is different from other protected areas of water sources, which are usually located in the upstream basin with dominant natural lands. This watershed is relatively developed, and the distribution of land use is 44.3% forest, 17.43% agricultural lands, 17.17% residential lands, 6.99% grasslands, 9.49% waterbody, and 4.62% open spaces. The area of forest land is less than half of the total watershed.
Figure 1. Locations of 10 villages for (low impact development) LID implementation in Yuanshanyan watershed.
Water 06 03575 g001
There are three water quality monitoring stations along with the main stream in the studied watershed, Dahan creek. The average percentage of water with quality that was in compliance with the standard during 2001–2010 was only 61%, 30%, and 20% at the upstream, midstream, and downstream stations, respectively. The downstream station is located where water is withdrawn and purified for drinking water use. The water contamination is a burden for water treatment; therefore, the watershed has sought a control policy to maintain local economic development while minimizing water pollution.
For this watershed, the areas classified as urban planning areas have planned to build sewage systems to treat domestic or industrial wastewater. Assuming that the centralized treatment plants can control the point source pollution from these areas, we tested LID measures for non-urban planning areas. We surveyed and digitized 10 villages in the non-urban planning area in the watershed for LID implementation. The locations of the 10 villages are shown in Figure 1.

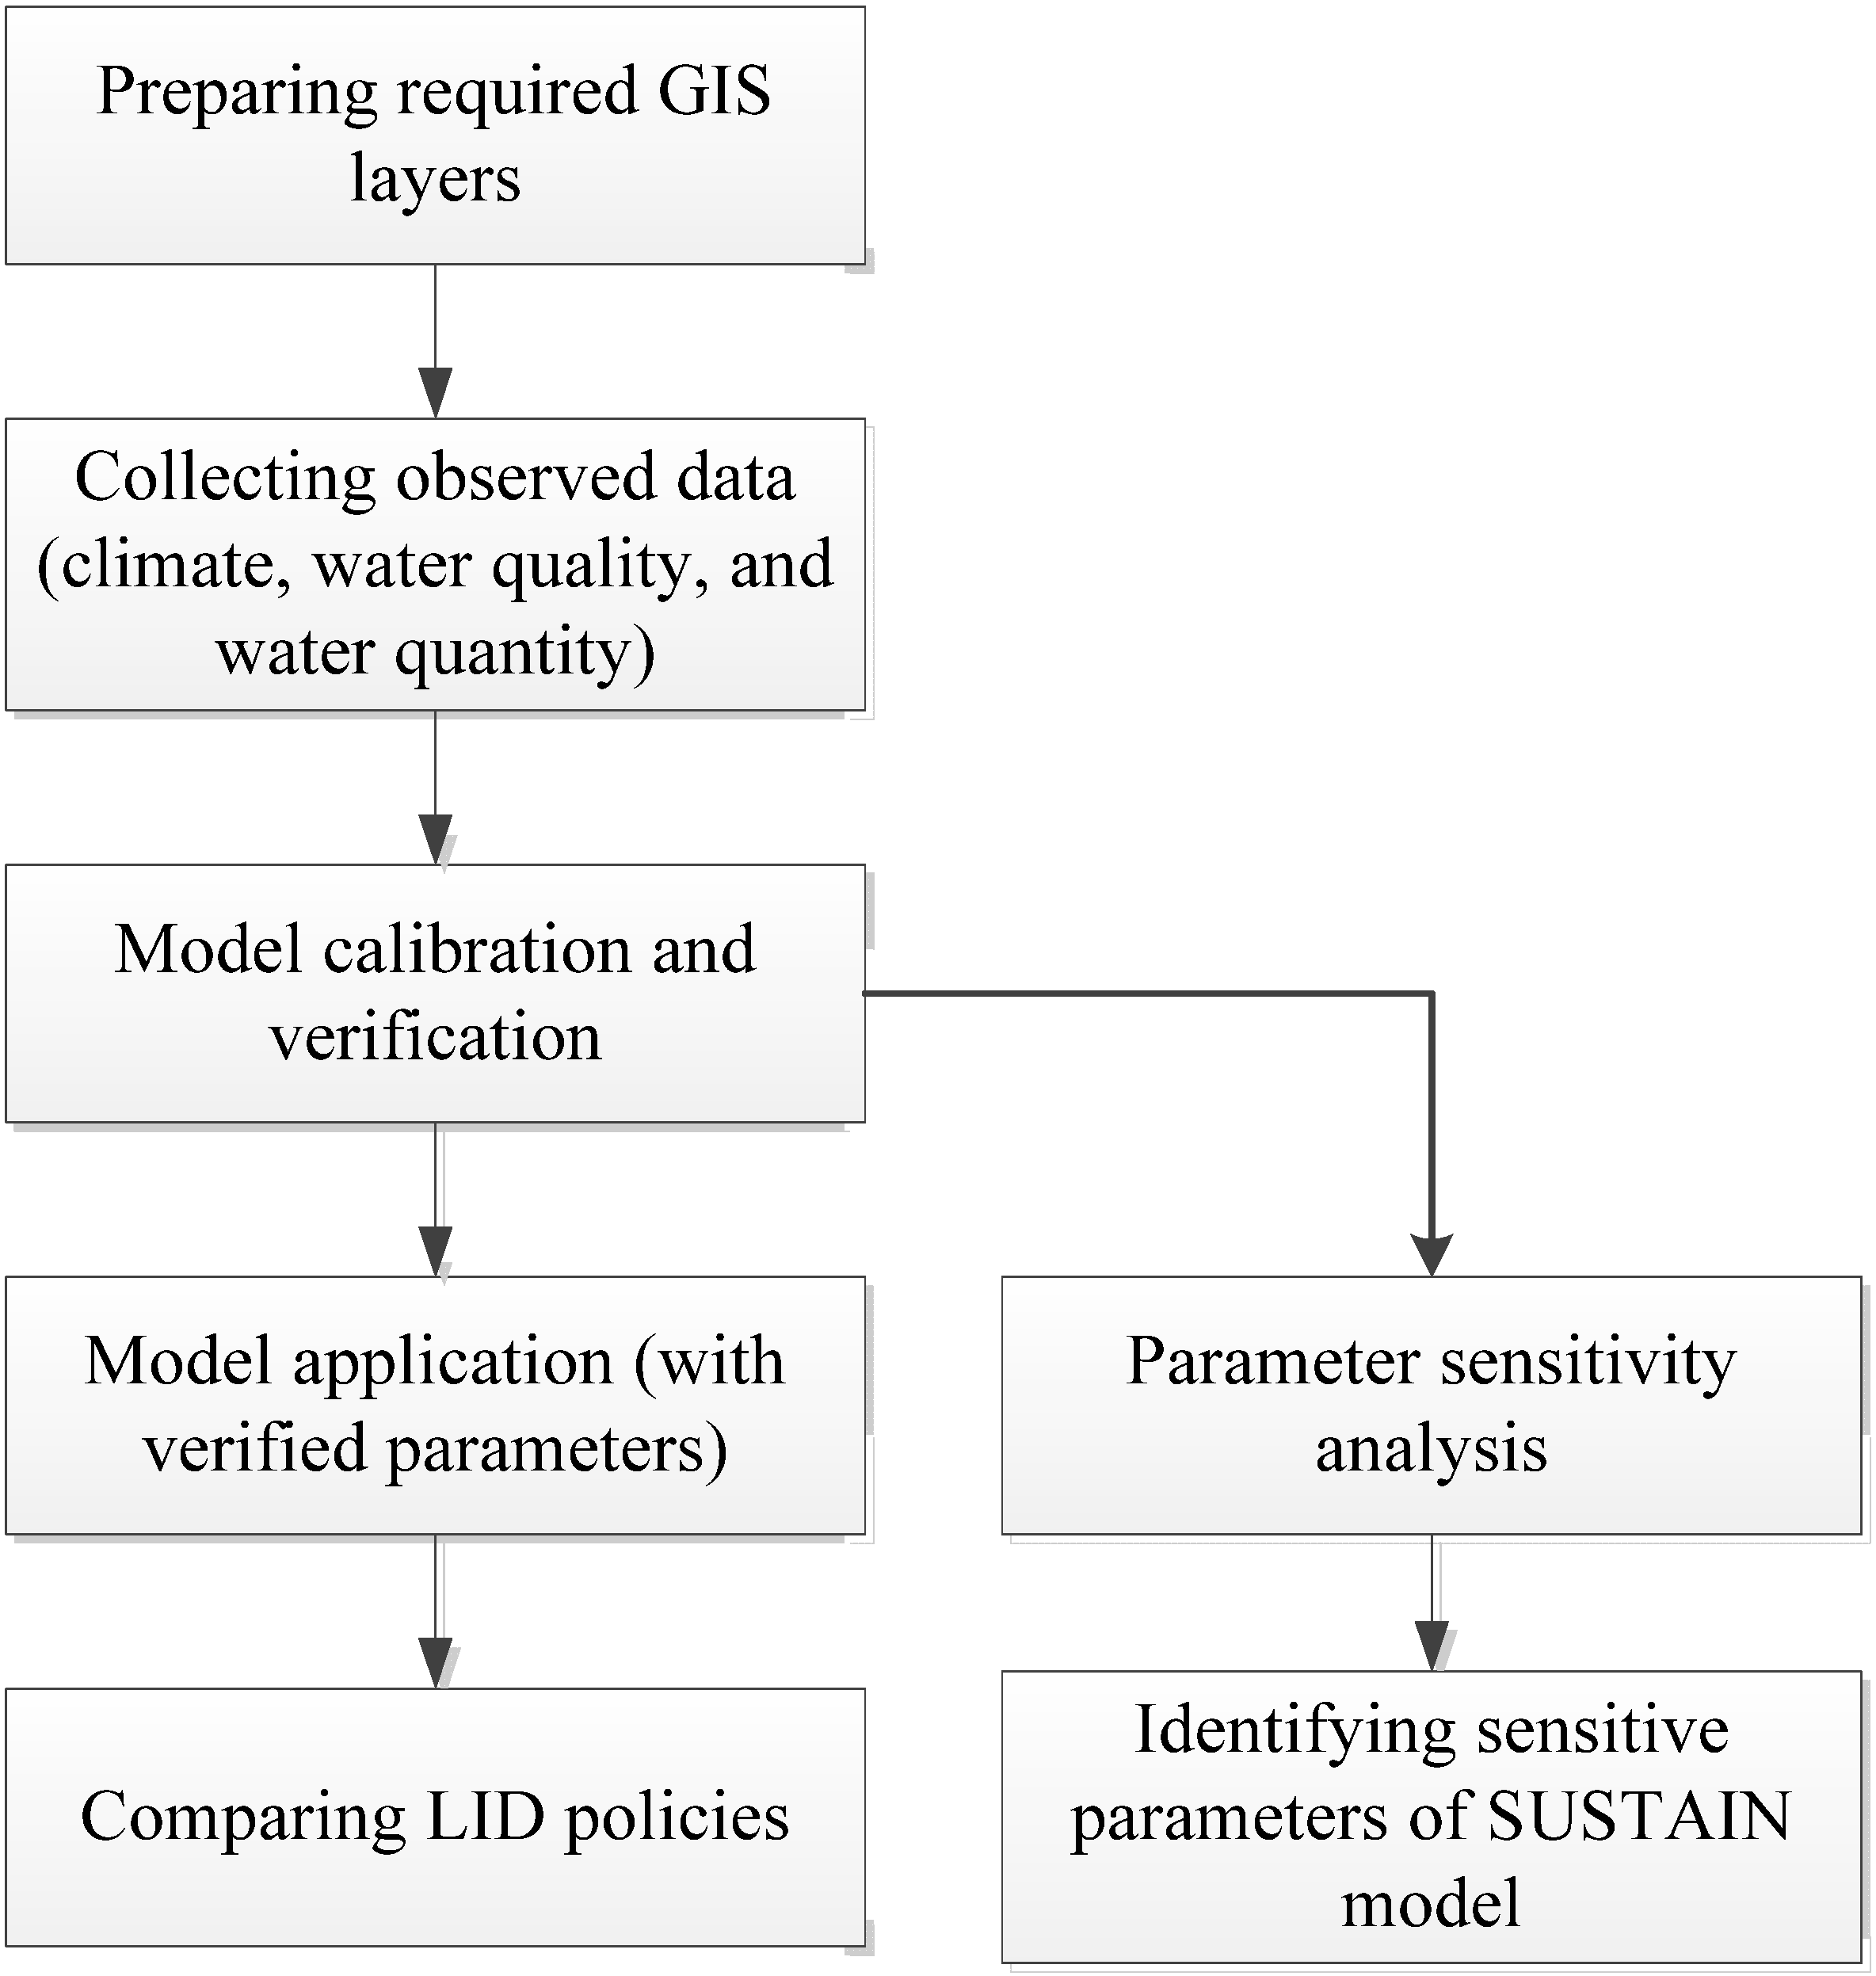
2.3. Model Simulation Process

When applying the SUSTAIN model to assess LID policy, a verified model is necessary. Figure 2 demonstrates the model simulation process of this study. First, the required GIS layers for the SUSTAIN model were prepared, such as land use, stream, and digital elevation data (DEM). Second, observed data were collected for model calibration and verification. Because the Shiman Reservoir is located upstream of Dahan Creek, the main stream of the Yuanshanyan watershed, the stream flow is influenced by the operation of the Shiman Reservoir. This artificial factor that controls the stream flow could not be captured in the model simulation. Therefore, the model calibration and verification were conducted at the upstream watershed, which is not influenced by the reservoir. We assumed that the characteristics of the entire watershed were homogeneous and that the verified model parameters could be used for either upstream of the Shiman reservoir watershed or downstream of the Yuanshanyan watershed. The locations of the Yuanshanyan and Shiman watersheds are shown in Figure 3. The Shiman reservoir separates the water between the two watersheds. Data on water quality and flow as well as from the climatic monitoring station at the Shiman reservoir watershed were collected for the following model calibration and verification.
Figure 2. Model simulation process in this study.
Water 06 03575 g002
Figure 3. Watershed used for SUSTAIN model calibration and verification; this area is located upstream of the Yuanshanyan watershed and is not influenced by the Shiman Reservoir, which divides this area from the Yuanshanyan watershed.
Water 06 03575 g003
Third, model calibration and verification was performed. The data from 2008 to 2009 was used. The input model parameters were based on the suggestions from the manual and their values were adjusted based on the observed data. There are five simulation modules in the SUSTAIN model, which includes many computation parameters or coefficients. The parameters relating to topographical conditions, such as slopes, are based on actual GIS data. However, some parameters, such as Manning coefficients or pollutant degradation coefficients, should be confirmed by calibration and verification processes based on observed data. These parameters and coefficients were tested, and the ones sensitive to the results were summarized. To ensure the reliability of the simulation results, statistical analysis was used to demonstrate goodness-of-fit. The coefficient of determination (R2) is used for flow simulation because flow simulation has continuous data. We used the mean absolute percentage error (MAPE) to evaluate water quality simulation because water quality was officially observed once a month and continuous monitoring data were not available. The MAPE was a suitable indicator for evaluating the performance of the water quality simulation [18]. Fourth, the verified model parameters were applied to the Yuanshanyan watershed with the geographical and climatic data cited from the Yuanshanyan watershed. Finally, some LID policy scenarios were tested and their efficiencies were compared.
To advance the understanding of the SUSTAIN model, we conducted a model parameter sensitivity analysis to identify sensitive parameters of the LID module. Unlike the water quantity and quality results which can be verified using the observed data, the simulation of a LID scenario is predictive information for policy making and cannot be verified at this stage. Therefore, it is important to know the sensitivity of design factors used in LID. A sensitivity index (SI) value was used to indicate the sensitivity level and was calculated using SI = Δ C / C Δ X / X , where C is the water quality output and X is the input parameter.

3. Results and Discussion

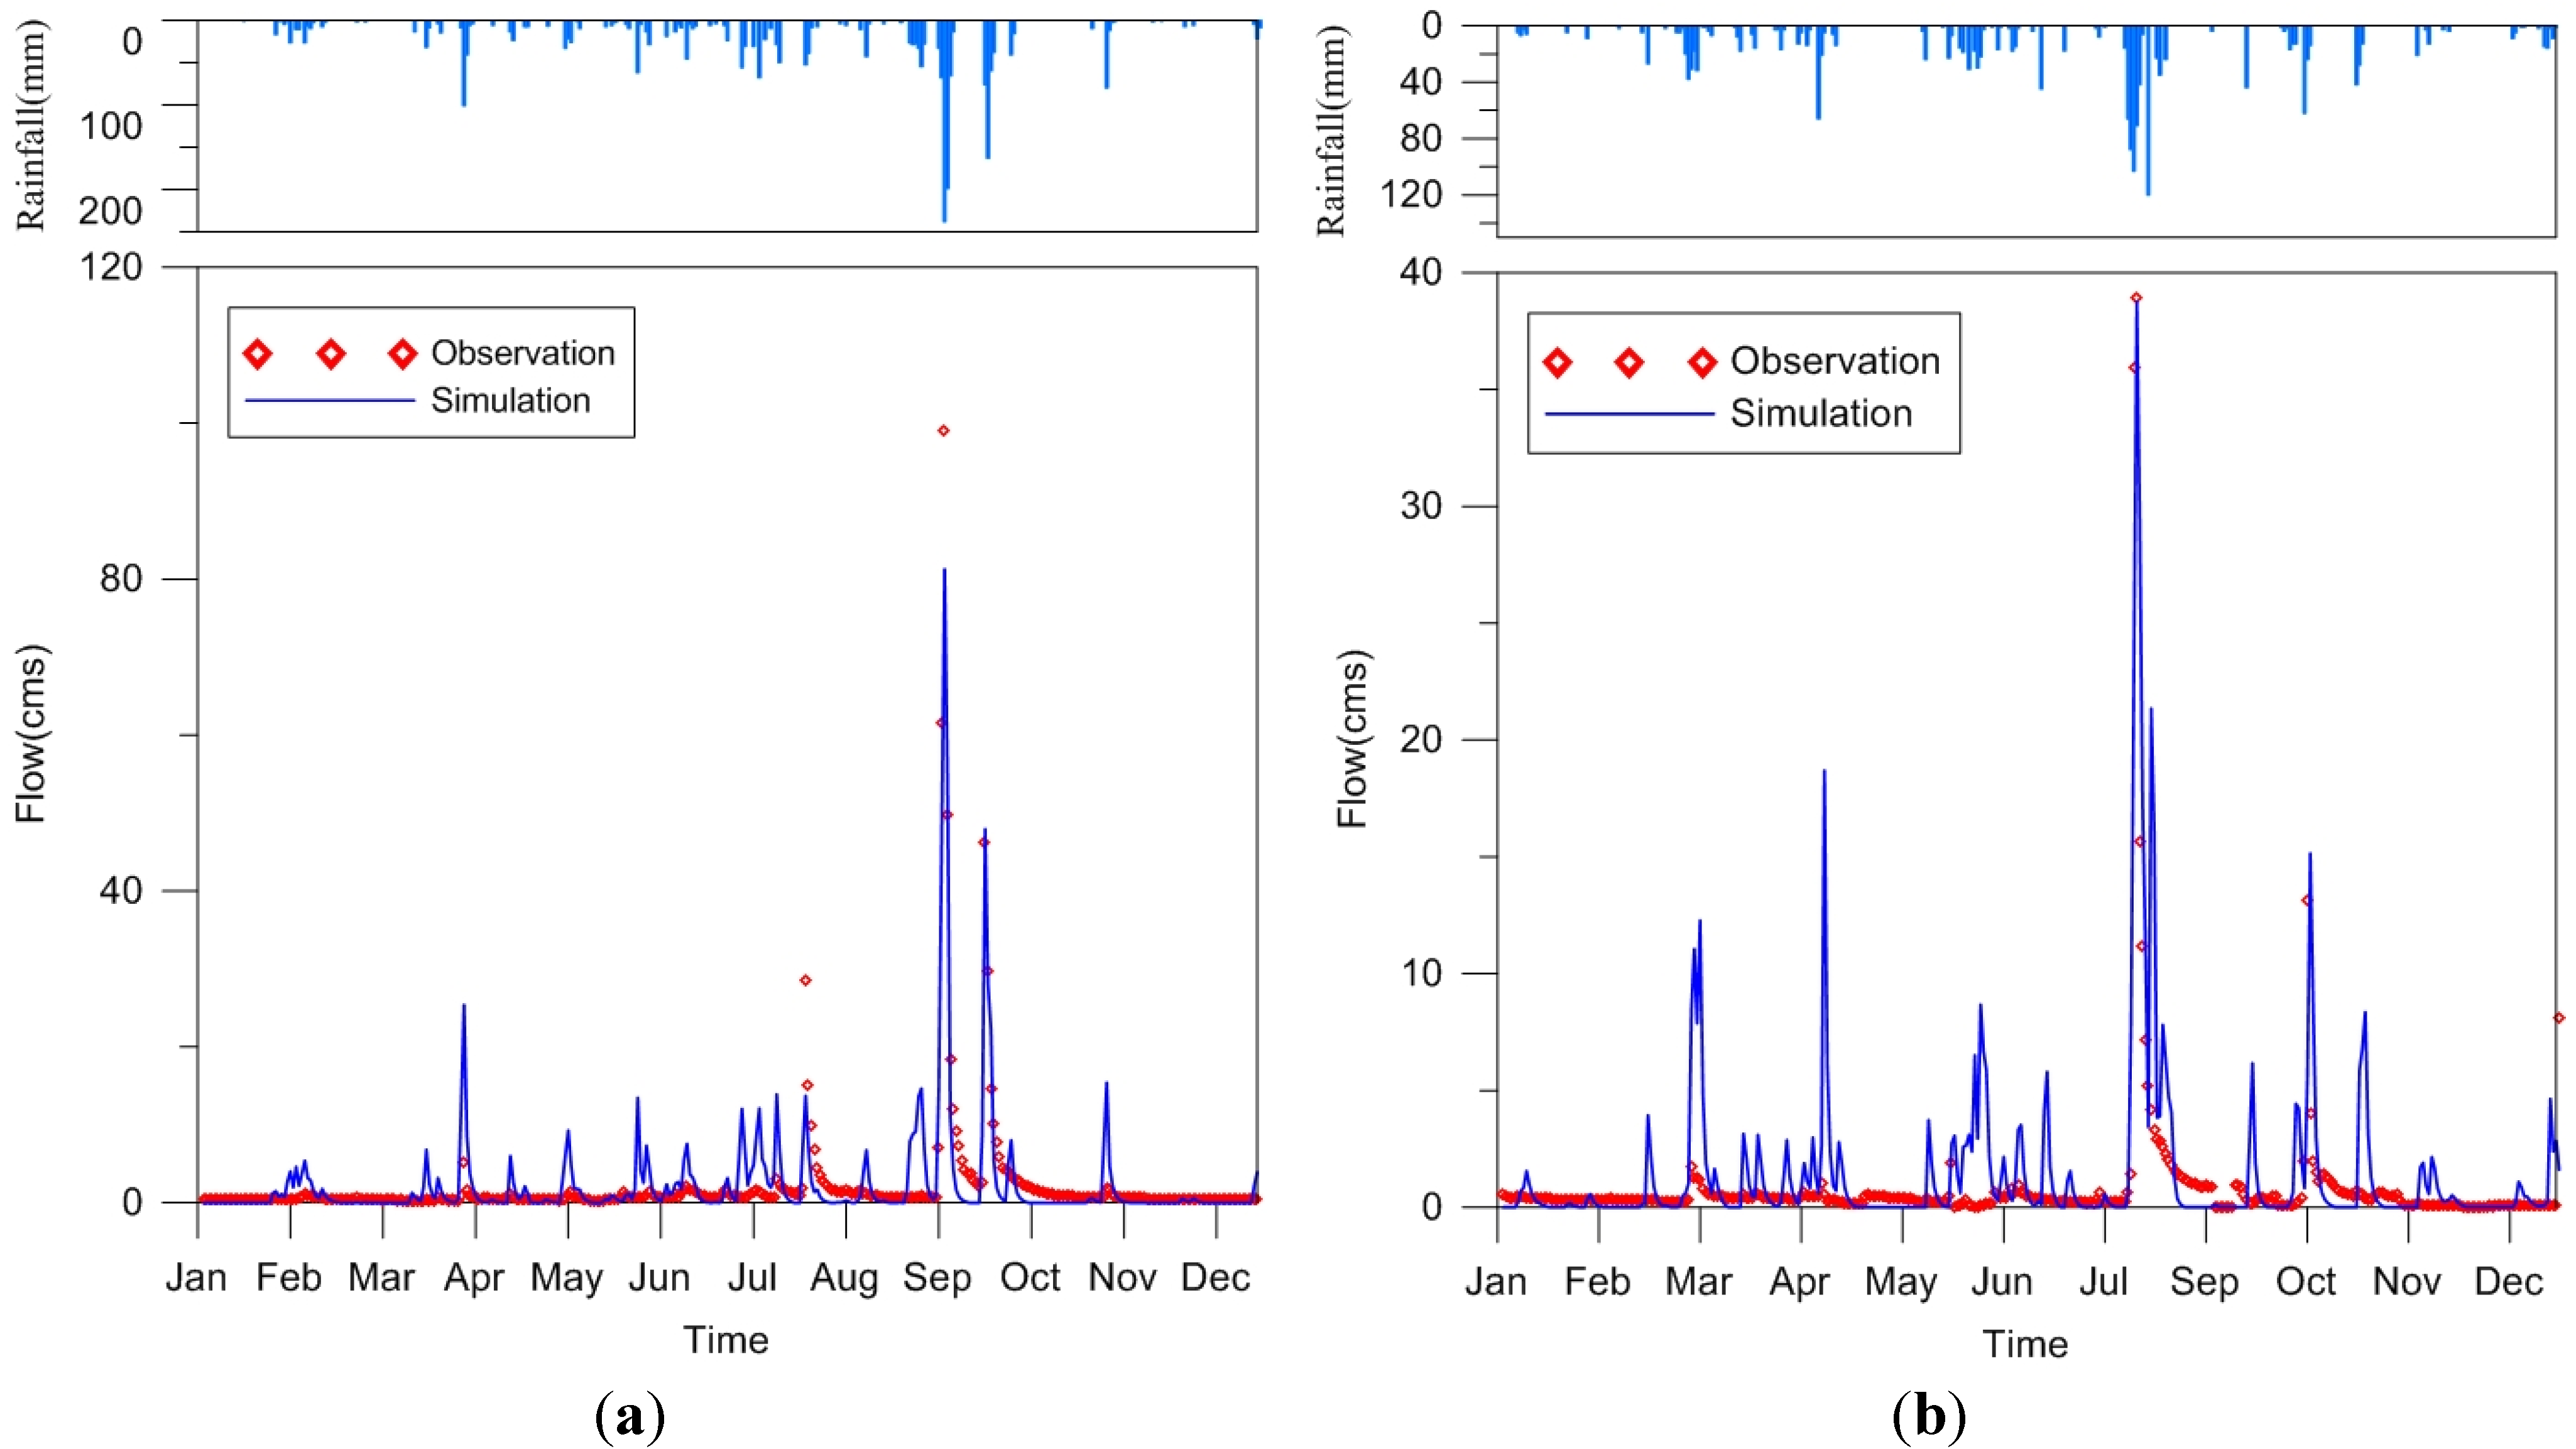
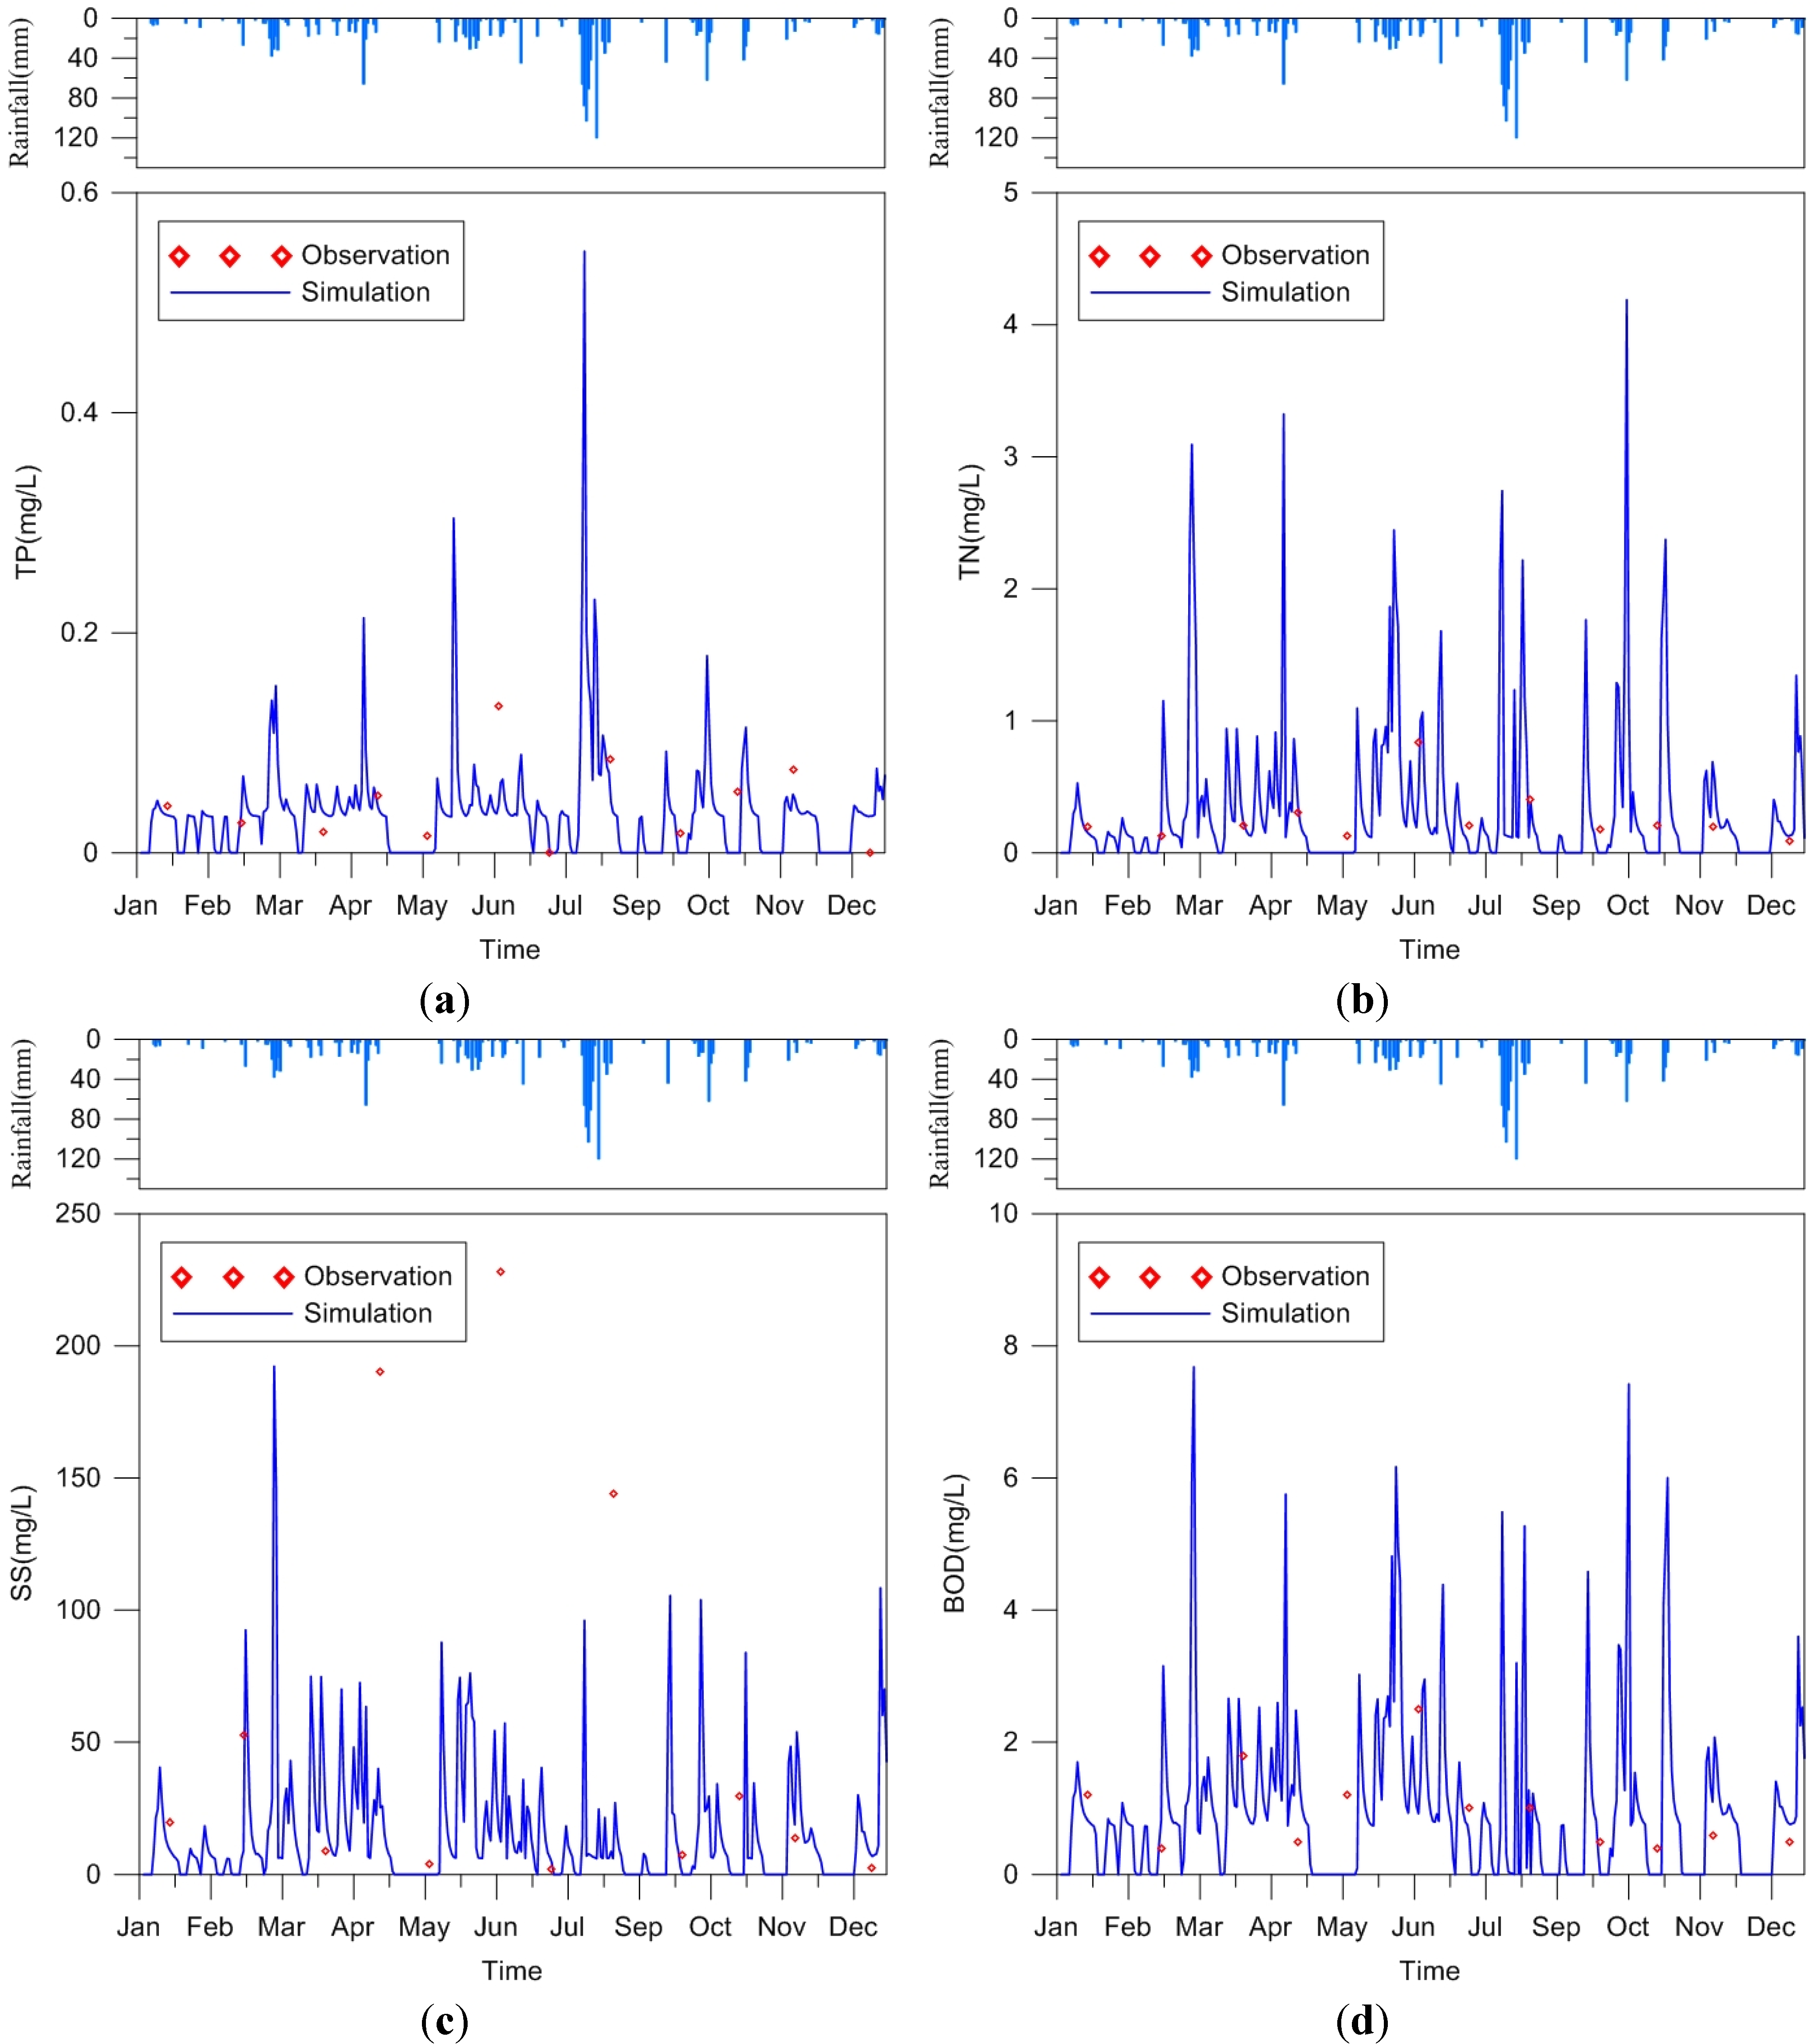
3.1. Model Calibration and Verification

Monitoring data from 2008 to 2009 was used. The 2008 data were used for calibration and the 2009 data were used for verification. Figure 4 shows the simulated flow results and Figure 5 shows the water quality results. The results from statistical analysis are summarized in Table 1. From the Figure 4 and Figure 5, it appears that the simulation values are more dynamic than the observed ones. The R2 for flow calibration and verification was 0.79 and 0.67, respectively. The trend for flow change could be predicted well and peak flow could be matched, but the simulations for low flow were dynamic and the observed data were relatively stable. This may be because simulation values were computed and directly reflected the precipitation situation. However, the observed outflows were buffered by natural transportations and the precipitation lost was more than the computed values. One of the significant differences was that the antecedent soil condition was not actually captured in the computation process, resulting in flow simulation errors. For water quality simulations, the observed water quality was usually sampled during good weather days and not rainy days, meaning nonpoint source pollution may not be detected and may result in lower pollutant concentrations than the simulated values.
Figure 4. Simulated flow results for: (a) calibration performed using 2008 data and (b) verification performed using 2009 data.
Water 06 03575 g004
Figure 5. Verification results from water quality simulations for: (a) TP (total phosphorous); (b) TN (total nitrogen); (c) SS (suspended solid); and (d) BOD (biological oxygen demand).
Water 06 03575 g005
Table 1. Statistical results of model calibration and verification.
ItemsFlowTPTNSSBOD
Statistic ResultsR2MAPE
Calibration0.7925.18%12.34%32.85%29.2%
Verification0.6725.21%0.74%33.14%37.5%
Simulation models include many calculation parameters which are not applied with directly observed data and need to be confirmed indirectly through a calibration and verification process. From this study, we found five model parameters that significantly affected the flow results. These parameters were the Manning coefficient for pervious land (Np), the Manning coefficient for impervious land (Ni), the depression depth for pervious land (Dp), the depression depth for impervious land (Di), and the coefficient of roughness for an open channel (R). The verified parameter values in this study are listed in Table 2. The upstream watershed is mostly covered by forest; thus, large Np and Dp values were required to fit the real conditions. When applying the SUSTAIN model on other similar cases, these verified parameter values could be used as reference values and decrease the time needed for model simulation.
The SUSTAIN model simulate water quality by the build up and flush off functions. Both functions need to be identified for each land use type. We tested each function and finally selected the power function (POW) as the build up function for all of the land types and the rating curve (RC) and event mean concentration (EMC) for different land types. The associated parameters or coefficients need to be determined in addition to selecting the calculation functions. The verified results for TP, TN, SS, and BOD are shown in Figure 5. All of the simulation results fell within a reasonable prediction range, for which the MAPE was between 20% and 50% (Table 1). The verified model parameters are listed in Table 3, including the selected functions and the key coefficients for different water qualities of various land types.
Table 2. Major model parameters for flow simulation using SUSTAIN model and its verified values in this study.
Model ParameterVerified ValueSuggested Range *
Manning coefficient for pervious land (Np)0.80.06–0.8
Manning coefficient for impervious land (Ni)0.30.1–0.3
Depression depth for pervious land (Dp)0.0120.011–0.024
Depression depth for impervious land (Di)0.050.05–0.1
Coefficient of roughness for open channel (R)0.10.04–0.1
Note: * Suggested range obtained from SUSTAIN manual [12] and SWMM manual [19].
Table 3. Major model parameters for water quality simulation using SUSTAIN model and its verified values in this study.
Water Quality and Selected FunctionLand Use
Agriculture LandForest LandConstructed Land
TPBuild up, c1POW *, 0.5POW, 0.35POW, 1.3
Flush off, c1EMC, 0.3RC, 0.01EMC, 0.6
TNBuild up, c1POW, 0.4POW, 0.3POW, 0.6
Flush off, c1EMC, 1RC, 0.4EMC, 1.5
SSBuild up, c1POW, 40POW, 30POW, 80
Flush off, c1EMC, 50RC, 25EMC, 100
BODBuild up, c1POW, 0.8POW, 0.5POW, 1.3
Flush off, c1EMC, 6RC, 0.7EMC, 15
Note: * POW = power function, EMC = event mean concentration, and RC = rating curve; C1 is the first parameter of a function, i.e., the maximum build up amount, EMC concentration, and flush coefficient of POW, EMC, and RC, respectively.

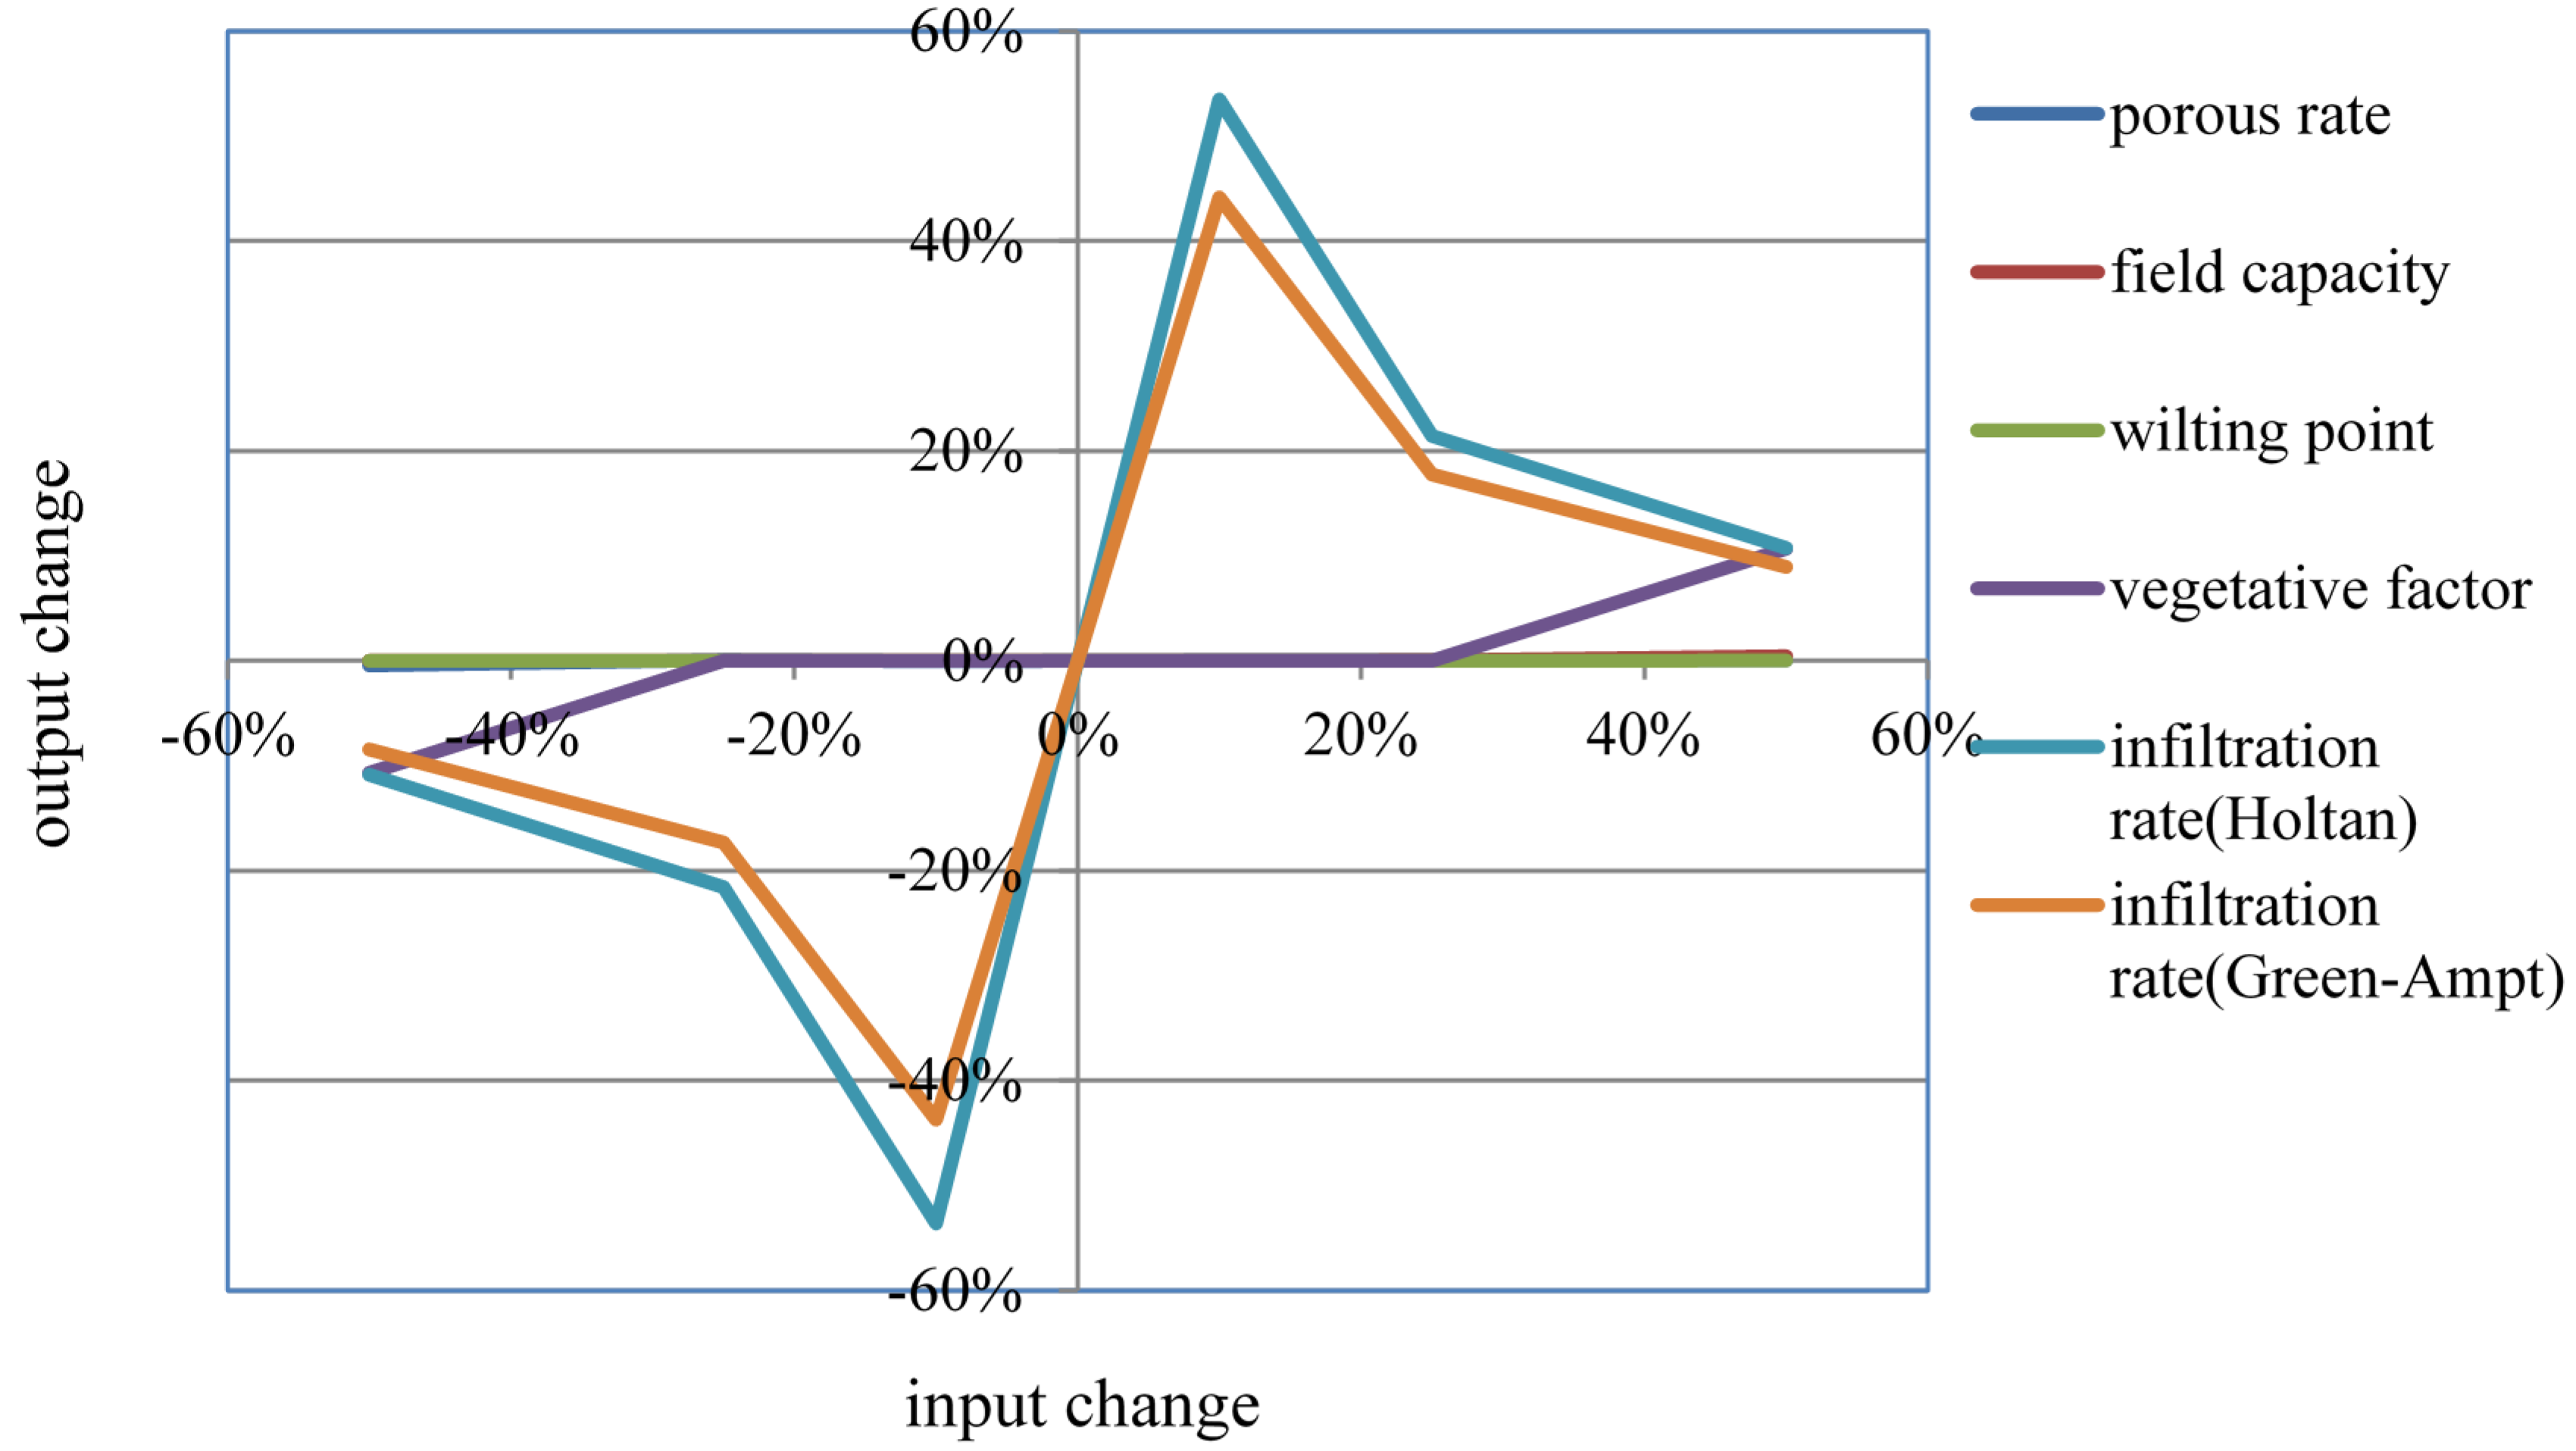
3.2. Sensitivity Analysis of Model Parameters

The model parameters in the watershed module were confirmed using the observed data, but the model parameters used in the LID module depended on the model defaults. Therefore, it was necessary to identify sensitive model parameters. The six model parameters used in all of the LID types in the SUSTAIN model were tested. The results are shown in Figure 6. In the figure, the output changes are based on changes in TP concentrations and the input changes are based on changes of the parameters values.
Figure 6. Sensitivity analysis results for model parameters used in BMP/LID module: porous rate, field capacity, wilting point, vegetative factor, infiltration rate (Holtan), and infiltration rate (Green-Ampt).
Water 06 03575 g006
The results showed that the porous rate, the field capacity, the wilting point, and the vegetative factor on water quality had minimal effects. In contrast, the infiltration rate, which was used in either the Holtan equation or the Green-Ampt equation, significantly affected the results. A 10% change in the infiltration rate increased the TP change by up to 50%. Thus, when using the SUSTAIN model, the infiltration rate of the LID units should be chosen very carefully to prevent over- or underestimation of the LID design performance. In the LID module calculation, we found that major reductions in pollution are due to the reduction of outflow volume and not from chemical or biological reduction, which is denoted as a degradation coefficient for different pollutants.

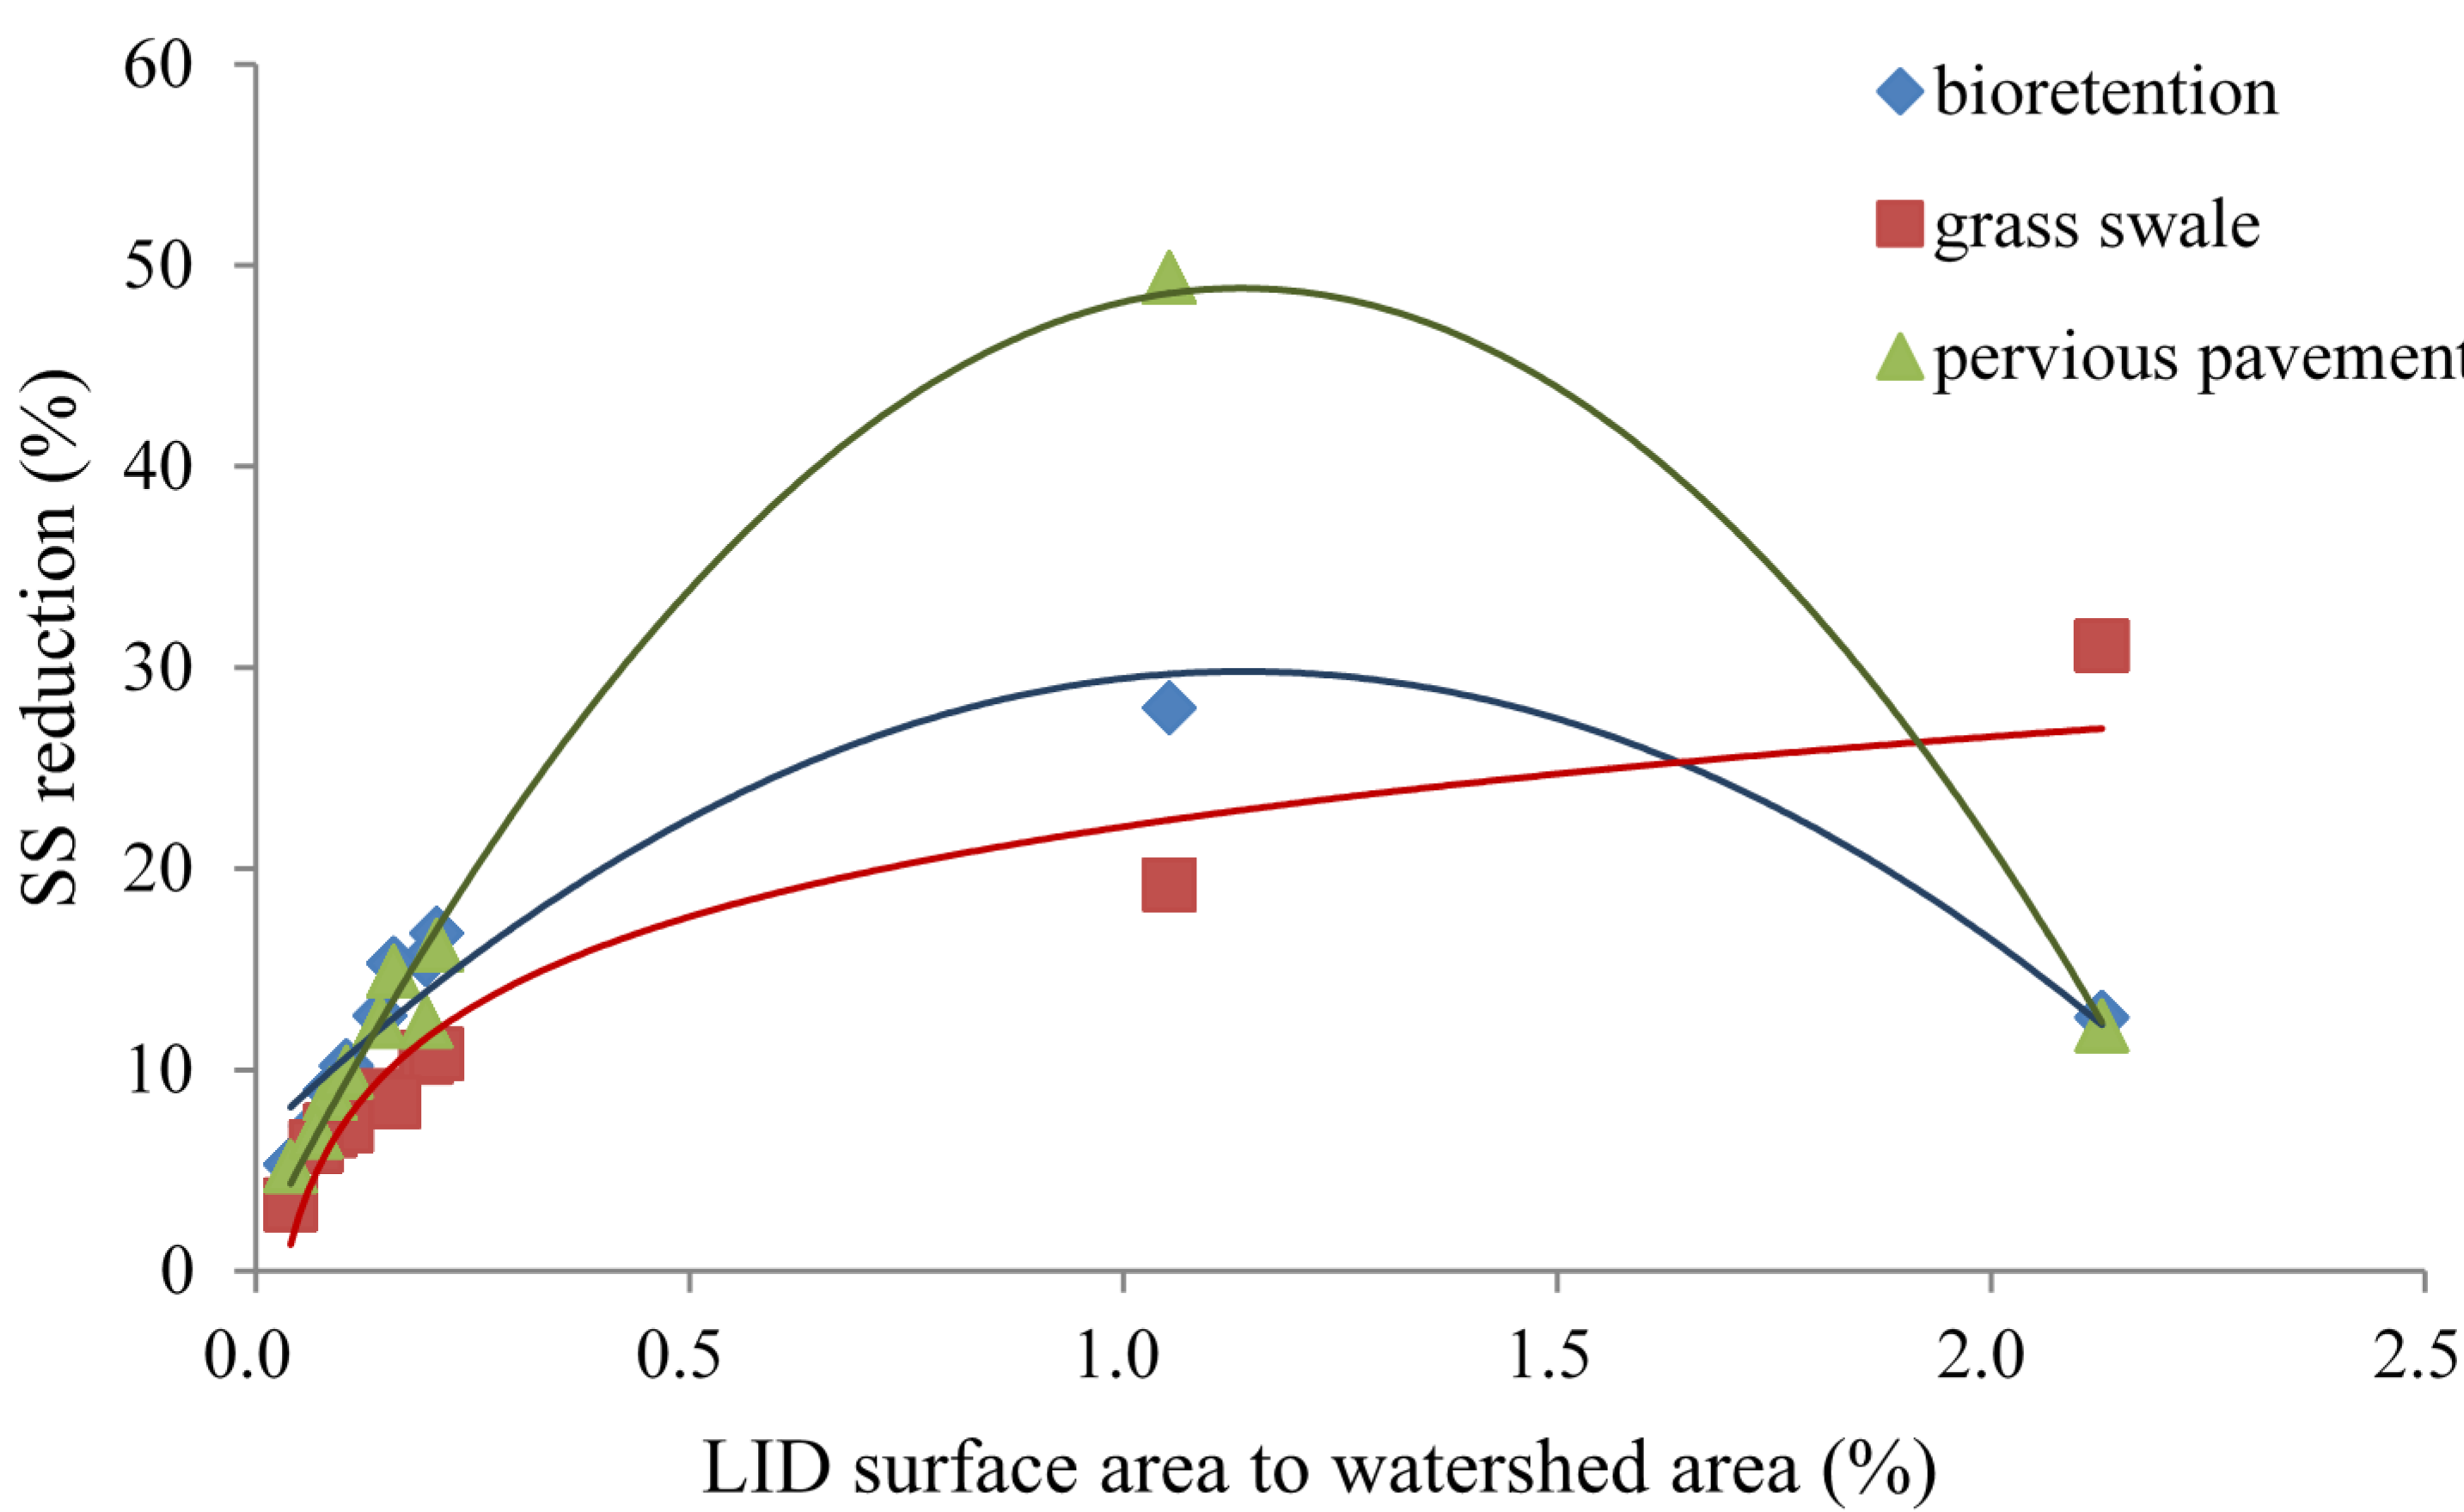
3.3. Effects of LID Types on Water Quality

The types of LID facilities needed to be selected before designing the LID policy to the case study. There are three LID types corresponding to three primary treatment mechanisms. The point LID corresponded to the storage function; the linear LID corresponded to the plants interception; and the area LID corresponded to fast infiltration. To determine the performance of different LID types, we chose bioretention cells, grass swales, and pervious pavements from point, linear, and area types of LID, respectively. The three LID facilities are commonly used and easily adjusted to cases. To estimate their treatment performance, each LID facility had a fixed surface area of 1000 m2 and the other model parameters were assumed to be the same. After we tested the three LID facilities in the 10 villages, the results showed that pervious pavements resulted in the greatest reduction in pollution and runoff, followed by the bioretention cell and the grass swale. The results implied that infiltration was the dominant contribution to LID performance and the plant interception had a minor effect on treatment.
In this simulation, the LID area was fixed at 1000 m2 and placed in the 10 villages in Yuanshanyan watershed. The areas of these villages were different, for example, two villages had areas below 10 ha and three villages had areas above 100 ha. Therefore, the pollution reduction rates in villages were not the same. We compared the percentage of the LID area of the watershed area and found that this ratio affected the pollution reduction performance (Figure 7). Increasing the LID area percentage increased the pollution reduction rate; however, the optimal reduction was obtained for an LID area that was 1% of the watershed area. When the LID area was greater than 1% of the watershed area, improvements in water quality either increased at a slower rate or started to decrease. This finding should be studied further to determine the optimal LID design.
Figure 7. Effects of LID area as a percentage of watershed area on pollution reduction, as measured by SS reduction. Optimal LID surface area is 1% of watershed area, regardless of LID types.
Water 06 03575 g007

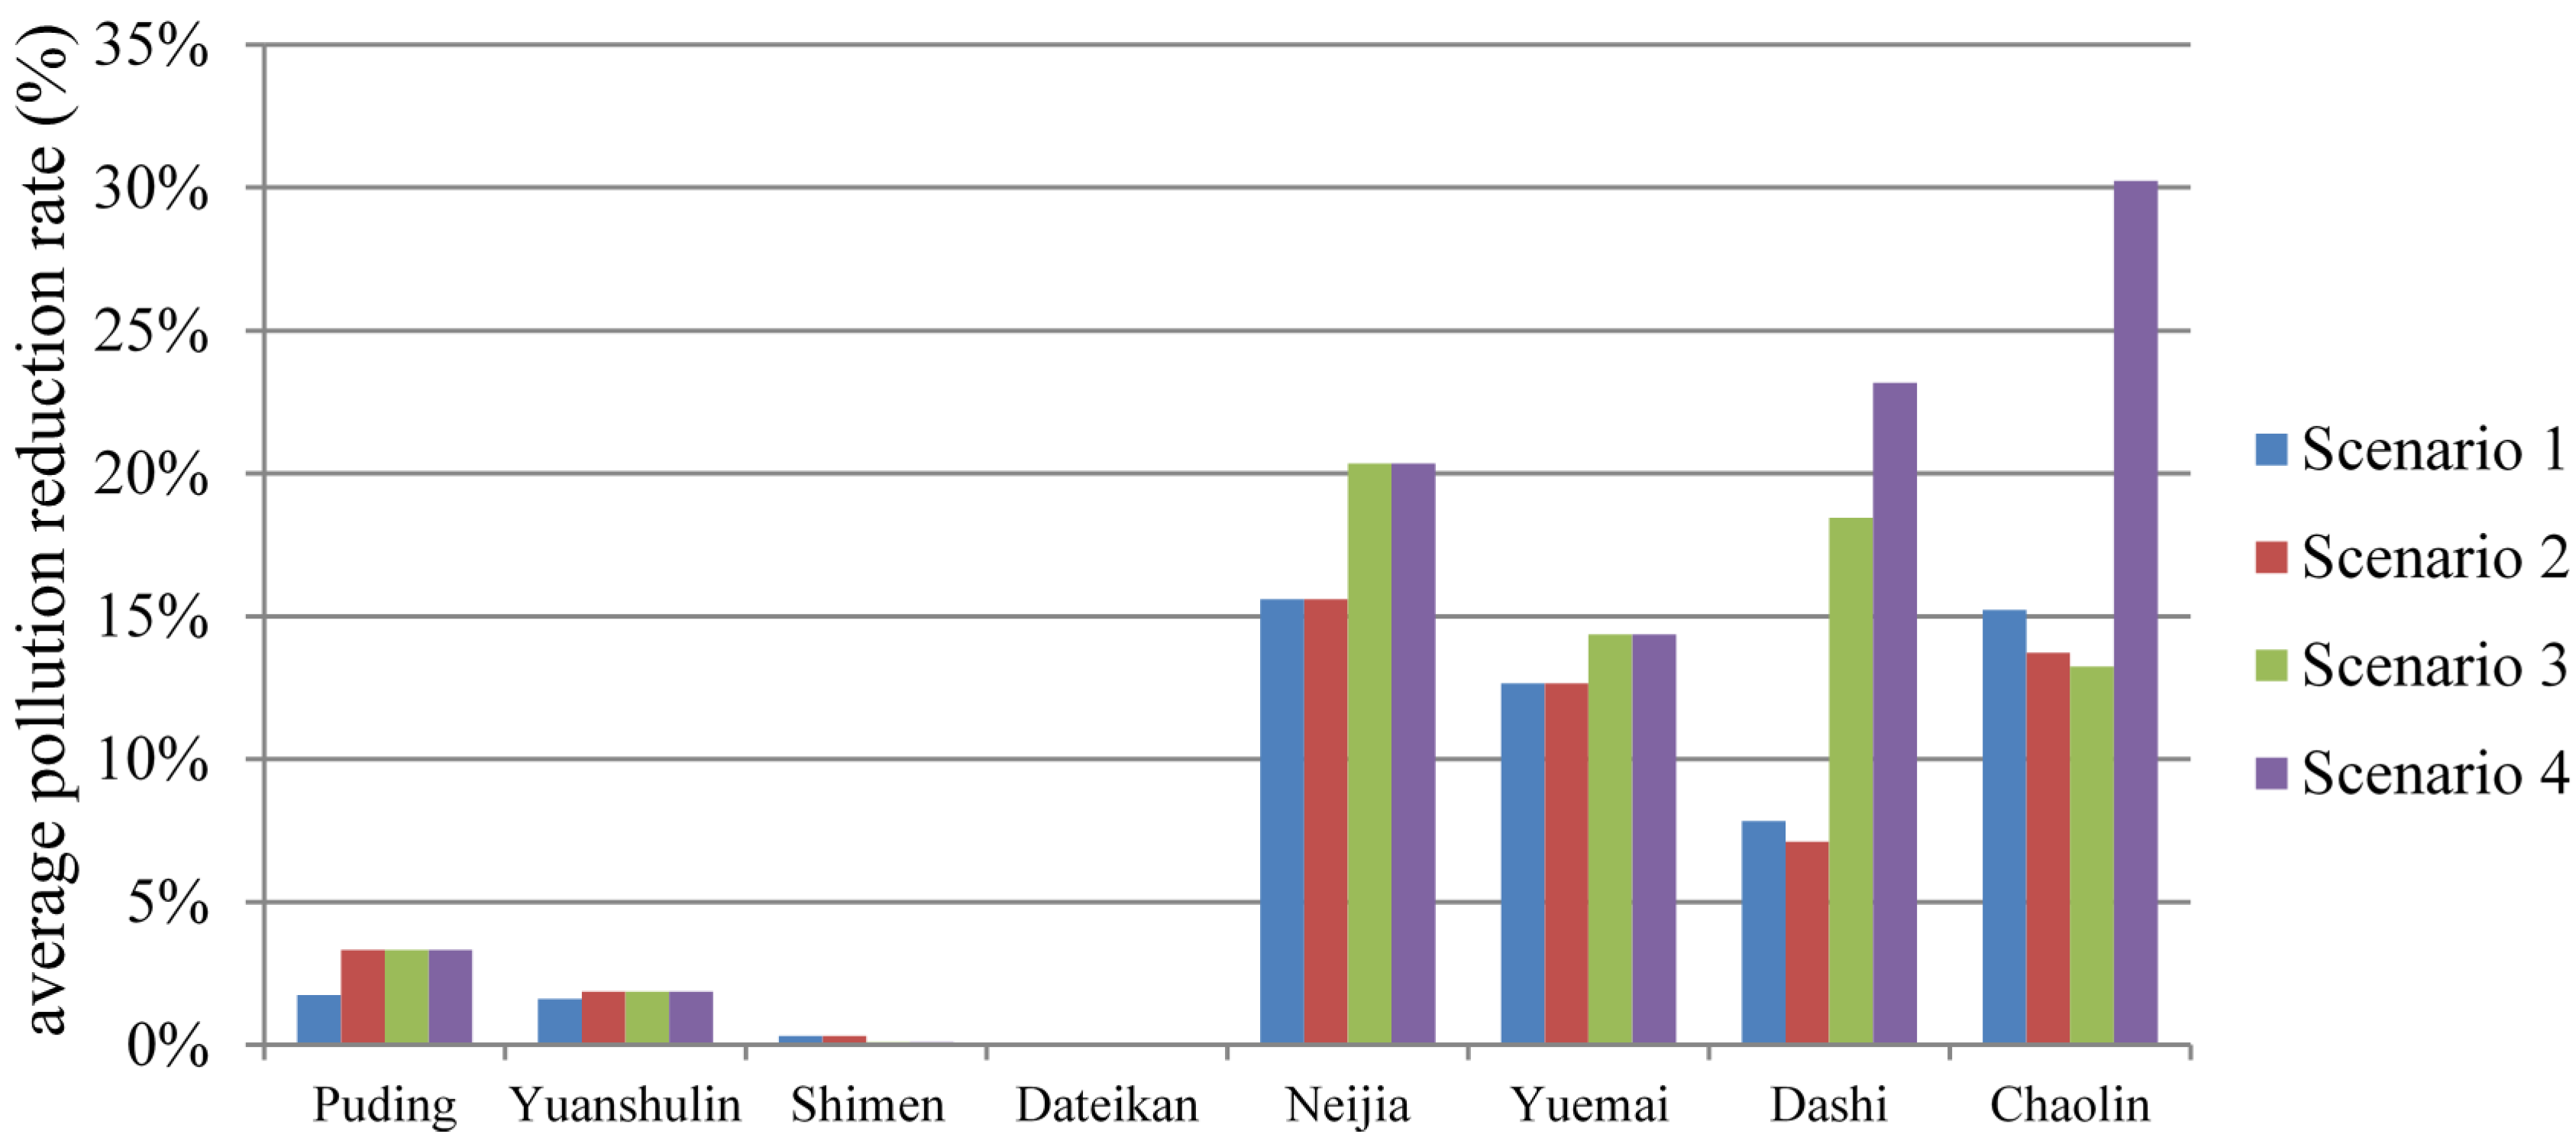
3.4. Performance of LID Practices in Yuanshanyan Watershed

For the 10 villages in non-urban planning areas of the Yuanshanyan watershed, we confined the potential LID locations to public areas such as green open spaces and public schools and did not consider private areas. A total of 25 potential sites with a total area of 103.42 ha were defined among the 10 villages. When choosing proper LID types and designing LID scenarios, the three previously tested LID types were used in the real case and other LID types were not considered. In this watershed, the green open spaces are usually near the river so that bioretention ponds and grass swales are suitable. For public schools, bioretention ponds and pervious pavement were used. Bioretention ponds could be integrated into existing gardens and pervious pavement could replace impervious parking lots or roads in the schools. The potential LID sites and their LID dimensions are summarized in Table 4. Because there were two LID alternatives that can be used in public open spaces and schools, this yielded four LID combinations.
  • Scenario 1: bioretention ponds for both open spaces and schools;
  • Scenario 2: bioretention ponds for open spaces and pervious pavements for schools;
  • Scenario 3: grass swales for open spaces and bioretention ponds for schools;
  • Scenario 4: grass swales for open spaces and pervious pavements for schools.
Table 4. LID dimensions for potential sites in Yuanshanyan watershed.
SiteLID Surface Area (ha)Bioretention Ponds (Width and Length, m)Pervious Pavement (Width and Length, m)Grass Swale (Length, m)Grass Swale (Width, m)
16.20249-522119
216.10401-184387
33.88197-62262
412.49353-650192
55.40232-71376
61.68130-28559
714.72384-928158
811.59340-1111104
912.51354-865144
1013.77371-1136121
112.213333
120.331313--
131.552828--
140.1488--
150.1177--
160.0977--
170.0977--
180.0344--
190.0866--
200.1077--
210.0655--
220.0655--
230.1077--
240.0766--
250.0766--
The results of using the LID practices for the four scenarios are shown in Figure 8. The Yuanshanyan watershed was divided into eight sewage collection systems such that the assessment point was set for eight control areas to evaluate pollution reduction based on the LID practices. The differences in the available LID site areas and the associated site properties resulted in variations in the pollution reduction rates from less than 1% to 30%. The pollution reduction rates shown in Figure 8 are the average rates from TP, TN, SS, and BOD reductions in each scenario. The Neijia, Yuemai, Dashi, and Chaolin subwatersheds exhibited higher pollution reduction than the other four subwatersheds and are recommended for implementing LID practices. Greater pollution reductions were obtained for Scenarios 3 and 4 than for Scenarios 1 and 2, showing that using grass swales in open spaces could yield greater pollution reductions than using bioretention ponds. Scenario 4 produced the greatest pollution reduction rates of all of the scenarios. The average reduction rates were 20.3%, 14.4%, 23.2%, and 30.2% for the Neijia, Yuemai, Dashi, and Chaolin subwatersheds, respectively. The simulation results were used to rank the LID locations and the design practices.
Figure 8. Pollution reduction for four LID scenarios for different sewage collection systems: in Scenario 1, bioretention ponds are used for both open spaces and schools; in Scenario 2, bioretention ponds are used for open spaces and pervious pavements are used for schools; in Scenario 3, grass swales are used for open spaces and bioretention ponds are used for schools; and in Scenario 4, grass swales are used for open spaces and pervious pavements are used for schools.
Water 06 03575 g008

4. Conclusions

The SUSTAIN model is a decision support tool for LID design and is expected to be increasingly used because the source control method of stormwater management has been widely accepted. However, this model has had limited applications, especially in international cases. In this study, the SUSTAIN model was applied to a Taiwanese watershed-scale case to test the feasibility of the model and determine suitable LID practices for local use. A model calibration and verification were performed and a sensitivity analysis was conducted on some of the model parameters. The model parameters were verified and can serve as references for similar watershed cases. We also tested different types of LID facilities and assessed various scenarios in which different LID facilities were combined. The results were satisfactory, and the primary subwatersheds where the LID practices resulted in high pollution reductions were ranked. However, local cost functions for different LID practices in Taiwan have not yet been constructed, thus the optimization module of the SUSTAIN model could not be used in this study.
The infiltration rate used in the SUSTAIN model should be very carefully considered. The water quality improvement of LID facilities was significantly affected by water quantity reduction. The infiltration rate was determined to be the parameter that was most sensitive to water quantity changes and water quality results. A 10% change in the infiltration rate resulted in a change in the output TP concentration by up to 50% regardless of whether the Holtan or Green-Ampt equation was chosen as the infiltration method. Infiltration is a predominant factor in LID practices; thus, we found that using the area type of LID with a high infiltration rate produced greater runoff and pollution reduction than using linear and point types of LID for fixed surface areas. Therefore, the infiltration rate used in the SUSTAIN model should be obtained from field tests to prevent under- or overestimation of the performance of LID practices.

Acknowledgments

The authors would like to thank the reviewers and editors for their valuable comments on improving the quality of the manuscript.

Author Contributions

All authors were involved in designing and discussing the study. Chi-Feng Chen drafted and finalized the manuscript. Ming-Yang Sheng executed the model. Chia-Ling Chang and Shyh-Fang Kang collected required data. Jen-Yang Lin coordinated the group and designed scenarios. All authors have read and approved the final manuscript.

Conflicts of Interest

The authors declare no conflicts of interest.

References

  1. Low Impact Development (LID): A Literature Review; EPA-841-B-00–005; United States Environmental Protection Agency (USEPA): Washington, DC, USA, October 2000.
  2. Coffman, L.S. Low-impact development: An alternative stormwater management technology. In Handbook of Water Sensitive Planning and Design; France, R.L., Ed.; Lewis Publishers: Boca Raton, FL, USA, 2002; pp. 97–123. [Google Scholar]
  3. The SUDS Manual; Construction Industry Research and Information Association (CIRIA): London, UK, 2007.
  4. Demonstrating the Multiple Benefits of SuDS—A Business Case—Literature Review; CIRIA Research Project RP993; CIRIA: London, UK, 2013.
  5. Takahasi, Y.; Uitto, U.I. Evolution of river management in Japan: From focus on economic benefits to a comprehensive view. Global Environ. Change 2004, 14, 63–70. [Google Scholar] [CrossRef]
  6. Gilroy, K.L.; McCuen, R.H. Spatio-temporal effects of low impact development practices. J. Hydrol. 2009, 367, 228–236. [Google Scholar] [CrossRef]
  7. Jia, H.; Lu, Y.; Yu, S.L.; Chen, Y. Planning of LID–BMPs for urban runoff control: The case of Beijing Olympic Village. Sep. Purif. Technol. 2012, 84, 112–119. [Google Scholar] [CrossRef]
  8. Jia, H.; Yao, H.; Yu, S.L. Advances in LID BMPs research and practice for urban runoff control in China. Front. Environ. Sci. Eng. 2013, 7, 709–720. [Google Scholar] [CrossRef]
  9. Ahiablame, L.M.; Engel, B.A.; Chaubey, I. Effectiveness of low impact development practices: Literature review and suggestions for future research. Water Air Soil Pollut. 2012, 223, 4253–4273. [Google Scholar] [CrossRef]
  10. Doubleday, G.; Sebastian, A.; Luttenschlager, T.; Bedient, P.B. Modeling hydrologic benefits of low impact development: A distributed hydrologic model of the Woodlands, Texas. J. Am. Water Resour. Assoc. 2013, 49, 1444–1455. [Google Scholar] [CrossRef]
  11. Elliott, A.H.; Trowsdale, S.A. A review of models for low impact urban stormwater drainage. Environ. Model. Softw. 2007, 22, 394–405. [Google Scholar] [CrossRef]
  12. SUSTAIN—A Framework for Placement of Best Management Practices in Urban Watersheds to Protect Water Quality; EPA/600/R-09/095; USEPA: Washington, DC, USA, September 2009.
  13. Report on Enhanced Framework (SUSTAIN) and Field Applications for Placement of BMPs in Urban Watersheds; EPA 600/R-11/144; USEPA: Washington, DC, USA, November 2011.
  14. Lee, J.G.; Selvakumar, A.; Alvi, K.; Riverson, J.; Zhen, J.X.; Shoemaker, L.; Lai, F. A watershed-scale design optimization model for stormwater best management practices. Environ. Model. Softw. 2012, 37, 6–18. [Google Scholar] [CrossRef]
  15. Zhang, G.; Hamlett, J.M.; Reed, P.; Tang, Y. Multi-objective optimization of low impact development designs in an urbanizing watershed. Open J. Optim. 2013, 2, 95–108. [Google Scholar] [CrossRef]
  16. Baek, S.S.; Choi, D.H.; Jung, J.W.; Yoon, K.S.; Cho, K.H. Evaluation of a hydrology and run-off BMP model in SUSTAIN on a commercial area and a public park in South Korea. Desalin. Water Treat. 2014. [Google Scholar] [CrossRef]
  17. Saravanapavan, T.; Zhang, G.; Voorhees, M. Sustainability through optimization: The future of watershed management. Appl. Mech. Mater. 2013, 260–261, 876–881. [Google Scholar]
  18. Application Guide for Hydrological Simulation Program—FORTRAN (HSPF); EPA-600/3-84-065; USEPA: Washington, DC, USA, 1984.
  19. Rossman, L.A. Storm Water Management Model User’s Manual Version 5.0; EPA/600/R-05/040; USEPA: Washington, DC, USA, June 2007.

