Article

A Mass Balance Model for Designing Green Roof Systems that Incorporate a Cistern for Re-Use

Stormwater Management Academy, Department of Civil and Environmental Engineering, University of Central Florida, P.O. Box 162450, Orlando, FL 32816-2450, USA
*
Author to whom correspondence should be addressed.
Water 2012, 4(4), 914-931; https://doi.org/10.3390/w4040914
Submission received: 18 September 2012 / Revised: 29 October 2012 / Accepted: 7 November 2012 / Published: 13 November 2012
(This article belongs to the Special Issue Sustainable Urban Water Management)

Abstract

:
Green roofs, which have been used for several decades in many parts of the world, offer a unique and sustainable approach to stormwater management. Within this paper, evidence is presented on water retention for an irrigated green roof system. The presented green roof design results in a water retention volume on site. A first principle mass balance computer model is introduced to assist with the design of these green roof systems which incorporate a cistern to capture and reuse runoff waters for irrigation of the green roof. The model is used to estimate yearly stormwater retention volume for different cistern storage volumes. Additionally, the Blaney and Criddle equation is evaluated for estimation of monthly evapotranspiration rates for irrigated systems and incorporated into the model. This is done so evapotranspiration rates can be calculated for regions where historical data does not exist, allowing the model to be used anywhere historical weather data are available. This model is developed and discussed within this paper as well as compared to experimental results.

Graphical Abstract

1. Introduction

The ability of green roofs to control stormwater runoff is well documented in the literature. The control of stormwater runoff is a pressing issue facing most urban areas. Stormwater runoff is, by nature, a difficult waste stream to control. Due to the large volumes of water generated, stormwater runoff contributes to poor surface water quality. Urban areas have either separate sewers or a combined sewer system which frequently overflows during storm events causing large amounts of raw sewage to be discharged into surface water bodies [1]. Stormwater runoff into separate or combined sewers can be polluted in several ways such as contact with corroded and deposited roof materials [2], contact with polluted particulate matter on roadways [3], and contact with fertilizers and pesticides from lawns and agricultural land [4]. A sustainable solution for treatment of roof runoff water is the use of a green roof stormwater treatment system.
A green roof with a cistern for reuse offers a sustainable and aesthetically pleasing treatment solution that utilizes unused space to treat and store stormwater runoff. This system includes a green roof with its drainage system connected to a cistern. The cistern in turn supplies irrigation water to the roof via a pump. A supplemental water source is also connected to the cistern to provide water should there not be sufficient water to perform the irrigation event. This supplemental source can be either potable water or, provided that the quality of the water is acceptable for irrigation purposes, grey water or stormwater from a nearby pond. The pump can be either electric or solar depending on the site conditions and project goals. The irrigation is managed via a controller, similar to what is widely used for home lawn irrigation, which only irrigates on the prescribed times unless sufficient rain has fallen within 24 h of the intended irrigation event. This is controlled via a quark gage which will prevent irrigation when the quark swells with sufficient water, which can be set by the operator. Systems similar to this are fairly common in the state of Florida. With the adaptabilities of a green roof system, it can be applied to almost any roof structure [5,6]. The results in this paper will give developers and builders new options for stormwater management source control that will allow them to treat polluted stormwater, reduce the volume of discharge and thus eliminate an impervious surface and pollution contributor [7].
Recycling the stormwater runoff and irrigating the green roof with stored water enhances hydrologic related factors such as evapotranspiration, the filtering and water holding abilities of the plants and media, as well as greatly reduces the volume of stormwater runoff leaving the site. In order to achieve this, a cistern needs to be used to store the water between irrigation events. The only two ways water will leave the system are through evapotranspiration and as stormwater runoff when the system reaches storage capacity from large storm events. The only two ways water will enter the system are from precipitation and from a supplemental source that is of a quality that is acceptable for irrigation use. The efficiency of the system is determined from the total precipitation and the total overflow from the cistern. Design equations and a model are developed to estimate the size of a cistern given a desired hydrologic efficiency.
A practical approach to the problem of stormwater runoff is to try to treat the water as close to where it is generated as possible. This concept is called source control [8]. Developing undeveloped land reduces the evapotranspiration and increases the stormwater runoff for that area, thereby changing the hydrologic cycle for the watershed. The practice of using plant- and soil-based techniques for treating and holding stormwater at the source to decrease stormwater runoff and increase evapotranspiration rates is called low-impact development (LID) [9]. It should be noted that LID broadly equates to best management practice (BMP), water sensitive urban design (WSUD) and sustainable urban drainage system (SuDS). A new LID treatment option for some parts of the world, but has been used as standard practice in other parts, is introduced within this paper—the use of a green roof and cistern system. Green roofs with cisterns have been shown to remove pollutants from stormwater [5,10], making this a way to utilize the unused roof space, which is in many cases a source of stormwater pollution.
Hunt and Moran [7] completed a water budget on a non-irrigated green roof and found that for small precipitation events, the green roof was able to retain approximately 75% of the precipitation and reduce the peak flow by as much as 90% as well as increase the time of concentration to almost four hours [7]. The time of concentration is the amount of time it takes for stormwater runoff to occur after a precipitation event has begun [7,11].
MacMillan [12] studied the water quantity of stormwater runoff from an irrigated green roof in Toronto. It was found that green roofs were able to significantly reduce the total stormwater runoff volume and the peak flows coming off a roof for small storm events, around 55% and 85%, respectively, for storm events less than or equal to 10 mm [12]. Also addressed in MacMillan’s [12] paper, is the fact that green roof volume control efficiency changes with time of year noting that the efficiency is higher in the spring and summer months and lower in the winter and fall months.
Moran et al. [13] studied green roofs in North Carolina to examine runoff quantity and quality as well as evaluate plant growth. During the nine month period examined it was found that a green roof was able to retain about 60% of the total rainfall volume while reducing the peak flow by about 80% [13].
Green roof stormwater treatment systems are an acceptable way to treat and store stormwater. Modern green roofs have been used for three decades or more in Europe. Despite this longevity, there have been little or no equations developed for the design of cisterns intended to store green roof runoff/filtrate for irrigation. There have been models developed to predict the runoff from a green roof using historical precipitation and evapotranspiration data. Hoffman [1], Miller [14,15], and Hilten et al. [16] have developed models for the purpose of green roof stormwater retention, but did not include the addition of a cistern to store and reuse stormwater for green roof irrigation. Hoffman [1], Miller [14,15], and Hilten et al. [16] have identified the important factors that determine green roof efficiency without a cistern. These factors are soil moisture, soil water holding capacity, plant water holding capacity, precipitation, evapotranspiration, temperature, and humidity. While Miller [14,15] and Hilten et al. [16] discusses the different approaches used to develop a green roof model they use modified groundwater modeling programs for the development of their models. The models proposed by Hoffman [1] and Miller [14,15] are a representation of the actual findings from several working green roofs. However, the mass balance across the green roof boundary may not be preserved. Further, by using groundwater modeling variables that are not easy to measure or describe with equations could introduce more error into the model rather than the desired result of a fine tuned model. Hilten et al. [16] did use a mass balance approach but also incorporated groundwater modeling variables which are difficult to estimate over long periods of time limiting the usefulness of this model to individual storm events.
There are a few models in the literature that examine the reuse of stormwater. A model presented by Gue and Baetz [17] examines the use of a probabilistic model to size rain barrels and cisterns for stormwater reuse. They showed that rain barrels and cisterns can reliably provide water for irrigation and other non-potable uses during interevent dry periods but do not examine the hydrologic efficiency [17]. The variability in reliability and storage volume with respect to geographic region was noted [17]. While the development of the model was logical the use of probabilistic variables results in a complicated model. Further the rainfall data used in the development of the model was selected for only four months potentially excluding important rainfall data. Different types of roof cover were not examined, specifically an irrigated green roof which would return water to the cistern during the irrigation event.
Liaw and Tsai [18] also developed a model to optimize reliability based on cistern storage and roof area. They used historical rainfall data and runoff coefficients that they developed from experimentation. While the use of runoff coefficients is a common method for stormwater volume estimation the values they reported (0.82) are low for impervious roof cover [18]. Furthermore, on an event by event basis this number will change, i.e., the runoff coefficient should decrease with decreasing rainfall volume and increase with increasing rainfall volume. The use of a constant value for the runoff coefficient will result in overestimation of runoff volume for small storm events and underestimation for large storm events. Further, Liaw and Tsai [18] did not examine hydrologic efficiency nor how an irrigated green roof would affect reliability.
Jones and Hunt [19] also examined the performance of rainwater harvesting systems as related to reliability and hydrologic efficiency. They found that small storage systems such as rain barrels were inadequate to provide water for irrigation and at reducing stormwater runoff while larger systems performed well [19]. Jones and Hunt [19] note that the main factors that influence cistern size, hydrologic efficiency and reliability, are conflicting making the sizing of these systems problematic.
Douglas et al. [20] examined three models for the estimation of potential evapotranspiration (ET), namely the Penman-Monteith, the Priestley-Taylor, and the Turc. They found that, while all three give reasonable estimations of the potential ET, the Priestley-Taylor gave the best fit to data from around the state of Florida followed by the Turc and then the Penman-Monteith [20]. Douglas et al. [20] note from their literature review that often simpler, temperature based models provide sufficient estimations for most modeling applications. While Douglas et al. [20] examined several different types of land cover they did not examine green roofs.

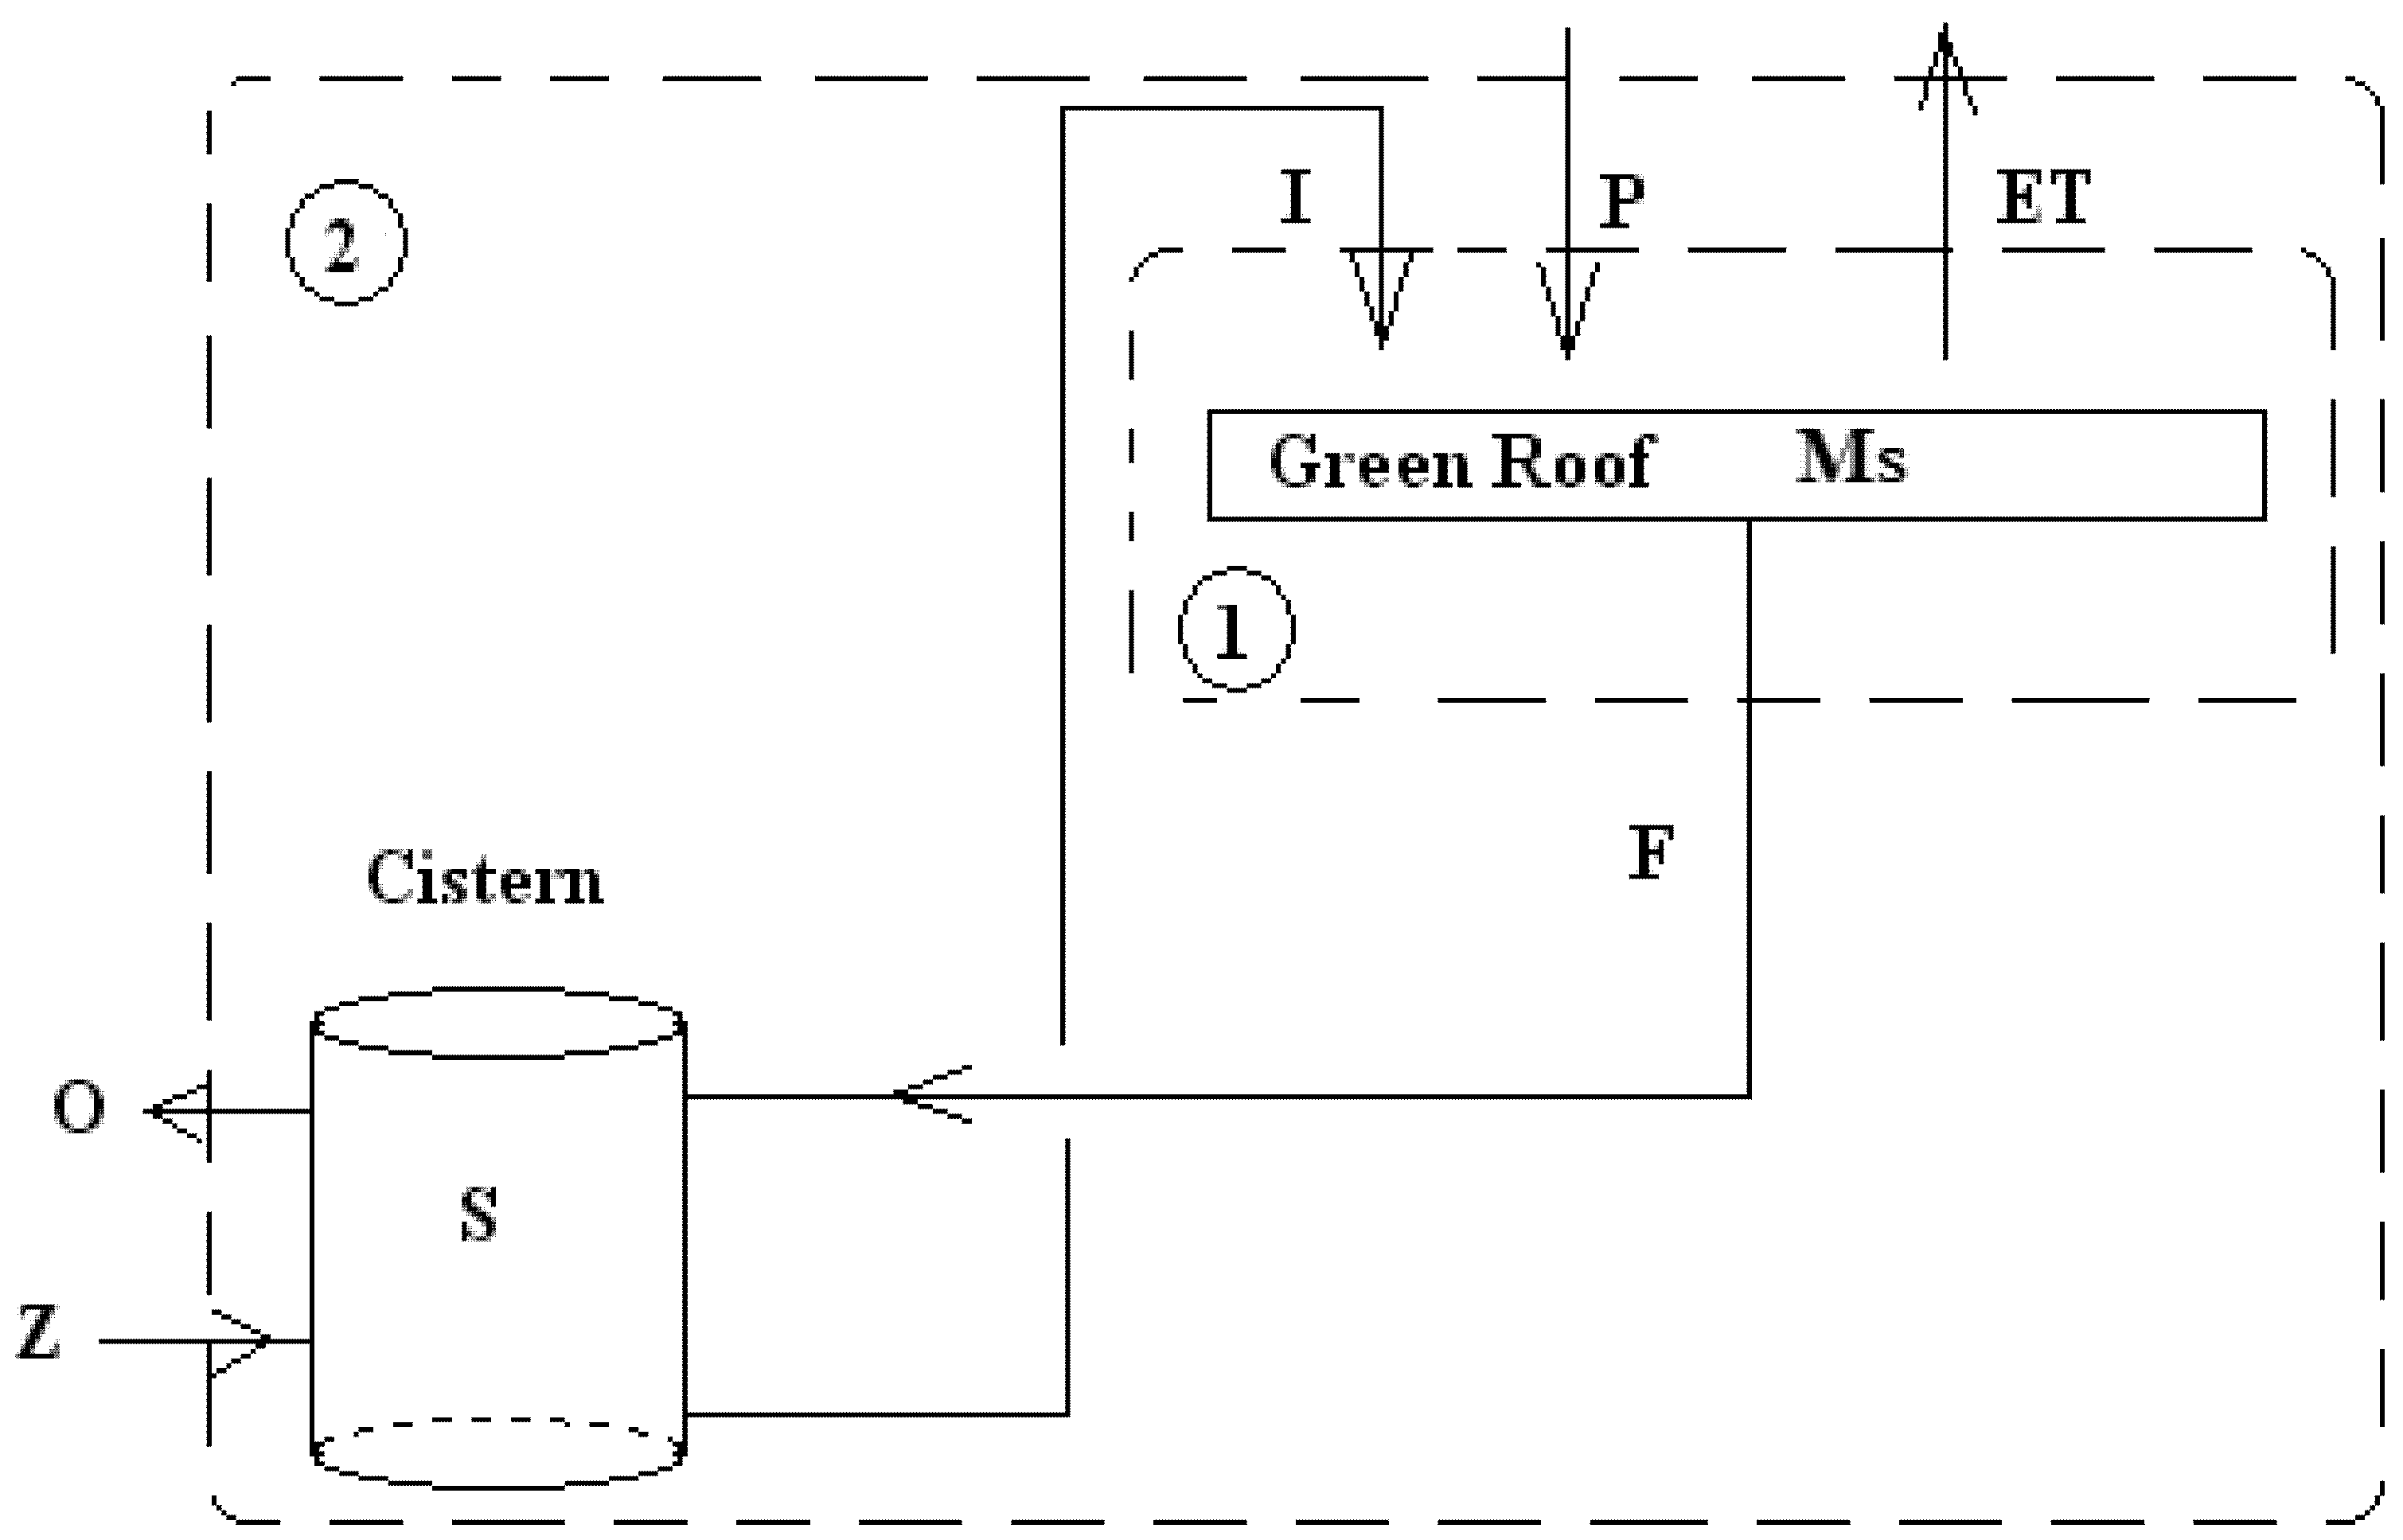
2. Methodology for Estimating Retention of Water

The intent of this work is to develop a mathematical model based on data presented by Hardin [10] to accurately predict the hydrologic performance of an irrigated green roof system which incorporates the use of a cistern to collect and reuse filtrate water. The data from several full scale and bench scale green roofs were reviewed and used to design a model to size cisterns to achieve a desired hydrological efficiency. It has been shown in previous work that green roofs in Florida need to be irrigated for the survival of the vegetation [5,6,10,21]. This requires the designer to designate a water supply for this purpose. Hardin [10] proposed the use of a cistern to capture green roof filtrate and reuse this water for irrigation of the green roof. The work of Hardin [10] was principally used to develop the model presented while other data was used to validate the model and justify model assumptions. Hardin [10] examined several different green roof systems, however for the purposes of developing the model presented in this work two systems are examined, a control roof and an irrigated green roof with a cistern to store and reuse the filtrate. From the work of Hardin [10], a control roof (C1 and C2) is a conventional roof, in this case a thermoplastic membrane roof, i.e., one without vegetation. The green roof system (EVR1 and EVR2) from Hardin [10] consists of a thermoplastic membrane with a geosynthetic protection layer above it, a 50.8 mm (2 in.) gravel drainage layer above that, a non-woven separation fabric above that, a 152.4 mm (6 in.) layer of growth media with vegetation on the top. In addition a cistern with a volume equivalent to 127 mm (5 in.) over the green roof area, which is 0.092 m (16 square feet) is also part of the design [10]. This design has several benefits, including reduction in potable water demand and increased hydrologic efficiency of the system [10].
Hardin [10] measured the change in cistern water volume, irrigation volume, rainfall volume, and filtrate volume. Additionally, Hardin [10] defined a new variable called the filtrate factor which is the fraction of applied water, either through irrigation or natural precipitation, which drains off the roof. Since the water drains through the greenroof media it is called filtrate. ET volume was estimated based on a mass balance approach. This data was collected over a one year period from 3 October 2005 to 29 September 2006 in Orlando, Florida. Data was collected twice weekly for the duration of this project [10].
Kelly et al. [5] and Wanielista et al. [21] examined green roofs having different depths namely, 50.8 mm (2 in.), 101.6 mm (4 in.), 152.4 mm (6 in.), and 203.2 mm (8 in.) and reported a full year of hydrologic data. It was shown that depth had no significant effect (α = 0.05) on ET rates. It was also shown that there was a significant effect on filtrate factor but it was related to soil water storage capacity [5,21]. The results from two full scale green roofs examined by Kelly et al. [5] agreed well with data collected from experimental chambers. These studies show that ET is not dependent on growth media depth but rather local meteorological conditions. The Blaney and Criddle equation is presented and analyzed to determine its acceptability for ET determination and make the model relevant for cistern design in all geographic regions. It should be noted that the media used was largely inorganic expanded clay and will not degrade over time. This is evident from a green roof in central Florida that, despite the hot climate and weather conditions, after seven years has no visual signs of degradation [22]. The media has the trade name of Bold & GoldTM. Within the state of Florida, over 5,600 square meters (60,000 square feet) of green roofs have been installed using this media in the last 7 years [22].
The effect of different drainage materials was also examined by Kelly et al. [5] and Wanielista et al. [21]. Two different types of drainage materials were examined, namely a 15.875 mm (0.625 in.) expanded clay at a depth of 50.8 mm (2 in.), and a geo-synthetic material [5,21]. The geo-synthetic material was a plastic sheet with dimples allowing storage of water between precipitation and irrigation events [5,21]. No significant difference (α = 0.05) in ET or filtrate factor was found for the different drainage materials [5,21]. These results show that ET and filtrate factor results should be unaffected by drainage material selection, and thus not an important design factor as it relates to hydrological efficiency.
The species of plants, were held constant for these experiments and include; Helianthus debilis (Dune sunflower), Gaillardia pulchella or aristata (Blanket flower), Lonicera sempervirens (Coral honeysuckle), Myricanthes fragrans (Simpson’s stopper), Clytostoma callistegioides (Argentine trumpet vine), Tecomeria capensis (Cape honeysuckle), and Trachelospermum jasminoides (Confederate jasmine). The plants were selected based on hardiness, drought tolerance, the aesthetically pleasing aspects of the plant and whether or not they are native to Florida. The first four plant species are Florida natives while the last three are naturalized. The plant species are an important factor for calculating the ET using the Blaney and Criddle equation. It should be noted that the ET calculated using this equation was for plants similar to the ones listed above, i.e., ground cover plantings.

3. Results and Discussion

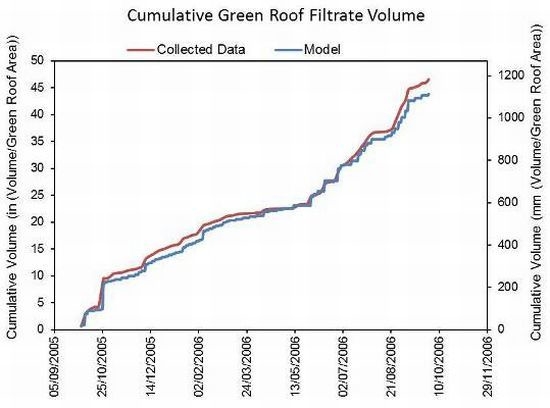
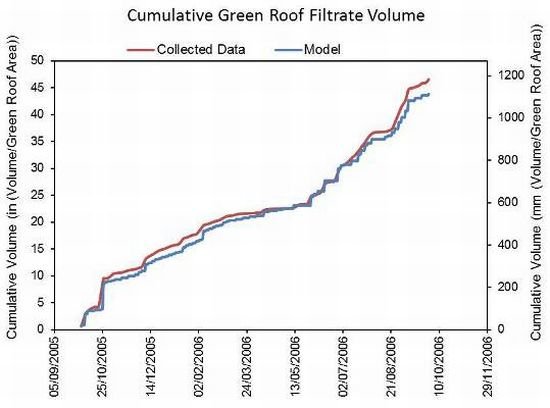
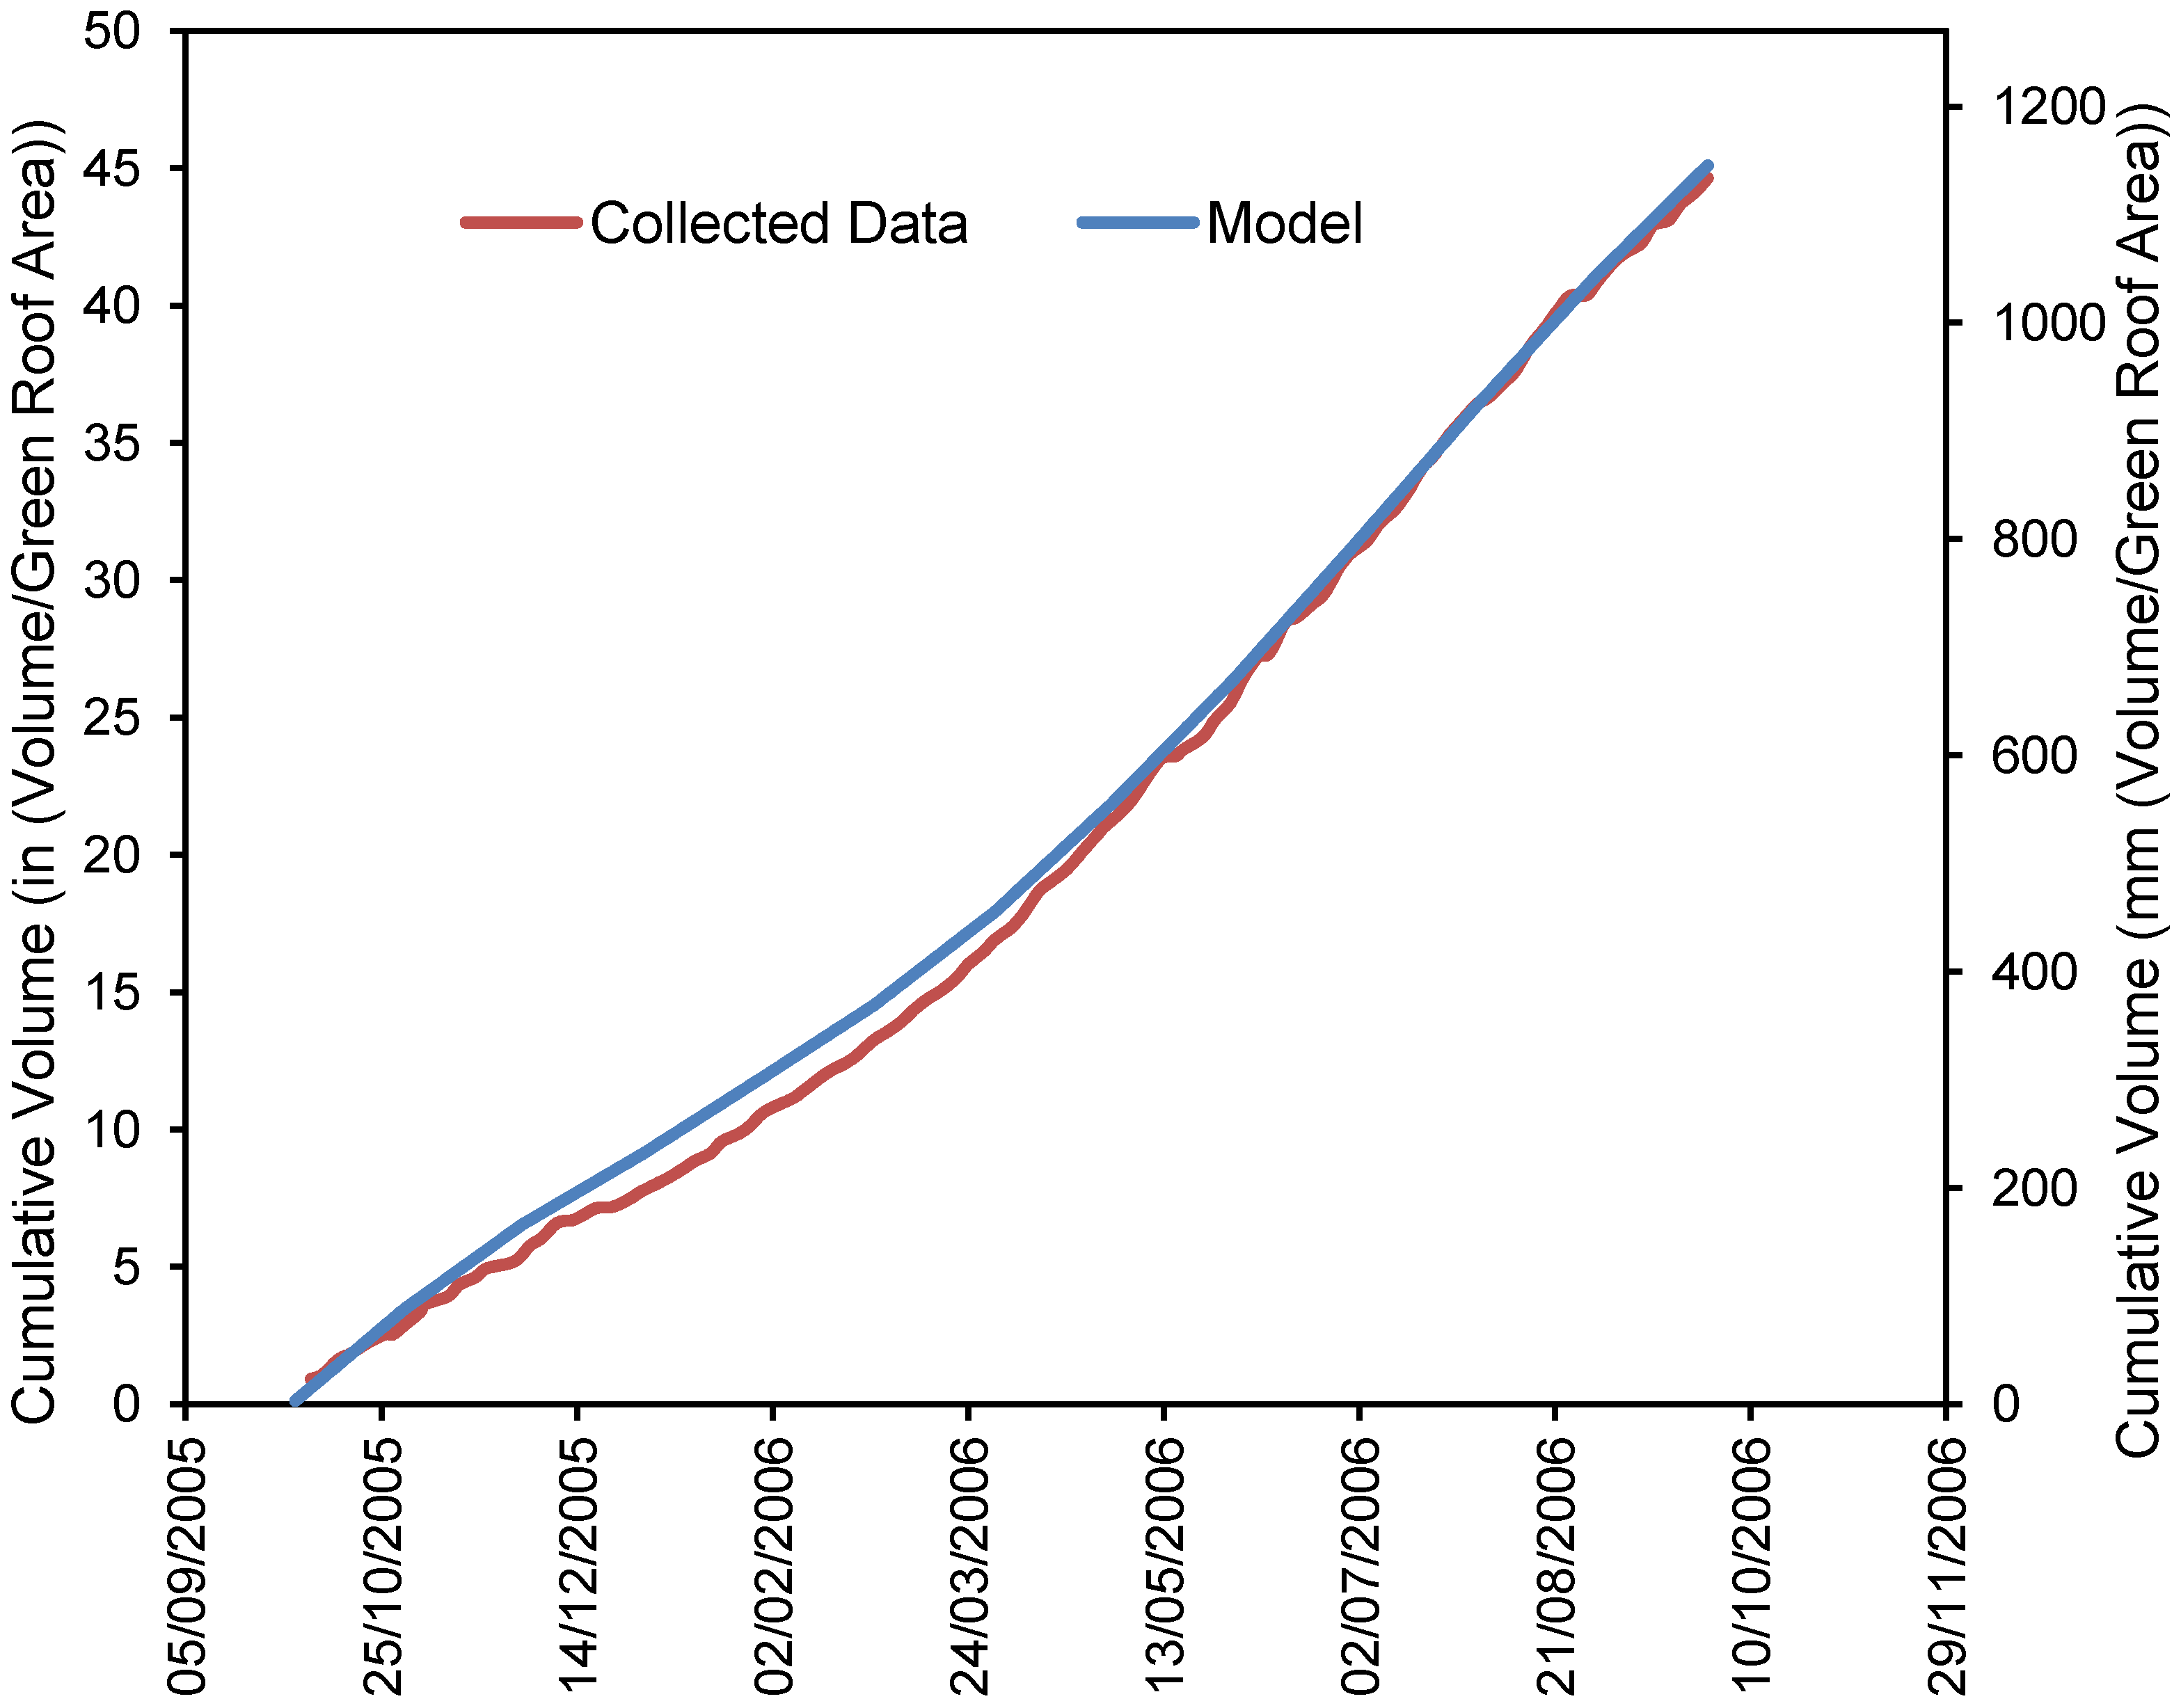
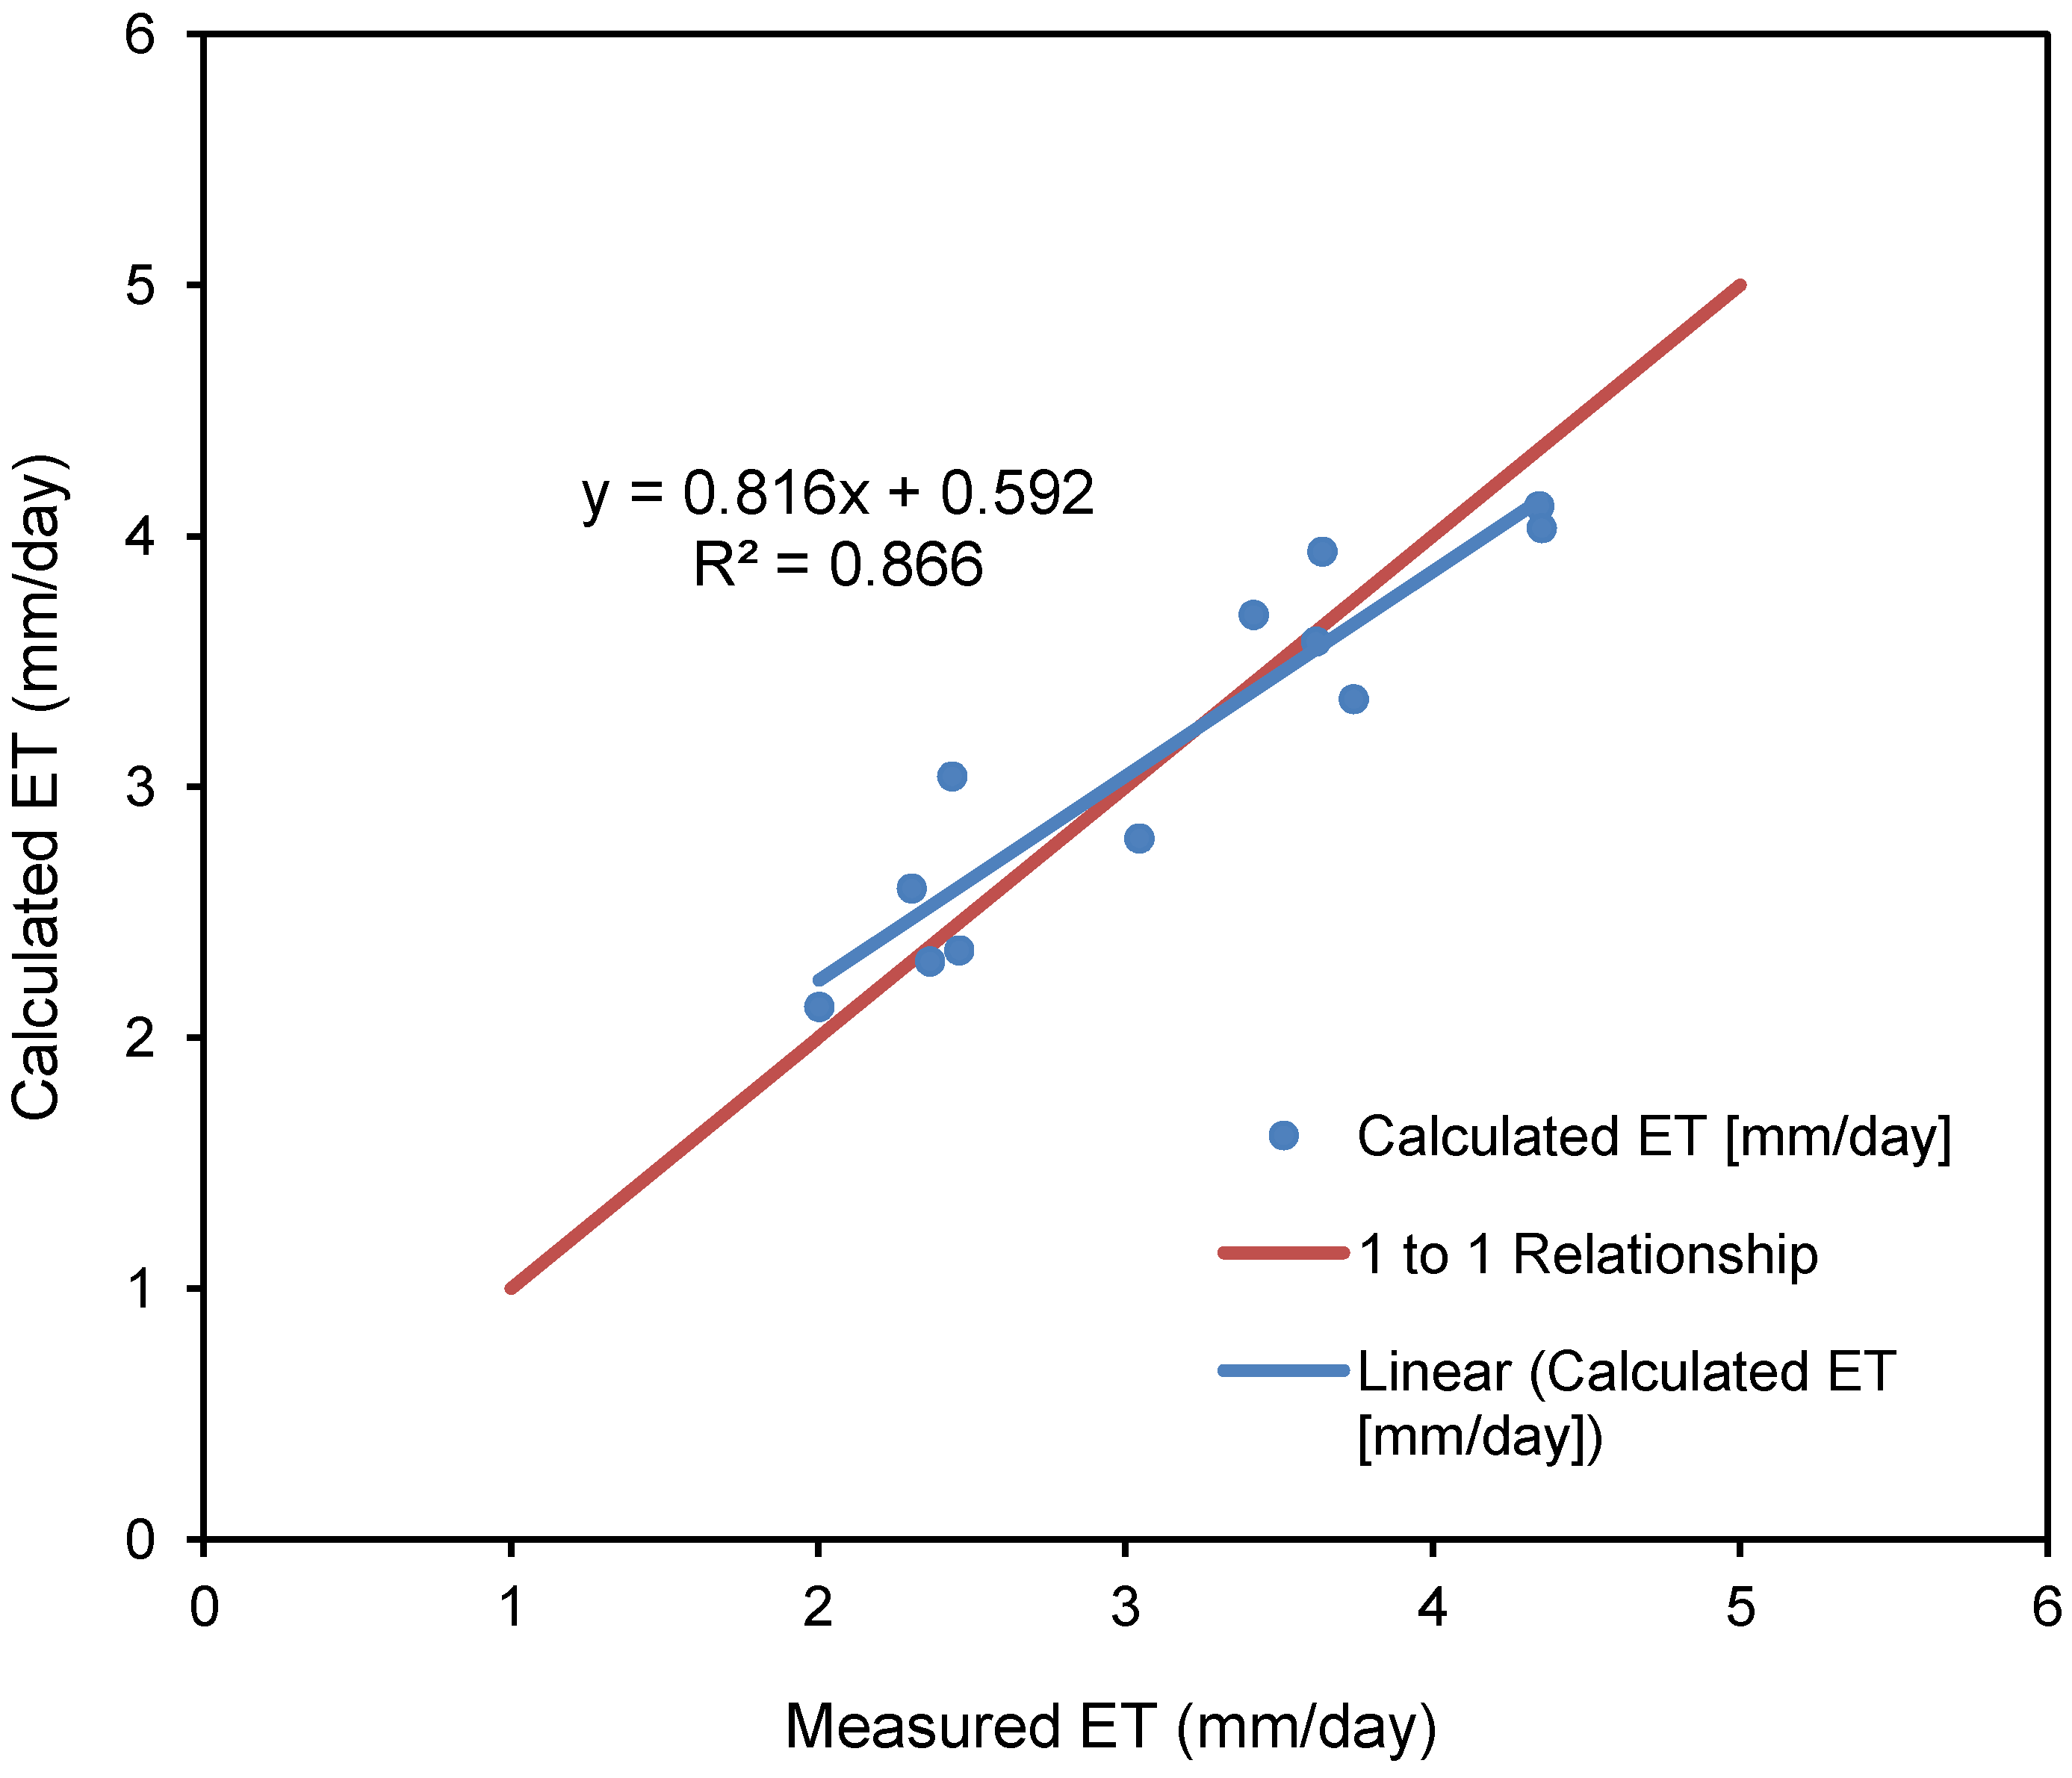
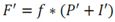
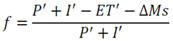
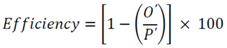
3.1. The Filtrate Factor and ET

Average monthly ET rates as well as average monthly filtrate factors for an irrigated green roof in central Florida were estimated from actual measurements for the green roof schematic shown in Figure 1. The variables in Figure 1 are defined as follows: I is the volume of irrigation applied to the roof during the time step, P is the volume of precipitation that fell on the roof during the time step, ET is the volume of evapotranspiration that left the roof during the time step, Ms is the media water storage, and F is the volume of filtrate which drains off the roof during the time step. The prime nomenclature is indicative of volume. The monthly ET rates were calculated using a mass balance approach. The irrigation, precipitation, and filtrate were all measured over the course of the one year study period. The only two parameters that were not directly measured were the ET and the media storage. Over a sufficiently long period of time the change in media storage was insignificant compared to the ET, thus allowing for estimation of the ET volume.
The filtrate factor was calculated as the fraction of water collected per water added from both precipitation and irrigation. The ET rates were calculated daily and then averaged for each month. The inputs into the system are the precipitation and irrigation volumes. The outputs to the system are ET and filtrate volumes. The monthly estimated ET and calculated filtrate factors from the experimental data are shown in Table 1 and Table 2 respectively. These tables show data for duplicate control roof chambers (C1 and C2) and duplicate green roof chambers (EVR1 and EVR2).
The control roof chambers show no significant evaporation and high filtrate factor values as expected since storage is minimal and most of the rainfall promptly drains off the surface (Table 1 and Table 2). From Table 1 and Table 2, it can be shown that for the green roof chambers both the evapotranspiration rates and the filtrate factors change with the season. As would be expected, the evapotranspiration rates increased during the summer months and decreased during the winter months. The filtrate factor did the opposite, decreased during the summer months and increased during the winter months.
Figure 1. Green roof system boundaries [10]. The variables are as follows: MS = Media storage (volume/(unit area of green roof)); P = Precipitation (volume/(unit area of green roof × time)); I = Irrigation (volume/(unit area of green roof × time)); ET = Evapotranspiration (volume/(unit area of green roof × time)); F = Filtrate (volume/(unit area of green roof × time)).
Water 04 00914 g001
Table 1. ET monthly average comparisonof the Chambers (mm/day (in./day)) [10].
MonthC1C2EVR1EVR2
July 20050.51 (0.02)^0.00*4.32 (0.17)4.06 (0.16)
August 20050.00*0.51 (0.02)^3.56 (0.14)3.56 (0.14)
September 20050.00*0.00*3.56 (0.14)3.30 (0.13)
October 20050.00*0.25 (0.01)^2.54 (0.10)2.29 (0.09)
November 20050.00*0.00*2.29 (0.09)2.29 (0.09)
December 20050.00*0.00*2.03 (0.08)2.03 (0.08)
Jananuary 20060.00*0.25 (0.01)^2.29 (0.09)2.54 (0.10)
Feberary 20060.00*0.00*2.54 (0.10)2.54 (0.10)
March 20060.00*+0.00*+3.05 (0.12)3.05 (0.12)
April 20060.00*0.00*3.81 (0.15)3.56 (0.14)
May 20060.00*0.51 (0.02)^3.30 (0.13)3.30 (0.13)
June 20060.00*0.76 (0.03)^4.32 (0.17)4.32 (0.17)
* Values are sufficiently close to zero; + No precipitation occurred during month; ^ Depression storage can account for evaporation.
Table 2. Filtrate factor monthly average comparison of the Chambers [10].
MonthC1C2EVR1EVR2
July 20050.960.910.520.56
August 20050.940.880.390.40
September 20050.981.000.520.55
October 20050.970.940.550.59
November 20050.940.780.400.38
December 20050.980.820.580.57
Jananuary 20060.860.710.450.42
Feberary 20060.980.870.450.44
March 2006NA+NA+0.190.17
April 20060.970.830.140.16
May 20060.990.810.270.30
June 20060.990.840.440.47
+ No precipitation occurred during month.
The authors acknowledge that ET data may not be readily available for all areas potentially limiting the usefulness of a model developed for design purposes and therefore propose to use the Blaney and Criddle equation to calculate the ET. Values for ET were calculated using the Blaney and Criddle equation and compared to experimentally determined values from Hardin [10] (Figure 2). An analysis of variance was performed and no significant difference was detected at a significance level of 99%. The Blaney and Criddle equation calculates monthly ET based on a consumptive use coefficient, percent of daytime hours per year in the study month, and mean monthly temperature in F. The authors acknowledge that this equation best estimates the potential ET but since irrigation is being regularly performed the soil moisture will remain close to field capacity making this an appropriate estimation. The consumptive use coefficient used was from Table 4.5 in Wanielista et al. [11] for pasture or grass giving a range of values from 0.6–0.75. Based on the best fit to the experimental data presented by Hardin [10] a value of 0.63 was selected for the consumptive use coefficient (Figure 2). The percent of daytime hours per year in the study month was determined from Table 4.6 in Wanielista et al. [11] for each month examined by Hardin [10]. The mean monthly temperature was gathered from historical data for the time period of July 2005 to June 2006 [23]. From Figure 2 it can be seen that the Blaney and Criddle equation is an acceptable approximation of ET data for irrigated green roofs.
Figure 2. ET Comparison of Blaney and Criddle Calculated vs. Experimentally Determined from Hardin [10].
Water 04 00914 g002
To further analyze the Blaney and Criddle equation to effectively model actual values it was used with the model and compared with actual data collected from experimental chambers and actual data collected from a full sized operating green roof on the student union building (SU) at the University of Central Florida (Figure 3 and Figure 4, respectively). The cumulative ET verses time for the Blaney and Criddle equation and data collected from experimental chambers as well as data collected from a full sized operating green roof, respectively show a good fit. These figures further support the use of the Blaney and Criddle equation for estimation of ET for the purposes of the model presented.
Figure 3. Comparison of cumulative ET volume for the Blaney and Criddle equation and actual data collected from experimental chambers [10].
Water 04 00914 g003
Figure 4. Comparison of cumulative ET determined from the Blaney and Criddle equation and actual data collected from a full sized operating green roof [24].
Water 04 00914 g004

3.2. Continuous Stormwater Treatment Outflow Reduction Model (CSTORM) Development
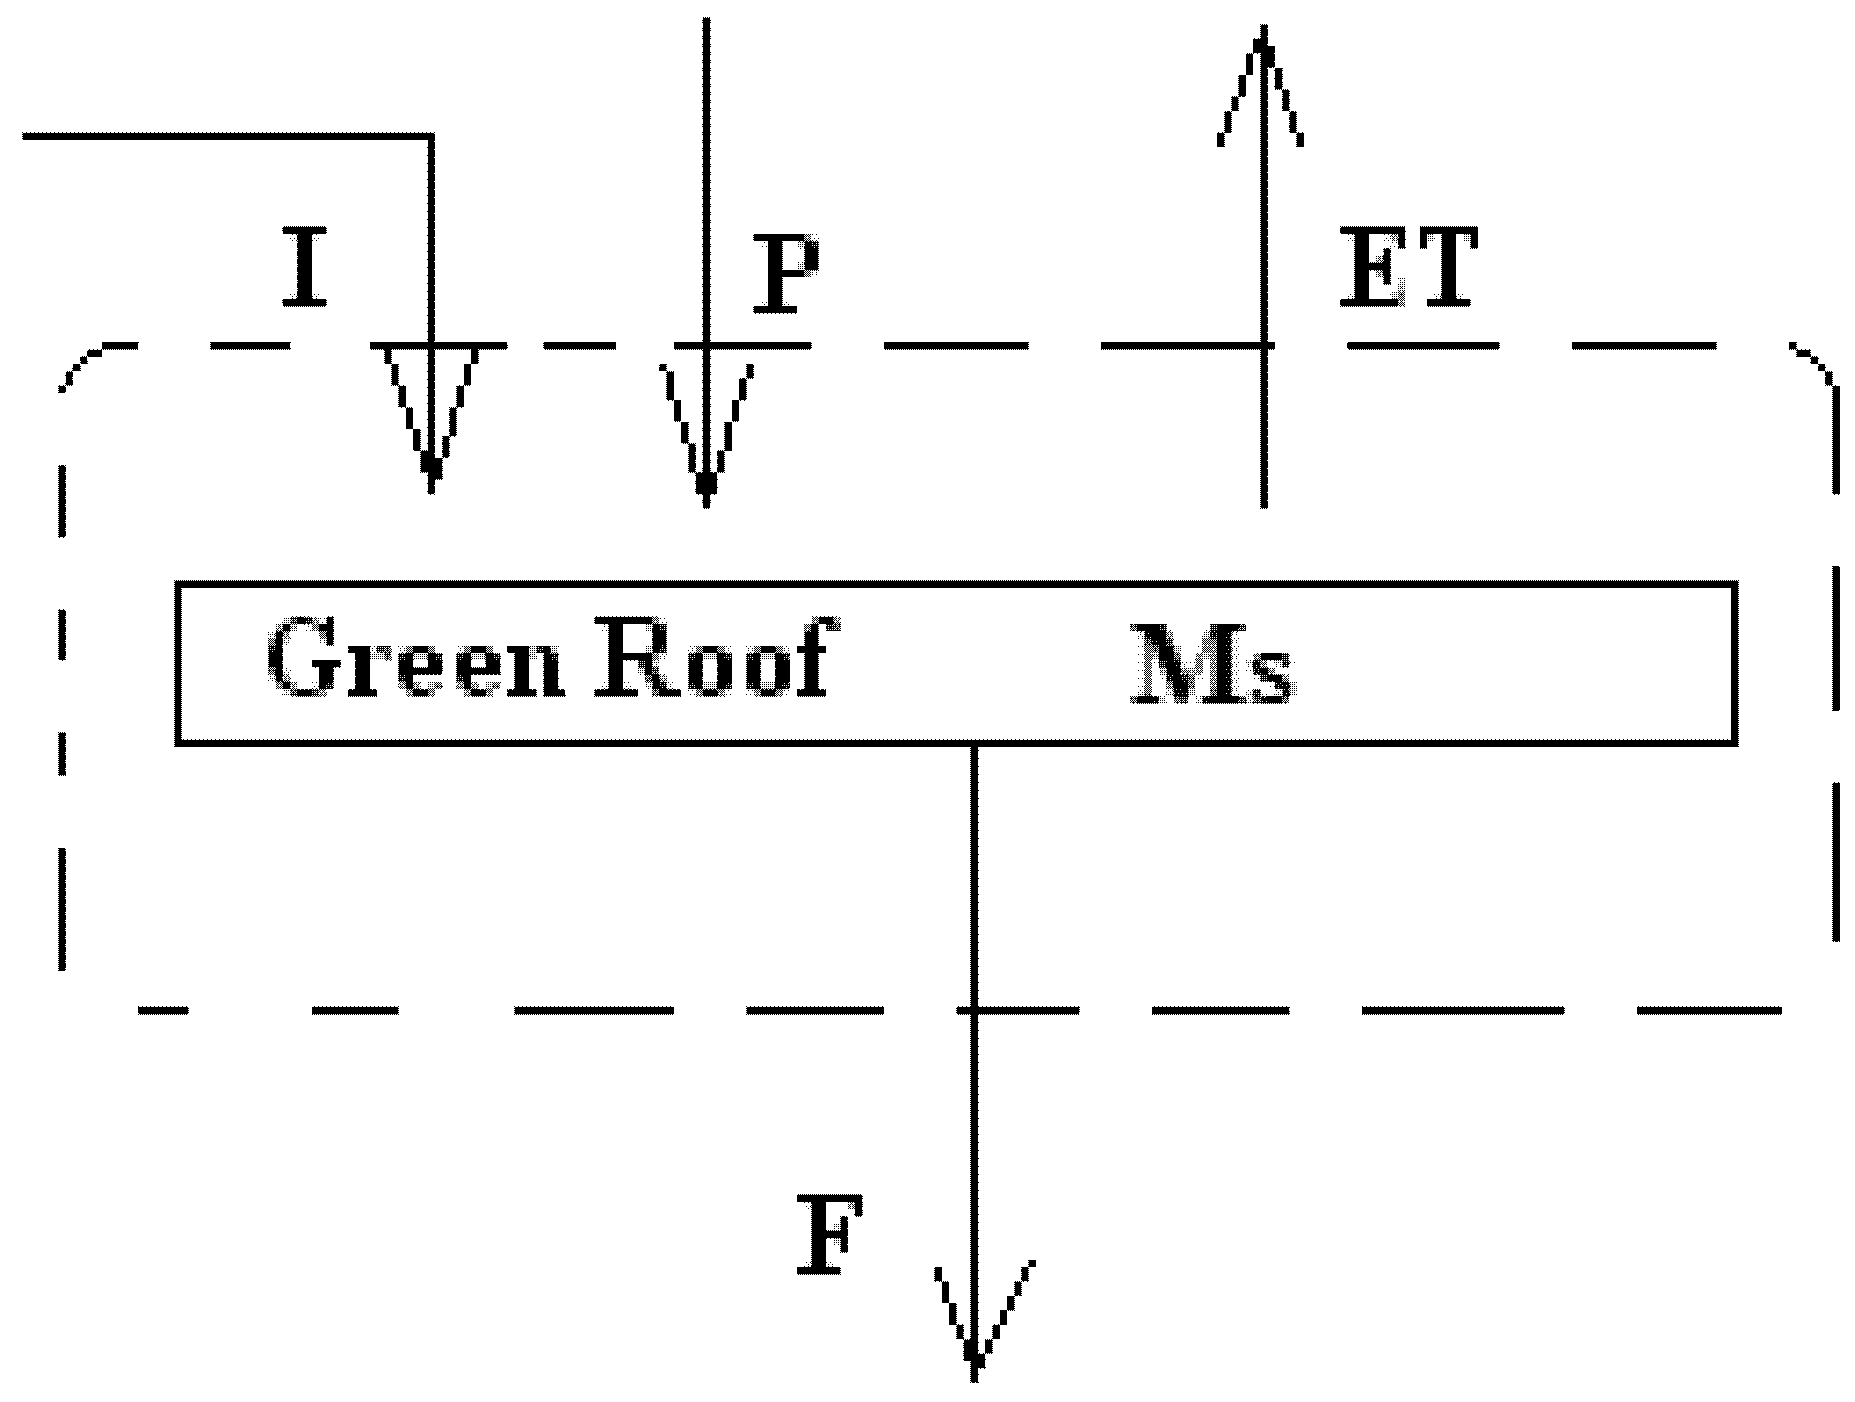
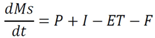
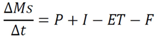
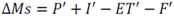
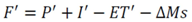
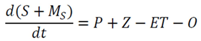
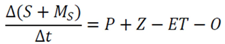
3.2.1. Mass Balance

Similar to the design of a reuse pond, a mass balance approach can be used for the design of a green roof stormwater treatment system. To design a green roof stormwater treatment system, the inputs and outputs for a mass balance must be preserved (see Figure 5). The main system inputs and outputs are precipitation, evapotranspiration, makeup water, and overflow.
The main factors that influence the cistern water level are the filtrate from the green roof, the irrigation rate, the rate at which makeup water is added, and the overflow rate. The overflow rate will be a function of the maximum cistern storage volume and the rate at which makeup water is added will be a function of available storage water and irrigation rate. Jones and Hunt [19] evaluated rainwater harvesting systems with a model and showed that these systems can be effective in providing reuse waters and reducing runoff. They point out, however that there is a tradeoff between reducing the cistern volume and runoff reduction [19]. The irrigation rate is not to exceed 25.4 mm (1 in.) per week in the summer months and half that for the winter months for the purposes of demonstrating the use of the model. It should be noted that irrigation will not occur if, in the twenty four hours previous to the irrigation event, the precipitation volume is greater than or equal to the irrigation volume. From this it can be seen that filtrate from the green roof is the only variable that is not known.
Figure 5. Green roof stormwater treatment system boundaries [10]. The variables are as follows: MS = Media storage (volume/unit area of green roof); P = Precipitation (volume/(unit area of green roof × time)); I = Irrigation (volume/(unit area of green roof × time)); ET = Evapotranspiration (volume/(unit area of green roof × time)); F = Filtrate (volume/(unit area of green roof × time)); S = Cistern storage (volume/(unit area of green roof); Z = Makeup Water (volume/(unit area of green roof × time)); O = Overflow (volume/(unit area of green roof × time)).
Water 04 00914 g005
Isolating the green roof stormwater treatment system into mass balances as shown in Figure 3 is necessary in order to determine the filtrate, or the filtrate factor. Using the system boundaries for system one in Figure 5, an expression for the filtrate factor as it varies with soil conditions, precipitation, evapotranspiration, and irrigation amount can be derived.
Water 04 00914 i001
Making the assumption of a finite difference the following simplification can be made:
Water 04 00914 i002
This equation is in terms of volume per unit time and needs to be multiplied through by the time step to get volume. This equation then simplifies as follows:
Water 04 00914 i003
where the prime nomenclature is indicative of volume. It should be noted that Ms represents the depth of water that the growth media can hold per unit area, and is determined by multiplying the porosity of the chosen growth media by the depth. This gives the media water storage capacity per unit area. Solving for the filtrate gives:
Water 04 00914 i004
But:
Water 04 00914 i005
where f = Filtrate factor, the fractional volume of precipitation and irrigation which becomes filtrate.
Therefore,
Water 04 00914 i006
It can be seen from Equation (4) that the filtrate will vary depending on the soil conditions and therefore with time. Since green roofs need to be irrigated more frequently when first installed to ensure the health of the plants [25] the assumption that the initial soil storage is equal to the field capacity of the soil is made. The ET′can either be supplied via experimental data or calculated using the Blaney and Criddle equation. The Blaney and Criddle equation is presented below as Equation (5):
Water 04 00914 i007
where ET′ is in inches, k is the consumptive use coefficient, p is the percent of daytime hours per year in the study month, and t is the mean monthly temperature in F [11]. The Blaney and Criddle equation was selected for use in this model due to the fact that it is simple and the variables are easily looked up for a given region. Additionally, this equation adequately predicted the actual measured data. All other variables needed to solve this equation are known with the exception of the final soil storage and the filtrate factor.
To solve for the filtrate factor several more assumptions must be made. First, precipitation and irrigation contribute to the soil storage up until the point of field capacity. For this equation, assume that media field capacity is at a volume of 20% of the growing media depth. Also, assume that any precipitation and irrigation past the point of field capacity will contribute to runoff, or the filtrate equals input for any additional water past the field capacity of the soil. Therefore, for field capacity conditions the equation that describes the final soil storage term, MS2, is as follows:
Water 04 00914 i008
That is, whenever runoff occurs, Equation (6) is used to determine the soil storage at the end of the time step. If runoff does not occur, or the soil does not get to the field capacity, then the soil storage at the end of the time step can be found from the following equation:
Water 04 00914 i009
Using these assumptions every variable in Equation (4) is known except for the filtrate factor. From this information f can be solved for any location provided daily precipitation data are available.
Now that the filtrate has been quantified an equation needs to be developed that describes how the cistern behaves. An equation for the change in soil storage between times 1 and 2 needs to be developed using the first system boundaries from Figure 3.
This gives the following equation:
Water 04 00914 i010
Next, using the second system boundaries in Figure 5, an equation is developed to describe the overall system. The equation for this system is as follows:
Water 04 00914 i011
Assuming a finite time step and converting to volume terms gives:
Water 04 00914 i012
This equation further simplifies to:
Water 04 00914 i013
Rearranging gives:
Water 04 00914 i014
Finally, a mass balance equation needs to be developed for the cistern. This can be done by combining Equations (8,9) to give:
Water 04 00914 i015
S1 and S2 refer to the cistern storage volume at the initial time and after the time step, respectively. Therefore, this equation describes how the water level in the cistern fluctuates over time.
Using the equations previously developed, Equations (4–7,10), a green roof model is formulated. The model developed is called the continuous stormwater treatment outflow reduction model, or CSTORM. The equation developed to solve for the filtrate factor, Equation (4), needs to be solved simultaneously with Equation (10) using the entire record of daily precipitation data and monthly average evapotranspiration data, either from historical data or using the Blaney and Criddle equation, for a one day time step. The purpose of using the entire precipitation record is to reduce the introduction of error into the model due to the variability of yearly precipitation for any given area. The equations that describe the soil storage potential, Equations (6,7), are to be used as stipulations that depend on the current conditions of the system.
Operating assumptions for the cistern need to be made, the first is that the initial storage volume of the cistern is equal to the irrigation volume. This is done so as to provide sufficient water to perform the initial irrigation. If the cistern storage is less than the irrigation volume, and irrigation is to occur, then makeup water is added. The amount of makeup water added is equal to the difference of the irrigation volume and the current cistern storage volume. In addition, if the volume of filtrate plus the initial volume of the cistern is greater than the maximum storage capacity of the cistern, then overflow occurs. The volume of overflow is equal to the difference between the beginning period cistern volume plus the filtrate in that period and the maximum cistern storage capacity.
With the CSTORM model, a green roof and cistern system can be designed to achieve desired stormwater retention efficiency. The efficiency, expressed as a percentage, is defined as the volume of stormwater retained within the system and released as ET divided by the volume of precipitation. The fraction of stormwater retained relative to the total precipitation can also be expressed as one minus the fraction of stormwater released as overflow relative to the total precipitation.
Water 04 00914 i016
Using the above equations the CSTORM model was developed. This model can produce design curves which can be used for quantification of the average year stormwater efficiency. It should be noted that the model will give a cistern storage requirement in terms of depth stored per unit area of green roof. To get the volume or size of cistern required for an individual project, the area of green roof needs to be multiplied by this term along with the appropriate unit conversions.
To examine how the model predicts the filtrate volume from the green roof experimental data from Hardin [10] and Hardin and Wanielista [24] are compared to a short term model run for the precipitation and irrigation that occurred. The cumulative filtrate volume vs. time is shown below in Figure 6 and Figure 7 for the model compared to the data from Hardin and for the model compared to the data from Hardin and Wanielista. These Figures show good agreement for the modeled data and the experimental data.
Figure 6. Cumulative filtrate volume vs. time for modeled data and experimental chambers data from Hardin [10].
Water 04 00914 g006
Figure 7. Cumulative filtrate volume vs. time for modeled data and a full sized green roof data from Hardin and Wanielista [24].
Water 04 00914 g007

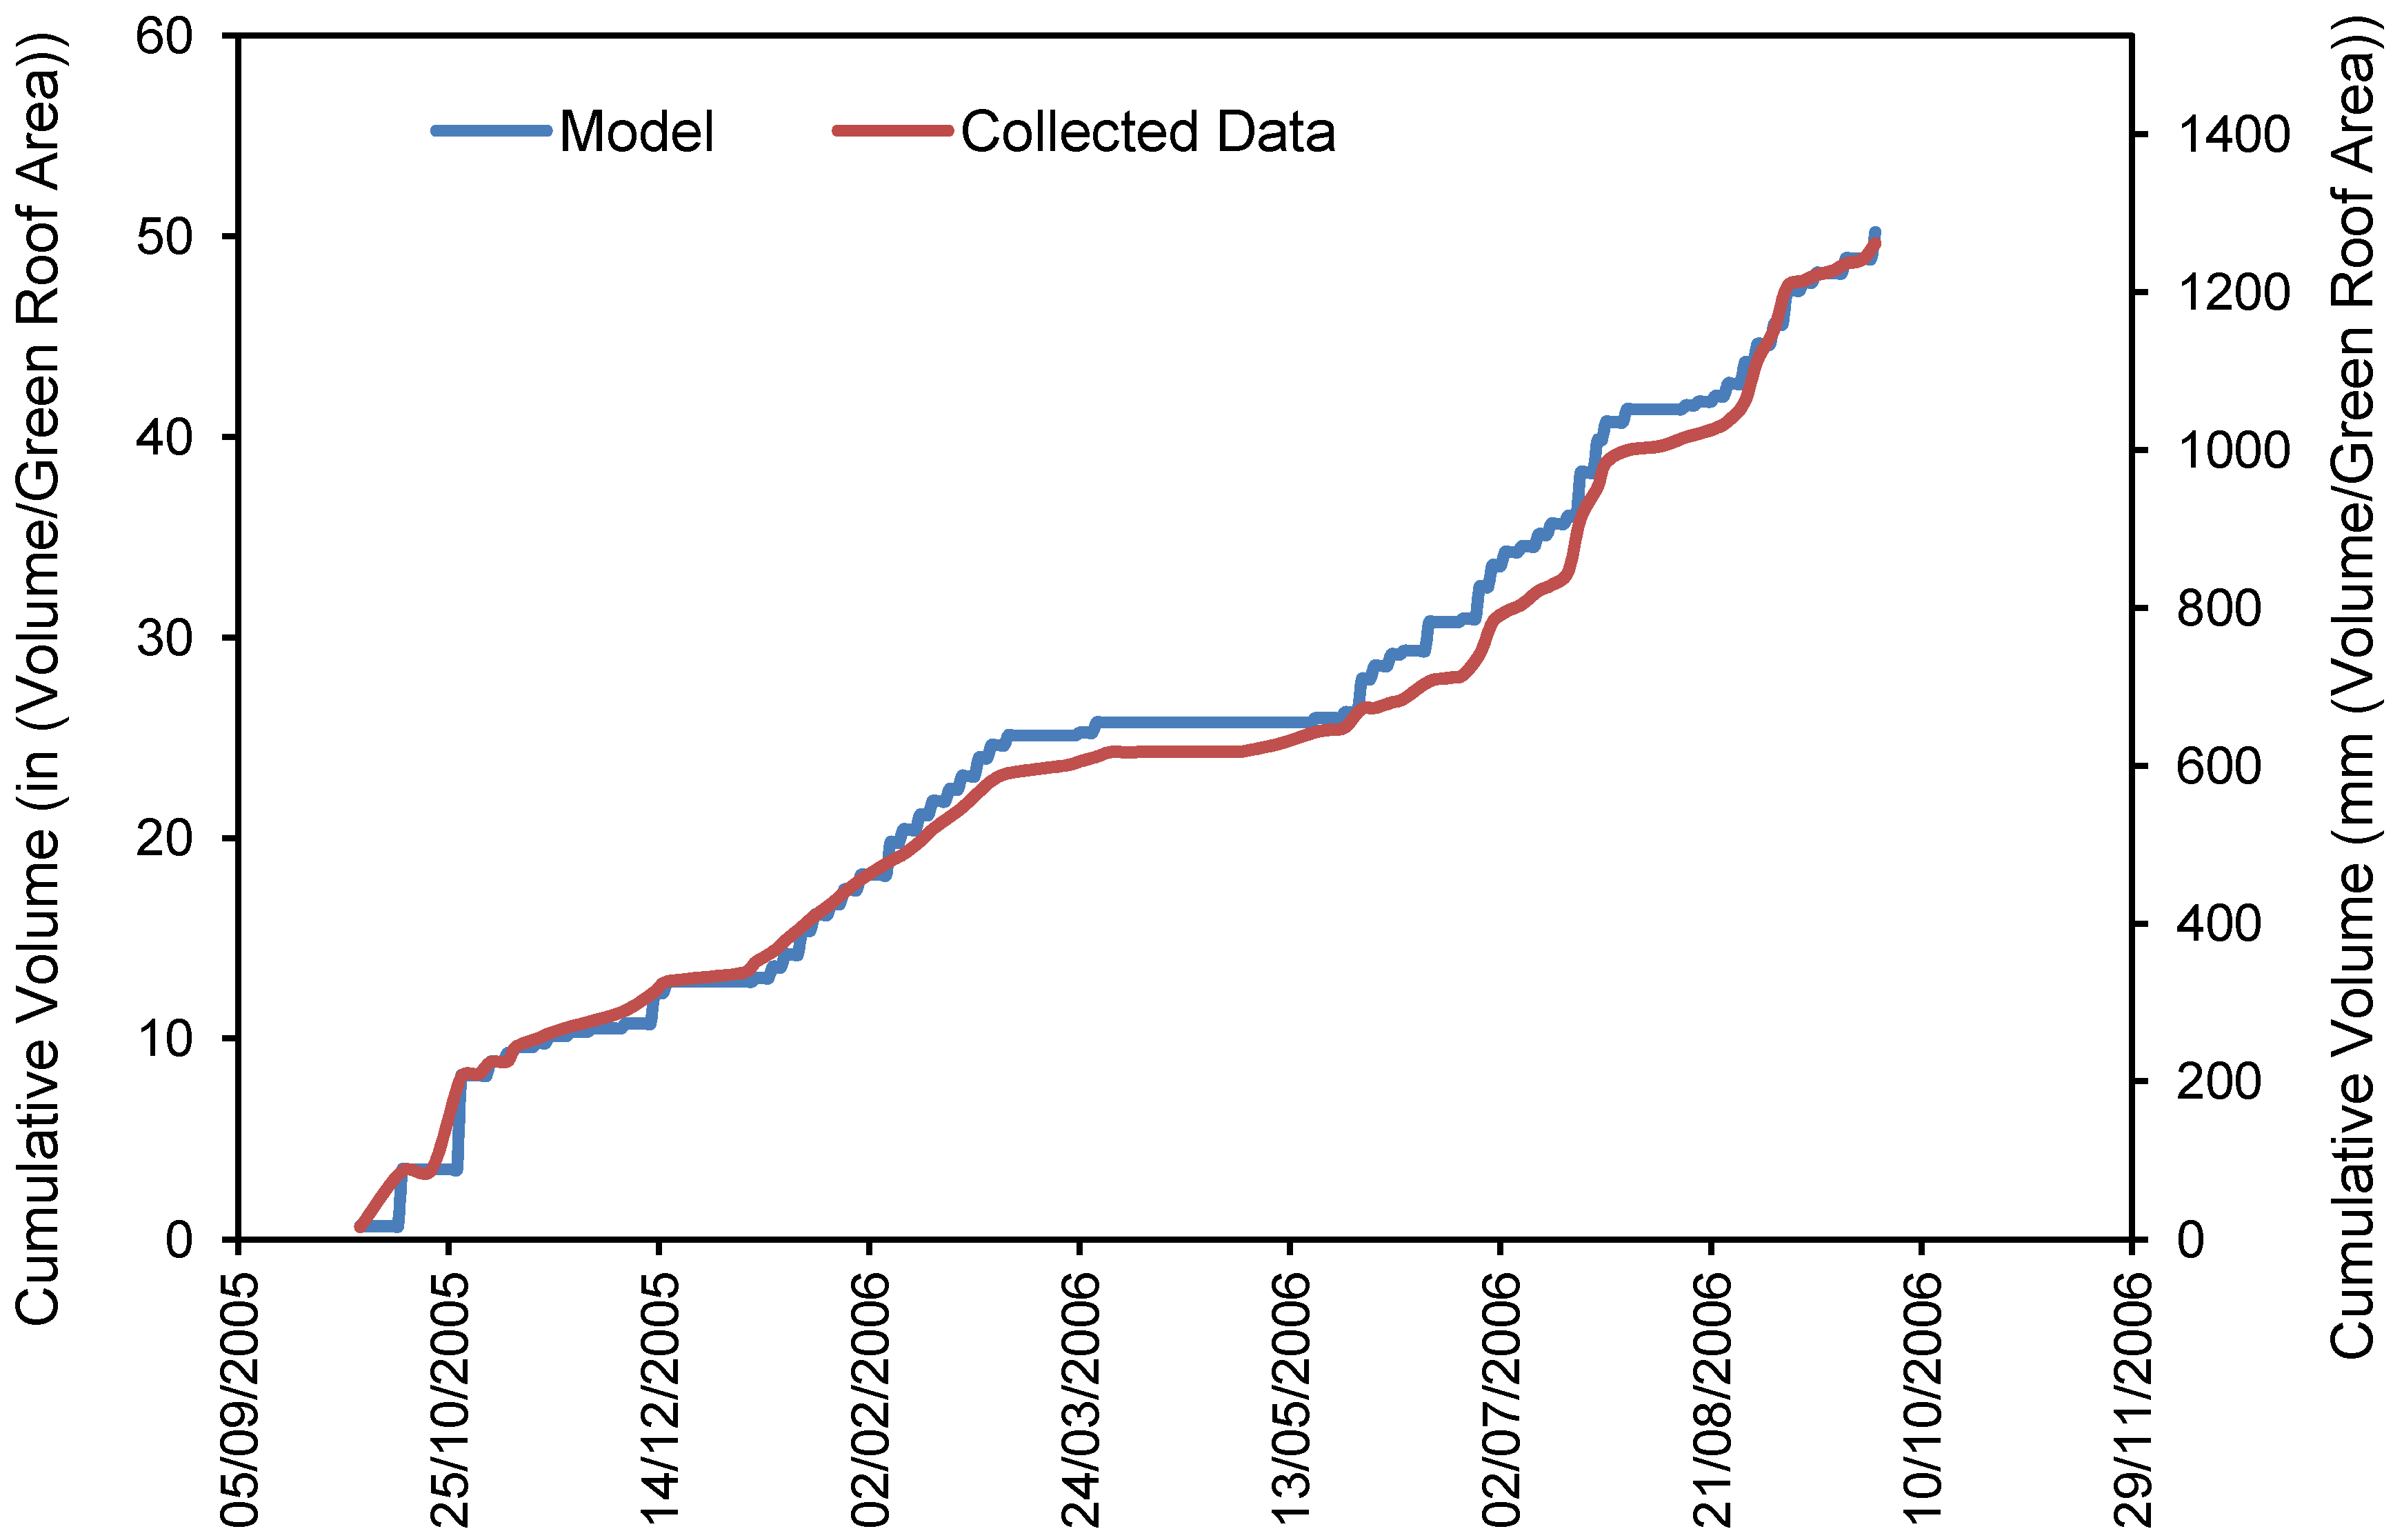
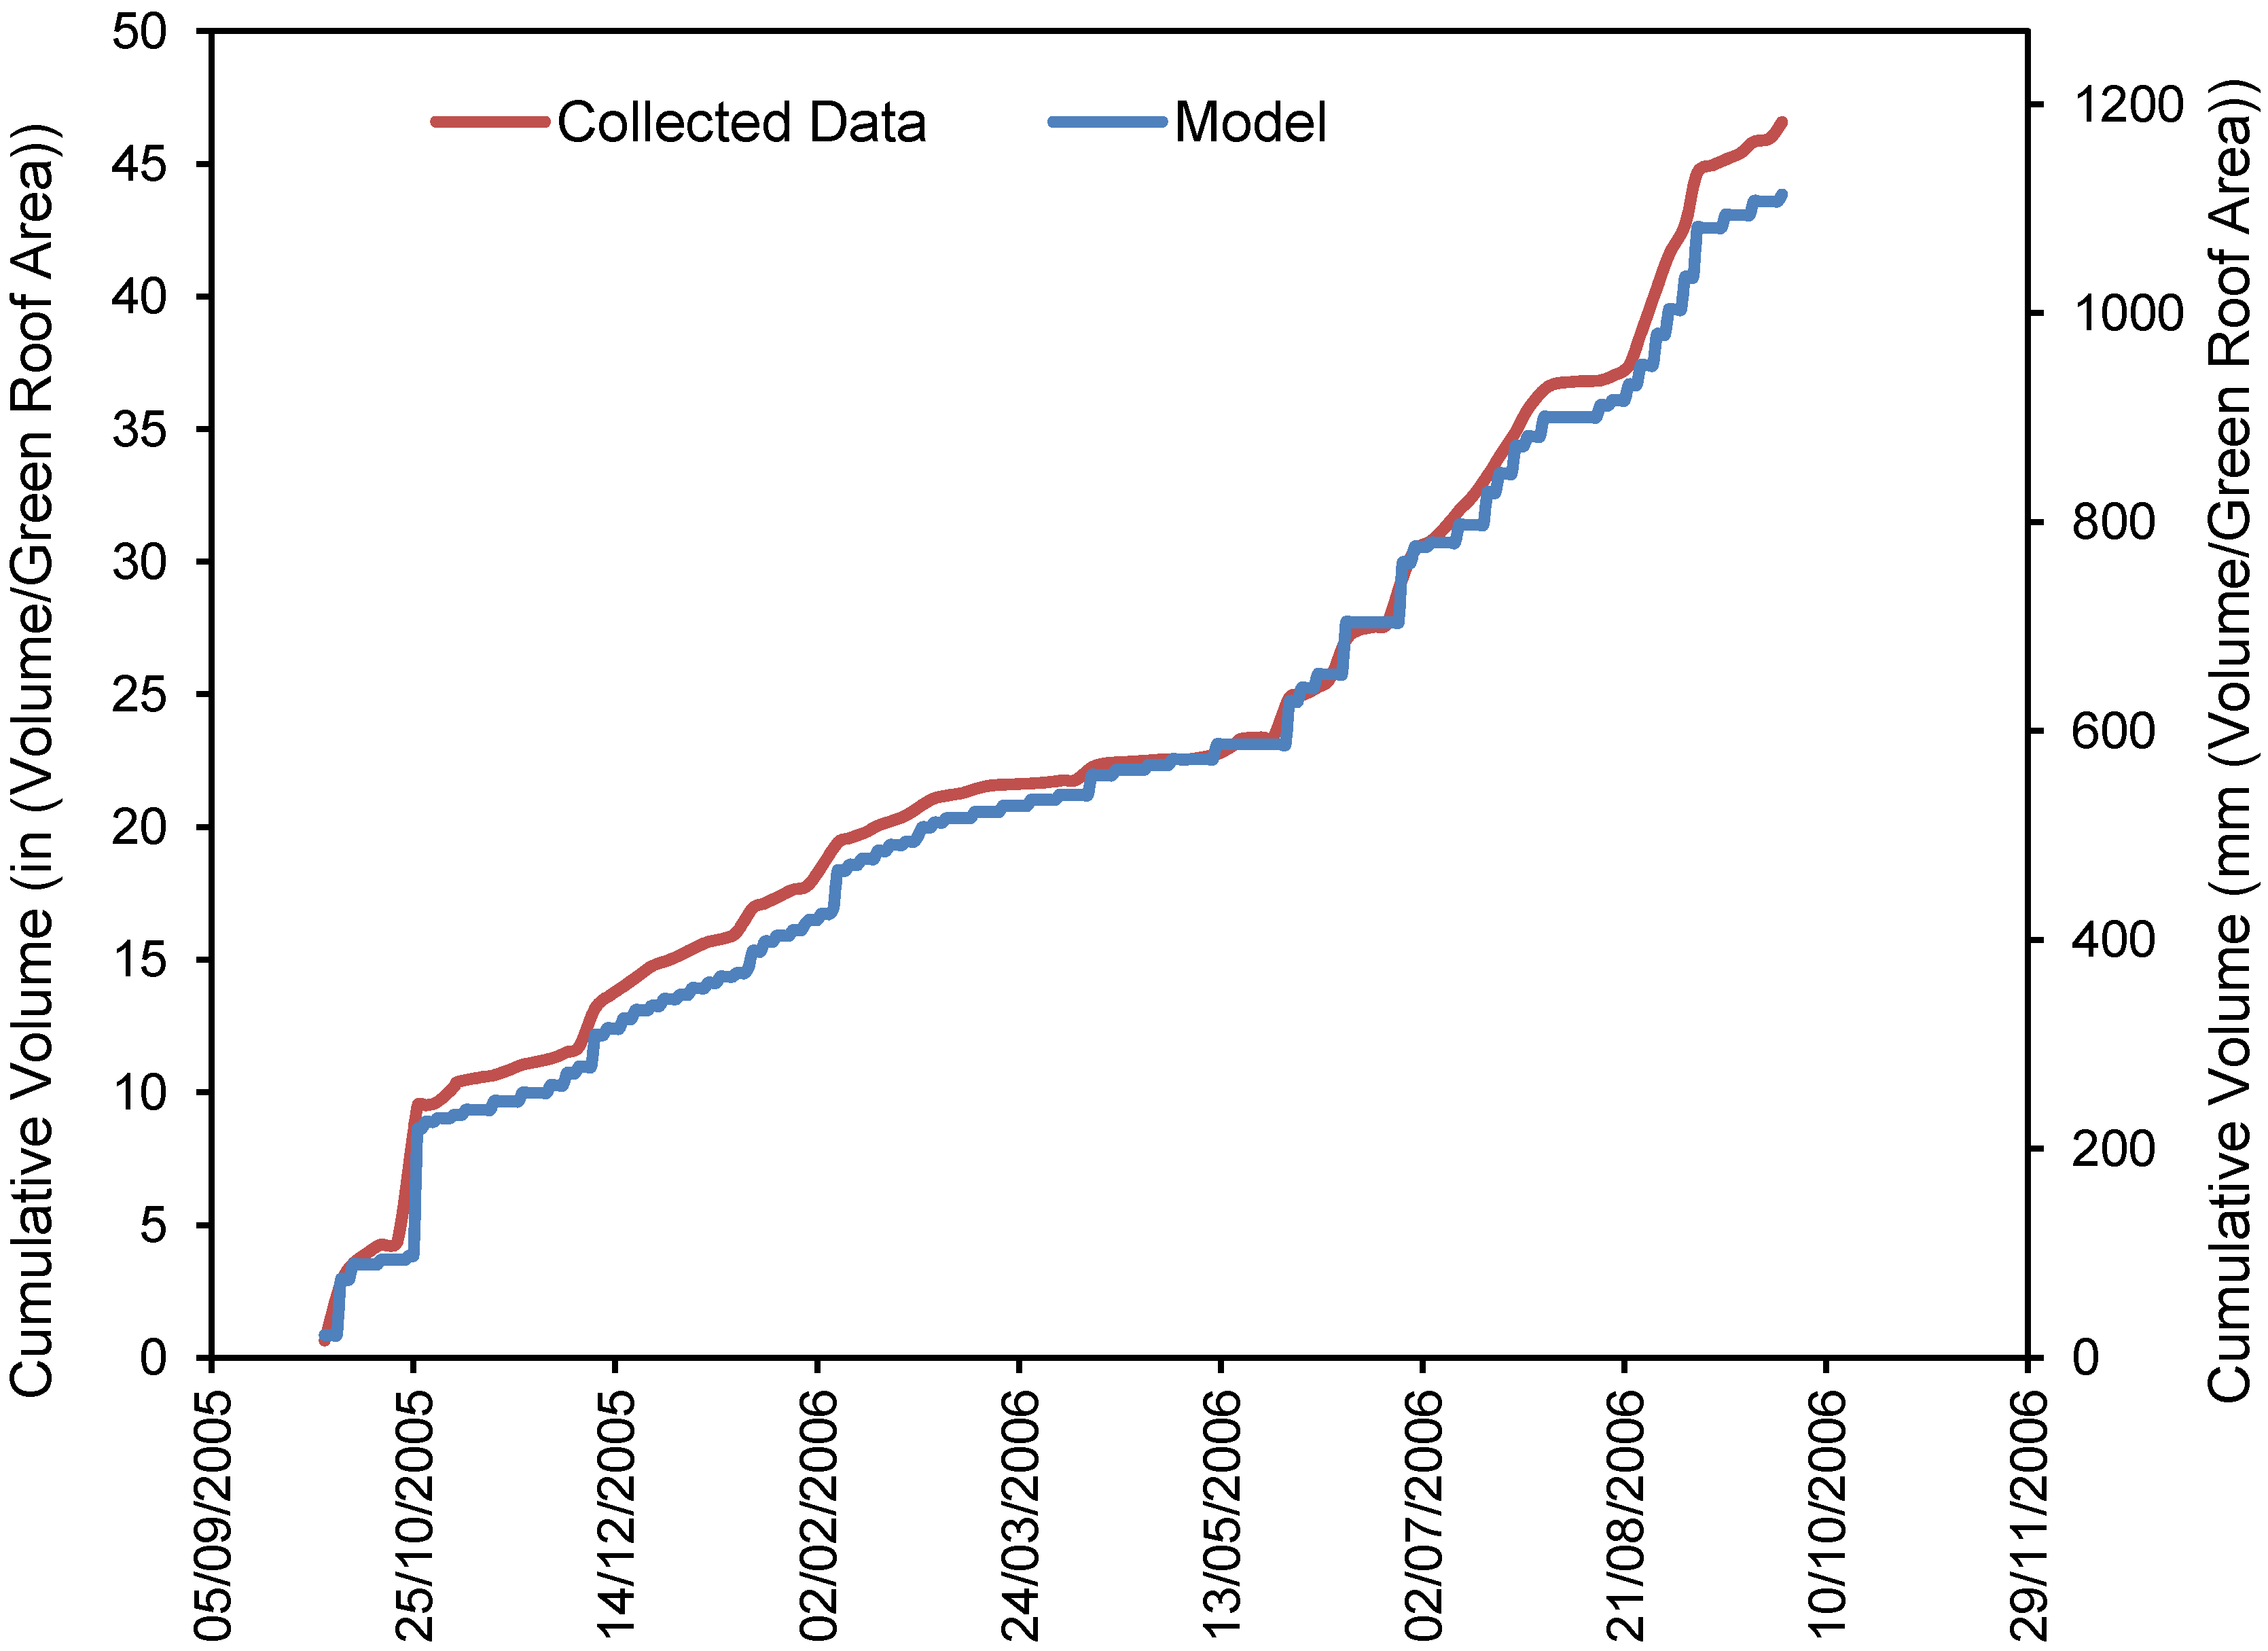
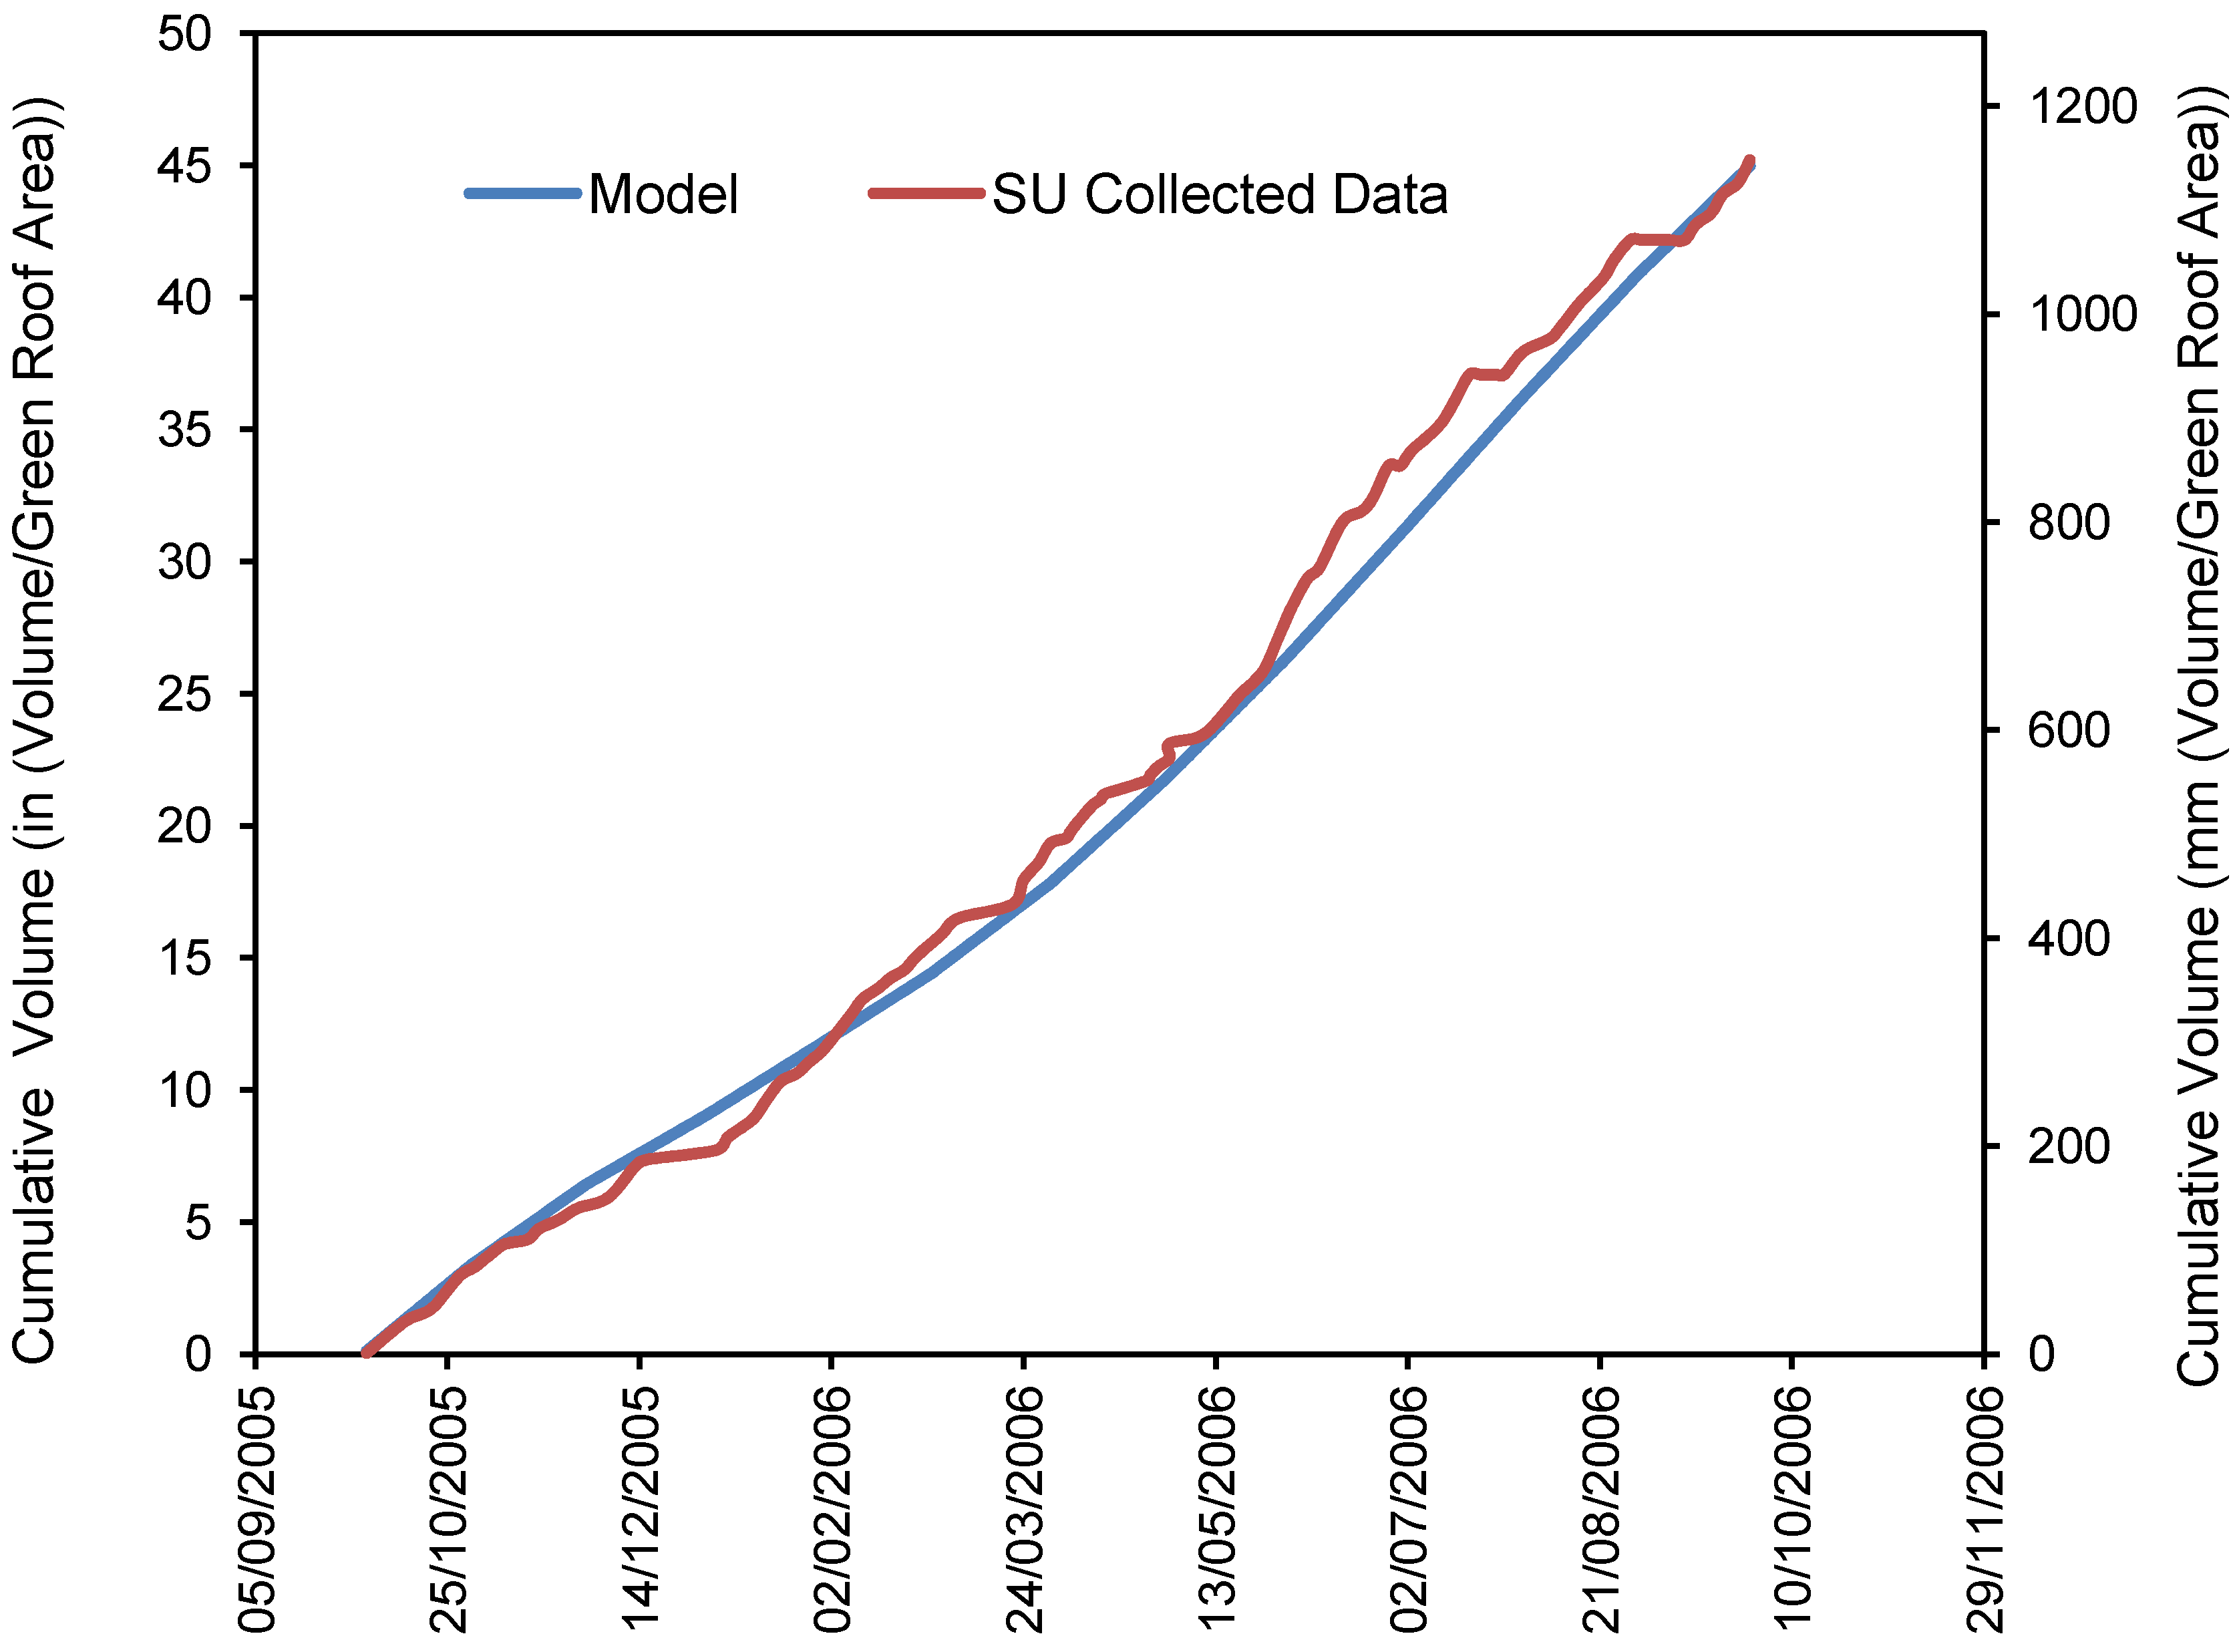
3.2.2. CSTORM Model Output

The CSTORM model is a valuable design tool for the consulting and design industry. This model has the ability to design a green roof stormwater storage system for a desired efficiency, incorporate additional irrigation areas, and include additional impervious area runoff. The model predicts the expected yearly retention and gives an estimate to the yearly makeup water requirements.
Design curves developed using the above equations can be produced for effective cistern sizing given a desired retention. Presented in Table 3 is a summary of efficiencies for different cistern storage volumes and locations. From Table 3 it can be determined that the main factors that affect the efficiency of the system are precipitation, evapotranspiration, and cistern storage volume. Lower precipitation and higher evapotranspiration produces a higher efficiency green roof stormwater treatment system, while the converse yields a lower efficiency for the system. Also from Table 3, it is noted that for an irrigated green roof the roof runoff without a cistern can be reduced by about 25%–43% depending on location. If the no cistern option is used, there are more pollutants (nutrients) from the green roof than from the control roof and an additional stormwater management technique will need to be used to help meet TMDL standards [5,6,10]. Another way to increase the efficiency of the system is to irrigate additional areas, such as ground level landscaping.
The results of the CSTORM model shown in Table 3 show that an expected efficiency of 87% can be achieved for the Orlando Florida area when storing 127 mm (5 in.) over the green roof area. Hardin [10] showed from experimental data that the actual efficiency is about 83%. These results show that the CSTORM model can be used to accurately predict, plus or minus 4%, the green roof system performance for the average year. In addition, rainfall depth and overflow volume from a cistern were collected over a two year period of time on a 1600 square foot green roof using a 1400 gallon cistern and the removal effectiveness was 77% [24]. The rainfall was about 80% of the average over a two year period of time, and thus it is expected that the removal will be greater than the annual average as predicted by the model (71%).
Table 3. Summary of yearly retentions for different cistern storage volumes and locations [10].
LocationCistern Storage Volume (mm (inch) over GR area)
025.4 (1)50.8 (2)76.2 (3)101.6 (4)127 (5)
Austin, TX25%65%77%83%87%90%
Miami, FL42%63%69%73%76%78%
Orlando, FL43%69%78%82%85%87%
Tallahassee, FL35%58%66%70%72%74%

4. Conclusions

Stormwater management to sustain local water supplies continues to be a growing problem in some areas because of limited space and resources. Green roof stormwater treatment systems are a sustainable solution to this problem of water retention without using more land while offering several other benefits [26,27,28,29]. It is shown in this paper that an irrigated green roof with a cistern is an effective way to reduce the volume of stormwater runoff from rooftops. The results from the water budget data presented here and by Hardin [10], Kelly et al. [5], Wanielista et al. [6,21] show that there is a method to estimate the amount of filtrate from a green roof. Also shown is that ET is not dependent on depth or drainage media type [5,21]. The filtrate factor, however, is dependent on depth but not drainage media type [5,21]. This eliminates drainage media as an important design parameter for the purposes of hydrologic efficiency while showing the importance of growth media depth.
From the results of the CSTORM model and the water budget data from Hardin [10], Kelly et al. [5], and Wanielista et al. [6,21,30], it can be seen that green roof stormwater treatment systems can effectively reduce the volume of runoff by as much as 87% for the Orlando, Florida region. This efficiency is based on a cistern that stores a volume of 127 mm (5 in.) over the green roof area. It should be noted that an irrigated green roof without a cistern will achieve an annual retention of about 43% for the Orlando region. Examination of Table 3 shows that the expected efficiency is dependent on the geographic region. This is due to local climate conditions. To address changes in evapotranspiration, the authors included the Blaney and Criddle equation to estimate the evapotranspiration for a given region, which was shown to be a good approximation based on the experimental data presented within this paper.

5. Recommendations for Future Work

While green roofs have been used for more than 30 years they have only just recently been seen as a way of retaining water near the rainfall area. Throughout the course of this work the authors have noted the following areas needing further work. The use of different vegetation and the resulting effects on evapotranspiration rates, i.e., does the Blaney and Criddle equation still hold up with a different vegetative cover. Additionally, more work needs to be done to quantify the increase in waterproof membrane life when using a green roof.

Acknowledgments

The authors would like to acknowledge the support of all the students who worked on this project, in particular that of Erik Stuart and Ken Horner. In addition, the authors appreciate the technical and financial support from the Florida Department of Environmental Protection, in particular Eric Livingston.

References

  1. Hoffman, L. The Earth Pledge Green Roof Stormwater Modeling System. In Proceedings of Greening Rooftops for Sustainable Communities Conference; Boston, MA, USA: 11–12 May 2006.
  2. Good, J.C. Roof stormwater runoff as a diffuse source of metals and aquatic toxicity in storm water. Water Sci. Technol. 1993, 28, 317–322. [Google Scholar]
  3. Vaze, J.; Chiew, F.H.S. Nutrient loads associated with different sediment sizes in urban stormwater and surface pollutants. J. Environ. Eng. 2004, 130, 391–396. [Google Scholar] [CrossRef]
  4. Chopra, M.; Wanielista, M.; Kakuturu, S.; Hardin, M.; Stuart, E. Evaluation of Pollution Levels due to the Use of Consumer Fertilizers under Florida Conditions; Florida Department of Transportation: Tallahassee, FL, USA, 2010. [Google Scholar]
  5. Kelly, M.; Hardin, M.; Wanielista, M. A Stormwater Management Evaluation of the 2007 New American Home Stormwater Treatment System and the Stormwater Academy Green Roof; Florida Department of Environmental Protection: Tallahassee, FL, USA, 2007. [Google Scholar]
  6. Wanielista, M.; Hardin, M. A Comparative Analysis of Greenroof Depth as It Affects Retention of Rainfall; Florida Department of Environmental Protection: Tallahassee, FL, USA, 2011. [Google Scholar]
  7. Hunt, B.; Moran, A. Bioretention and Green Roof Field Research in North Carolina. In Proceedings of 1st Annual Stormwater Management Research Symposium, Orlando, FL, USA, 12–13 October 2004; pp. 89–102.
  8. Ellis, J.B. Infiltration systems: A sustainable source-control option for urban stormwater quality management? Water Environ. Manag. 2000, 14, 27–34. [Google Scholar] [CrossRef]
  9. Davis, A.P.; Shokouhian, M.; Sharma, H.; Minami, C.; Winogradoff, D. Water quality improvement through bioretention: Lead, copper, and zinc removal. Water Environ. Res. 2003, 75, 73–82. [Google Scholar] [CrossRef]
  10. Hardin, M. The Effectiveness of a Specifically Designed Green Roof Stormwater treatment System Irrigated with Recycled Stormwater Runoff to Achieve Pollutant Removal and Stormwater Volume Reduction. Master’s Thesis, University of Central Florida, Orlando, FL, USA, 2006. [Google Scholar]
  11. Wanielista, M.; Kersten, R.; Eaglin, R. Hydrology: Water Quantity and Quality Control; John Wiley & Sons: New York, NY, USA, 1997. [Google Scholar]
  12. MacMillan, G. York University Rooftop Garden Stormwater Quantity and Quality Performance Monitoring Report. In Proceedings of Greening Rooftops for Sustainable Communities, Portland, OR, USA, 2–4 June 2004.
  13. Moran, A.; Hunt, B.; Jennings, G. A North Carolina Field Study to Evaluate Greenroof Runoff Quantity, Runoff Quality, and Plant Growth. In Proceedings of Greening Rooftops for Sustainable Communities Conference, Portland, OR, USA, 2–4 June 2004.
  14. Miller, C. Use of Vegetated Roof Covers in Runoff Management; RoofMeadow: Philadelphia, PA, USA, 2004. Available online: http://www.roofmeadow.com/wp-content/uploads/Runoff_Management_with_Green_Roofs.v2.pdf (accessed on 9 Novemeber 2012).
  15. Miller, C. Mathematical Simulation Methods: A Foundation for Developing General-Purpose Green Roof Simulation Models; RoofMeadow: Philadelphia, PA, USA, 2002. Available online: http://www.roofmeadow.com/wp-content/uploads/Mathematical-Simulation.pdf (accessed on 9 Novemeber 2012).
  16. Hilten, R.N.; Lawrence, T.M; Tollner, E.W. Modeling stormwater runoff from green roofs with HYDRUS-1D. J. Hydrol. 2008, 358, 288–293. [Google Scholar] [CrossRef]
  17. Guo, Y.; Baetz, B.W. Sizing of rainwater storage units for green building applications. J. Hydrol. Eng. 2007, 12, 197–205. [Google Scholar] [CrossRef]
  18. Liaw, C.-H.; Tsai, Y.-L. Optimum storage volume of rooftop rain water harvesting systems for domestic use. J. Am. Water Resour. Assoc. 2004, 40, 901–912. [Google Scholar] [CrossRef]
  19. Jones, M.P.; Hunt, W.F. Performance of rainwater harvesting systems in the southeastern united states. Resour. Conserv. Recycl. 2010, 54, 623–629. [Google Scholar] [CrossRef]
  20. Douglas, E.M.; Jacobs, J.M.; Sumner, D.M.; Ray, R.L. A comparison of models for estimating potential evapotranspiration for florida land cover types. J. Hydrol. 2009, 373, 366–376. [Google Scholar] [CrossRef]
  21. Wanielista, M.; Kelly, M.; Hardin, M. A Comparative Analysis of Greenroof Designs Including Depth of Media, Drainage Layer Materials, and Pollution Control Media; Florida Department of Environmental Protection: Tallahassee, FL, USA, 2008. [Google Scholar]
  22. Hagan, G. Personal communication. Tecta America, Sanford, FL, USA, 2012. [Google Scholar]
  23. Weather Underground Home Page. Available online: http://www.wunderground.com/history/ (accessed on 2 September 2012).
  24. Hardin, M.; Wanielista, M. Stormwater Effectiveness of an Operating Green Roof Stormwater Treatment System and Comparison to a Scaled Down Green Roof Stormwater Treatment System Chambers; Florida Department of Environmental Protection: Tallahassee, FL, USA, 2007. [Google Scholar]
  25. FLL, Guideline for the Planning, Execution and Upkeep of Green-roof Sites, January 2002 ed; Forschungsgesellschaft Landschaftsentwicklung Landschaftsbau E.V.: Bonn, Germany, 2002.
  26. Sonne, J. Evaluating green roof energy performance. ASHRAE J. 2006, 48, 59–61. [Google Scholar]
  27. Saiz, S.; Kennedy, C.; Bass, B.; Pressnail, K. Comparative life cycle assessment of standard and green roofs. Environ. Sci. Technol. 2006, 40, 4312–4316. [Google Scholar] [CrossRef]
  28. Kosareo, L.; Ries, R. Comparative environmental life cycle assessment of green roofs. Build. Environ. 2007, 42, 2606–2613. [Google Scholar] [CrossRef]
  29. Teemusk, A.; Mander, U. Greenroof potential to reduce temperature fluctuations of a roof membrane: A case study from estonia. Build. Environ. 2009, 44, 643–650. [Google Scholar] [CrossRef]
  30. Wanielista, M.; Hardin, M. A Stormwater Management Assessment of Green Roofs with Irrigation. In Proceedings of 2nd Biennal Stormwater Management Research Symposium, Orlando, FL, USA, 4–5 May 2006; pp. 153–164.

