Potable Water Savings by Using Rainwater for Non-Potable Uses in Houses


Laboratory of Energy Efficiency in Buildings, Department of Civil Engineering, Federal University of Santa Catarina, Florianópolis-SC 88040-900, Brazil
*
Author to whom correspondence should be addressed.
Water 2012, 4(3), 607-628; https://doi.org/10.3390/w4030607
Submission received: 9 July 2012
/
Revised: 14 August 2012
/
Accepted: 17 August 2012
/
Published: 29 August 2012
(This article belongs to the Special Issue Sustainable Water Systems)
Abstract
:The objective of this study is to assess the potential for potable water savings by using rainwater as well as the sizing of rainwater tanks in houses in some cities in the world. Daily rainfall data for thirteen cities located in different countries were used. Different catchment areas, number of residents, potable and rainwater demands were considered in order to assess their impact on the potential for potable water savings and sizing of rainwater tanks. The analysis was performed using the Netuno computer program. The results showed that the greatest potential for potable water savings is obtained in cities where there is constant rainfall, which does not always mean high annual average rainfall. Cities with well-defined periods of drought require larger tank capacities. Overall, it was observed that all parameters (catchment area, number of residents, potable and rainwater demands, and rainfall) influence the sizing of the tank for rainwater storage.
1. Introduction
The scarcity of potable water is becoming a matter of concern all over the world. According to [1], countries such as Kuwait, Egypt, Saudi Arabia, Algeria, Belgium, among others, are already suffering from this problem. On the other hand, water consumption is quite high in several countries. According to [2], the average potable water consumption in Brazil is 116 L per capita/day, but it ranges from 88 to 158 L per capita/day depending on the geographical location. Gulyani et al., [3] studied the potable water demand in many cities in Africa, in Asia and Latin America and noted that the consumption in some cities is quite high. The cities of Manila, Seoul, Delhi in Asia and Santiago and San Jose in Latin America have an average potable water demand higher than 200 L per capita/day.
The use of rainwater for non-potable uses is a means to reduce the potable water consumption. It is also a way to save the environment and prevent disorders in the urban context. Rainwater harvesting is a very old practice. According to [4] such a system has existed for over 4,000 years in the Negev desert and sophisticated structures for collection and storage of rainwater were built during the Roman era.
Nowadays, examples of rainwater harvesting are well-known in the world, some more simple as in Zambia [5], where the residents were trained to build tanks; and others more complex such as for larger housing in Sweden [6], hotels in Hong Kong [7] and schools in Taiwan [8].
Eroksuz and Rahman [9] performed studies in three cities in Australia and obtained potable water savings ranging from 21%–57% along the year, with tank capacities ranging from 10,000 to 100,000 L in multi-family buildings. There are studies for large catchment areas such as large stadiums in Japan, where rainwater usage allows for annual savings of about US$ 120,000 and supplies 65% of the non-potable water demand [10].
For example, Marinoski and Ghisi [11] analyzed the investment feasibility of implementing a system for rainwater usage for non-potable uses in an educational institution located in Florianópolis, Brazil. The potable water savings were estimated as 45.8% and the payback as four years and 10 months.
In Jordan, a country that already has problems with drinking water scarcity, and an annual rainfall average of only 300 mm, Abdulla and Al-Shareef [12] analyzed the implementation of systems to collect rainwater. They concluded that the potential for potable water savings by using rainwater ranges from 0.27% to 19.7% in the twelve states of the country.
Fewkes [13] examined the use of rainwater for toilet flushing by installing a tank of 2032 L in a home in the UK. The system was monitored for twelve months. Potable water savings ranged from 4% in June to 100% in September.
Slys [14] analyzed the feasibility of rainwater systems in the residential sector of Poland by developing a simulation model to estimate the potential for potable water savings according to the climate conditions and demands of the site. By estimating the investment feasibility of the system, the author concluded that the payback period is still high, being considered expensive when compared to the price paid by the regular supply of water.
According to [15] calculations based on average annual rainfall produce unrealistic results, particularly in very large rainwater tank capacities. The concept of seasonality index studies this inter annual variability, separating the years into dry, average and wet, and evaluates if the variability affects the results.
As one can see, different studies applying different methods have been performed worldwide. This paper contributes to the increasing knowledge about potable water savings by using rainwater and tank sizing for different cities in the world using the same method.
2. Objective
The objective of this paper is to compare the potential for potable water savings by using rainwater in the residential sector of different cities around the world, as well as assess the rainwater tank capacities.
3. Method
3.1. Cities Chosen
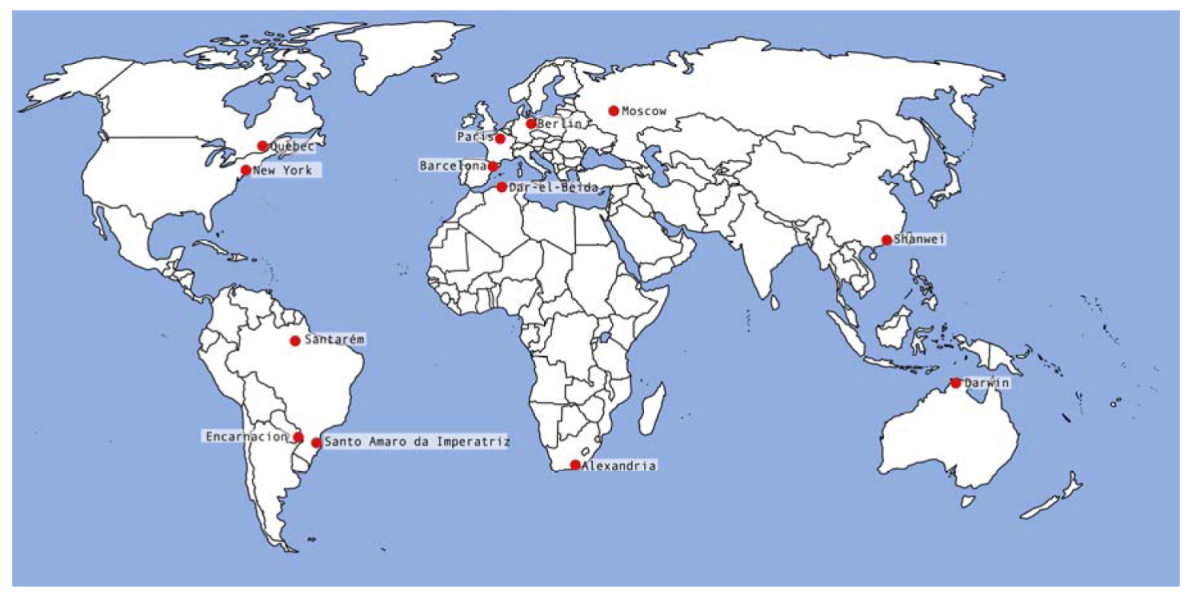
In order to achieve the objective of the research it was necessary to obtain reliable daily rainfall data for several cities in the world. The cities were selected according to their geographical location, rainfall level, and rainfall time series. Table 1 shows the cities chosen for analysis and Figure 1 shows their location on the globe.

| Cities | Countries |
|---|---|
| Alexandria | South Africa |
| Barcelona | Spain |
| Berlin | Germany |
| Dar-el-Beida | Algeria |
| Darwin | Australia |
| Encarnacion | Paraguay |
| Moscow | Russia |
| New York | USA |
| Paris | France |
| Quebec | Canada |
| Santarém | Brazil |
| Santo Amaro da Imperatriz | Brazil |
| Shanwei | China |
Figure 1.
Location of selected cities.
3.2. Rainfall Data
The rainfall data were obtained through the internet database of the GHCN (Global Historical Climatology Network) [16]. GHCN serves as the official repository for daily data of the Global Climate Observing System (GCOS) and is used for monitoring and evaluation of terrestrial climate. GHCN contains a database composed of daily measurements of maximum and minimum temperatures, rainfall and snowfall. It covers more than 40,000 stations distributed in all continents and contains the largest collection of daily weather data.
All of the chosen cities have daily rainfall data over a period of 30 years; however the 30-year time series does not cover the same period of time for all cities. On days when measurements were missing or not accurate, rainfall was considered to be zero in the computer simulations. Although it is known that there are many cities with high annual rainfall variability, and this can be accentuated by the recent climate change, this was mitigated by taking a rainfall time series of 30 years.
3.3. Computer Simulations
In order to estimate the tank capacities and potential for potable water savings the Netuno computer program (Version 2.1) was used [17]. Netuno was developed to estimate the potential for potable water savings for different rainwater tank capacities. More information about Netuno can be found in [18]; and information on its validation can be found in [19]. Advantages, disadvantages and limitations of Netuno can also be found in these works. Input data to be used in Netuno are shown as follows.
3.3.1. Catchment Surface Area
To evaluate the influence of the catchment surface area on the potential for potable water savings in each city, three areas were chosen, i.e., 100, 200 and 400 m2. Since it is known that this data is proportional to the economic level of the dwellers, catchment areas were chosen to try to approach this variation, considering that the larger the catchment area, the greater the dwellers financial resources.
3.3.2. Potable Water Demand
To consider a range of potable water demands capable of representing all the cities selected in this study, the values were chosen based on other studies. According to [2,3,12,20], the potable water demand varies between 45 and 209 L per capita/day around the world. Thus, the potable water demands used in the simulations were 50, 100, 150, 200 and 250 L per capita/day.
3.3.3. Number of Residents
In order to assess the influence that the number of residents has on the rainwater tank sizing, two or four people per household were considered.
3.3.4. Rainwater Demand
According to [21,22,23], SABESP apud [24] and [25], the water end-uses for activities that do not require potable water in residential buildings range between 38% and 55% in Denmark, the United States, the United Kingdom, Colombia, Switzerland and Brazil. Thus, the analyses performed in this paper consider rainwater demands of 40%, 50% and 60% of the potable water demand.
The analysis to identify the ideal tank capacities considered rainwater demands of 10% to 100% of the potable water demand, at intervals of 10%.
3.3.5. Run-off Coefficient
In order to account for the first flush to dispose of debris and impurities on the catchment surface and also losses due to absorption and evaporation of rainwater, a run-off coefficient of 80% was considered in all simulations.
3.3.6. Lower and Upper Rainwater Tanks
The simulations were performed considering lower tank capacities ranging from zero to 20,000 L, at intervals of 1000 L. The upper tank capacity was taken as 1000 L in all cases. The lower tank is placed at ground level and the upper one is placed on the roof. Rainwater is pumped from the lower to the upper tank; and then it reaches the plumbing fixtures by gravity.
3.3.7. Ideal Capacity of the Lower Rainwater Tank
The ideal capacity of the lower rainwater tank was obtained through simulations using Netuno, which estimates the potential for potable water savings for each tank capacity. Thus, the ideal tank capacity was taken as the one in which the potential for potable water savings increased 2% or less when increasing the tank capacity in 1000 L.
3.3.8. Correlations
Results obtained from the computer simulations were analyzed by means of correlations between rainwater demand and potable water savings per house; both variables were taken as a function of the catchment surface area.
4. Results
By performing the computer simulations for the selected cities and using the input data previously described, it was possible to obtain the ideal rainwater tank capacities, as well as the potential for potable water savings for each case. Such results are assessed as follows.
4.1. Rainfall
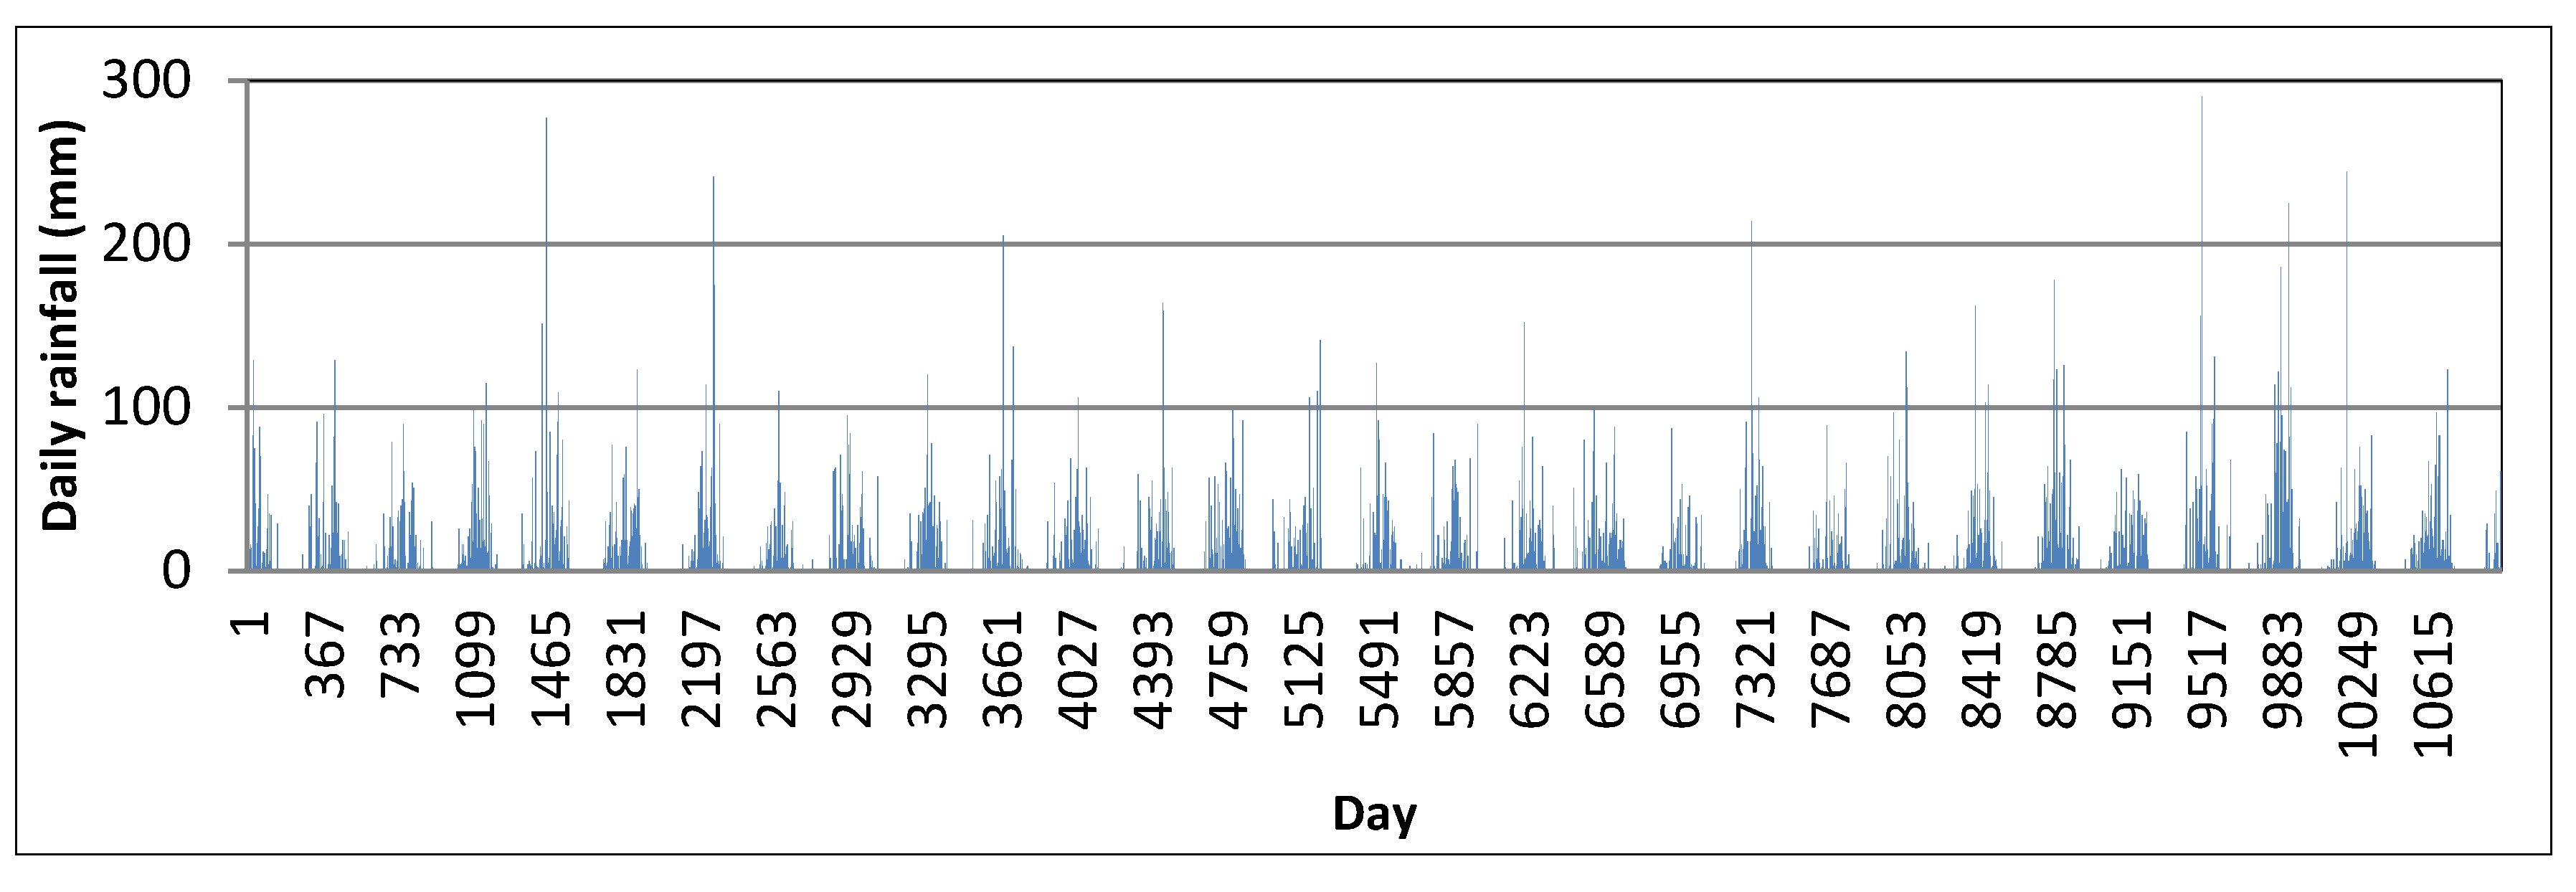
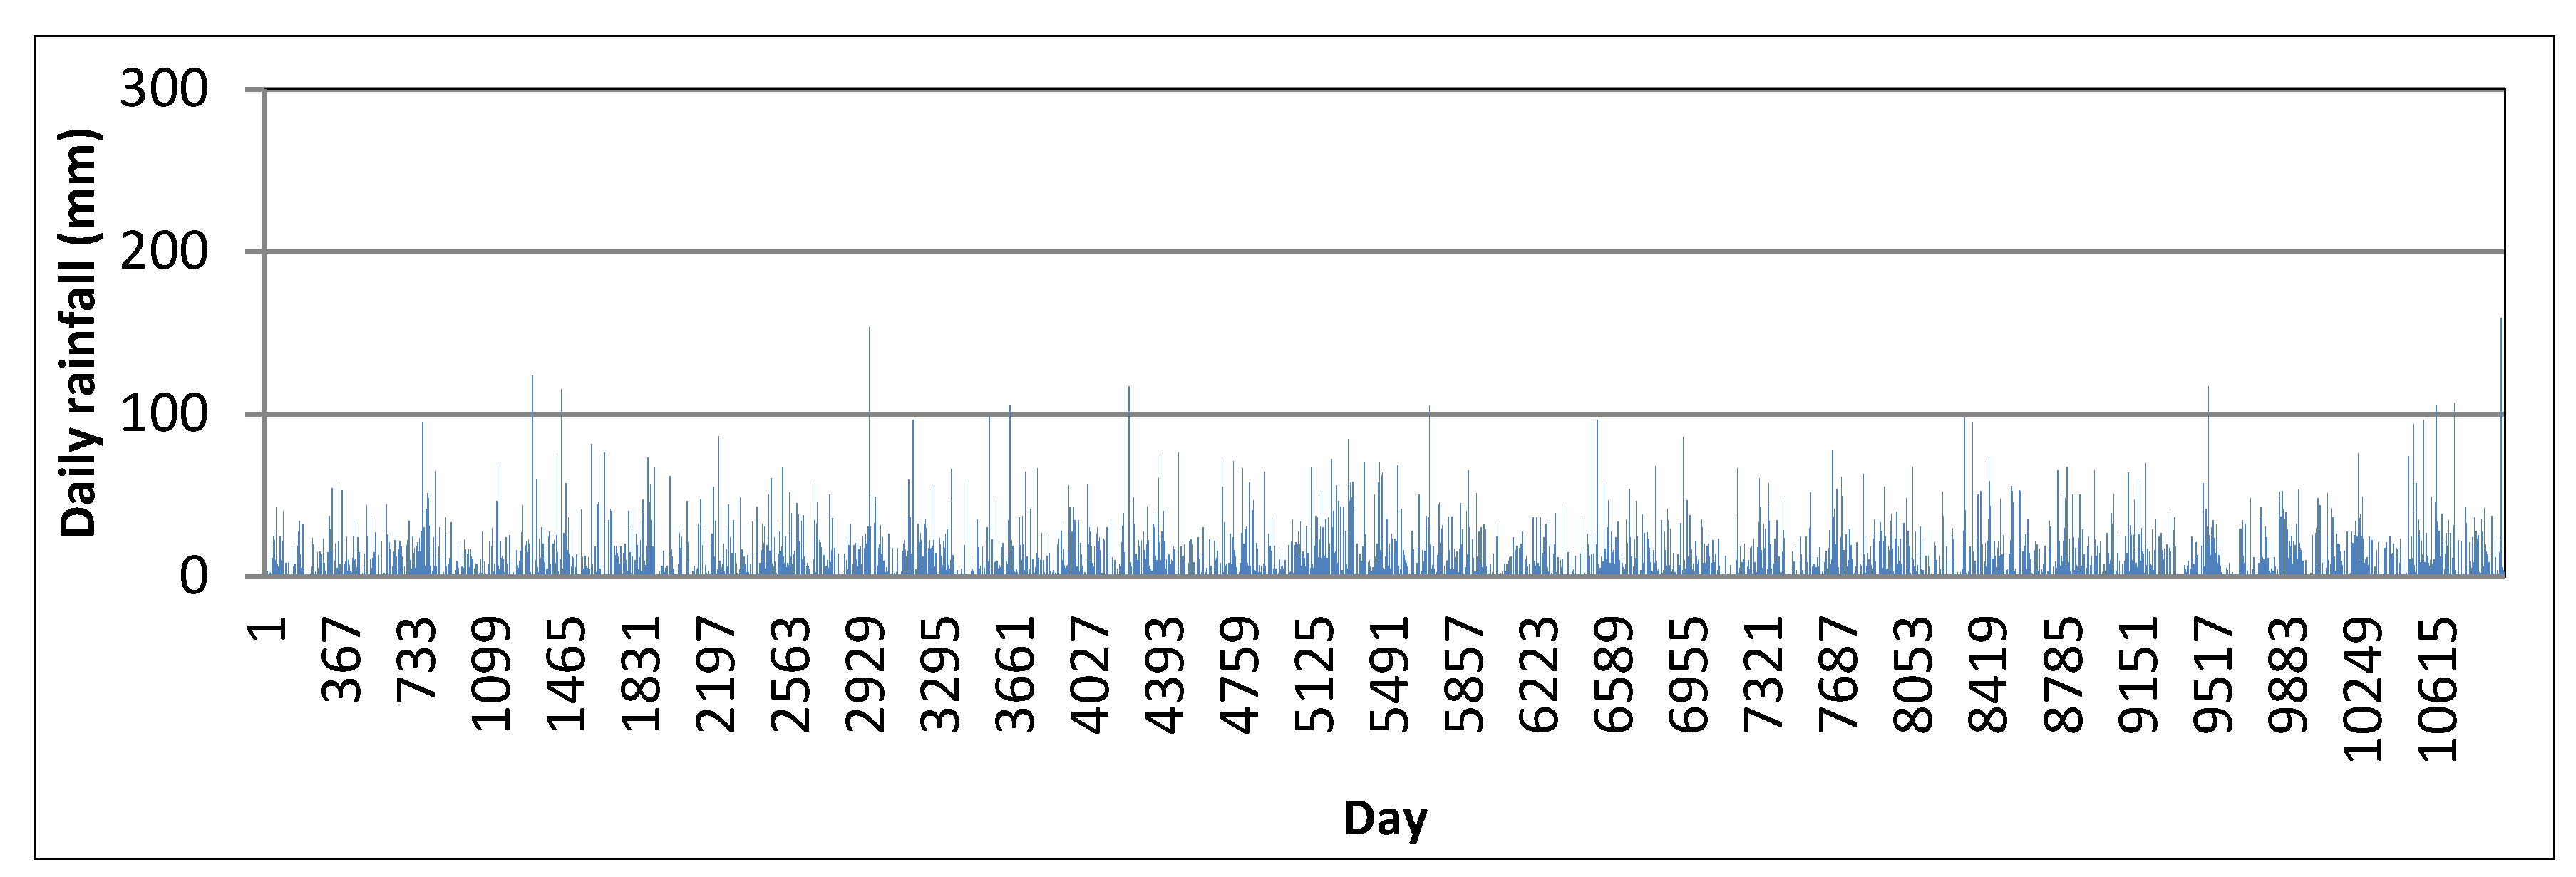
The rainfall data for the selected cities are composed of a time series of 30 years (about 10,960 days). Figure 2–Figure 4 show the daily rainfall data throughout the study period for the three cities selected to be shown herein. These figures show the rainfall variation in each city. Figure 3, for example, shows the city of Darwin, Australia, in the tropical climate, which is characterized by high rainfall in summer and very low in winter. Figure 2 shows Berlin that has the lowest average rainfall of all cities chosen. Santarém, in Figure 4, has large quantities of rain and good constancy.
Table 2 shows the rainfall time series considered for each city and their annual average rainfall. As the cities were chosen primarily according to their geographical location, some have similar rainfall.
Figure 2.
Daily rainfall for Berlin, Germany, for a 30-year time series.
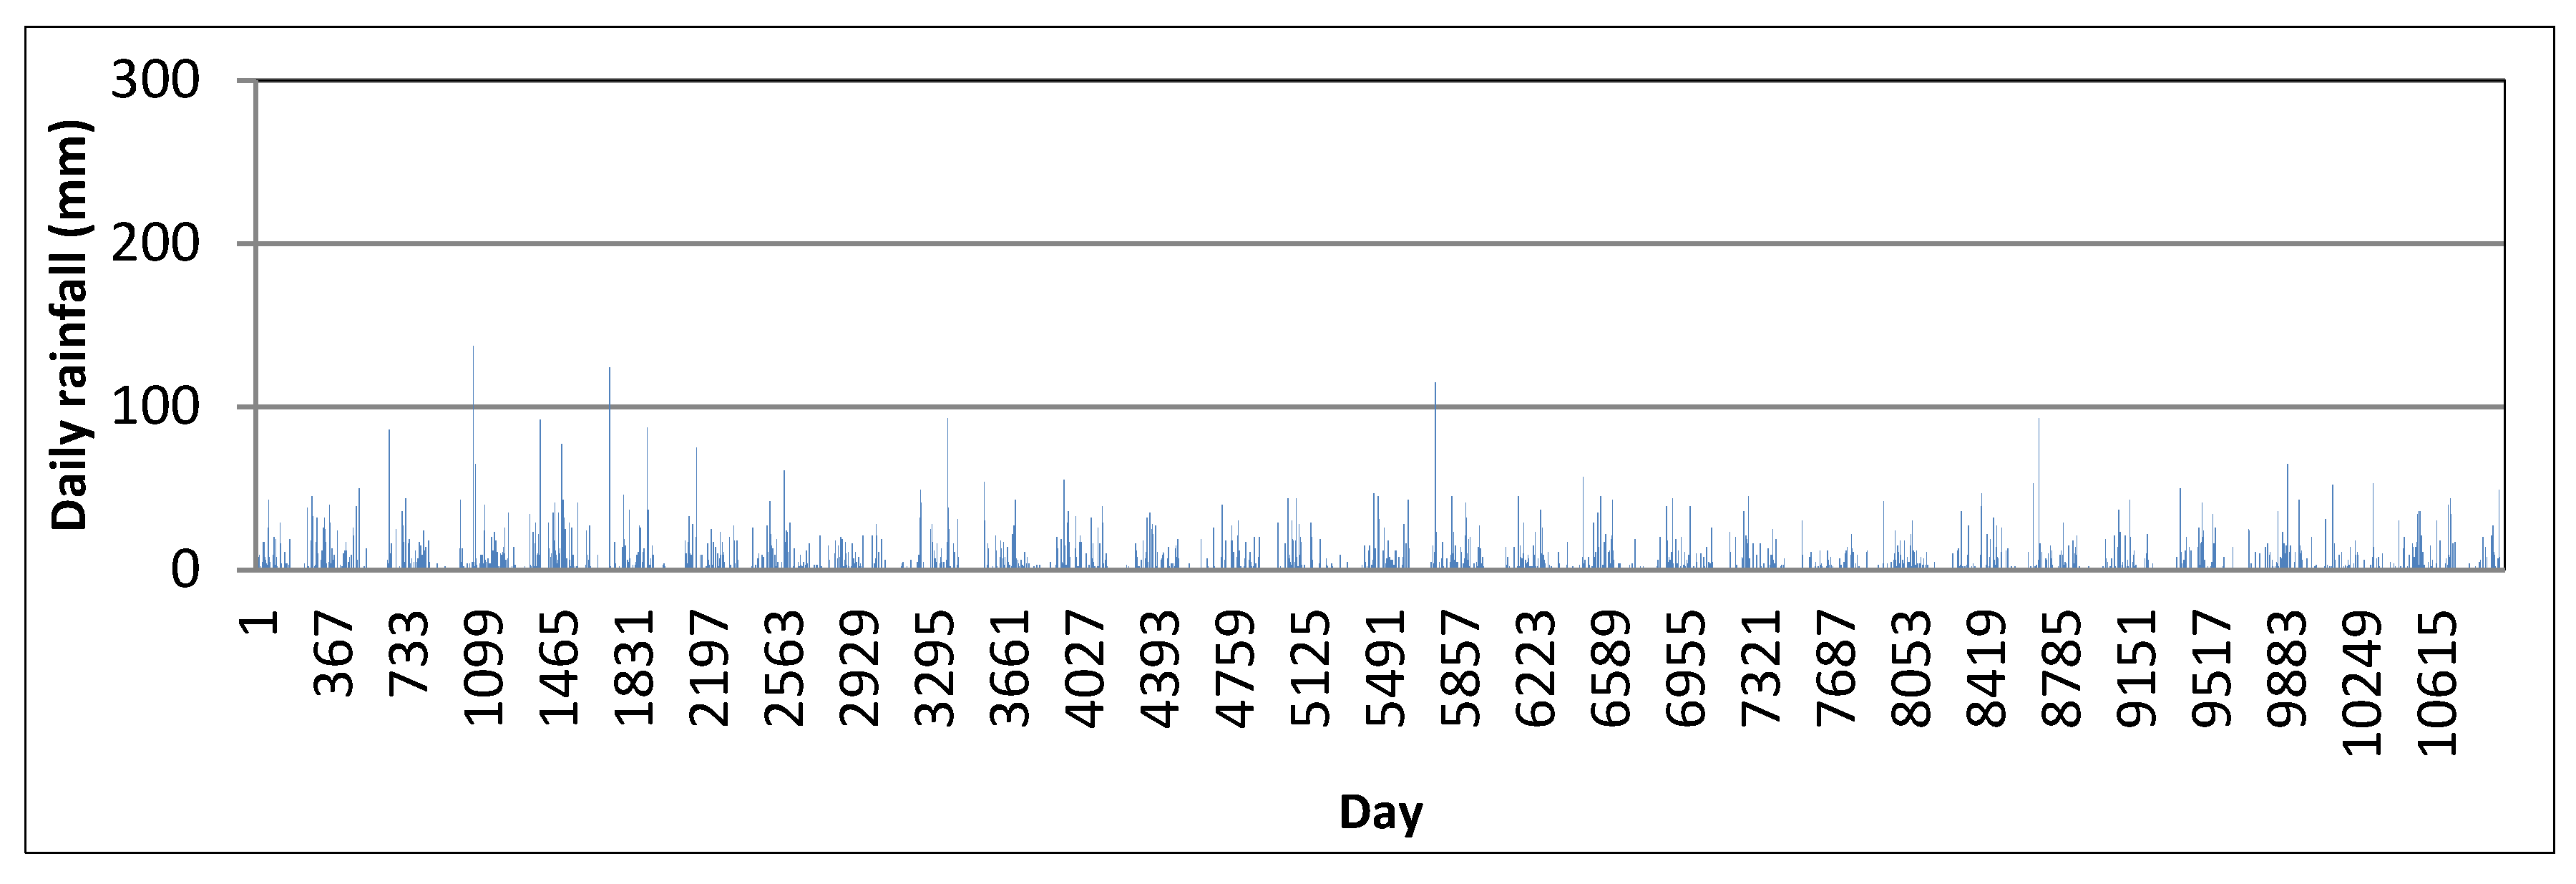
Figure 3.
Daily rainfall for Darwin, Australia, for a 30-year time series.

Figure 4.
Daily rainfall for Santarém, Brazil, for a 30-year time series.

| City, Country | Rainfall time series | Average rainfall (mm/year) | |
| Begin–End | Years | ||
| Alexandria, South Africa | 01/01/1966–31/12/1995 | 30 | 591 |
| Barcelona, Spain | 01/01/1968–31/12/1997 | 30 | 634 |
| Berlin, Germany | 01/01/1972–31/12/2001 | 30 | 585 |
| Dar-el-Beida, Algeria | 01/01/1969–31/12/1998 | 30 | 654 |
| Darwin, Australia | 01/01/1972–31/12/2000 | 30 | 1839 |
| Encarnacion, Paraguay | 01/01/1970–31/12/1999 | 30 | 1848 |
| Moscow, Russia | 01/01/1970–31/12/1999 | 30 | 683 |
| New York, United States | 01/01/1980–31/12/2009 | 30 | 1265 |
| Paris, France | 01/01/1971–31/12/2000 | 30 | 650 |
| Quebec, Canada | 01/01/1965–31/12/1994 | 30 | 1219 |
| Santarém, Brazil | 01/01/1969–31/12/1998 | 30 | 2199 |
| Santo Amaro da Imperatriz, Brazil | 01/01/1969–31/12/1998 | 30 | 1761 |
| Shanwei, China | 01/01/1968–31/12/1997 | 30 | 1999 |
4.2. Computer Simulation Results
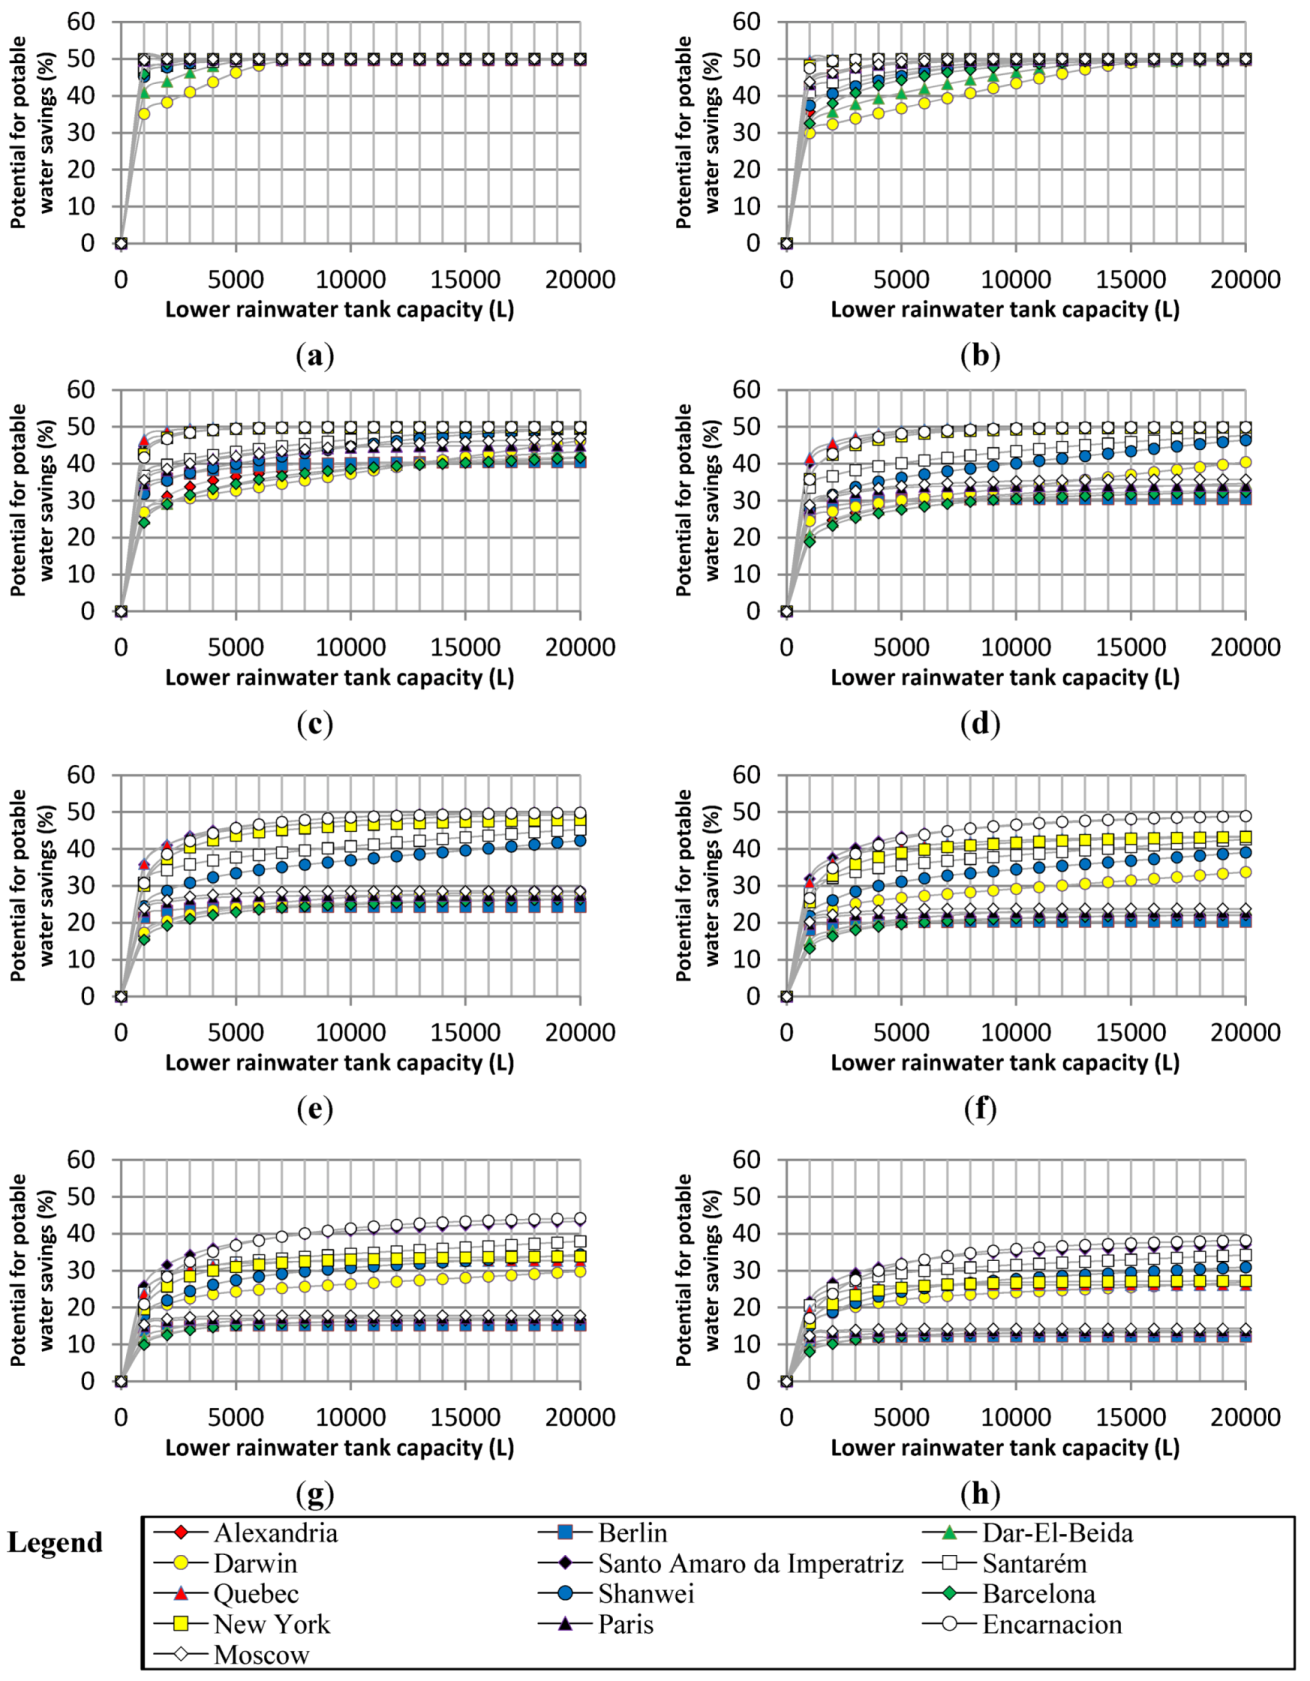
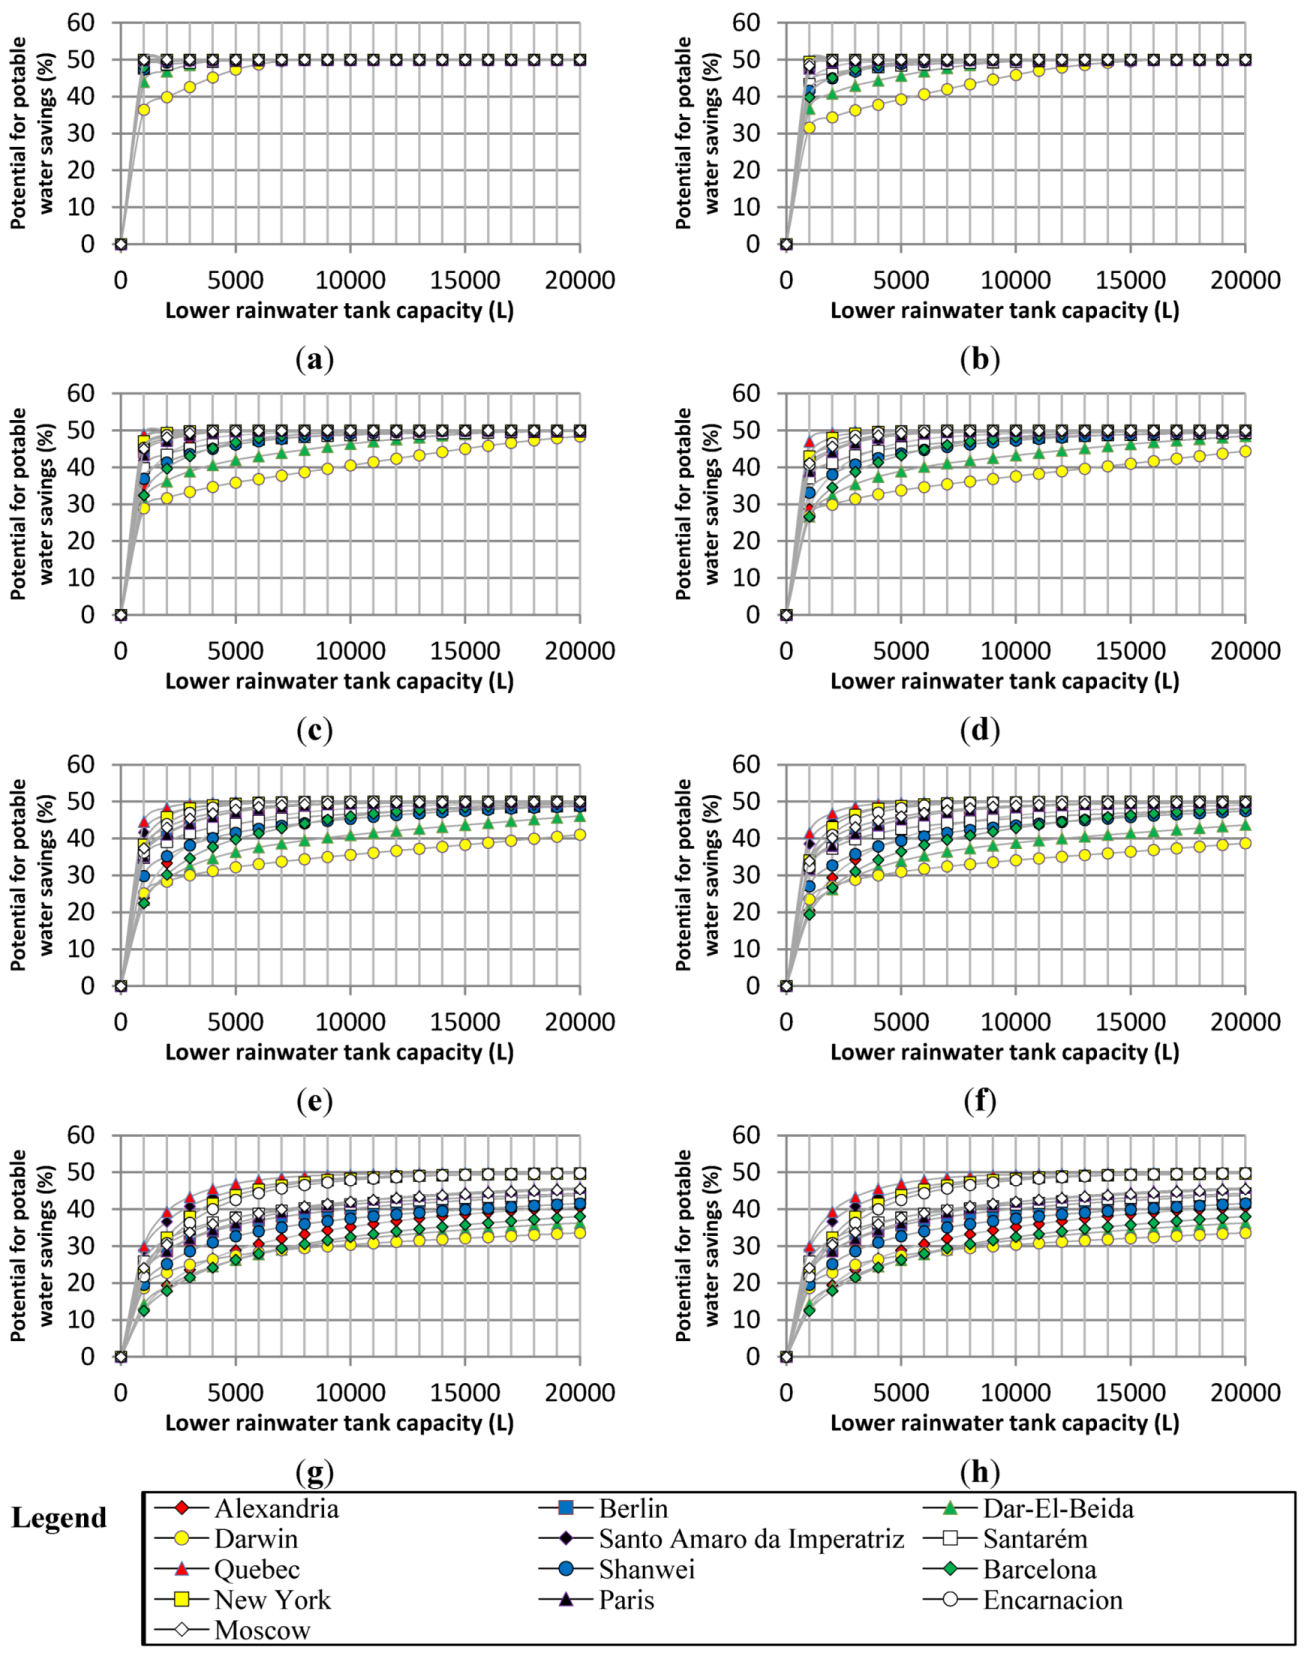
Figure 5–Figure 7 show the potential for potable water savings for the thirteen cities as a function of rainwater demand, number of residents and catchment surface areas of 100 m2, 200 m2 and 400 m2, respectively. Rainwater demand of 40%, 50% and 60% of potable water demand were analyzed; however, due to limitation of space, only the results for rainwater demand of 50% are shown. Results for 40% and 60% show the same trend as observed for 50%.
It is possible to observe that in cities with more frequent rainfall the curve soon settles horizontally, which indicates that the potential for potable water savings does not significantly increase with the increase of the rainwater tank capacity. This is observed for New York, Moscow and Berlin. In cities such as Darwin, Dar-el-Beida and Alexandria, which have long periods of low rainfall, the potential for potable water savings increases with the increase of the tank capacity. Thus, larger tanks are needed for these cities because rainwater has to be stored for drought periods.
By analyzing Figure 5a it is possible to see that when potable water demand is low, i.e., 50 L per house per day, in most cities the potential for potable water savings reaches 50%. By doubling the demand in Figure 5b, Darwin, Dar-el-Beida and Barcelona can only achieve potable water savings of 50% if the lower tank has a capacity of about 14,000 L. When potable water demand is high, i.e., 500 L per house per day it is observed that the potential for potable water savings is quite low. From Figure 5g,h one sees a decrease of at least 20% in the potential for potable water savings. This is due to the fact that by increasing the potable water demand and the number of residents, the rainwater collected from the catchment surface of 100 m2 cannot supply the demand.
Comparing Figure 5h and Figure 7h, both with rainwater demand of 500 L per house per day, but with different catchment areas (100 m2 and 400 m2, respectively), one sees that the larger the catchment area, the easier it is to achieve a high potential for potable water savings. In Figure 5h, when the catchment surface area is small (100 m2), the potential for potable water savings of most cities ranges from 10% to 40%. However, by increasing the catchment area to 400 m2, in Figure 7h, a higher potential for potable savings can be achieved, since a greater amount of rainwater can be collected.
Figure 5.
Potential for potable water savings for each city as a function of rainwater demand and catchment surface area of 100 m2. (a) Rainwater demand of 50 L per house per day; (b) Rainwater demand of 100 L per house per day; (c) Rainwater demand of 150 L per house per day; (d) Rainwater demand of 200 L per house per day; (e) Rainwater demand of 250 L per house per day; (f) Rainwater demand of 300 L per house per day; (g) Rainwater demand of 400 L per house per day; (h) Rainwater demand of 500 L per house per day.

Figure 6.
Potential for potable water savings for each city as a function of rainwater demand and catchment surface area of 200 m2. (a) Rainwater demand of 50 L per house per day. (b) Rainwater demand of 100 L per house per day. (c) Rainwater demand of 150 L per house per day. (d) Rainwater demand of 200 L per house per day. (e) Rainwater demand of 250 L per house per day. (f) Rainwater demand of 300 L per house per day. (g) Rainwater demand of 400 L per house per day. (h) Rainwater demand of 500 L per house per day.
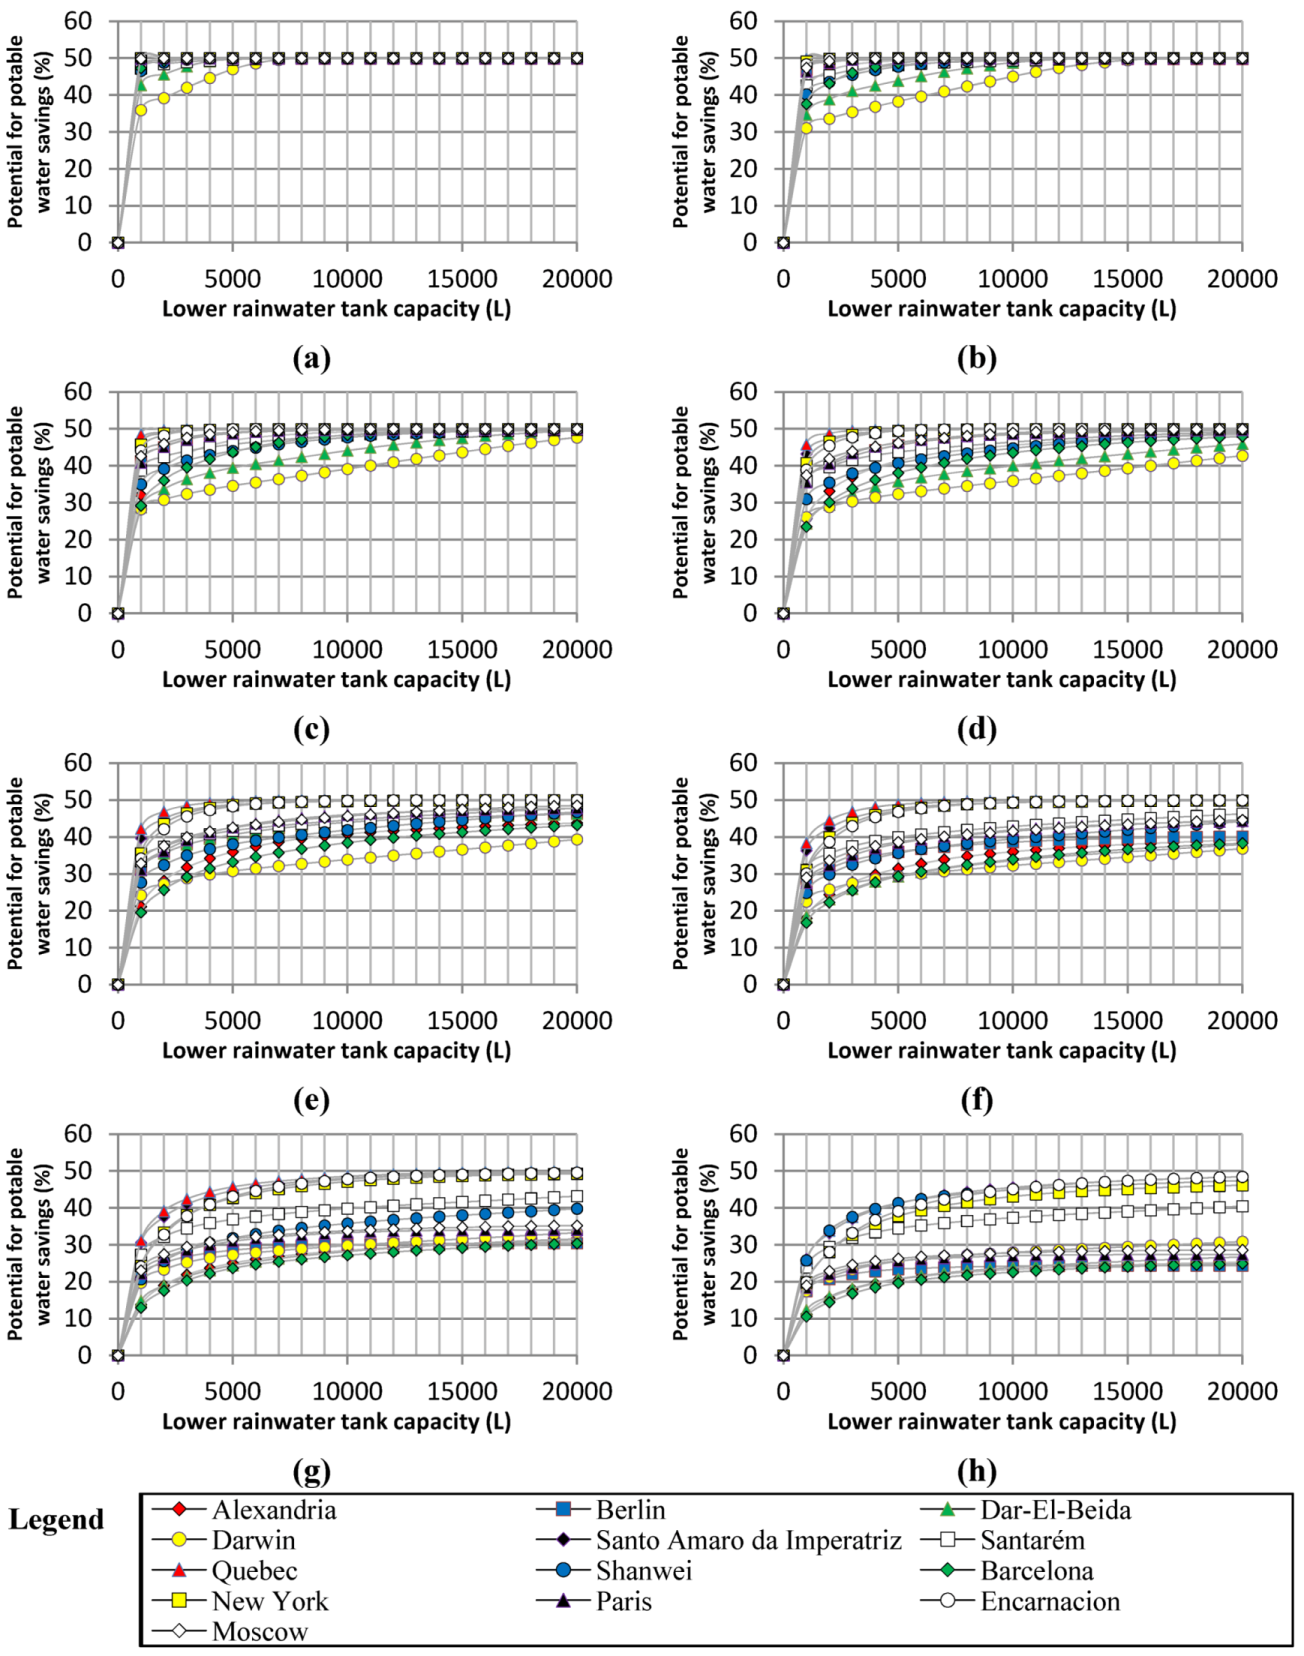
Figure 7.
Potential for potable water savings for each city as a function of rainwater demand and catchment surface area of 400 m2. (a) Rainwater demand of 50 L per house per day; (b) Rainwater demand of 100 L per house per day; (c) Rainwater demand of 150 L per house per day; (d) Rainwater demand of 200 L per house per day; (e) Rainwater demand of 250 L per house per day; (f) Rainwater demand of 300 L per house per day; (g) Rainwater demand of 400 L per house per day; (h) Rainwater demand of 500 L per house per day.
4.2.1. Potential for Potable Water Savings
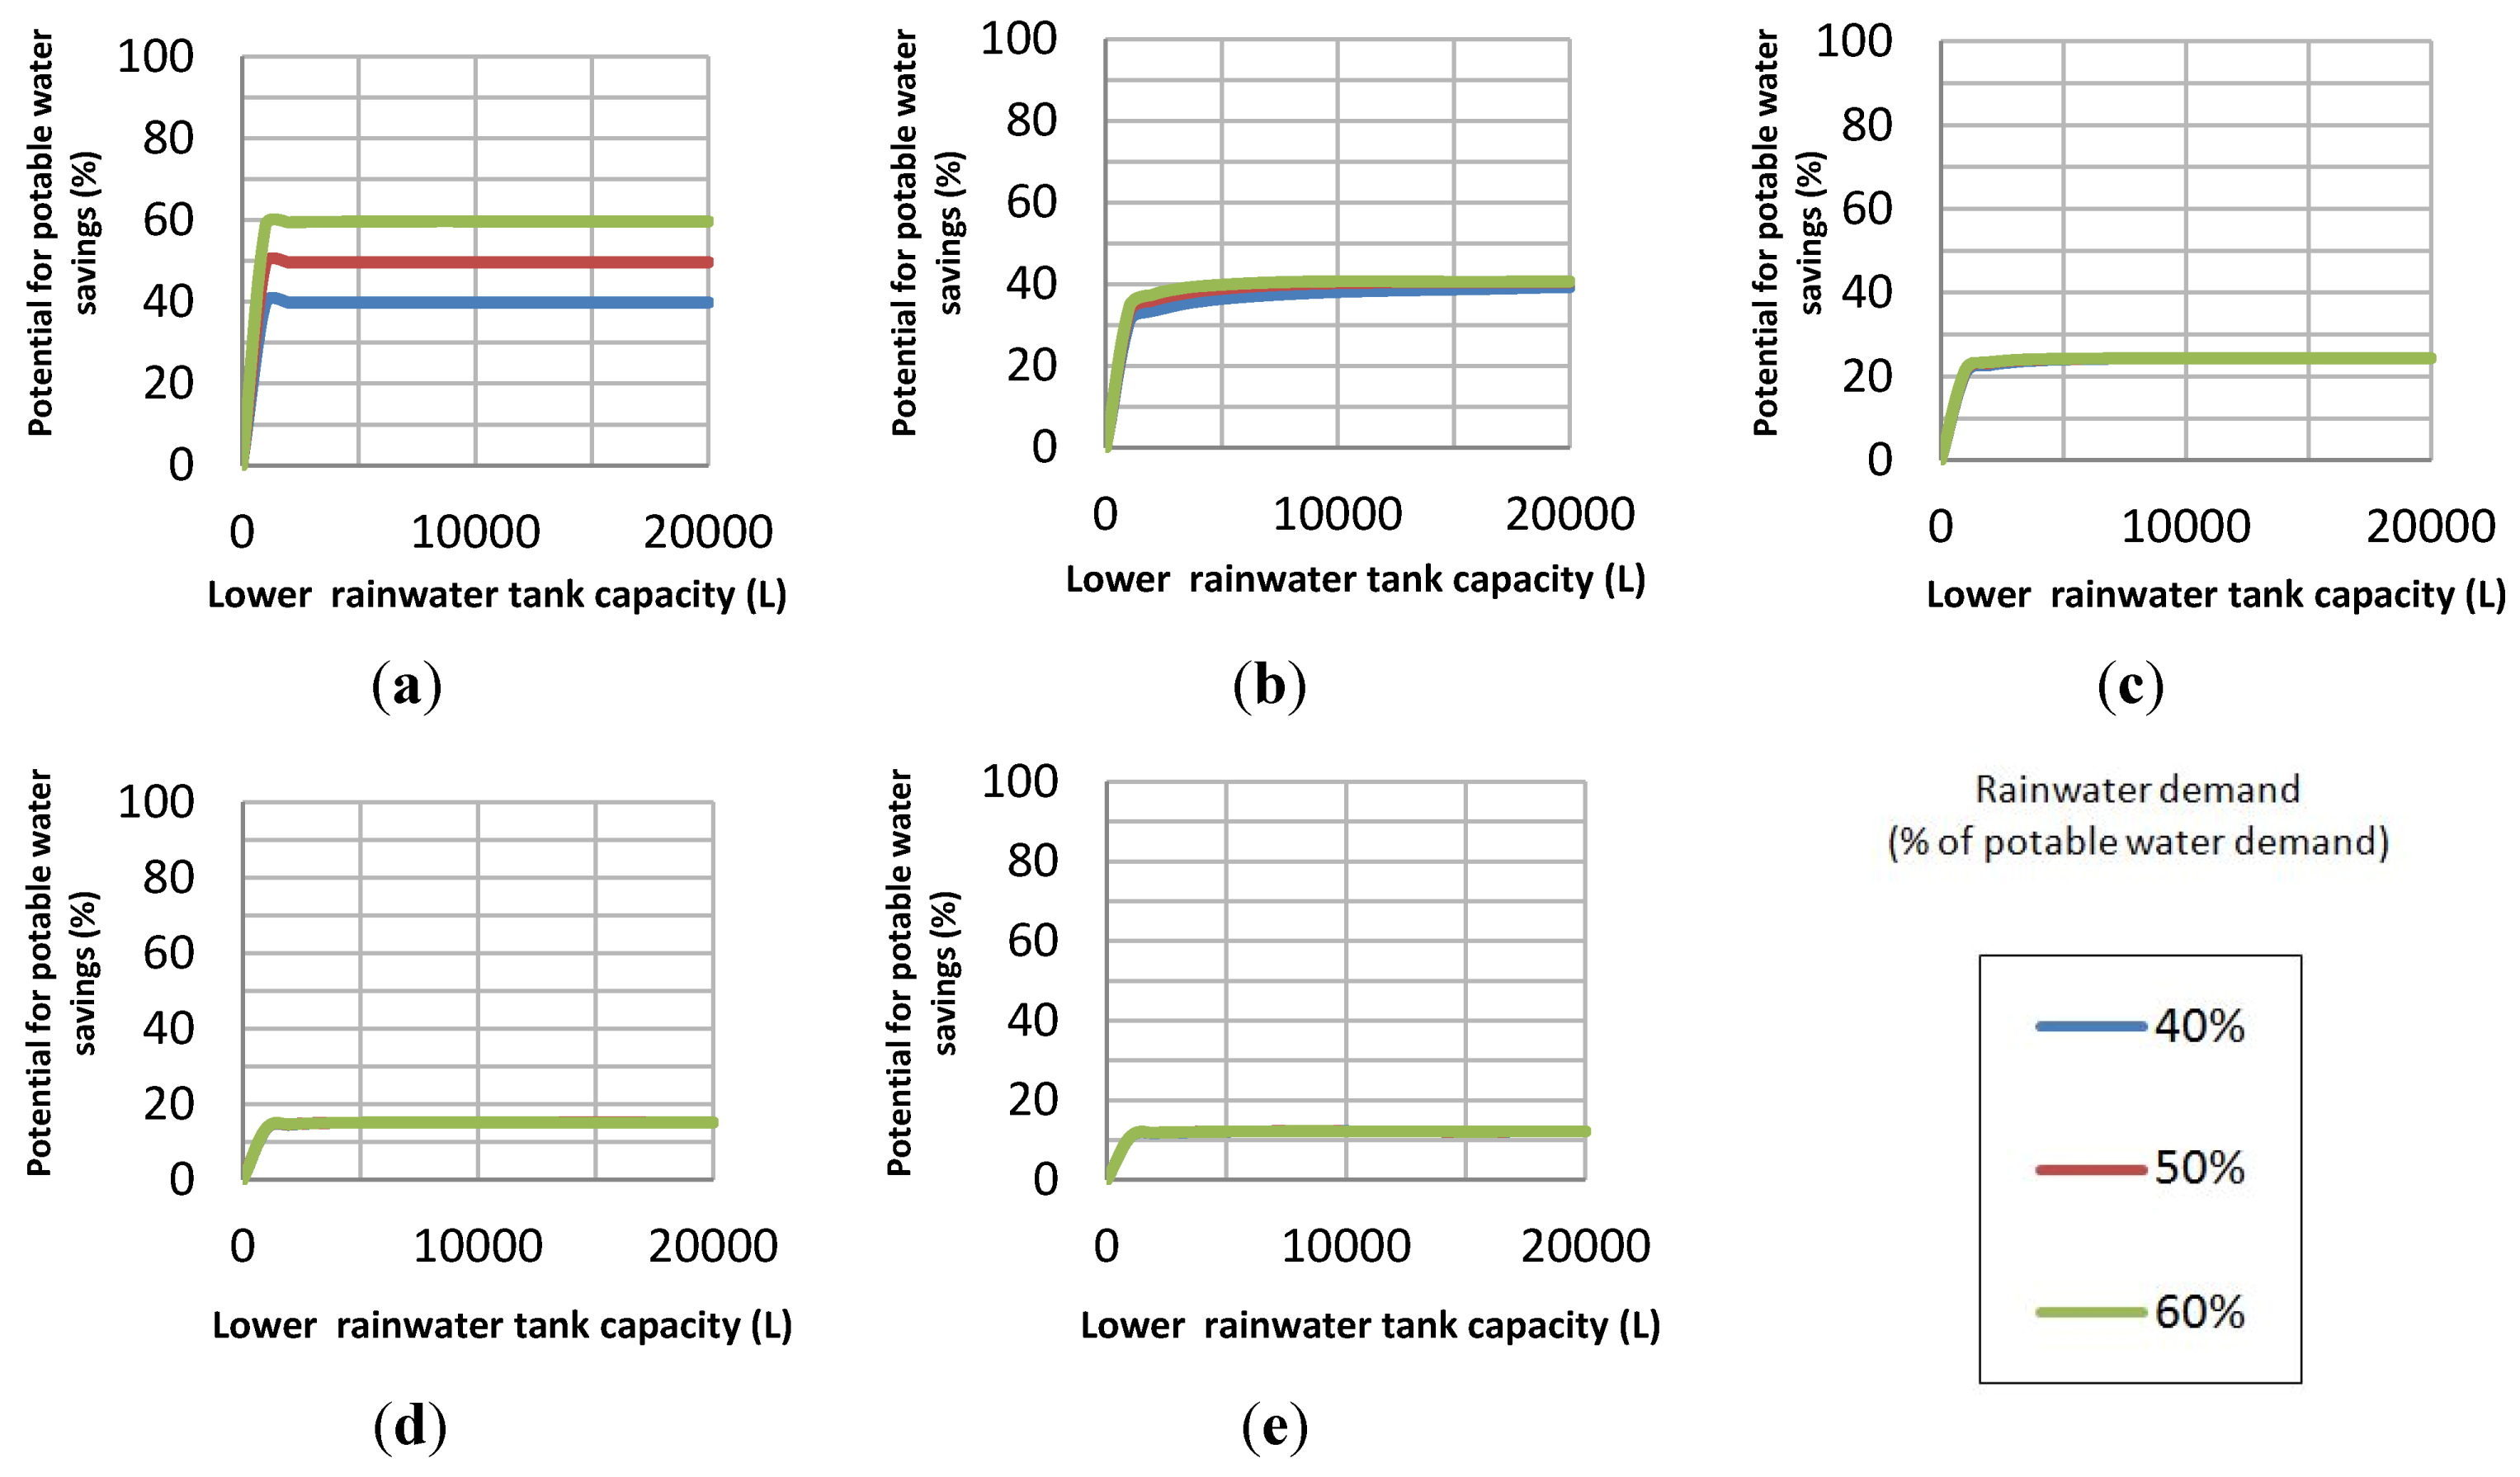
To assess the potential for potable water savings, three cities with different rainfall levels were selected to be shown herein. Thus, Berlin is the city with the lowest rainfall (585 mm/year), Santarém is the one with the highest rainfall (2199 mm/year) and Darwin has a high rainfall (1839 mm/year), but, in the winter, as it is located in a tropical climate, has low rainfall. The simulations were performed with potable water demands of 100, 300, 500, 800 and 1000 L/day per house which were obtained by multiplying the daily potable water demand by the number of residents, varying the catchment area between 100 m2 and 400 m2.
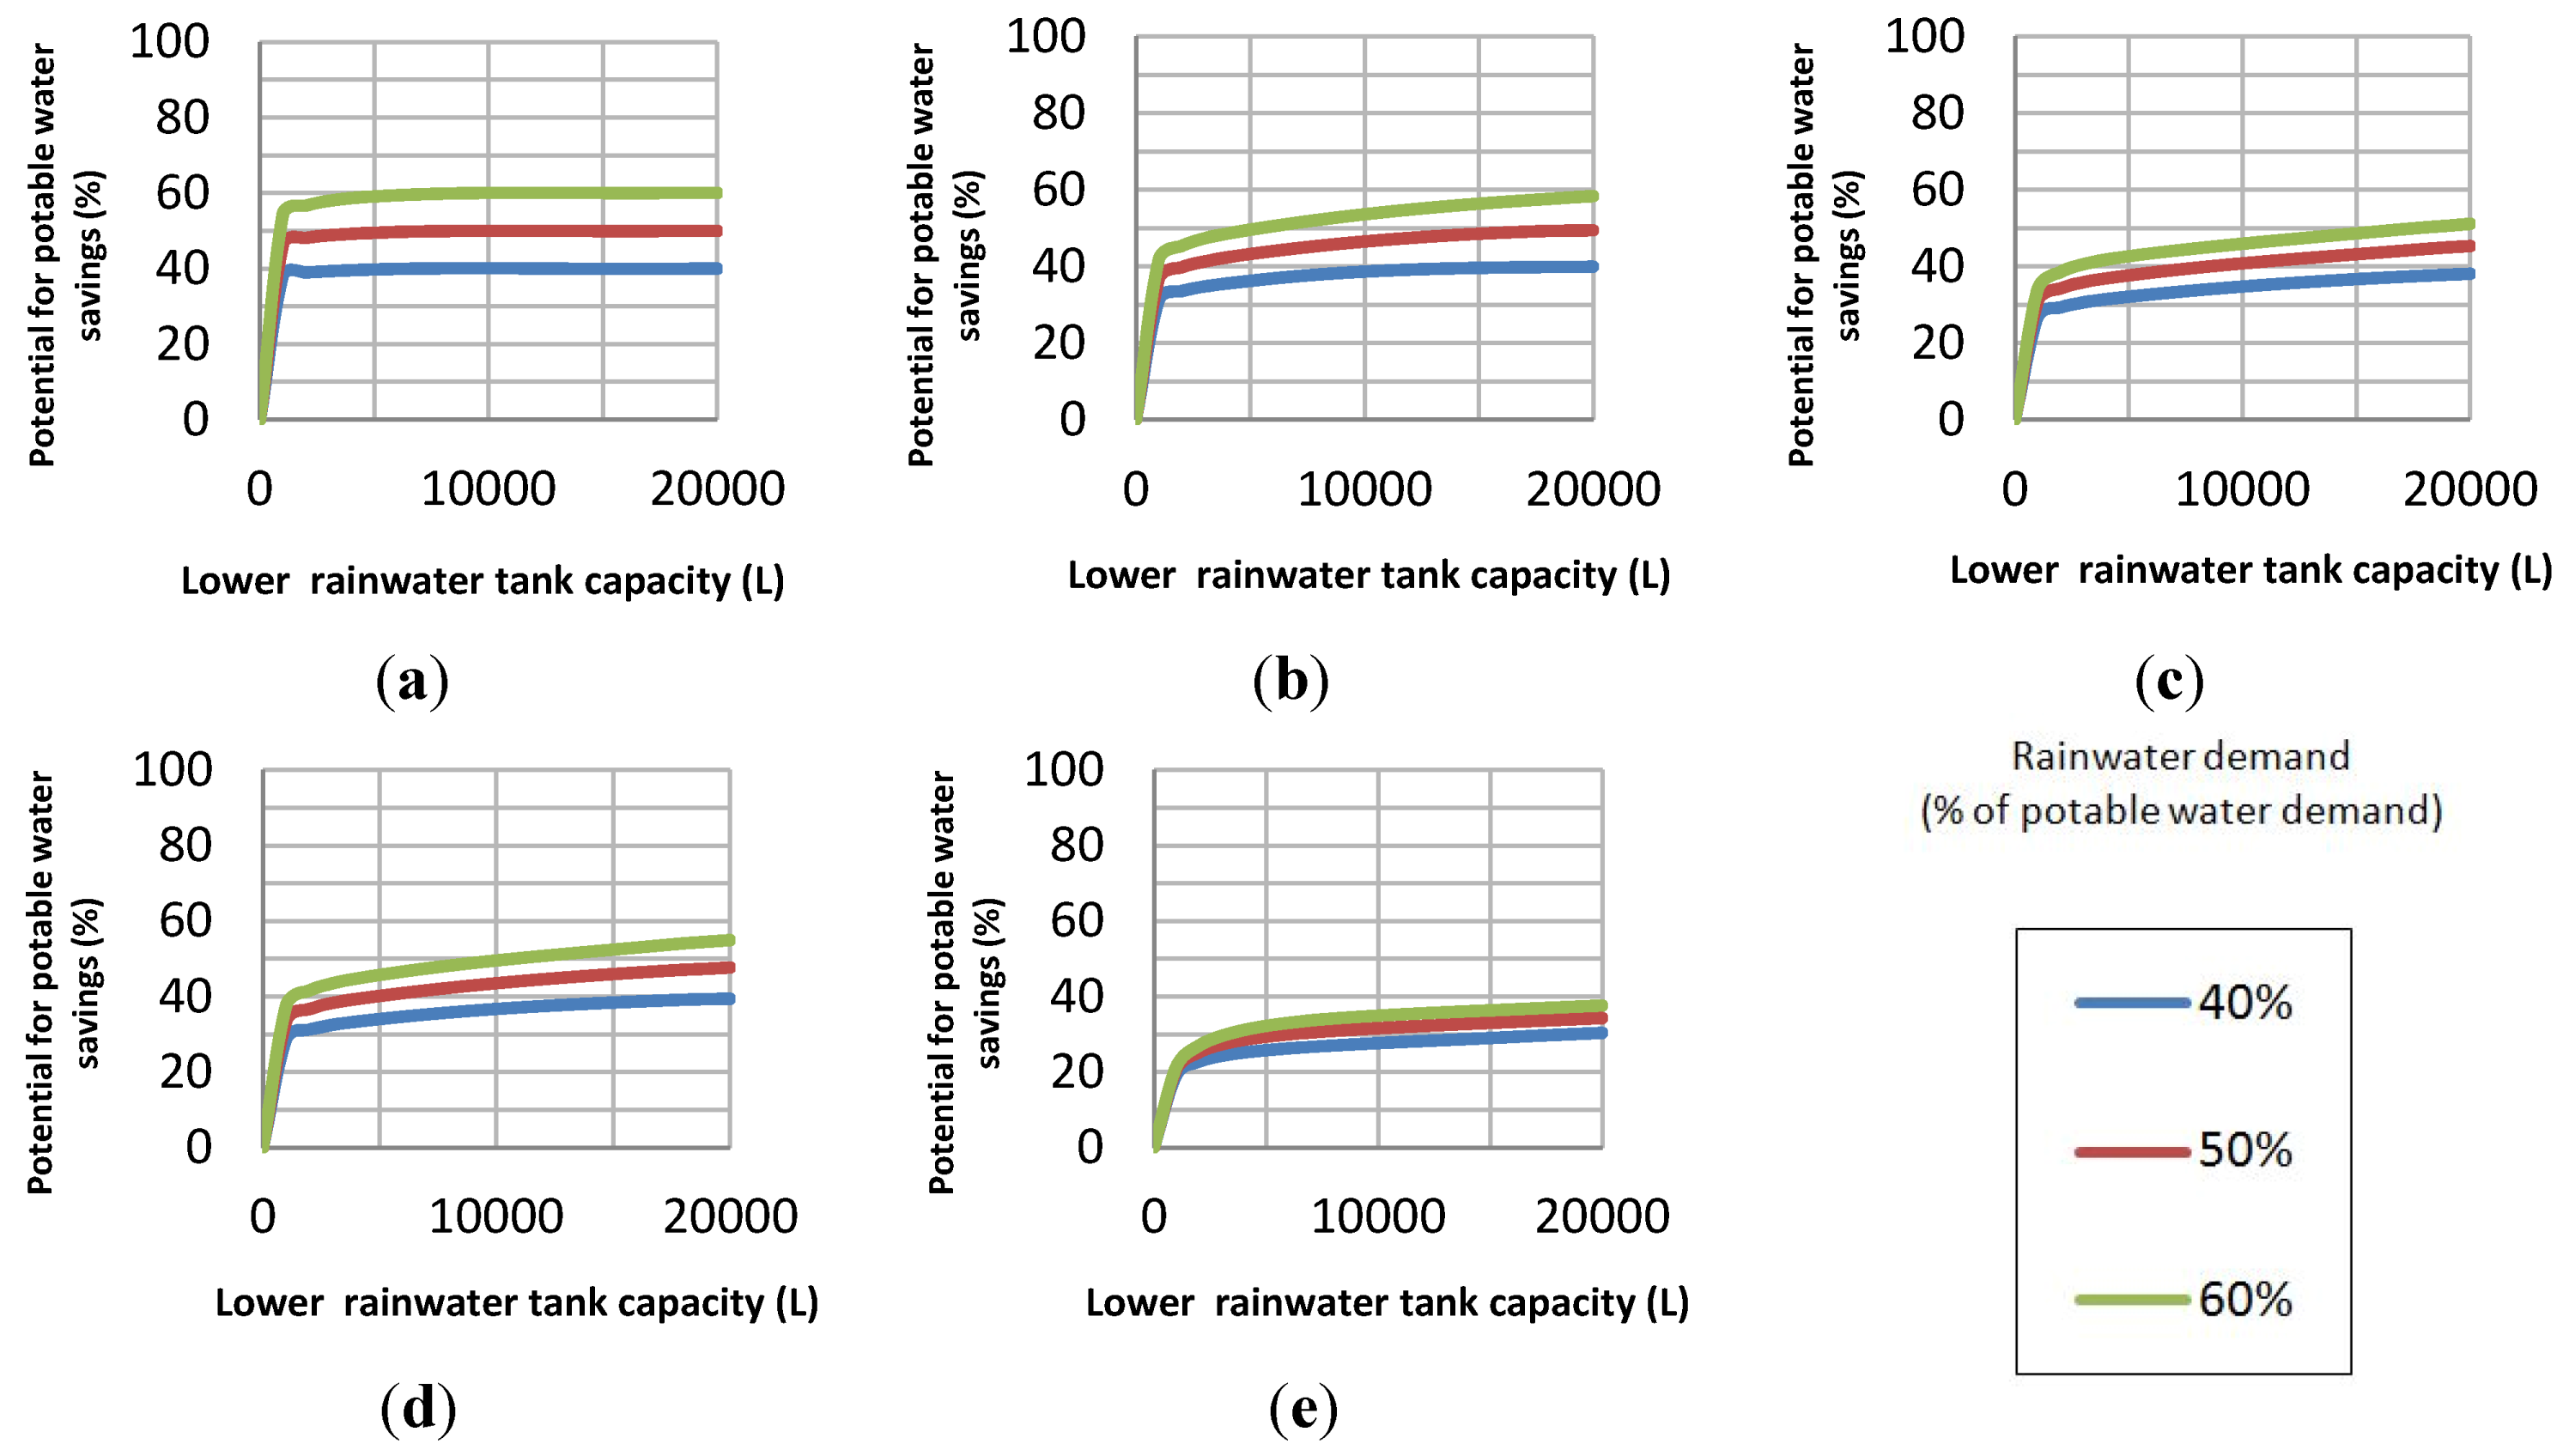
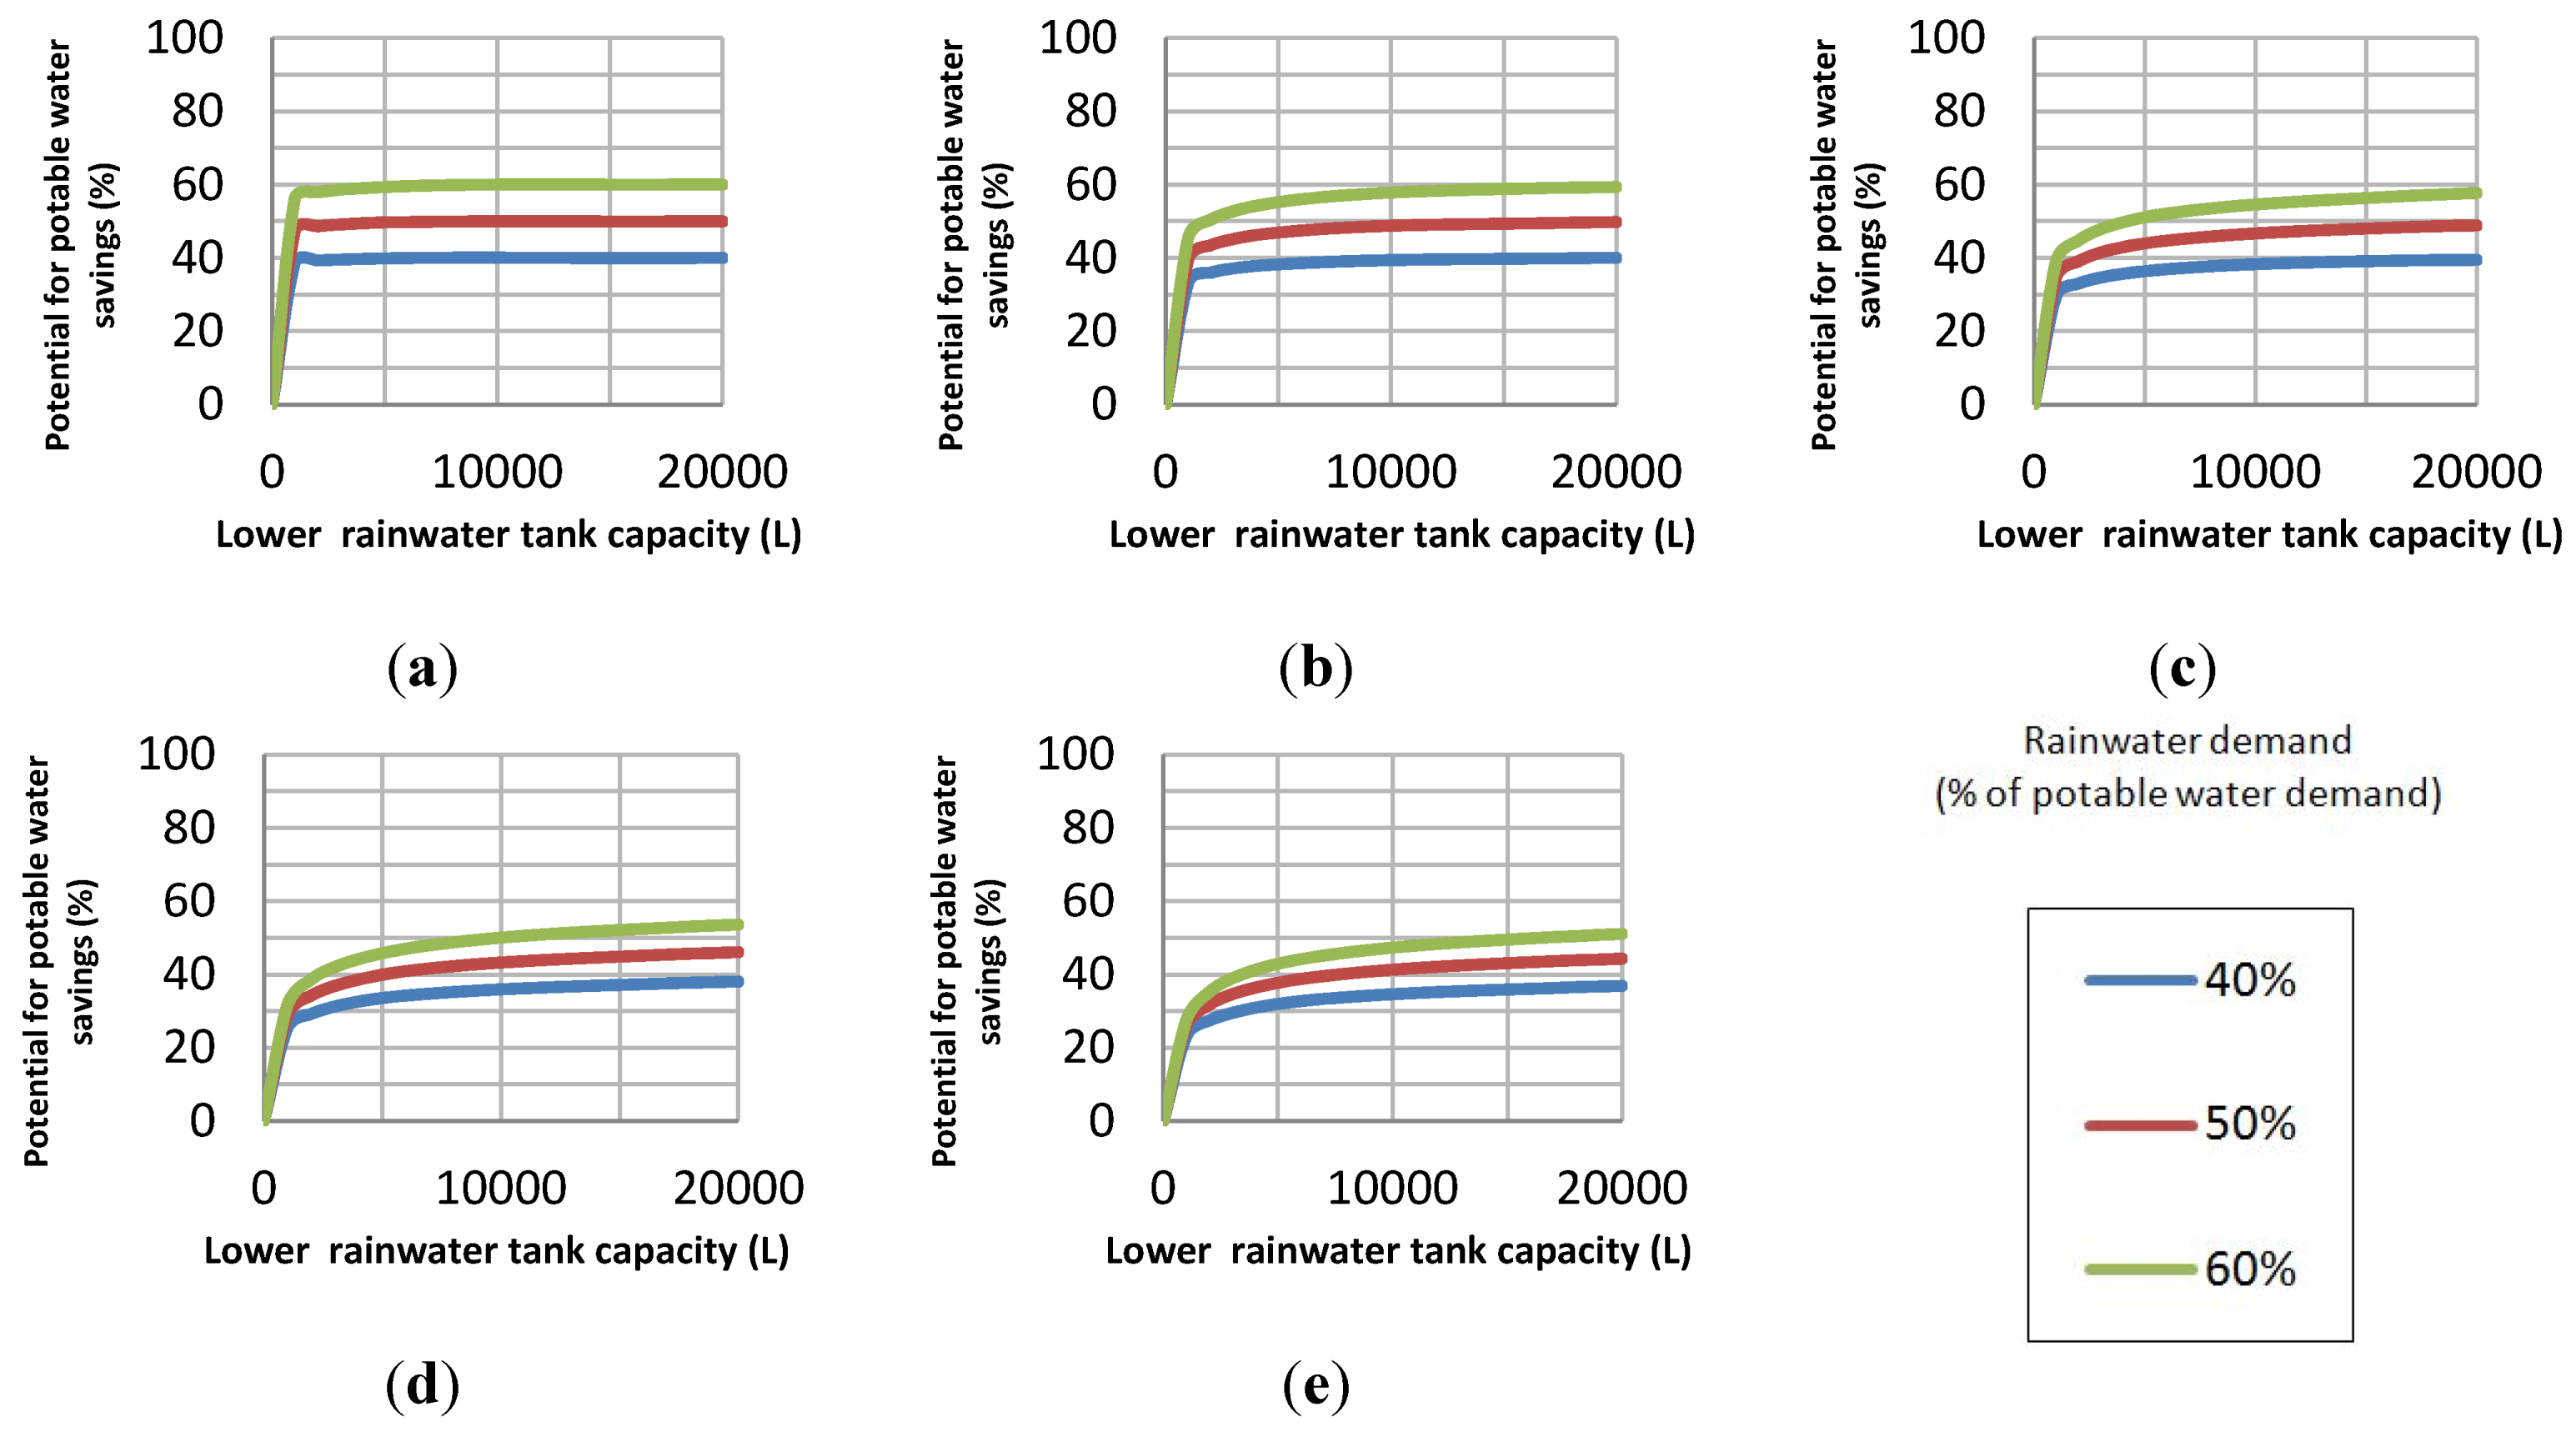
In Figure 8, for Berlin, it can be observed that when the catchment area is small, 100 m2, by increasing the rainwater demand, the potential for potable water savings decreases significantly, since the amount of harvested rainwater does not meet the rainwater demand. With a catchment area of 400 m2 (Figure 9), the potential for potable water savings becomes greater, since the volume of rainwater collected is greatly increased. This is a trend seen in cities with low rainfall, such as Alexandria, Berlin, Barcelona and Paris. For a suitable potential for potable water savings, larger catchment areas are necessary.
With a very high average rainfall, exceeding 2000 mm/year, Santarém has a high potential for potable water savings, as seen in Figure 10 and Figure 11. Thus, the higher and more constant the rainfall is, the greater the potential for potable water savings.
Figure 8.
Potential for potable water savings as a function of lower rainwater tank capacity and potable water demand for Berlin, Germany, for a catchment area of 100 m2 and different potable water demands. (a) 100 L per house per day; (b) 300 L per house per day; (c) 500 L per house per day; (d) 800 L per house per day; (e) 1000 L per house per day.

Figure 9.
Potential for potable water savings as a function of lower rainwater tank capacity and potable water demand for Berlin, Germany, for a catchment area of 400 m2 and different potable water demands. (a) 100 L per house per day; (b) 300 L per house per day; (c) 500 L per house per day; (d) 800 L per house per day; (e) 1000 L per house per day.
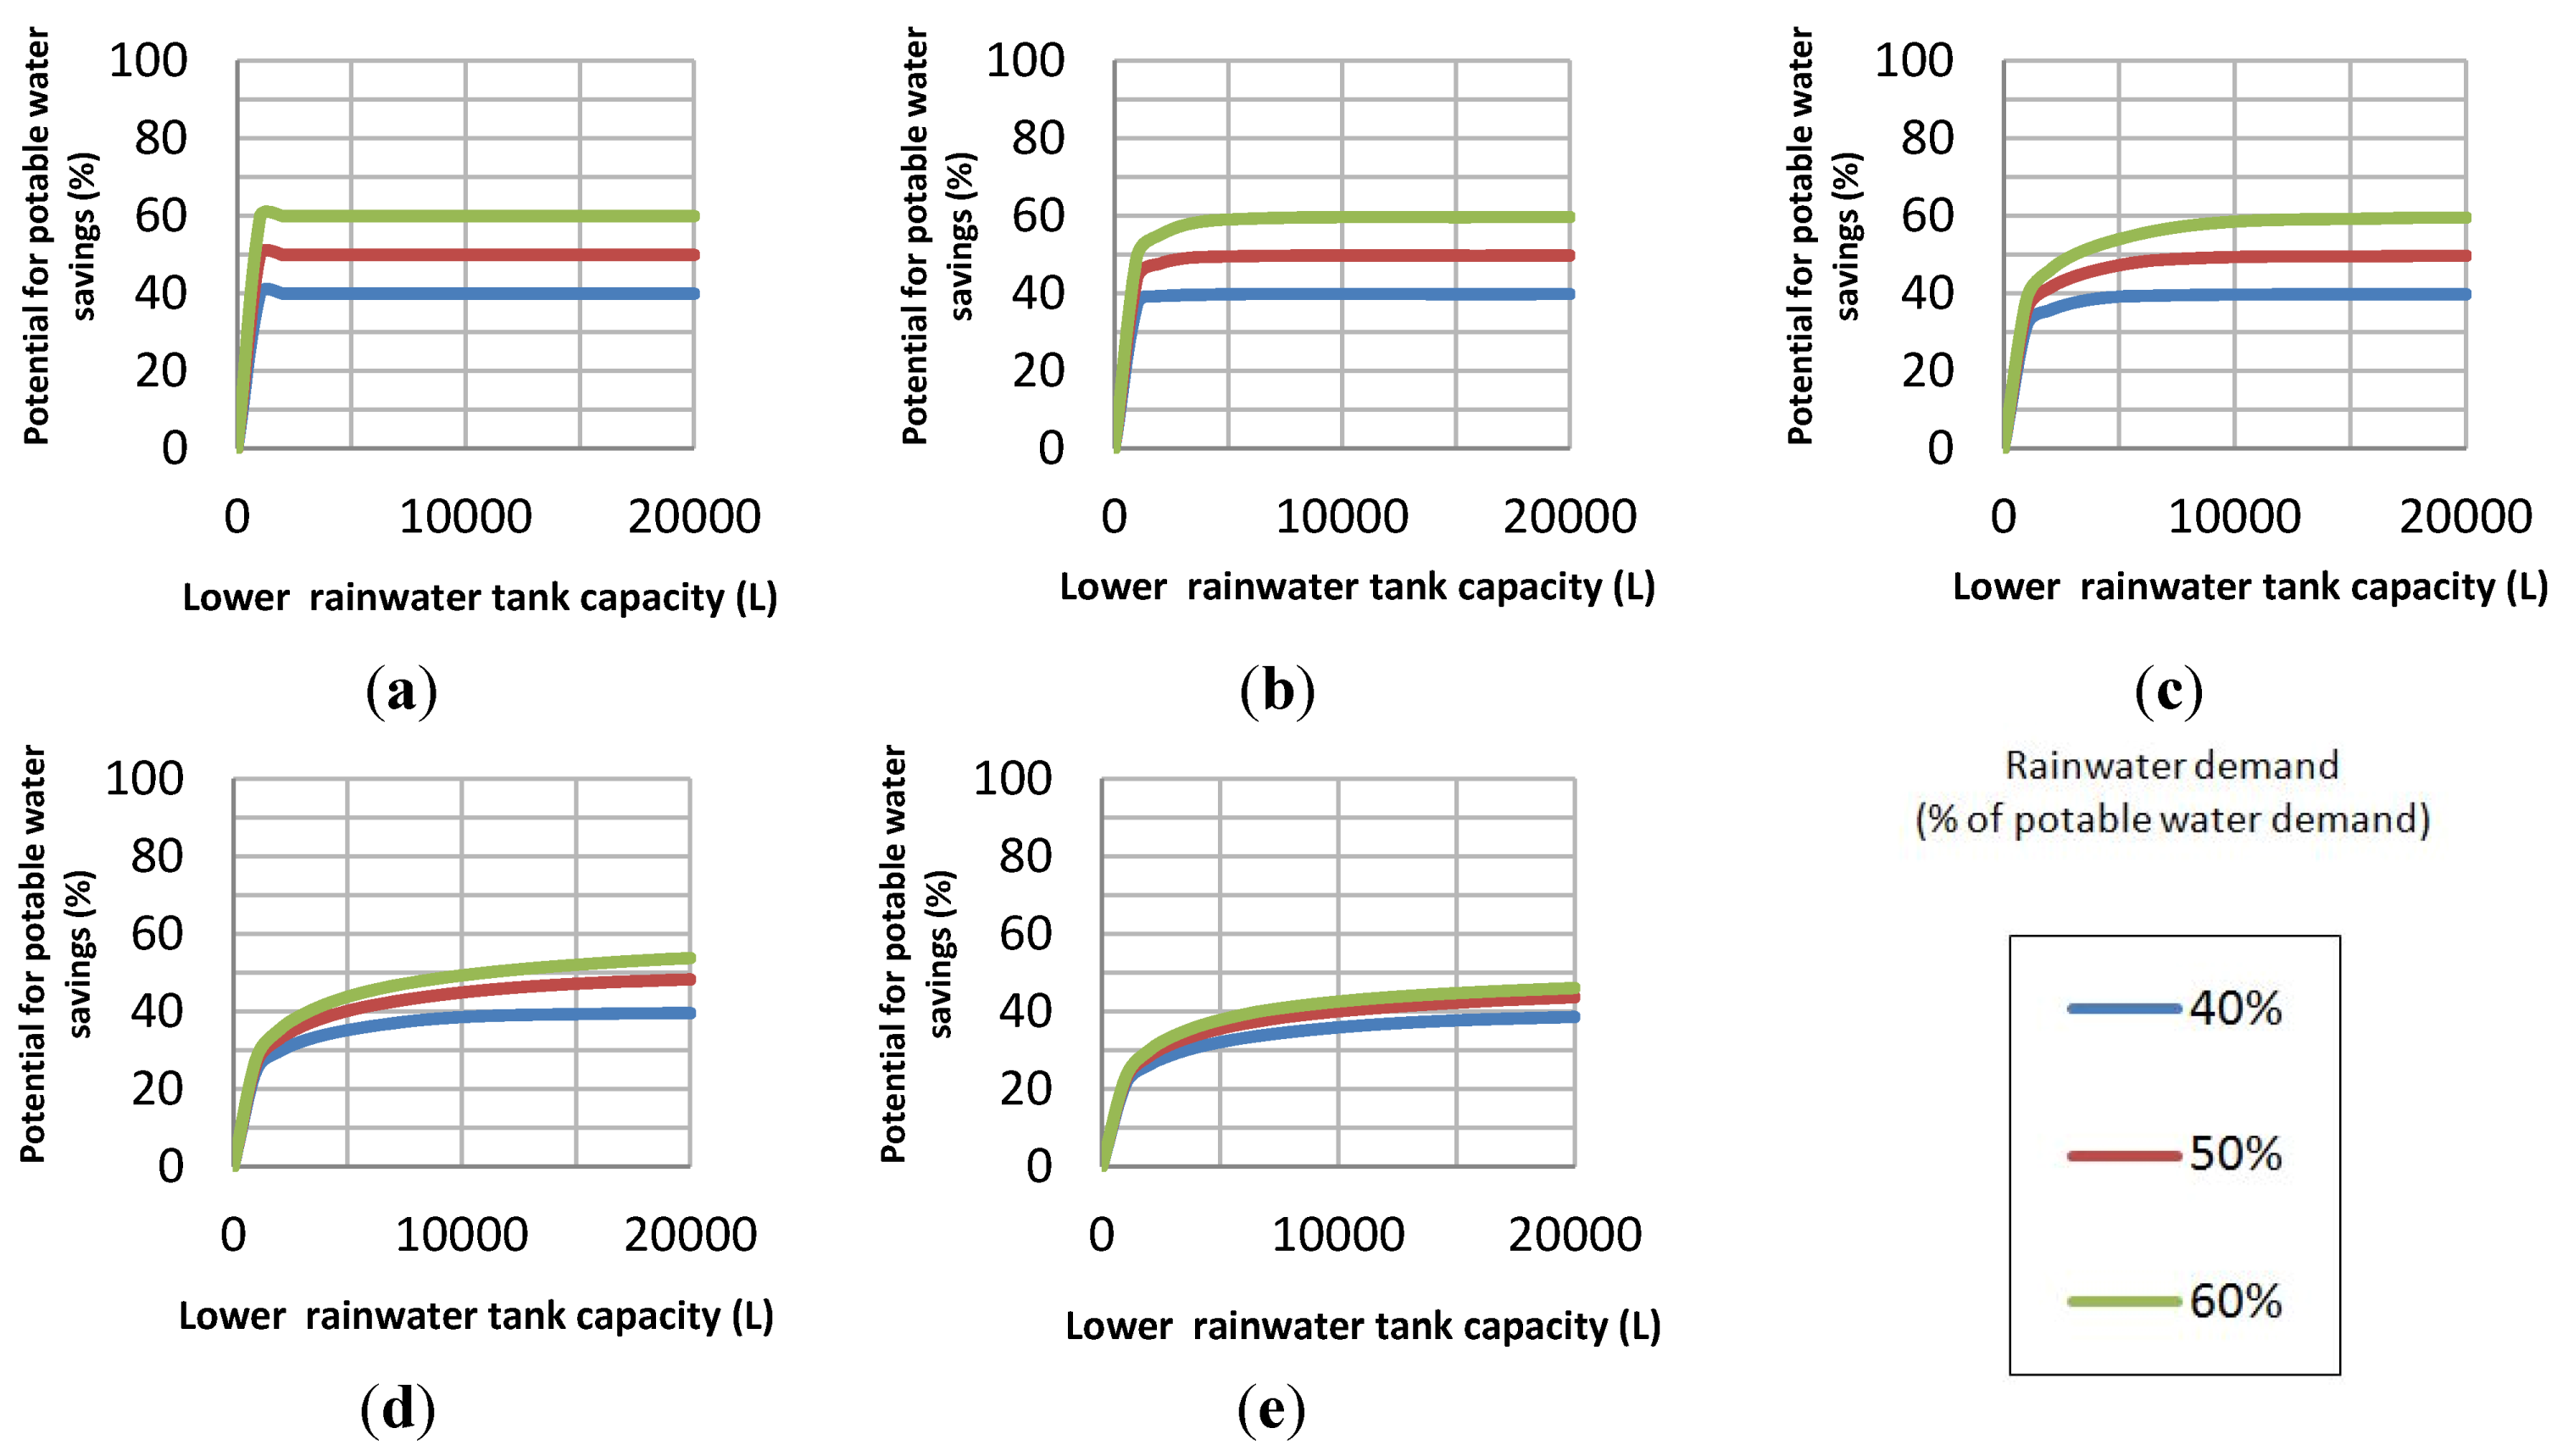
Figure 10.
Potential for potable water savings as a function of lower rainwater tank capacity and potable water demand for Santarém, Brazil, for a catchment area of 100 m2 and different potable water demands. (a) 100 L per house per day; (b) 300 L per house per day; (c) 500 L per house per day; (d) 800 L per house per day; (e) 1000 L per house per day.

Figure 11.
Potential for potable water savings as a function of lower rainwater tank capacity and potable water demand for Santarém, Brazil, for a catchment area of 400 m2 and different potable water demands. (a) 100 L per house per day; (b) 300 L per house per day; (c) 500 L per house per day; (d) 800 L per house per day; (e) 1000 L per house per day.

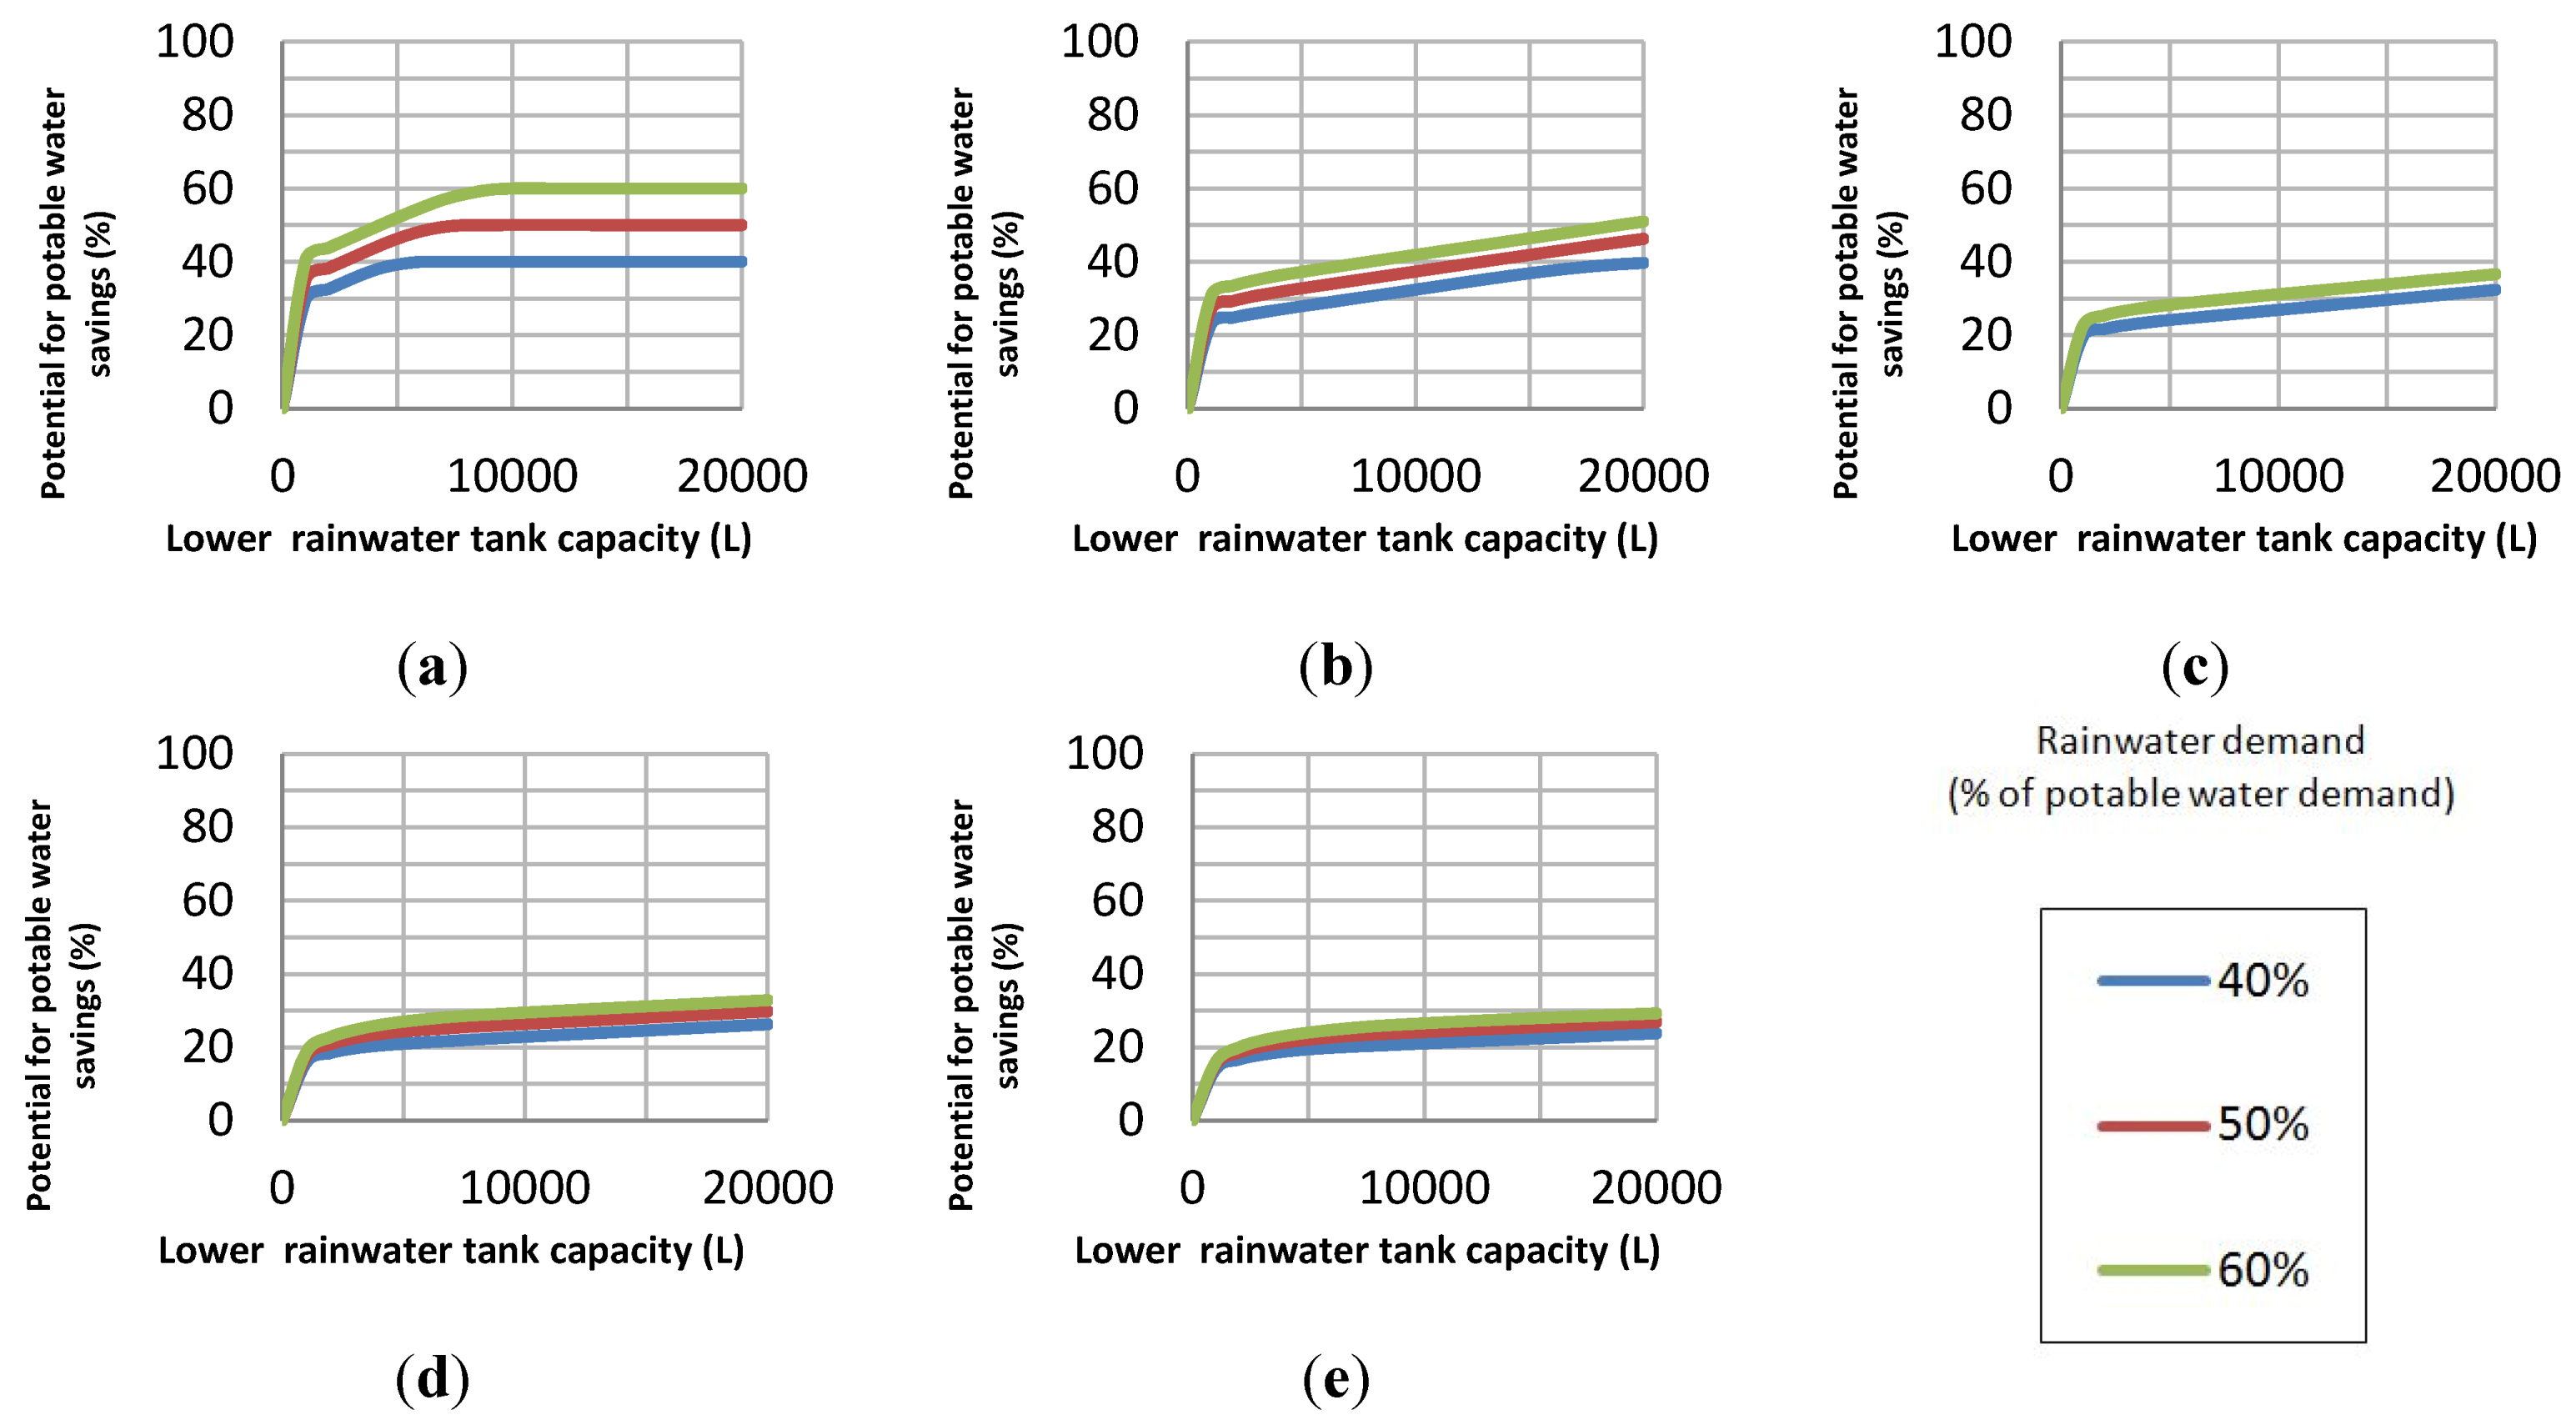
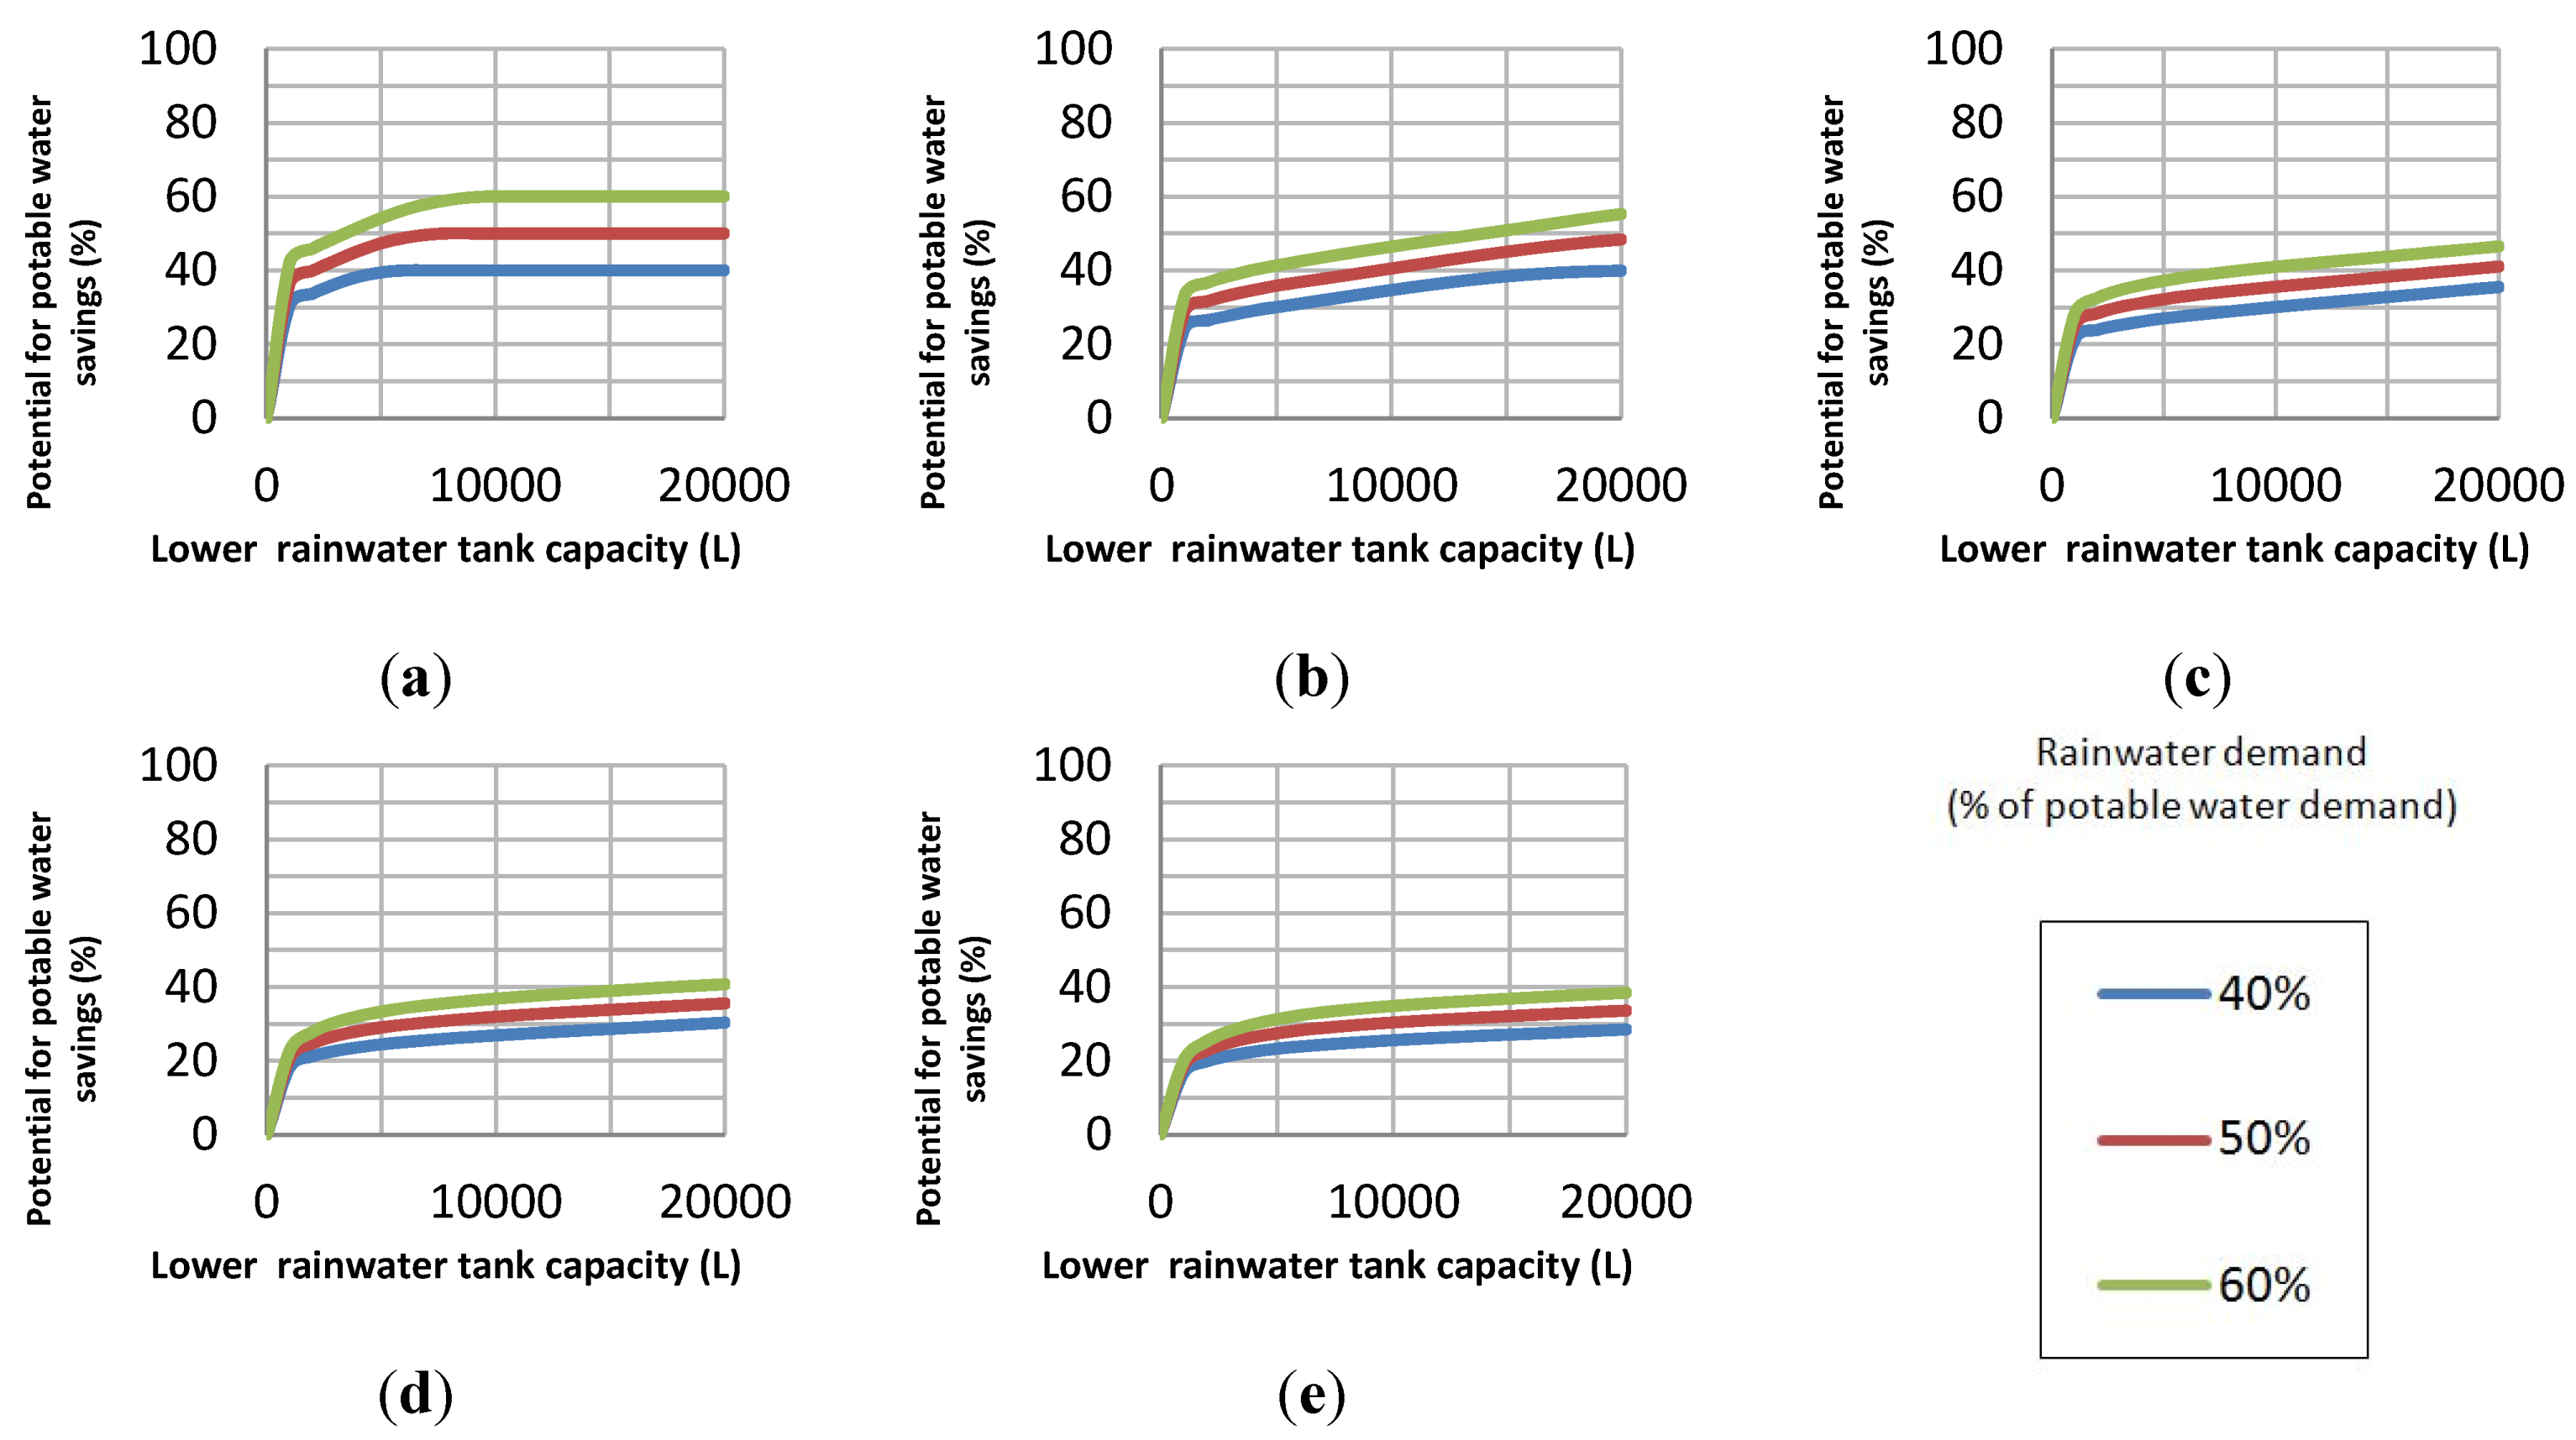
In the city of Darwin (Figure 12 and Figure 13), the potential for potable water savings has a different trend. This city has high rainfall in the summer and very low in the winter. Thus, the increase in the potential for potable water savings as the tank capacities increase by 1000 L is significant. Another city where there is a similar situation is Shanwei.
In general, it can be observed that the potential for potable water savings ranges more significantly amongst the cities when the catchment surface area is small. Imteaz [26] studied this issue and states that for smaller roofs, there is a threshold to the tank capacities, and even when increasing the tank size, the ability of the tank to supply the demand required, which he calls the reliability, will not increase. In this case, the amount of rain collected from the roof will be used fast and the tank will remain empty until a new rainfall event takes place.
Figure 12.
Potential for potable water savings as a function of lower rainwater tank capacity and potable water demand for Darwin, Australia, for a catchment area of 100 m2 and different potable water demands. (a) 100 L per house per day; (b) 300 L per house per day; (c) 500 L per house per day; (d) 800 L per house per day; (e) 1000 L per house per day.

Figure 13.
Potential for potable water savings as a function of lower rainwater tank capacity and potable water demand for Darwin, Australia, for a catchment area of 400 m2 and different potable water demands. (a) 100 L per house per day; (b) 300 L per house per day; (c) 500 L per house per day; (d) 800 L per house per day; (e) 1000 L per house per day.
4.2.2. Rainwater Tank Capacity
In order to compare the lower rainwater tank capacities with the potable water demand the same three cities were used, i.e., Berlin, Santarém and Darwin, with catchment areas of 100 m2 and 400 m2, and rainwater demand ranging from 0 to 100% of the potable water demand. Figure 14–Figure 16 show tank capacities as a function of rainwater demand.
It can be observed that the city of Berlin needs the smaller tank capacities (Figure 14). This occurs because rainfall in Berlin is as low as 585 mm per year. Thus, the rainwater tank does not need to be too large, even though the rainwater demand is not reached in most cases.
In Santarém, where rainfall is as high as 2199 mm per year, the tank capacities vary almost linearly, increasing with the increase in the rainwater demand (Figure 15). This trend is not observed in Darwin, Australia.
Figure 14.
Rainwater tank capacity as a function of rainwater demand, catchment surface area, and number of people per house in Berlin, Germany. (a) 100 m2 and two people; (b) 100 m2 and four people; (c) 400 m2 and two people; (d) 400 m2 and four people.
Figure 14.
Rainwater tank capacity as a function of rainwater demand, catchment surface area, and number of people per house in Berlin, Germany. (a) 100 m2 and two people; (b) 100 m2 and four people; (c) 400 m2 and two people; (d) 400 m2 and four people.

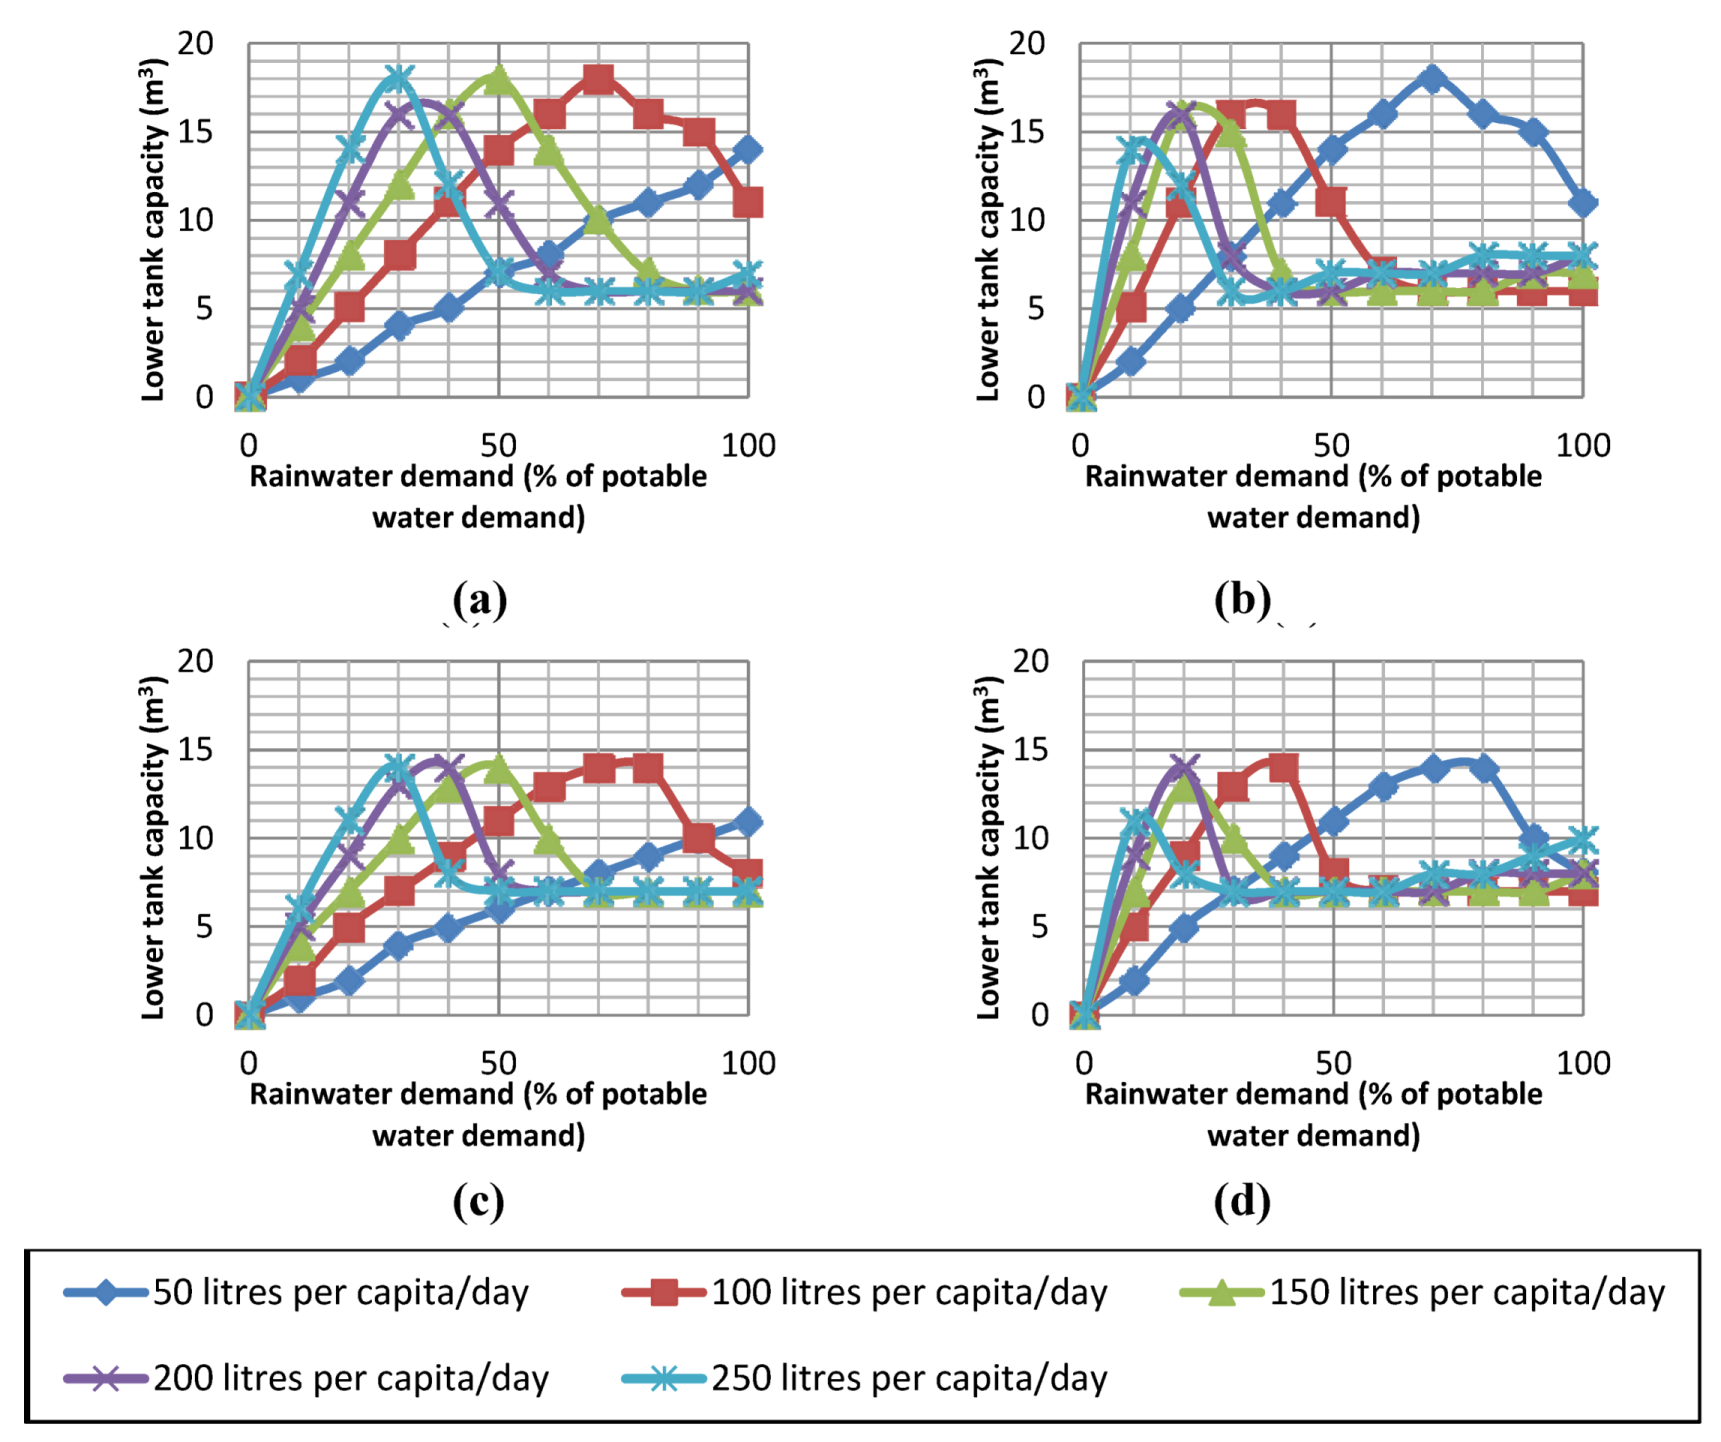
As seen previously in Figure 12 and Figure 13, Darwin has a relatively low potential for potable water savings due to its well-defined periods of drought (although its rainfall is as high as 1839 mm per year). Figure 16 shows the tank capacity as a function of rainwater demand for Darwin. A different behavior can be noticed, since the tank capacity ranges significantly; it can be as large as 18,000 L for lower rainwater demands, and then the capacity decreases as the rainwater demand increases.
Figure 15.
Rainwater tank capacity as a function of rainwater demand, catchment surface area, and number of people per house in Santarém, Brazil. (a) 100 m2 and two people; (b) 100 m2 and four people; (c) 400 m2 and two people; (d) 400 m2 and four people.
Figure 15.
Rainwater tank capacity as a function of rainwater demand, catchment surface area, and number of people per house in Santarém, Brazil. (a) 100 m2 and two people; (b) 100 m2 and four people; (c) 400 m2 and two people; (d) 400 m2 and four people.
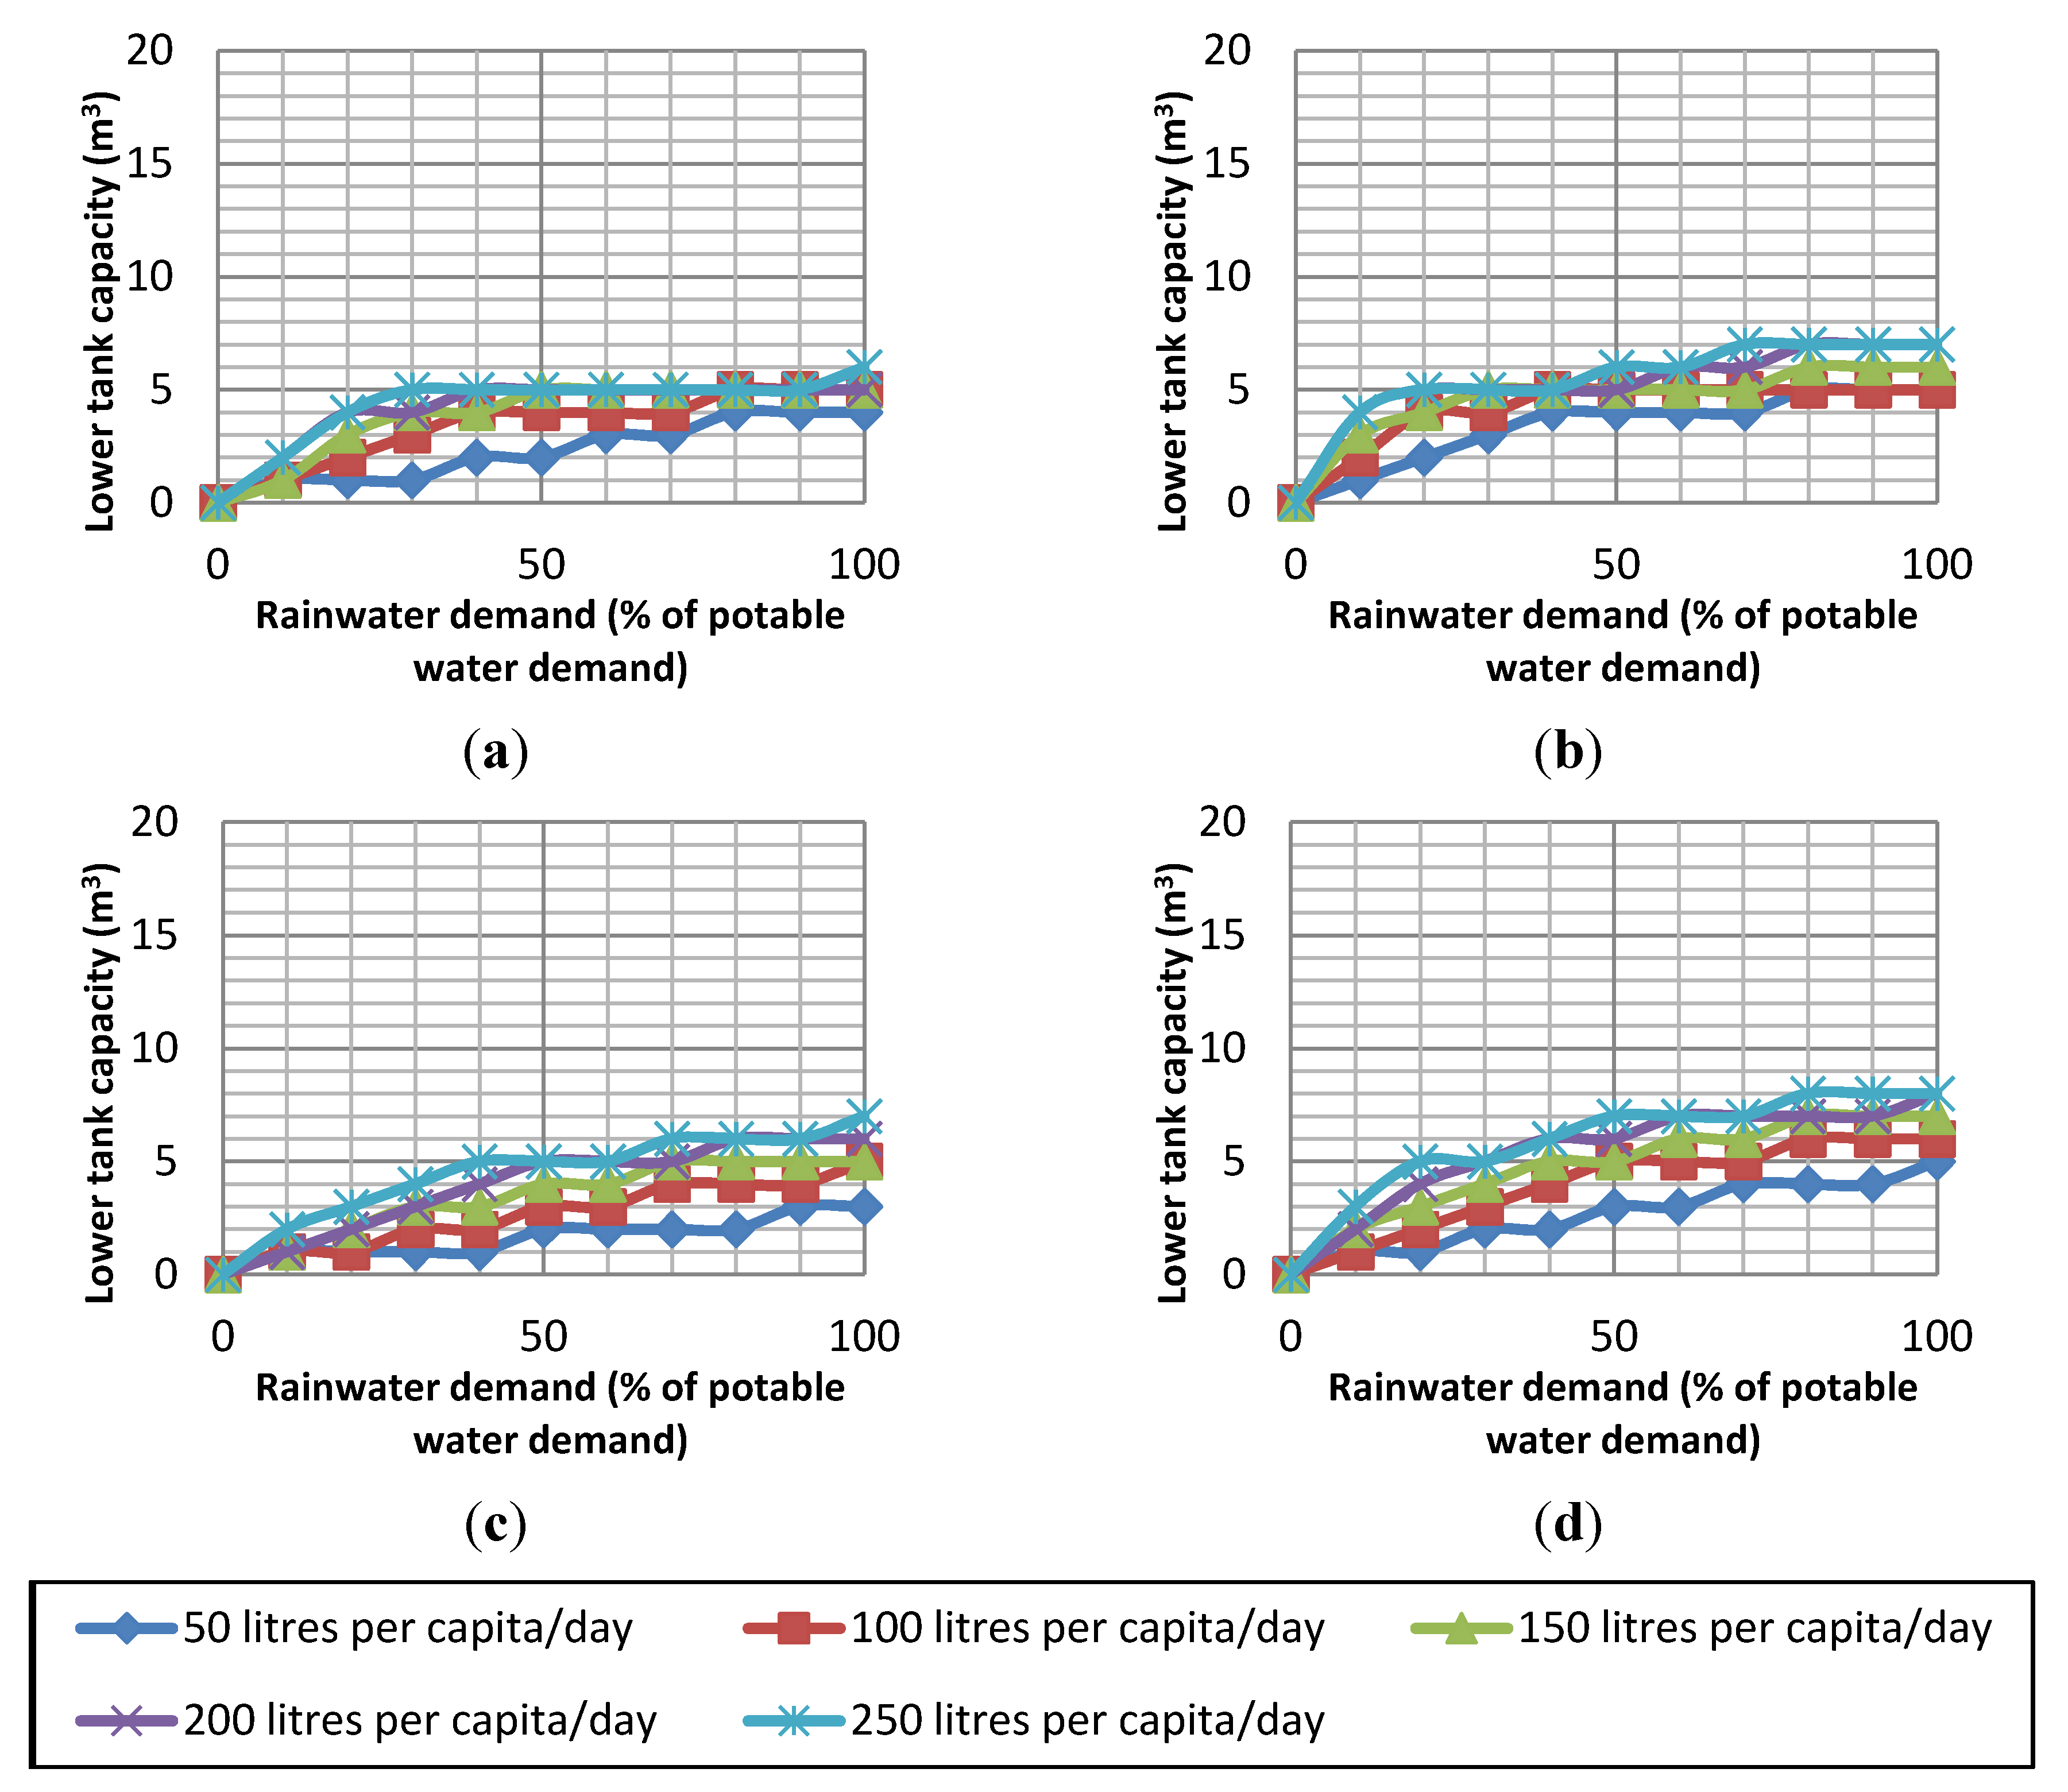
Figure 16.
Rainwater tank capacity as a function of rainwater demand, catchment surface area, and number of people per house in Darwin, Australia. (a) 100 m2 and two people; (b) 100 m2 and four people; (c) 400 m2 and two people; (d) 400 m2 and four people.
Figure 16.
Rainwater tank capacity as a function of rainwater demand, catchment surface area, and number of people per house in Darwin, Australia. (a) 100 m2 and two people; (b) 100 m2 and four people; (c) 400 m2 and two people; (d) 400 m2 and four people.
4.3. Correlations
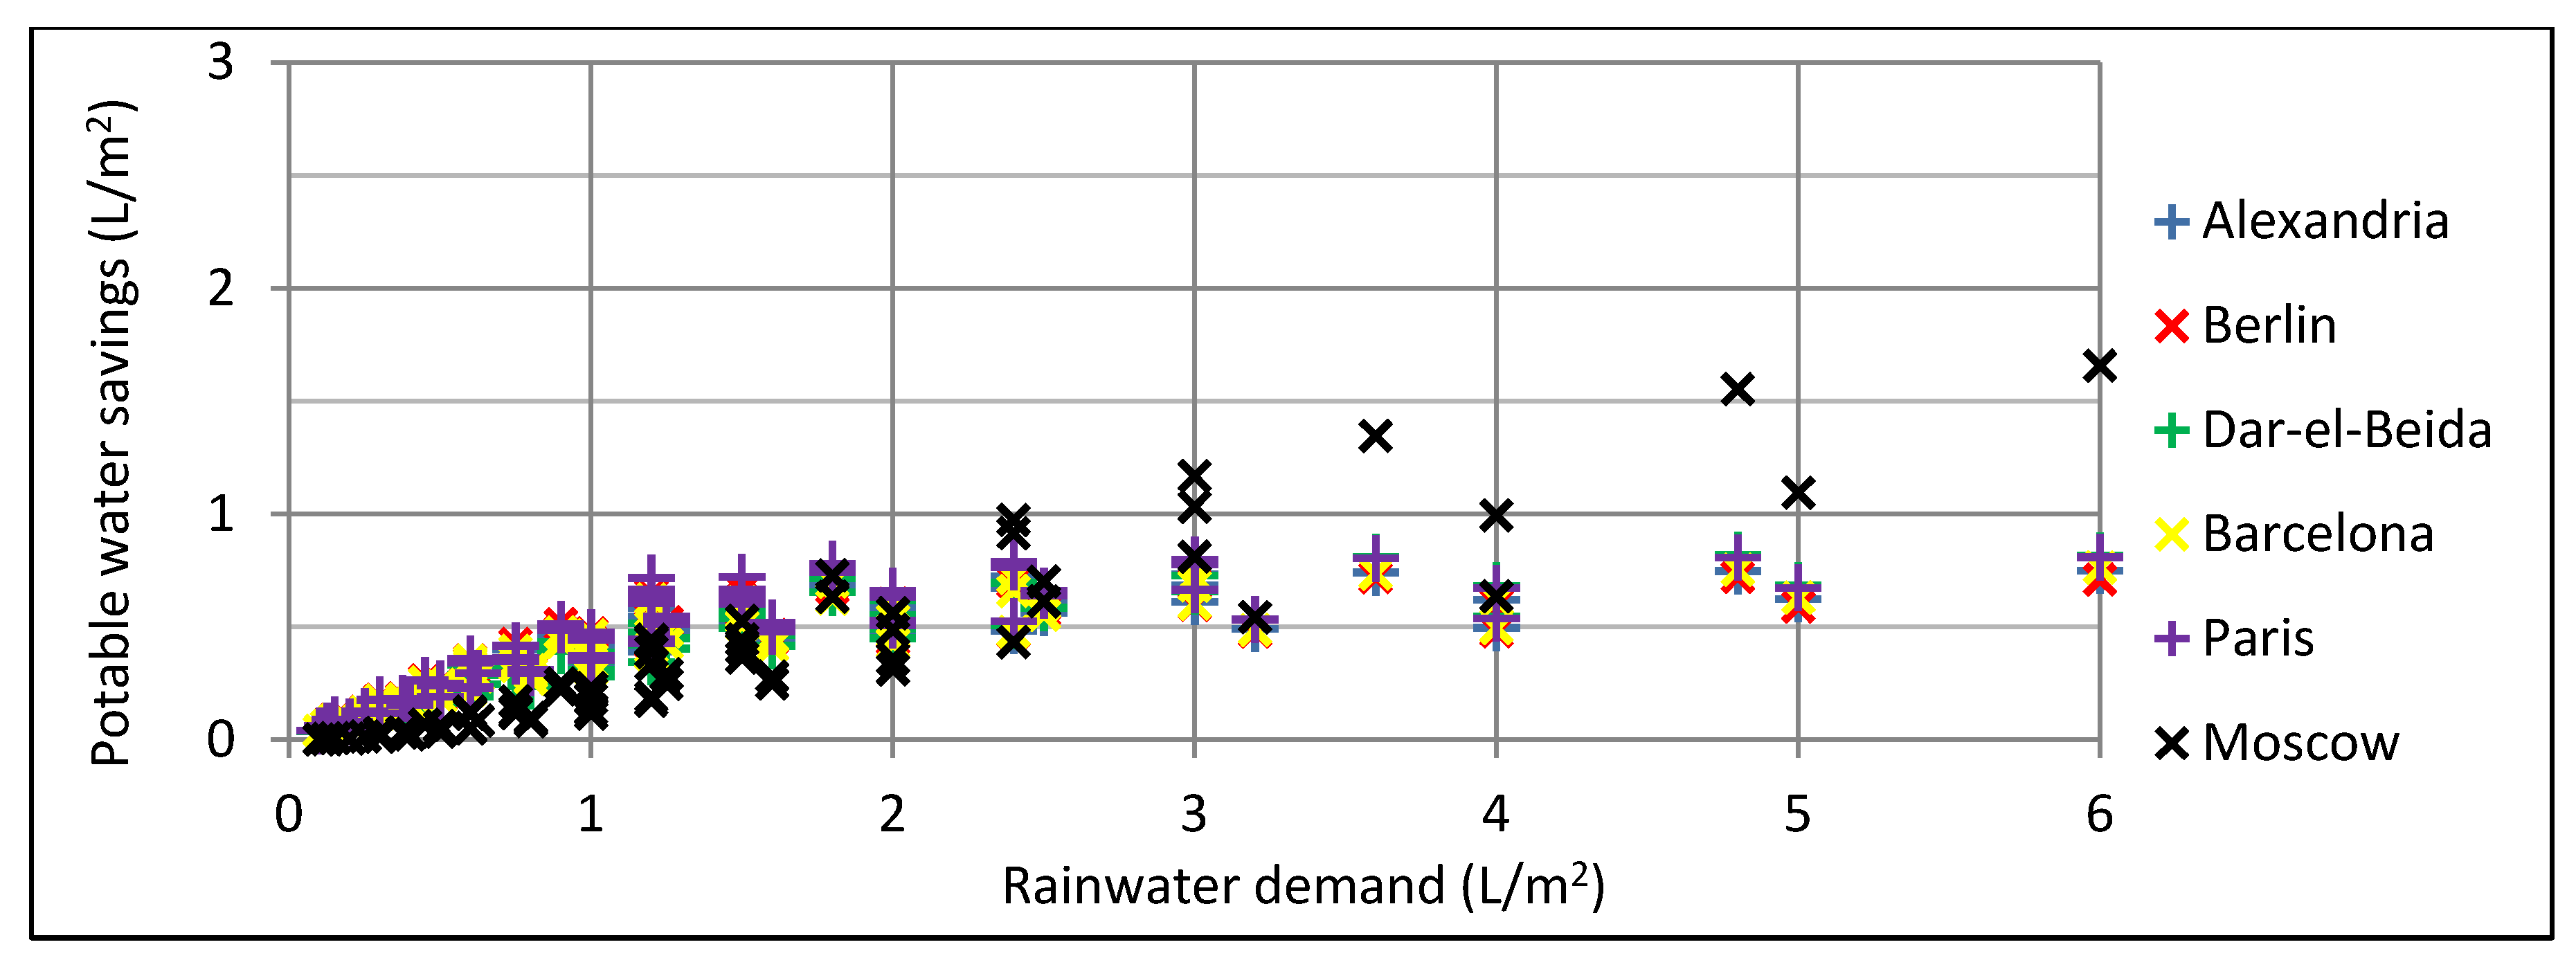
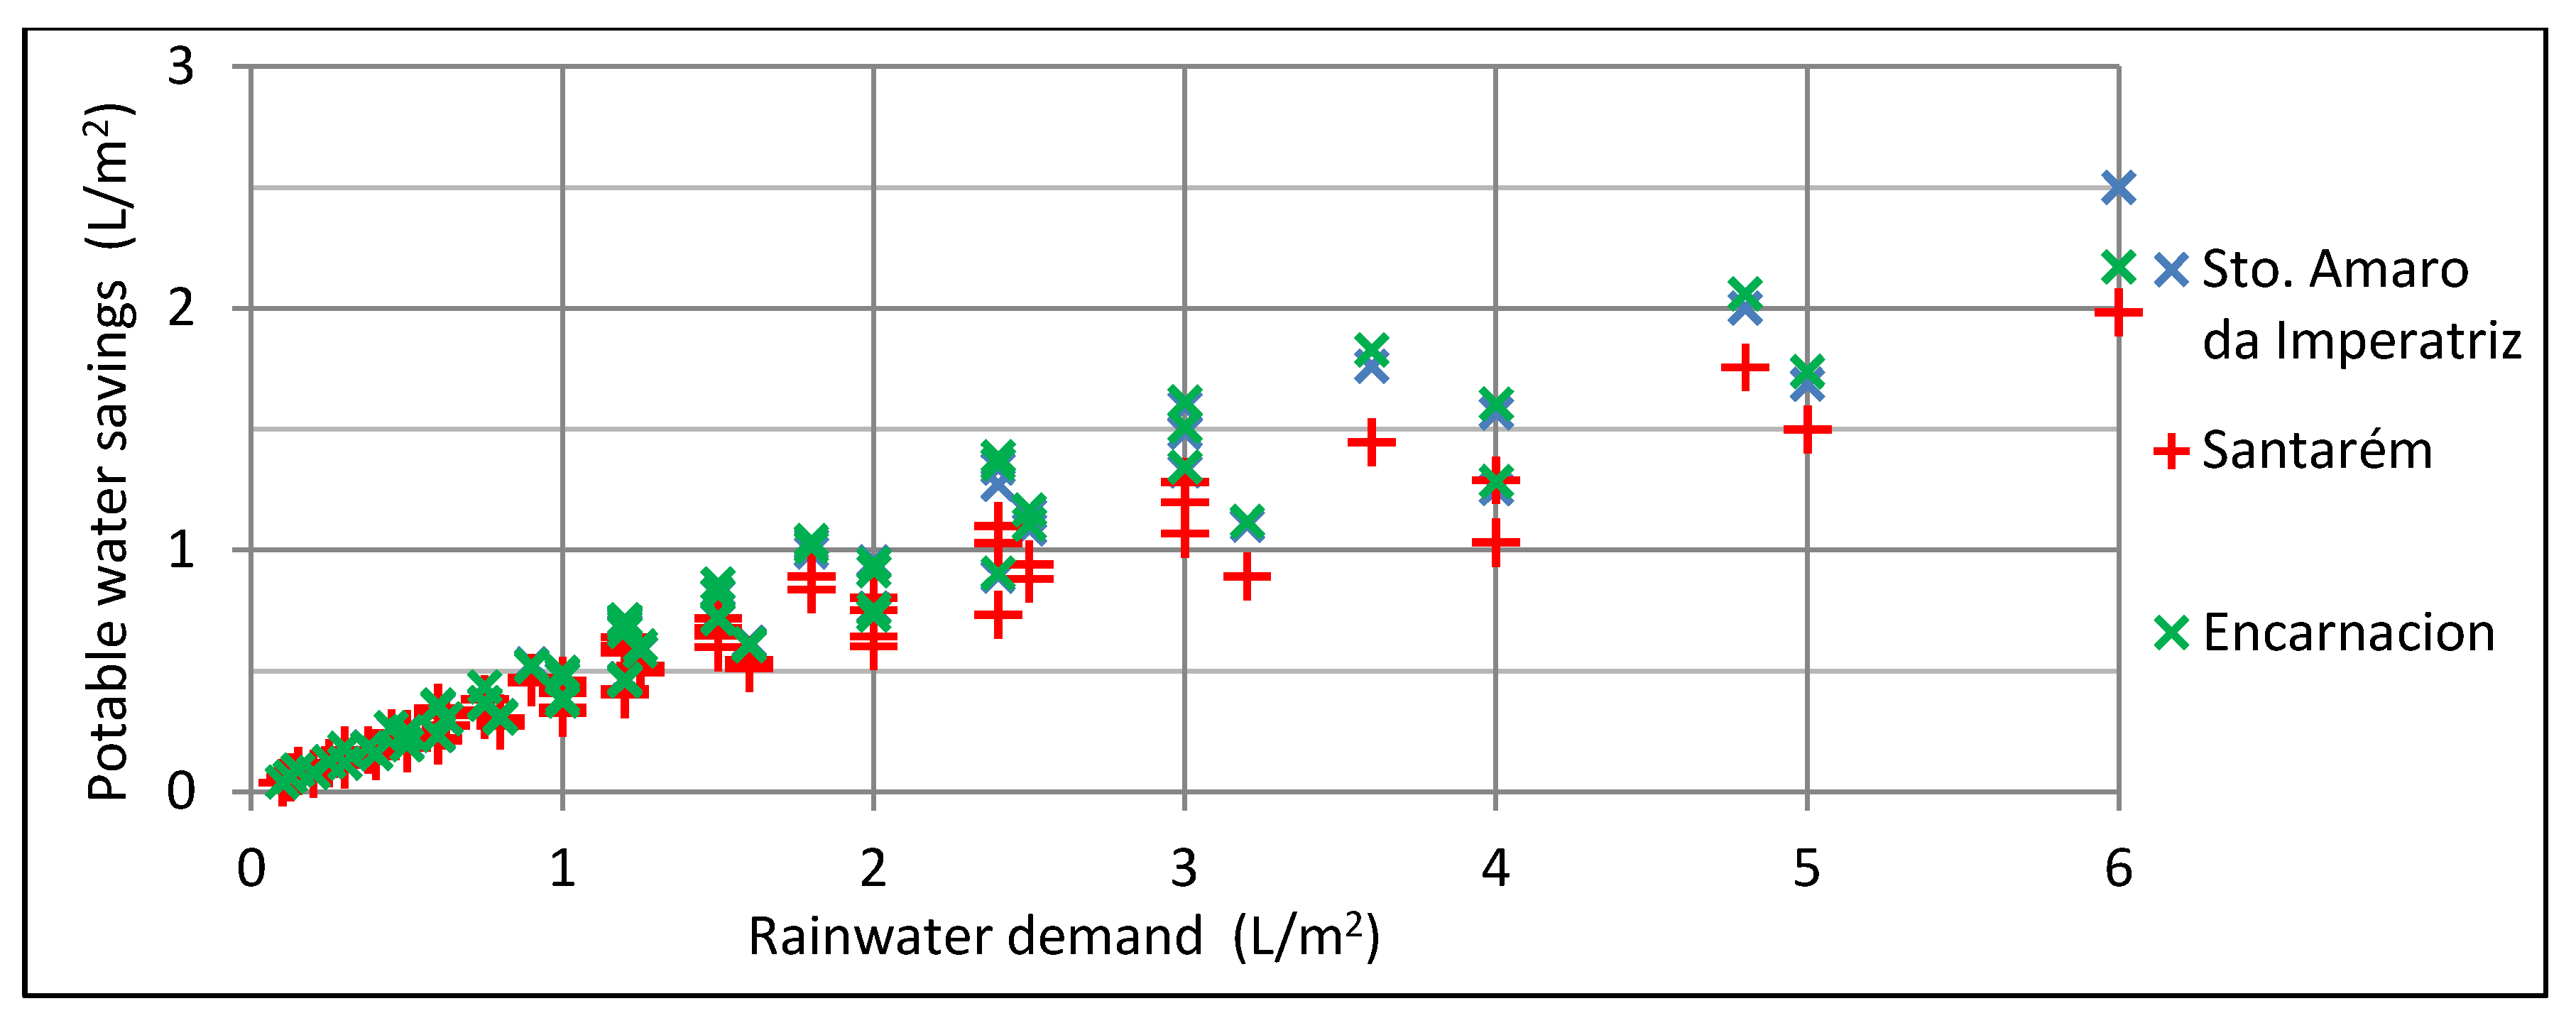
In order to get some more conclusive results from the simulations, correlations between rainwater demand as a function of catchment area and potable water savings were studied. Figure 17–Figure 20 present the results; and for a better understanding, cities with similar annual rainfall were grouped together. The potable water savings are also shown in L/m2 of catchment area. This was done dividing the demands of potable water per residence (100, 200, 300, 400, 500, 600, 800 and 1000 L) by the catchment areas (100, 200 and 400m2).
In Figure 17, it is possible to see that cities with an average rainfall lower than 700 mm per year have the lowest potential for potable water savings when there is high demand for rainwater. This is because these cities cannot supply high demands due to low rainfall. The city of Moscow presents a different behavior, as the potable water savings are higher for greater rainwater demands. This is due to the fact that this city has a good distribution of rainfall all over the year. On the other hand, the highest savings for high rainwater demands occur in the cities located in South America—Santarém, Santo Amaro da Imperatriz, Encarnacion—shown in Figure 20, which also had the greatest average rainfall. In most cities, the potential for potable water savings vary in a linear fashion, with a constant growth (Figure 18–Figure 20). In other cities, Figure 17, where the average rainfall is low, potable water savings tend to increase, and then become constant. In conclusion, it is seen that for low rainwater demands, i.e., 1 and 2 L/m2, the cities with the greater potential for potable water savings are not the cities with the highest average annual rainfall, but those with more constant rainfall throughout the year, although the differences are small. When the demand increases more than 4 L/m2, the potential for potable water savings just keeps increasing in cities shown in Figure 20, since they are the ones that can supply such demands.
Table 3 shows comparisons between minimum and maximum rainwater tank capacities according to the rainwater demand per catchment area for all cities. It can be seen again that the city with the largest lower tank capacities is Darwin, Australia. The city of Quebec, which has an annual average rainfall not as high but well distributed, has the smallest capacities. This trend is observed in all cities. When there is drought, the lower tank capacities are larger. When rainfall is constant, the capacities are smaller. In brief, there is no correlation between annual rainfall and tank capacity.
Figure 17.
Correlation between potable water savings per catchment area and rainwater demand per catchment area for cities with annual rainfall up to 700 mm/year.
Figure 17.
Correlation between potable water savings per catchment area and rainwater demand per catchment area for cities with annual rainfall up to 700 mm/year.

Figure 18.
Correlation between potable water savings per catchment area and rainwater demand per catchment area for cities with annual rainfall ranging from 701 mm/year to 1500 mm/year.
Figure 18.
Correlation between potable water savings per catchment area and rainwater demand per catchment area for cities with annual rainfall ranging from 701 mm/year to 1500 mm/year.
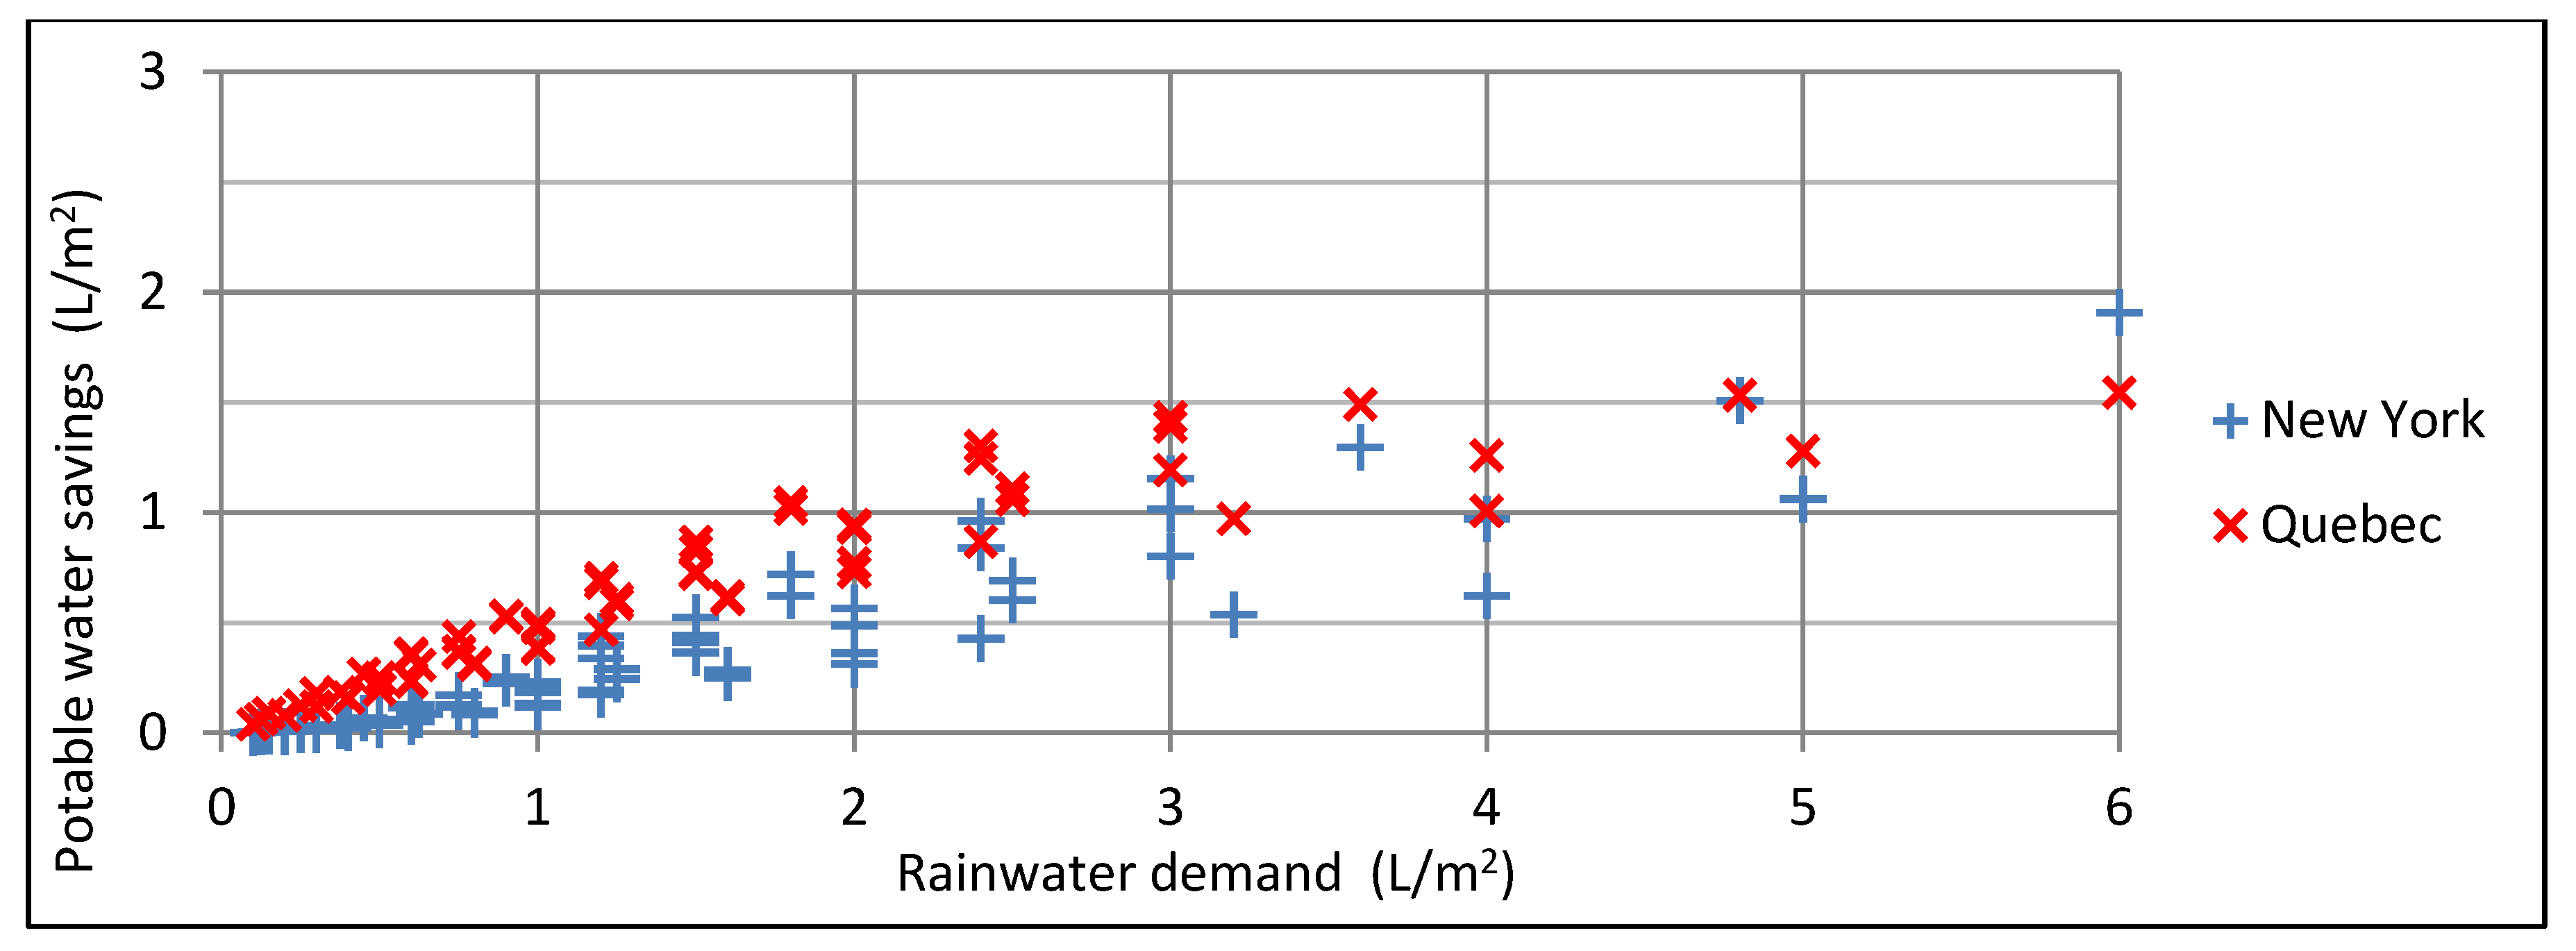
Figure 19.
Correlation between potable water savings per catchment area and rainwater demand per catchment area for cities with annual rainfall greater than 1500 mm/year with periods of drought.
Figure 19.
Correlation between potable water savings per catchment area and rainwater demand per catchment area for cities with annual rainfall greater than 1500 mm/year with periods of drought.

Figure 20.
Correlation between potable water savings per catchment area and rainwater demand per catchment area for cities with annual rainfall greater than 1500 mm/year.
Figure 20.
Correlation between potable water savings per catchment area and rainwater demand per catchment area for cities with annual rainfall greater than 1500 mm/year.

Table 3.
Comparison between rainwater demand per catchment area and lower rainwater tank capacity for all cities.
| City | Average rainfall (mm/year) | Lower rainwater tank capacity (m3) | ||||||
| Minimum and maximum capacity | Rainwater demand (L/m2) | |||||||
| 1 | 2 | 3 | 4 | 5 | 6 | |||
| Berlin | 585 | minimum | 3 | 3 | 3 | 3 | 2 | 2 |
| maximum | 8 | 5 | 4 | 3 | 2 | 2 | ||
| Alexandria | 591 | minimum | 5 | 6 | 6 | 6 | 6 | 6 |
| maximum | 11 | 9 | 8 | 6 | 6 | 6 | ||
| Barcelona | 634 | minimum | 7 | 8 | 6 | 6 | 6 | 6 |
| maximum | 12 | 9 | 9 | 6 | 6 | 6 | ||
| Paris | 650 | minimum | 3 | 4 | 3 | 3 | 3 | 3 |
| maximum | 8 | 6 | 5 | 3 | 3 | 3 | ||
| Dar-el-Beida | 654 | minimum | 8 | 8 | 7 | 7 | 6 | 5 |
| maximum | 10 | 10 | 9 | 7 | 6 | 5 | ||
| Moscow | 683 | minimum | 4 | 4 | 3 | 3 | 3 | 3 |
| maximum | 6 | 4 | 5 | 3 | 3 | 3 | ||
| Quebec | 1219 | minimum | 1 | 3 | 4 | 4 | 4 | 4 |
| maximum | 4 | 6 | 7 | 4 | 4 | 4 | ||
| New York | 1265 | minimum | 2 | 4 | 6 | 6 | 5 | 5 |
| maximum | 6 | 7 | 9 | 6 | 5 | 5 | ||
| Darwin | 1839 | minimum | 7 | 6 | 6 | 6 | 7 | 7 |
| maximum | 14 | 12 | 7 | 6 | 7 | 7 | ||
| Shanwei | 1999 | minimum | 6 | 7 | 7 | 8 | 9 | 9 |
| maximum | 8 | 8 | 9 | 8 | 9 | 9 | ||
| Santo Amaro da Imperatriz | 1761 | minimum | 2 | 4 | 6 | 7 | 7 | 7 |
| maximum | 5 | 6 | 8 | 7 | 7 | 7 | ||
| Encarnacion | 1848 | minimum | 2 | 4 | 7 | 8 | 8 | 8 |
| maximum | 6 | 8 | 10 | 8 | 8 | 8 | ||
| Santarém | 2199 | minimum | 4 | 5 | 5 | 5 | 6 | 6 |
| maximum | 6 | 6 | 6 | 5 | 6 | 6 | ||
Berlin and Alexandria, for example, have very similar annual rainfall, but tank capacities to store rainwater would be very different. On the other hand, New York and Encarnacion have very different annual rainfall, but very similar tank capacities for rainwater demand lower than 3 L/m2 of catchment area.
It can also be observed that the lower the rainwater demand, the larger the difference between the minimum and maximum tank capacities. For rainwater demand lower than 3 L/m2 of catchment area, tank capacities should be sized according to catchment area, number of residents, and so on. However, for rainwater demands greater than 4 L/m2 of catchment area, there is no variation in tank size in each city. In Paris, for example, tanks of 3m3 could be used for any house where rainwater demand is greater than 4 L/m2.
5. Conclusions
This study investigated the influence of rainfall on the potential for potable water savings in the residential sector in thirteen cities located in different countries. Variations in catchment surface area, potable and rainwater demands, and number of residents were also assessed. The simulations were performed using the computer program Netuno. The results shown herein are based on past data, but rainfall in the future may have different patterns; thus the potential for potable water savings may be different.
Cities with higher annual rainfall, but with well-defined periods of drought, do not reach as high a potential for potable water savings and end up requiring larger tanks to store rainwater.
Overall, it was observed that all parameters (catchment area, number of residents and potable and rainwater demands, and rainfall) influence the sizing of the rainwater tanks. This influence is greater for a lower rainwater demand per catchment area. This leads to the conclusion that rainwater systems should be studied and designed for each case, as the rainwater tank capacity cannot be replicated, since the parameters are almost always different in each residence.
6. Limitations
Some limitations of this work are:
- (1) The demands considered were obtained by averaging collected data from the existing literature. For better accuracy, the ideal would be to obtain empirical data from drinking water demands for each city and social class;
- (2) Reliable daily rainfall data were not available for some cities of great importance or with serious problems of lack of water;
- (3) Although it is not the focus of the work, an investment feasibility analysis could give more reliability to the results;
- (4) Other parameters that influence the potential for potable water savings could have been considered, such as water restrictions, household behavior, water-efficient household stock, among others.
References
- Shiklomanov, I.A. A New Appraisal and Assessment for the 21st Century. World Water Resources; United Nations Educational, Scientific and Cultural Organization: St Petersburg, Russia, 1998. [Google Scholar]
- Ghisi, E. Potential for potable water savings by using rainwater in the residential sector of Brazil. Build. Environ. 2005, 41, 1544–1550. [Google Scholar] [CrossRef]
- Gulyani, S.; Talukdar, D.; Kariuk, M. Water markets, household demand and the poor in urban Kenya. Urban Stud. 2005, 42, 1247–1274. [Google Scholar] [CrossRef]
- May, S. Estudo da Viabilidade do Aproveitamento de Água de Chuva Para Consumo não Potável em Edificações [Study on the Feasibility of Rainwater Harvesting for Non-Potable Uses in Buildings].
- Handia, L.; Tembo, J.M.; Mwiindwa, C. Potential of rainwater harvesting in urban Zambia. Phys. Chem. Earth 2003, 28, 893–896. [Google Scholar] [CrossRef]
- Villarreal, E.L.; Dixon, A. Analysis of a rainwater collection system for domestic water supply in Ringdansen, Norrköping, Sweden. Build. Environ. 2005, 40, 1174–1184. [Google Scholar]
- Deng, S. Energy and water uses and their performance explanatory indicators in hotels in Hong Kong. Energy Build. 2003, 35, 775–784. [Google Scholar] [CrossRef]
- Cheng, C.L.; Hong, Y.T. Evaluating water utilization in primary schools. Build. Environ. 2004, 39, 837–845. [Google Scholar] [CrossRef]
- Eroksuz, E.; Rahman, A. Rainwater tanks in multi-unit buildings: A case study for three Australian cities. Res. Conserv. Recycl. 2010, 54, 1449–1452. [Google Scholar] [CrossRef]
- Zaizen, M.; Urakawa, T.; Matsumoto, Y.; Takai, H. Case study: The collection of rainwater from dome stadiums in Japan. Urban Water 1999, 1, 355–359. [Google Scholar]
- Marinoski, A.K.; Ghisi, E. Aproveitamento de água pluvial para usos não potáveis em instituição de ensino; estudo de caso em Florianópolis-SC (Rainwater Harvesting for non-potable uses in educational institutions: A case study in Florianópolis-SC). Ambiente Construído 2008, 2, 67–84. [Google Scholar]
- Abdulla, F.A.; Al-Shreef, A.W. Roof rainwater harvesting systems for household water supply in Jordan. Desalination 2009, 1, 195–207. [Google Scholar]
- Fewkes, A. The use of rainwater for WC flushing: the field testing of a collection system. Build. Environ. 1999, 34, 765–772. [Google Scholar] [CrossRef]
- Slys, D. Potential of rainwater utilization in residential housing in Poland. WaterEnviron. J. 2009, 23, 318–325. [Google Scholar]
- Imteaz, M.A.; Shanableh, A.; Rahman, A.; Ahsan, A. Optimisation of rainwater tank design from large roofs: A case study in Melbourne, Australia. Res. Conserv. Recycl. 2011, 55, 1022–1029. [Google Scholar] [CrossRef]
- Global Climate Observing System (GCOS) . Available online: http://www.ncdc.noaa.gov/oa/climate/ghcn-daily/index.php?name=data (accessed on 20 May 2011).
- Ghisi, E.; Cordova, M.M.; Rocha, V.L. Netuno 2.1. Computer Programme; School of Civil Engineering, Federal University of Santa Catarina: Florianópolis, Brazil, 2009. Available online: http://www.labeee.ufsc.br/ (accessed on 10 May 2009).
- Ghisi, E. Parameters influencing the sizing of rainwater tanks for use in houses. Water Res. Manag. 2010, 24, 2381–2403. [Google Scholar] [CrossRef]
- Rocha, V.L. Validação do algoritmo do programa Netuno para avaliação do potencial de economia de água potável e dimensionamento de reservatórios de aproveitamento de água pluvial em edificações [Validation of the Algorithm of the Netuno Computer Programme to Assess the Potential for Potable Water Savings and Sizing of Rainwater Tanks for Rainwater Usage in Buildings].
- Chiu, Y.; Chao Hsien, Y.; Liang-Ching, C. Optimizing rainwater harvesting systems as an innovative approach to saving energy in hilly communities. Renew. Energy 2009, 34, 492–498. [Google Scholar] [CrossRef]
- Tomaz, P. Economia de Água para Empresas e Residências–Um Estudo Atualizado sobre o Uso Racional da Água. [Water Saving for Business and Residences–An Updated Study on the Rational Use of Water]; Navegar Editora: São Paulo, Brazil, 2001. [Google Scholar]
- Tomaz, P. Previsão de Consumo de Água—Interface das Instalações Prediais de Água e Esgoto com os serviços Públicos. [Water Consumption Forecast—Interface Building Installation of Water and Sewerage with Public Service]; Navegar Editora: São Paulo, Brazil, 2001. [Google Scholar]
- Tomaz, P. Aproveitamento de Água de Chuva—Para Áreas Urbanas e Fins não Potáveis. [Use of Rainwater—For Urban Areas and non Potable Purposes]; Navegar Editora: São Paulo, Brazil, 2003. [Google Scholar]
- Marinoski, A.K. Aproveitamento de Água Pluvial Para Usos não Potáveis em Instituições de Ensino: Estudo de Caso em Florianópolis-SC. [Rainwater Harvesting for Non-Potable Uses in Educational Institutions: A Case Study in Florianópolis-SC.]; School of Civil Engineering, Federal University of Santa Catarina: Florianópolis, Brazil, 2007. [Google Scholar]
- Ghisi, E.; Ferreira, D.F. Potential for potable water savings by using rainwater and greywater in a multy-storey residential building in southern Brazil. Build. Environ. 2007, 42, 2512–2522. [Google Scholar] [CrossRef]
- Imteaz, M.A.; Rahman, A.; Ahsan, A. Reliability analysis of rainwater tanks: A comparison between South East and Central Melbourne. Res. Conserv. Recycl. 2012, 66, 1–7. [Google Scholar] [CrossRef]
© 2012 by the authors; licensee MDPI, Basel, Switzerland. This article is an open-access article distributed under the terms and conditions of the Creative Commons Attribution license (http://creativecommons.org/licenses/by/3.0/).
Share and Cite
MDPI and ACS Style
Souza, E.L.; Ghisi, E. Potable Water Savings by Using Rainwater for Non-Potable Uses in Houses. Water 2012, 4, 607-628. https://doi.org/10.3390/w4030607
AMA Style
Souza EL, Ghisi E. Potable Water Savings by Using Rainwater for Non-Potable Uses in Houses. Water. 2012; 4(3):607-628. https://doi.org/10.3390/w4030607
Chicago/Turabian StyleSouza, Eduardo Leite, and Enedir Ghisi. 2012. "Potable Water Savings by Using Rainwater for Non-Potable Uses in Houses" Water 4, no. 3: 607-628. https://doi.org/10.3390/w4030607