<?xml version="1.0" encoding="UTF-8"?>
<!DOCTYPE article PUBLIC "-//NLM//DTD Journal Publishing DTD v2.3 20070202//EN" "journalpublishing.dtd">
<article xmlns:mml="http://www.w3.org/1998/Math/MathML" xmlns:xlink="http://www.w3.org/1999/xlink" xml:lang="en" article-type="research-article">
  <front>
    <journal-meta>
      <journal-id journal-id-type="publisher-id">water</journal-id>
      <journal-title>Water</journal-title>
      <abbrev-journal-title abbrev-type="publisher">Water</abbrev-journal-title>
      <abbrev-journal-title abbrev-type="pubmed">water</abbrev-journal-title>
      <issn pub-type="epub">2073-4441</issn>
      <publisher>
        <publisher-name>MDPI</publisher-name>
      </publisher>
    </journal-meta>
    <article-meta>
      <article-id pub-id-type="doi">10.3390/w4030568</article-id>
      <article-id pub-id-type="publisher-id">water-04-00568</article-id>
      <article-categories>
        <subj-group>
          <subject>Article</subject>
        </subj-group>
      </article-categories>
      <title-group>
        <article-title>Sensitivity of Coastal Flood Risk Assessments to Digital Elevation Models</article-title>
      </title-group>
      
      <contrib-group>
        <contrib contrib-type="author">
          <name>
            <surname>van de Sande</surname>
            <given-names>Bas</given-names>
          </name>
          <xref rid="c1-water-04-00568" ref-type="corresp">1*</xref>
        </contrib>
        <contrib contrib-type="author">
          <name>
            <surname>Lansen</surname>
            <given-names>Joost</given-names>
          </name>
          <xref rid="af2-water-04-00568" ref-type="aff">2</xref>
        </contrib>
        <contrib contrib-type="author">
          <name>
            <surname>Hoyng</surname>
            <given-names>Claartje</given-names>
          </name>
          <xref rid="af2-water-04-00568" ref-type="aff">2</xref>
        </contrib>
      </contrib-group>
      <aff id="af1-water-04-00568"><label>1 </label>Royal HaskoningDHV, Barbarossastraat 35 6522 DK Nijmegen, The Netherlands</aff>
      <aff id="af2-water-04-00568"><label>2 </label>Royal HaskoningDHV, George Hintzenweg 85 3068 AX Rotterdam, The Netherlands; Email: <email>joost.lansen@rhdhv.com</email> (J.L.); <email>claartje.hoyng@rhdhv.com</email> (C.H.)</aff>
	  <author-notes>
        <corresp id="c1-water-04-00568"><label>*</label> Author to whom correspondence should be addressed; Email: <email>bas.van.de.sande@rhdhv.com</email>; Tel.: +31-6-1359-1995; Fax: +31-24-323-9346.</corresp>
      </author-notes>
      <pub-date pub-type="epub">
        <day>27</day>
        <month>07</month>
        <year>2012</year>
      </pub-date>
      <pub-date pub-type="collection">
        <month>09</month>
		<year>2012</year>
      </pub-date>
      <volume>4</volume>
      <issue>3</issue>
      <fpage>568</fpage>
      <lpage>579</lpage>
      <history>
        <date date-type="received">
          <day>14</day>
          <month>06</month>
          <year>2012</year>
        </date>
        <date date-type="rev-recd">
          <day>14</day>
          <month>07</month>
          <year>2012</year>
        </date>
        <date date-type="accepted">
          <day>16</day>
          <month>07</month>
          <year>2012</year>
        </date>
      </history>
      <permissions>
        <copyright-statement>© 2012 by the authors; licensee MDPI, Basel, Switzerland.</copyright-statement>
        <copyright-year>2012</copyright-year>
        <license xmlns:xlink="http://www.w3.org/1999/xlink" license-type="open-access" xlink:href="http://creativecommons.org/licenses/by/3.0/">
          <p>This article is an open-access article distributed under the terms and conditions of the Creative Commons Attribution license (http://creativecommons.org/licenses/by/3.0/).</p>
        </license>
      </permissions>
      <abstract>
        <p>Most coastal flood risk studies make use of a Digital Elevation Model (DEM) in addition to a projected flood water level in order to estimate the flood inundation and associated damages to property and livelihoods. The resolution and accuracy of a DEM are critical in a flood risk assessment, as land elevation largely determines whether a location will be flooded or will remain dry during a flood event. Especially in low lying deltaic areas, the land elevation variation is usually in the order of only a few decimeters, and an offset of various decimeters in the elevation data has a significant impact on the accuracy of the risk assessment. Publicly available DEMs are often used in studies for coastal flood risk assessments. The accuracy of these datasets is relatively low, in the order of meters, and is especially low in comparison to the level of accuracy required for a flood risk assessment in a deltaic area. For a coastal zone area in Nigeria (Lagos State) an accurate LiDAR DEM dataset was adopted as ground truth concerning terrain elevation. In the case study, the LiDAR DEM was compared to various publicly available DEMs. The coastal flood risk assessment using various publicly available DEMs was compared to a flood risk assessment using LiDAR DEMs. It can be concluded that the publicly available DEMs do not meet the accuracy requirement of coastal flood risk assessments, especially in coastal and deltaic areas. For this particular case study, the publically available DEMs highly overestimated the land elevation Z-values and thereby underestimated the coastal flood risk for the Lagos State area. The findings are of interest when selecting data sets for coastal flood risk assessments in low-lying deltaic areas.</p>
      </abstract>
      <kwd-group>
        <kwd>coastal flood risk</kwd>
        <kwd>LiDAR</kwd>
        <kwd>GIS</kwd>
        <kwd>DEM</kwd>
        <kwd>data accuracy</kwd>
      </kwd-group>
    </article-meta>
  </front>
  <body>
    <sec sec-type="intro">
      <title>1. Introduction</title>
      <p>Coasts are experiencing the adverse consequences of hazards related to climate change and sea level rise and will be exposed to increasing risks of coastal flooding [<xref ref-type="bibr" rid="B1-water-04-00568">1</xref>,<xref ref-type="bibr" rid="B2-water-04-00568">2</xref>,<xref ref-type="bibr" rid="B3-water-04-00568">3</xref>]. Coastal zones and deltas already contain a larger share of the world’s population and will become more heavily populated. Ten percent of the world’s population lives in the 10 m Low Elevation Coastal Zone. This share covers two percent of the world’s land area [<xref ref-type="bibr" rid="B4-water-04-00568">4</xref>]. This emphasizes the need for coastal flood risk assessments to which GIS (Geographic Information System) components and mapping can be incorporated.</p>
      <p>There are many (online) tools to estimate the impact of sea level rise on land area. One can visualize flood extents by setting an elevation relative to sea level in the chosen application (e.g., Globalfloodmap [<xref ref-type="bibr" rid="B5-water-04-00568">5</xref>] and the Wikipedia Sea Level Rise Explorer [<xref ref-type="bibr" rid="B6-water-04-00568">6</xref>]). These tools are mainly used to indicate impacts on a global scale. As of yet it is still unclear and not easy to estimate to what extent these tools and its underlying data can be used in other (smaller) scaled spatial analyses (<xref ref-type="fig" rid="water-04-00568-f001">Figure 1</xref>).</p>
      <fig id="water-04-00568-f001" position="anchor">
        <label>Figure 1</label>
        <caption>
          <p>Online tools are available to estimate the impact of sea-level-rise on land area; tools which are based on public Digital Elevation Models (DEMs). Views were zoomed to Lagos State area. Source of upper left image: Wikipedia Sea Level Rise Explorer [<xref ref-type="bibr" rid="B6-water-04-00568">6</xref>]; source of lower right image: Flood Maps [<xref ref-type="bibr" rid="B7-water-04-00568">7</xref>].</p>
        </caption>
        <graphic xmlns:xlink="http://www.w3.org/1999/xlink" xlink:href="water-04-00568-g001.tif"/>
      </fig>
      <sec>
        <title>1.1. GIS Approach</title>
        <p>
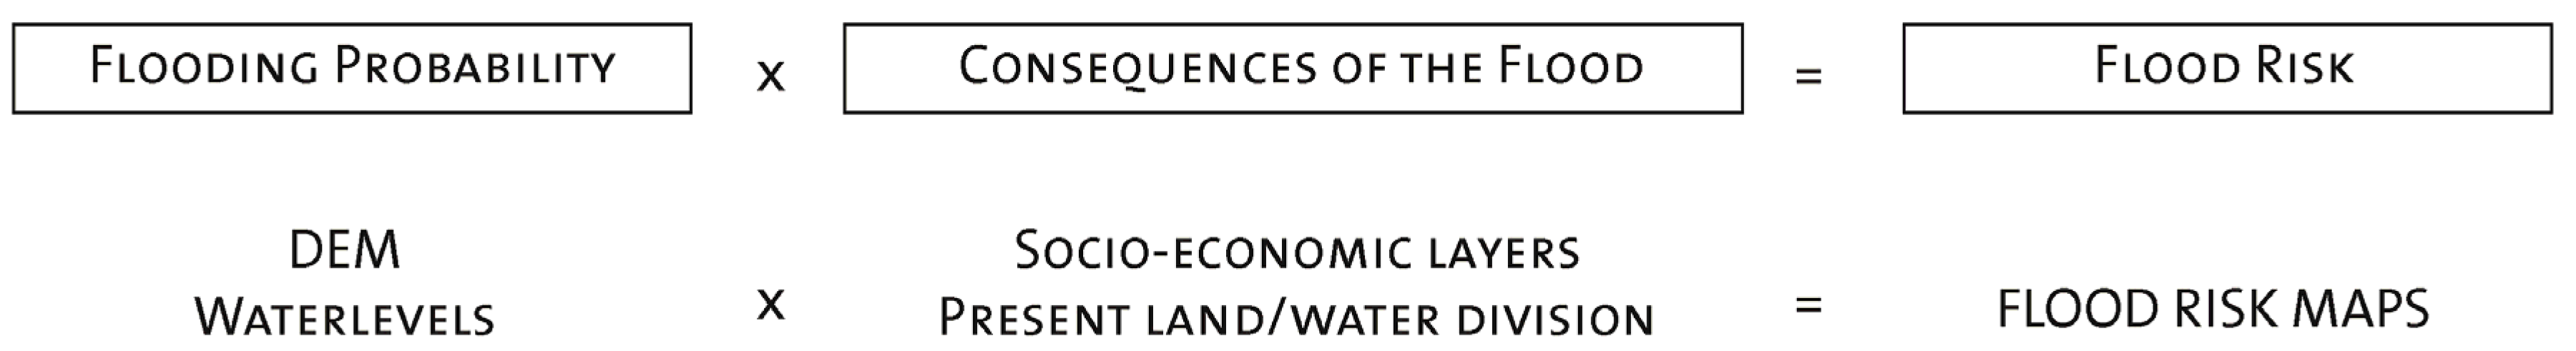
Coastal flood risk mapping is used to estimate flood risk as shown schematically in <xref ref-type="fig" rid="water-04-00568-f002">Figure 2</xref> [<xref ref-type="bibr" rid="B8-water-04-00568">8</xref>]. The combination of the occurrence probability of a flood event and the associated (socio-economic) consequences of the flood events determines the total flood risk of a region. In case of GIS-based flood risk assessments, three types of geo data are generated in coastal flood risk models (see <xref ref-type="fig" rid="water-04-00568-f002">Figure 2</xref>) representing the flood event (inundation depth maps defined as the difference of a water level and land elevation), the potential consequences of the flood, and a flood risk map. </p>
        <fig id="water-04-00568-f002" position="anchor">
          <label>Figure 2</label>
          <caption>
            <p>Conceptual risk equation.</p>
          </caption>
          <graphic xmlns:xlink="http://www.w3.org/1999/xlink" xlink:href="water-04-00568-g002.tif"/>
        </fig>
      </sec>
      <sec>
        <title>1.2. DEM as Critical Factor</title>
        <p>Most coastal flood risk assessments are based on a conceptual risk approach where Digital Elevation Models (DEM) is used in order to estimate the flood hazard for coastal zones according to projected water levels. The resolution and accuracy of DEM data are critical regarding the results of coastal flood risk assessments, because these data determine whether a location will be flooded by means of a flood simulation. Topographic data are the most important factor in determining the extent of flooding and therefore the accuracy of flood maps [<xref ref-type="bibr" rid="B9-water-04-00568">9</xref>]. Especially in low-lying coastal zones, the simulation of flood extents was found to be very sensitive to the terrain representation [<xref ref-type="bibr" rid="B10-water-04-00568">10</xref>]. Yet in general mainly these areas are most vulnerable to coastal floods and therefore demand adequate risk assessments. Commonly publicly available DEMs like ASTER GDEM (Advanced Spaceborne Thermal Emission and Reflection Radiometer) 30 m. horizontal resolution data set [<xref ref-type="bibr" rid="B11-water-04-00568">11</xref>] and SRTM DEM (Shuttle Radar Topography Mission) 90 m. horizontal resolution data set [<xref ref-type="bibr" rid="B12-water-04-00568">12</xref>] are used for coastal flood risk assessments [<xref ref-type="bibr" rid="B13-water-04-00568">13</xref>], although the resolution and accuracy of these data sets are relatively low. In some areas of the world DEMs generated from LiDAR data are publicly available, but this is rarely the case. Many users end up using an SRTM DEM and ASTER GDEM dataset mainly because it is freely available and ready to use for modeling [<xref ref-type="bibr" rid="B14-water-04-00568">14</xref>,<xref ref-type="bibr" rid="B15-water-04-00568">15</xref>,<xref ref-type="bibr" rid="B16-water-04-00568">16</xref>]. Also many online coastal flooding applications are based on these publicly available DEM data sets (see <xref ref-type="fig" rid="water-04-00568-f001">Figure 1</xref>), as are the earlier mentioned applications of Globalfloodmap and the Wikipedia Sea Level Rise Explorer. However, the sensitivity of coastal flood risk assessments to the publicly available DEMs and the associated effects on coastal flood hazard and flood risk estimations based on these data sets are currently overlooked.</p>
      </sec>
    </sec>
    <sec>
      <title>2. Materials and Methods</title>
      <sec>
        <title>2.1. Comparison Analyses</title>
        <p>A case study for Lagos State (Nigeria) was conducted to show the effects on flood hazard and flood risk estimations by comparing flood risk estimations based on two publicly available DEM datasets (ASTER GDEM and SRTM DEM) to flood risk estimations based on LiDAR (Light Detection and Ranging) DEM estimations. </p>
        <p>DEMs (Digital Elevation Models) can be split up in Digital Terrain Models (DTM) and Digital Surface Models (DSM). DTMs represent the terrain’s elevation, whereas DSMs represent the surface elevation of objects in the landscape (e.g., roofs of buildings and canopies of trees) [<xref ref-type="bibr" rid="B17-water-04-00568">17</xref>]. In fact ASTER GDEM and STRM DEM datasets are Digital Surface Models instead of Digital Terrain Models. Both sensors apply space borne measure techniques for capturing surface elevations. Unlike the publicly available DEM datasets the LiDAR DEM is a DTM. Although this essential difference is known, a comparison analysis is worth performing since STRM DEM and ASTER GDEM are widely used and ubiquitous as terrain or topography models.</p>
        <p>The LiDAR survey was flown with a plane sensor platform in May 2009 by the PBH Group (based in Canada). The nominal point density of the bare earth point data is 2 points per m<sup>2</sup>, and the provided accuracy assessment reported a root mean square error (RMSE) of less than 1 cm. These accuracy and resolution characteristics amply comply with the guidelines for accuracy and resolution of terrain data as input for flood risk assessments [<xref ref-type="bibr" rid="B18-water-04-00568">18</xref>]. The LiDAR bare earth point measurements were adopted as ground truth, since there was no reference elevation dataset available. The bare earth point data was processed to a grid with a horizontal resolution of 5 m. by natural neighbor interpolation techniques. This processed grid was used for the flooding simulations. With a Root Mean Square Error of 0.10 m. and a Mean Error of 0.00 m. of this grid compared to the bare earth points, the deviations of the 5 m. resolution LiDAR DEM were considered acceptable.</p>
        <p>
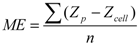
In this case study coastal flooding is approached from a “bathtub” approach. In order to model hydrological connectivity, you can simulate inundation by selecting the values of your DEM which have a lower value than the projected water level [<xref ref-type="bibr" rid="B19-water-04-00568">19</xref>]. The simulation can be executed in two manners; with and without surface connectivity (see <xref ref-type="fig" rid="water-04-00568-f003">Figure 3</xref>).</p>
        <fig id="water-04-00568-f003" position="anchor">
          <label>Figure 3</label>
          <caption>
            <p>Bathtub principle (red indicates simulated inundated areas).</p>
          </caption>
          <graphic xmlns:xlink="http://www.w3.org/1999/xlink" xlink:href="water-04-00568-g003.tif"/>
        </fig>
        <p>With surface connectivity only the grid cells which are lower than the projected water level and which are connected to an adjacent flooded grid cell or open water indicate inundation. Simulation with surface connectivity is more appropriate because a coastal flood only has direct influence on the adjacent land zone.</p>
        <p>
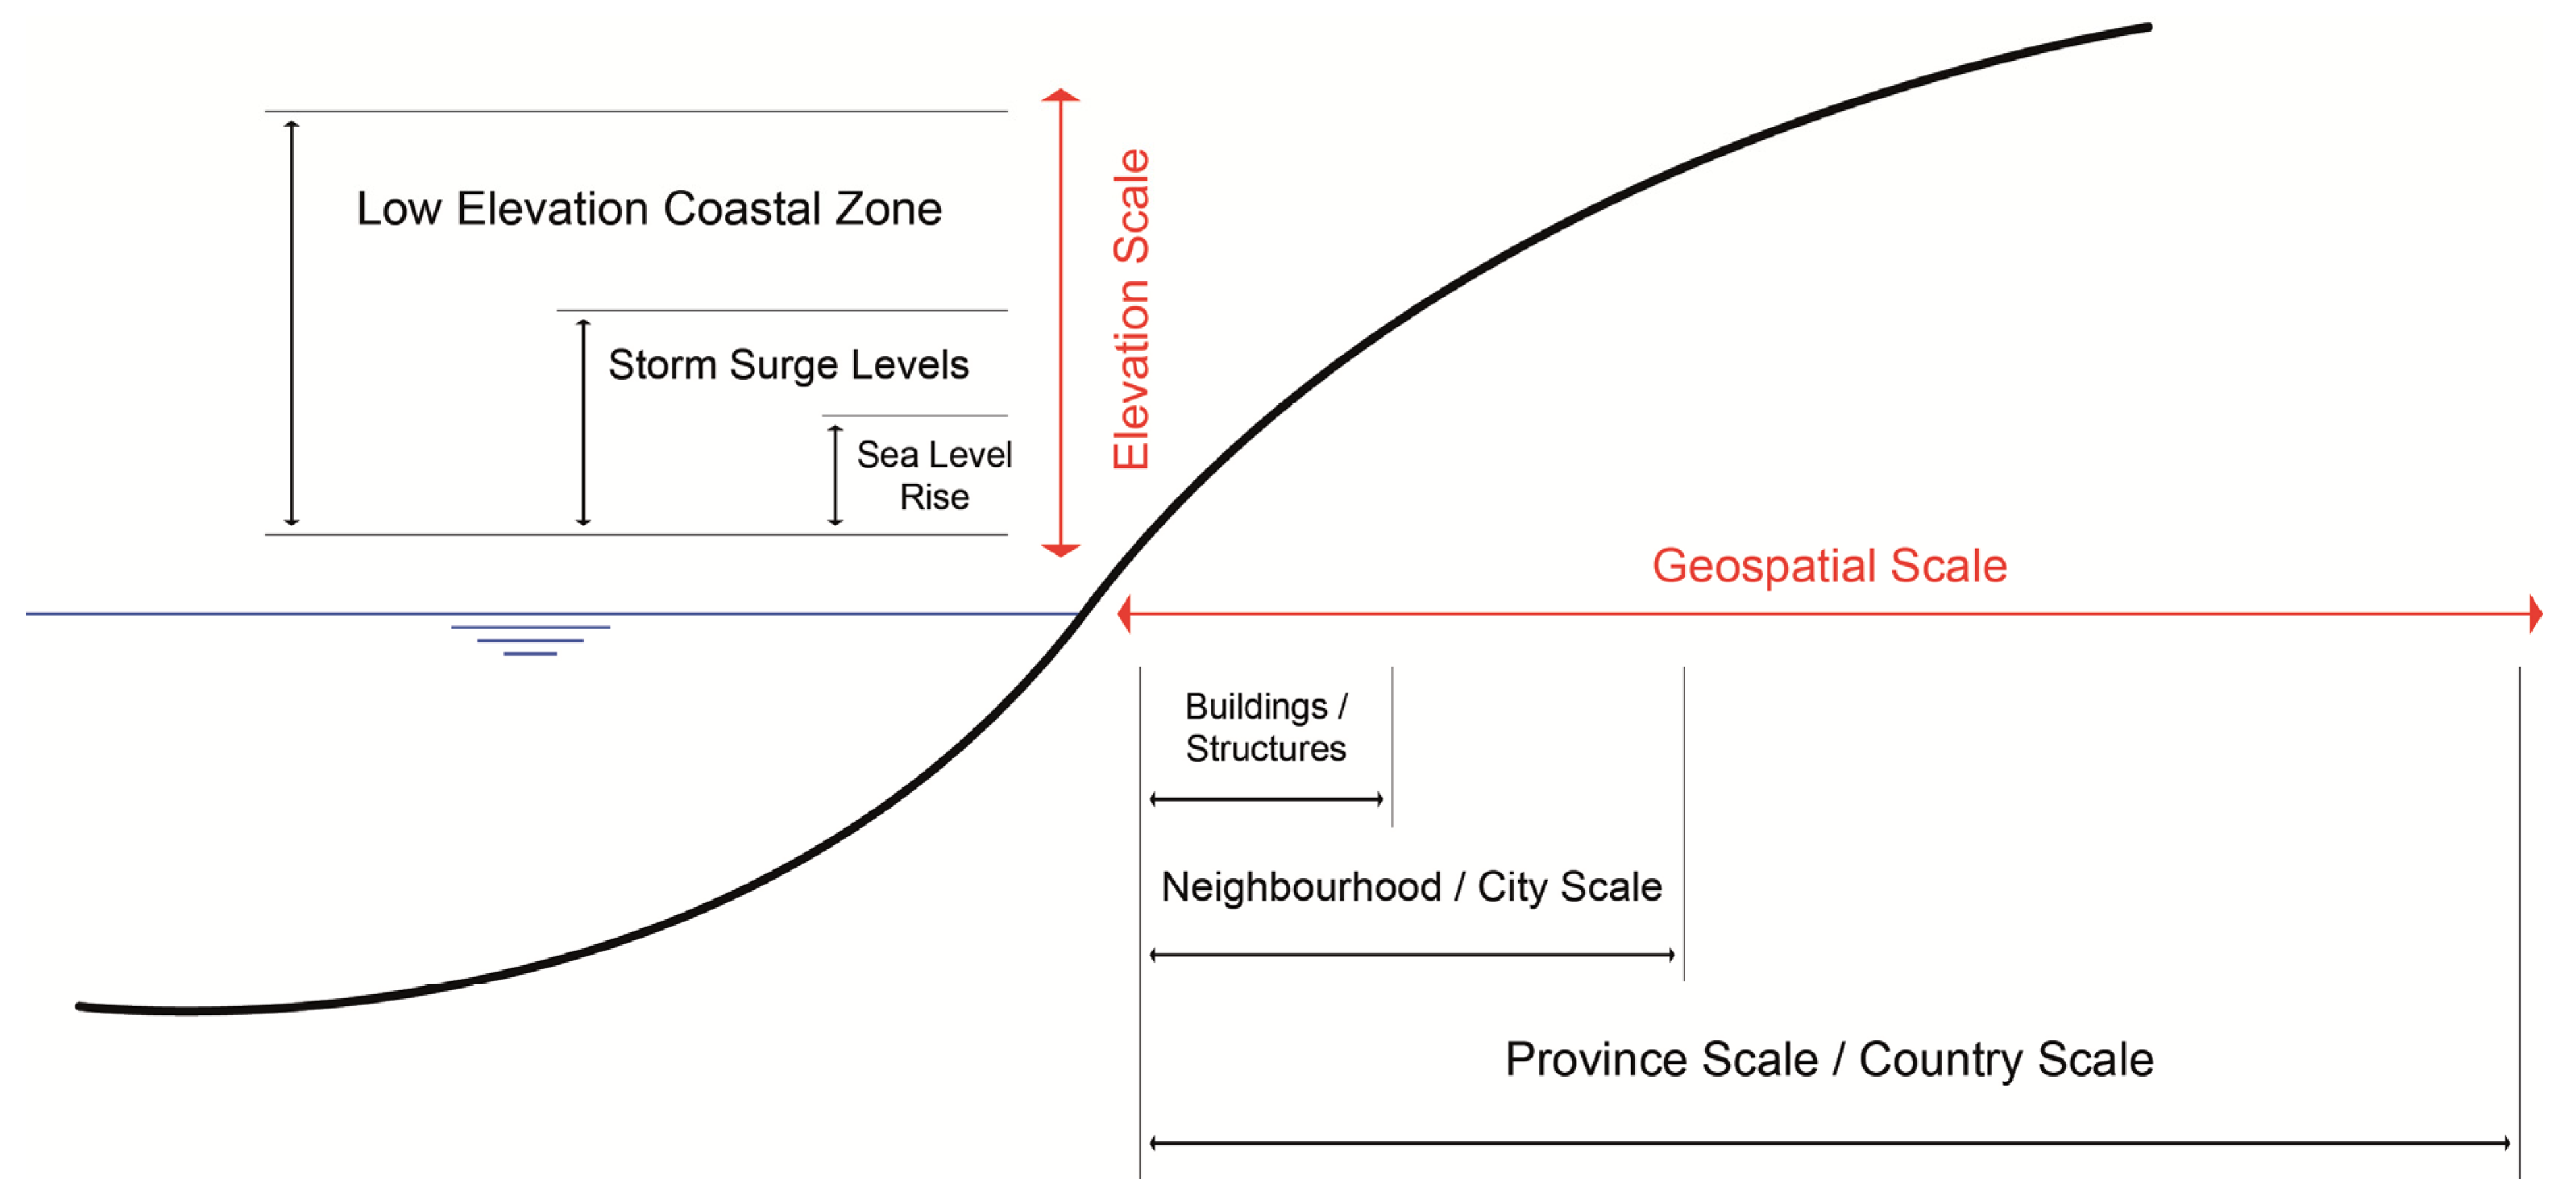
Coastal flood risk assessments can be performed at different horizontal and vertical scale levels (respectively the geospatial scale and the elevation scale). Assessments differ from estimations of the share of the global population living in low-lying deltas to estimations of the probability of a flood in a small harbor. Two case study scales were included in order to reveal the effects of usage of the public DEMs on coastal flood risk assessments and to give an indication of the suitability for use of these public datasets. Lagos State scale and Lagos City scale represent the geospatial scales with accompanying elevation scales; respectively 5 meter Low Elevation Coastal Zone (LECZ) and storm surge water levels (see <xref ref-type="fig" rid="water-04-00568-f004">Figure 4</xref>). These two case study scales were chosen as they have been used relatively often in past executed coastal flood risk assessments based on both publicly available DEM datasets.</p>
        <fig id="water-04-00568-f004" position="anchor">
          <label>Figure 4</label>
          <caption>
            <p>Different elevation and geospatial scales can be applied on coastal flood risk assessments.</p>
          </caption>
          <graphic xmlns:xlink="http://www.w3.org/1999/xlink" xlink:href="water-04-00568-g004.tif"/>
        </fig>
      </sec>
      <sec>
        <title>2.2. Lagos State Scale and Low Elevation Coastal Zone</title>
        <p>McGranahan <italic>et al.</italic> [<xref ref-type="bibr" rid="B4-water-04-00568">4</xref>] conducted a study on the estimation of the world’s population living in LECZ. An estimation of the population of the world living in a 5 m. or 10 m. LECZ was made for many countries based on SRTM data [<xref ref-type="bibr" rid="B12-water-04-00568">12</xref>] and GRUMP population data [<xref ref-type="bibr" rid="B20-water-04-00568">20</xref>]. The concept of the Low Elevation Coastal Zone represents the scale level comparable with the global sea level rise tools which are available online. These tools support a quick and indicative analysis.</p>
        <p>
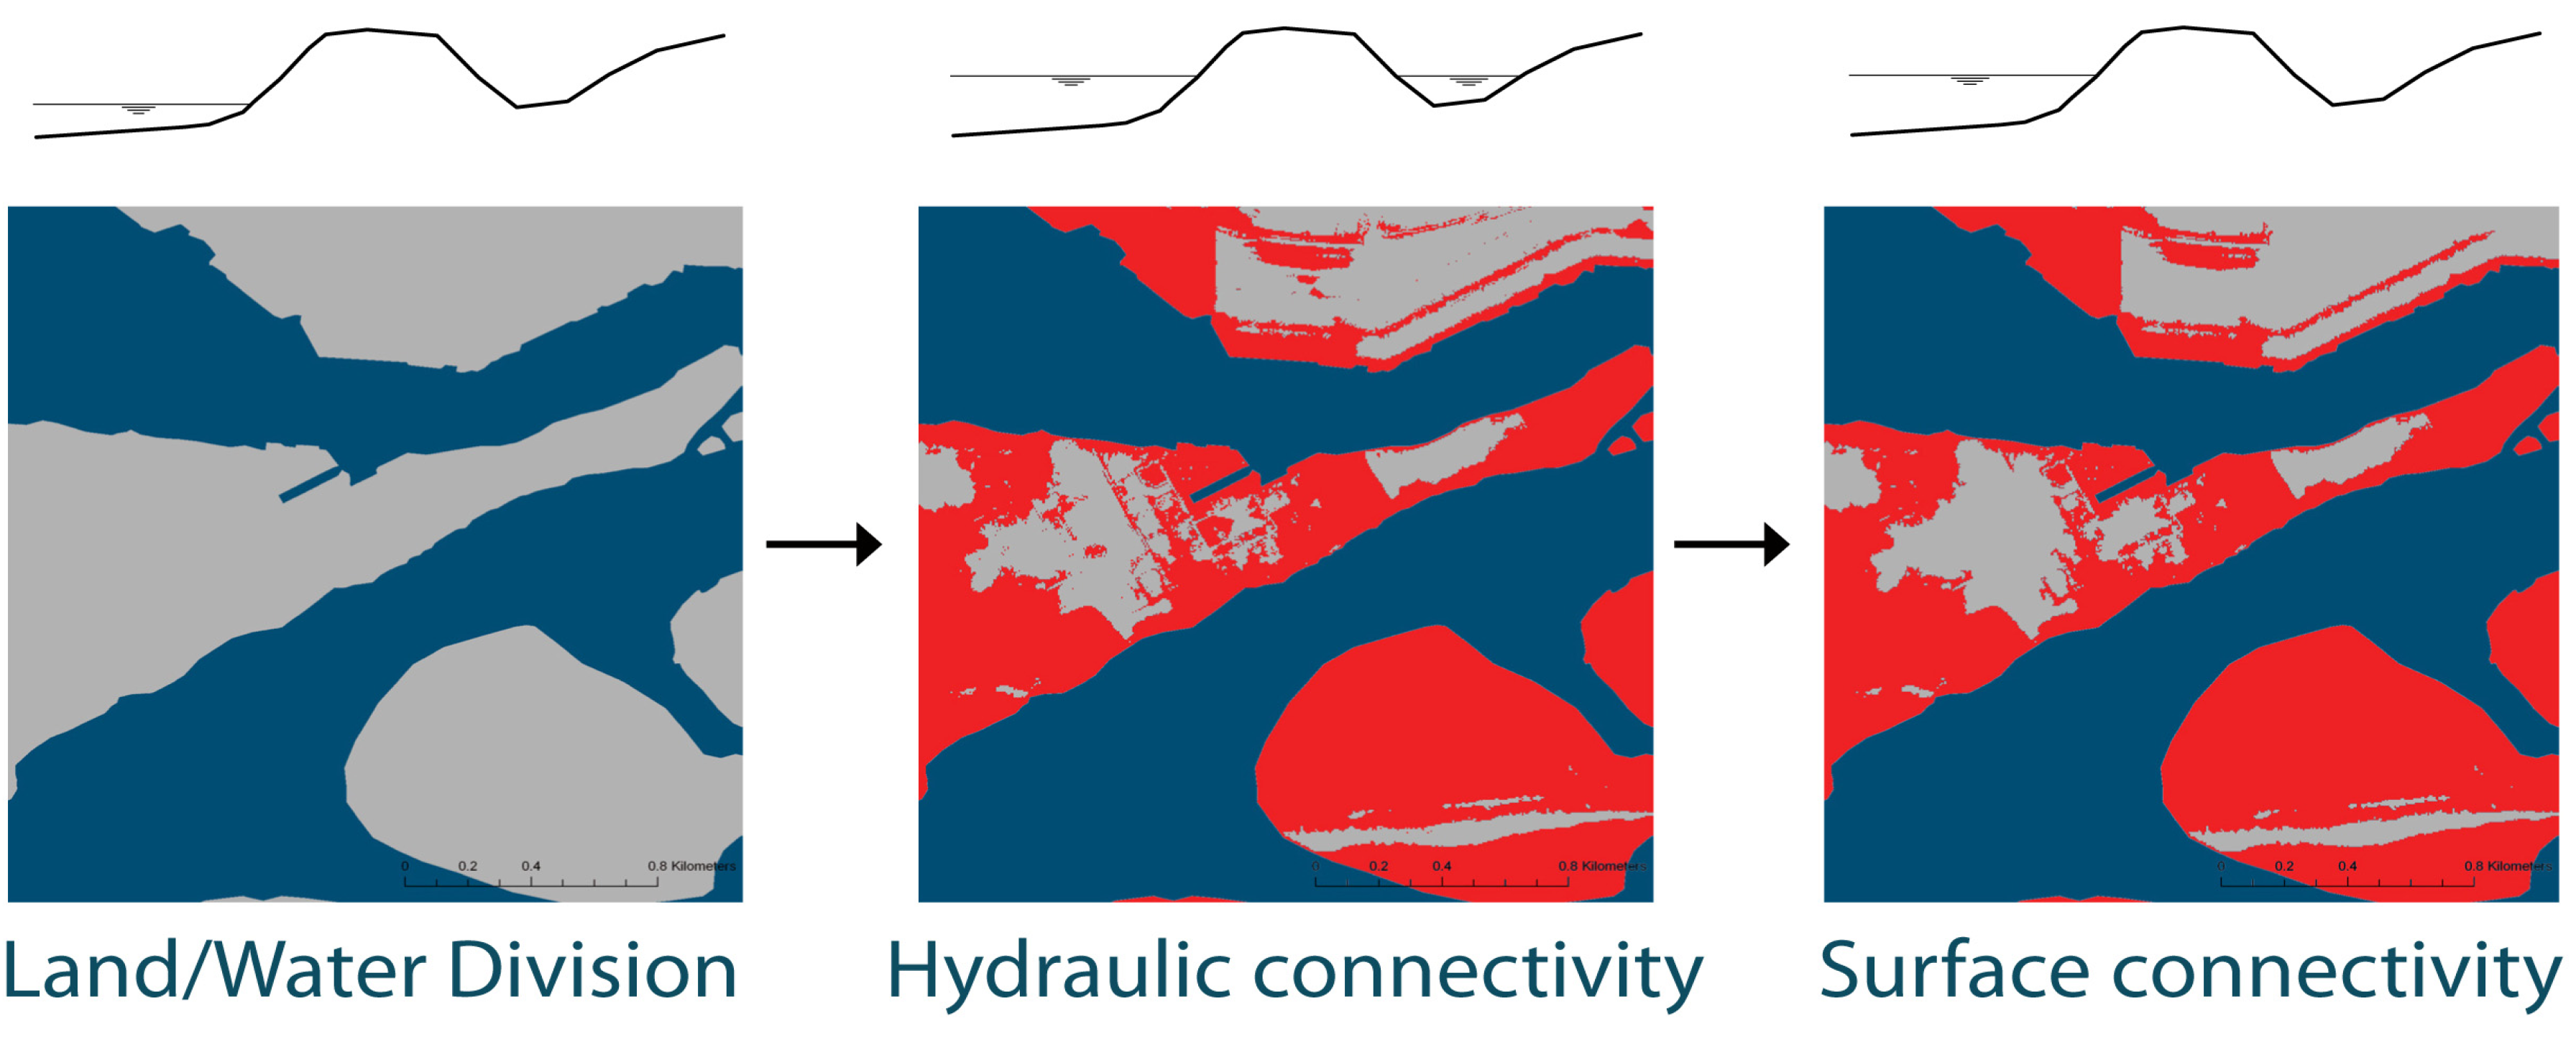
In this focusing scale with Lagos State area as geospatial scale level, and the 5 m. LECZ as elevation scale level, the goal was to assess the land cover of the 5 m. LECZ for Lagos State area by the public DEMs and the LiDAR DEM. Because the entire bare earth point dataset of the LiDAR DEM is too extensive to be used for the entire area, a subset was used. In the subset strips of tiles were chosen to handle calculation time and reduce memory space. The strips are oriented north-south because most elevation differences occur in north-south direction (perpendicular to the coastline and the major lagoons) and have an equal distance of 20 km from each other (see <xref ref-type="fig" rid="water-04-00568-f005">Figure 5</xref>).</p>
        <fig id="water-04-00568-f005" position="anchor">
          <label>Figure 5</label>
          <caption>
            <p>Strips of data tiles were selected because the full dataset for the Lagos State area was too extensive.</p>
          </caption>
          <graphic xmlns:xlink="http://www.w3.org/1999/xlink" xlink:href="water-04-00568-g005.tif"/>
        </fig>
      </sec>
      <sec>
        <title>2.3. Lagos City Scale and Storm Surge Water Levels</title>
        <p>For this focusing scale, both geospatial and elevation scale levels are smaller. In this case probable flood hazard areas of the city of Lagos were estimated by simulating a storm surge hitting the city of Lagos. Storm surges can differ in intensity and have a relation to the return interval. Storm surge height is directly related to the intensity of the storm. The storm intensity is also related to the frequency of storm surges in terms of return periods. For Lagos State the return periods of storm surges were investigated as well (see <xref ref-type="table" rid="water-04-00568-t001">Table 1</xref>). Flooded areas due to storm surges can be simulated by exposing these heights to the public DEMs and the LiDAR DEM. </p>
        <table-wrap id="water-04-00568-t001" position="anchor">
          <object-id pub-id-type="pii">water-04-00568-t001_Table 1</object-id>
          <label>Table 1</label>
          <caption>
            <p>Water levels used for the case study of Lagos City.</p>
          </caption>
          <table>
		  <thead>
              <tr align="center">
                <th colspan="2" valign="middle">Return period</th>
                <th valign="middle">Storm surge height in m. relative to geopotential model EGM96</th>
              </tr>
            </thead>
            <tbody>
              <tr align="center">
                <td rowspan="2" valign="middle">Present (without Sea Level Rise)</td>
                <td align="center" valign="middle">1/100 yr</td>
                <td align="center" valign="middle">1.7 m</td>
              </tr>
              <tr>
                <td align="center" valign="middle">1/200 yr</td>
                <td align="center" valign="middle">2.0 m</td>
              </tr>
              <tr align="center">
                <td rowspan="2" valign="middle">Future (with Sea Level Rise)</td>
                <td align="center" valign="middle">1/100 yr</td>
                <td align="center" valign="middle">2.7 m</td>
              </tr>
              <tr>
                <td align="center" valign="middle">1/200 yr</td>
                <td align="center" valign="middle">3.0 m</td>
              </tr>
            </tbody>
          </table>
		  </table-wrap>
      </sec>
      <sec>
        <title>2.4. Statistical Analysis of Elevation Differences</title>
        <p>The statistical elevation differences among the DEM datasets can be revealed by error statistics, because the bare earth points of the LiDAR DEM dataset were adopted as ground truth. The differences in estimated flood extents can be supported by error measurements. These error measurements can be used as a means to quantify the vertical accuracy of a DEM. The errors are calculated for each point by taking the difference of elevation of the GRID and the true elevation of the point. The error statistics were calculated for the 9 strips of the Lagos State case study scale.</p>
        <p>The error statistics of the global public DEM datasets are assessed by three functions; the root mean square error of elevation measurements (see Equation 1), the mean error of elevation measurements (see Equation 2) and the standard deviation of elevation measurements (see Equation 3).</p>
        <disp-formula id="water-04-00568-i001">
		<inline-graphic xmlns:xlink="http://www.w3.org/1999/xlink" xlink:href="water-04-00568-i001.tif"/>
		<label>(1)</label>
		</disp-formula>

        <disp-formula id="water-04-00568-i002">
		<inline-graphic xmlns:xlink="http://www.w3.org/1999/xlink" xlink:href="water-04-00568-i002.tif"/>
		<label>(2)</label>
		</disp-formula>
		
        <disp-formula id="water-04-00568-i003">
		<inline-graphic xmlns:xlink="http://www.w3.org/1999/xlink" xlink:href="water-04-00568-i003.tif"/>
		<label>(3)</label>
		</disp-formula>
		
        <p>where Z<sub>p</sub> is elevation of ground truth; Z<sub>cell</sub> is elevation of model; n: sample size.</p>
        <p>The RMSE is a widely used measure of conformity between a set of estimates and the actual values and has become a standard measure of map accuracy [<xref ref-type="bibr" rid="B21-water-04-00568">21</xref>]. The mean error (ME) is an important component for elevation accuracy assessments because it provides an indication of whether the dataset is under- or overestimated in relation to ground truth. The standard deviation provides information on the spread of the errors, which indicates to what extent there is a variety in the magnitude of the errors in the dataset. </p>
      </sec>
    </sec>
    <sec sec-type="results">
      <title>3. Results</title>
      <sec>
        <title>3.1. Results Lagos State Scale</title>
        <p>The amount of LiDAR data was the inhibiting factor which meant the case study could not be assessed for the entire extent of Lagos State. In order to compare the LECZ areas based on the SRTM DEM, the ASTER GDEM, and the LiDAR DEM, only nine strips were used for comparison. A result for one of the strips is shown in <xref ref-type="fig" rid="water-04-00568-f006">Figure 6</xref>. The cumulative results are shown in <xref ref-type="table" rid="water-04-00568-t002">Table 2</xref>.</p>
        <table-wrap id="water-04-00568-t002" position="anchor">
          <object-id pub-id-type="pii">water-04-00568-t002_Table 2</object-id>
          <label>Table 2</label>
          <caption>
            <p>Numbers and percentages of the estimated LECZ areas.</p>
          </caption>
          <table>
		  <thead>
              <tr align="center">
                <th valign="middle">DEM Datasets</th>
                <th valign="middle">LECZ area in m<sup>2</sup></th>
                <th valign="middle">% of LECZ area compared to LiDAR DEM</th>
              </tr>
            </thead>
            <tbody>
              <tr align="center">
                <td valign="middle">LiDAR DEM</td>
                <td valign="middle">78,095,118</td>
                <td valign="middle">-</td>
              </tr>
              <tr align="center">
                <td valign="middle">ASTER GDEM</td>
                <td valign="middle">11,855,514</td>
                <td valign="middle">15</td>
              </tr>
              <tr align="center">
                <td valign="middle">SRTM DEM</td>
                <td valign="middle">19,690,838</td>
                <td valign="middle">25</td>
              </tr>
            </tbody>
          </table>
		  </table-wrap>
        <p>
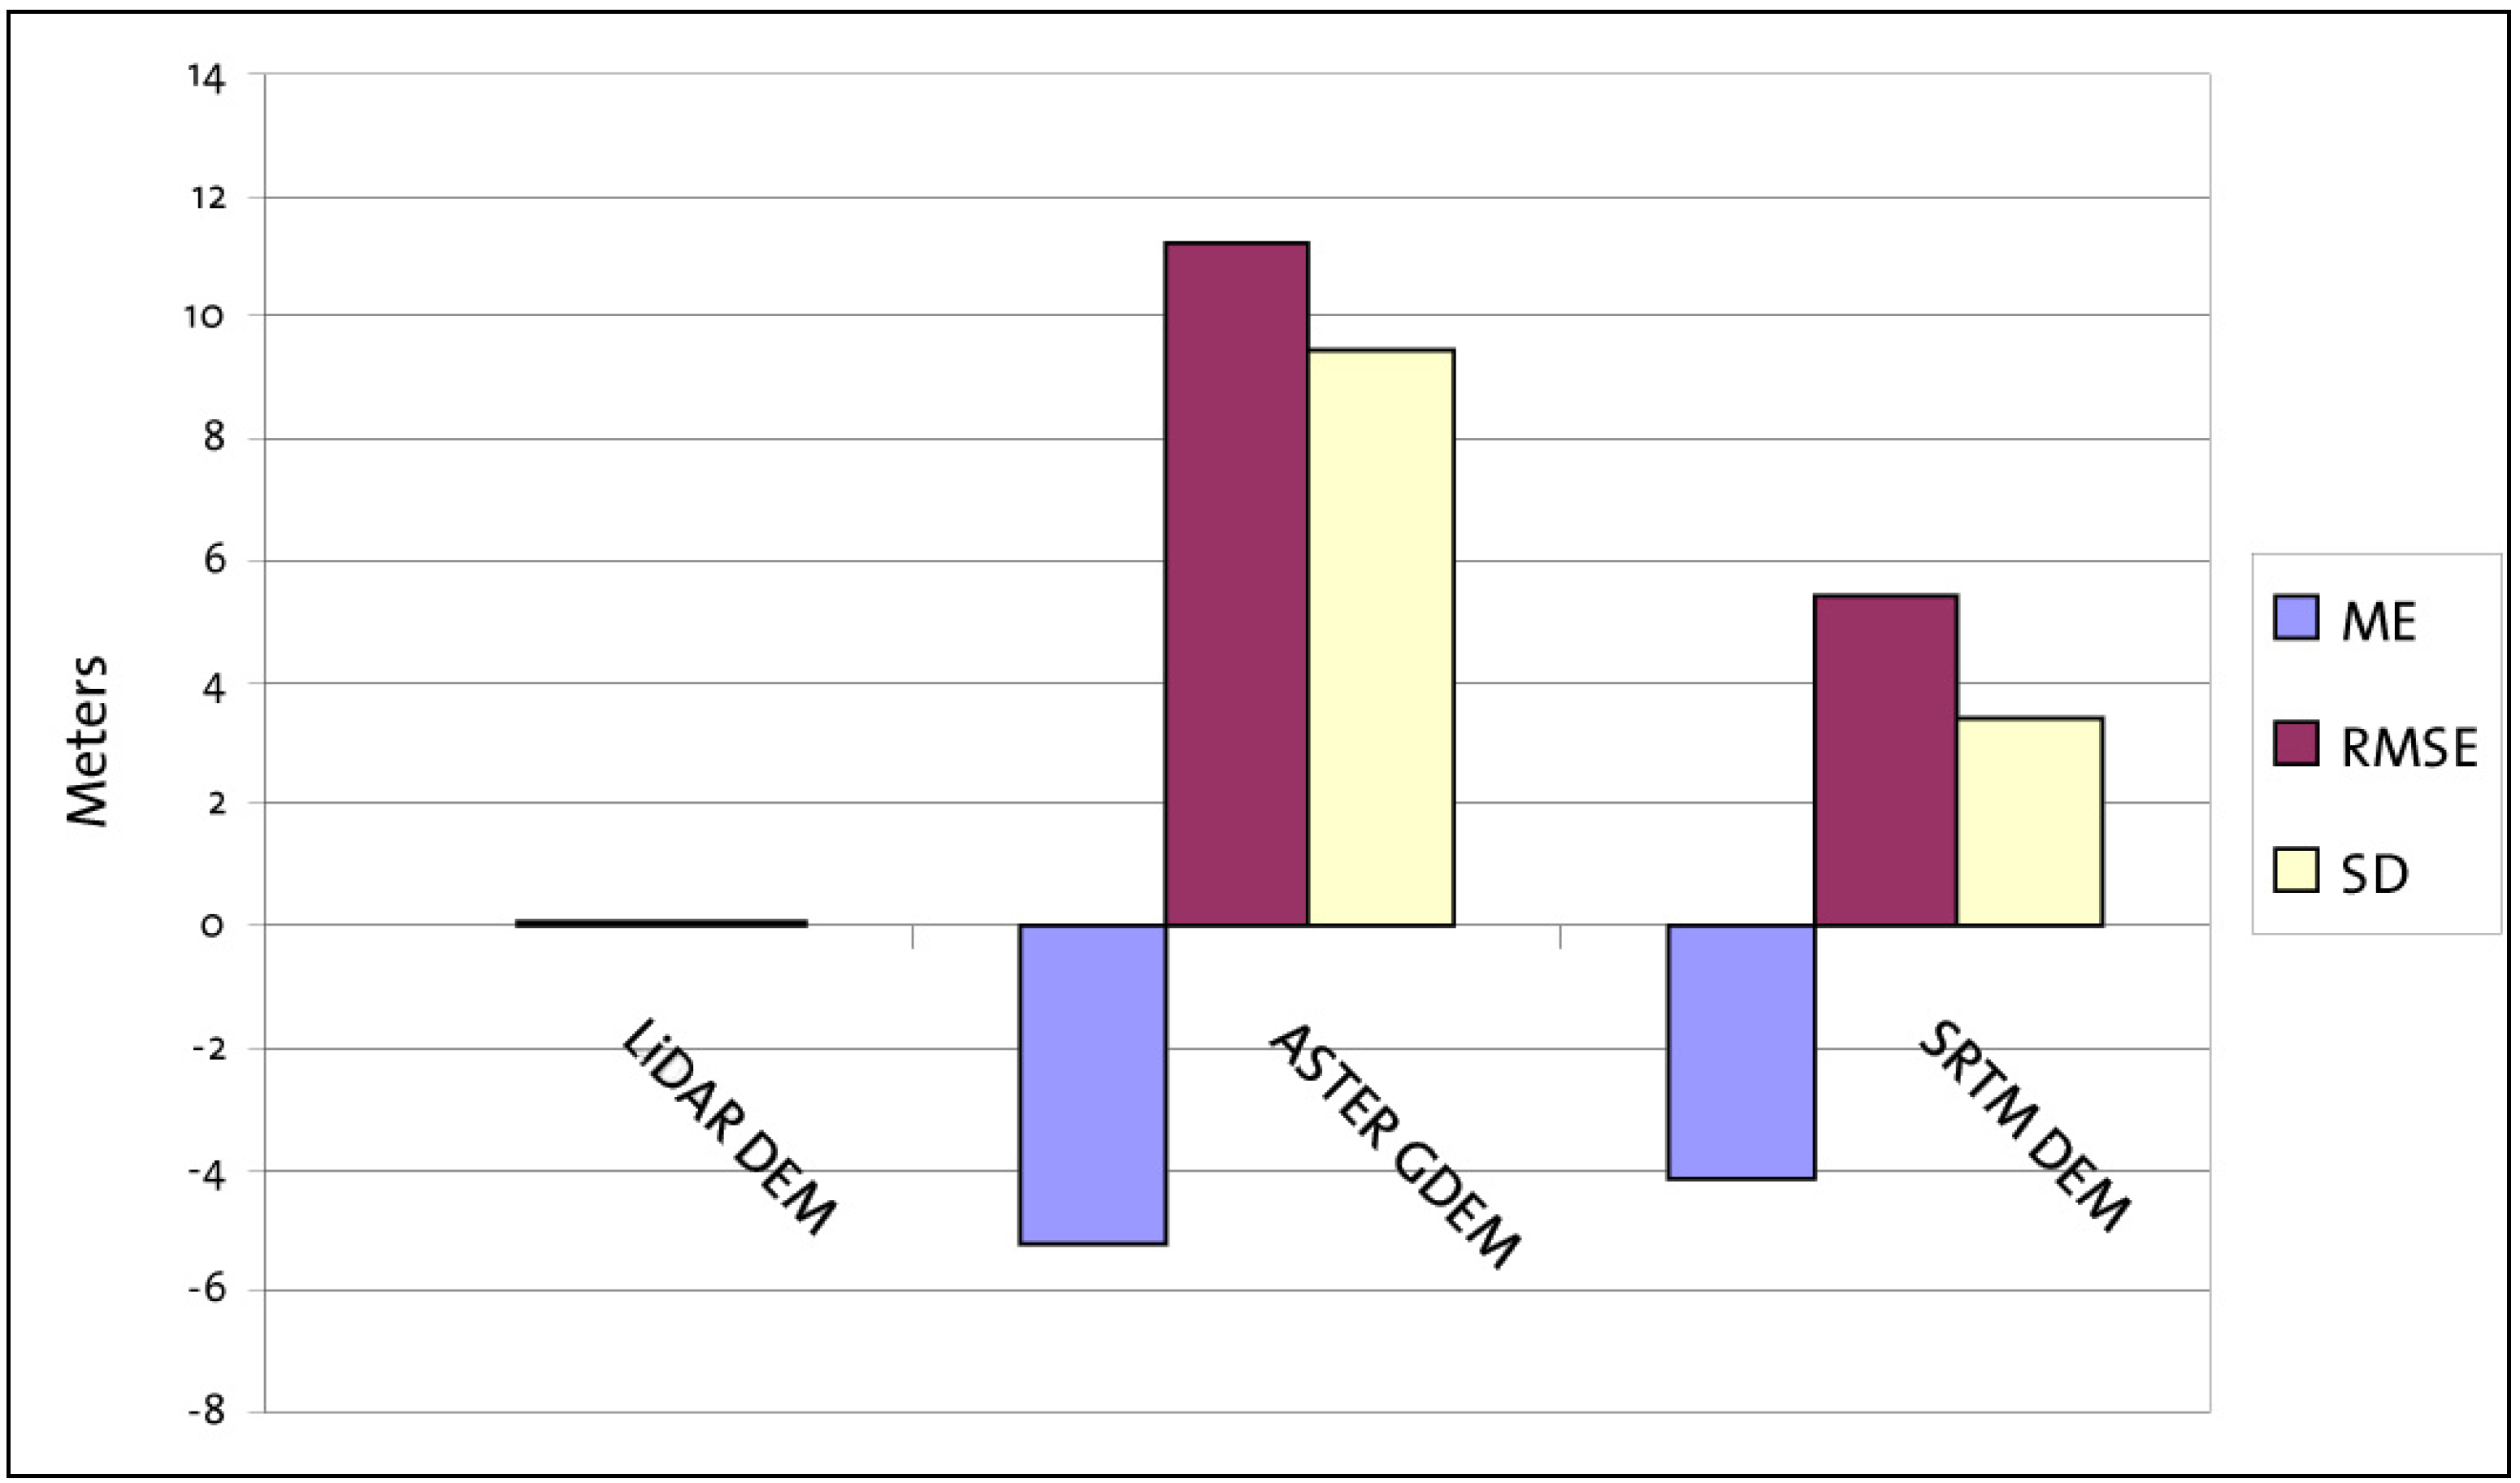
The results show that the estimated LECZ area estimated by the SRTM DEM is four times smaller than the LECZ area estimated by the LiDAR DEM. The results generated by the ASTER GDEM provide an area that is almost seven times smaller than LiDAR DEM estimations. For the error statistics you see larger magnitudes in all accuracy components for ASTER GDEM than for SRTM DEM (see <xref ref-type="fig" rid="water-04-00568-f007">Figure 7</xref>). SRTM DEM shows an ME of −4.2 m, whereas ASTER GDEM shows an ME of −5.25 m. This means that both public DEM datasets overestimate the elevation for Lagos State area and consequently underestimate the risk of flooding. From the perspective of the elevation focusing scale of this case study, you see that the RMSE of both public DEMs (respectively 11.3 m and 5.3 m.) is even larger than the defined range of the LECZ (0–5 m above mean sea level).</p>
        <fig id="water-04-00568-f006" position="anchor">
          <label>Figure 6</label>
          <caption>
            <p>Terrain elevation (upper image; the more brownish, the higher the elevation) and LECZ area (lower image, LECZ indicated in red) for one of the strips.</p>
          </caption>
          <graphic xmlns:xlink="http://www.w3.org/1999/xlink" xlink:href="water-04-00568-g006.tif"/>
        </fig>
        
		<fig id="water-04-00568-f007" position="anchor">
          <label>Figure 7</label>
          <caption>
            <p>Error statistics.</p>
          </caption>
          <graphic xmlns:xlink="http://www.w3.org/1999/xlink" xlink:href="water-04-00568-g007.tif"/>
        </fig>
      </sec>
      <sec>
        <title>3.2. Results Lagos City Scale</title>
        <p>
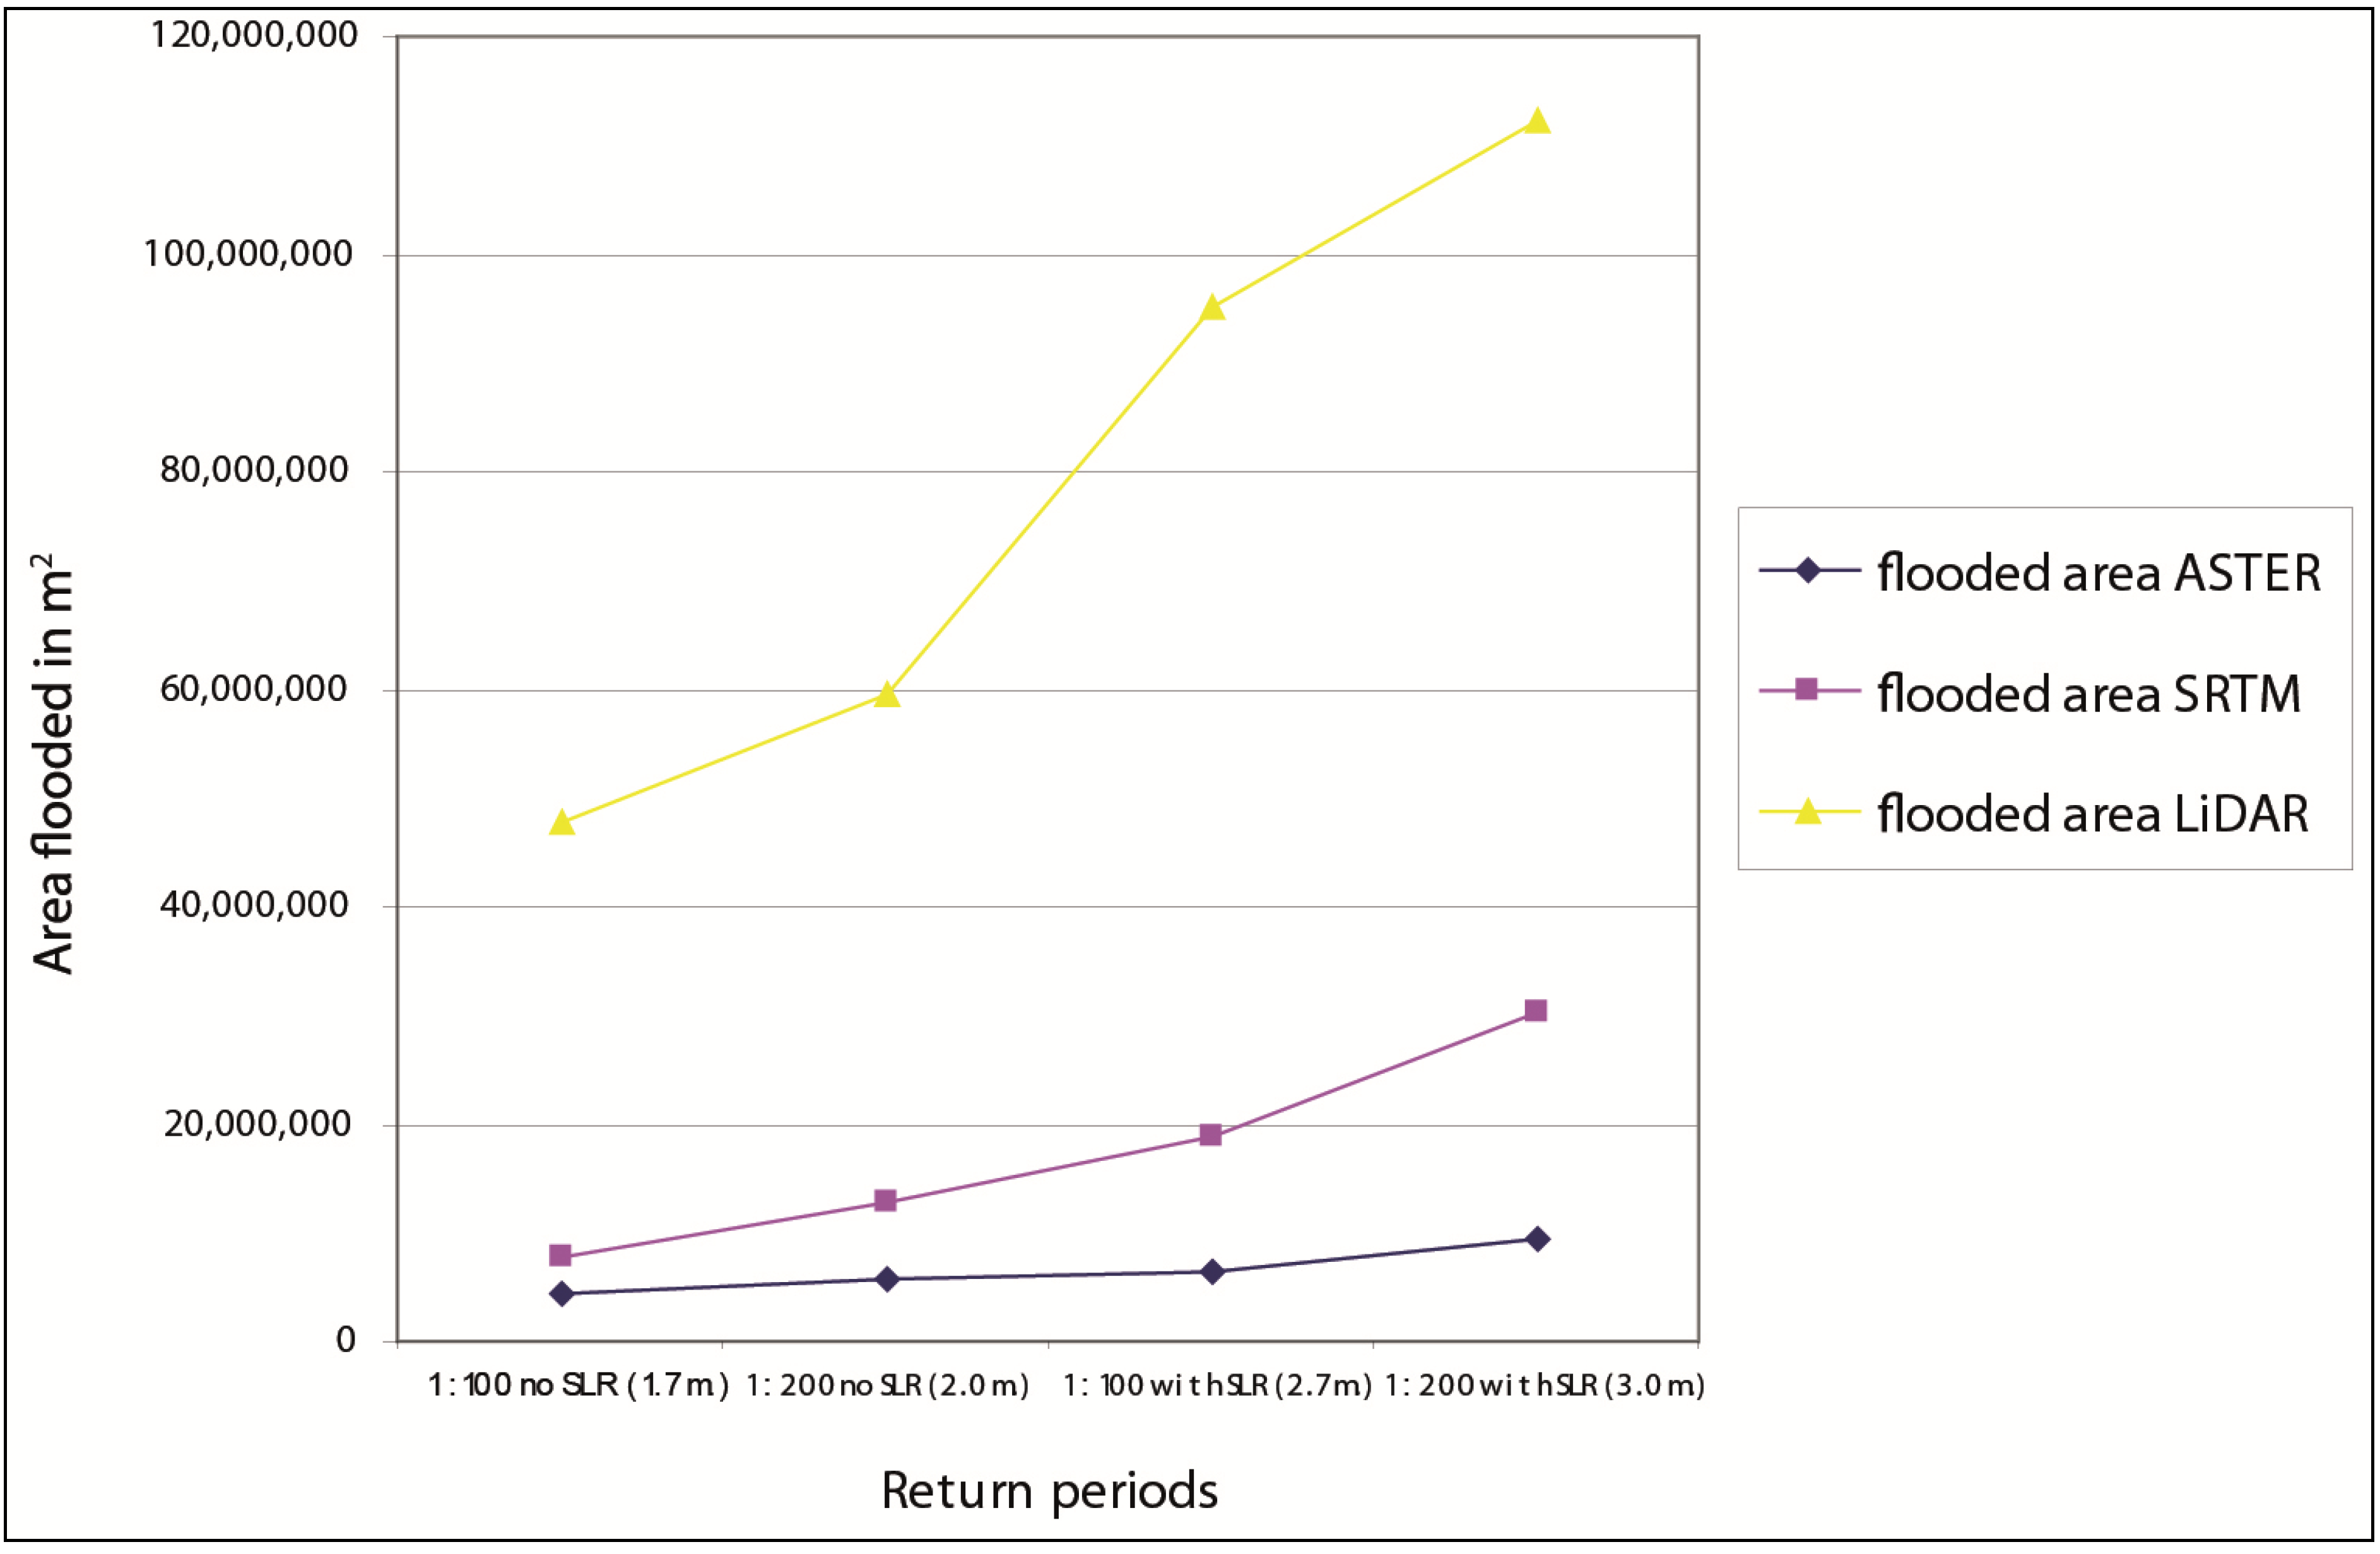
For the Lagos City study area it was possible to make use of the full data coverage of the study extent. The focusing scale applied in this case study is more precise and is meant as a case study where the precision of estimations approximates detail levels which are tangible, such as affected neighborhoods or affected houses which are inundated in flood areas during a plausible event. The results are shown in <xref ref-type="fig" rid="water-04-00568-f008">Figure 8</xref> and <xref ref-type="table" rid="water-04-00568-t003">Table 3</xref>.</p>
        <fig id="water-04-00568-f008" position="anchor">
          <label>Figure 8</label>
          <caption>
            <p>Flooded area estimated by ASTER, SRTM and LiDAR for Lagos City.</p>
          </caption>
          <graphic xmlns:xlink="http://www.w3.org/1999/xlink" xlink:href="water-04-00568-g008.tif"/>
        </fig>
        <table-wrap id="water-04-00568-t003" position="anchor">
          <object-id pub-id-type="pii">water-04-00568-t003_Table 3</object-id>
          <label>Table 3</label>
          <caption>
            <p>Percentages of ASTER GDEM and SRTM DEM of flooded areas compared to LiDAR DEM.</p>
          </caption>
          <table>
<thead>
              <tr align="center">
                <th valign="middle">Return period</th>
                <th valign="middle">Waterlevel in [m] + MSL</th>
                <th valign="middle">Sea level rise</th>
                <th valign="middle">% Flooded area by ASTER compared to LiDAR DEM</th>
                <th valign="middle">% Flooded area by SRTM compared to LiDAR DEM</th>
              </tr>
            </thead>
            <tbody>
              <tr align="center">
                <td valign="middle">1/100 yr</td>
                <td valign="middle">1.7</td>
                <td rowspan="2" valign="middle">Without</td>
                <td valign="middle">9</td>
                <td valign="middle">16</td>
              </tr>
              <tr align="center">
                <td valign="middle">1/200 yr</td>
                <td valign="middle">2.0</td>
                <td valign="middle">9</td>
                <td valign="middle">21</td>
              </tr>
              <tr align="center">
                <td valign="middle">1/100 yr</td>
                <td valign="middle">2.7</td>
                <td rowspan="2" valign="middle">With</td>
                <td valign="middle">7</td>
                <td valign="middle">20</td>
              </tr>
              <tr align="center">
                <td valign="middle">1/200 yr</td>
                <td valign="middle">3.0</td>
                <td valign="middle">8</td>
                <td valign="middle">27</td>
              </tr>
            </tbody>
          </table>
		  </table-wrap>
        
		<p>Again the flood areas (in Lagos State case, the LECZ areas) estimated by the ASTER GDEM and the SRTM DEM are significantly smaller than the estimations by LiDAR DEM. SRTM DEM estimates results that are closer to LiDAR DEM than ASTER GDEM. It could be observed that in the Lagos City case scale, the deviations of both public DEMs in relation to the LiDAR DEM estimations were larger than the deviations in the Lagos State case scale. Especially ASTER GDEM (with percentages not higher than 10%) provides large hazard indication deviations. </p>
      </sec>
    </sec>
    <sec sec-type="conclusions">
      <title>4. Conclusions and Discussion</title>
      <p>This study shows that attention should be paid in the application of publically available DEMs to support coastal flood risk assessments at different geospatial and elevation scales. In this case study, a comparison was made between public DEMs and very accurate vertical elevation measurements (LiDAR DEM). It can be concluded that the resulting flood risk can deviate significantly in such magnitudes that ASTER GDEM and SRTM DEM do not meet the accuracy requirements for the coastal flood risk assessment applied on Lagos State. Both ASTER GDEM and SRTM DEM overestimate the land elevation and, therefore, underestimate the flood hazard and associated risk. The overestimation is mainly due to the sensor techniques used in both publicly available datasets. The DSMs include elevations of vegetation and buildings. More research is needed to reveal the deviation magnitudes of elevations for different land-uses like forests, urban areas, and open areas. Although ASTER GDEM and SRTM DEM are Digital Surface Models instead of Digital Terrain Models, these datasets are widely used across the world for coastal flood risk assessments. Therefore these datasets should be compared and analyzed in original state to elevation data with a higher resolution and accuracy to reveal flood risk outcome differences. Underestimating hazards and risks in coastal flood risk assessments based on SRTM DEM or ASTER GDEM data is of concern, especially when investment decisions are made or policy procedures are adopted.</p>
      <p>The flood inundation maps using SRTM DEM or ASTER GDEM show an inundated area at least four times smaller than a LiDAR DEM based inundation map. Although the horizontal resolution of ASTER GDEM is higher than SRTM DEM, the risk estimate of ASTER GDEM deviates significantly more from the LiDAR DEM risk estimate than the SRTM DEM does. A comparison of a coastal flood risk assessment at two geospatial scales (Lagos State and Lagos City) using the ASTER GDEM land elevation shows that the bias increases when the risk assessment becomes more geographically detailed, for instance when zooming in on a map. The same conclusion can be made for flood risk assessments using the STRM DEM land elevation, although the bias is smaller.</p>
      <p>Despite the fact that this case study has been conducted for one location only (Lagos State area) the conclusions are relevant for other delta areas in the world as well. SRTM DEM and ASTER GDEM are extensively used across the globe in order to assess coastal flood risks. The findings are important to take into account when selecting publically available data sets for coastal flood risk assessments for low-lying deltas. In addition, conclusions based on a coastal flood risk assessment performed using these publically available data sets should be reevaluated taking into consideration this accuracy level. In addition to this, the absolute terrain elevation (relative to mean sea level, chart datum, <italic>etc</italic>.) is critical information for any GIS-based coastal flood risk assessment. If the elevation data (SRTM DEM or ASTER GDEM) shows an overestimation throughout its entire global dataset, this influences the results of any flood risk assessment with highly plausible underestimations of the flood risk. However, there is a need for further research to conclude whether there is a trend that SRTM DEM and ASTER GDEM show an overestimation of the elevation in low-lying delta areas across the globe with resulting underestimation of flood hazards for the studied areas. </p>
    </sec>
  </body>
  <back>
    <ref-list>
      <title>References</title>
      <ref id="B1-water-04-00568">
        <label>1.</label>
        <citation citation-type="other">
          <article-title>Intergovernmental Panel on Climate Change</article-title>
		  <source>Summary for Policymakers, The Physical Science Basis</source>
          <publisher-name>Cambridge University Press</publisher-name>
          <publisher-loc>New York, NY, USA</publisher-loc>
		  <year>2007</year>
        </citation>
      </ref>
      <ref id="B2-water-04-00568">
        <label>2.</label>
        <citation citation-type="book">
          <person-group person-group-type="author">
            <name>
              <surname>Nicholls</surname>
              <given-names>R.J.</given-names>
            </name>
            <name>
              <surname>Wong</surname>
              <given-names>P.P.</given-names>
            </name>
            <name>
              <surname>Burkett</surname>
              <given-names>V.R.</given-names>
            </name>
            <name>
              <surname>Codignotto</surname>
              <given-names>J.</given-names>
            </name>
            <name>
              <surname>Hay</surname>
              <given-names>J.</given-names>
            </name>
            <name>
              <surname>McLean</surname>
              <given-names>R.</given-names>
            </name>
            <name>
              <surname>Ragoonaden</surname>
              <given-names>S.</given-names>
            </name>
            <name>
              <surname>Woodroffe</surname>
              <given-names>C.D.</given-names>
            </name>
          </person-group>
          <source>Coastal Systems and Low-Lying Areas</source>
          <publisher-name>Cambridge University Press</publisher-name>
          <publisher-loc>New York, NY, USA</publisher-loc>
          <year>2007</year>
        </citation>
      </ref>
      <ref id="B3-water-04-00568">
        <label>3.</label>
        <citation citation-type="journal">
          <person-group person-group-type="author">
            <name>
              <surname>Nicholls</surname>
              <given-names>R.J.</given-names>
            </name>
            <name>
              <surname>Wong</surname>
              <given-names>P.P.</given-names>
            </name>
            <name>
              <surname>Burkett</surname>
              <given-names>V.R.</given-names>
            </name>
            <name>
              <surname>Woodroffe</surname>
              <given-names>C.D.</given-names>
            </name>
            <name>
              <surname>Hay</surname>
              <given-names>J.</given-names>
            </name>
          </person-group>
          <article-title>Climate change and coastal vulnerability assessment: Scenarios for integrated assessment</article-title>
          <source>Sustain. Sci.</source>
          <year>2008</year>
          <volume>3</volume>
          <fpage>89</fpage>
          <lpage>102</lpage>
          <pub-id pub-id-type="doi">10.1007/s11625-008-0050-4</pub-id>
        </citation>
      </ref>
      <ref id="B4-water-04-00568">
        <label>4.</label>
        <citation citation-type="journal">
          <person-group person-group-type="author">
            <name>
              <surname>McGranahan</surname>
              <given-names>G.</given-names>
            </name>
            <name>
              <surname>Balk</surname>
              <given-names>D.</given-names>
            </name>
            <name>
              <surname>Anderson</surname>
              <given-names>B.</given-names>
            </name>
          </person-group>
          <article-title>The rising tide: Assessing the risks of climate change and human settlements in low elevation coastal zones</article-title>
          <source>Environ. Urban.</source>
          <year>2007</year>
          <volume>19</volume>
          <fpage>17</fpage>
          <lpage>37</lpage>
          <pub-id pub-id-type="doi">10.1177/0956247807076960</pub-id>
        </citation>
      </ref>
      <ref id="B5-water-04-00568">
        <label>5.</label>
        <citation citation-type="web">
          <collab>Globalfloodmap Home Page</collab>
          <access-date>(accessed on 26 July 2012)</access-date>
          <comment>Available online:<ext-link xmlns:xlink="http://www.w3.org/1999/xlink" xlink:href="http://www.globalfloodmap.org" ext-link-type="uri">http://www.globalfloodmap.org</ext-link></comment>
        </citation>
      </ref>
      <ref id="B6-water-04-00568">
        <label>6.</label>
        <citation citation-type="web">
          <collab>Globalwarmingart</collab>
          <access-date>(accessed on 26 July 2012)</access-date>
          <comment>Available online:<ext-link xmlns:xlink="http://www.w3.org/1999/xlink" xlink:href="http://www.globalwarmingart.com/wiki/Special:SeaLevel" ext-link-type="uri">http://www.globalwarmingart.com/wiki/Special:SeaLevel</ext-link></comment>
        </citation>
      </ref>
      <ref id="B7-water-04-00568">
        <label>7.</label>
        <citation citation-type="web">
          <collab>Flood Maps Home Page</collab>
          <access-date>(accessed on 26 July 2012)</access-date>
          <comment>Available online:<ext-link xmlns:xlink="http://www.w3.org/1999/xlink" xlink:href="http://flood.firetree.net" ext-link-type="uri">http://flood.firetree.net</ext-link></comment>
        </citation>
      </ref>
      <ref id="B8-water-04-00568">
        <label>8.</label>
        <citation citation-type="book">
          <collab>EXCIMAP (European exchange circle on flood mapping)</collab>
          <source>Handbook on Good Practices for Flood Mapping in Europe</source>
          <person-group person-group-type="editor">
            <name>
              <surname>Martini</surname>
              <given-names>F.</given-names>
            </name>
            <name>
              <surname>Loat</surname>
              <given-names>R.</given-names>
            </name>
          </person-group>
          <publisher-name>Drukkerij Feiko Stevens</publisher-name>
          <publisher-loc>Emmeloord, The Netherlands</publisher-loc>
          <year>2007</year>
        </citation>
      </ref>
      <ref id="B9-water-04-00568">
        <label>9.</label>
        <citation citation-type="gov">
          <collab>National Research Council of the National Academies</collab>
          <source>Mapping the Zone, Improving Flood Map Accuracy</source>
          <publisher-name>The National Academies Press</publisher-name>
          <publisher-loc>Washington, DC, USA</publisher-loc>
          <year>2009</year>
        </citation>
      </ref>
      <ref id="B10-water-04-00568">
        <label>10.</label>
        <citation citation-type="journal">
          <person-group person-group-type="author">
            <name>
              <surname>Colby</surname>
              <given-names>J.D.</given-names>
            </name>
            <name>
              <surname>Dobson</surname>
              <given-names>J.G.</given-names>
            </name>
          </person-group>
          <article-title>Flood modelling in the coastal plains and mountains: Analysis of terrain resolution</article-title>
          <source>Nat. Hazards Rev.</source>
          <year>2010</year>
          <volume>11</volume>
          <fpage>19</fpage>
          <lpage>28</lpage>
          <pub-id pub-id-type="doi">10.1061/(ASCE)1527-6988(2010)11:1(19)</pub-id>
        </citation>
      </ref>
      <ref id="B11-water-04-00568">
        <label>11.</label>
        <citation citation-type="web">
          <collab>METI &amp; NASA Home Page</collab>
          <access-date>(accessed on 16 July 2012)</access-date>
          <comment>Available online:<ext-link xmlns:xlink="http://www.w3.org/1999/xlink" xlink:href="http://www.gdem.aster.ersdac.or.jp/" ext-link-type="uri">http://www.gdem.aster.ersdac.or.jp/</ext-link></comment>
        </citation>
      </ref>
      <ref id="B12-water-04-00568">
        <label>12.</label>
        <citation citation-type="web">
          <collab>CGIAR: Consortium for Spatial Information (CGIAR-CSI) Home Page</collab>
          <access-date>(accessed on 16 July 2012)</access-date>
          <comment>Available online:<ext-link xmlns:xlink="http://www.w3.org/1999/xlink" xlink:href="http://srtm.csi.cgiar.org/" ext-link-type="uri">http://srtm.csi.cgiar.org/</ext-link></comment>
        </citation>
      </ref>
      <ref id="B13-water-04-00568">
        <label>13.</label>
        <citation citation-type="gov">
          <collab>Federal Emergency Management Agency</collab>
          <article-title>Airborne light detection and ranging systems</article-title>
          <source>LiDAR Specifications for Flood Hazard Mapping</source>
          <publisher-name>FEMA</publisher-name>
          <publisher-loc>Washington, DC, USA</publisher-loc>
          <year>2002</year>
        </citation>
      </ref>
      <ref id="B14-water-04-00568">
        <label>14.</label>
        <citation citation-type="journal">
          <person-group person-group-type="author">
            <name>
              <surname>Demirkesen</surname>
              <given-names>A.C.</given-names>
            </name>
            <name>
              <surname>Evrendilik</surname>
              <given-names>F.</given-names>
            </name>
            <name>
              <surname>Berberoglu</surname>
              <given-names>S.</given-names>
            </name>
            <name>
              <surname>Kilic</surname>
              <given-names>S.</given-names>
            </name>
          </person-group>
          <article-title>Coastal flood risk analysis using Landsat-7 ETM+ imagery and SRTM DEM: A case study of Izmir, Turkey</article-title>
          <source>Environ. Monit. Assess.</source>
          <year>2007</year>
          <volume>131</volume>
          <fpage>293</fpage>
          <lpage>300</lpage>
          <pub-id pub-id-type="doi">10.1007/s10661-006-9476-2</pub-id>
        </citation>
      </ref>
      <ref id="B15-water-04-00568">
        <label>15.</label>
        <citation citation-type="book">
          <person-group person-group-type="author">
            <name>
              <surname>De Roo</surname>
              <given-names>A.</given-names>
            </name>
            <name>
              <surname>Barredo</surname>
              <given-names>J.</given-names>
            </name>
            <name>
              <surname>Lavalle</surname>
              <given-names>C.</given-names>
            </name>
            <name>
              <surname>Bodis</surname>
              <given-names>K.</given-names>
            </name>
            <name>
              <surname>Bonk</surname>
              <given-names>R.</given-names>
            </name>
          </person-group>
          <article-title>Potential flood hazard and risk mapping at Pan-European scale</article-title>
          <source>Digital Terrain Modelling</source>
          <publisher-name>Springer</publisher-name>
          <publisher-loc>Berlin, Germany</publisher-loc>
          <year>2007</year>
          <fpage>183</fpage>
          <lpage>202</lpage>
        </citation>
      </ref>
      <ref id="B16-water-04-00568">
        <label>16.</label>
        <citation citation-type="journal">
          <person-group person-group-type="author">
            <name>
              <surname>Lugeri</surname>
              <given-names>N.</given-names>
            </name>
            <name>
              <surname>Kundzewicz</surname>
              <given-names>Z.W.</given-names>
            </name>
            <name>
              <surname>Genovese</surname>
              <given-names>E.</given-names>
            </name>
            <name>
              <surname>Hochrainer</surname>
              <given-names>S.</given-names>
            </name>
            <name>
              <surname>Radziejewski</surname>
              <given-names>M.</given-names>
            </name>
          </person-group>
          <article-title>River flood risk and adaptation in Europe-Assessment of the present status</article-title>
          <source>Mitig. Adapt. Strateg. Glob. Chang.</source>
          <year>2010</year>
          <volume>15</volume>
          <fpage>621</fpage>
          <lpage>639</lpage>
          <pub-id pub-id-type="doi">10.1007/s11027-009-9211-8</pub-id>
        </citation>
      </ref>
      <ref id="B17-water-04-00568">
        <label>17.</label>
        <citation citation-type="book">
          <person-group person-group-type="author">
            <name>
              <surname>Li</surname>
              <given-names>Z.</given-names>
            </name>
            <name>
              <surname>Zhu</surname>
              <given-names>Q.</given-names>
            </name>
            <name>
              <surname>Gold</surname>
              <given-names>C.</given-names>
            </name>
          </person-group>
          <source>Digital Terrain Modeling: Principles and Methodology</source>
          <publisher-name>CRC Press</publisher-name>
          <publisher-loc>Boca Raton, FI, USA</publisher-loc>
          <year>2005</year>
        </citation>
      </ref>
      <ref id="B18-water-04-00568">
        <label>18.</label>
        <citation citation-type="journal">
          <person-group person-group-type="author">
            <name>
              <surname>Holmes</surname>
              <given-names>K.W.</given-names>
            </name>
            <name>
              <surname>Chadwick</surname>
              <given-names>O.A.</given-names>
            </name>
            <name>
              <surname>Kyriakidis</surname>
              <given-names>P.C.</given-names>
            </name>
          </person-group>
          <article-title>Error in a USGS 30-meter digital elevation model and its impact on terrain modeling</article-title>
          <source>J. Hydrol.</source>
          <year>2000</year>
          <volume>233</volume>
          <fpage>154</fpage>
          <lpage>173</lpage>
          <pub-id pub-id-type="doi">10.1016/S0022-1694(00)00229-8</pub-id>
        </citation>
      </ref>
      <ref id="B19-water-04-00568">
        <label>19.</label>
        <citation citation-type="journal">
          <person-group person-group-type="author">
            <name>
              <surname>Poulter</surname>
              <given-names>B.</given-names>
            </name>
            <name>
              <surname>Halpin</surname>
              <given-names>P.N.</given-names>
            </name>
          </person-group>
          <article-title>Raster modelling of coastal flooding from sea-level rise</article-title>
          <source>Int. J. Geogr. Inf. Sci.</source>
          <year>2008</year>
          <volume>22</volume>
          <fpage>167</fpage>
          <lpage>182</lpage>
          <pub-id pub-id-type="doi">10.1080/13658810701371858</pub-id>
        </citation>
      </ref>
      <ref id="B20-water-04-00568">
        <label>20.</label>
        <citation citation-type="web">
          <collab>GRUMP dataset developed by Center for International Earth Science Information Network Home Page</collab>
          <access-date>(accessed on 16 July 2012)</access-date>
          <comment>Available online:<ext-link xmlns:xlink="http://www.w3.org/1999/xlink" xlink:href="http://sedac.ciesin.columbia.edu/data/set/grump-v1-urban-extents" ext-link-type="uri">http://sedac.ciesin.columbia.edu/data/set/grump-v1-urban-extents</ext-link></comment>
        </citation>
      </ref>
      <ref id="B21-water-04-00568">
        <label>21.</label>
        <citation citation-type="journal">
          <person-group person-group-type="author">
            <name>
              <surname>Fisher</surname>
              <given-names>P.</given-names>
            </name>
            <name>
              <surname>Tate</surname>
              <given-names>T.</given-names>
            </name>
          </person-group>
          <article-title>Causes and consequences of error in digital elevation models</article-title>
          <source>Prog. Phys. Geogr.</source>
          <year>2006</year>
          <volume>30</volume>
          <fpage>467</fpage>
          <lpage>489</lpage>
          <pub-id pub-id-type="doi">10.1191/0309133306pp492ra</pub-id>
        </citation>
      </ref>
    </ref-list>
  </back>
</article>
