Climate Change Impacts on Water Availability and Use in the Limpopo River Basin

Abstract
:1. Introduction


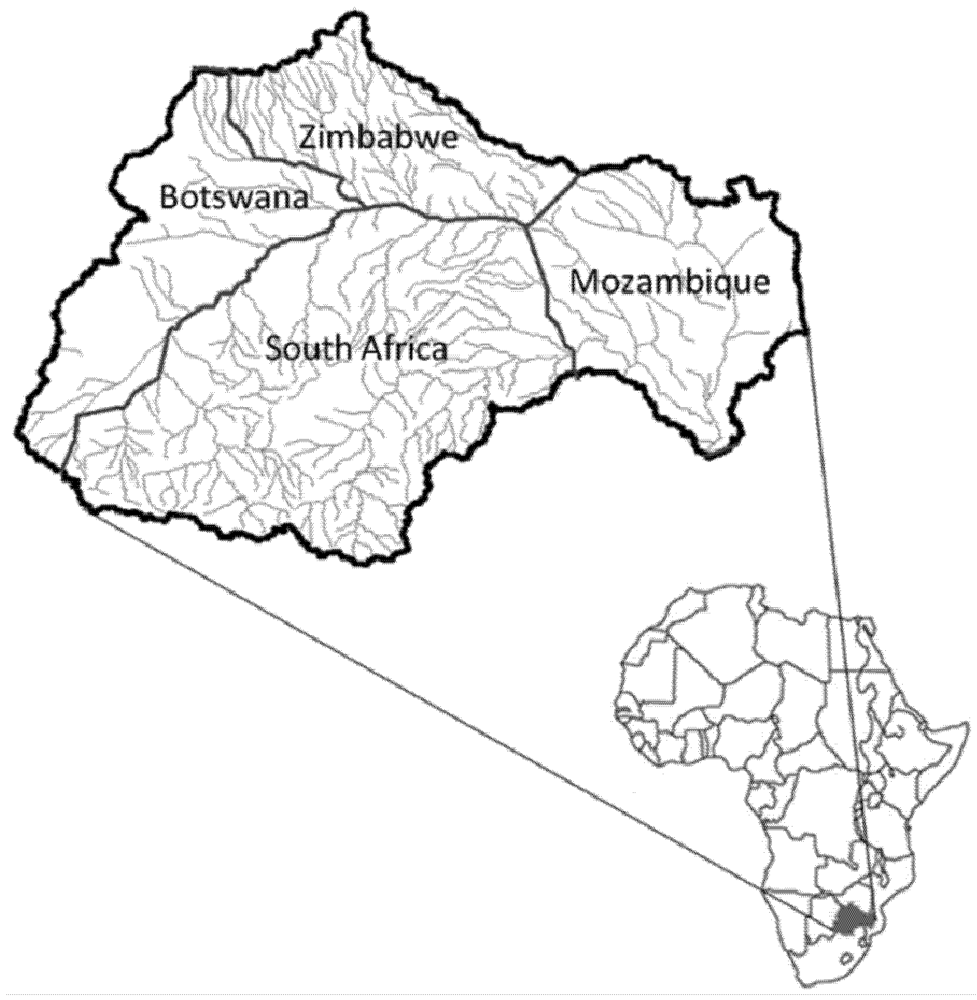
| Country | Area of country within basin (km2) | Share of total basin area (%) | Annual mean precipitation (mm) | Annual mean potential evapotranspiration (mm) |
|---|---|---|---|---|
| Botswana | 80118 | 19 | 422 | 1599 |
| Mozambique | 84981 | 21 | 751 | 1650 |
| South Africa | 185298 | 45 | 607 | 1570 |
| Zimbabwe | 62541 | 15 | 506 | 1592 |
| Basin | 412938 | 100 | 587 | 1596 |
2. Linked Modeling System for Water Availability and Use Simulation
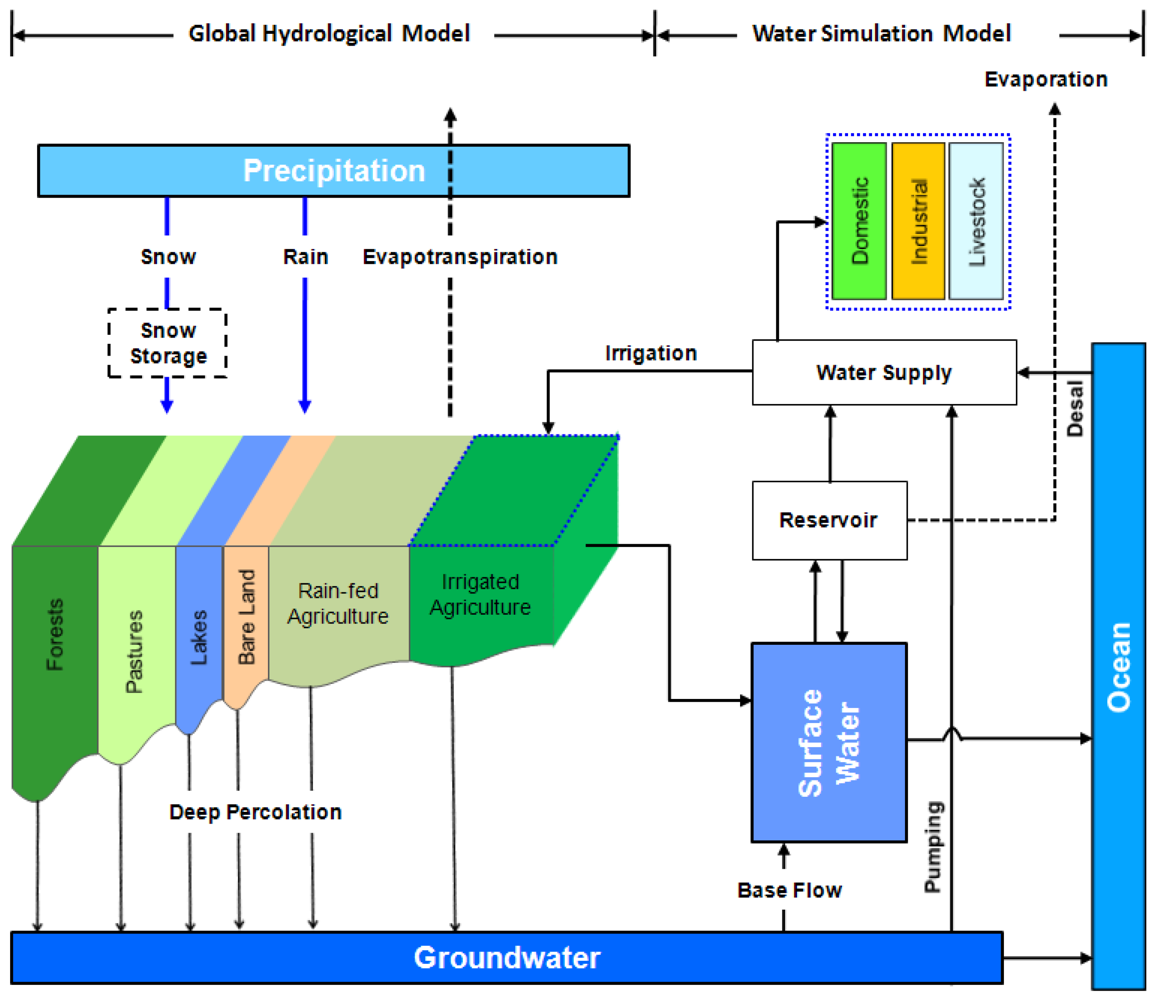
2.1. Hydrological Model
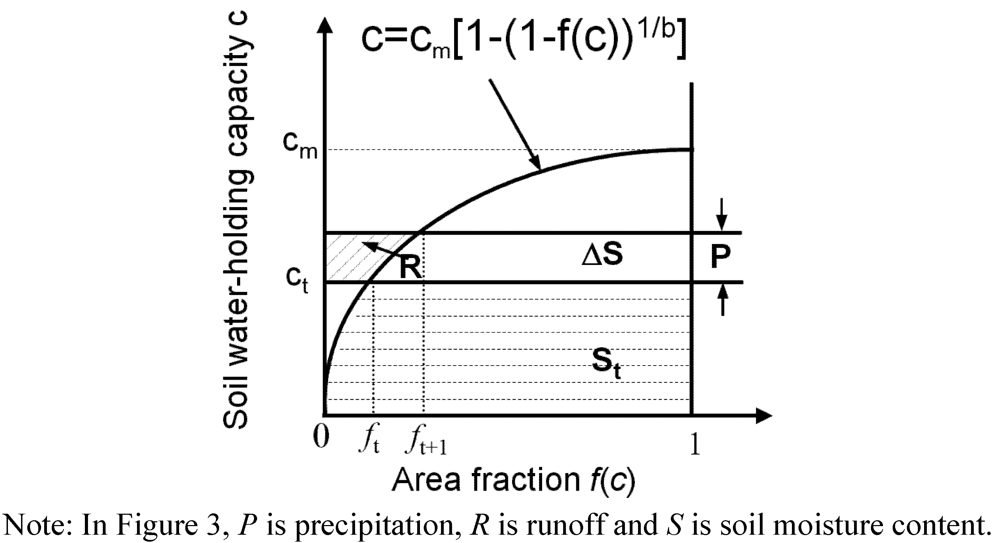
 (1)
(1) (2)
(2) is the fraction of area in a grid cell that has soil water-holding capacity values lower than c; Cm is the maximum soil water-holding capacity value across all points within the grid cell; and b is the “shape parameter” that defines the degree of spatial variability of soil moisture holding capacity c.
  (3)
(3)
 (4)
(4) ,
, (5)
(5) ,
, (6)
(6) (7)
(7) :
: (8)
(8) (9)
(9) (10)
(10) (11)
(11)
 (12)
(12) represents the observed flow in time period t,
  denotes the average of the observed flow over the entire simulation period, and
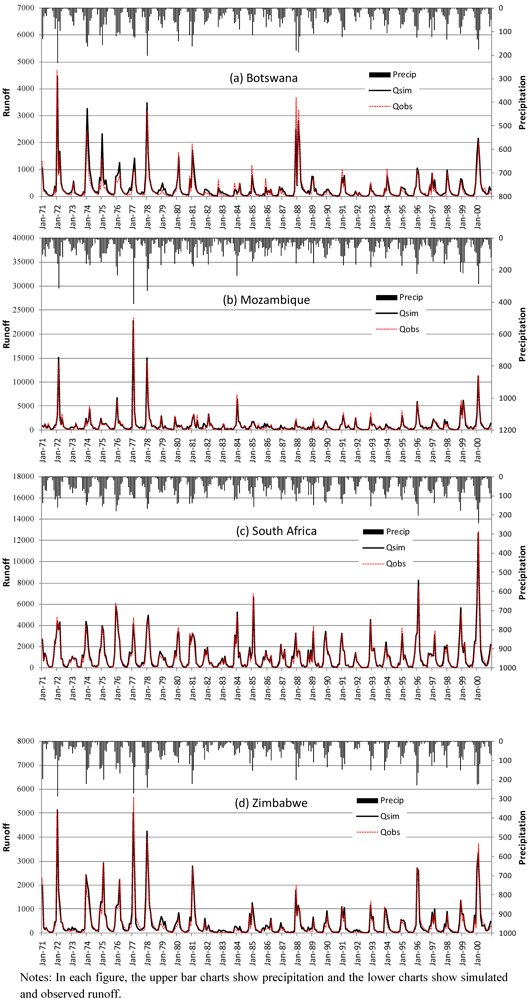
  is the simulated flow for time period t. By definition, the NSE value ranges from −∞ to 1, and the closer the model efficiency is to 1, the more accurate the model is. In our simulations for the Limpopo catchments, the NSE values are 0.913 and 0.906 in the calibration period and validation period, respectively, for the catchment in Botswana, 0.976 and 0.947 in Mozambique, 0.980 and 0.985 in South Africa, and 0.964 and 0.962 in Zimbabwe.
 2.2. Water Simulation Module

3. Climate Change and Socioeconomic Scenarios
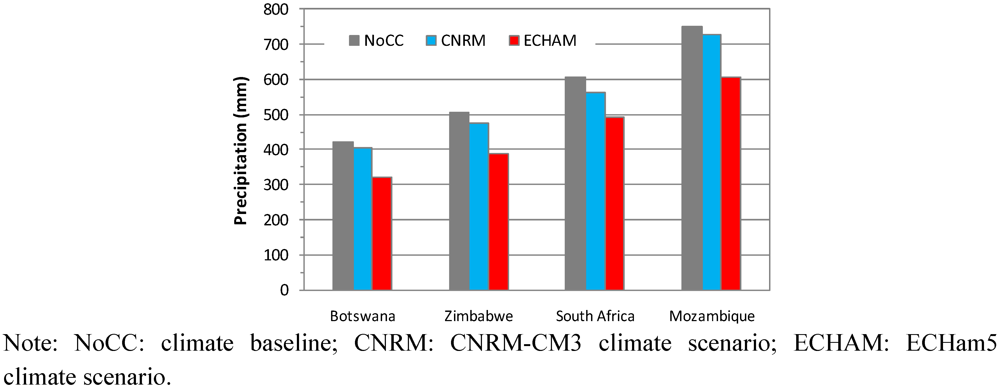
3.1. Climate Change Scenarios
3.2. Socioeconomic Scenario
3.3. Irrigation and Water Infrastructure Development Scenarios
4. Results
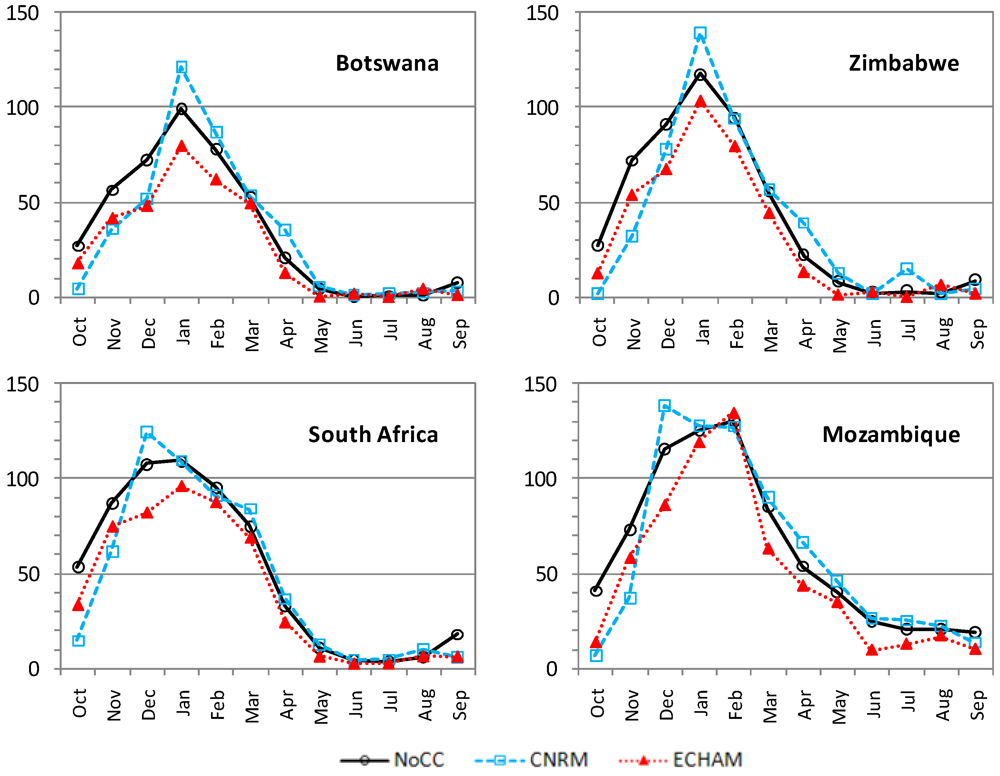
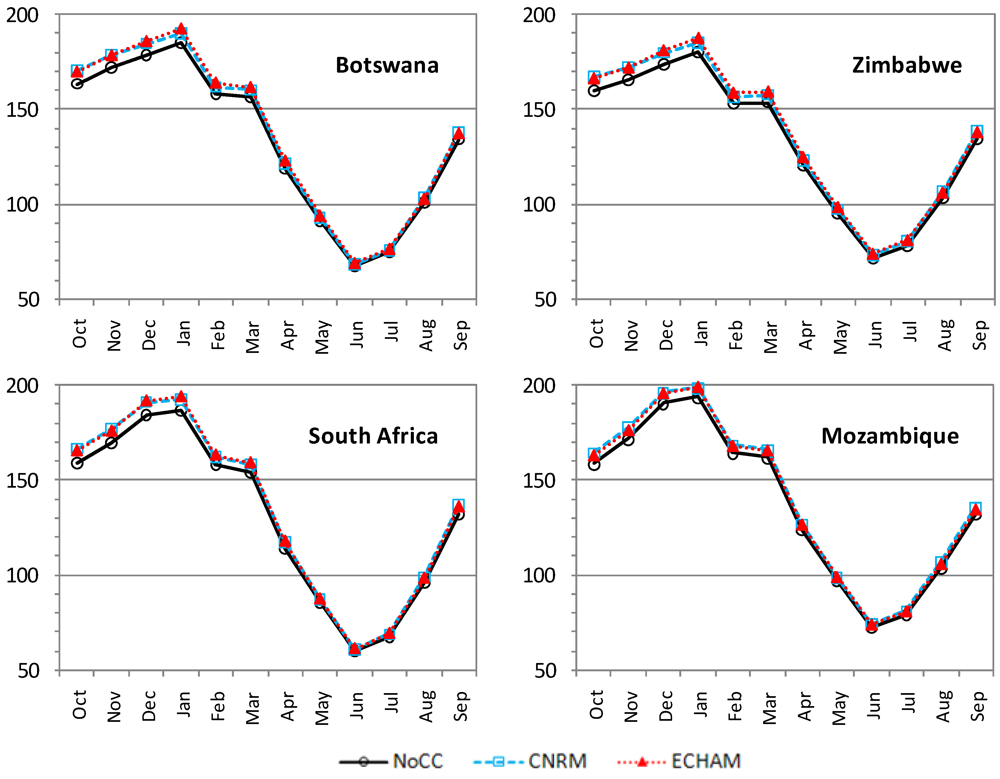
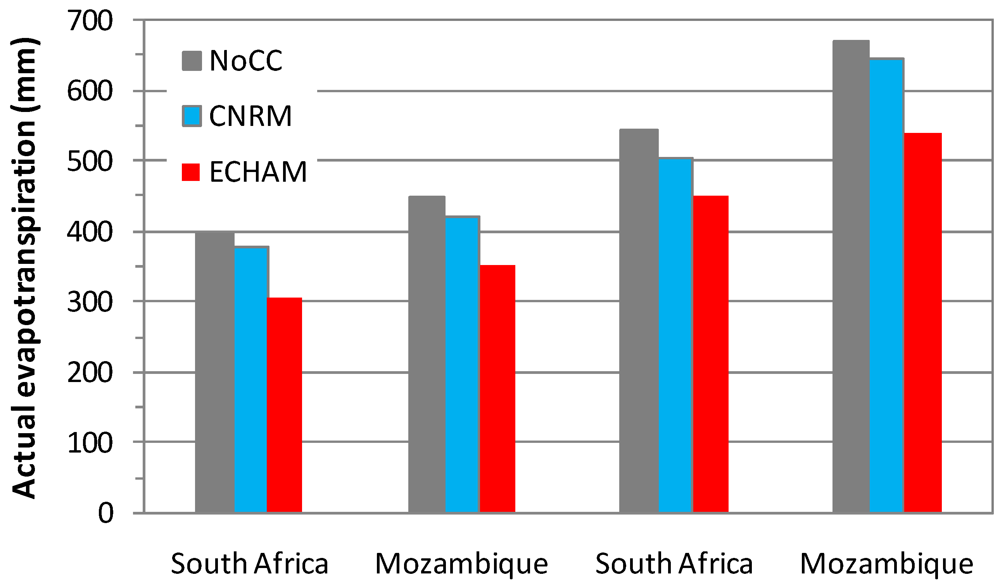
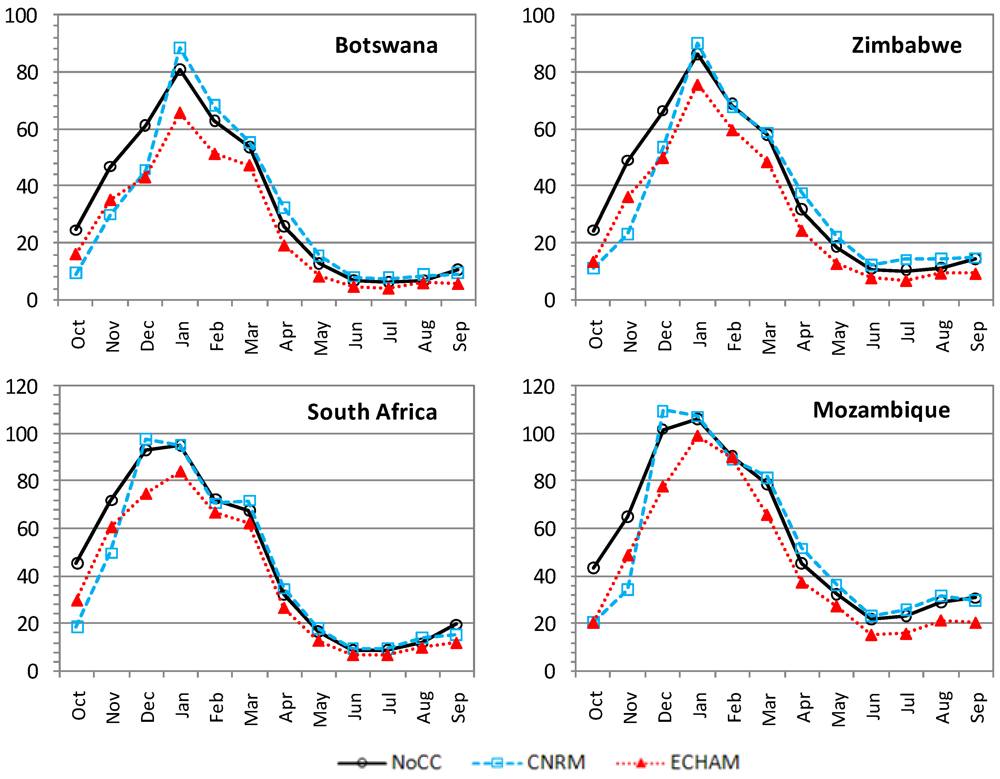
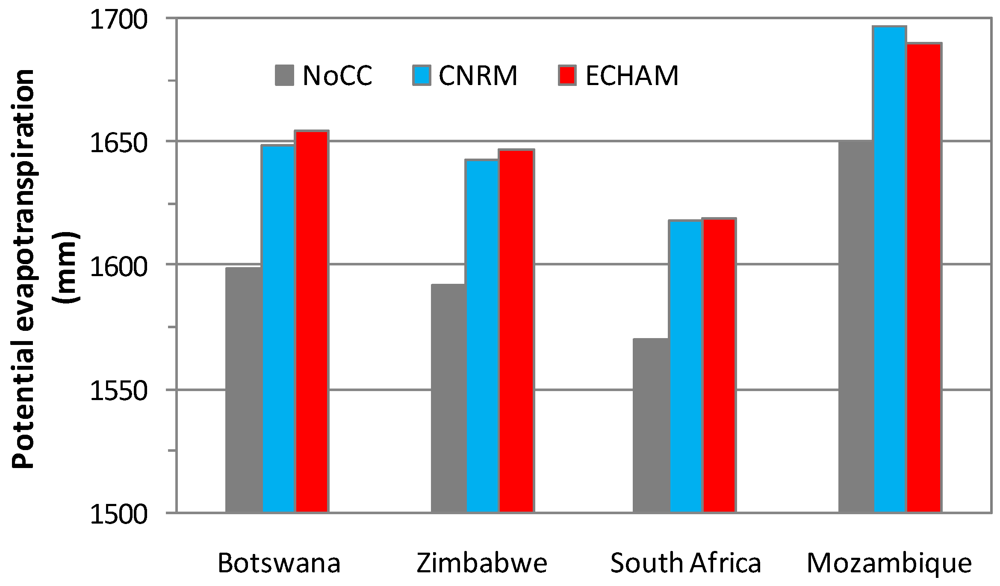
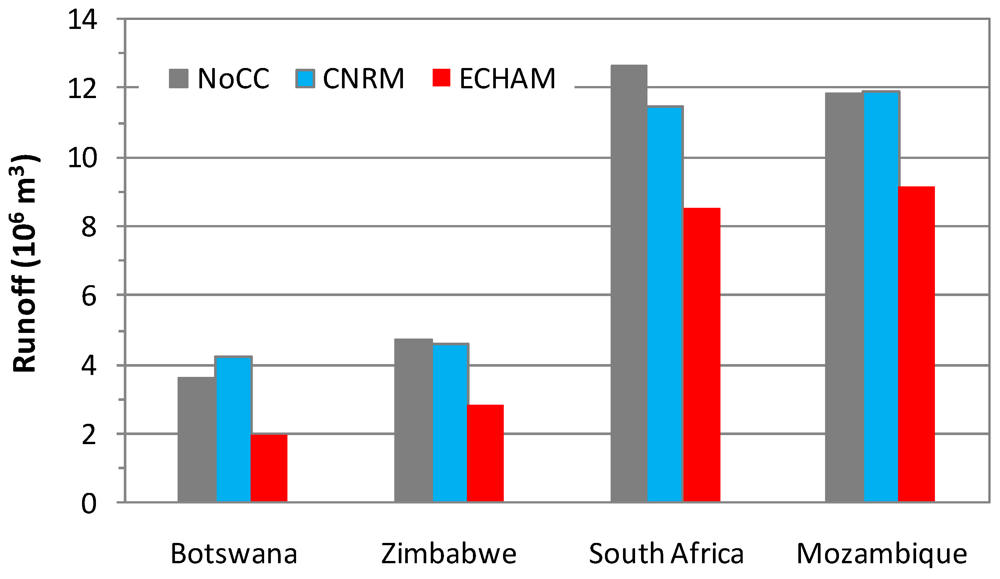
4.1. Hydrological Impacts


4.2. Irrigation Water Supply Reliability

5. Conclusions
Acknowledgements
References
- Trenberth, K.E.; Jones, P.D.; Ambenje, P.; Bojariu, R.; Easterling, D.; Klein Tank, A.; Parker, D.; Rahimzadeh, F.; Renwick, J.A.; Rusticucci, M.; et al. Observations: Surface and atmospheric climate change. In Climate Change 2007: The Physical Science Basis. Contribution of Working Group I to the Fourth Assessment Report of the Intergovernmental Panel on Climate Change; Solomon, S., Qin, D., Manning, M., Chen, Z., Marquis, M., Averyt, K.B., Tignor, M., Miller, H.L., Eds.; Cambridge University Press: Cambridge, UK and New York, NY, USA, 2007. [Google Scholar]
- Zhu, T.; Jenkins, M.W.; Lund, J.R. Estimated impacts of climate warming on California water availability under twelve future climate scenarios. J. Am. Water Resour. Assoc. 2005, 41, 1027–1038. [Google Scholar] [CrossRef]
- Arnell, N.W. Climate change and global water resources: SRES emissions and social-economic scenarios. Glob. Environ. Change 2004, 14, 31–52. [Google Scholar] [CrossRef]
- Rogers, P. Coping with global warming and climate change. J. Water Resour. Plan. Manag. 2010, 134, 203–204. [Google Scholar] [CrossRef]
- IPCC, Summary for policymakers. In Climate Change 2007: Impacts, Adaptation and Vulnerability. Contribution of Working Group II to the Fourth Assessment Report of the Intergovernmental Panel on Climate Change; Parry, M.L.; Canziani, O.F.; Palutikof, J.P.; van der Linden, P.J.; Hanson, C.E. (Eds.) Cambridge University Press: Cambridge, UK, 2007; pp. 7–22.
- Kundzewicz, Z.W.; Mata, L.J.; Arnell, N.W.; Döll, P.; Kabat, P.; Jiménez, B.; Miller, K.A.; Oki, T.; Sen, Z.; Shiklomanov, I.A. Freshwater resources and their management. In Climate Change 2007: Impacts, Adaptation and Vulnerability. Contribution of Working Group II to the Fourth Assessment Report of the Intergovernmental Panel on Climate Change; Parry, M.L., Canziani, O.F., Palutikof, J.P., van der Linden, P.J., Hanson, C.E., Eds.; Cambridge University Press: Cambridge, UK, 2007; pp. 173–210. [Google Scholar]
- Brown, C.; Lall, U. Water and economic development: The role of variability and a framework for resilience. Nat. Resour. Forum 2006, 30, 306–317. [Google Scholar] [CrossRef]
- FAO, Drought Impact Mitigation and Prevention in the Limpopo River Basin: A Situation Analysis; Land and Water Discussion Paper No. 40; Food and Agriculture Organization of the United Nations: Roma, Italy, 2004.
- CPWF, Limpopo Basin Profile: Strategic Research for Enhancing Agricultural Water Productivity; Challenge Program on Water and Food: Colombo, Sri Lanka, 2003.
- Reason, C.J.C.; Hachigonta, S.; Phaladi, R.F. Interannual variability season characteristics over the Limpopo region of Southern Africa. Int. J. Climatol. 2005, 25, 1835–1853. [Google Scholar] [CrossRef]
- IWMI, IDIS (Integrated Data Information System) Basin Kit— Limpopo Basin V 1.0 (CD-ROM); International Water Management Institute: Colombo, Sri Lanka, 2006.
- Mitchell, T.D.; Jones, P.D. An improved method of constructing a database of monthly climate observations and associated high-resolution grids. Int. J. Climatol. 2005, 25, 693–712. [Google Scholar] [CrossRef]
- Zhu, T.; Ringler, C.; Rosegrant, M.W. Development and Validation of a Global Hydrology Model for Climate Change Impact Assessment; International Food Policy Research Institute: Washington, DC, USA, 2010; Photocopy. [Google Scholar]
- Rosegrant, M.W.; Cai, X.; Cline, S.A. World Water and Food for 2025: Dealing with Scarcity; International Food Policy Research Institute: Washington, DC, USA, 2002. [Google Scholar]
- Rosegrant, M.W.; Msangi, S.; Ringler, C.; Sulser, T.B.; Zhu, T.; Cline, S.A. International Model for Policy Analysis of Agricultural Commodities and Trade (IMPACT): Model Description; International Food Policy Research Institute: Washington, DC, USA, 2008. [Google Scholar]
- Priestley, C.H.B.; Taylor, R.J. On the assessment of surface heat flux and evaporation using large scale parameters. Mon. Weather Rev. 1972, 100, 81–92. [Google Scholar]
- Shuttleworth, W.J. Evaporation. In Handbook of Hydrology; Maidment, D.R., Ed.; McGraw-Hill: New York, NY, USA, 1993. [Google Scholar]
- Zhao, R.J. The Xinanjiang model applied in China. J. Hydrol. 1992, 135, 371–381. [Google Scholar] [CrossRef]
- Wood, E.F.; Lettenmaier, D.P.; Zartarian, V.G. A land-surface hydrology parametrization with subgrid variability for general circulation models. J. Geophys. Res. 1992, 97, 2717–2728. [Google Scholar]
- Arnell, N.W. A simple water balance model for the simulation of streamflow over a large geographic domain. J. Hydrol. 1999, 217, 314–335. [Google Scholar] [CrossRef]
- Chow, V.T.; Maidment, D.R.; Mays, L.W. Applied Hydrology; McGraw-Hill: New York, NY, USA, 1988. [Google Scholar]
- Doll, P.; Kaspar, F.; Lehner, B. A global hydrological model for deriving water availability indicators: Model tuning and validation. J. Hydrol. 2003, 270, 105–134. [Google Scholar] [CrossRef]
- Alcamo, J.; Doll, P.; Henrichs, T.; Kaspar, F.; Lehner, B.; Rosch, T.; Siebert, S. Development and testing of the WaterGAP2 global model of water use and availability. Hydrol. Sci. J. 2003, 48, 317–337. [Google Scholar] [CrossRef]
- Goldberg, D.E. Genetic Algorithms in Search, Optimization, and Machine Learning; Kluwer Academic Publishers: Boston, MA, USA, 1989. [Google Scholar]
- Nash, J.E.; Sutcliffe, J.V. River flow forecasting through conceptual models part I—A discussion of principles. J. Hydrol. 1970, 10, 282–290. [Google Scholar] [CrossRef]
- Keller, A.; Keller, J.; Seckler, D. Integrated Water Resource Systems: Theory and Policy Implications; Research Report 3; International Water Management Institute: Colombo, Sri Lanka, 1996. [Google Scholar]
- Cai, X.; Rosegrant, M.W. Optional water development strategies for the Yellow River Basin: Balancing agricultural and ecological water demands. Water Resour. Res. 2004, 40. [Google Scholar]
- Falkenmark, M.; Rockström, J. The new blue and green water paradigm: Breaking new ground for water resources planning and management. J. Water Resour. Plan. Manag. 2006, 132, 129–132. [Google Scholar] [CrossRef]
- Christensen, J.H.; Hewitson, B.; Busuioc, A.; Chen, A.; Gao, X.; Held, R.; Jones, R.; Kolli, R.; Kwon, W.; Laprise, R.; et al. Regional climate projections. In Climate Change 2007: The Physical Science Basis. Contribution of Working Group I to the Fourth Assessment Report of the Intergovernmental Panel on Climate Change; Solomon, S., Qin, D., Manning, M., Chen, Z., Marquis, M., Averyt, K.B., Tignor, M., Miller, H.L., Eds.; Cambridge University Press: Cambridge, UK and New York, NY, USA, 2007. [Google Scholar]
- Mote, P.; Brekke, L.; Duffy, P.B.; Maurer, E. Guidelines for constructing climate scenarios. Eos Trans. AGU 2011, 92, 257–258. [Google Scholar] [CrossRef]
- IPCC (Intergovernmental Panel on Climate Change), Emissions Scenarios 2000: Special Report of the Intergovernmental Panel on Climate Change; Cambridge University Press: Cambridge, UK, 2000.
- Jones, P.G.; Thornton, P.K.; Heinke, J. Generating Characteristic Daily Weather Data Using Downscaled Climate Model Data from the IPCC’s Fourth Assessment; Project Report. 2009. Available online: http://dspacetest.cgiar.org/handle/10568/2482 (accessed on 16 January 2011).
- Gerald, N.; Rosegrant, M.W.; Palazzo, A.; Gray, I.; Ingersoll, C.; Robertson, R.; Tokgoz, S.; Zhu, T.; Sulser, T.; Ringler, C.; et al. Food security, Farming,and Climate Change to 2050; Research Monograph, International Food Policy Research Institute (IFPRI): Washington, DC, USA, 2010. [Google Scholar]
- FAO, Irrigation Potential in Africa: A Basin Approach; FAO Land and Water Bulletin 4; Food and Agriculture Organization of the United Nations: Roma, Italy, 1997.
- You, L.; Wood, S. An entropy approach to spatial disaggregation of agricultural production. Agric. Syst. 2006, 90, 329–347. [Google Scholar] [CrossRef]
- Portmann, F.T.; Siebert, S.; Döll, P. MIRCA2000—Global monthly irrigated and rainfed crop areas around the year 2000: A new high-resolution data set for agricultural and hydrological modeling. Glob. Biogeochem. Cycles 2010, 24. [Google Scholar]
- FAO. FAOSTAT-Crops; Food and Agriculture Organization of the United Nations: Rome, Italy. Available online: http://faostat.fao.org (accessed on 6 October 2010).
- De Wit, M.; Stankiewicz, J. Changes in surface water supply across Africa with predicted climate change. Science 2006, 301, 1917–1921. [Google Scholar]
© 2012 by the authors; licensee MDPI, Basel, Switzerland. This article is an open-access article distributed under the terms and conditions of the Creative Commons Attribution license (http://creativecommons.org/licenses/by/3.0/).
Share and Cite
Zhu, T.; Ringler, C. Climate Change Impacts on Water Availability and Use in the Limpopo River Basin. Water 2012, 4, 63-84. https://doi.org/10.3390/w4010063
Zhu T, Ringler C. Climate Change Impacts on Water Availability and Use in the Limpopo River Basin. Water. 2012; 4(1):63-84. https://doi.org/10.3390/w4010063
Chicago/Turabian StyleZhu, Tingju, and Claudia Ringler. 2012. "Climate Change Impacts on Water Availability and Use in the Limpopo River Basin" Water 4, no. 1: 63-84. https://doi.org/10.3390/w4010063