Integrating the Carbon and Water Footprints’ Costs in the Water Framework Directive 2000/60/EC Full Water Cost Recovery Concept: Basic Principles Towards Their Reliable Calculation and Socially Just Allocation


Abstract
:
1. Introduction
2. Carbon and Water Footprint, Virtual Water
2.1. Carbon Footprint (CF)

2.2. Virtual Water (VW) and Water Footprint (WF)
3. Full Water Cost Recovery Principle
3.1. Direct Cost—DC
3.2. Environmental Cost—EC
3.3. Resource Cost—RC
4. Integrating Carbon and Water Footprints in the Water Services Costs
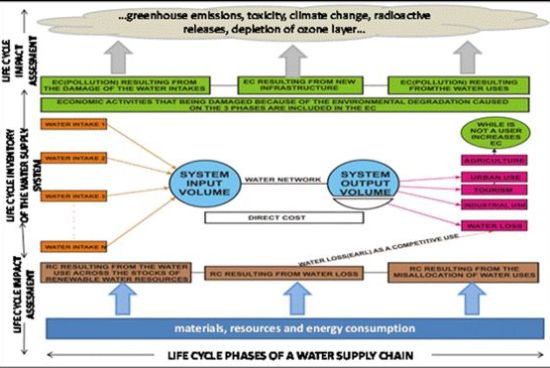
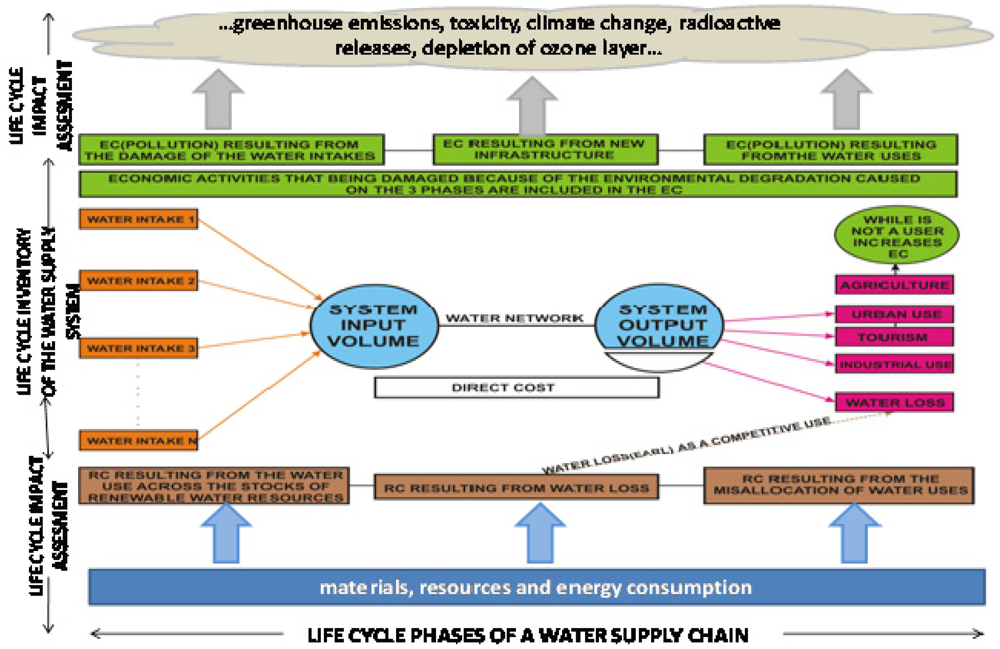
4.1. Carbon and Water Footprints in the Water Supply Chain

| Category | Aspect |
|---|---|
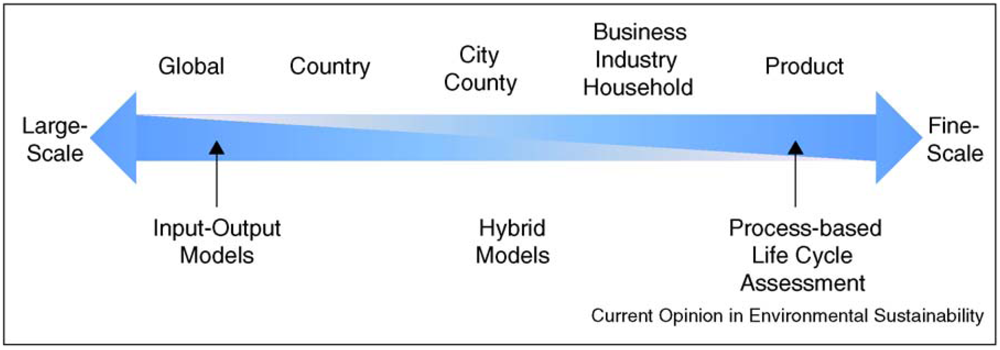
| Definition | Similar definitions depending on the functional operations (global, country, region, city, business, industry, household, process/product level) |
| Methodology | Common methodological approaches depending on the functional operations (global, country, region, city, business, industry, household, process/product level) |
| Best methodology for their calculation in a water supply chain is LCA approach | |
| Standardization | Development of ISO standards for their calculation globally |
| Full Water Cost Principle | Both of them should be included in the FWC recovery principle as it is defined according to the WFD, by considering the definition and the analysis of the three FWC components (DC; EC; RC) |
| Pricing Policy | Water pricing policies should take into account both footprints |
| Water Losses | Reducing water losses could lead to reducing CF and WF. |
| Strategy | WF, reported on a product level, can be used to empower consumers to take greater responsibility for their purchasing behaviors and that this might stimulate further innovation in business |
| WF is creating a capacity for change comparable to CF |
4.2. Integrating Carbon Footprint (CF) in the Environmental Cost (EC)

4.3. Integrating the Water Footprint (WF) in the Resource Cost (RC)
5. Suggested Methodology for Cost Allocation
5.1. Basic Concept
5.2. The Role of Water Losses and Their Cost Allocation Methodology


- The consumers must pay the FWC of the water losses (apparent) occurring within their property.
- The water utility must pay the rest of the apparent losses due to theft, metering inaccuracies, corrupt practices during metering, etc.
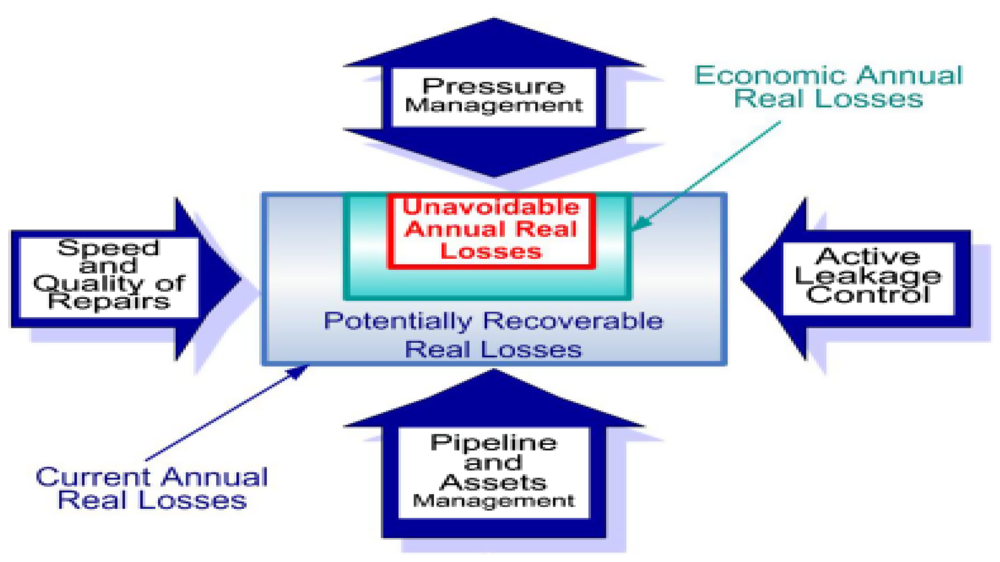
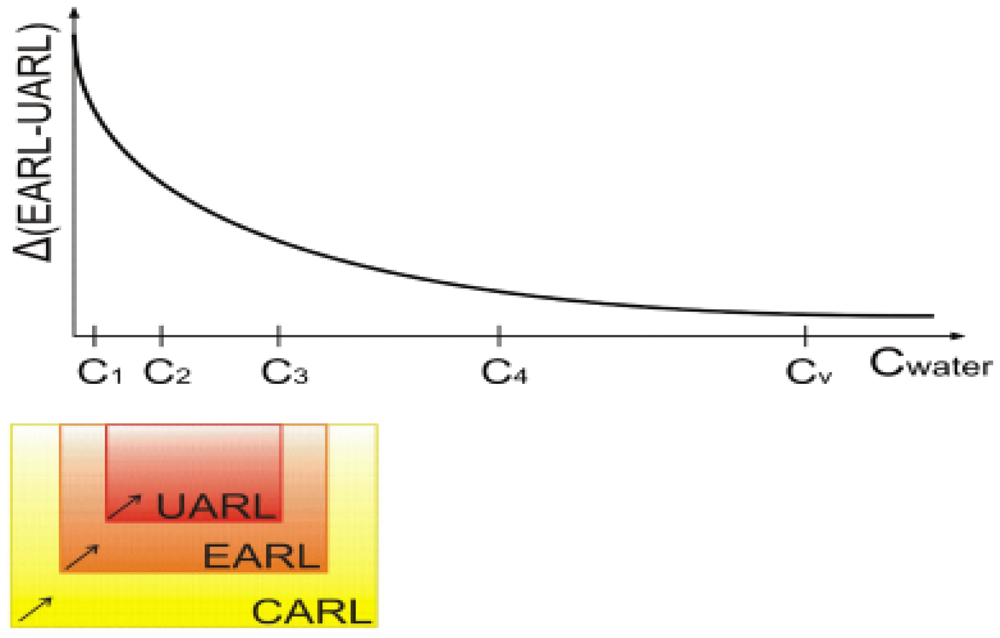
- The consumers pay the FWC of a minimum accepted water losses level (UARL max level equals 5% of the System Input Volume), in return for having access to water (opportunity cost).
- When the real losses exceed the unavoidable real losses level, then both customers and water utility pays the remaining part of the UARL FWC, according to the water volume each one uses. The same should be the case regarding the FWC of the difference EARL-UARL.
- The water utility must pay the FWC of the difference CARL-EARL, as a penalty for the network’s poor operating performance level.
- The State should pay its part of the above costs (in the form of grants to the water utilities) if involved in the construction and initial management of the network infrastructure. The size of the State’s contribution should be discussed (negotiated) with the water utility.
- The water utility must directly pay the biggest part of these costs. Until now utilities usually ask customers to recover these costs by including specific charges in the water tariffs (expansion charges).
- FWC will be reduced as a result of the reduced water demand level and of the minimized water losses. Then the water prices will be reduced and the customers should cover a part of these costs.
- Finally, the State should pay its part (in the form of grants to the water utilities) if involved in the construction and initial management of the network infrastructure. The size of the State’s contribution should be discussed (negotiated) with the water utility.
- Regarding the CF cost: The consumer pays his part of the CF cost proportionally to the product’s production cost. The producer pays the proportion of the CF cost regarding the profit he made by selling this product. So if the production cost over profit is 80/20, then the consumer should pay 80% of the CF cost and the producer 20% of the CF cost.
- Regarding the WF cost: The consumer pays his part for the water quantity used to produce the product he is using (or the water quantity the consumer is using), so that the original water resource will return to its original state. The producer pays also his part of the product WF cost regarding the profit he made by selling this product.
5.3. The Suggested Step-by-Step Methodology for the NRW Index Reduction
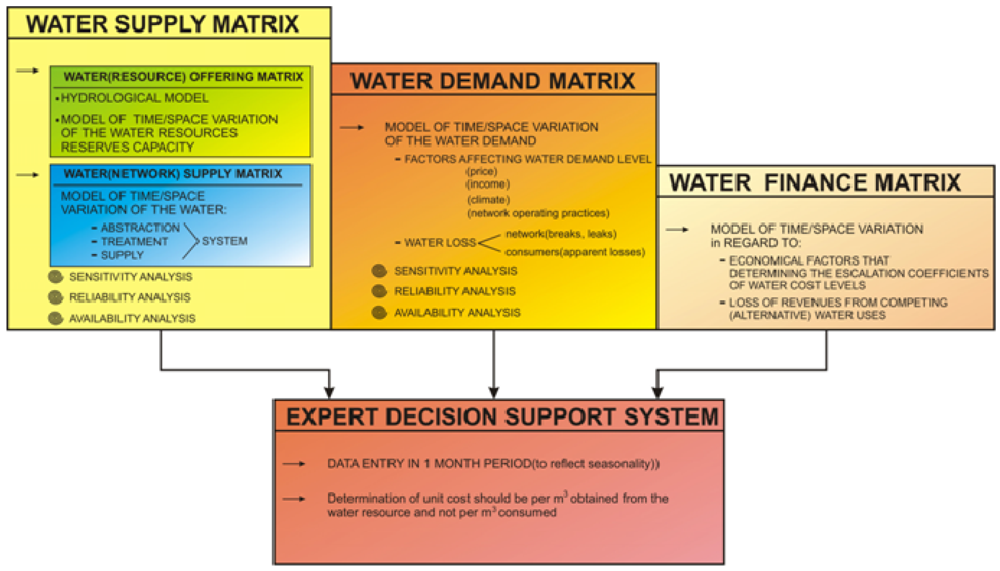
- The ‘water supply matrix’ will consist of the ‘water (resource) offering matrix’ and the ‘water (network) supply matrix’. The first will consist of the hydrological model (e.g., a hydrological model to assess the inflow to the resource; a ground or surface water hydrology model to assess what the water resource can offer; a water-intake works operation model) and the model of the spatial and temporal variation of the water resources reserves capacity. The ‘water (network) supply matrix’ will consist of the model of the spatial and temporal variation of the water abstraction, treatment and supply system. For each component of this system the results of a sensitivity, reliability and availability analysis will be also taken into account. The water quality characteristics of each water resource can be also included in the ‘water (resource) offering matrix’ (Figure 5).
- The ‘water demand matrix’ will result from a model of spatial and temporal variation of: (a) the water demand pattern for each type of use/user; (b) the factors affecting the level of demand (e.g., income, price, race, religion, size of property); and (c) external factors (e.g., climate, network operation and maintenance practices, water losses levels). For each part of this system the results of an analysis of sensitivity, reliability and availability will be also taken into consideration (Figure 5).
- The ‘water finance matrix’ will result from a model of spatial and temporal variation regarding economical factors defining the water price adjustment to avoid economic obsolescence, and the profit levels of the alternative (competing) water uses (revenue losses) (Figure 5).

- Assess the system’s supplying capacity (water resources reserves level; water intake works capacity; water aqueducts carrying capacity).
- Monitor—using a SCADA—the entire system (water resources; water network; water storage tanks).
- Develop the entire system’s simulation model (use data from the SCADA to calibrate/validate it).
- Estimate the UARL level based on the network’s current operating pressure (using Equation (1)).
- Form the Water Balance of the water distribution network and assess the NRW level.
- Estimate the EARL level, based on the existing water pricing policy.
- Determine the water demand level.
- Estimate the FWC components (DC, EC and RC including CF and WF costs) based on the current total water demand (ex-ante evaluation process). Calculate the FWC level.
- Determine the new (higher) water price levels based on the current FWC levels (ex-ante evaluation process). These higher price levels will result in reduced total actual water use due to the water-price oriented elasticity of demand (as the price gets higher, the demand decreases).
- Determine the new (lower) water demand level and the new (lower) EARL level based on the new (higher) water prices set (ex-ante evaluation process).
- Pinpoint the crucial network points for pressure management (e.g., zoning through PRVs) or even DMAs formation. Apply the most cost-effective strategy (thorough cost-benefit analysis).
- Estimate the new (lower) UARL/NRW levels based on the network’s reduced operating pressure.
- Estimate the new (reduced) water demand level due to the higher price levels and reduced losses.
- Estimate the new (lower) DC, EC, RC levels (including CF and WF costs) due to the reduced water demand (ex-post evaluation process). Calculate the new (lower) FWC level.
- Determine the new (lower) water price levels based on the new (lower) FWC. These lower price levels will force total water use to increase due to the water-price oriented elasticity of demand.
- Determine the (increased) EARL levels based on the new (reduced) water prices set.
- Pinpoint the new crucial points in the network to act. Implement the most cost-effective solution.
- Determine the new UARL/NRW levels due to the reduced water losses due to the interventions.
- Estimate the new increased water demand because of the new reduced water prices.
- Repeat steps 8-19. The system will eventually balance to its ‘sustainability level’. UARL will then be minimized, EARL will tend to be equal to UARL and CARL will tend to be equal to EARL. The whole process should be repeated based on a water tariffs re-adjustment period (3–5 years).
6. Conclusions
References
- Official Journal of the European Communities. Directive 2000/60/EC of the EP & of the Council of 23 October 2000 establishing a framework for Community action in the field of water policy. 2000, L327:1-L327:72. Available online: http://eur-lex.europa.eu/LexUriServ/LexUriServ.do?uri =OJ:L:2000:327:0001:0072:en:pdf (accessed on 1 December 2011).
- Feldman, M. Aspects of energy efficiency in water supply systems. In CD-Proceedings of the International Conference on Water Loss, IWA, Cape Town, South Africa, 26-30 April 2009.
- CIS-WG2.6. Economics and the environment. The implementation challenge of the water framework directive. A guidance document. In Common Implementation Strategy, Working Group 2.7-WATECO; France and the European Commission: Brussels, Belgium, 2002.
- IWA. Task Force on Water Utility Efficiency in Low and Middle Income Countries (LAMIC TF). Increasing Energy Efficiency of Water Supply—How to introduce carbon credits to the water sector? Concept Note. 2009.
- Wiedmann, T.; Minx, J. A Definition of “Carbon Footprint”. In Ecological Economics Research Trends; Pertsova, C.C., Ed.; Nova Science Publishers: Hauppauge, NY, USA, 2008. [Google Scholar]
- Peters, G.P. Carbon footprints and embodied carbon at multiple scales. Curr. Opin. Environ. Sustain. 2010, 2, 245–250. [Google Scholar] [CrossRef]
- JRC European Commission, European Platform on Life Cycle Assessment; Newsletter/info Update No.14; JRC European Commission: Brussels, Belgium, 2010.
- Hertwich, E.G.; Peters, G.P. Carbon footprint of nations: A global, trade-linked analysis. Environ. Sci. Technol. 2009, 43, 6414–6420. [Google Scholar] [CrossRef]
- Corporate Value Chain (Scope 3)—Accounting and Reporting Standard Supplement to the GHG Protocol—Corporate Accounting and Reporting Standard—Draft for Stakeholder Review; World Resources Institute & World Business Council for Sustainable Development: Washington, DC, USA, 2010.
- European Platform on Life Cycle Assessment European Commission, Carbon Footprint—What it is and How to Measure It; European Commission: Brussels, Belgium, 2011.
- Cabrera, E.M.; Pardo, M.A.; Cobacho, R.; Cabrera, E., Jr. Energy audit of water networks. Water Resour. Plan. Manag. 2010, 136, 669–677. [Google Scholar] [CrossRef]
- Allan, J.A. Fortunately there are substitutes for water otherwise our hydro-political futures would be impossible. In ODA, Priorities for Water Resources Allocation and Management; ODA: London, UK, 1993. [Google Scholar]
- Allan, J.A. Overall perspectives on countries and regions. In Water in the Arab World: Perspectives and Prognoses; Rogers, P., Lydon, P., Eds.; Harvard University Press: Cambridge, UK, 1994. [Google Scholar]
- Velazquez, E.; Madrid, C.; Beltran, M.J. Rethinking the concepts of virtual water and water footprint in relation to the production-consumption binomial and the water-energy nexus. Water Resour. Manag. 2011, 25, 743–761. [Google Scholar] [CrossRef]
- Hoekstra, A.Y. Virtual water: An introduction. Virtual water trade. In Proceedings of the International Expert Meeting on Virtual Water Trade; Values of Water Research Report Series no 12. IHE: Delft, The Netherlands, 12–13 December 2003.
- Chapagain, A.K.; Hoekstra, A.Y. Water footprint of nations. In Value of Water Research Report Series 16; UNESCO-IHE,Institute of Water Education: Delft, The Netherlands, 2004. [Google Scholar]
- Feng, K.; Hubacek, K.; Minx, J.; Siu, Y.L.; Chapagain, A.; Yu, Y.; Guan, D.; Barrett, J. Spatially explicit analysis of water footprints in the UK. Water 2011, 3, 47–63. [Google Scholar]
- ISO, GHG Schemes Addressing Climate Change—How ISO Standards Help; ISO: Geneva, Switzerland, 2010.
- Hoekstra, A.Y.; Chapagain, A.K. Water footprints of nations: Water use by people as a function of their consumption pattern. Water Resour. Manag. 2007, 21, 35–48. [Google Scholar]
- WaterStrategyMan. Deliverable 7—Available Methods for Estimating Water Supply, Resource and Environmental Costs. The WaterStrategyMan Project. 2002.
- Kanakoudis, V.; Gonelas, K.; Tolikas, D. Basic principles for urban water value assessment and price setting towards its full cost recovery-pinpointing the role of the water losses. Water Supply Res. Technol. AQUA 2011, 60, 27–39. [Google Scholar] [CrossRef]
- Kanakoudis, V. Vulnerability based management of water resources systems. Hydroinformatics 2004, 6, 133–156. [Google Scholar]
- Griffin, R. Effective water pricing. Am. Water Resour. Assoc. 2001, 37, 1335–1347. [Google Scholar] [CrossRef]
- Pielen, B.; Interwies, E. The economic analysis according to the WFD—Status of Implementation. An international exchange of experience. In Proceedings of the Ecologic Institute for International and European Environmental Policy, Berlin, Germany, 22-23 April 2004.
- Common Implementation Strategy Working Group 2B: Drafting Group ECO1. Information Sheet on Assessment of the Recovery of Costs for Water Services for the 2004 River Basin Characterization Report (Article 9), 2004.
- Görlach, B.; Interwies, E. Economic valuation of environmental and resource costs: The case of Germany. In Presented at the Ecologic-Institute for International and European Environmental Policy, Berlin, Germany, August 2005.
- United Nations, The Millennium Development Goals Report. United Nations: New York, NY, USA, 2006.
- Farley, M.; Trow, S. Losses in Water Distribution Networks—A practitioner’s Guide to Assessment, Monitoring and Control; IWA Publishing: London, UK, 2003. [Google Scholar]
- Lambert, A.O.; Brown, T.G.; Takizawa, M.; Weimer, D. A review of performance indicators for real losses from water supply systems. Water Supply Res. Technol. AQUA 1999, 48, 227–237. [Google Scholar]
- WWF. Water pricing and the recovery of the costs of water services. In WFD Economics Capacity Building Seminar, Brussels, Belgium, 2006.
© 2012 by the authors; licensee MDPI, Basel, Switzerland. This article is an open-access article distributed under the terms and conditions of the Creative Commons Attribution license (http://creativecommons.org/licenses/by/3.0/).
Share and Cite
Kanakoudis, V.; Tsitsifli, S.; Papadopoulou, A. Integrating the Carbon and Water Footprints’ Costs in the Water Framework Directive 2000/60/EC Full Water Cost Recovery Concept: Basic Principles Towards Their Reliable Calculation and Socially Just Allocation. Water 2012, 4, 45-62. https://doi.org/10.3390/w4010045
Kanakoudis V, Tsitsifli S, Papadopoulou A. Integrating the Carbon and Water Footprints’ Costs in the Water Framework Directive 2000/60/EC Full Water Cost Recovery Concept: Basic Principles Towards Their Reliable Calculation and Socially Just Allocation. Water. 2012; 4(1):45-62. https://doi.org/10.3390/w4010045
Chicago/Turabian StyleKanakoudis, Vasilis, Stavroula Tsitsifli, and Anastasia Papadopoulou. 2012. "Integrating the Carbon and Water Footprints’ Costs in the Water Framework Directive 2000/60/EC Full Water Cost Recovery Concept: Basic Principles Towards Their Reliable Calculation and Socially Just Allocation" Water 4, no. 1: 45-62. https://doi.org/10.3390/w4010045