
Development and Application of a New Exponential Model for Hydraulic Conductivity with Depth of Rock Mass

1
School of Earth Sciences and Engineering, Hohai University, Nanjing 210098, China
2
Yellow River Engineering Consulting Co., Ltd., Zhengzhou 450003, China
*
Authors to whom correspondence should be addressed.
Water 2024, 16(5), 778; https://doi.org/10.3390/w16050778
Submission received: 16 January 2024
/
Revised: 12 February 2024
/
Accepted: 23 February 2024
/
Published: 5 March 2024
(This article belongs to the Special Issue Impact of Geological Uncertainty on Geological Hazards and Groundwater Environment Assessments)
Abstract
:Hydraulic conductivity generally decreases with depth in the Earth’s crust. The hydraulic conductivity–depth relationship has been assessed through mathematical models, enabling predictions of hydraulic conductivity in depths beyond the reach of direct measurements. However, it is observed that beyond a certain depth, hydraulic conductivity tends to stabilize; this phenomenon cannot be effectively characterized by the previous models. Thus, these models may make inaccurate predictions at deeper depths. In this work, we introduce an innovative exponential model to effectively assess the conductivity–depth relationship, particularly addressing the stabilization at greater depths. This model, in comparison with an earlier power-like model, has been applied to a globally sourced dataset encompassing a range of lithologies and geological structures. Results reveal that the proposed exponential model outperforms the power-like model in correctly representing the stabilized conductivity, and it well captures the fast stabilization effect of multiple datasets. Further, the proposed model has been utilized to analyze three distinct groups of datasets, revealing how lithology, geological stabilization, and faults impact the conductivity–depth relationship. The hydraulic conductivity decays to the residual hydraulic conductivity in the order (fast to slow): metamorphic rocks, sandstones, igneous rock, mudstones. The mean hydraulic conductivity in stable regions is roughly an order of magnitude lower than unstable regions. The faults showcase a dual role in both promoting and inhibiting hydraulic conductivity. The new exponential model has been successfully applied to a dataset from a specific engineering site to make predictions, demonstrating its practical usage. In the future, this model may serve as a potential tool for groundwater management, geothermal energy collection, pollutant transport, and other engineering projects.
1. Introduction
The hydraulic conductivity of rock masses plays a crucial role in various engineering projects [1]. In engineering, understanding rock mass hydraulic conductivity is key for predicting water movement through the subsurface [2,3,4]. Hydraulic conductivity is also vital for assessing geothermal energy potential [5,6,7], evaluating reservoir rock production [8,9], tracking subsurface contaminant movement [10,11], absorbing pollutants for treatment [12,13], managing CO2 injectivity and containment [14,15,16], and providing parameters for preventing natural disasters [17,18]. Hydraulic conductivities are commonly determined through in situ and laboratory tests, inversion techniques, and modeling approaches [19]. Empirical models stand out for their simplicity and efficiency, requiring fewer data points. They typically rely on easily obtainable parameters in engineering, such as grain size, porosity, and depth to make estimations. Therefore, it is especially useful in early project stages [20]. The dependent variable in these models assumes two forms. The first is the original form of the permeability properties. The second is the logarithmic form, like the logarithm of permeability or hydraulic conductivity. The two forms can be converted. Due to the significant difference in the permeability properties’ order magnitude, the models’ dependent variables will be transformed into the logarithmic form in this paper.
Generally, there are three major kinds of models between the permeability property and depth. The three models are the linear model, the logarithmic model, and the power-like model. Louis [21] pioneered this exploration in 1974, identifying a linear relationship between the logarithm of hydraulic conductivity and depth through hydraulic tests of porous media. This linear model was later applied to various engineering projects [22,23]. However, these linear models often predict an unrealistic convergence of hydraulic conductivity to zero at great depths. Subsequently, logarithmic models were developed to address the limitations of linear models. The logarithmic models employ logarithmic scales for both permeability and depth. They have demonstrated greater suitability across various geological conditions and, thus, have gained broader acceptance [24]. These models are found to also be applicable in fractured formations [25]. Recently, the logarithmic models have been modified based on actual field data [26,27,28,29,30], thereby gaining better applicability and accuracy. Yet a notable drawback of logarithmic models is their tendency to overestimate hydraulic conductivities at shallower depths, as well as the unrealistic slow decay rate. Additionally, some unusual models have been proposed for specific engineering scenarios [31,32], but most of the parameters do not have an interpretable physical meaning. Kuang et al. [33] introduced a power-like model that correlates logarithmic permeability with depth. This power-like model exhibited improved results in crust-wide permeability distributions over the traditional models.
However, limitations exist for the existing studies. First, although the power-like model presented better performance, it cannot correctly represent the residual permeability of measured data, and it cannot well capture the fast stabilization effect. Second, previous empirical models have typically been tested on datasets with a singular lithology, casting doubts on their applicability to varied global field conditions.
In this paper, the presented study introduces a novel exponential model to overcome two major limitations of the power-like model: (1) to effectively represent the residual hydraulic conductivity in specific engineering conditions; (2) to correct the unrealistic slow decay rate. The proposed model has been validated by an extensive hydraulic conductivity database, which incorporates data sources from different lithologies and geological structures [23,26,27,34,35,36]. The study details how factors such as lithologies, geological stability, and faults can impact hydraulic conductivity. The stability of rock masses is determined by the geological province in which they are located. For instance, shields and cratons are relatively stable geological provinces, resulting in good geological stability of the rock masses. On the other hand, orogenic belts, rifts, and volcanic arcs are unstable geological provinces, leading to poor geological stability of rock masses. Following these comprehensive validations, the exponential model was applied to the dataset from the Qinghai engineering project, thereby demonstrating its practical utility in making accurate predictions.
2. Methodology
2.1. Model Analysis
Various empirical models have been developed and utilized to assess the permeability–depth relationship. We summarize the existing models in Table 1 to provide a direct overview of them. However, among these models, we have specifically chosen to apply the power-like model in this study. This decision is based on findings from recent research [33], which showed that the power-like model demonstrates greater accuracy compared to the other models.
In our applications, we found that the power-like model has limitations in representing the hydraulic conductivity at maximum depth in the specific area when the surface hydraulic conductivity is significantly different from the hydraulic conductivity deep in the specific area. Thus, we propose a novel exponential model:
where Ks is the surface hydraulic conductivity, which means hydraulic conductivity at the depth of 0; Kr is the residual hydraulic conductivity at maximum depth in the specific engineering; α is the decay coefficient; and z is the depth.
To primarily evaluate the characteristics of the two models, the sensitivity analysis for the parameter “Log Ks” is depicted in Figure 1. In this analysis, “Log Kr” is set at −11 and “α” is set at 1.2, while “Log Ks” varies from −9 to −1 in steps of two the depth ranges between 0 and 5 km. Detailed sensitivity analyses for other parameters are provided in the chapter “Other Sensitive Analyses” of Supporting Information.
As illustrated in Figure 1a, the exponential model demonstrates a rapid convergence of hydraulic conductivities towards Log Kr at greater depths. Conversely, Figure 1b shows that the hydraulic conductivities in the power-like model converge to Log Kr at a slower rate. This slow convergence may cause the power-like model to overestimate hydraulic conductivities at deeper layers, potentially leading to less accurate predictions in such scenarios. Consequently, the exponential model is specially designed to provide a more accurate representation of hydraulic conductivity behavior at varying depths.
To describe the decay of different datasets in the results and discussions section, the decay rate β, which means the magnitude of the change in Log K caused by the increase in depth, can be expressed in derivation of Equation (1):
where α is the decay coefficient in both models, Log Ks is the logarithm of the surface hydraulic conductivity, Log Kr is the logarithm of the residual hydraulic conductivity, and z is the depth.
2.2. Source and Classification of Database
This paper utilizes several key datasets for validation of the models, encompassing different lithologies and geological settings:
(1) Global Permeability Dataset by P. Achtziger et al. [26]: This dataset encompasses a variety of lithologies including granites, granodiorites, gneisses, and kyanites, predominantly characterized by weak permeability. Sample’s origin spans Northern Europe, with additional data from Central and Western Europe, Asia, and North America. Most samples are from stable geological areas like shields, while other samples are from unstable geological areas like orogenic belts. While primarily from stable geological areas like shields, some samples may include faults.
(2) Dataset by Pouyan Asem and Colleagues [34]: The geological origins of these samples and the nature of fault traversals in these regions have been detailed in [37] and, thus, they are not specified here. Focused on mudstones, limestones, dolomites, and sandstones, this dataset is notable for its low permeability.
(3) Sandstone Permeability Data from Geoscience Australia [35] and GeoProvider [32]: Sourced from the Great Artesian Basin in Australia and Norway, this collection specializes in sandstone permeability, generally exhibiting medium-to-high levels.
(4) Studies by Li Wan [19] and Yi Feng Chen [28]: Centered around hydroelectric and dam projects in China, the data primarily involve granite and granodiorite lithologies, which are known for their low permeability.
(5) Dataset by Andrew P. Snowdo [37]: The lithology includes granite, gneiss, and gabbro, mainly from Ontario, Quebec, and other provinces in Canada, some of which are fault zones.
Other datasets with small amounts of data originate from many studies [38,39,40,41,42,43,44,45,46,47,48,49,50,51,52,53], including igneous rocks, metamorphic rocks, and sedimentary rocks. These datasets are mainly located in Asia and Europe. While, for these datasets, the geological stability is uncertain, it is unknown whether faults intersect the samples.
The permeability data within this database have been derived from various methods, including borehole tests, packer tests (both single and double plug), drill pipe tests, discrete fracture network seepage methods, and slug-water tests. For consistency, all of the permeabilities have been converted to hydraulic conductivity. The conversion method for hydraulic conductivity can be found in the chapter “The Conversion Method For Hydraulic Conductivity” of Supporting Information.
To explore how lithology and geological stability impact, and whether fault cross rocks, influence permeability. Three groupings are realized.
For Group 1: The rocks in the database include igneous, metamorphic, and sedimentary rocks. The igneous rocks consist mainly of granite, granodiorite, and diorite. The metamorphic rocks are mainly quartzite, marble, gneiss, and amphibolite. The sedimentary rocks are mainly sandstone and mudstone. It can be observed that except for mudstone, the hardness of all the other rocks is relatively high. Therefore, based on lithology and hardness, the database is first divided into igneous rock dataset, metamorphic rock dataset, and sedimentary rock dataset (which only includes sandstone). Then, sandstone and mudstone, which both belong to sedimentary rock, are classified as sandstone dataset and mudstone dataset.
For Group 2: The Earth’s crust is composed of two primary components: the stable ancient regions, such as cratons and shields, and the unstable young regions, including orogenic zones, rift valleys, and volcanic arcs. The stable ancient regions are ancient landmasses formed during the Paleozoic and Mesozoic periods [43]. They have remained stable with minimal tectonic activity or deformation since their formation. In contrast, the dynamic unstable regions are younger, formed during the Mesozoic era, and are sites of active tectonics, marked by earthquakes, volcanism, and metamorphic processes. Therefore, we believe that the geological stability of the stable geological province is good, while the unstable province is bad. Utilizing the geological province map contributed by Derrick et al. [43] and the location of the data in our database, the second group divides the data based on geological stability, distinguishing between stable regions such as cratons and shields, and unstable regions, including volcanic arcs, rift valleys, and ophiolite mafic belts.
For Group 3: Various-sized faults formed during geological region development can disrupt rock mass continuity, affecting hydraulic conductivity [54]. In the study, rocks with faults crossing are considered as the fault core zone, and rocks without faults crossing are considered as the fault damage zone based on Jacek Scibek [55]. Therefore, Group 3 divides the data based on whether faults cross the rocks.
Here is the group’s introduction in Table 2. The detailed information of these groups of dataset can be found in the chapter “Datasets Collected From Other Literature” of Supporting Information.
2.3. Geological Setting of Qinghai Engineering Project
The Qinghai engineering project area is situated in the vicinity of Xining City, Qinghai Province, China (Figure 2). This region is characterized by its rugged mountains and deep gullies, with elevation ranging from 2600 to 3500 m. The project area’s topography and geomorphology consist of three major geomorphological units: tectonic denudation and erosion of alpine–mid alpine, tectonic erosion of mid-mountain hills, and erosion of river valleys. The stratigraphy is discontinuous and incomplete, with the spatial distribution of each stratum influenced by the regional geological structure.
The geological strata in the engineering project area are discontinuous and missing, and the spatial distribution of each layer is clearly controlled by the regional geological structure. The main strata are as follows: Paleoproterozoic (Pt1), Changcheng (Ch), Ordovician (O), Carboniferous (C), Triassic (T), Jurassic (J), Cretaceous (K), Paleogene (E), Neogene (N), and Quaternary (Q). Its main lithology is the Caledonian intrusive rock, which is present by granite, granodiorite, and diorite in block-like structures, invading metamorphic rock series through rock pillars or veins.
For faults, the project is located in the Northeastern tectonic zone of the Tibetan Plateau at the convergence of the Qilian Mountain Range and the Qinghai Nanshan–Laji Mountain systems. The presence of several active faults, specifically, F2, F3, F5, and F6, plays a significant role at the project site. These geological features disrupt the rock mass, creating an intricate network of subterranean hydraulic pathways. Fractured cores from borehole samples in fault zones show elevated permeability, underscoring the impact of faulting on the hydraulic properties of the subsurface.
Borehole examinations within the area primarily uncover igneous rocks, such as granodiorite and diorite, alongside metamorphic varieties like dolomite and greywacke, and sedimentary formations, including conglomerate, sandstone, and mudstone. Packer test results indicate that the igneous rocks typically possess moderate permeability, while the metamorphic and sedimentary rocks tend to show lower permeabilities. This suggests a discernible correlation between hydraulic conductivity and lithology. Further details regarding boreholes and fault information are provided in the chapter “The Engineering Project Area Data” of Supporting Information.
3. Results and Discussions
3.1. Performance of the Two Models
Two datasets with similar Log Kr values were selected from the metamorphic sub-dataset to test the performance of the two models, namely the proposed exponential model and the power-like model. Dataset 1 is from the igneous dataset and Dataset 2 is from the metamorphic dataset. As shown in Figure 3, the box-and-line shows the surface hydraulic conductivity (at the depth approach 0) for Dataset 1 is about two orders of magnitude greater than that of Dataset 2. On the other hand, residual hydraulic conductivities (at the depth of about 1 km) for the two datasets do not differ by more than 0.5 orders of magnitude.
Subsequently, we fitted the exponential model and the power-like model to the two datasets. The fitting performance of both models is depicted in Figure 4. In Figure 4a, the power-like model, while effective for smaller depth ranges, cannot accurately reproduce the stabilization effect at greater depths. It tends to predict a continual decrease in K; thus, it failed to accurately represent the stabilization effect. In contrast, the exponential model shows a better performance: it not only captures the initial decline in permeability with depth well, but it also captures the subsequent stabilization. This makes the exponential model more suitable for such datasets, further to make more reliable predictions on the full range of permeability variations from the surface to the deeper stabilized zones. Figure 4b shows that, for Dataset 2, both models perform similarly in terms of fitting, indicating that when the difference between surface permeability and deep permeability is small, the differences between the models may be less pronounced.
In Table 3, the calibrated values of the residual hydraulic conductivity (Log Kr) of the two models are presented and compared to the true value. The definitions of some parameters are provided below. True Log Kr is the true hydraulic conductivity at the maximum depth in the specific engineering condition. True Log Kr is averaged from the logarithmic hydraulic conductivity data in the last 10% of the depth range of the dataset. Log Kre is obtained by the exponential model to reflect the hydraulic conductivity at the maximum depth under the specific engineering condition, while Log Krp is obtained by the power-like model to reflect the hydraulic conductivity at the maximum depth under the specific engineering condition. Log Kre and Log Krp, obtained from the model are deviated from True Log Kr, define a formula to describe the deviation as: , to assess the deviation for the exponential model and the power-like model.
As indicated in Table 3, the index of effectiveness (Ie) for the exponential model is consistently lower than that of the power-like model (Ip) across both datasets. This suggests that the exponential model exhibited a better representation of the residual hydraulic conductivity of the datasets. Notably, the disparity between Ie and Ip is more pronounced for Dataset 1 than Da taset 2. For dataset 2, Ie (0.07) is closer to Ip (0.12). This indicates that the exponential model is a more effective model for characterizing the fast stabilization effect; namely, there is a significant difference between surface hydraulic conductivity and the deeper stabilized values.
3.2. Lithology Influence on the Hydraulic Conductivity with the Exponential Model
Based on three main rock types classification, the hard rock’s relationship between hydraulic conductivity and depth (K–Z relationship) is explored utilizing several sub-datasets, including igneous, metamorphic, and sedimentary (sandstone) sub-datasets. It was shown in Figure 5 within box lines and trend lines.
Figure 5a,b shows that for igneous and metamorphic rocks, the logarithmic hydraulic conductivity spans a broad range from (−12 to −2) at shallow depths of 0–500 m. However, beyond 800 m, the values converge more tightly between (−10 and −6). Figure 5c indicates that sedimentary rocks (sandstone), in contrast, maintain a more consistent range from (−6 to −3) at shallower depths, transitioning to (−7 to −4) between 800 m and 1500 m depths. Figure 5 comprehensively shows that the middle 50% of logarithmic hydraulic conductivities for igneous and metamorphic rocks is situated between (−9 and −5) and (−8 and −5), respectively, while for sedimentary rocks, it is (−6 to −4). At a depth of 0–1600 m, fitted exponential models for each rock type are as follows.
The exponential model for igneous rocks is:
The exponential model for metamorphic rocks is:
The exponential model for sedimentary (sandstone) rocks is:
Figure 5 suggests igneous rocks have the highest decay rate in hydraulic conductivity with depth, followed by metamorphic and then sedimentary (sandstone) rocks. A higher decay rate indicates a more pronounced decrease in conductivity with the same increase in depth. Additionally, metamorphic rocks reach the residual (stable) hydraulic conductivity at the shallowest depth, succeeded by sedimentary and igneous rocks. These findings provide an approximate estimation of each rock type’s hydraulic conductivity decay rate and the depth at which they stabilize.
Subsequently, Figure 6 illustrates the K–Z relationship for two sedimentary sub-datasets based on rock hardness classifications (the sandstone sub-dataset and the mudstone sub-dataset). Within 0–7000 m, mudstone’s hydraulic conductivity spans from (−13 to −3), which is a notably broader range than sandstone’s (−8 to −3). Therefore, the range of mudstone is significantly larger than that of sandstone. Furthermore, at greater depths, the hydraulic conductivity of mudstone is notably lower, potentially due to the presence of muddy debris in soft rock causing blockages in the rock’s channels. At a larger depth range (roughly 0–6000 m), the exponential model expressions for mudstone and sandstone at this depth are:
The exponential model for sandstone rocks is:
The exponential model for mudstone is:
Figure 7 presents a graph depicting the relationship between the decay rate β and depth for igneous rock, metamorphic rock, sandstone, and mudstone at a depth range of 0–1600 m (β is normalized using data from these rock types, while the normalization method is in the chapter “Normalization Method” of Supporting Information). The graph reveals three distinct stages in the decay process for each rock type. (1) At very shallow depths (roughly less than 200 m), mudstone demonstrates the quickest decay rate, with metamorphic rock, igneous rock, and sandstone following, respectively. (2) Within moderate depths (roughly 200–500 m), it continues to be mudstone that experiences the most rapid decay, with igneous rock following mudstone, metamorphic rocks in the slower decay rate, and sandstone decaying the slowest. (3) Beyond roughly 500 m, mudstone still shows the highest decay rate, with igneous rock, sandstone, and metamorphic rock following, respectively. Additionally, as indicated in Figure 5, Figure 6 and Figure 7, metamorphic rocks reach the residual hydraulic conductivity at the shallowest depth, succeeded by sandstone, igneous rocks, and mudstone. Metamorphic rocks reach complete decay stability at only about 1500 m. The depth required for the remaining rocks to decay to stability is not clear.
The exponential model was applied to sub-datasets from various locations such as France, Germany, China, and so on, and these sub-datasets are sourced from the database. A series of Log Ks, Log Kr, and Log α values were obtained by fitting on the sub-datasets. These values are plotted in Figure 8. It reveals a positive correlation between Log Kr and Log Ks, as well as between Log Ks–Log Kr and log α. Figure 8a suggests that as the surface hydraulic conductivity Log Ks increases, the residual hydraulic conductivity Log Kr also increases in the same depth decay coefficient α. Moreover, Figure 8b shows that for a longer decay process of the hydraulic conductivity (Log Ks–Log Kr), a higher decay rate α is required for the same decay depth.
3.3. Geological Region’s Stableness, Faults’ Influence on the Hydraulic Conductivity with the Exponential Model
Figure 9 illustrates the influence of geological stability on the K–Z relationship. Stable regions display a broader range of hydraulic conductivities, with the middle 50% of their distribution spanning from −9 to −4 in logarithmic values. In contrast, the corresponding range for dynamic regions is from −8 to −4, suggesting a narrower distribution. Additionally, hydraulic conductivities in unstable regions reach residual levels at shallower depths compared to the stable regions.
At depths exceeding 500 m, the average hydraulic conductivity in stable regions is approximately an order of magnitude lower than in unstable regions, largely due to the presence of crystalline basement rocks and the absence of significant tectonic activity [24]. However, at shallower depths of less than 200 m, the hydraulic conductivities are similar across both regions. This is possibly due to the overriding effects of weathering and erosion, which are prevalent in both geological settings. Then, any differences brought about by tectonic processes are relatively insignificant.
Figure 10 showcases the impact of these faults on hydraulic conductivity by comparing faulted and non-faulted sub-datasets. The faulted sub-datasets exhibit a broader range of logarithmic hydraulic conductivities, extending from −11 to −2, suggesting greater variability. On the other hand, the non-faulted sub-datasets show a narrower range, from −8 to −2.
Furthermore, the average logarithmic hydraulic conductivity for the faulted sub-dataset is 0.4 orders of magnitude lower than that of the non-faulted sub-dataset, indicating a general trend of reduced conductivity associated with fault presence. Jacek Scibek [55] noted that within fault cores, hydraulic conductivity can be three orders of magnitude lower compared to non-faulted zones due to mudification phenomenon caused by excessive pressure at the core of the fault. Conversely, in the fault damage zones, conductivity is typically one order of magnitude higher due to increased seepage channels caused by the proper pressure. It is possible that based on the difference in average permeability between faulted rock and non-faulted rock, the ratio of the rock mass located in the fault core to the rock mass located in the fault damage zone can be roughly inferred. Therefore, we can infer the stress state of the engineering area, which helps prevent disasters such as rock bursts [56,57].
It is important to note that the mean hydraulic conductivity curves presented are approximations. The exact location of data-point collection (whether within the fault core or the affected zones) is not always clear, adding a layer of uncertainty to the analysis. Additionally, the representation of these curves could be skewed by the sampling ratio of fault core areas to fault-affected zones, highlighting the need for the careful interpretation of the data.
3.4. Exponential Model Application in Qinghai Engineering Project
Hydraulic conductivity for the project area was revealed through packer tests in boreholes. The project area contains two main types of boreholes: the QZK series and the SZK series. QZK stands for the abbreviation of phonetic Chinese “QianZuanKong”, which means shallow boreholes. SZK stands for the abbreviation of phonetic Chinese “ShenZuanKong”, which means deep boreholes. The former represents shallow boreholes (depths of around 100 m), and the latter represents deep boreholes (depths greater than 100 m). The shallow hydraulic conductivity data obtained from packer tests spanned wide orders of magnitude. As Kuang et al. [33] pointed out, differentiating between the general dataset and the instances of extremely low conductivity provides enhanced assessment. Thus, to accurately portray the K–Z relationship in this project area, extremely low conductivity data from certain boreholes was analyzed separately from the general dataset.
Figure 11a shows the general hydraulic conductivity data of the project area. The three rocks are distributed similarly at shallow depths less than 200 m. The hydraulic conductivities of igneous rocks are much higher at 200–600 m. The data across all rock types exhibit an exponential decay pattern, represented by the equation:
It is important to note that individual decay rates for each rock type do not consistently align with this overall exponential trend, potentially due to limited data availability.
In addition, Figure 11b shows the exponential decay exists in the low hydraulic conductivity data. The model for the QZK series can be expressed as:
The model for the SZK series can be expressed as:
Therefore, the distribution of hydraulic conductivities in the project area can be summarised by the above three equations (Equations (8)–(10)). Then, to evaluate the fitting effect of the exponential model, the project area’s hydraulic conductivities were predicted with the above Equations (8)–(10). The true values were then plotted against the predicted values, as shown in Figure 12.
The R2 value obtained from the linear fit indicates that the true value fits the predicted value well, and the fitted curve can reflect the variability of the data. There is a 95% likelihood that the predicted value of hydraulic conductivity from the exponential model for a single point will fall within the prediction interval when the depth is determined. Meanwhile, there is a 95% chance that the predicted value of the exponential model for the average hydraulic conductivity will fall in the confidence interval. On the other hand, the narrow confidence interval is more indicative of high accuracy of the linear fitting and good accuracy of the parameter estimation.
The slope (0.99) obtained from the linear fit is very close to 1, roughly indicating that the exponential model has a good prediction. The Mean Absolute Error (MAE) was calculated as the average of the absolute differences between predicted and true values. Additionally, the Mean Absolute Percentage Error (MAPE) was quantified as the relative magnitude of deviations. The true values closely align with the predicted values, evenly distributed on both sides of the y = x. The MAE and MAPE of the predicted values are 0.32 and 7.81%, signifying that the model generates superior forecasts.
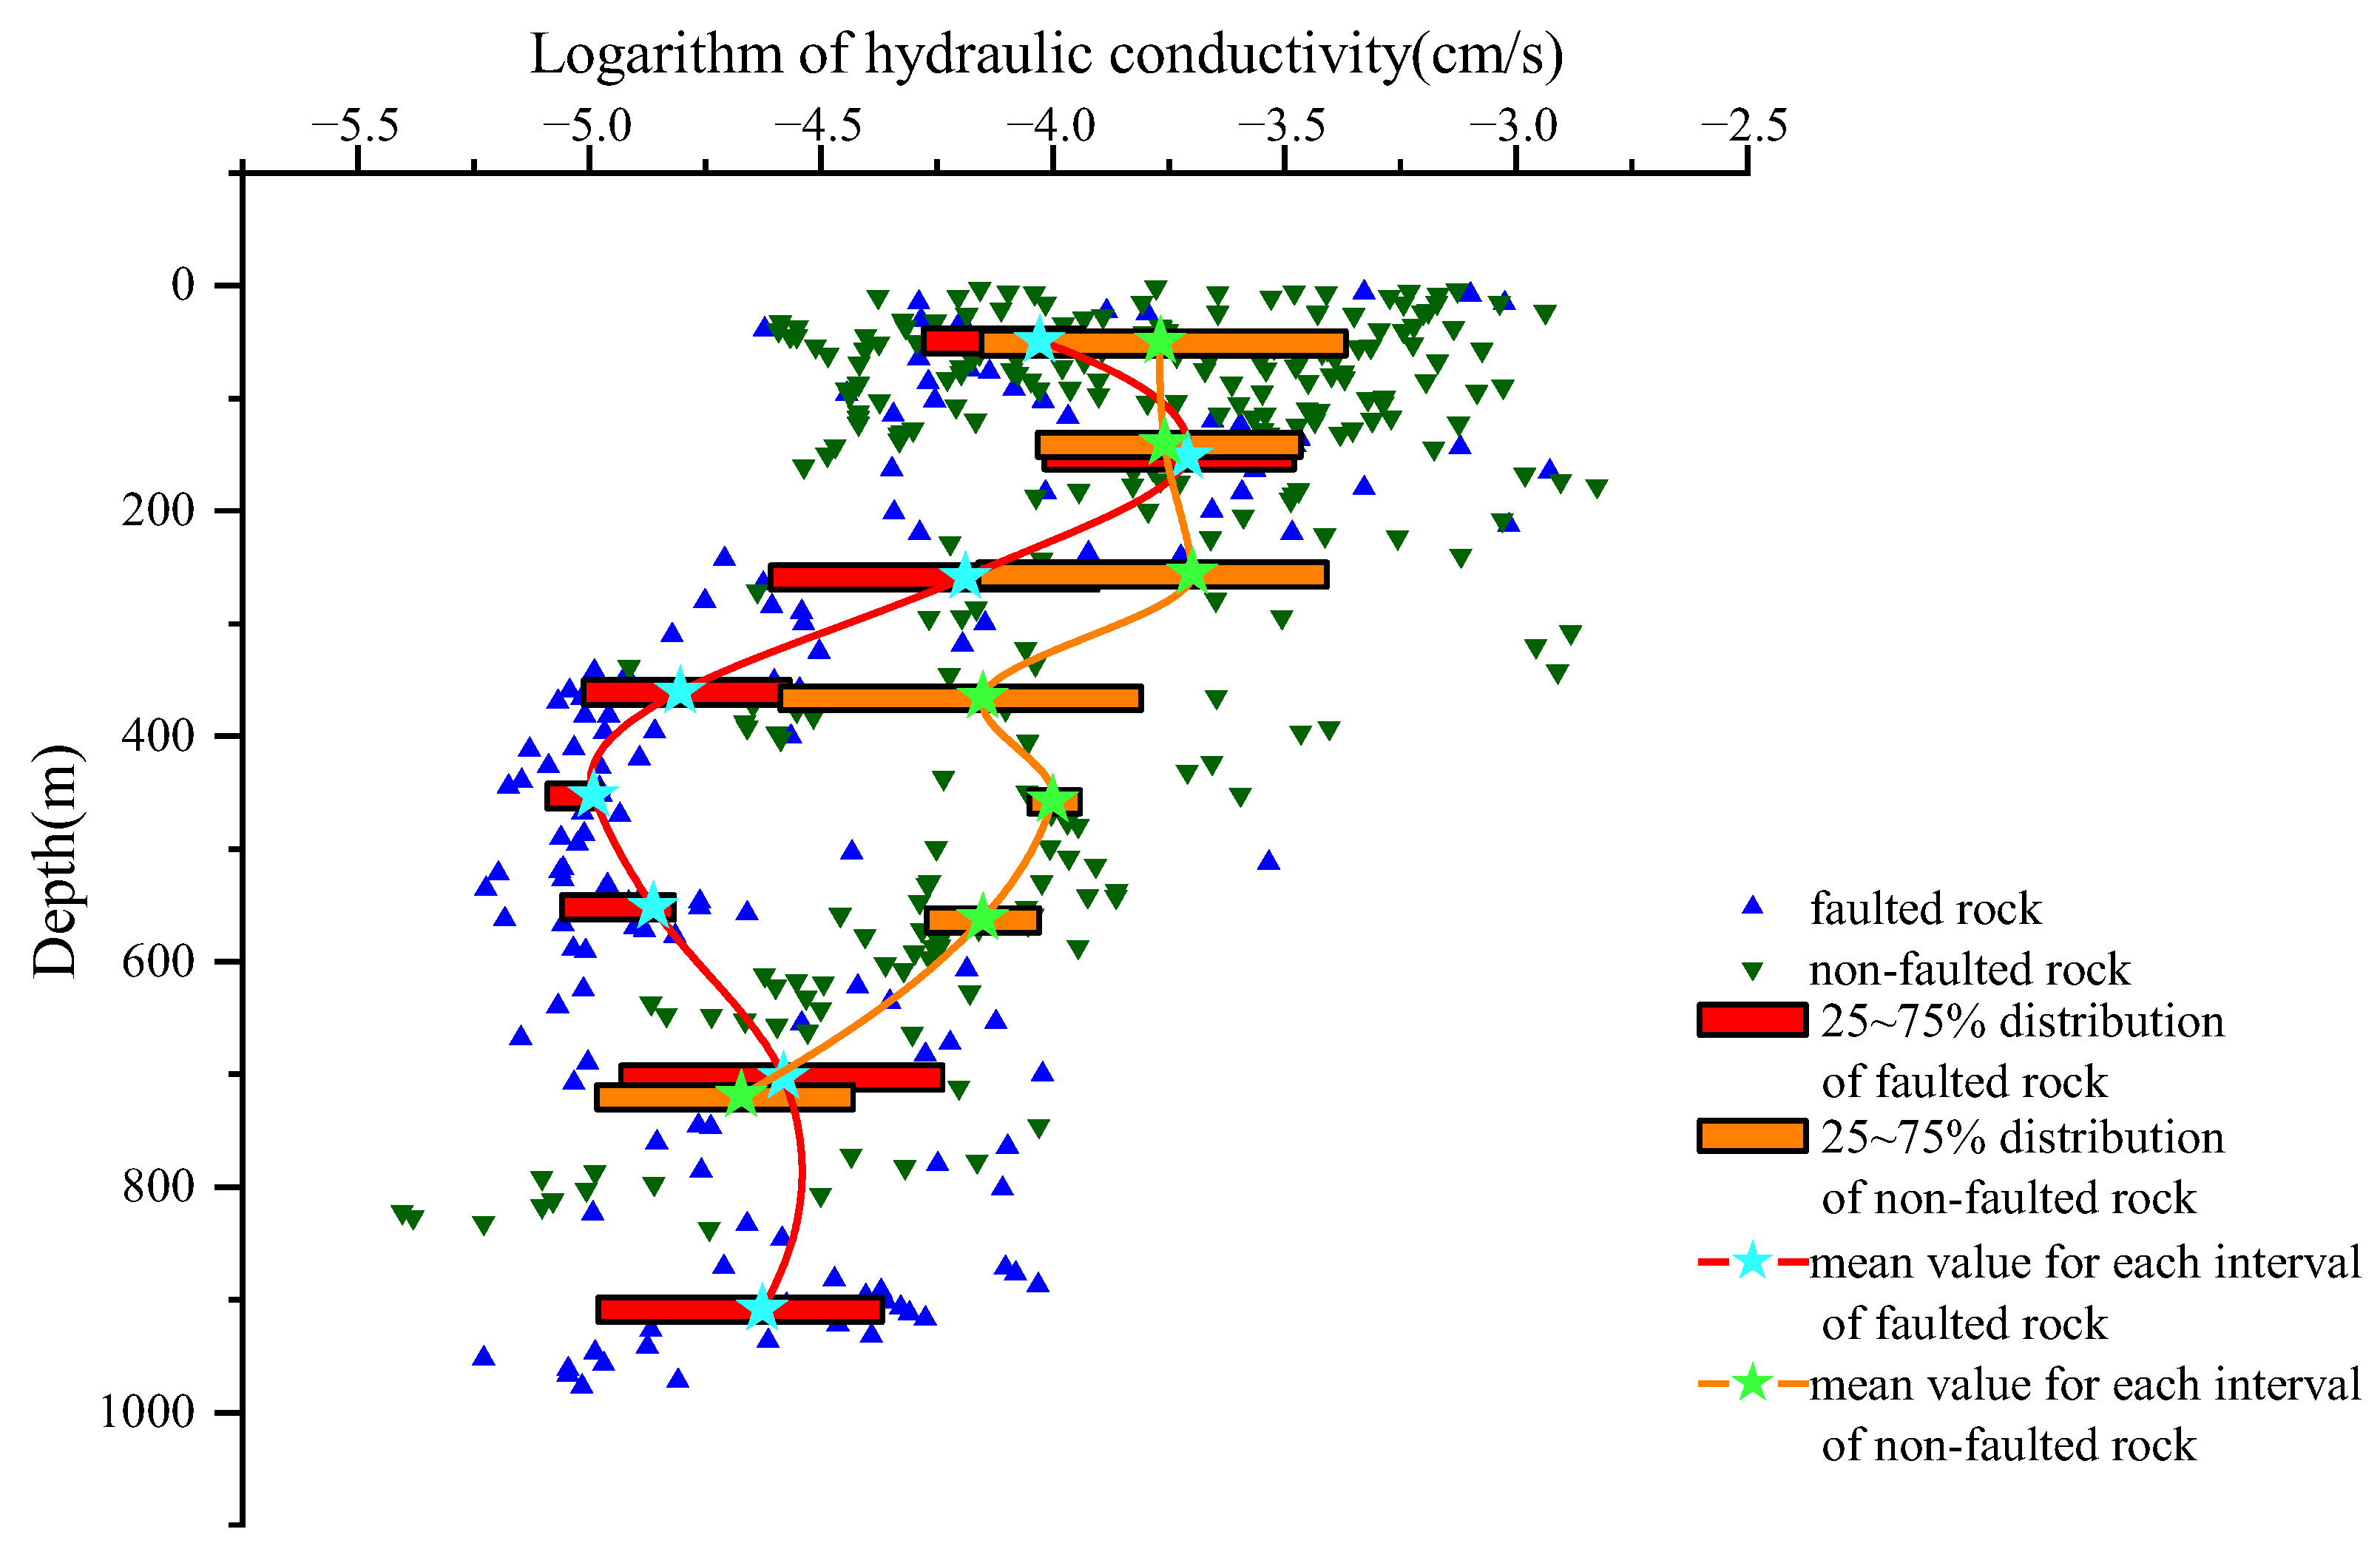
In the project area, most boreholes do not intersect faults, with only a few (such as SZK13, 18, and 10) passing through faults at the 0–500 m depth range. These boreholes exhibit various geological features, including fracture zones, mud deposits, collapse, and faults, leading to more complex patterns in hydraulic conductivity as depicted in Figure 13.
In Figure 13, it can be seen that at 0–500 m, the red line is more inclined to the left than the green line. This is because the fault core passes through boreholes, and the permeability at the fault core is lower than that of normal rocks. After 500 m, the red line shifts to the right due to the fact that this is a fault damage zone, and the core of the fault does not pass through boreholes. There is clear trend that faulted rocks’ hydraulic conductivities initially decrease and subsequently increase with depth. Furthermore, the logarithmic hydraulic conductivities of boreholes that cross the fault have a wider range than those that do not pass through it due to the existence of faults. These findings align with Jacek Scibek [55] and the above research on the permeability distribution pattern of faults. The presence of faults introduces significant variability in subsurface hydraulic properties, emphasizing the need for detailed analysis in areas with complex geological structures.
4. Conclusions
We proposed a new exponential model for predicting the hydraulic conductivity. A comparison with previous models revealed its advantages. The datasets of multiple researchers on rock mass permeability were collected in this study, resulting in a database of hydraulic conductivities with over 20,000 data points. The database was analyzed employing statistical methods like box plots and regression analysis. These methods examine the factors influencing the distribution of hydraulic conductivities with depth, including lithology, geological stableness, and faults. Subsequently, our model was applied to the Qinghai engineering project, where it demonstrated effective engineering prediction capabilities, thus showcasing the practical advantages of the exponential model. Our findings demonstrate that:
- The proposed exponential model overcame the two main limitations of the power-like model: First, it can effectively represent residual hydraulic conductivity in specific engineering conditions. Second, it captured the fast stabilization effects of the datasets well.
- Igneous rocks, metamorphic rocks, and mudstones have a similar distribution range for Log K within a range of (−13 to −2), while the sandstone is (−7 to −3). In addition, the hydraulic conductivity decays to stability from fast to slow in the order of metamorphic rocks, sandstones, igneous rocks, and mudstones.
- Hydraulic conductivity in stable regions is approximately one-tenth of unstable regions. Faults can limit and promote seepage, with hydraulic conductivity declining through fault cores and increasing through fault damage zones.
- In the application of the exponential model to the Qinghai engineering project, the model provides an accurate prediction of hydraulic conductivities in engineering projects.
Nevertheless, the model has limitations. In the future, the spatial variation of horizontal permeability can be combined to describe the distribution pattern of anisotropy in rock mass permeability [58]. Meanwhile, it considers a limited set of factors and provides a generalized distribution for prediction, which may not precisely reflect the specificities of individual engineering projects. Future enhancements, including the application of neural network methods, could enable the model to incorporate a broader range of quantifiable factors, thereby improving its predictive accuracy.
Supplementary Materials
The supporting information can be downloaded at: https://www.mdpi.com/article/10.3390/w16050778/s1, Figure S1: sensitivity analysis of two models on log Kr; Figure S2: Sensitivity analysis of two models on α; Table S1: Major faults information for the engineering project; Table S2: The borehole hydraulic conductivity information.
Author Contributions
Z.D.: conceptualization, methodology, resources, validation, writing—review and editing, supervision, project administration, funding acquisition. X.H.: methodology, software, formal analysis, visualization, data curation, writing—original draft preparation. W.W.: investigation, data curation, resources, writing—review and editing. F.Z.: investigation, data curation, resources, writing—review and editing. C.W.: methodology, software, validation, writing—review and editing, funding acquisition. All authors have read and agreed to the published version of the manuscript.
Funding
This work was financially supported by the National Natural Science Foundation of China (Grant Nos. 42302295 and 42272278).
Data Availability Statement
The data can be found at: https://github.com/crush856/hydraulic-conductivity-depth-model-supporting-information.git (accessed on 11 February 2024).
Acknowledgments
The authors thank P. Achtziger, Pouyan Asem, Li Wan, Yi Feng Chen, Andrew P. Snowdo, Geoscience Australia, GeoProvider, and other researchers that provided literature data support. Their specific information can be obtained from the references. The data provided by geoprovider are © GeoProvider https://geoprovider.no/and licensed CC-BY 4.0 (accessed on 19 May 2023). For the measured engineering project data, the authors thank Yellow River Engineering Consulting Co., Ltd. for their support. Also, thanks to Xingxing Kuang for the proposed permeability-depth model.
Conflicts of Interest
The authors declare no conflicts of interest.
References
- Brady, B.H.G.; Brown, E.T. Rock Mass Structure. In Rock Mechanics: For Underground Mining; Springer: Dordrecht, The Netherlands, 1985; pp. 48–85. [Google Scholar]
- Hsu, S.M.; Hsu, J.P.; Ke, C.C.; Lin, Y.T.; Huang, C.C. Rock mass permeability classification schemes to facilitate groundwater availability assessment in mountainous areas: A case study in Jhuoshuei river basin of Taiwan. Geosci. J. 2020, 24, 209–224. [Google Scholar] [CrossRef]
- MacDonald, A.; Davies, J.; Dochartaigh, B.Ó. Simple methods for assessing groundwater resources in low permeability areas of Africa. Br. Geol. Surv. 2001, 168, CR/01. [Google Scholar]
- Hamill, L.; Bell, F.G. Groundwater Resource Development; Elsevier: Amsterdam, The Netherlands, 2013. [Google Scholar]
- Dobson, P.F.; Kneafsey, T.J.; Hulen, J.; Simmons, A. Porosity, permeability, and fluid flow in the Yellowstone geothermal system, Wyoming. J. Volcanol. Geotherm. Res. 2003, 123, 313–324. [Google Scholar] [CrossRef]
- Murphy, H.D.; Tester, J.W.; Grigsby, C.O.; Potter, R.M. Energy extraction from fractured geothermal reservoirs in low-permeability crystalline rock. J. Geophys. Res. Solid Earth 1981, 86, 7145–7158. [Google Scholar] [CrossRef]
- Panja, P.; McLennan, J.; Green, S. Influence of permeability anisotropy and layering on geothermal battery energy storage. Geothermics 2021, 90, 101998. [Google Scholar] [CrossRef]
- Honarpour, M.M. Relative Permeability of Petroleum Reservoirs; CRC Press: Boca Raton, FL, USA, 2018. [Google Scholar]
- Subasi, A.; El-Amin, M.F.; Darwich, T.; Dossary, M. Permeability prediction of petroleum reservoirs using stochastic gradient boosting regression. J. Ambient. Intell. Humaniz. Comput. 2020, 13, 3555–3564. [Google Scholar] [CrossRef]
- You, X.; Liu, S.; Dai, C.; Guo, Y.; Zhong, G.; Duan, Y. Contaminant occurrence and migration between high-and low-permeability zones in groundwater systems: A review. Sci. Total Environ. 2020, 743, 140703. [Google Scholar] [CrossRef] [PubMed]
- Hadley, P.W.; Newell, C. The new potential for understanding groundwater contaminant transport. Groundwater 2014, 52, 174–186. [Google Scholar] [CrossRef] [PubMed]
- Nobaharan, K.; Bagheri Novair, S.; Asgari Lajayer, B.; van Hullebusch, E.D. Phosphorus Removal from Wastewater: The Potential Use of Biochar and the Key Controlling Factors. Water 2021, 13, 517. [Google Scholar] [CrossRef]
- Zhao, S.; Zhang, J.; Feng, S.J. The era of low-permeability sites remediation and corresponding technologies: A review. Chemosphere 2023, 313, 137264. [Google Scholar] [CrossRef] [PubMed]
- Armitage, P.; Worden, R.H.; Faulkner, D.R.; Butcher, A.R.; Espie, A.A. Permeability of the Mercia Mudstone: Suitability as caprock to carbon capture and storage sites. Geofluids 2016, 16, 26–42. [Google Scholar] [CrossRef]
- Cinar, Y.; Bukhteeva, O.; Neal, P.R.; Allinson, W.G.; Paterson, L. CO2 storage in low permeability formations. In SPE Improved Oil Recovery Conference? SPE: Kuala Lumpur, Malaysia, 2008. [Google Scholar]
- Tan, Y.; Nookuea, W.; Li, H.; Thorin, E.; Yan, J. Property impacts on Carbon Capture and Storage (CCS) processes: A review. Energy Convers. Manag. 2016, 118, 204–222. [Google Scholar] [CrossRef]
- Farhadi, H.; Najafzadeh, M. Flood Risk Mapping by Remote Sensing Data and Random Forest Technique. Water 2021, 13, 3115. [Google Scholar] [CrossRef]
- Liu, J.; Zhang, X.; Li, X.; Li, Z.; Sun, C. A New Quantitative Evaluation Index System for Disaster-Causing Factors of Mud Inrush Disasters in Water-Rich Fault Fracture Zone. Appl. Sci. 2023, 13, 6199. [Google Scholar] [CrossRef]
- Zhang, L. Engineering Properties of Rocks; Butterworth-Heinemann: Oxford, UK, 2016. [Google Scholar]
- Bryant, S.; Cade, C.; Mellor, D. Permeability prediction from geologic models. AAPG Bull. 1993, 77, 1338–1350. [Google Scholar]
- Louis, C. Introduction a l’hydraulique des roches [Introduction to rock hydraulics]. Bur. Rech. Géol. Min. 1974, III, 283–356. [Google Scholar]
- Piscopo, V.; Baiocchi, A.; Lotti, F.; Ayan, E.A.; Biler, A.R.; Ceyhan, A.H.; Cüylan, M.; Dişli, E.; Kahraman, S.; Taşkın, M. Estimation of rock mass permeability using variation in hydraulic conductivity with depth: Experiences in hard rocks of western Turkey. Bull. Eng. Geol. Environ. 2018, 77, 1663–1671. [Google Scholar] [CrossRef]
- Wan, L.; Jiang, X.; Wang, X. A Common Regularity of Aquifers: The Decay in Hydraulic Conductivity with Depth. Geol. J. China Univ. 2010, 16, 7–12. [Google Scholar]
- Ahlbom, K.; Albino, B.; Carlsson, L.; Danielsson, J.; Nilsson, G.; Olsson, O.; Stenberg, L. Evaluation of the Geological, Geophysical and Hydrogeological Conditions at Kamlunge; Swedish Nuclear Fuel Supply Co.: Stockholm, Sweden, 1983. [Google Scholar]
- Manning, C.E.; Ingebritsen, S.E. Permeability of the continental crust: Implications of geothermal data and metamorphic systems. Rev. Geophys. 1999, 37, 127–150. [Google Scholar] [CrossRef]
- Achtziger-Zupančič, P.; Loew, S.; Mariéthoz, G. A new global database to improve predictions of permeability distribution in crystalline rocks at site scale. J. Geophys. Res. Solid Earth 2017, 122, 3513–3539. [Google Scholar] [CrossRef]
- Chen, Y.F.; Hu, S.H.; Hu, R.; Zhou, C.B. Estimating hydraulic conductivity of fractured rocks from high-pressure packer tests with an Izbash’s law-based empirical model. Water Resour. Res. 2015, 51, 2096–2118. [Google Scholar] [CrossRef]
- Chen, Y.-F.; Ling, X.-M.; Liu, M.-M.; Hu, R.; Yang, Z. Statistical distribution of hydraulic conductivity of rocks in deep-incised valleys, Southwest China. J. Hydrol. 2018, 566, 216–226. [Google Scholar] [CrossRef]
- Stober, I.; Bucher, K. Hydraulic properties of the crystalline basement. Hydrogeol. J. 2007, 15, 213–224. [Google Scholar] [CrossRef]
- Zhang, L. Aspects of rock permeability. Front. Struct. Civ. Eng. 2013, 7, 102–116. [Google Scholar] [CrossRef]
- Wei, Z.; Hudson, J. Permeability of jointed rock masses. In ISRM International Symposium; ISRM: Lisbon, Portugal, 1988. [Google Scholar]
- Wei, Z.; Egger, P.; Descoeudres, F. Permeability predictions for jointed rock masses. In International Journal of Rock Mechanics and Mining Sciences & Geomechanics Abstracts; Elsevier: Amsterdam, The Netherlands, 1995. [Google Scholar]
- Kuang, X.; Jiao, J.J. An integrated permeability-depth model for Earth’s crust. Geophys. Res. Lett. 2014, 41, 7539–7545. [Google Scholar] [CrossRef]
- Asem, P.; Gardoni, P. A probabilistic, empirical model for permeability of mudstone. Probabilistic Eng. Mech. 2022, 69, 103262. [Google Scholar] [CrossRef]
- Geoprovider; Bormann, P. Porosity, Permeability, Rock Type Data from 1240 Norwegian Exploration, Appraisal and Development Wells. Core Data (2.0) [Data set]. Zenodo 2021. [Google Scholar] [CrossRef]
- Great Artesian Basin Porosity and Permeability; Geoscience Australia: Canberra, Australia, 2013. Available online: https://ecat.ga.gov.au/geonetwork/srv/eng/catalog.search#/metadata/76562 (accessed on 15 January 2024).
- Snowdon, A.P.; Normani, S.D.; Sykes, J.F. Analysis of crystalline rock permeability versus depth in a Canadian Precambrian rock setting. J. Geophys. Res. Solid Earth 2021, 126, e2020JB020998. [Google Scholar] [CrossRef]
- Snow, D.T. Packer Injection Test Data from Sites on Fractured Rock; Lawrence Berkeley National Lab. (LBNL): Berkeley, CA, USA, 1979. [Google Scholar]
- Stevenson, D.R.; Brown, A.; Davison, C.C.; Gascoyne, M.; McGregor, R.G.; Ophori, D.U.; Tomsons, D.K. A Revised Conceptual Hydrogeologic Model of a Crystalline Rock Environment, Whiteshell Research Area, Southeastern Manitoba, Canada (No. AECL-11331); Atomic Energy of Canada Ltd.: Chalk River, ON, Canada, 1996. [Google Scholar]
- Johnson, R.L.; Glassborow, B.; Scott, M.P.; Pallikathekathil, Z.J.; Datey, A.; Meyer, J.J. Utilizing current technologies to understand permeability, stress azimuths and magnitudes and their impact on hydraulic fracturing success in a coal seam gas reservoir. In Proceedings of the SPE Asia Pacific Oil and Gas Conference and Exhibition, Brisbane, QC, Australia, 18–20 October 2010; OnePetro: Richardson, TX, USA, 2010. [Google Scholar]
- Burger, U.; Perello, P.; Reinhardt, S.; Torri, R. Verification and Validation of Hydraulic Packer Test Results in a Deep Lying Tunnel Project. In Engineering Geology for Society and Territory-Volume 6: Applied Geology for Major Engineering Projects; Springer: Berlin/Heidelberg, Germany, 2015. [Google Scholar]
- Fulton, P.M.; Harris, R.N.; Saffer, D.M.; Brodsky, E.E. Does hydrologic circulation mask frictional heat on faults after large earthquakes? J. Geophys. Res. 2010, 115, B09402. [Google Scholar] [CrossRef]
- Fisher, A.T.; Zwart, G. 15. Packer Experiments along the Décollement of the Barbados Accretionary Complex: Measurements of In Situ Permeability1. Proc. Ocean Drill. Prog. Sci. Res. 1997, 156, 199–218. [Google Scholar]
- Milnes, A.G.; Aaltonen, I.; Kemppainen, K.; Mattila, J.; Wikström, L.; Kärki, A.; Ahokas, T. Geological Data Acquisition for Site Characterisation at Olkiluoto: A Framework for the Phase of Underground Investigations; Posiva Oy: Eurajoki, Finland, 2007. [Google Scholar]
- Gale, J.E. The effects of fracture type (induced versus natural) on the stress-fracture closure-fracture permeability relationships. In ARMA US Rock Mechanics/Geomechanics Symposium; ARMA: Berkeley, CA, USA, 1982. [Google Scholar]
- Pfister, M.; Rybach, L. High-resolution digital temperature logging in areas with significant convective heat transfer. Geothermics 1995, 24, 95–100. [Google Scholar] [CrossRef]
- Guo, J.; Zhao, H.; Ma, F.; Li, K.; Zhao, C. Investigating the permeability of fractured rock masses and the origin of water in a mine tunnel in Shandong Province, China. Water Sci. Technol. 2015, 72, 2006–2017. [Google Scholar] [CrossRef] [PubMed]
- Achtziger-Zupančič, P.; Loew, S.; Hiller, A.; Mariethoz, G. 3D fluid flow in fault zones of crystalline basement rocks (Poehla-Tellerhaeuser Ore Field, Ore Mountains, Germany). Geofluids 2016, 16, 688–710. [Google Scholar] [CrossRef]
- Ikari, M.J.; Saffer, D.M.; Marone, C. Frictional and hydrologic properties of clay-rich fault gouge. J. Geophys. Res. Solid Earth 2009, 114. [Google Scholar] [CrossRef]
- Winkler, G.; Reichl, P. Scale dependent hydraulic investigations of faulted crystalline rocks–examples from the Eastern Alps, Austria. Fract. Rock Hydrogeol. 2014, 20, 181–196. [Google Scholar]
- MacDonald, A.M.; Taylor, R.G.; Bonsor, H.C. Groundwater in Africa: Is there sufficient water to support the intensification of agriculture from ‘land grabs’? In Handbook of Land and Water Grabs in Africa; Routledge: Abingdon, UK, 2012; pp. 376–383. [Google Scholar]
- Vandenberg, J.; Herrell, M.; Faithful, J.W.; Snow, A.M.; Lacrampe, J.; Bieber, C.; Dayyani, S.; Chisholm, V. Multiple modeling approach for the aquatic effects assessment of a proposed northern diamond mine development. Mine Water Environ. 2015, 35, 350–368. [Google Scholar] [CrossRef]
- Achtziger-Zupančič, P.; Loew, S.; Hiller, A. Factors controlling the permeability distribution in fault vein zones surrounding granitic intrusions (Ore Mountains/Germany). J. Geophys. Res. Solid Earth 2017, 122, 1876–1899. [Google Scholar] [CrossRef]
- Wibberley, C.A.J.; Yielding, G.; Di Toro, G. Recent advances in the understanding of fault zone internal structure: A review. Geol. Soc. Lond. Spec. Publ. 2022, 299, 5–33. [Google Scholar] [CrossRef]
- Scibek, J. Global Compilation and Analysis of Fault Zone Permeability. In Department of Earth and Planetary Sciences; McGill University: Montréal, QC, USA, 2019. [Google Scholar]
- He, M.; Zhang, Z.; Zhu, J.; Li, N.; Li, G.; Chen, Y. Correlation between the rockburst proneness and friction characteristics of rock materials and a new method for rockburst proneness prediction: Field demonstration. J. Pet. Sci. Eng. 2021, 205, 108997. [Google Scholar] [CrossRef]
- He, M.; Ding, M.; Yuan, Z.; Zhao, J.; Luo, B.; Ma, X. Numerical simulation of rock bursts triggered by blasting disturbance for deep-buried tunnels in jointed rock masses. Comput. Geotech. 2023, 161, 105609. [Google Scholar] [CrossRef]
- Wu, K.; He, M.; Yuan, Z.; Liu, X.; Luo, B.; Ma, X.; Ma, C. Characterizing rock transverse anisotropic spatial variations using digital drilling. Geoenergy Sci. Eng. 2024, 232, 212451. [Google Scholar] [CrossRef]
Figure 1.
Sensitivity analysis of two models on log Ks:l (a) the proposed exponential model and (b) the power-like model.
Figure 1.
Sensitivity analysis of two models on log Ks:l (a) the proposed exponential model and (b) the power-like model.
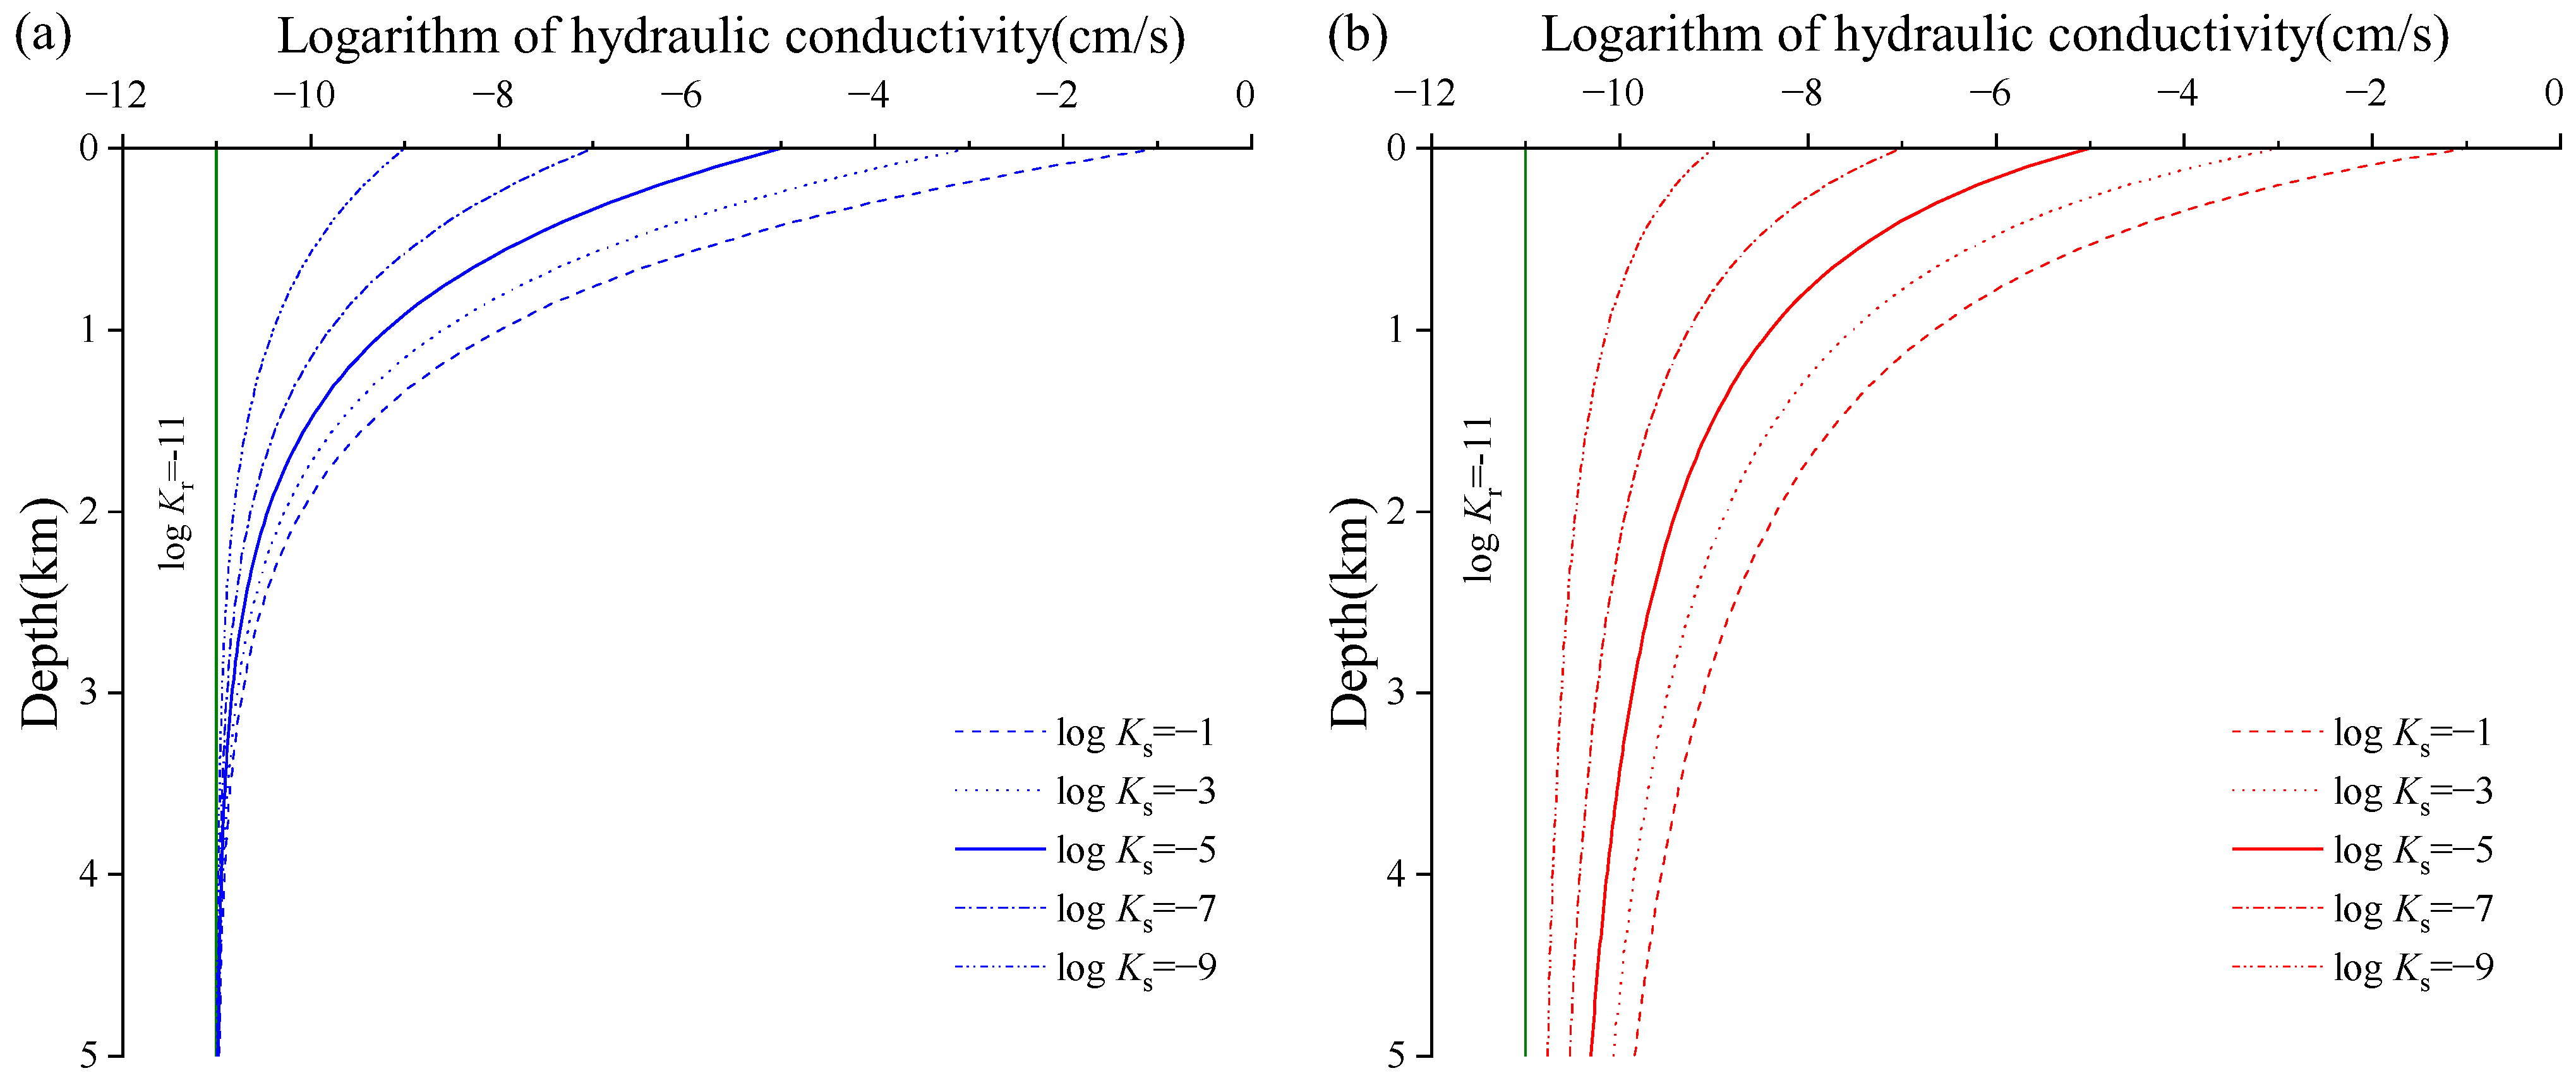
Figure 2.
Topography and geomorphology of the project area.
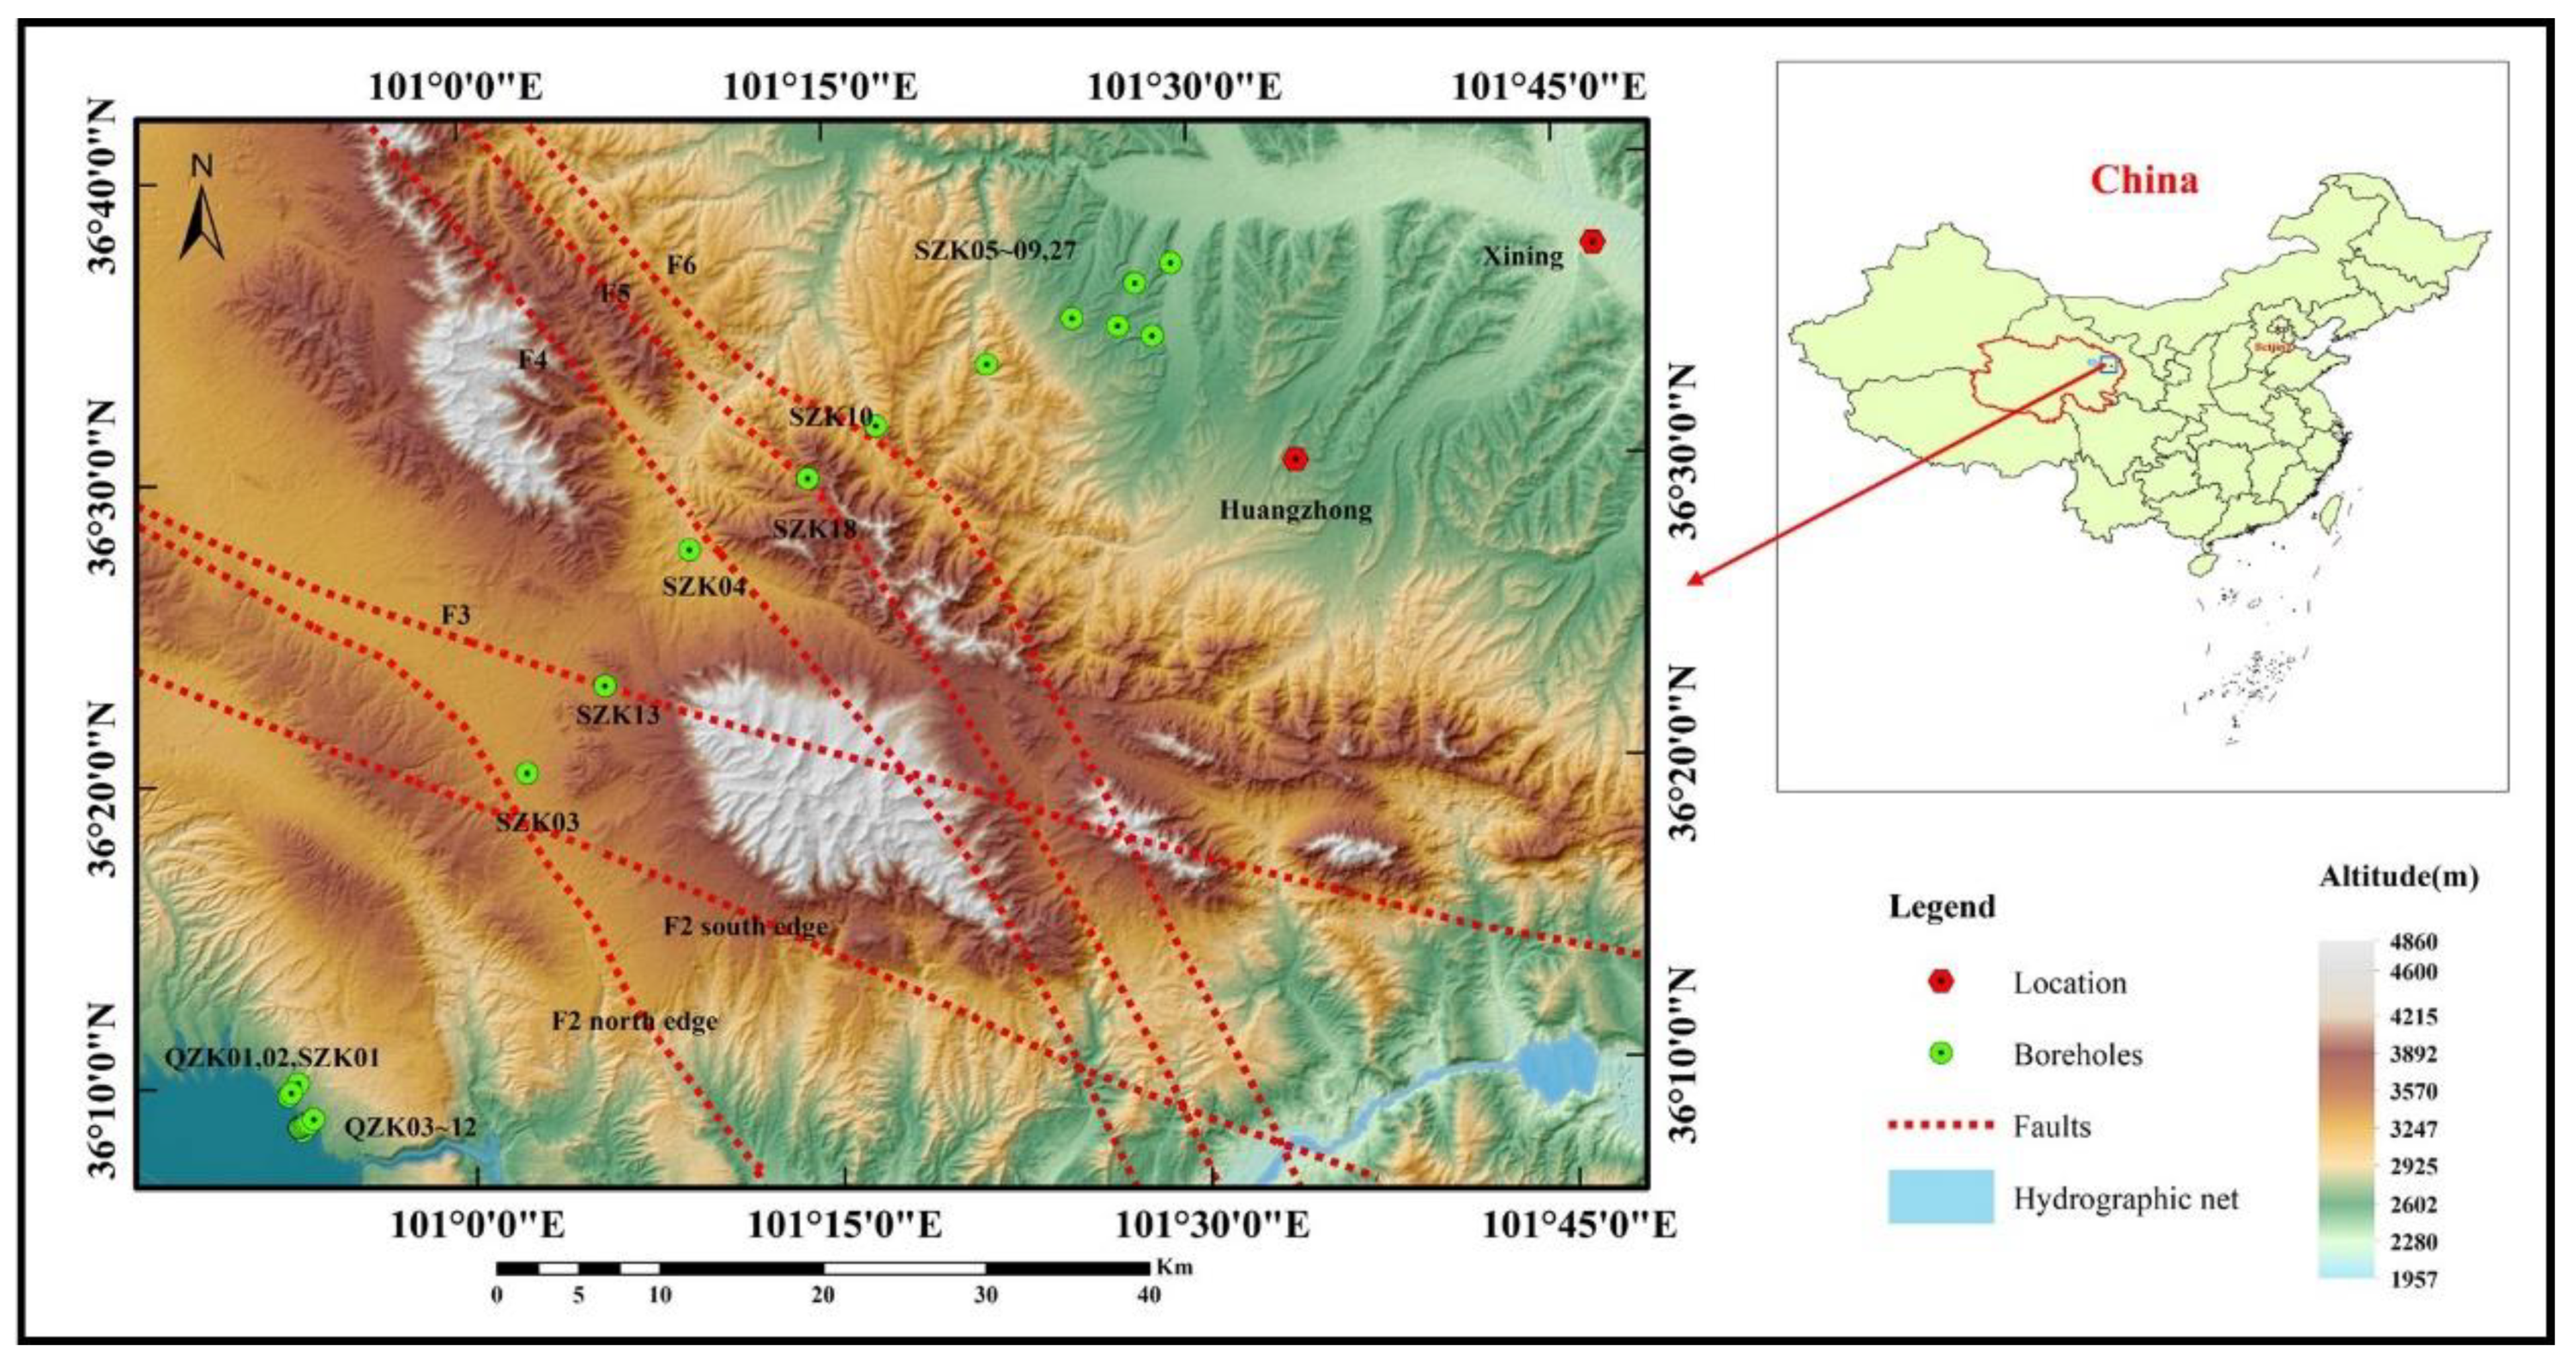
Figure 3.
Display of specific datasets used for validation of sensitive analysis.
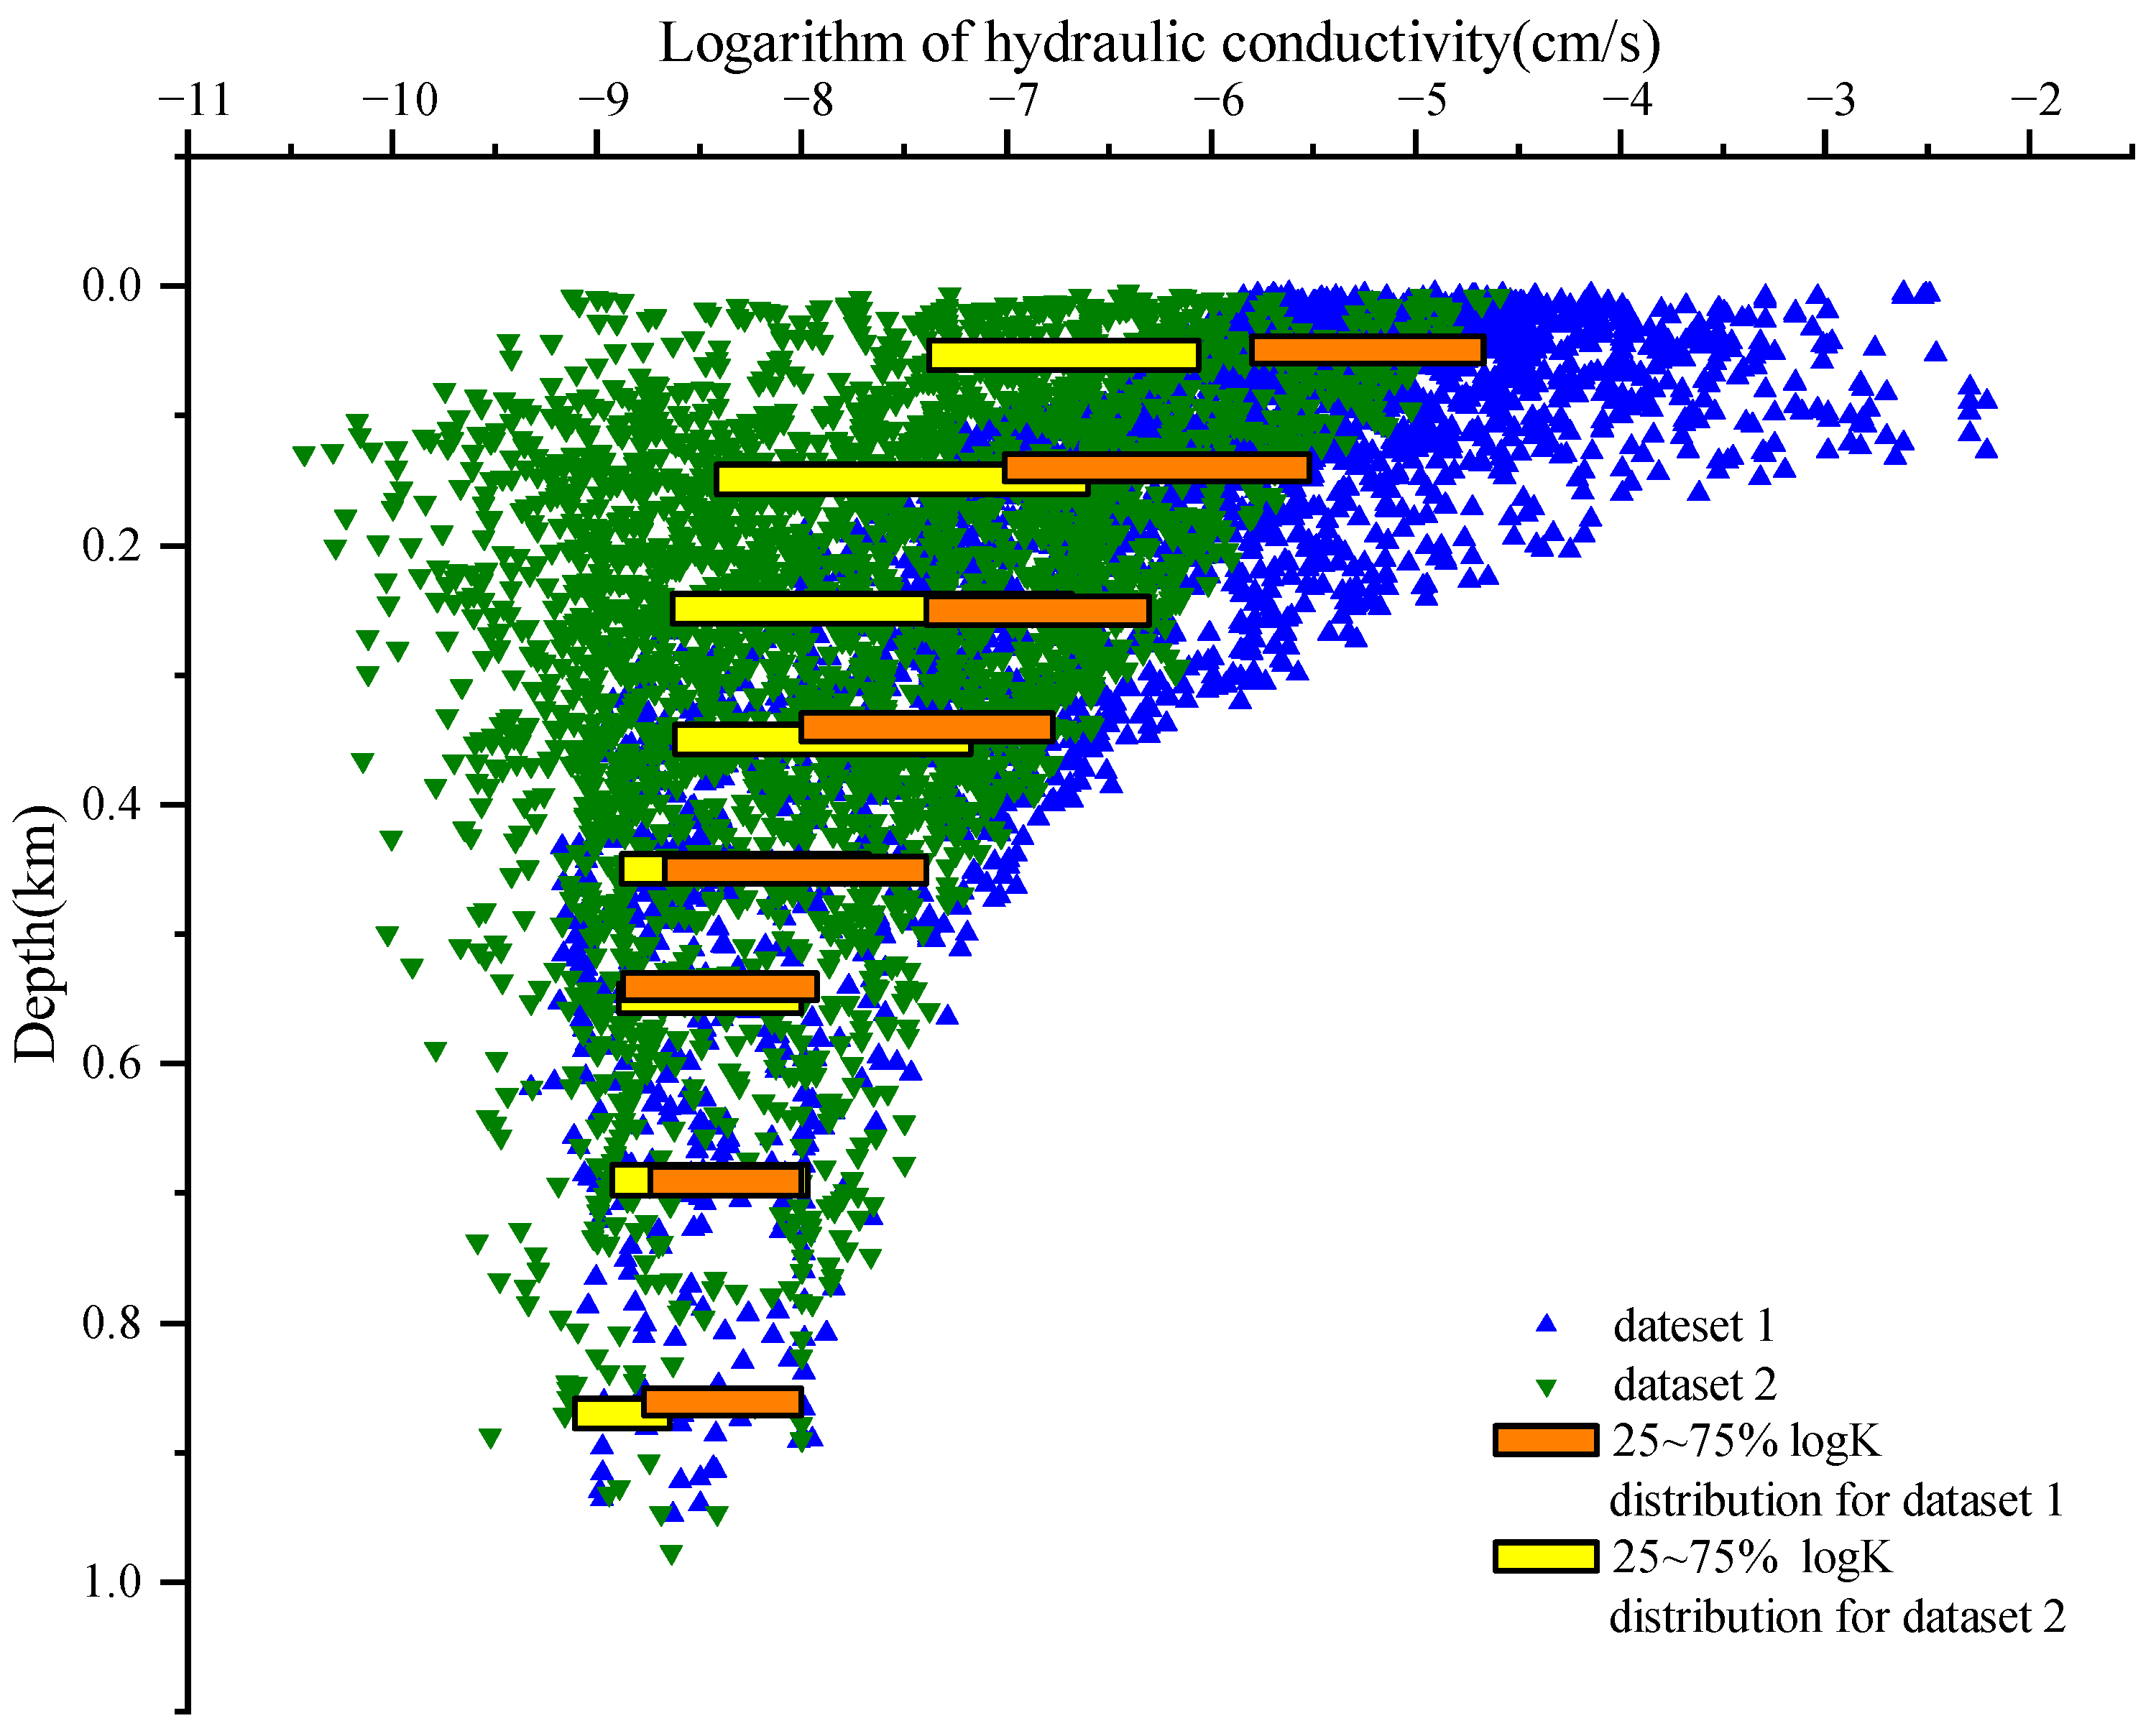
Figure 4.
Fitting effect diagrams: (a) fitting effect diagram of Dataset 1, (b) fitting effect diagram of Dataset 2.
Figure 4.
Fitting effect diagrams: (a) fitting effect diagram of Dataset 1, (b) fitting effect diagram of Dataset 2.
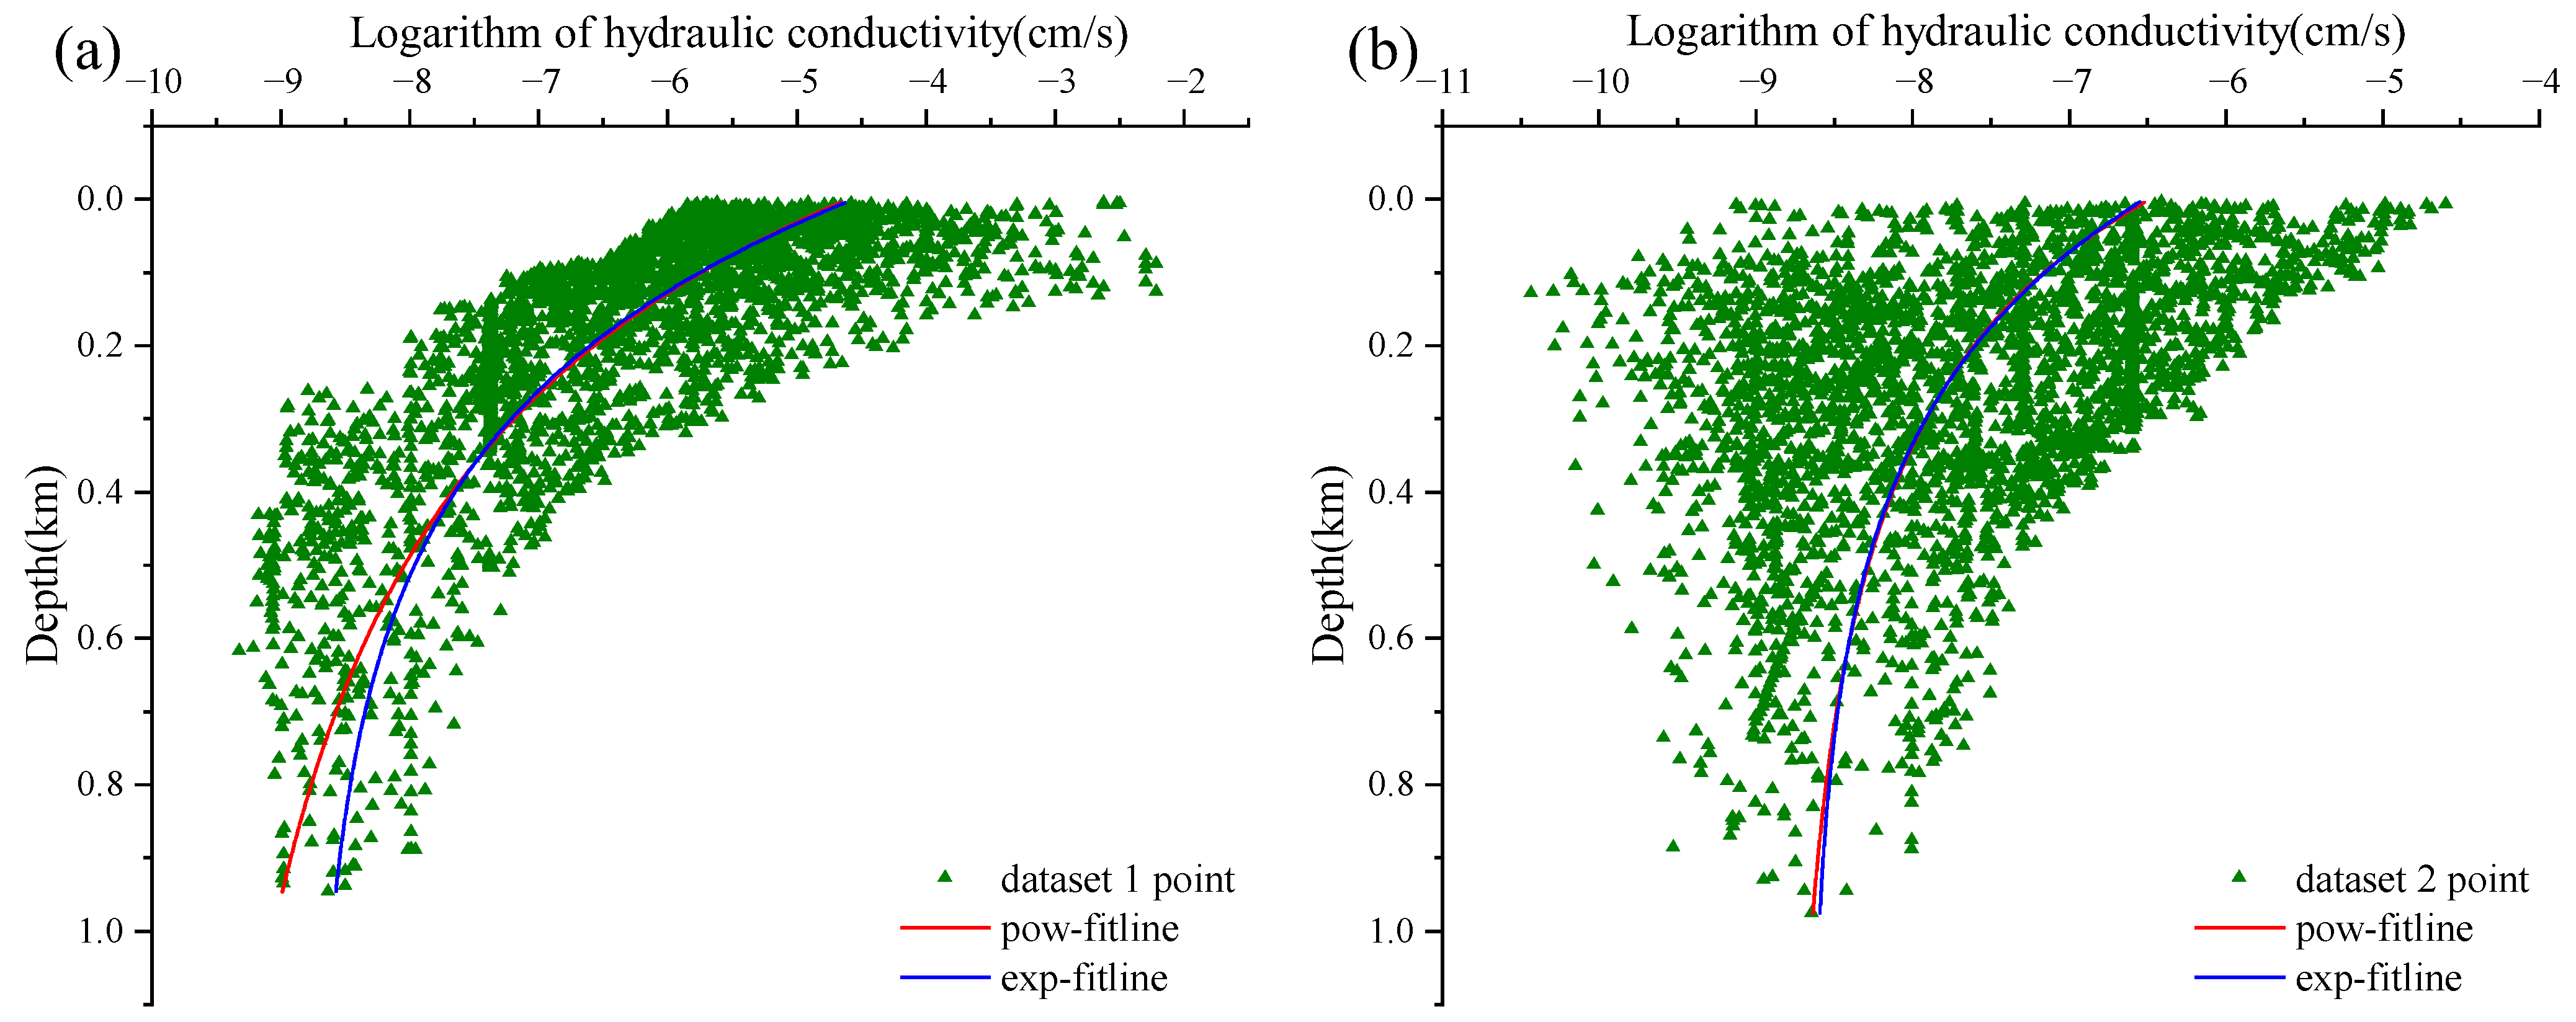
Figure 5.
Distribution of hydraulic conductivities with depth in a depth range of 0–1600 m, (a) igneous rocks, (b) metamorphic rocks, (c) sedimentary rocks (sandstone).
Figure 5.
Distribution of hydraulic conductivities with depth in a depth range of 0–1600 m, (a) igneous rocks, (b) metamorphic rocks, (c) sedimentary rocks (sandstone).
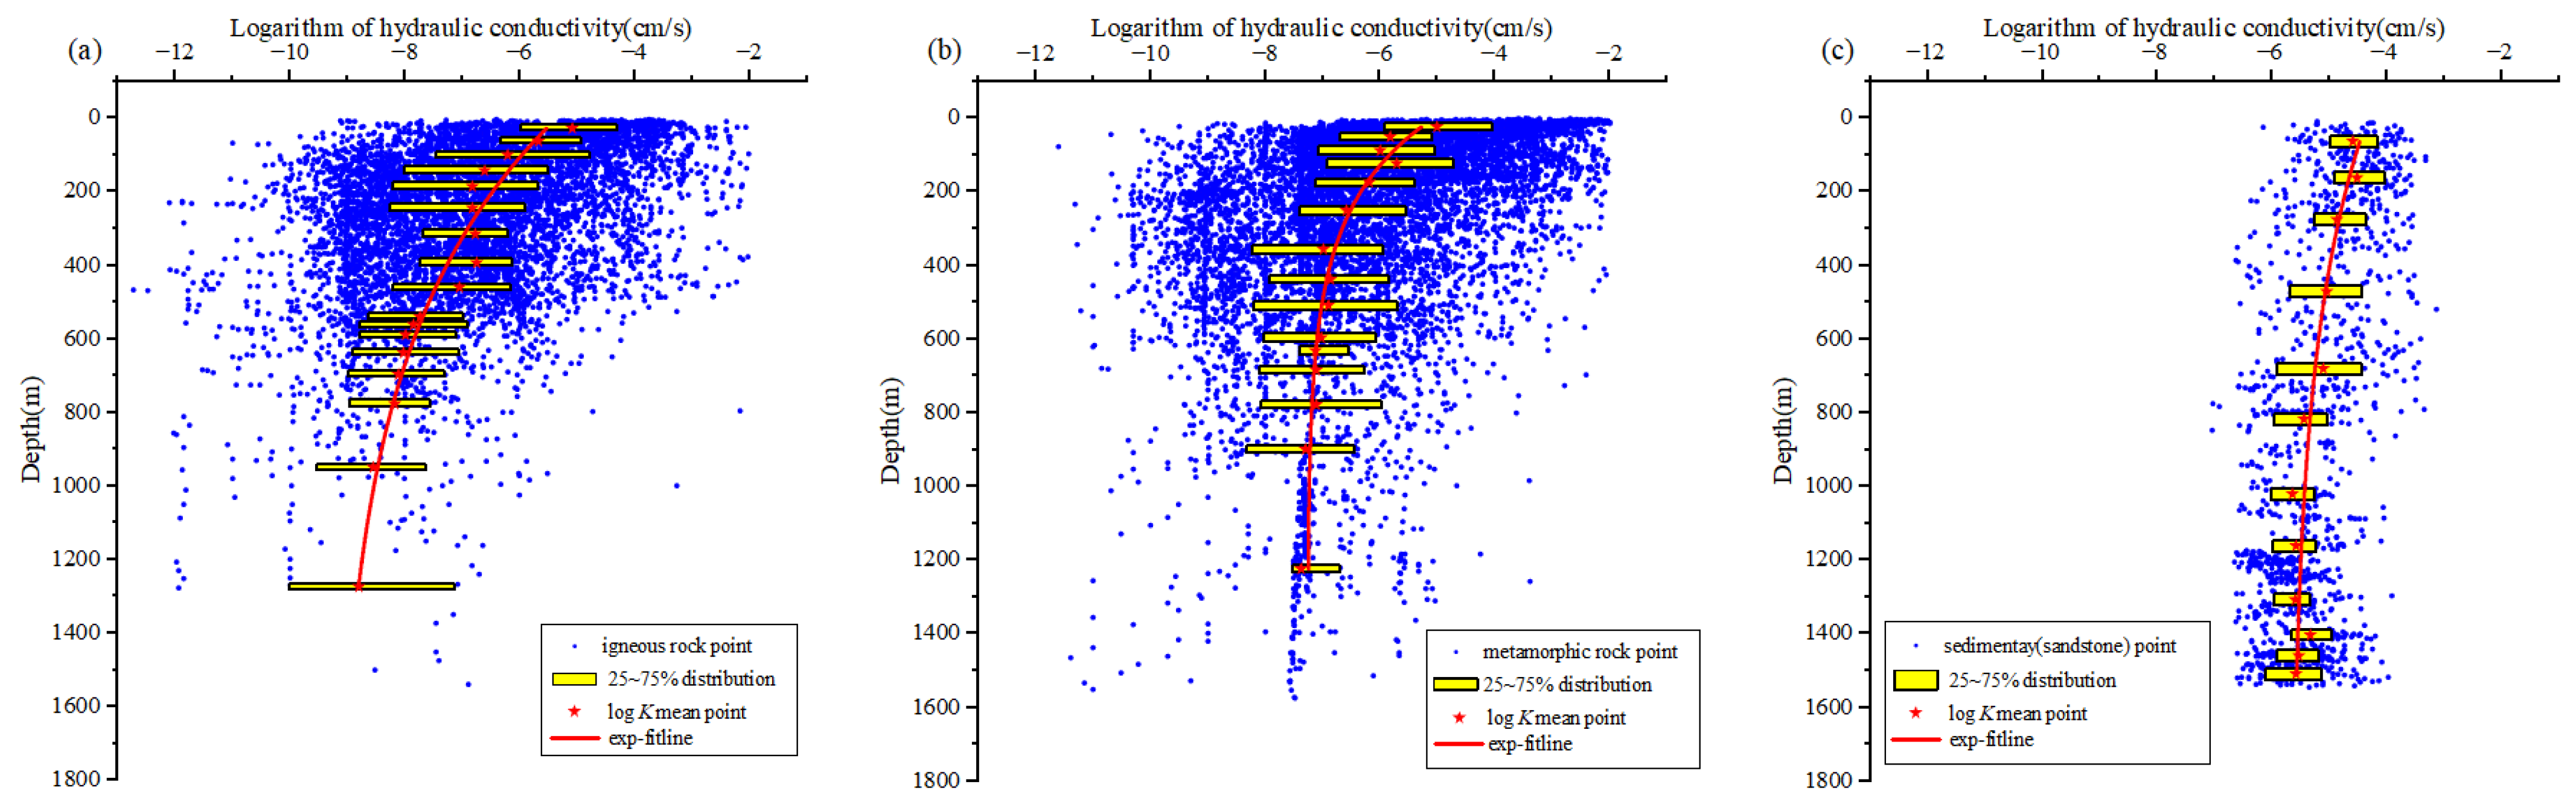
Figure 6.
Distribution of hydraulic conductivities with depth in a depth range of 0–7000 m, (a) sandstone, and (b) mudstone.
Figure 6.
Distribution of hydraulic conductivities with depth in a depth range of 0–7000 m, (a) sandstone, and (b) mudstone.
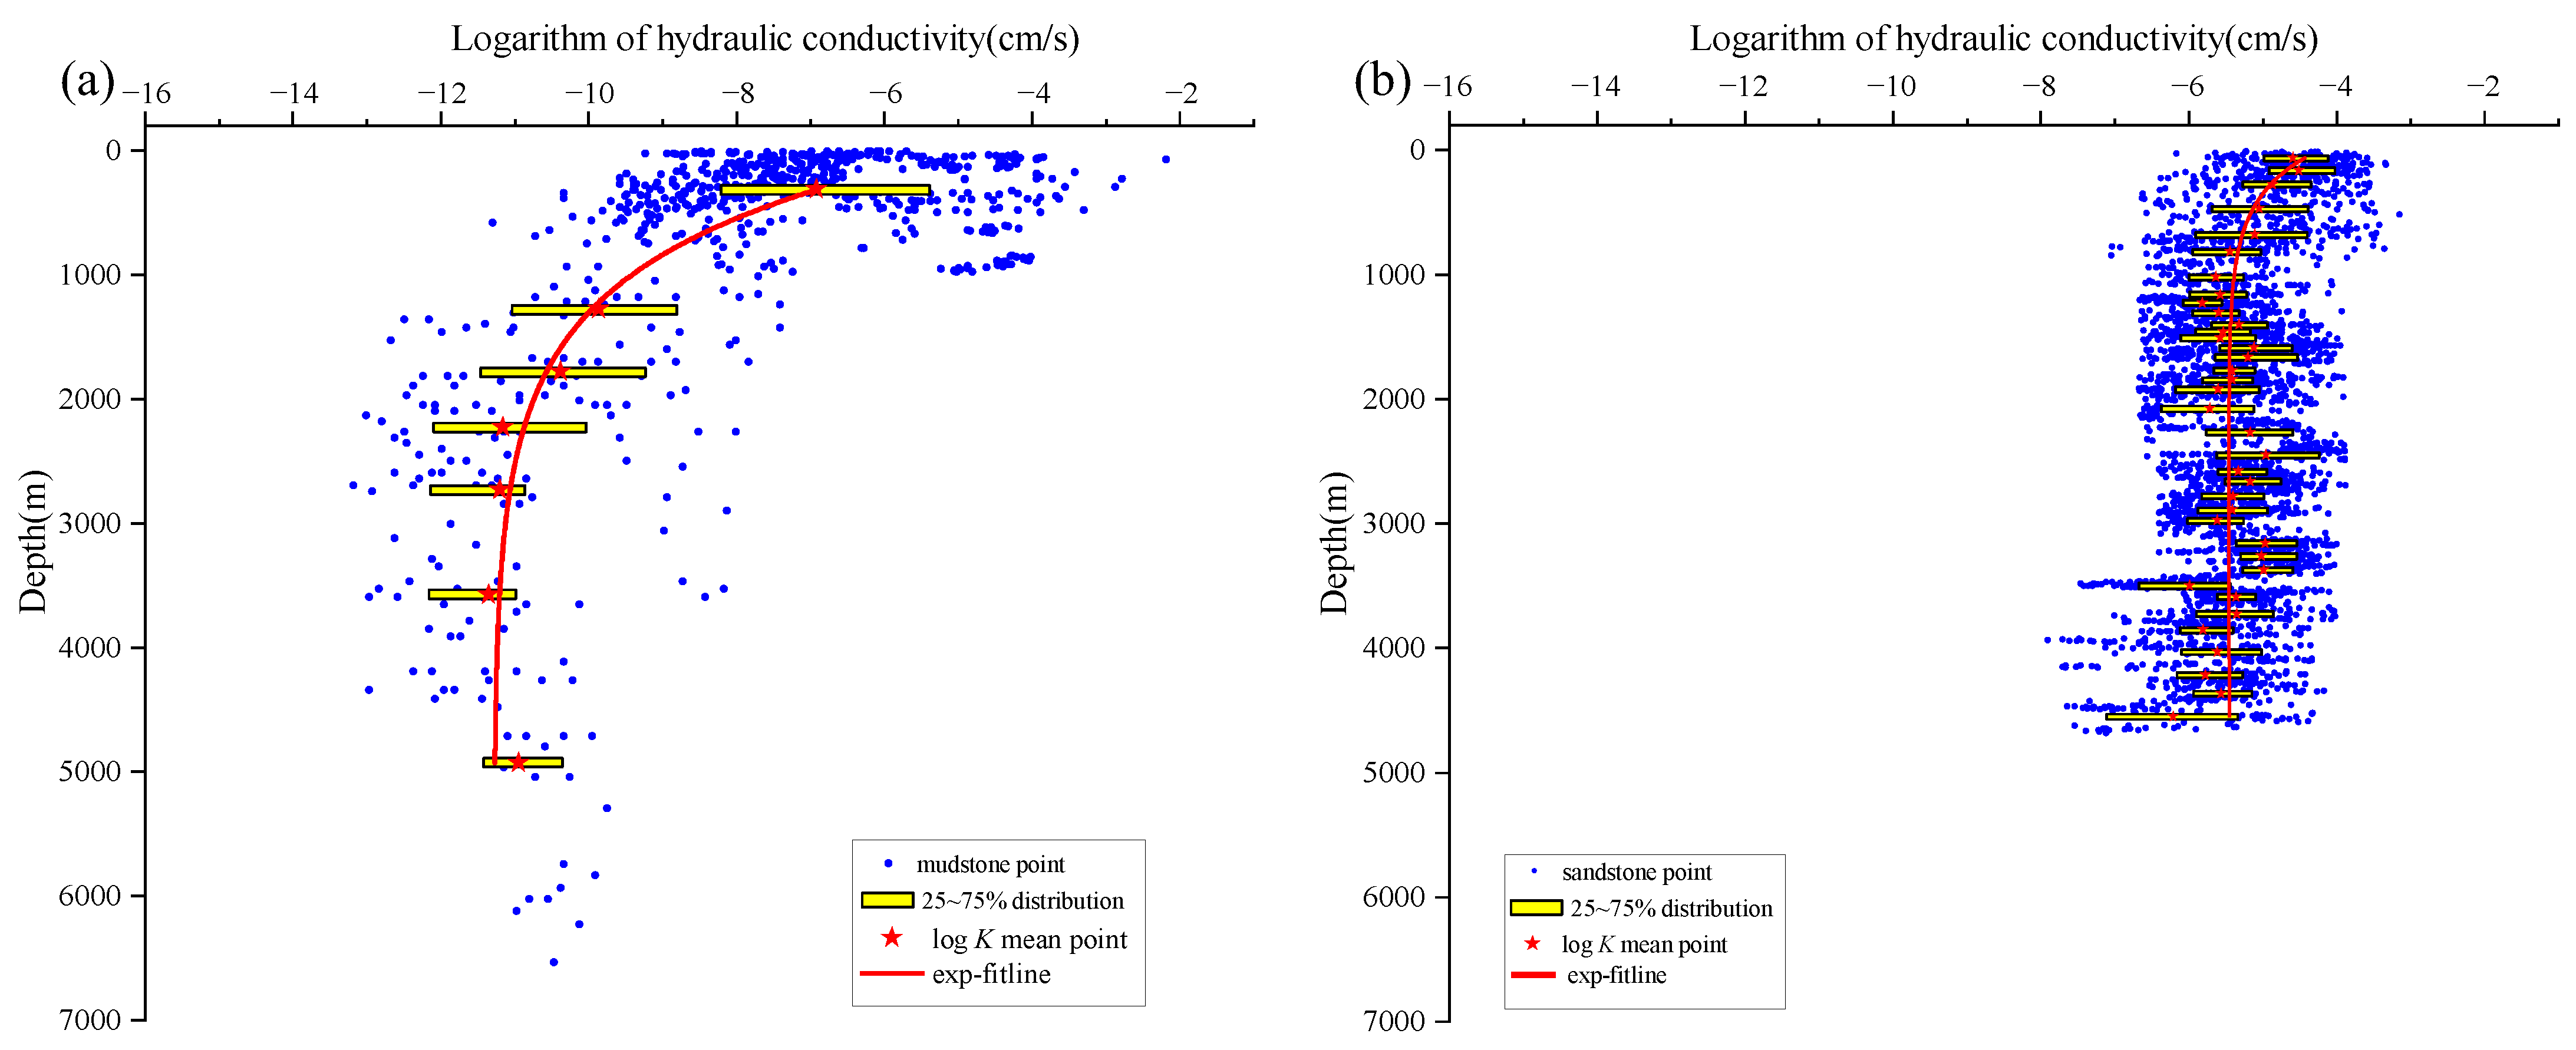
Figure 7.
Distribution of decay rates with depth for igneous rocks, metamorphic rocks, sandstones, and mudstones.
Figure 7.
Distribution of decay rates with depth for igneous rocks, metamorphic rocks, sandstones, and mudstones.
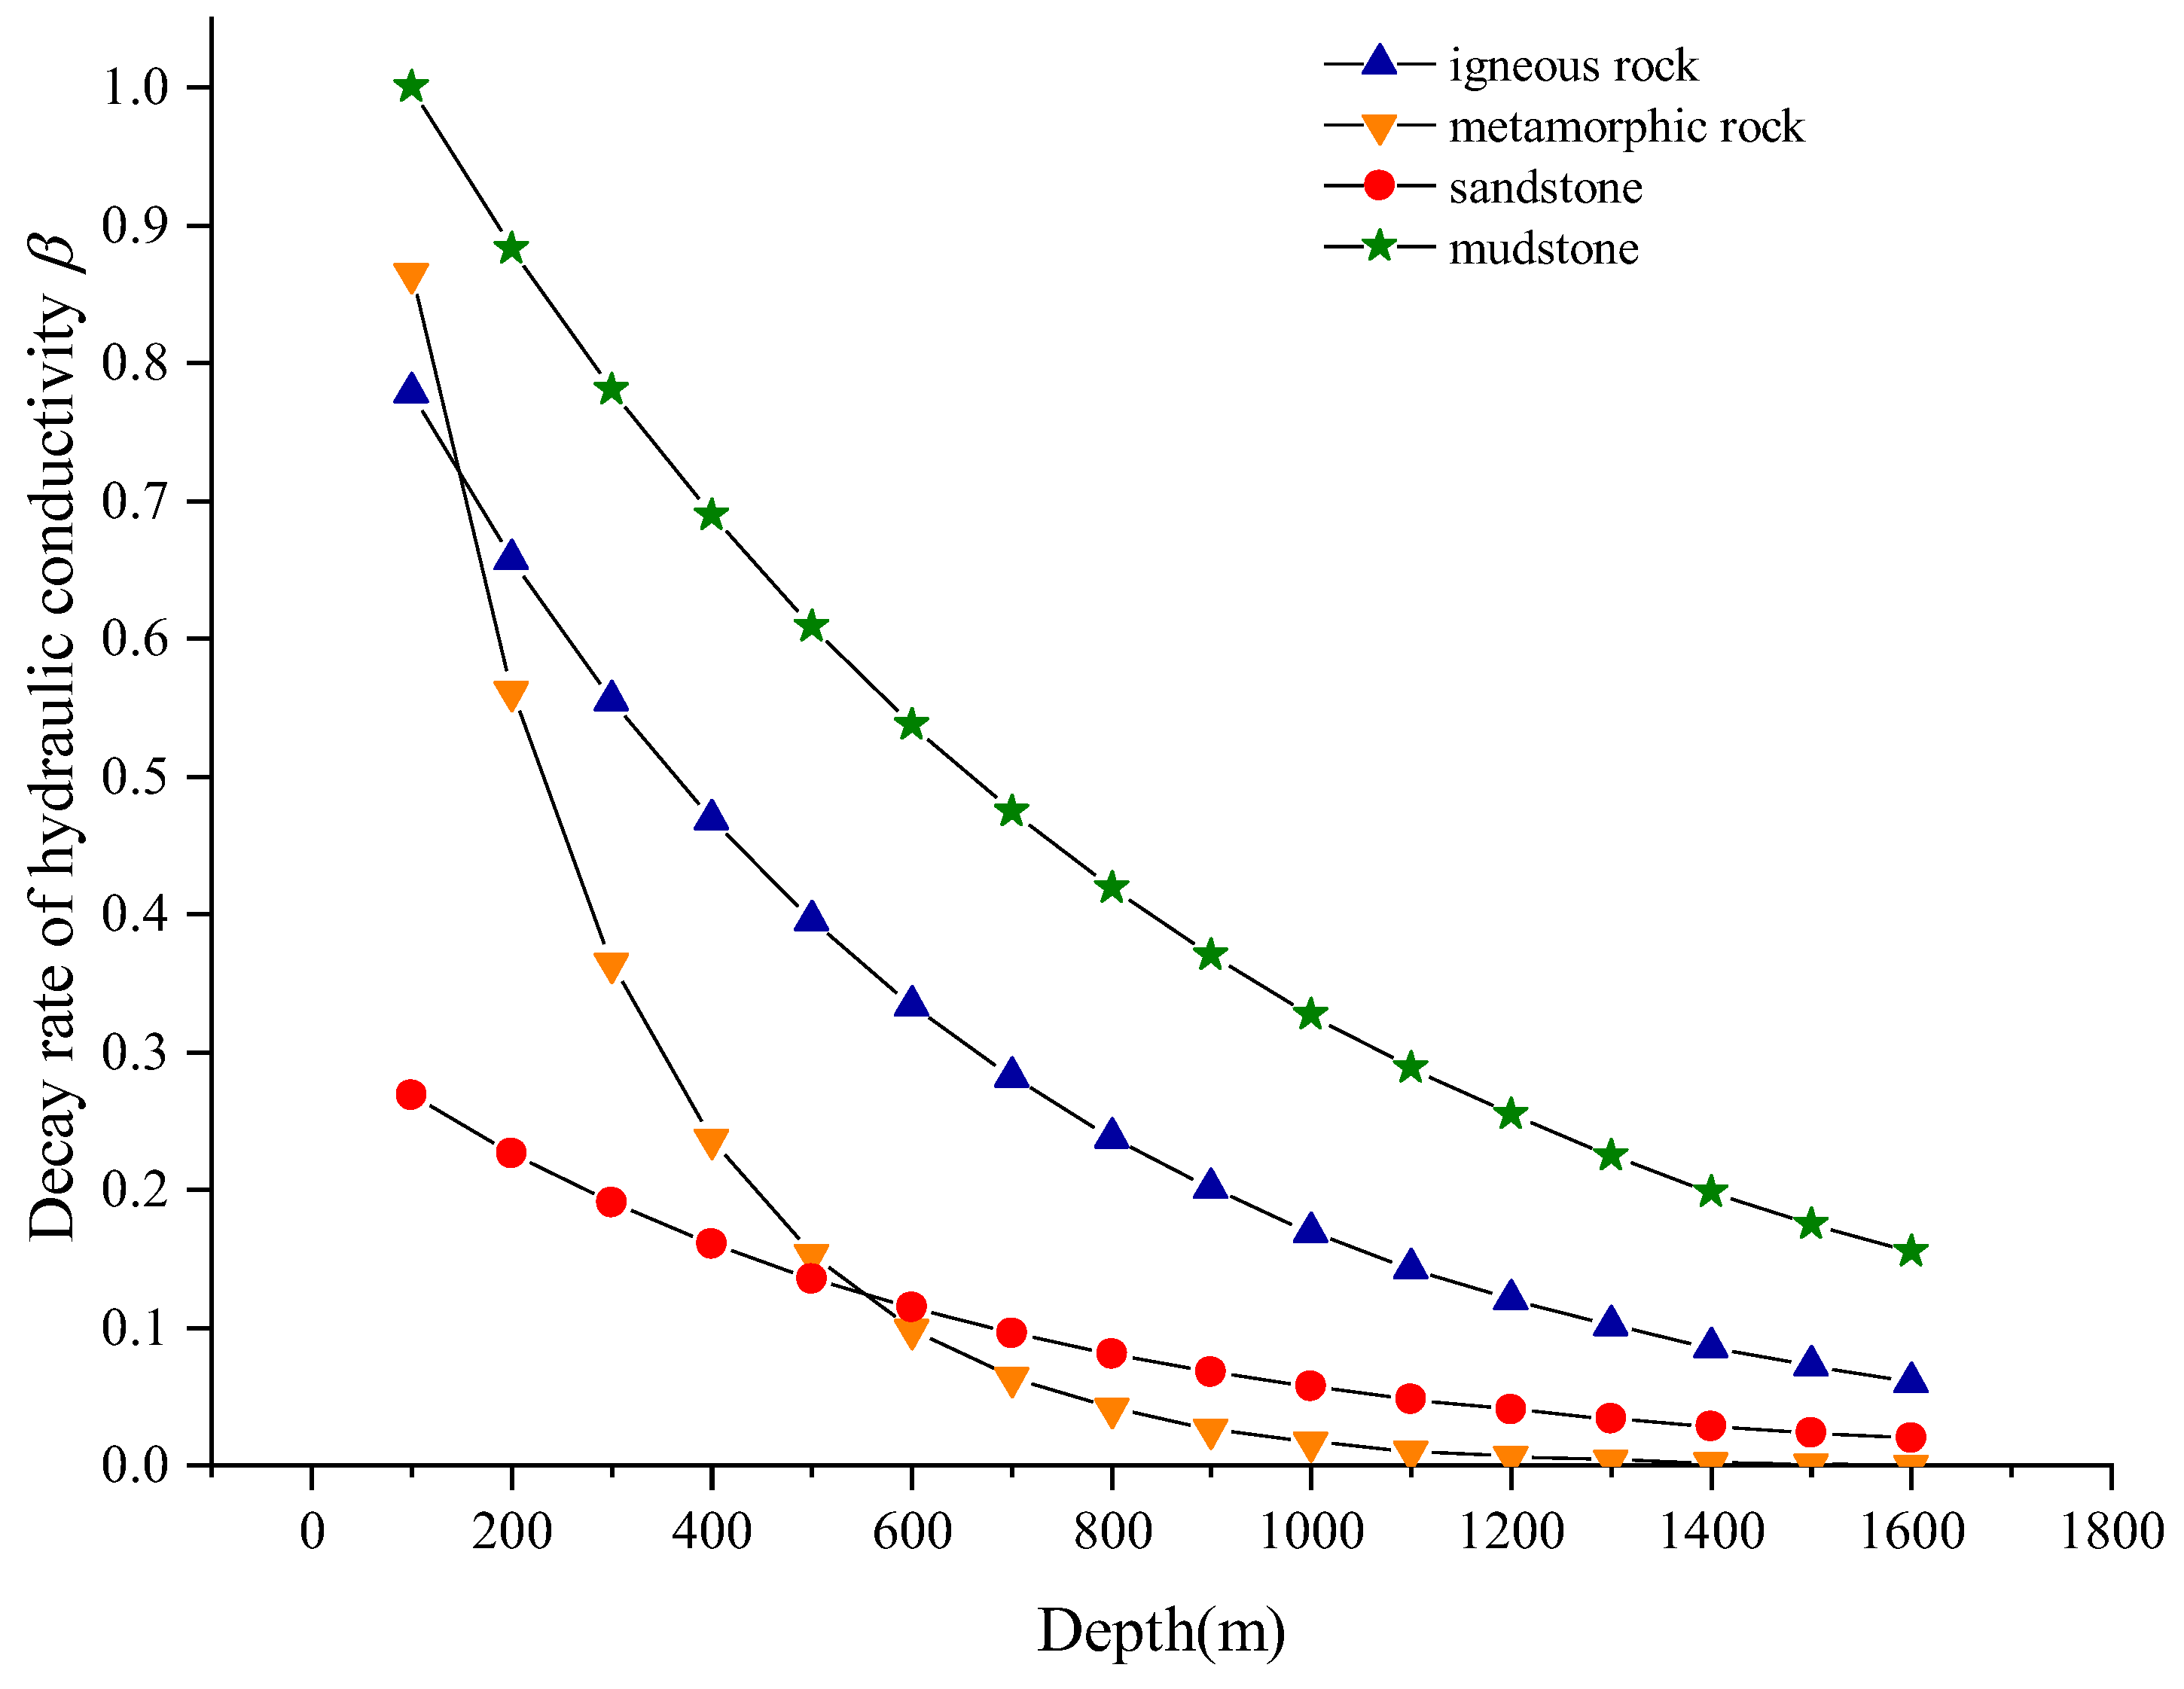
Figure 8.
Relationship of parameters in the exponential model, (a) the Log Ks–Log Kr relationship, (b) the (Log Ks–Log Kr)–α relationship.
Figure 8.
Relationship of parameters in the exponential model, (a) the Log Ks–Log Kr relationship, (b) the (Log Ks–Log Kr)–α relationship.
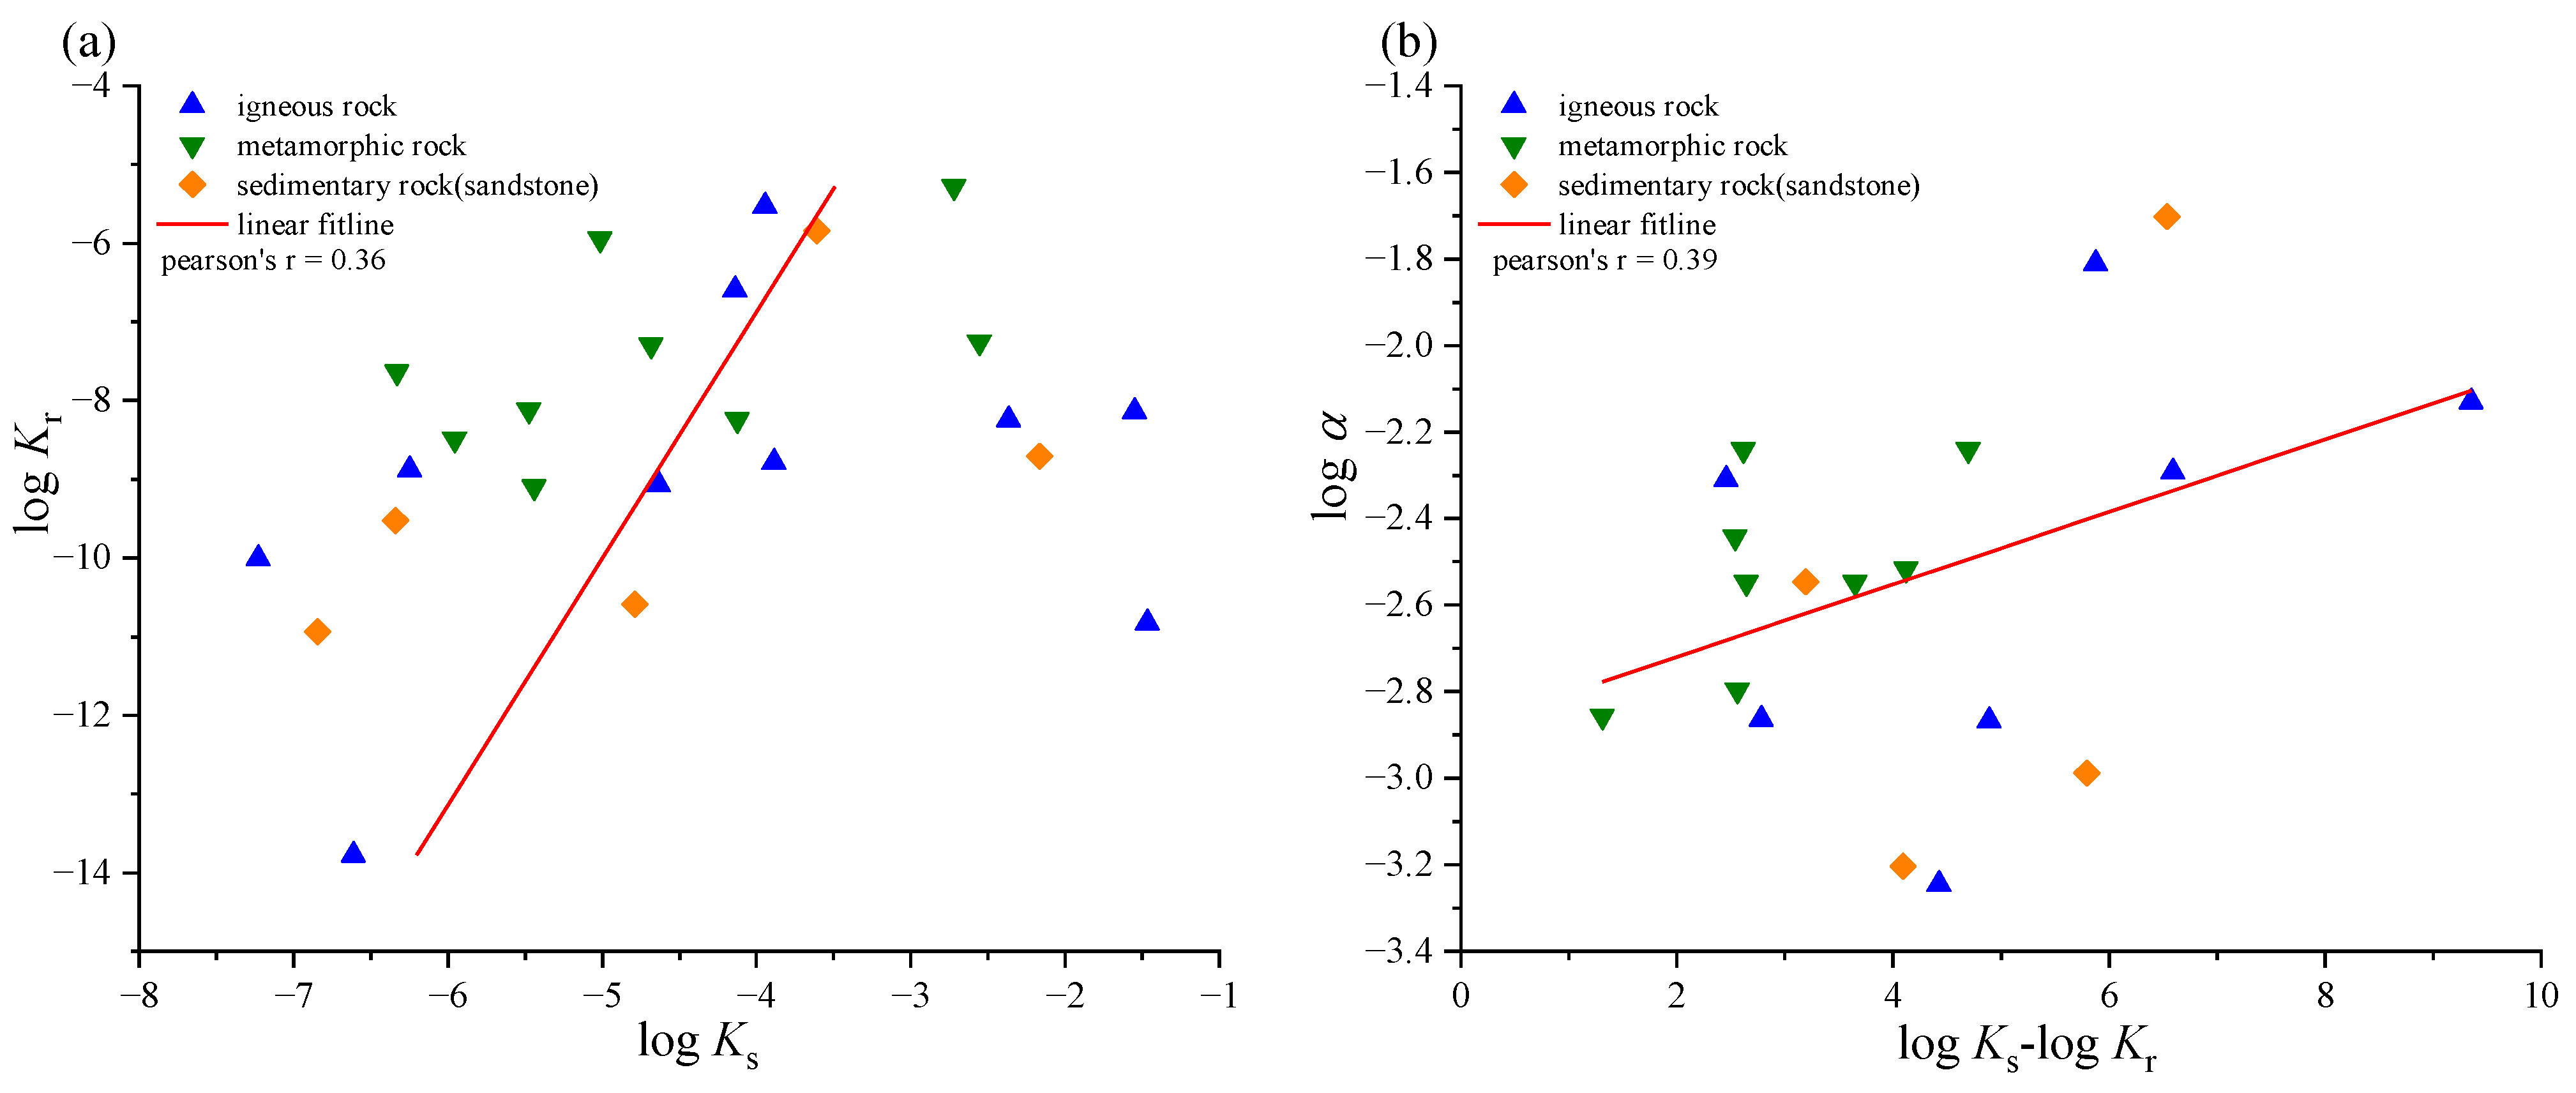
Figure 9.
Influence of geological stability on the distribution of hydraulic conductivities, (a) unstable geological region, (b) stable geological region.
Figure 9.
Influence of geological stability on the distribution of hydraulic conductivities, (a) unstable geological region, (b) stable geological region.
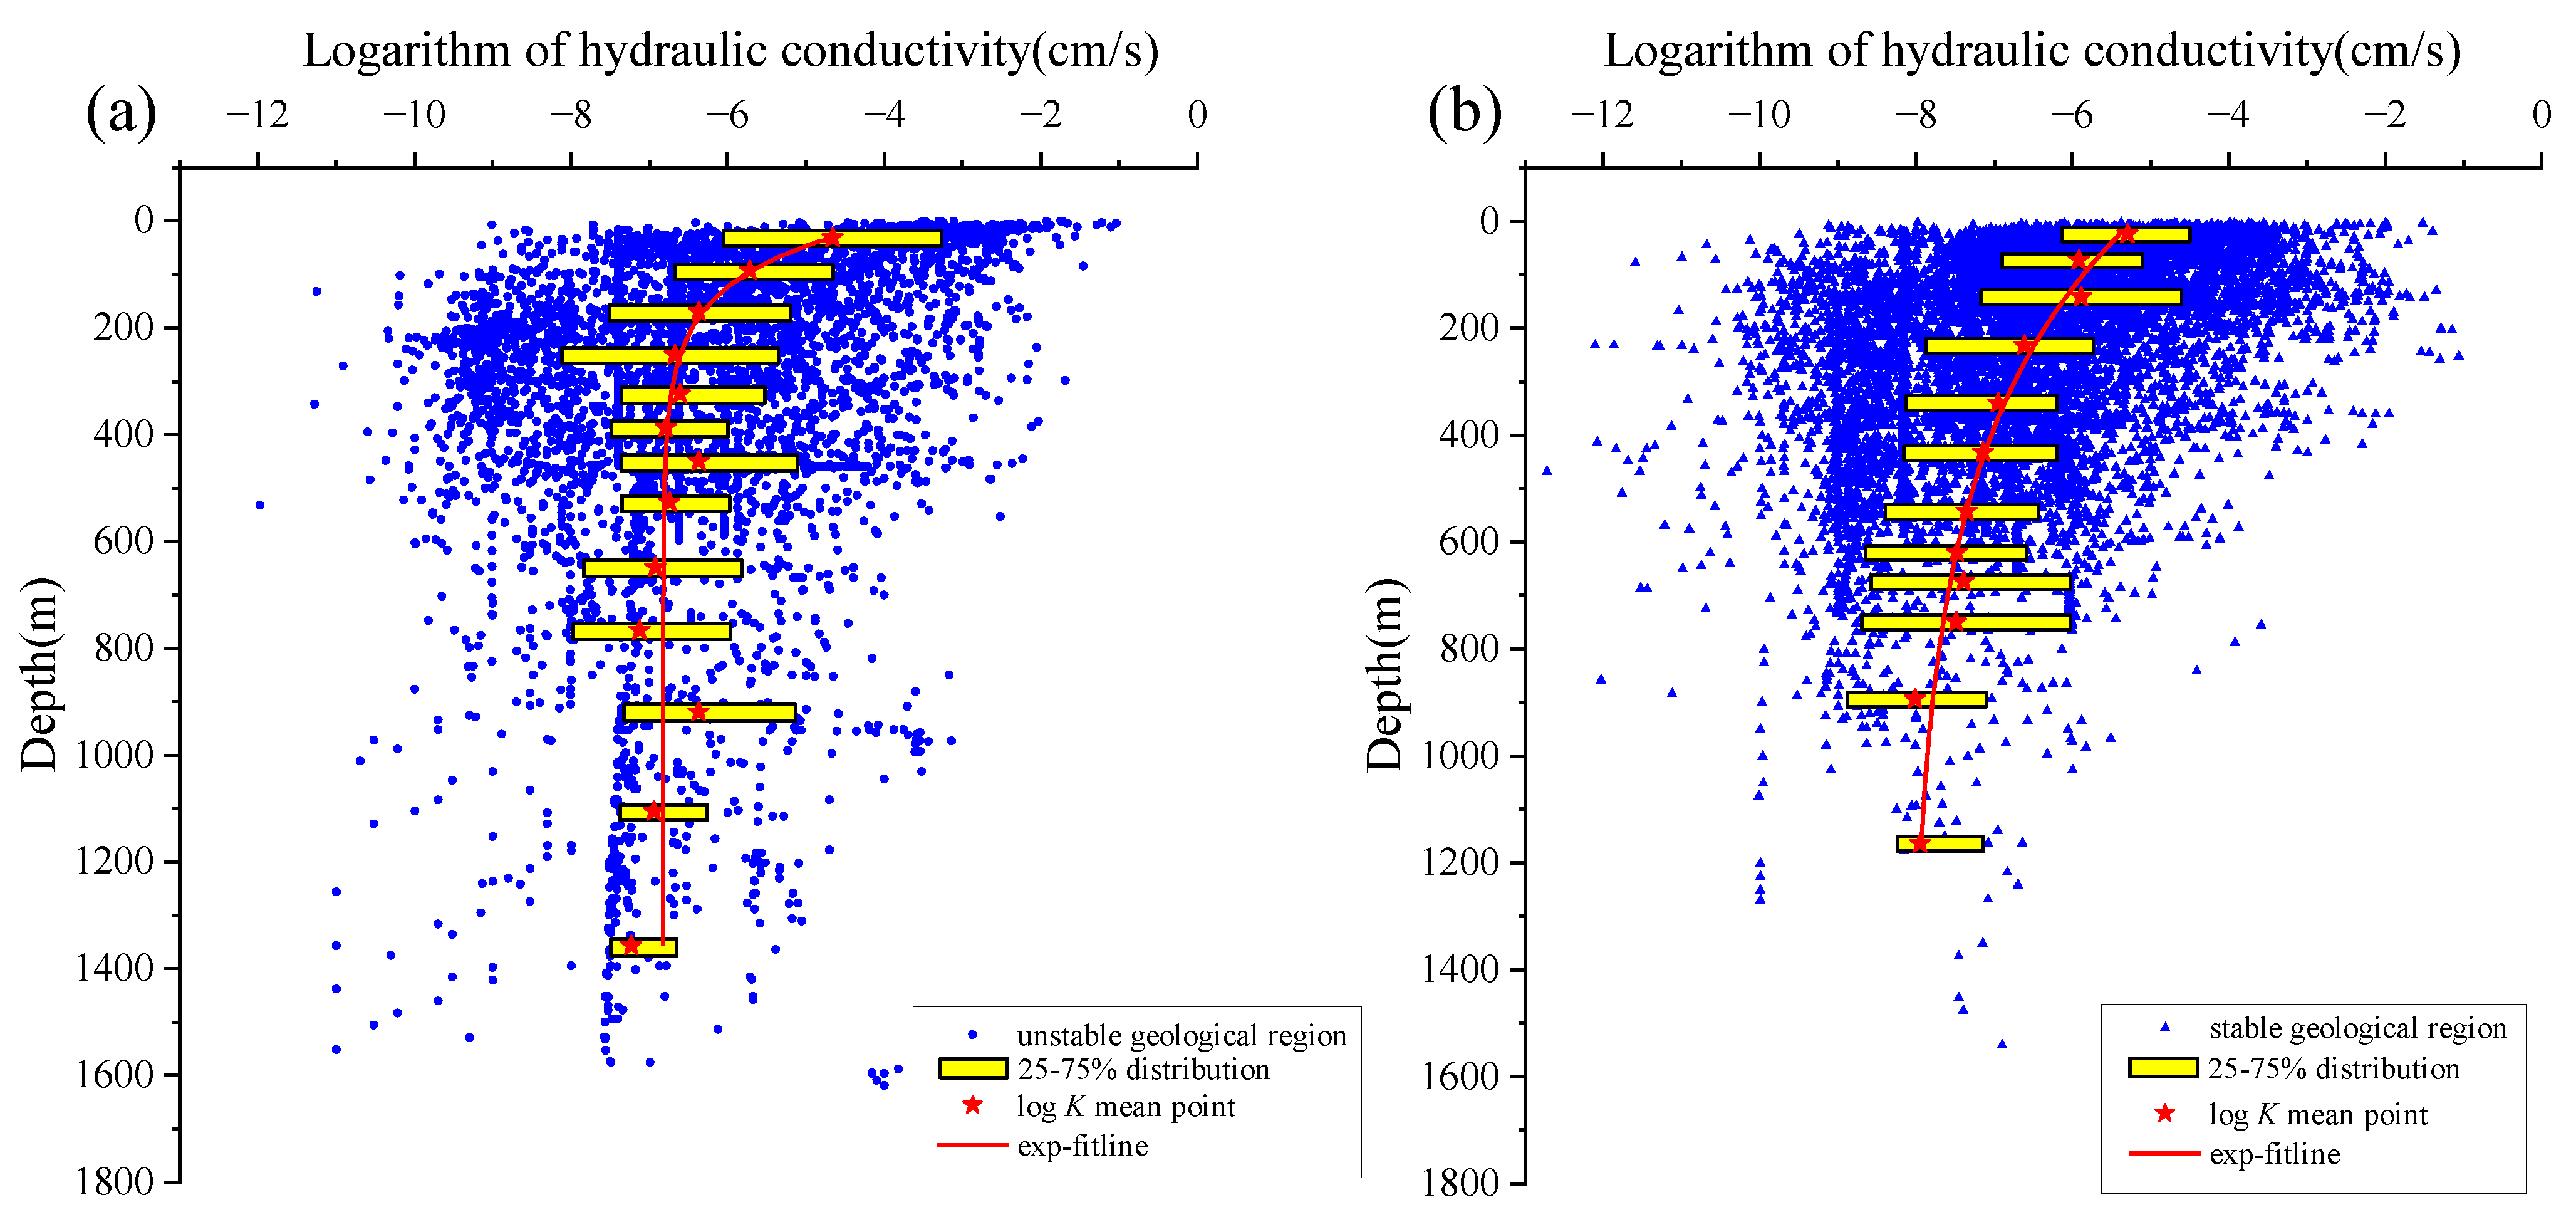
Figure 10.
Influence of faults on the distribution of hydraulic conductivities, (a) faulted rock, which means faults cross rock, (b) non-faulted rock, which means no fault crosses rock.
Figure 10.
Influence of faults on the distribution of hydraulic conductivities, (a) faulted rock, which means faults cross rock, (b) non-faulted rock, which means no fault crosses rock.

Figure 11.
Variation of hydraulic conductivity with depth in the engineer project, (a) the general hydraulic conductivity distribution, (b) the low hydraulic conductivity distribution.
Figure 11.
Variation of hydraulic conductivity with depth in the engineer project, (a) the general hydraulic conductivity distribution, (b) the low hydraulic conductivity distribution.
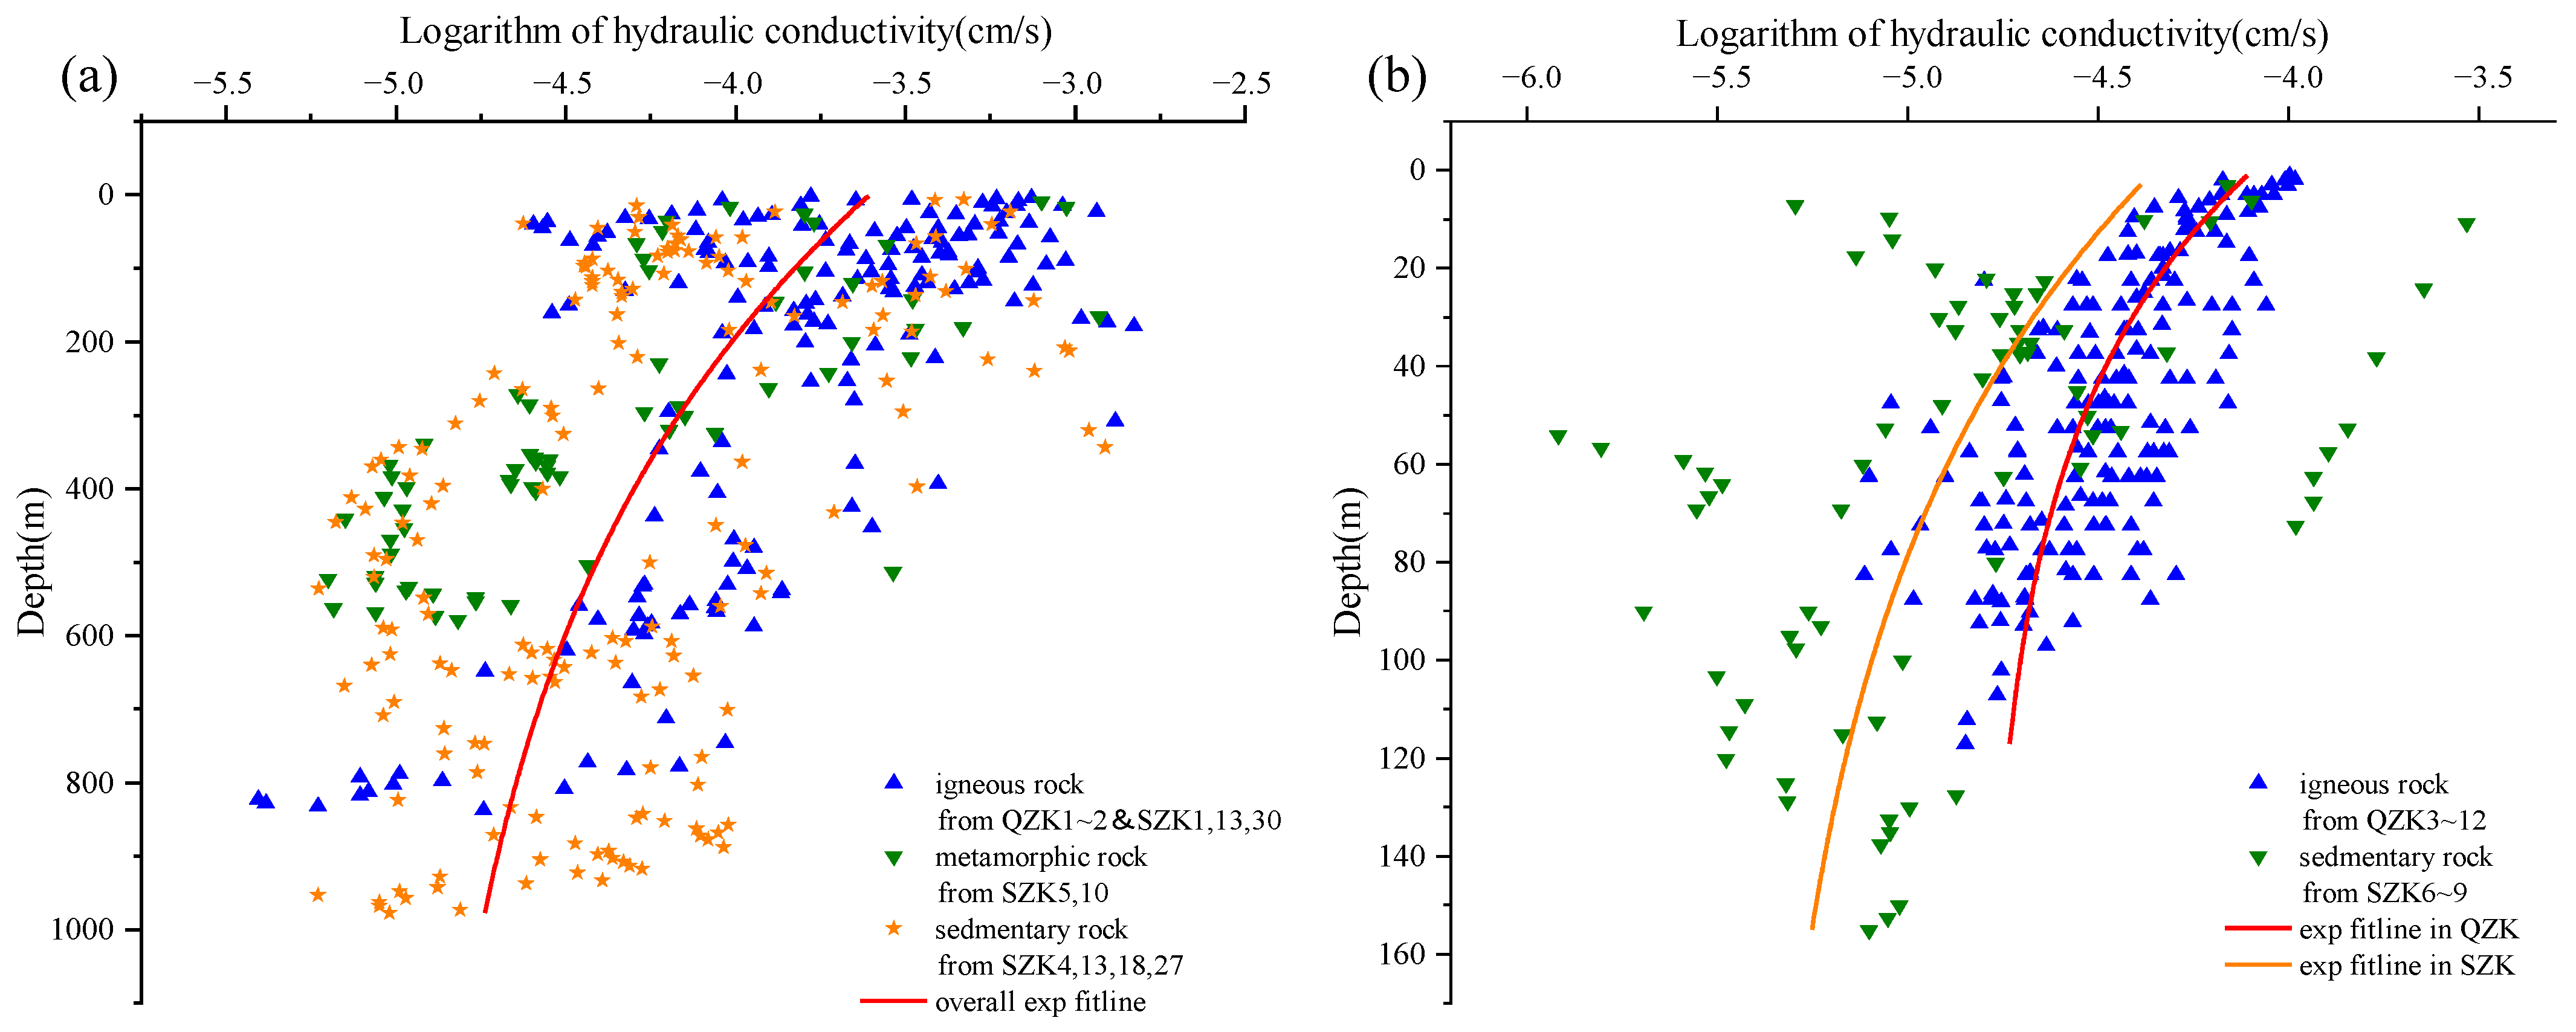
Figure 12.
Analysis of the exponential model prediction accuracy in the engineering project.
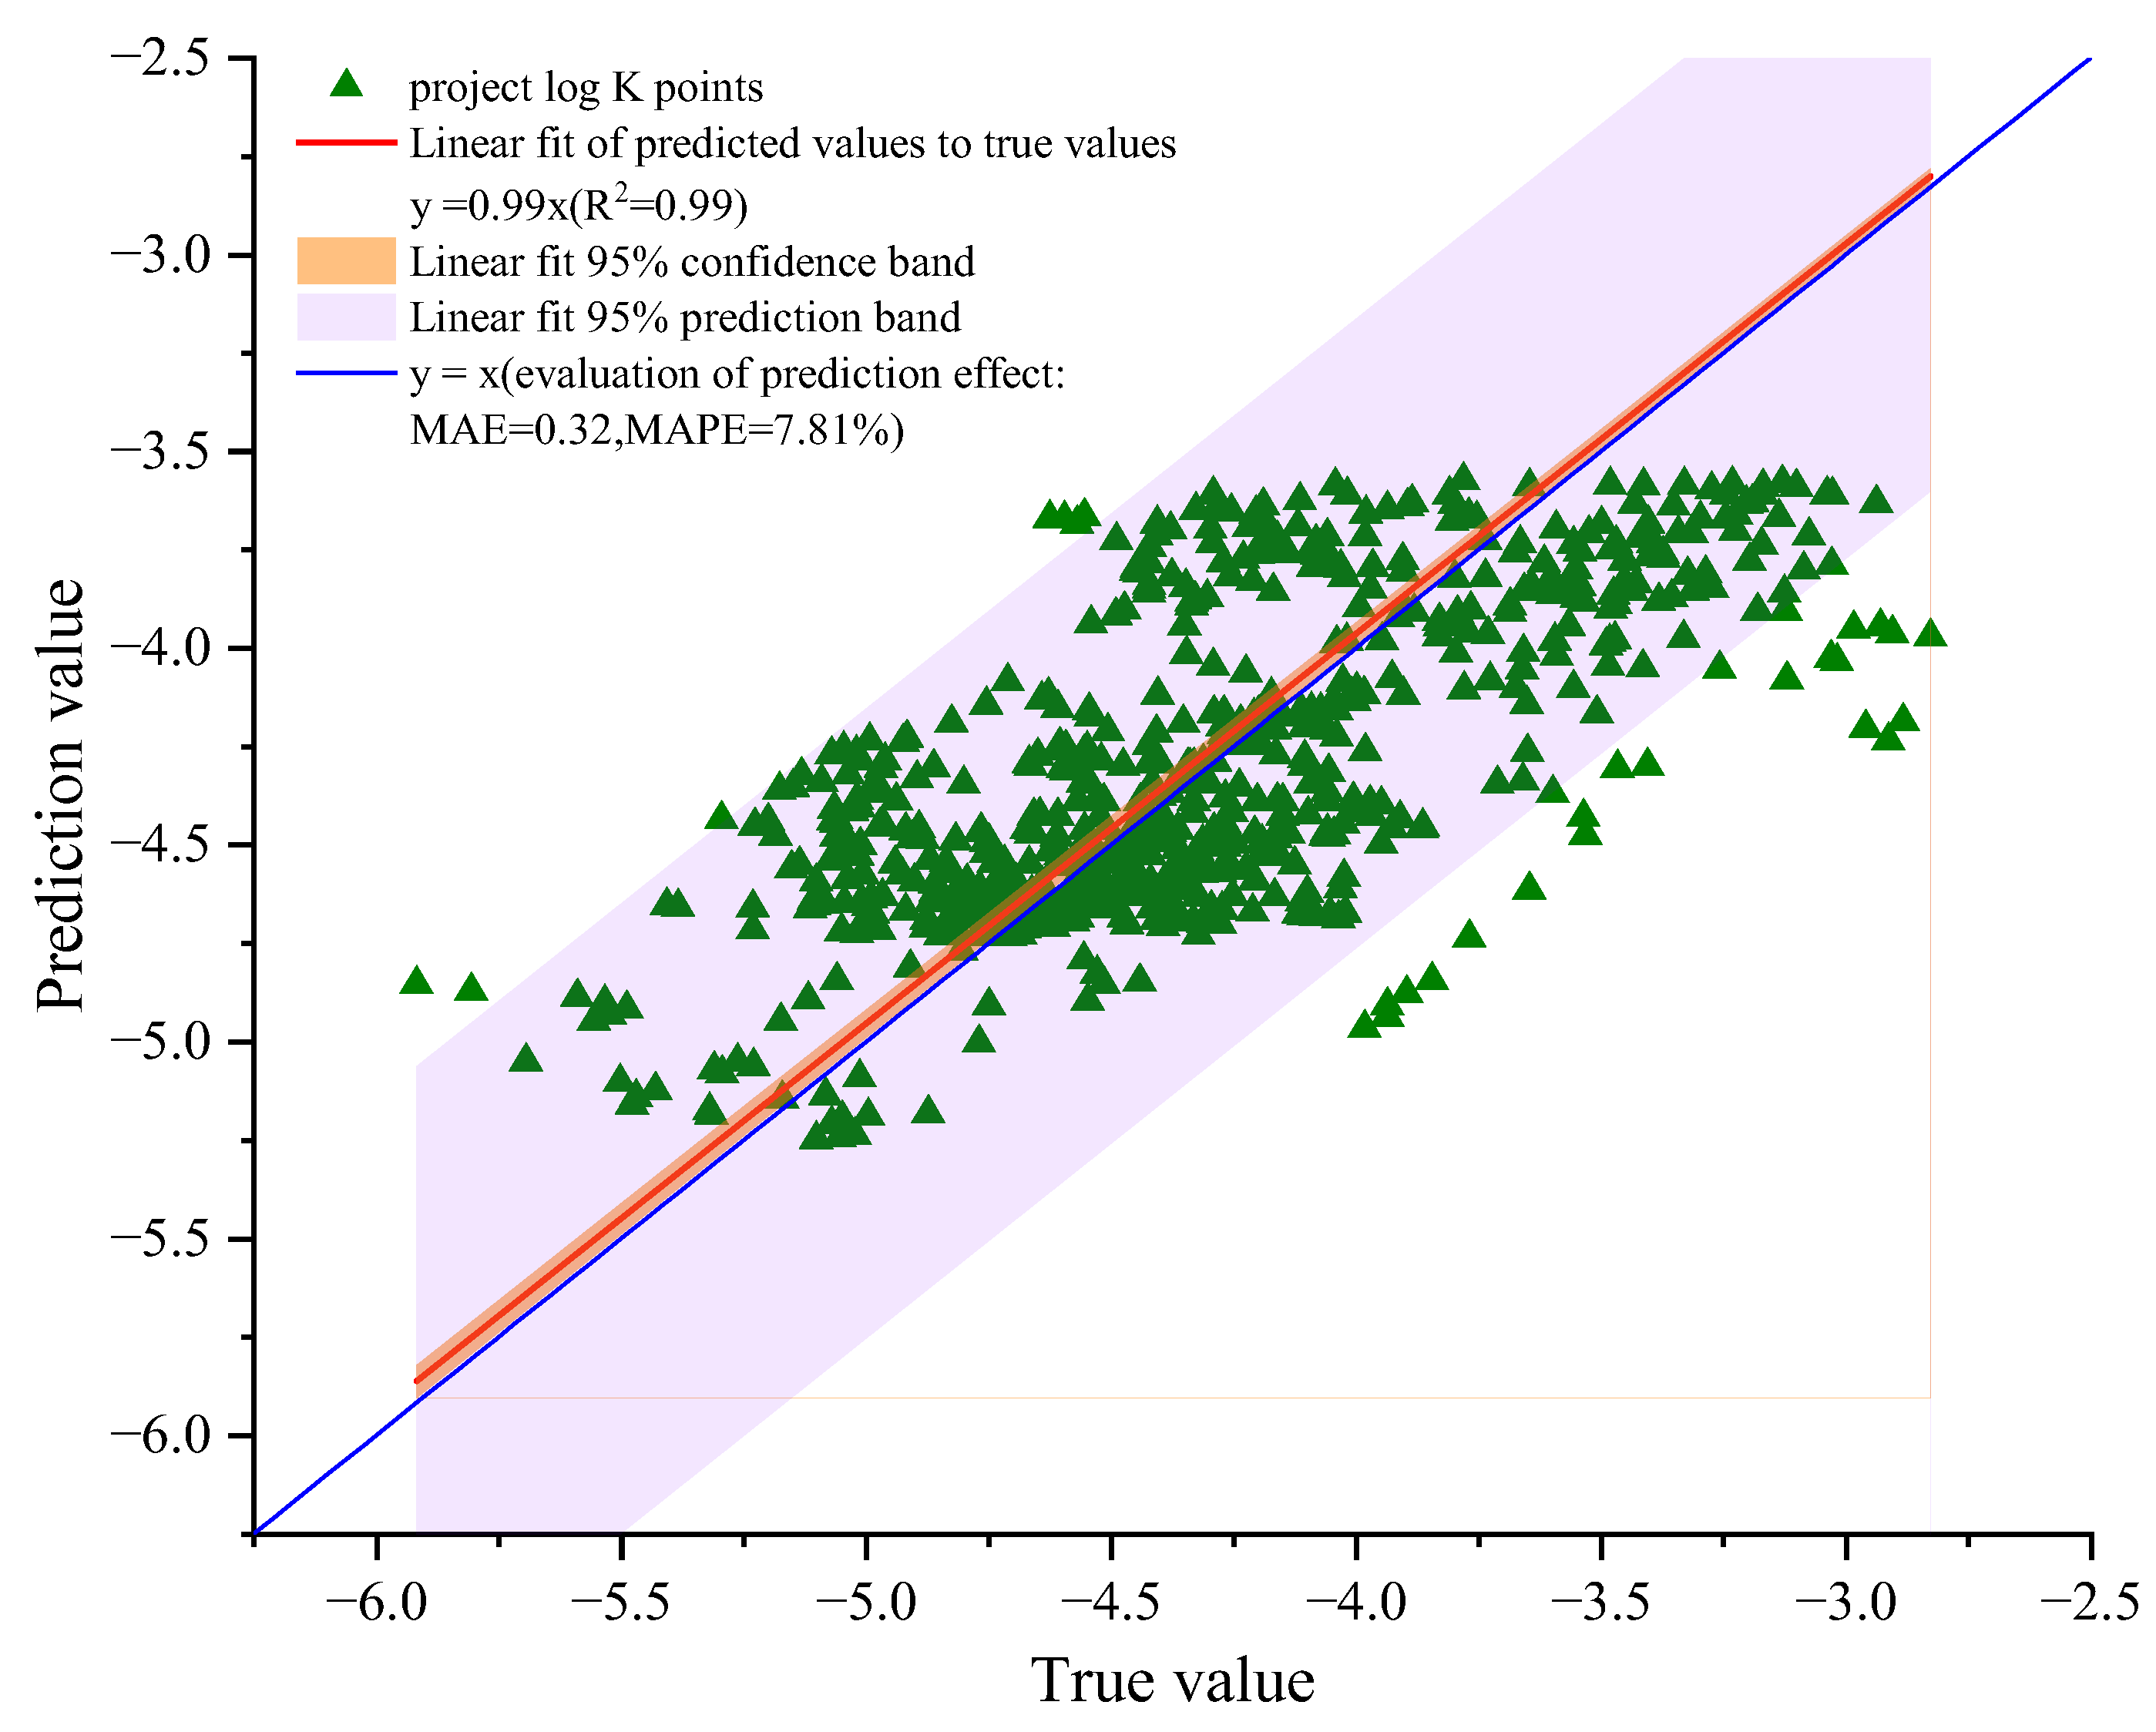
Figure 13.
Influence of faults on the distribution of hydraulic conductivities.

Table 1.
The summary of all the reviewed models.
| Model Name | Model Formula | Parameter Significance |
|---|---|---|
| The linear model [21,22,23,24] | Ks refers to the hydraulic conductivity at the depth of 0 (refer to surface hydraulic conductivity), α is the decay coefficient, and z is the depth. | |
| The logarithmic model [26,27,28,29,30] | Ks refers to the hydraulic conductivity at a depth of 1 km (refer to surface hydraulic conductivity), α is the decay coefficient, and z is the depth. | |
| The power-like model [33] | Ks refers to the hydraulic conductivity at the depth of 0 (referring to surface hydraulic conductivity), Kr is the residual hydraulic conductivity at depths exceeding the study area, α is the decay coefficient, and z is the depth. | |
| Other models [31,32] | Ks is the surface hydraulic conductivity and z is the depth. The remaining parameters do not have physical meaning that can be directly correlated to hydrological properties. |
Table 2.
Classification of datasets.
| Groups | Sub-Dataset | Description | Source | |
|---|---|---|---|---|
| Lithology | 1. Igneous | Granite, granodiorite, and diorite Location: Europe, Asia, North America Z (0, 1600 m) | Snow [38]; Stevenson [39] Li Wan [23]; Yi Feng Chen [28]; Achtziger [26] | |
| 2. Metamorphic | Quartzite, marble, gneiss, and amphibolite Location: Europe, Asia, North America Z (0, 1600 m) | P. Snowdon [37]; Burger [41]; Achtziger [26] | ||
| Sedimentary | 3. Sandstone | Location: Norway, Australia, China Z (0, 5000 m) | Pouyan [34]; Geoprovider [35]; Geoscience Australia [36] | |
| 4. Mudstone | Location: Alpine Basin, China, Japan Z (0, 7000 m) | Saffer [49]; Fisher [43]; Pouyan [34] | ||
| Geological | 1. Stable | Cratons, Shields, located in Europe, Asia, North America Z (0, 1600 m) | Gale [45]; Macdonald [51]; Achtziger [26,48] | |
| 2. Unstable | Volcanic arcs, Rift Valleys, Ophiolite mafic belts, located in Europe, Asia, North America Z (0, 1600 m) | Pfister [46]; Zhao [47]; Achtziger [26,53] | ||
| Fault Presence | 1. Faulted | A fault passes through or near a rock mass, located in Europe, Asia, North America Z (0, 1200 m) | Winkler [50]; Zhao [47]; Achtziger [26,53] | |
| 2. Non-Faulted | A complete rock mass that has not been crossed by a fault, located in Europe, Asia, North America Z (0, 1400 m) | Macdonald [51]; Vandenberg [52]; Achtziger [26] | ||
Table 3.
Estimated Log Kr values (True Log Kr is the true hydraulic conductivity at the maximum depth of the dataset, Log Kre is the hydraulic conductivity at the maximum depth obtained through the exponential model regression, Log Krp is the hydraulic conductivity at the maximum depth obtained through class power regression, Ie is the difference between True Log Kr and Log Kre, and Ip is the difference between True Log Kr and Log Krp).
| Dataset | True Log Kr | Log Kre | Log Krp | Ie | Ip |
|---|---|---|---|---|---|
| 1 | −8.51 | −8.60 | −9.05 | 0.09 | 0.54 |
| 2 | −8.73 | −8.66 | −8.85 | 0.07 | 0.12 |
Disclaimer/Publisher’s Note: The statements, opinions and data contained in all publications are solely those of the individual author(s) and contributor(s) and not of MDPI and/or the editor(s). MDPI and/or the editor(s) disclaim responsibility for any injury to people or property resulting from any ideas, methods, instructions or products referred to in the content. |
© 2024 by the authors. Licensee MDPI, Basel, Switzerland. This article is an open access article distributed under the terms and conditions of the Creative Commons Attribution (CC BY) license (https://creativecommons.org/licenses/by/4.0/).
Share and Cite
MDPI and ACS Style
Dou, Z.; Huang, X.; Wan, W.; Zeng, F.; Wang, C. Development and Application of a New Exponential Model for Hydraulic Conductivity with Depth of Rock Mass. Water 2024, 16, 778. https://doi.org/10.3390/w16050778
AMA Style
Dou Z, Huang X, Wan W, Zeng F, Wang C. Development and Application of a New Exponential Model for Hydraulic Conductivity with Depth of Rock Mass. Water. 2024; 16(5):778. https://doi.org/10.3390/w16050778
Chicago/Turabian StyleDou, Zhi, Xin Huang, Weifeng Wan, Feng Zeng, and Chaoqi Wang. 2024. "Development and Application of a New Exponential Model for Hydraulic Conductivity with Depth of Rock Mass" Water 16, no. 5: 778. https://doi.org/10.3390/w16050778
Note that from the first issue of 2016, this journal uses article numbers instead of page numbers. See further details here.