Article

Numerical Analysis of Water–Sediment Flow Fields within the Intake Structure of Pumping Station under Different Hydraulic Conditions

1
School of Water Conservancy, North China University of Water Resources and Electric Power, Zhengzhou 450046, China
2
Research Center of Hydraulic Structure Safety Engineering Technology of Henan Province, Zhengzhou 450018, China
3
Key Laboratory for Technology in Rural Water Management of Zhejiang Province, Hangzhou 310018, China
4
Liaoning Water Conservancy and Hydropower Survey and Design Research Institute Co., Ltd., Shenyang 110006, China
5
School of Civil Engineering and Architecture, Henan University, Kaifeng 475001, China
*
Author to whom correspondence should be addressed.
Water 2024, 16(5), 779; https://doi.org/10.3390/w16050779
Submission received: 24 January 2024 / Revised: 1 March 2024 / Accepted: 4 March 2024 / Published: 5 March 2024

Abstract

:
The vortices, backflow, and siltation caused by sediment-laden flow are detrimental to the safe and efficient operation of pumping stations. To explore the effects of water–sediment two-phase flow on the velocity field, vorticity field, and sediment distribution within intake structures, field tests and numerical simulations were conducted in this study with consideration for the sediment concentration, flow rate, and start-up combination. We applied a non-contact laser scanner and ultrasonic Doppler velocimetry to obtain the field data and reverse modeling of the three-dimensional model of the intake structure under siltation. A multiphase flow model based on the Euler–Euler approach combined with the k-ε turbulence model was adopted for numerical simulation under 10 working conditions, and the reliability was verified with field data. The results indicate that sediment promotes the evolution of coaxial vortices into larger-scale spiral vortices along the water depth, and the process of sediment deposition is controlled by the range, intensity, and flow velocity of the backflow zone. Furthermore, the maximum volume fraction of the near-bottom sediment increased by 202.01% compared to the initial state. The increase in flow rate exacerbates the turbulence of the flow field. Although the increase in sediment concentration benefits the flow diffusion, it further promotes sediment deposition. This study provides a new idea for modeling complex surfaces and considers different operating conditions. It can serve as a scientific reference for the structural optimization and anti-siltation design of similar water-conservancy projects.

1. Introduction

Pump stations have played a very significant role in flood control and drainage, agricultural irrigation, and interbasin water transfer. Due to special geological characteristics, the annual average sediment content of the Yellow River is as high as 30–150 kg/m3, the highest worldwide [1,2]. Therefore, in the arid area of northwest China, the safe and efficient operation of pumping stations in the Yellow River Basin has been greatly threatened. The sediment-laden water source has caused a series of problems for the intake structure, such as vortices, backflow, and reductions in the cross-section and water storage capacity. These problems deteriorate the uniformity of water flow into the pumps and cause further vibration, abrasion, and reduced service life of pumps, seriously affecting the efficiency, stability, and economy of pumping stations [3]. Thus, it is important to conduct comprehensive research on the multiple factors of sediment-laden flow to improve the hydraulic performance of the liquid–solid two-phase turbulence flow within intake structures.
The methods for studying fluid flow problems mainly include traditional theoretical analysis, experimental measurements, and computational fluid dynamic (CFD) approaches [4,5,6,7]. There have been many achievements in the study of single-phase turbulence. Matahel Ansar and Tatsuaki Nakato [8] conducted detailed measurements of three-dimensional (3D) turbulence flow in a rectangular single-pump forebay of a right-angle water-intake model applying an acoustic Doppler velocimeter (ADV) and analyzed the influence of cross flow on the swirl characteristics in the pump sump. J. Aubin et al. [9] numerically simulated the single-phase turbulent flow in a turbine-stirred tank based on CFD. They analyzed the effects of modeling methods, turbulence models, and discretization methods on kinetic energy, average velocity, and global variables. H. Chen and J. Guo [10] established and solved a numerical model of 3D turbulence flow in a multi-intake sump and proposed reasonable boundary conditions for different flow rates. Meanwhile, Zi Dan et al. [11,12,13] focused on experimental and simulation research of the intake structure of pumping stations for many years, analyzing the grid scale y+ of the boundary layer, the grid division scheme, and the influence of structural parameters on the flow field calculation in detail, and proposed a variety of optimization methods. Based on CFD numerical simulation, Xueping Gao et al. [14] combined the response surface method and the nondominated sorting genetic algorithm to conduct hydraulic analysis and optimize the intake diffusion section of pumped-storage hydroelectricity and determined the optimal inlet and outlet parameters under two-way flow.
Compared to single-phase flow, multiphase flow simulation is not very mature due to its complexity and the diversity of calculation methods. S. Balachandar and J.K. Eaton [15] reviewed and analyzed the experimental and computational techniques of turbulent dispersed multiphase flow in detail and focused on the preferential concentrations of bubbles, particles, and droplets, as well as the effects of turbulence on different phases. With the rapid development of measurement technology and CFD, the flow details and dynamic characteristics of complex 3D multiphase flow were further explored [16]. In order to analyze the erosion damage of pumping stations under the synergistic effect of free surface vortex (FSV) and sediment particles, Xijie Song et al. [17] adopted the Euler–Lagrange method and Tabakoff model to simulate and discuss the microscopic interaction between the gas phase and erosion. To explore the development and evolution of the surface suction vortices in an open intake sump, X. Hou et al. [18] conducted numerical simulations on the constructed intake sump model, analyzed the flow on the free surface, and determined the effects of the flow rate, Froude constant, and submergence depth on suction using the volume of fluid method. Jiaming Li et al. [19] and Rongrong Wang et al. [20] investigated the influence of different unit numbers and start-up combinations on the distribution of sediment concentration in the intake structure. Dan Zi et al. [13] analyzed the correlation between sediment concentration and flow velocity through numerical simulation and established a quadratic polynomial model of sediment deposition efficiency and flow velocity. Cundong Xu et al. [21] reconstructed the 3D geometric model of the intake structure using reverse engineering techniques, which can more realistically restore the structural dimensions and siltation morphology of the research object and reduce the distortions of numerical simulations using design dimensions. Haidong Wang et al. [2] explored the mechanism of vortices and sediment deposition in the forebay of the pumping station through numerical simulation. They applied ADCP to measure the in situ flow field, which verified the reliability of the numerical simulation. With the improvement in Particle Image Velocimetry (PIV) and Volumetric 3-component Velocimetry (V3V), scholars have also been encouraged to further explore the unsteady flow inside pumps and multiphase turbulent flow fields within intake structures [22,23,24,25,26]. The optimization of the water–sediment flow field inside the inlet structure by rectifying facilities such as diversion piers, diversion walls, bottom sills, columns, and water pressure plates has also been widely studied [27,28,29].
Although there have been many research achievements so far, there are still some shortcomings in studying the water–sediment flow field within the intake structure of pump stations. (A) Limitations of model tests. Due to the large size of the structure, the replacement costs of models with different experimental schemes are huge and very inconvenient; in addition, the model sand makes it difficult to reproduce the impact of natural sand on the flow field. (B) The reliability of numerical models. Different turbulence models and numerical calculation methods have a significant impact on the simulation results, especially for complex 3D water–sediment two-phase flow; verifying the applicability of the selected numerical model is an important prerequisite to ensure the reliability of the results. (C) Rationality of working conditions. Most studies on flow fields set clear water conditions or a fixed sediment concentration; however, for pumping stations that have been operating for many years under the action of sediment-laden flow, different sediment concentrations and flow rates are closely related to the hydraulic characteristics of the flow field, and a reasonable working condition plan needs to be designed for comprehensive research.
To improve the above shortcomings, the following work was carried out in this study. First, we applied the non-contact laser scanner to collect 3D point cloud data of a typical pumping station under siltation conditions and obtained the computational domain model through the reverse-modeling method. Then, different turbulence models were adopted for numerical simulation, and the simulation results were compared with the field measurement values to select and validate the suitable numerical model under the same working conditions. On this basis, considering the sediment concentration and flow rate, ten working conditions were designed to comprehensively analyze the hydraulic characteristics and sediment distribution of the water–sediment flow field within the intake structure.

2. Field Test

The on-site measurement of the flow field and the reverse modeling of the intake structure under siltation can provide an important foundation for constructing subsequent numerical models and quantitative verification of simulation reliability. To ensure rigor, it is necessary to make the actual flow field measurement and numerical simulation highly consistent regarding their geometric structure, deposition morphology, test conditions, and climatic conditions. Although the size of the intake structure is relatively regular, the morphological contour of the sediment inside is extremely complex, and it is difficult to accurately reconstruct traditional geometric model-construction methods. Therefore, this study proposes a reverse-modeling method for the actual intake structure with sediment based on mature and advanced reverse-engineering technology.

2.1. Study Area

The Jingtaichuan Electric Power Irrigation Project, located along the Yellow River Basin in the arid area of northwest China, is one of the largest high-lift and large-flow cascade irrigation projects in China, including Phase I and Phase II Irrigation Areas, with a total of 43 cascade pump stations built, an installed capacity of 270 MW, a maximum lift of 713 m, and a designed annual pumping capacity of 475 million cubic meters. The irrigation period is from March to November. Due to changes in the sediment content of the Yellow River, the sediment diversion in the irrigation area is mainly concentrated in June, July, and August, accounting for about 85.4% of the total annual sediment diversion. The maximum sediment concentration during the flood season is 382 kg/m3. The pumping stations in the irrigation area are plagued by sediment-laden water flow throughout the year, and problems such as adverse flow patterns, sediment deposition, and the cavitation and wear of pumps seriously restrict the efficiency and benefits of the project. The on-site investigation of the actual intake structure is shown in Figure 1.
A typical intake structure of a pumping station in the irrigation area is selected as the research object, and the calculation domain includes the diversion channel section, gradual section, gate chamber section, forebay, suction sump, and suction pipes. The forebay is a trapezoidal forward forebay, the suction sump is a sinking open suction sump, and the suction pipes are arranged horizontally (Figure 2). The design water level of the pump station is 1604.45 m, and the design flow rate is 6.00 m3/s. A total of eight units are installed, with a design flow rate of 1.6 m3/s for unit #5 and 0.88 m3/s for the remaining units. The corresponding suction pipe diameters are 1.0 m and 0.8 m, respectively. Units #1 and #8 at both ends are standby units.

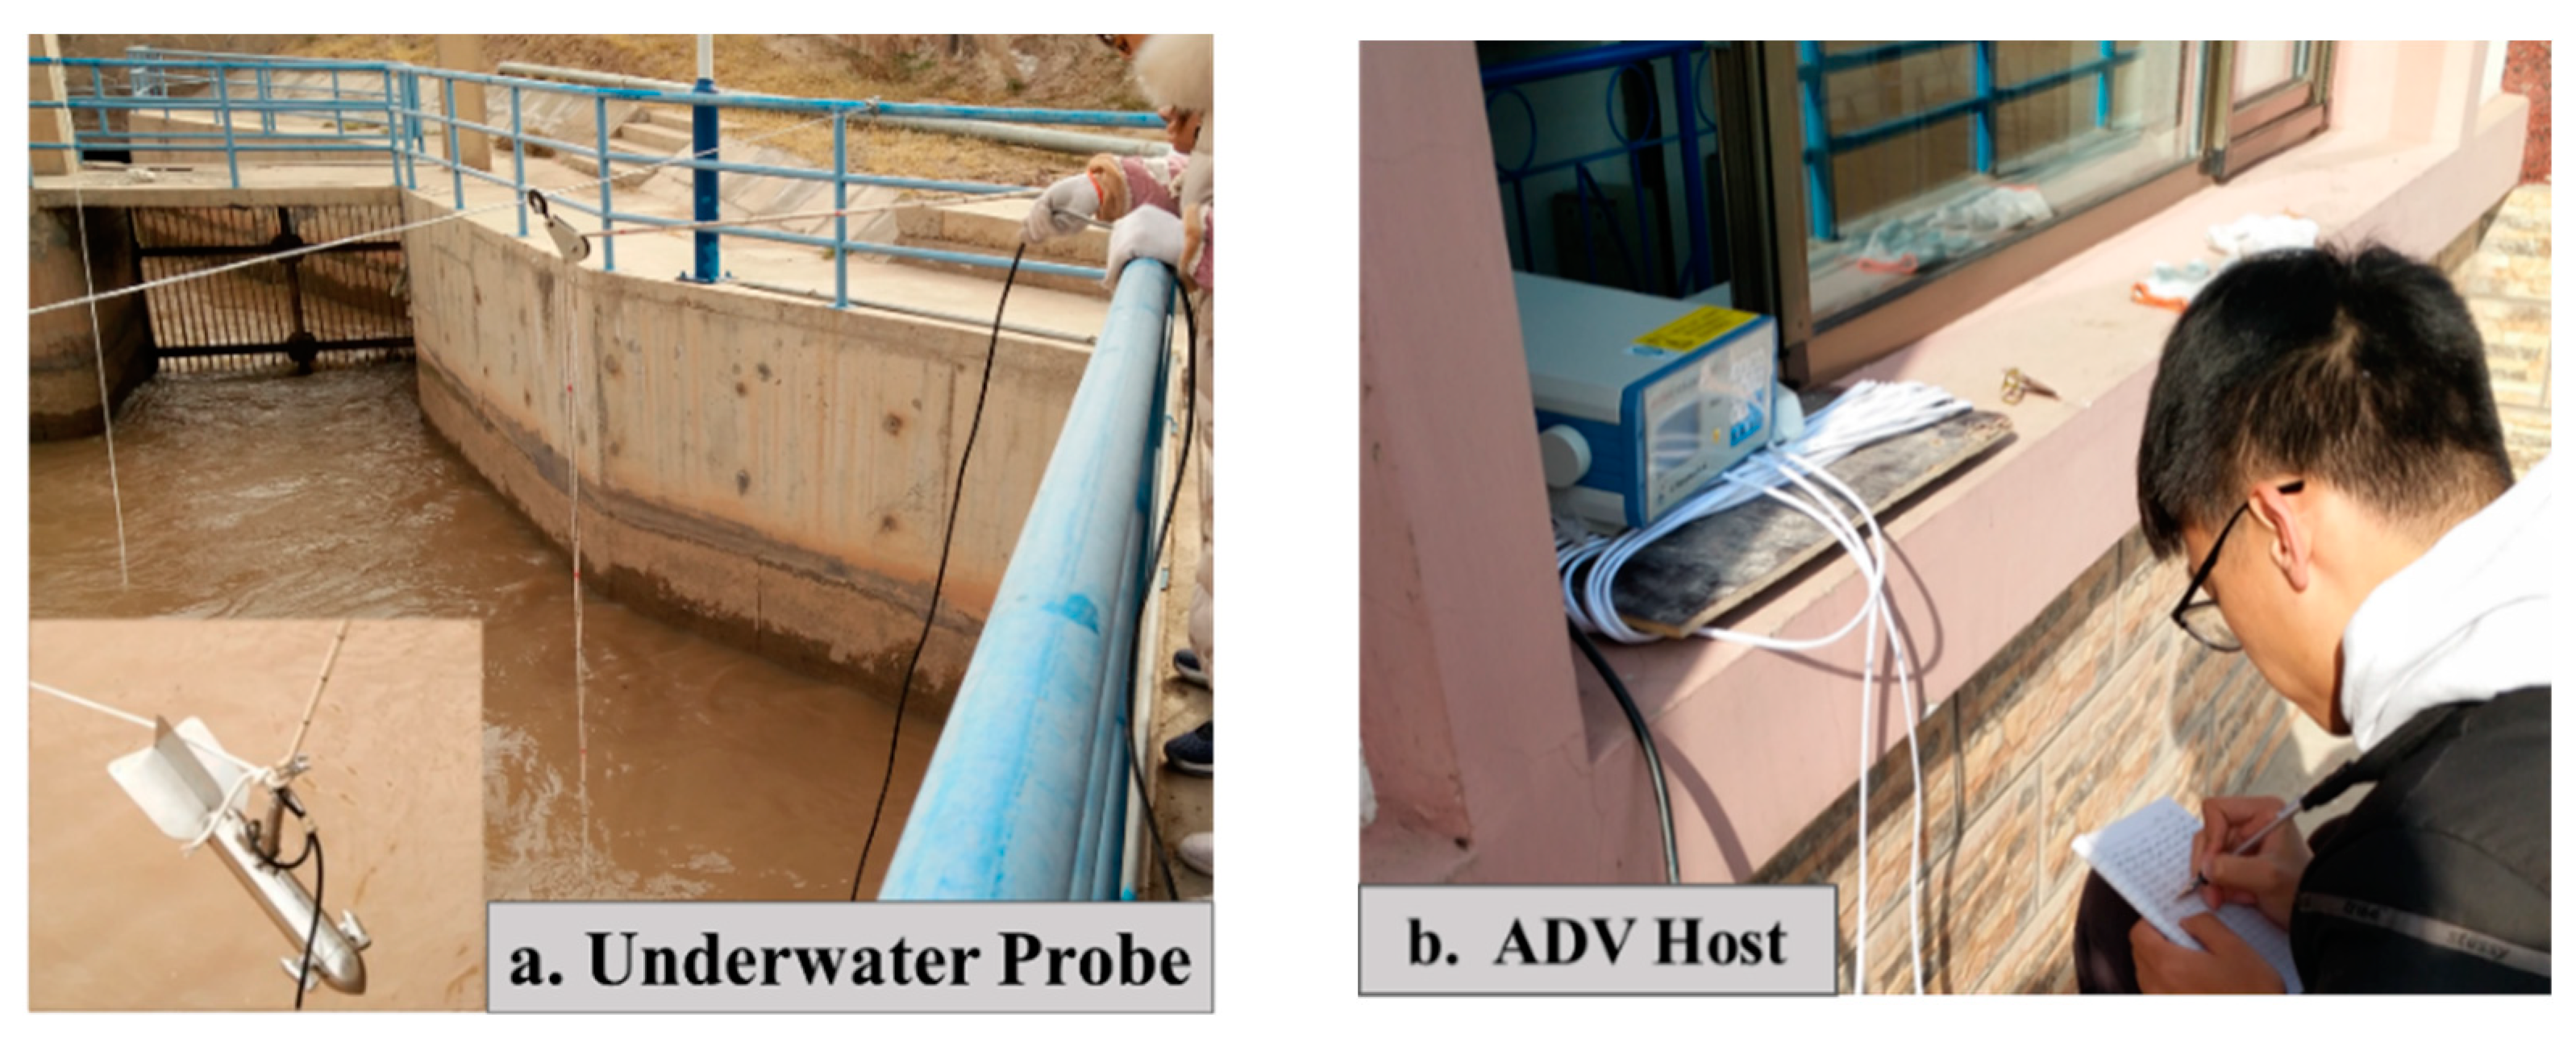
2.2. Measurement of the In Situ Flow Field

In order to select the turbulence model suitable for the numerical simulation of the intake structure and verify its reliability, we obtained flow field data through on-site measurement during the winter irrigation period before the pumping station was shut down. The HXH03-1S ultrasonic Doppler velocimetry was chosen as the measuring equipment, with an accuracy of ±1.0% ± 1 cm/s, and the measurement calculation of a single point can be completed in 30 s. The detector of this instrument is located in front of its body, which makes it difficult to disturb or damage the flow field. It has the advantages of a wide measurement range, high accuracy, sensitive sensing, strong anti-interference (no fear of sediment or floating debris), intuitive reading, and easy operation [30,31].
The design condition was set as the test condition; that is, units #2–#7 operated at the design condition, the #1 and #8 standby units did not work, and the flow rate of the pumping station was 6.00 m3/s. There were 25 characteristic sections and 188 characteristic points selected for the field test; the feature points were located at the intersection of X, Y, and Z sections and the midpoint of adjacent Y sections, where Z1, Z2, and Z3 sections were 0.8 m, 1.5 m, and 3.0 m away from the liquid surface, respectively. The relative orientations of X, Y, and Z are shown in Figure 2.
The detailed experimental method is as follows. The steel cable was firmly banded along the X characteristic sections above the water surface, and the underwater probe of the ADV instrument was tied with two sufficiently long graduated ropes. One of the ropes was hung on the steel cable, and the underwater detector was slowly sunk while controlling the depth. Another rope was adjusted on the opposite bank to make the suspension rope perpendicular to the water surface, ensuring the accuracy of the measurement point position. Moving along the steel cable to different measuring points, the flow field parameters were measured and recorded at different depths (Figure 3). The absolute value of the flow velocity measured in the experiment was used for subsequent analysis.
In addition, we collected water samples from the diversion channel at the front end of the intake structure for particle size analysis. The screening results are shown in Table 1. According to the analysis results, 93.91% of the sediment particle size is less than 75 μm, and the median particle size d50 = 25 μm, extremely fine-grained soil. The volume fraction of sediment is less than 5%, indicating a low concentration of solid–liquid two-phase flow.

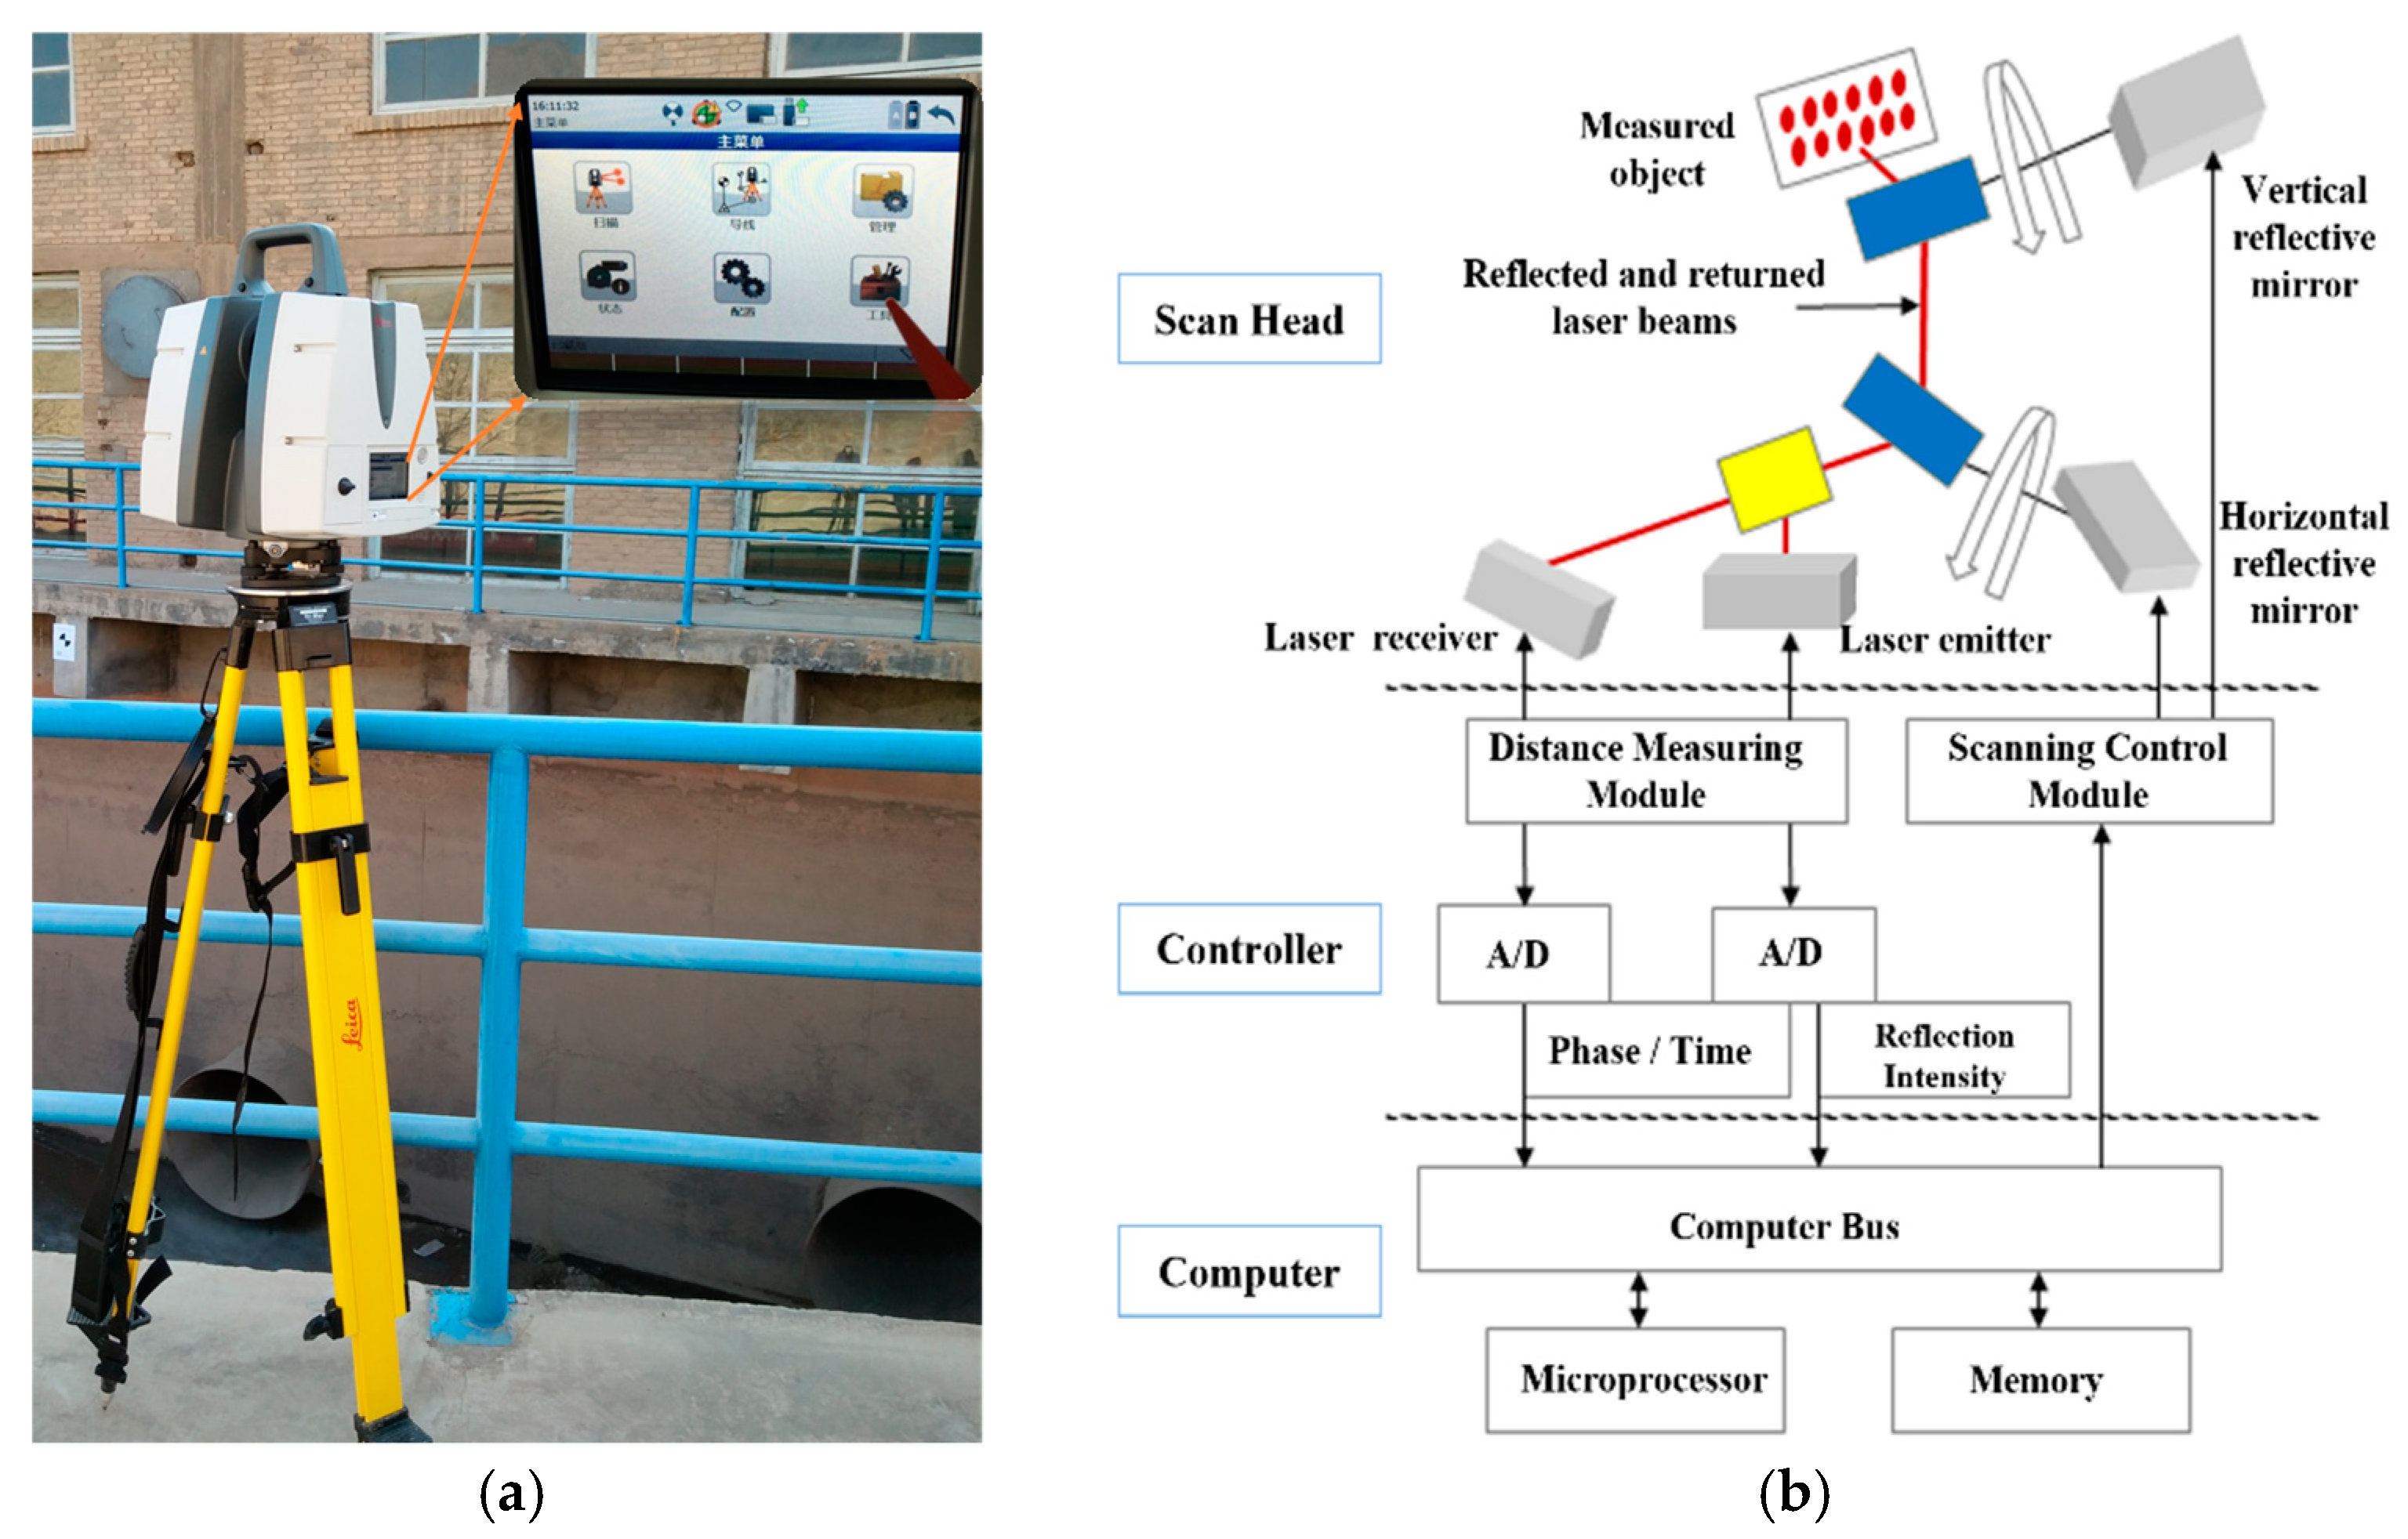
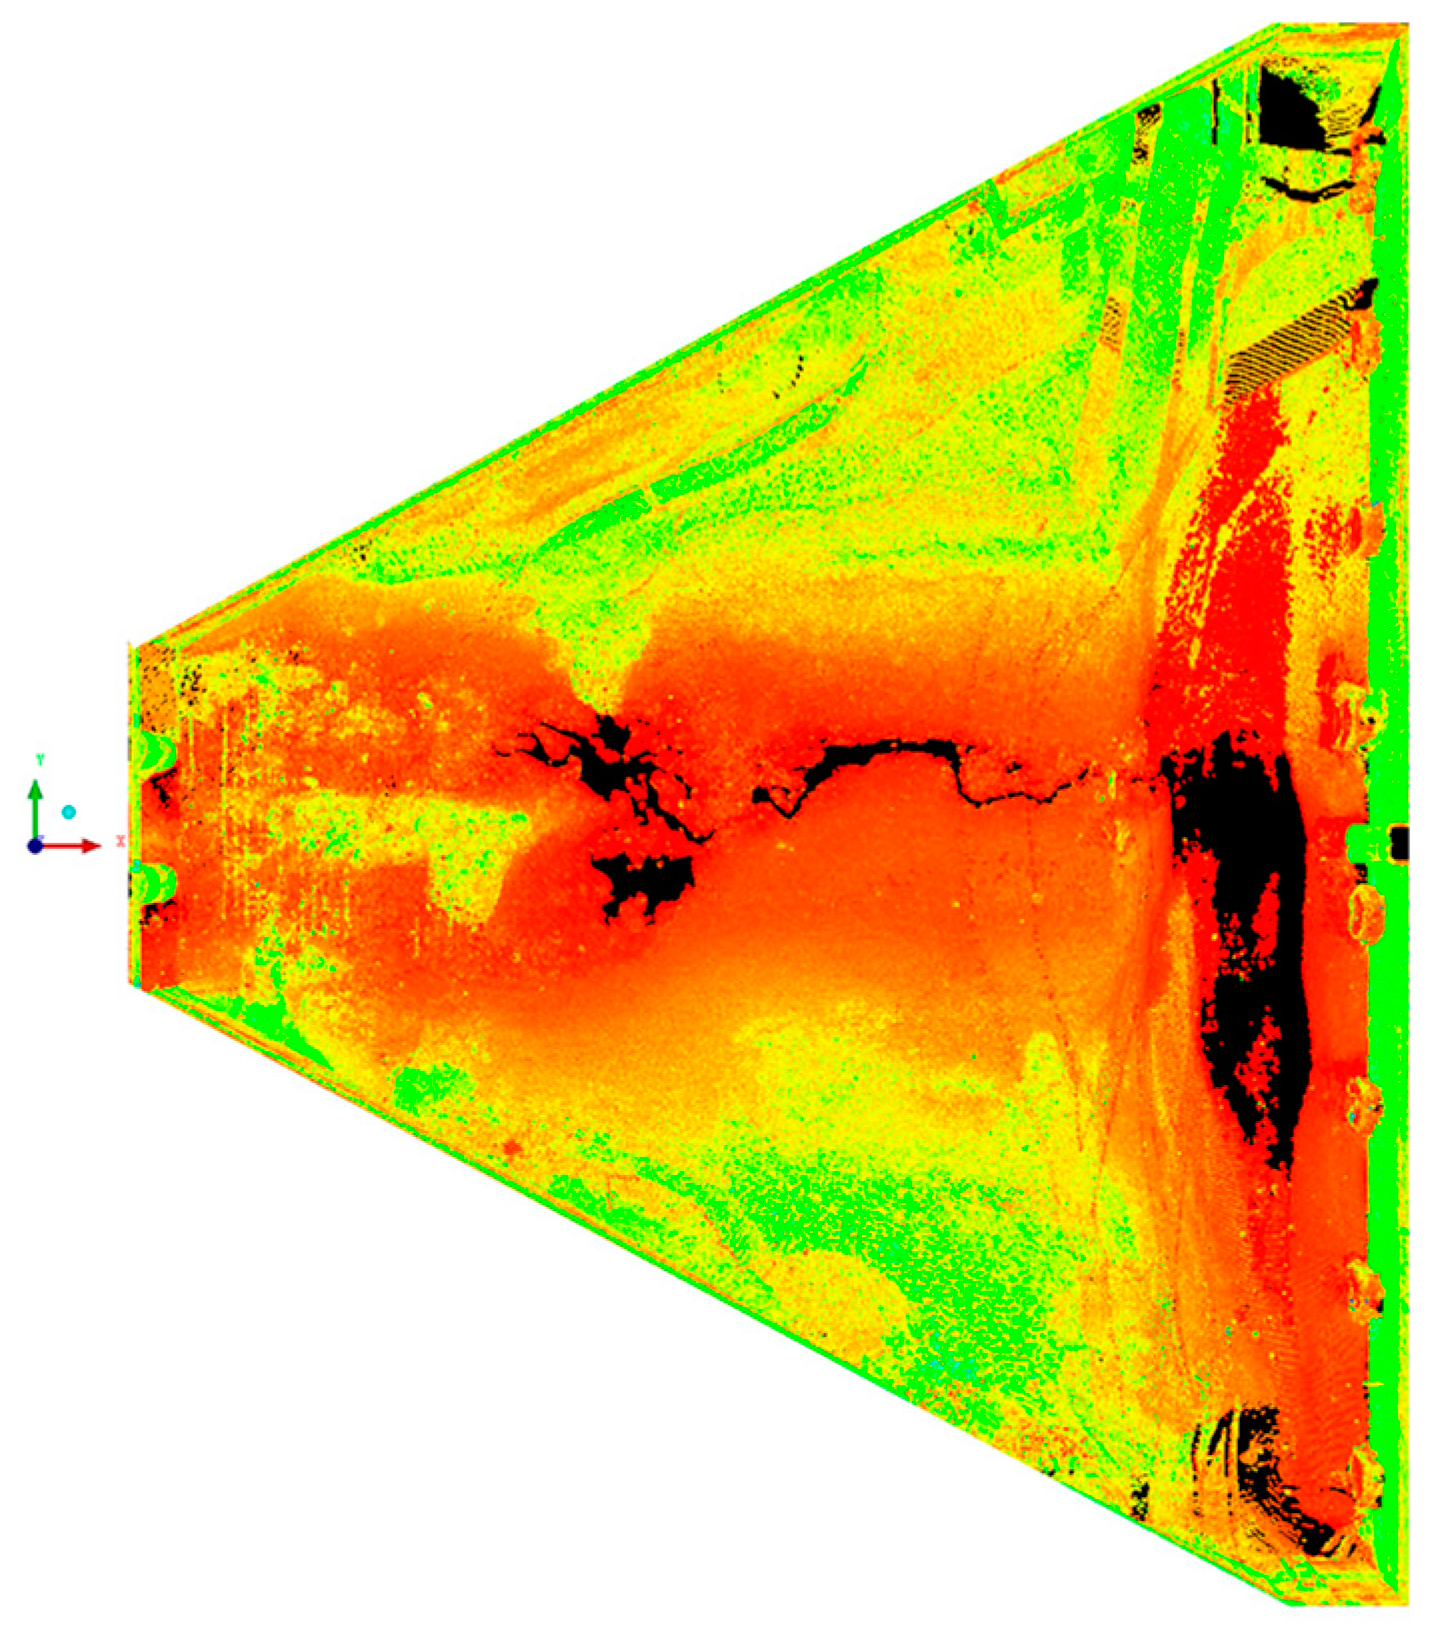
2.3. Acquisition and Processing of Point Cloud Data

After the winter irrigation period was over and there was no water in the intake structure, four stations were set up on site to collect the point cloud data of the forebay, suction sump, and internal siltation shapes using Leica Scan Station P30 (Leica, St. Gallen, Switzerland), taking into account the requirements of structural size, environment, and accuracy. This non-contact laser scanner combines technologies such as mixed pixels, WFD waveform digitization, and HDR imaging with high accuracy and a wide scanning range [32,33,34]. Its composition and working principle are shown in Figure 4.
The original data were preliminarily simplified, registered, and denoised using the post-processing software “Leica Cyclone 2022”, and the point cloud model obtained is shown in Figure 5. Then, the model was repaired using “Geomagic Wrap 2021” software, and the 3D curved surface model of the intake structure under the siltation state was reconstructed using the Non-uniform Rational Basis Splines (NURBS) rapid surface modeling method evolved from the B-spline theory [35,36]. After precision detection, the proportion of data points with a deviation in the range of ±350 mm between the curved surface model and the original point cloud data was 96.1%, which meets the calculation requirements of large-scale water conservancy projects. Finally, considering the limitation of the scanning range, and weakening the influence of the inlet and outlet boundaries on the flow field, we improved it using the software “ICEM-CFD 2022 R2” by supplementing the trash rack, transition section, and channel within 10 m upstream of the forebay entrance, as well as the suction pipe section downstream of the suction sump, to obtain a complete 3D computational domain model, as shown in Figure 6, which provides a basis for the construction and validation of subsequent numerical models. Reverse modeling involves the use of certain measurement techniques to measure existing physical objects or models and obtain a series of discrete data point values that can characterize their geometric topology information; then, based on the measured discrete data, with the help of certain three-dimensional geometric model construction methods and software, the process of reconstructing the CAD model of the physical object can commence. For the detailed process of reverse modeling, please refer to the Reference [21].

3. Construction and Validation of the Numerical Model

3.1. Governing Equation and Solving Method

According to the computational domain model constructed using reverse modeling, we applied “Fluent-ANSYS 2022 R2” based on CFD to numerically simulate the water–sediment two-phase flow field in the in situ intake structure [7,37,38].
The mixture model based on the Euler–Euler approach was adopted to calculate the multiphase flow [39,40]. The water source in this study is a mixed medium fluid composed of a solid phase (sediment particles) and a liquid phase (liquid water). The sediment phase is widely distributed in the fluid, and the drag force between the solid and liquid phases is unknown. This approach treats the fluid as a continuous medium, treats particles as quasi-continuous or quasi-fluid, and considers interphase slip and turbulent diffusion. It is more stable and efficient for calculating low-concentration solid–liquid two-phase flow in large pumping stations. Regardless of energy loss, the continuity equation for the mixture is defined as follows:
{ ρ m t + · ( ρ m u m ) = 0 ρ m = k = 1 n α k ρ k , u m = k = 1 n α k ρ k u k ρ m
The momentum equation of a mixture can be obtained by summing the respective momentum equations of all phases, which can be expressed as follows (for incompressible flow):
{ ( ρ m u m ) t + · ( ρ m u m u m ) = p + · [ μ m ( u m + u m T ) + ρ m g + F · ( k = 1 n α k ρ k u d r , k u d r , k ) μ m = k = 1 n α k μ k , u d r , k = u k u m
The slip velocity u p q of the secondary phase (p) relative to the primary phase (q), and its relationship with the drift velocity u d r , p are described as follows:
{ u p q = u p u q u d r , p = u p q k = 1 n α k ρ k ρ m u k q
where ρ m , ρ k is the density of mixed flow and phase k, respectively; u m , u k is the mass square velocity of mixed flow and the velocity of phase k, respectively; α k is the volume fraction of the k phase; n is the total number of phases; g is the gravity acceleration; p is the hydrostatic pressure; F is the volume force; μ m is the dynamic viscosity of mixed flow; and u d r , k is the drift velocity of phase k.
The k ε two-equations model based on the Reynolds-Averaged Navier–Stokes (RANS) method was selected as the turbulence model, including the Standard k ε model, the RNG k ε model, and the realizable k ε model. They can all simulate the complex flow patterns within the pumping station and the pump. Therefore, we adopted these three models for numerical calculation, compared them with the flow data obtained from the field test for verification, and finally determined the turbulence model suitable for this study.
The finite volume method was adopted to discretize the governing equations, the second-order upwind scheme was chosen to discretize the convection term, and the central difference scheme was set to discretize the diffusion term and source term. When using the pressure solver to solve the equation, the semi-implicit SIMPLEC algorithm was selected for the velocity and pressure coupling terms. The accuracy of the iterative residual was not less than 10−4.

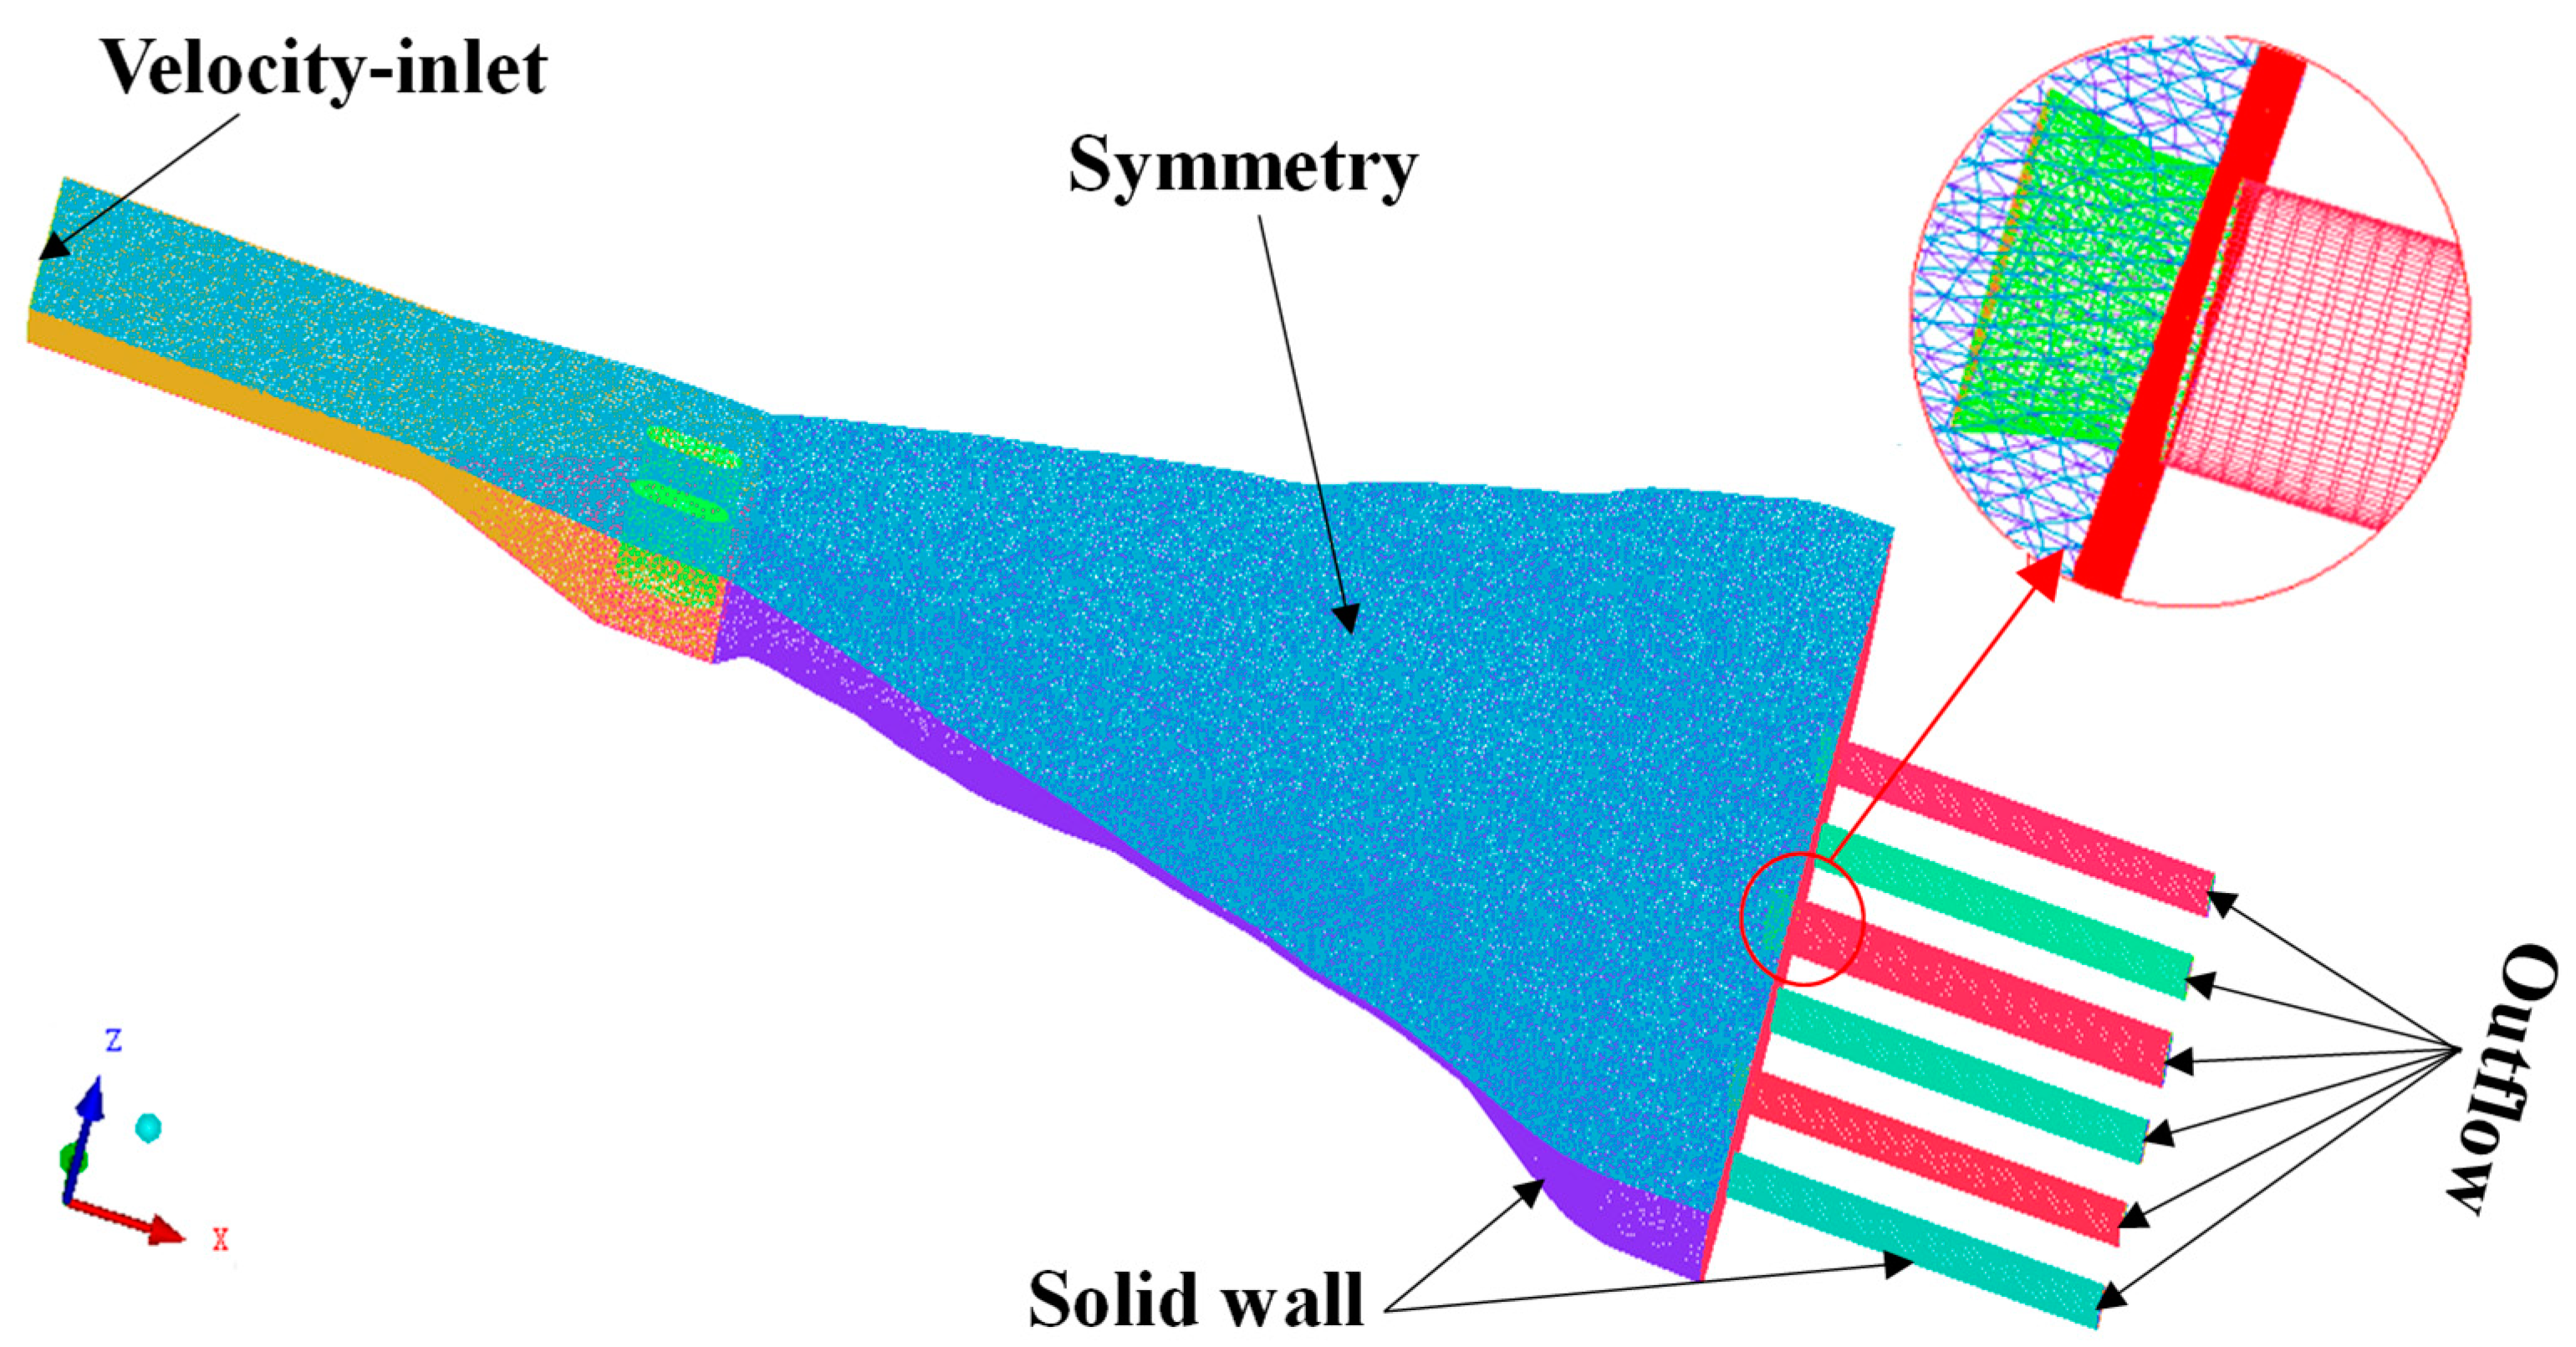
3.2. Boundary Condition and Meshing

(1) Boundary condition. The steady-state, homogeneous, and axial “velocity-inlet” condition was set as the inlet boundary of the computational domain, which was calculated to be 0.911 m/s according to the design flow rate and inlet cross-sectional area. The outlet boundary was set to “outflow”. Since the deformation of the water surface is very small when the pumping station operates stably under the design water level, the free surface was set to the “symmetry” plane boundary, that is, the “rigid-lid assumption”. The side walls and bottom of the forebay and suction sump adopted the no-slip boundary condition, with a wall roughness of 1.0 mm; the wall surface of suction pipes also adopted the no-slip wall condition, with a wall roughness of 0. It is verified that the boundary condition satisfies the mass conservation.
(2) Meshing. “ICEM-CFD” was used to mesh the computational domain model [41]. The suction pipes were divided into structured grids for their small volume and regular shape, and the rest of the parts were divided into unstructured grids. Considering the complexity of the flow near the inlet of suction pipes, local encryption was performed in this area. A total of five division schemes were designed, G1~G5, with the number of grid units being 1,195,560, 1,488,721, 1,855,558, 2,286,622, and 2,690,943, respectively. The hydraulic losses from the inlet to the outlet of each scheme were calculated to be 22.08, 11.14, 12.88, 13.57, and 13.39 mm, respectively. When the number of grid units exceeded 2,286,622, there was no significant change in hydraulic losses; therefore, the G4 scheme was ultimately selected, considering the calculation accuracy and economy, and the maximum size of the global element was 1.0 × 0.2 m. The grid division of the calculation domain model is shown in Figure 7.

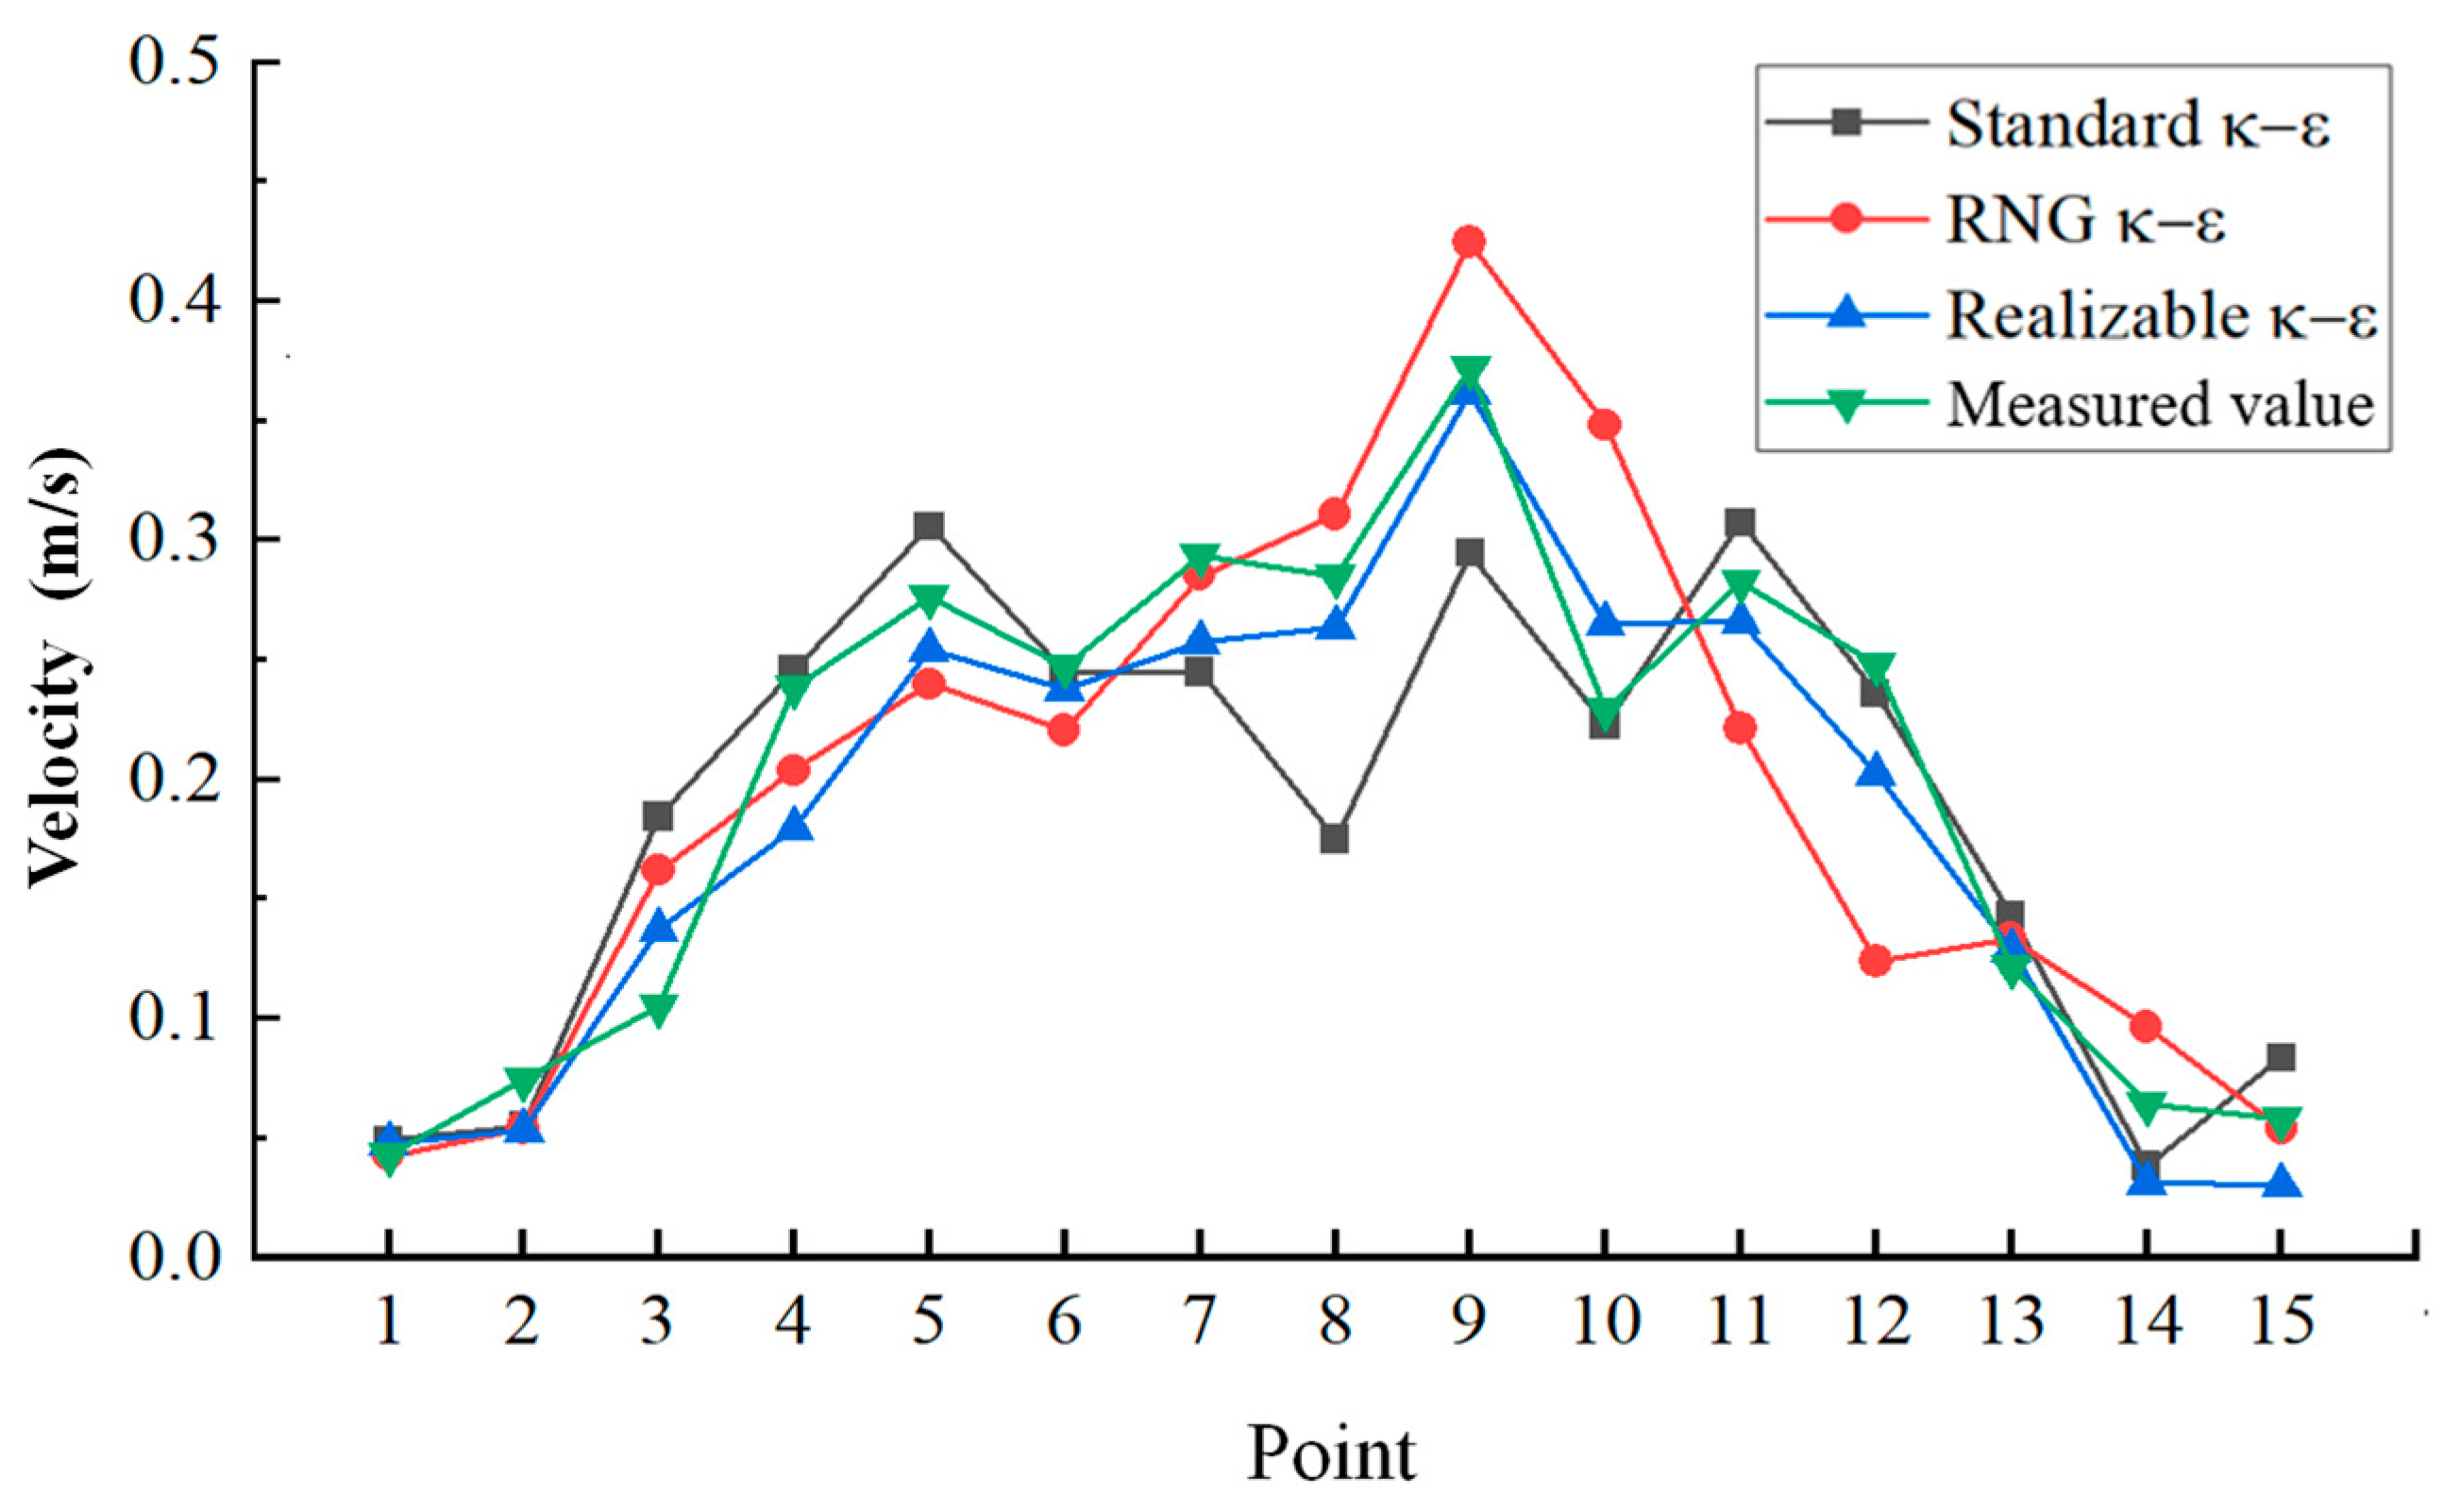
3.3. Verification of Numerical Model

We kept the same working conditions as the field test; that is, the #2~#7 pumps operated at the designed flow rate, while the #1 and #8 standby pumps were shut down (ignoring the corresponding pipelines during simulation). The flow rate was 6.00 m3/s. Referring to the results of the sediment particle size analysis previous, the sediment particle size was taken as 25 μm, the sediment concentration was 30 kg/m3, and the sediment density was taken as 2740 kg/m3.
The standard k ε , RNG k ε and realizable k ε turbulence model were, respectively, adopted for numerical calculations, combined with the mixture multiphase flow model. We selected 15 feature points on the intersection line lX5-Z1 of the X5 section (2 m away from the back wall) and Z1 section (1 m from the water surface), and compared them with the measured values. The location of the measuring points is shown in the blue circle in Figure 2. The comparison of flow velocity values is shown in Figure 8, indicating that the distribution trends of flow velocity calculated by the three turbulence models are basically consistent with the measured results, and the realizable k ε model has the best consistency. Then, the mean absolute error (MAE) and the root-mean-square error (RMSE) were applied for error analysis [42,43]; the MAE of the realizable k ε model was 0.183, and the RMSE was 0.029, both of which were the smallest. Therefore, it is accurate and reliable to choose the realizable k ε turbulence model combined with the mixture multiphase flow model for this study.

4. Results and Discussion

4.1. Calculated Working Conditions

Different operating conditions, especially the solid-phase concentration, flow rate, and start-up combination, have a direct impact on the energy loss, flow field distribution, and units’ inflow characteristics of the intake structure. Therefore, this study constructed a corresponding numerical model of the prototype intake structure without siltation, and a total of 10 cases were designed for simulation calculations based on the “turbulence–multiphase flow” model validated above, as shown in Table 2. CSf represents the sediment mass concentration at the inlet boundary, and Q represents the flow rate of the pumping station.
According to the previous simulation, it was found that the velocity distribution of section Z3 (h = 3.00 m) and the X axis velocity distribution of each point on section X3 can represent the flow field characteristics of the intake structure well. For the convenience of comparing different cases, the X3 section was simplified as follows: the horizontal distribution of each point on the X3 section remained unchanged, and the average flow velocity values were calculated by taking three points along the direction of the water depth. Taking these characteristic sections and feature points as the representative, we further analyzed the impact of different working conditions on the hydraulic performance of the water–sediment flow field within the intake structure.

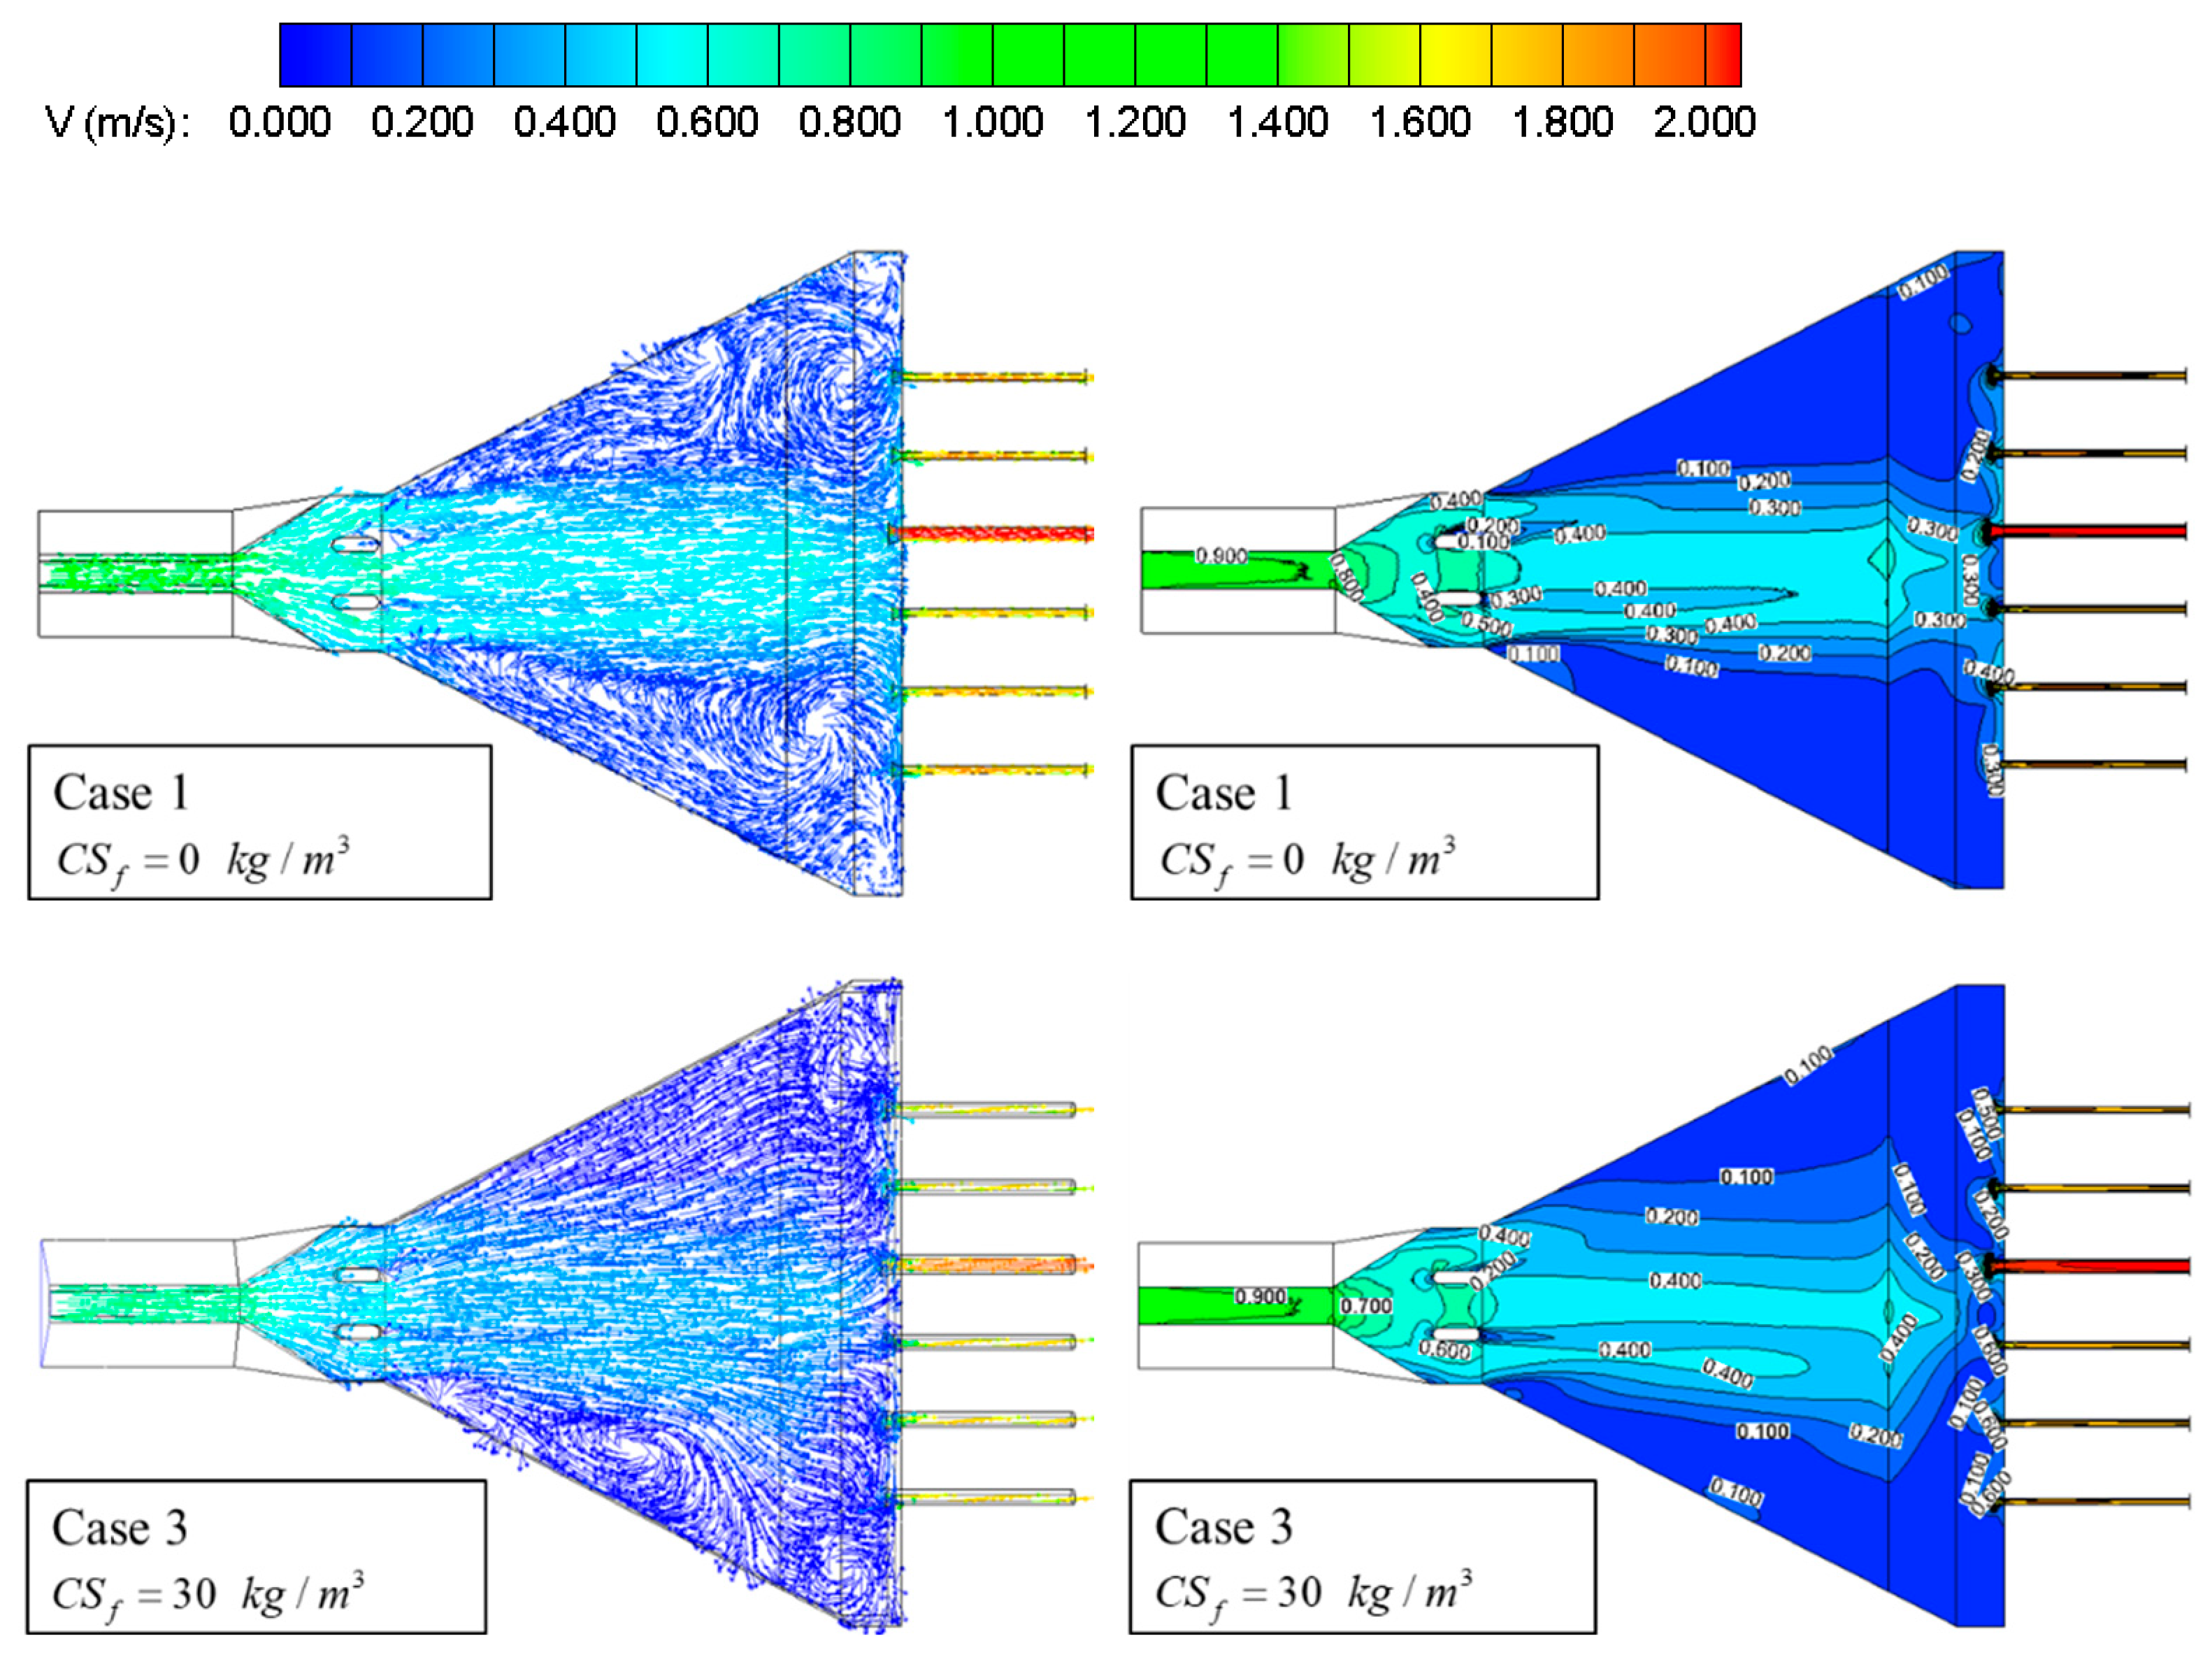
4.2. Effect of Sediment on the Flow Field

A comparative analysis was conducted on the flow fields of clear water “Case1” (single phase flow) and sediment-laden water “Case3” (solid–liquid two-phase flow), and the flow velocity distribution at typical cross-sections is shown in Figure 9. Under the clean-water condition, the mainstream effect in the intake structure is obvious, and the flow pattern in the mainstream area is relatively smooth. Two symmetrical large-scale coaxial vortices are generated at the back end of the forebay and inside the suction sump. The flow exhibits characteristics similar to jet flow, mainly due to the significant difference between the channel width and the width of the forebay and suction sump, resulting in a higher flow velocity within the same width range. Moreover, the flow impacts the sidewall of the suction sump and flows toward both sides.
When the water flow carries suspended sediment (Case3), the number and distribution of vortices change, and the large-scale coaxial vortices evolve into spiral vortices along the depth direction. The scale and intensity of the vortices increase, and the edges are close to each other, almost occupying the entire suction sump area. The spiral vortex weakens the jet features and mainstream effect, changing the velocity distribution of the flow field. The volume of the backflow zone within the sediment-laden flow is larger than that of the clean-water condition. Still, the average velocity of the backflow zone is smaller than that of the clear-water condition. The numerical results are expected to be consistent with the characteristics of the actual flow fields of the project.

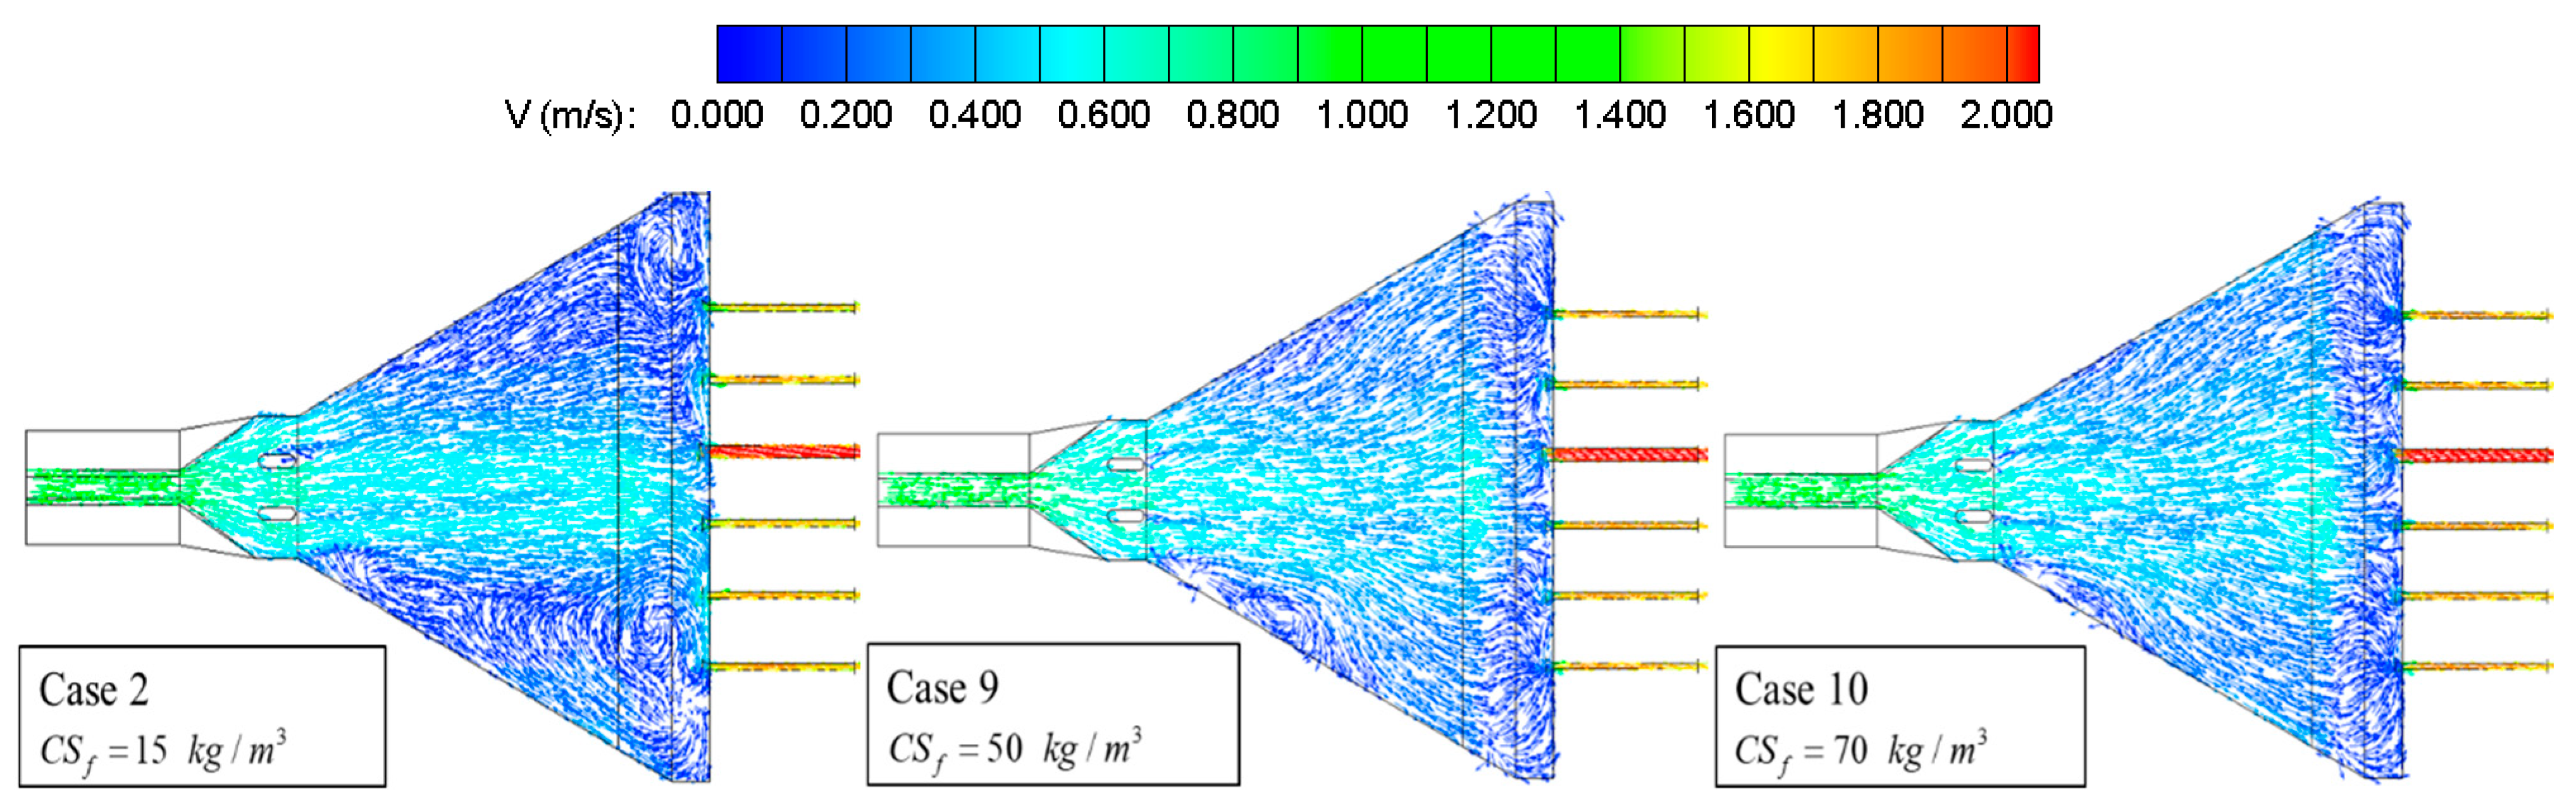
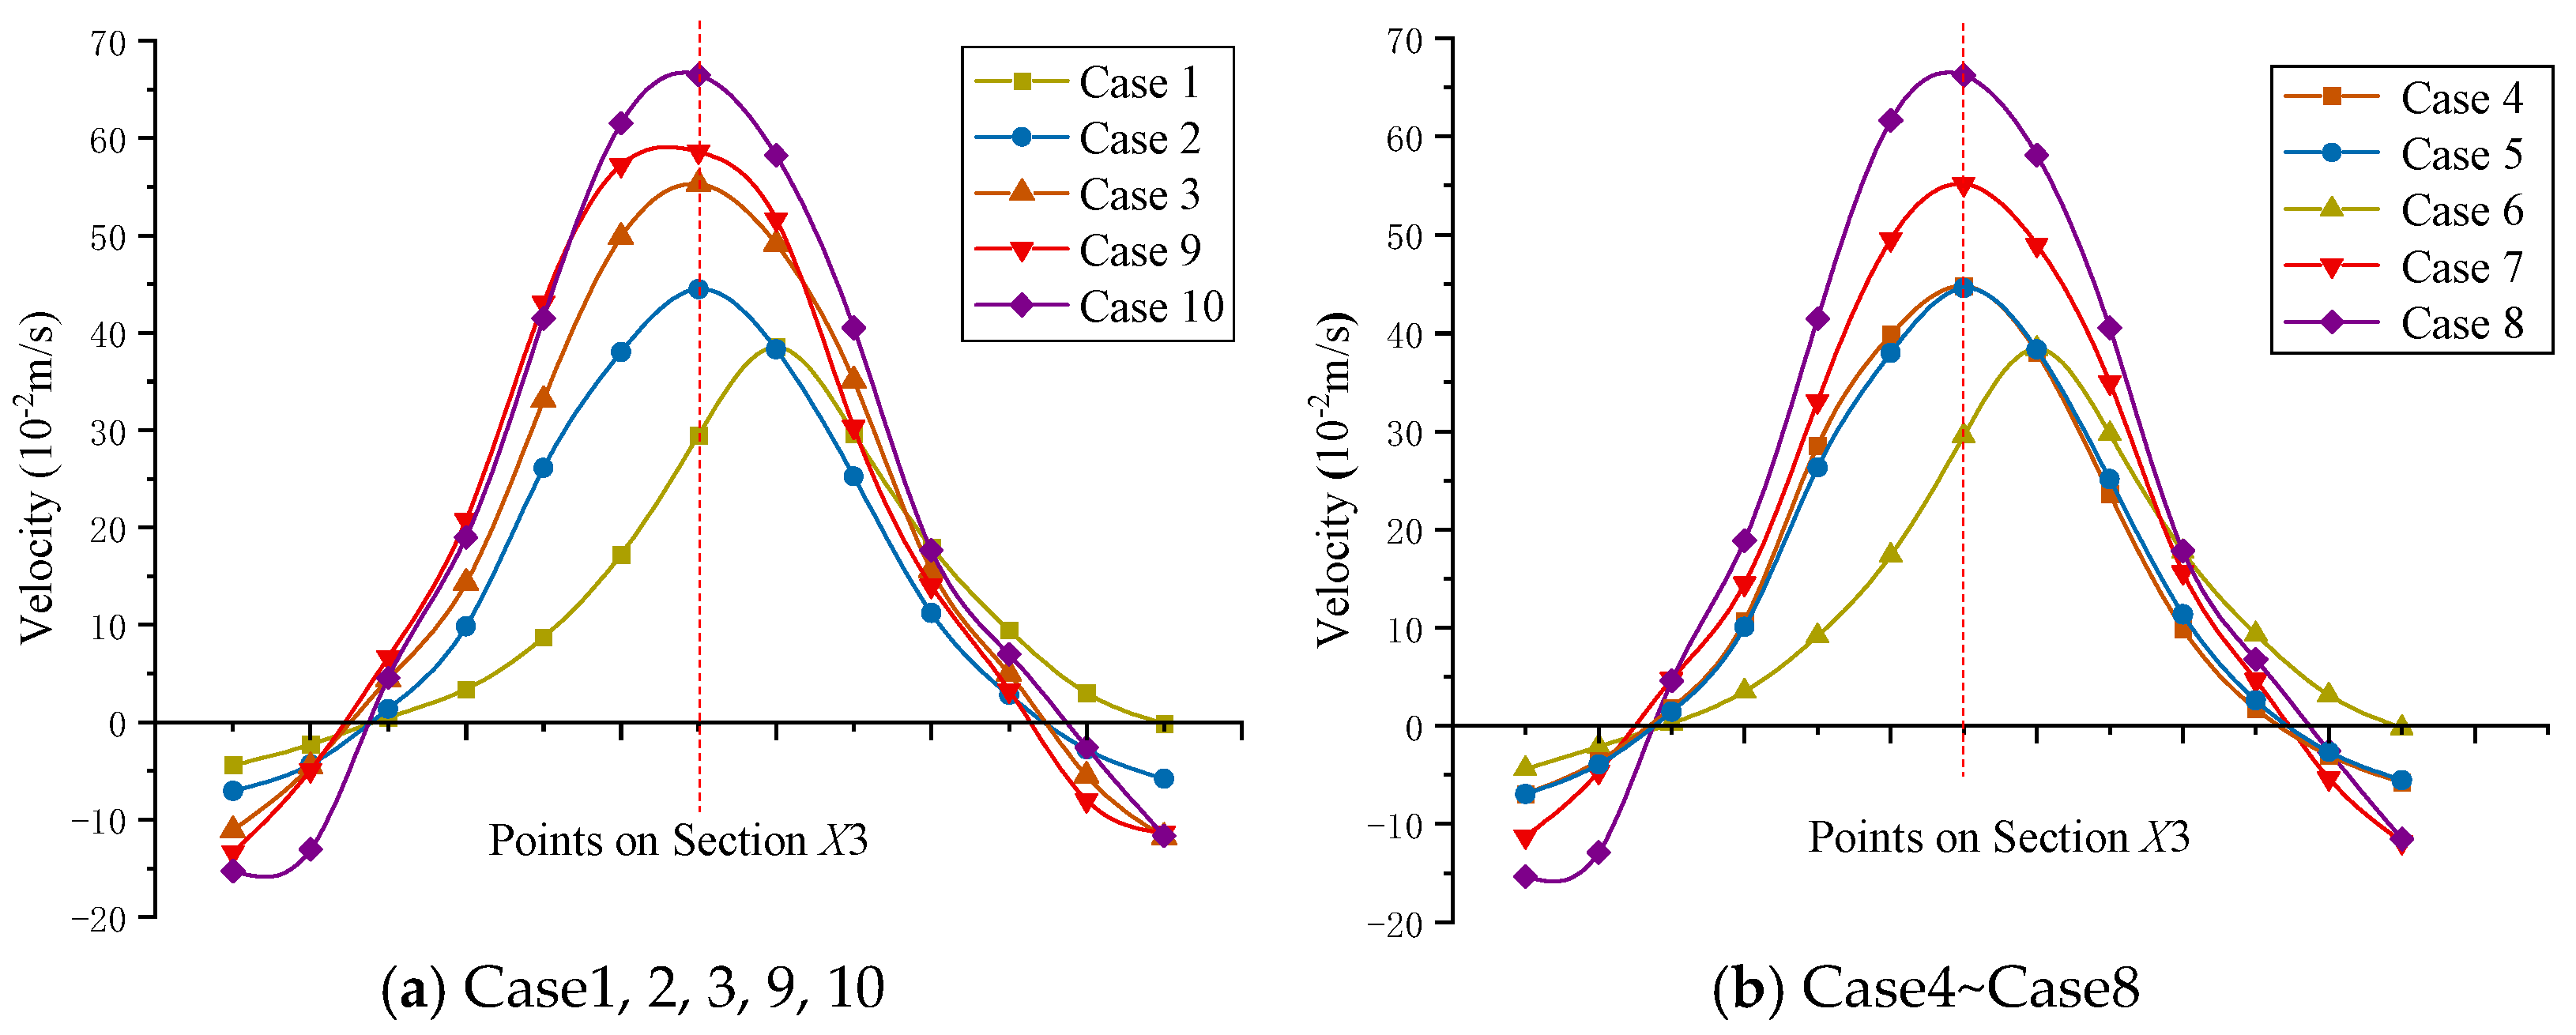
4.3. Effect of Sediment Concentration on the Flow Field

In order to further explore the impact of sediment concentration on the hydraulic performance of the intake structure, four calculation schemes with different solid-phase concentrations were designed for comparative analysis under the premise of keeping the operating condition of pump units and the characteristics of sediment particles unchanged, namely Case2, Case3, Case9, and Case10. The velocity distribution of the Z3 section is shown in Figure 10, the average X axis flow velocity distribution of the X3 section is shown in Figure 11a, and the distribution of the sediment volume fraction near the bottom is shown in Figure 12.
Figure 10 illustrates that with the increase in the sediment concentration, the diffusion effect of the water flow in the intake structure significantly improves, the mainstream effect weakens, and the vortex backflow zone decreases or even disappears. When the sediment concentration does not exceed 30 kg/m3 (Case2, Case3), the low-speed vortex recirculation zones on both sides of the forebay and suction sump are more obvious. The flow velocity in the vortex backflow zone is lower than 0.200 m/s, and the large range is below 0.100 m/s, with a slight increase in the mainstream range. When the sediment concentration exceeds 30 kg/m3 (Case9, Case10), the vortex backflow zone basically disappears, and the water flow diffuses evenly. The range of flow velocity below 0.100 m/s in the forebay is significantly reduced, while the flow velocity in the suction sump is still relatively low due to the significant water depth.
As shown in Figure 11a, as the sediment concentration increases, the peak X axis velocity of the X3 section decreases significantly. The peak velocity with a sediment concentration of 70 kg/m3 is 0.297 m/s, a 41.30% decrease compared to the clean-water condition. The reverse flow velocity on both sides gradually decreases until it disappears, but there is no significant increase in flow velocity. In Figure 12, it can be seen that with the increase in the sediment concentration, the deposition process and siltation in the intake structure are more significant; the maximum volume fractions of the near-bottom sediment of each scheme are 0.12836, 0.03307, 0.04129, and 0.05850, respectively. The areas with the most significant sediment deposition are mainly distributed in the low-velocity vortex backflow zone on both sides, consistent with the actual deposition distribution of the intake structure.
With the increase in the sediment concentration, the diffusion effect of water flow is significantly improved, the range of low-velocity backflow zone is obviously reduced, and the distribution of flow field and hydraulic loss are improved. However, the limitation of the sediment-carrying capacity of the water flow directly exacerbates the process of sediment deposition, especially for the suction sump, where the flow velocity is already low.

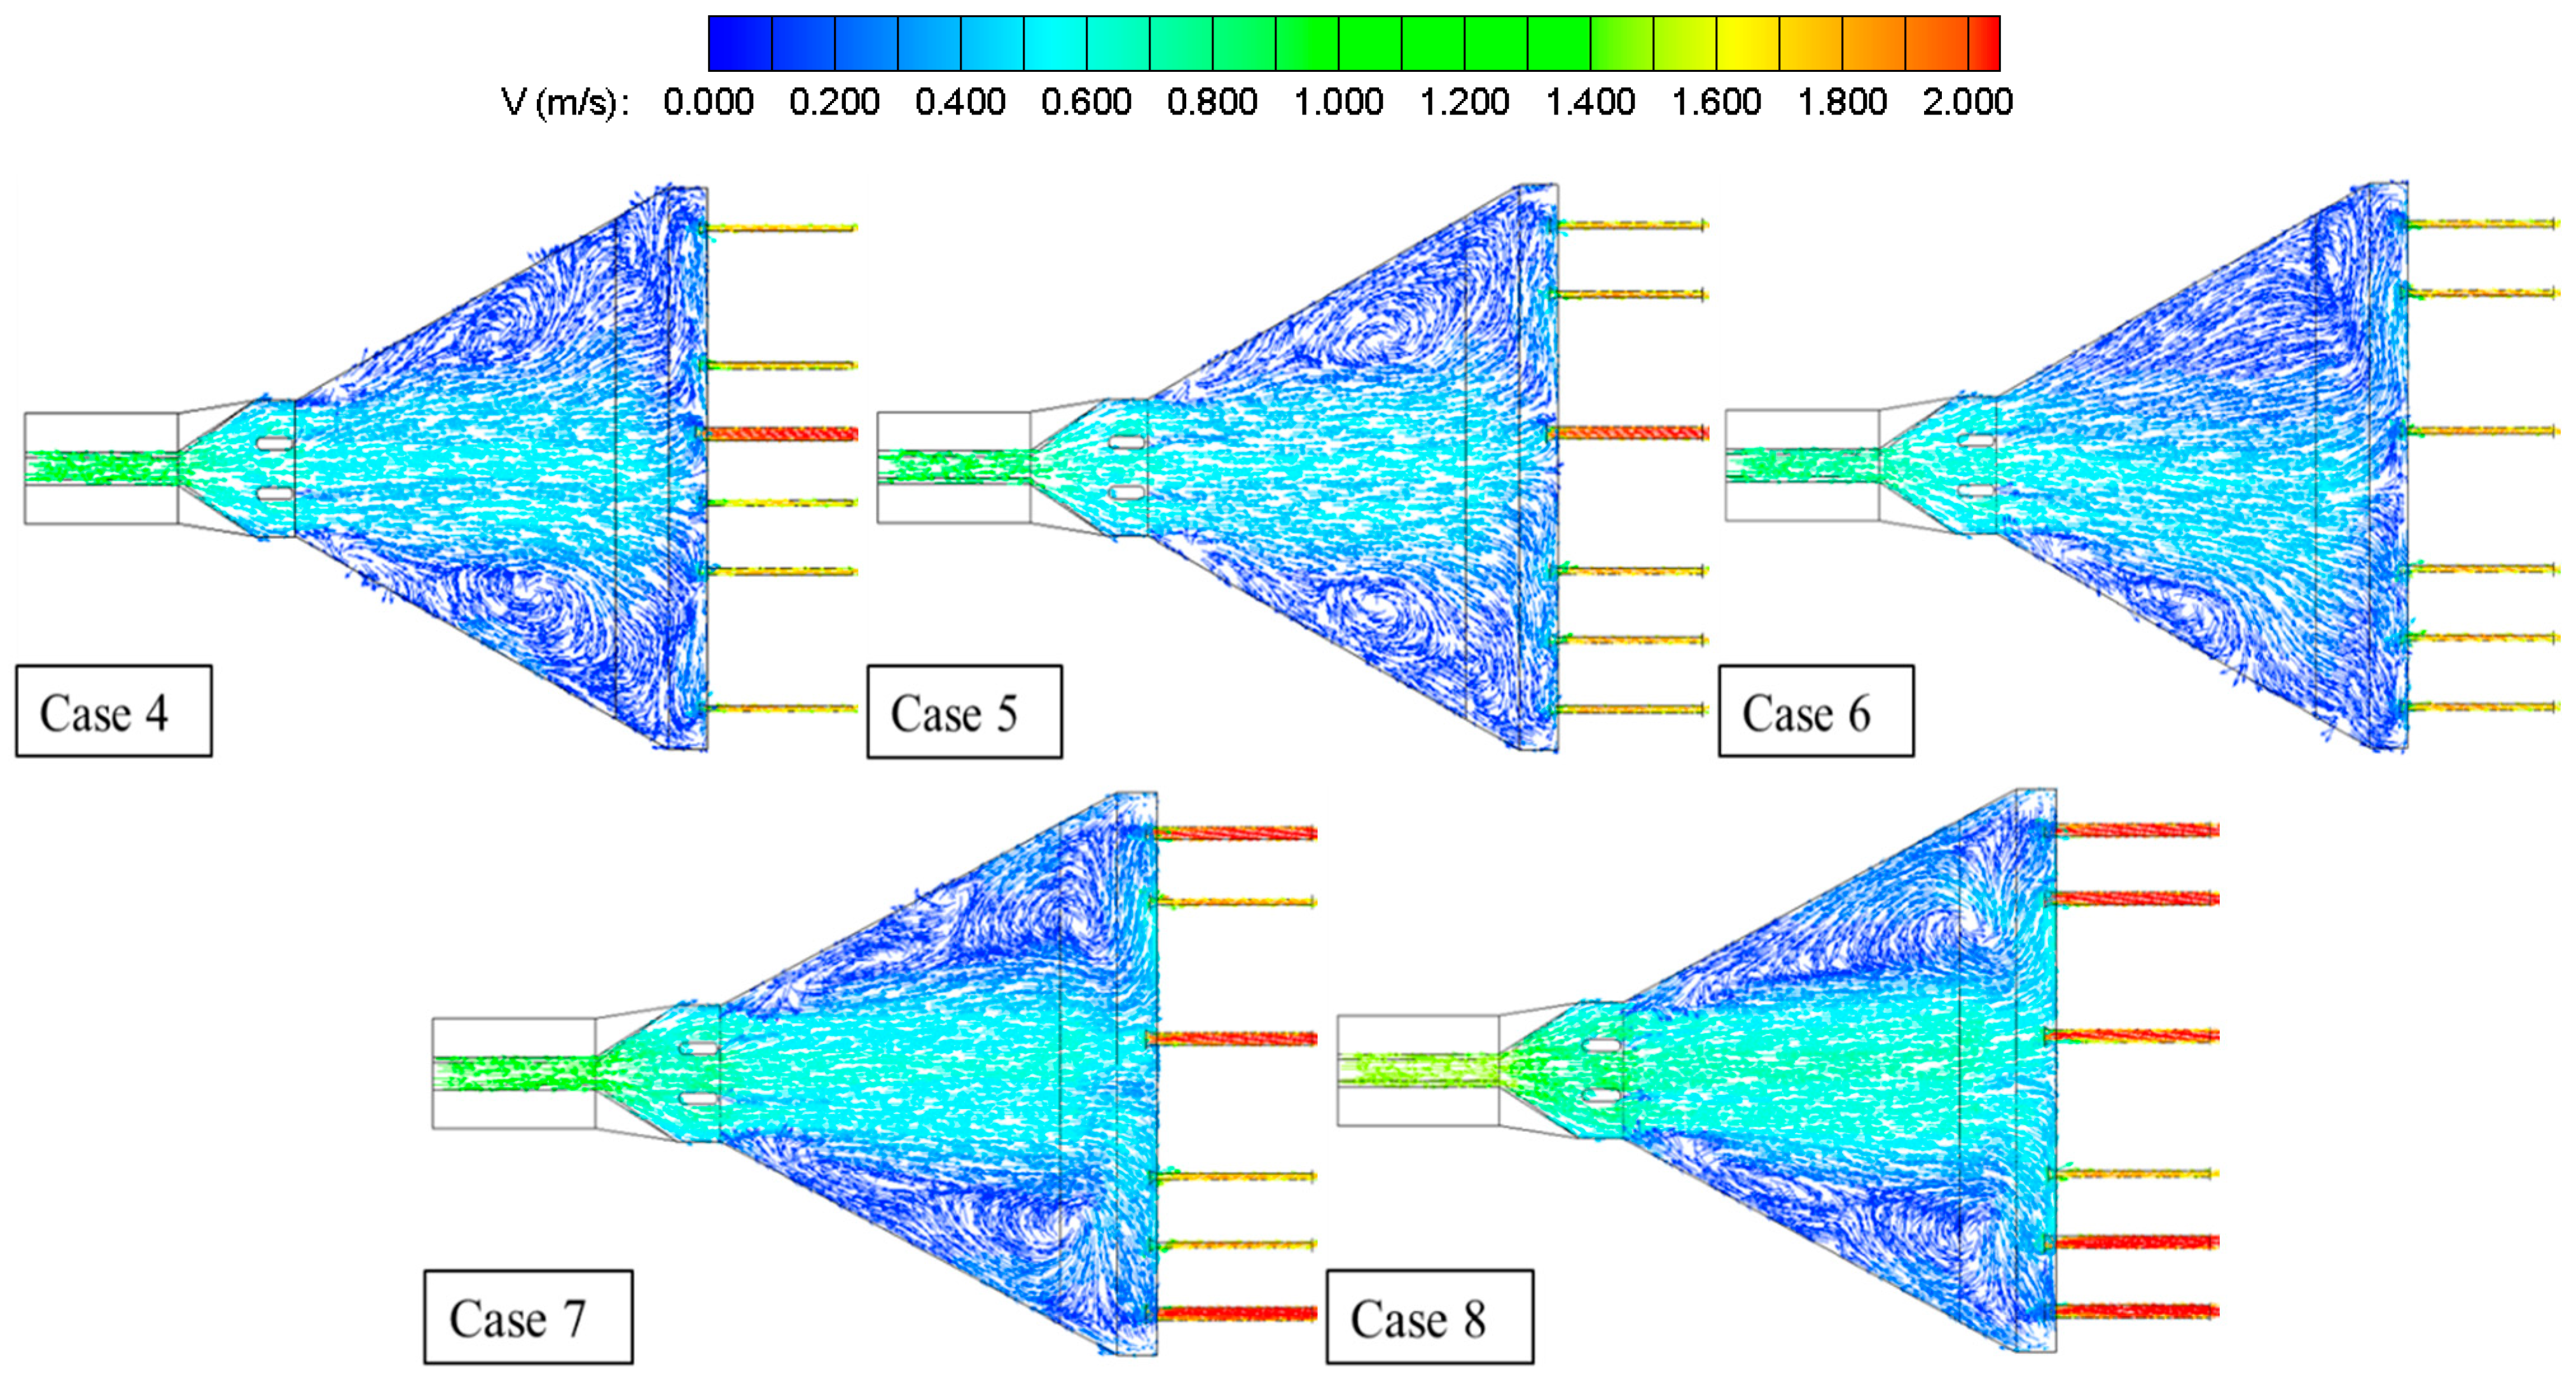
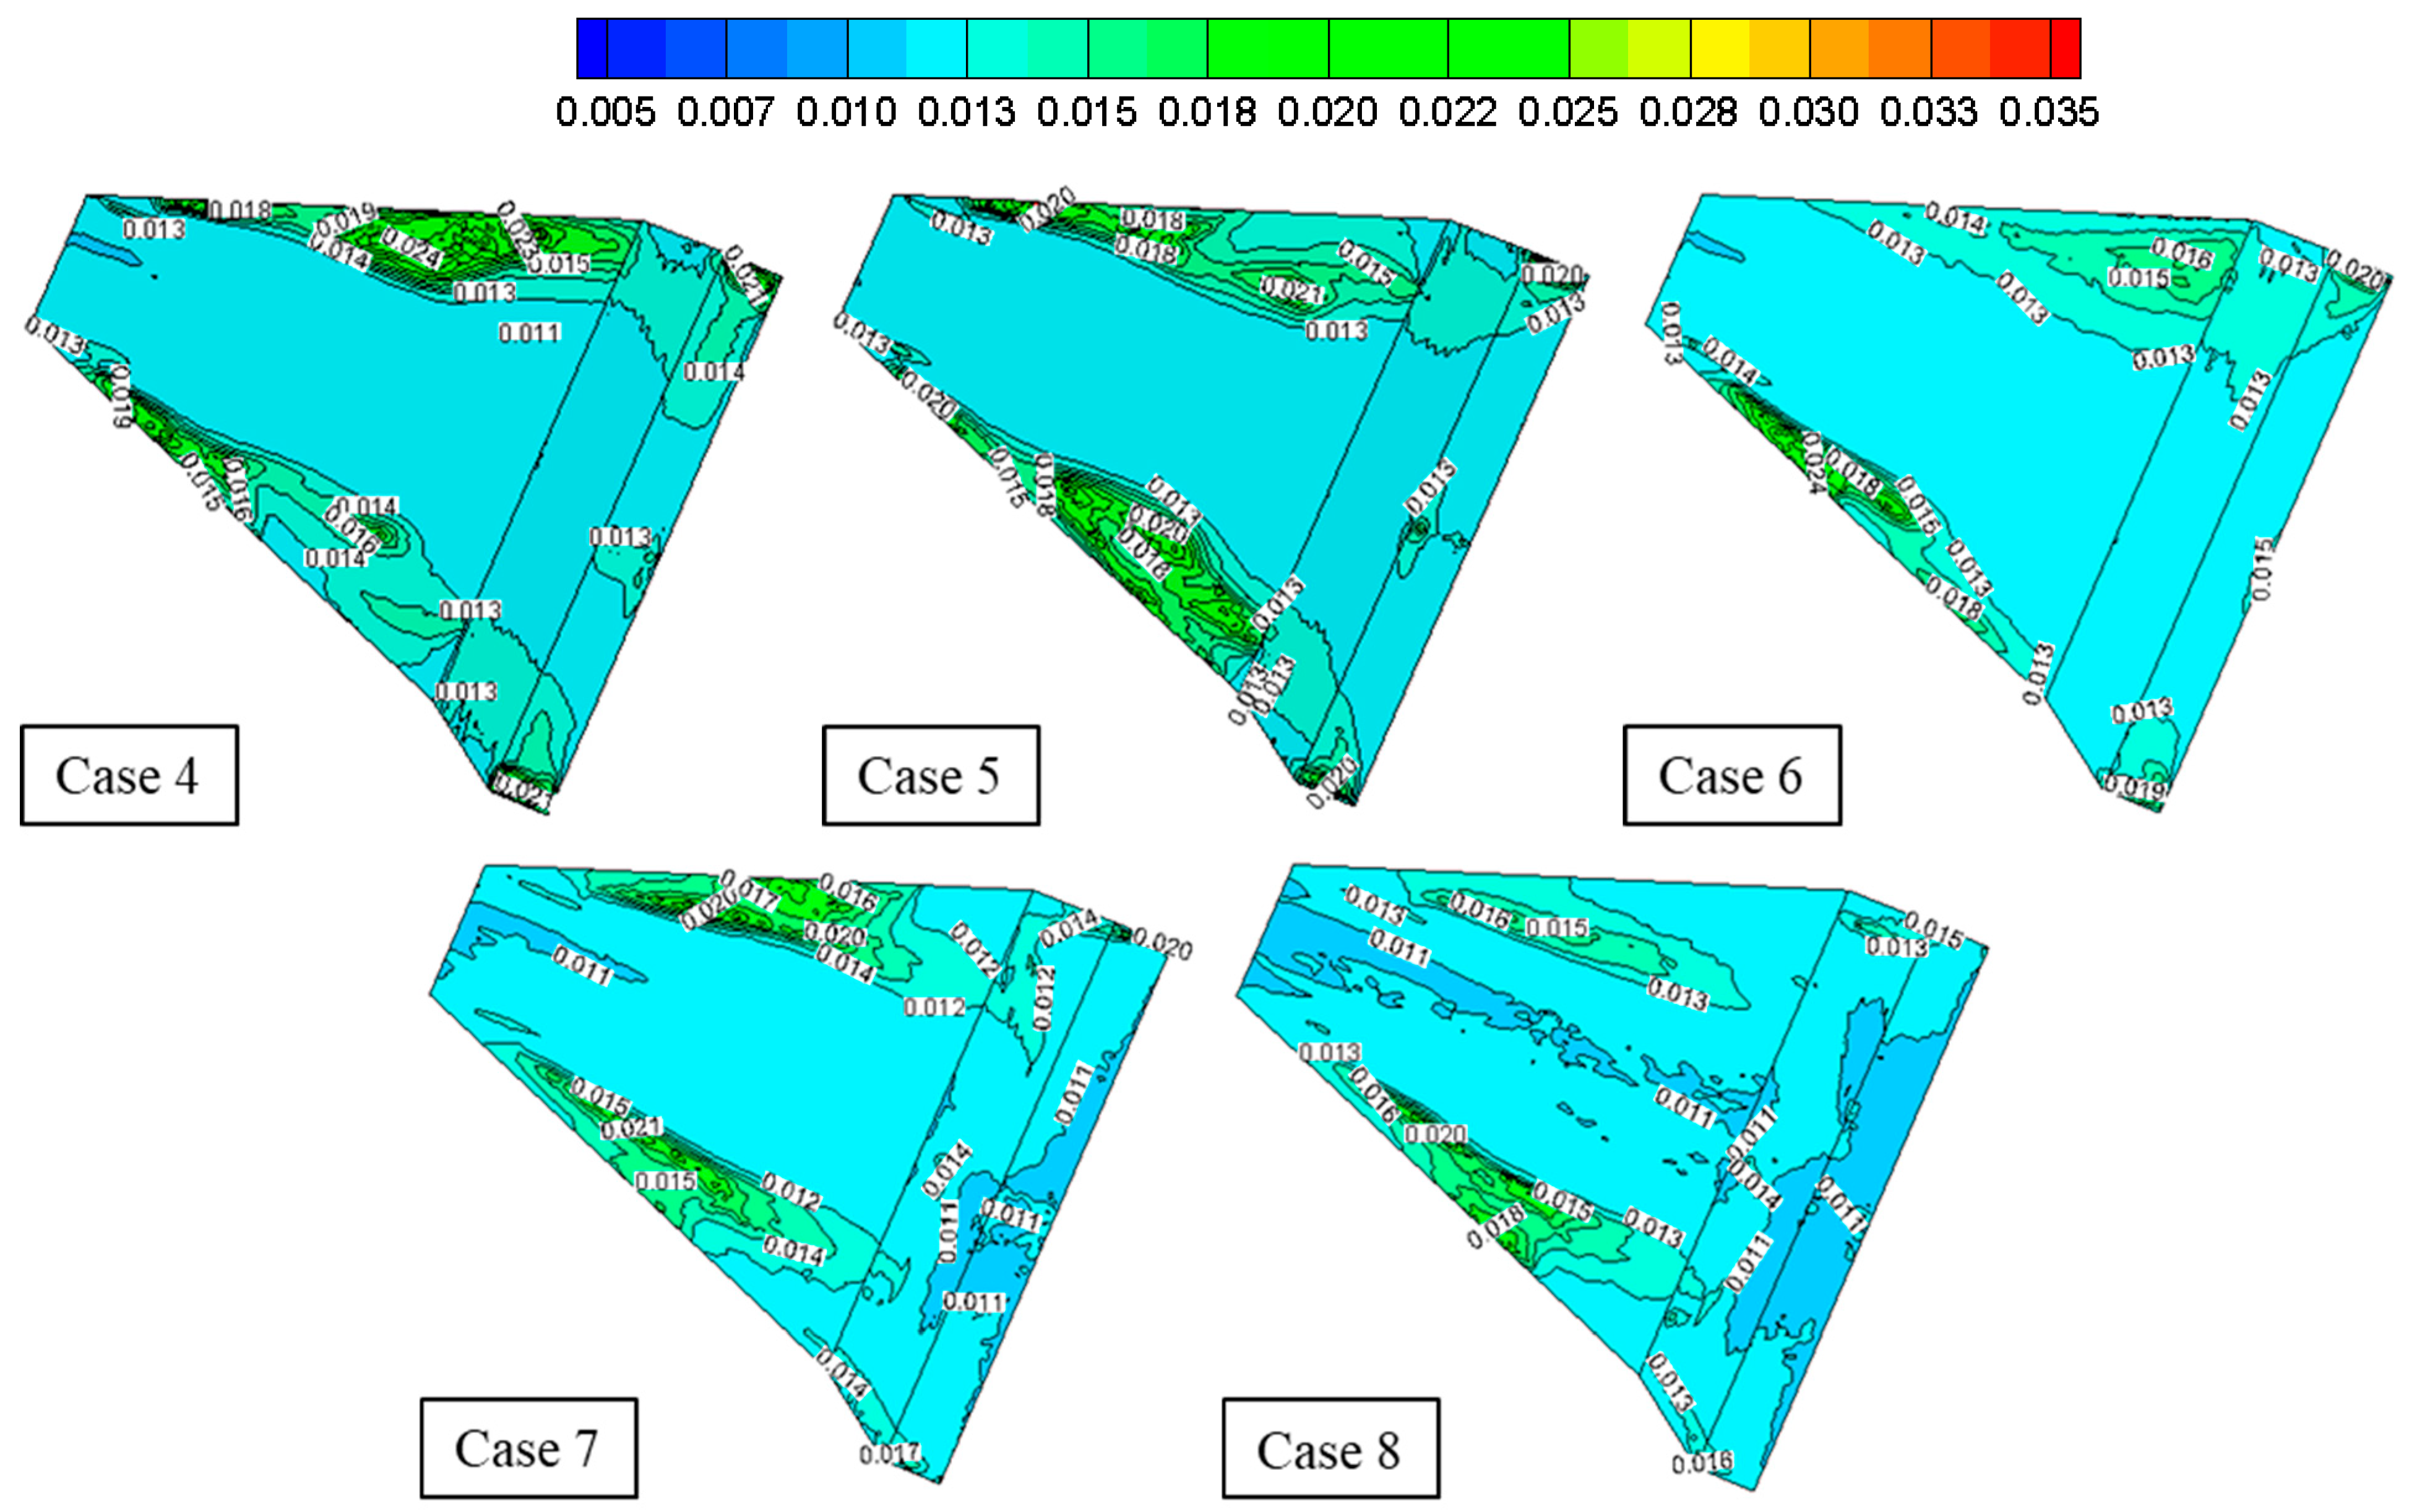
4.4. Effect of Flow Rate on Flow Field

The typical pumping station selected in this study has two types of pump units, namely, high-flow units (1.60 m3/s) and low-flow units (0.88 m3/s). In order to study the impact of different flow quantities and start-up combinations on the water–sediment flow field of the intake structure, a total of five schemes were designed for numerical simulation by adjusting the opening, closing, and flow rates of different units, namely Case4, Case5, Case6, Case7, and Case8, considering the symmetrical opening of pump units and the uniform distribution of flow quantities. The velocity distribution of the Z3 section is shown in Figure 13, the X-axial velocity distribution of the X3 section is shown in Figure 11b, and the distribution of the sediment volume fraction near the bottom is shown in Figure 14.
In Figure 13, the analysis reveals significant mainstream effects and large-scale low-speed vortex backflow zones within the intake structure under different schemes. When the flow rate is low (Case6), the velocity at the inlet is low, the water flow is not prone to wall detachment, the plane diffusion effect is good, the mainstream effect is weak, and the range of the vortex backflow zone is small. Affected by the layout of units, the mainstream is biased to the right, and the overall flow rate is low, with a wide range of flow quantities below 0.100 m/s. As the flow rate increases, the mainstream effect becomes more prominent, and the structure of the flow field becomes more complex; the flow distribution of pump units has a certain impact on the symmetry of the backflow zone. Further, the mainstream range and flow rate increase significantly along the inflow direction, while the increase is weaker in the horizontal direction due to the compression limitation of the vortex backflow zone. Lastly, the range of the vortex return zone is slightly reduced, but the intensity is significantly increased. Due to the large-scale backflow and vortex areas in the forebay and suction sump, the velocity of the sidewalls on both sides is very small, as the velocity in the backflow zone is less than 0.200 m/s and less than 0.100 m/s in a wide range; the smaller the velocity, the more favorable it is for sediment deposition.
As shown in Figure 11b, the distribution pattern of the X axis velocity on the X3 section is basically consistent in different cases. With the increase in the flow rate, the mainstream flow velocity increases obviously, and the peak position gradually deviates to the left, while the reverse flow velocity in the vortex backflow zone increases continuously. The flow velocity on the left side of the X3 section in Case4 and Case5 increases slightly, and the distribution tends to be more symmetrical, indicating a slight decrease both in the range of the vortex backflow zone and the squeezing effect on the mainstream. In Figure 14, sediment deposition within the intake structure is mainly distributed in vortex return zones and areas with velocities below 0.100 m/s; the maximum volume fractions of sediment near the bottom for different cases are 0.02518, 0.02181, 0.03366, 0.02930, and 0.02510, respectively, with little difference. However, the volume of the area with serious sediment deposition near the bottom decreases significantly with the increase in flow rate, which may be due to an increase in overall velocity, especially in the mainstream range and its transition area with backflow, where the sand-carrying capacity of the water flow is significantly improved.
In summary, the increase in the flow rate will exacerbate the mainstream effect and turbulence of the flow patterns within the intake structure and cannot improve the inflow conditions of the pump unit. The process of sediment deposition is mainly affected by many factors, such as the flow velocity, the range and intensity of the vortex backflow zone, as well as the position of the vortex center. The increase in the flow rate reduces the range of sediment deposition to a certain extent, but the existence of a vortex backflow zone will still promote the continuous occurrence of sediment deposition.

5. Conclusions

For pumping stations that divert water from sand-laden rivers, the operational safety and efficiency are threatened by sediment to varying degrees. This study conducted a hydraulic analysis of liquid–solid two-phase turbulence flow in the intake structure through field tests and numerical simulations, considering factors such as the sediment concentration, flow rate, and start-up combination. A three-dimensional computational domain model of the intake structure under siltation was accurately reconstructed by applying the reverse-modeling method; by comparing and verifying with the measured velocity values obtained from field tests, a suitable turbulence model was selected for numerical simulation for the further analysis of the effects of different operating conditions on the flow field and sediment deposition. The research content effectively improved the several shortcomings proposed in the Introduction, helps to explore the causes of sediment deposition, and provides references for the design of anti-deposition measures. The main conclusions are as follows:
(1)
The reverse-modeling method proposed and applied in this study can accurately identify the actual structure of the research object and the morphology of sediment deposition. Moreover, the quantitative verification of the numerical simulation results using field experimental values is more reliable. It not only provides a foundation for subsequent hydraulic analysis but also offers an effective reference for the modeling of similar projects with complex morphology.
(2)
At the solid-phase particle size of 25 μm and mass concentration of 30 kg/m3, the sediment will cause the coaxial vortex to evolve into a larger-scale spiral vortex along the water depth direction, and the backflow zone accounts for about 2/3 of the intake structure volume. The process of sediment deposition is controlled by the range, intensity, and flow velocity of the vortex backflow zone, and the maximum volume fraction of the near-bottom sediment increases by 202.01% compared to the initial state, especially in the suction sump. Sediment deposition is mainly distributed in areas with flow velocities below 0.100 m/s, and the vortex backflow zone is more prominent. With the increase in the sediment concentration, the attenuation of flow velocity will be accelerated. Although it assists in the diffusion of water flow, the increase in the sediment concentration and the decrease in flow velocity will further worsen the problem of sediment deposition. Increasing the flow rate will lead to an increase in the flow velocity within the intake structure, exacerbating the turbulence of the flow field.
(3)
The sediment-laden water source is the fundamental cause of sediment deposition in the intake structure, and the adverse flow fields, such as low-velocity zones and vortex backflow zones, have a significant promoting effect on the sediment deposition process, which is the main reason for its functional decline and sediment deposition. The improvement effect of adjusting the flow rate and start-up combination is relatively weak. Thus, subsequent research on optimization of the structural parameters and engineering measures should be carried out, such as adjusting the diffusion angle, length–width ratio, and bottom longitudinal slope, as well as parameters such as the submergence depth, suspension height, and rear wall distance of the suction pipe. Research could also examine the utility of setting up a debris basin, diversion pier, bottom sill, water-entrapment plate, vortex-elimination device, etc. The sediment particle size is also a non-negligible influencing factor, which should be considered in follow-up to improve the research content. In addition, the critical conditions for the deposition and start-up of sediment at the bottom should also be further analyzed.

Author Contributions

Material preparation, data collection and analysis were performed by J.T., G.W., R.W., H.L. and X.H. The first draft of the manuscript was written by C.X. and J.T., and all authors commented on previous versions of the manuscript. All authors have read and agreed to the published version of the manuscript.

Funding

The authors gratefully acknowledge the financial support of National Natural Science Foundation of China (51579102); Basic Public Welfare Research Program of Zhejiang Province (LZJWD22E090001); Major Science and Technology Program of Zhejiang Province (2021C03019); Ningxia Water Resources Science and Technology Program (GKGX-KY-2023-001); Ningxia Water Resources Science and Technology Program (QTXGQ-KY-2023-001).

Data Availability Statement

The data presented in this study are available on request from the corresponding author.

Acknowledgments

The authors would be grateful to the reviewers for their comments to improve the quality of this paper and would also like to thank the editors for their help with this paper.

Conflicts of Interest

Author Guoxia Wang was employed by the company Liaoning Water Conservancy and Hydropower Survey and Design Research Institute Co., Ltd. The remaining authors declare that the research was conducted in the absence of any commercial or financial relationships that could be construed as a potential conflict of interest.

References

  1. Wang, Z.; Qian, Z. Effects of concentration and size of silt particles on the performance of a double-suction centrifugal pump. Energy 2017, 123, 36–46. [Google Scholar] [CrossRef]
  2. Wang, H.; Li, C.; Lu, S.; Song, L. The flow patterns and sediment deposition in the forebay of a forward-intake pumping station. Phys. Fluids 2022, 34, 083316. [Google Scholar] [CrossRef]
  3. Wang, C.; Wang, F.; Chen, W.; He, Q.; Chen, X.; Zhang, Z. A dynamic particle scale-driven interphase force model for water-sand two-phase flow in hydraulic machinery and systems. Int. J. Heat Fluid Flow 2022, 95, 108974. [Google Scholar] [CrossRef]
  4. Rogallo, R.S.; Moin, P. Numerical simulation of turbulent flows. Annu. Rev. Fluid Mech. 1984, 16, 99–137. [Google Scholar] [CrossRef]
  5. Crowe, C.T.; Troutt, T.R.; Chung, J.N. Numerical models for two-phase turbulent flows. Annu. Rev. Fluid Mech. 1996, 28, 11–43. [Google Scholar] [CrossRef]
  6. Bernard, P.; Wallace, J.; Yavuzkurt, S. Turbulent flow: Analysis, measurement, and prediction. J. Fluid Mech. 2002, 478, 344–345. [Google Scholar] [CrossRef]
  7. Tu, Y.; Yeoh, G.H.; Liu, C. Computational Fluid Dynamics—A Practical Approach, 2nd ed.; Elsevier: Oxford, UK, 2013. [Google Scholar]
  8. Ansar, M.; Nakato, T. Experimental study of 3D pump-intake flows with and without cross flow. J. Hydraul. Eng. 2001, 127, 825–834. [Google Scholar] [CrossRef]
  9. Aubin, J.; Fletcher, D.F.; Xuereb, C. Modeling turbulent flow in stirred tanks with CFD: The influence of the modeling approach, turbulence model and numerical scheme. Exp. Therm. Fluid Sci. 2004, 28, 431–445. [Google Scholar] [CrossRef]
  10. Chen, H.-x.; Guo, J.-h. Numerical simulation of 3-D turbulent flow in the multi-intakes sump of the pump station. J. Hydrodyn. 2007, 19, 42–47. [Google Scholar] [CrossRef]
  11. Zi, D.; Wang, F.; Yao, Z.; Hou, Y.; Yang, E. Effects analysis on rectifying intake flow field for large scale pumping station with combined diversion piers. Nongye Gongcheng Xuebao Trans. Chin. Soc. Agric. Eng. 2015, 31, 71–77. [Google Scholar]
  12. Zi, D.; Wang, F.; Tao, R.; Hou, Y. Research for impacts of boundary layer grid scale on flow field simulation results in pumping station. J. Hydraul. Eng. 2016, 47, 139–149. [Google Scholar]
  13. Zi, D.; Wang, B.; Wang, F.; He, C.; Xue, S. Influences of start-up pump units on the sediment concentration for the intake system of a pumping station. Trans. Chin. Soc. Agric. Eng. 2022, 38, 59–68. [Google Scholar]
  14. Gao, X.; Tian, Y.; Sun, B. Multi-objective optimization design of bidirectional flow passage components using RSM and NSGA II: A case study of inlet/outlet diffusion segment in pumped storage power station. Renew. Energy 2017, 115, 999–1013. [Google Scholar] [CrossRef]
  15. Balachandar, S.; Eaton, J.K. Turbulent dispersed multiphase flow. Annu. Rev. Fluid Mech. 2010, 42, 111–133. [Google Scholar] [CrossRef]
  16. Li, L.; Xu, W.; Tan, Y.; Yang, Y.; Yang, J.; Tan, D. Fluid-induced vibration evolution mechanism of multiphase free sink vortex and the multi-source vibration sensing method. Mech. Syst. Signal Process. 2023, 189, 110058. [Google Scholar] [CrossRef]
  17. Song, X.; Wang, Z.; Saksala, T.; Borisov, V.G.; Zakharov, Y.N.; Shokin, Y.I.; Ovcharenko, E.A.; Klyshnikov, K.Y.; Ren, Z.; Wan, D. Numerical prediction of the effect of free surface vortex air-entrainment on sediment erosion in a pump. Proc. Inst. Mech. Eng. Part A J. Power Energy 2022, 236, 1297–1308. [Google Scholar] [CrossRef]
  18. Hou, X.; Yuan, J.; Fu, Y.; Lu, R.; Shi, J.; Zhang, P. A study on the dynamic characteristics of surface suction vortices in an open inlet pool. Phys. Fluids 2023, 35, 065108. [Google Scholar] [CrossRef]
  19. Xu, C.; Li, J.; Wang, R.; Tian, J.; Liu, Z.; Wang, Y.; Xu, X. Study on the influence of the start-up combinations on the characteristics of the water-sediment flow field in forebay of pumping station. J. Hohai Univ. Nat. Sci. 2022, 50, 11–16. [Google Scholar]
  20. Xu, C.; Wang, R.; Liu, H.; Lian, H.; Wang, Y.; Wang, G. Research on the influence of start-up combinations on the flow pattern in forebay of side-inlet pumping station on sandy river. J. Hydraul. Eng. 2020, 51, 92–101. [Google Scholar]
  21. Xu, C.; Tian, J.; Liu, Z.; Wang, R.; Wang, G. Three-dimensional reverse modeling and hydraulic analysis of the intake structure of pumping stations on sediment-laden rivers. Water Resour. Manag. 2023, 37, 537–555. [Google Scholar] [CrossRef]
  22. Li, X.; Chen, H.; Chen, B.; Luo, X.; Yang, B.; Zhu, Z. Investigation of flow pattern and hydraulic performance of a centrifugal pump impeller through the PIV method. Renew. Energy 2020, 162, 561–574. [Google Scholar] [CrossRef]
  23. Li, W.; Zhou, L.; Shi, W.-d.; Ji, L.; Yang, Y.; Zhao, X. PIV experiment of the unsteady flow field in mixed-flow pump under part loading condition. Exp. Therm. Fluid Sci. 2017, 83, 191–199. [Google Scholar] [CrossRef]
  24. Song, Q.; Sun, B.; Gao, X.; Zhang, C. PIV experimental investigation of the outflow temperature from nonlinearly stratified reservoir regulated by floating intake. Exp. Therm. Fluid Sci. 2019, 109, 109893. [Google Scholar] [CrossRef]
  25. Song, X.; Liu, C. Experimental study of the floor-attached vortices in pump sump using V3V. Renew. Energy 2021, 164, 752–766. [Google Scholar] [CrossRef]
  26. Zhang, B.; Yang, A.; Cheng, L.; Jiao, W.; Chen, Y.; Zhao, H. Spatial-temporal evolution and pressure fluctuation characteristics of the combined submerged vortex in a closed pump sump. Phys. Fluids 2023, 35, 065140. [Google Scholar] [CrossRef]
  27. Gao, M.; Cheng, L. Study on cascade density of the impeller based on response surface analysis. Water 2023, 15, 4101. [Google Scholar] [CrossRef]
  28. Zheng, X.; Zhang, P.; Zhang, W.; Yu, Y.; Zhao, Y. Numerical study on the influence of combined rectification facilities on the flow in the forebay of fumping station. Water 2023, 15, 3847. [Google Scholar] [CrossRef]
  29. Nasr, A.; Yang, F.; Zhang, Y.; Wang, T.; Hassan, M. Analysis of the flow pattern and flow rectification measures of the side-intake forebay in a multi-unit pumping station. Water 2021, 13, 2025. [Google Scholar] [CrossRef]
  30. Muramatsu, E.; Murakawa, H.; Hashiguchi, D.; Sugimoto, K.; Asano, H.; Wada, S.; Furuichi, N. Applicability of hybrid ultrasonic flow meter for wide-range flow-rate under distorted velocity profile conditions. Exp. Therm. Fluid Sci. 2018, 94, 49–58. [Google Scholar] [CrossRef]
  31. Tan, C.; Murai, Y.; Liu, W.; Tasaka, Y.; Dong, F.; Takeda, Y. Ultrasonic doppler technique for application to multiphase flows: A review. Int. J. Multiph. Flow 2021, 144, 103811. [Google Scholar] [CrossRef]
  32. Wang, H. The Study of the Key Techniques in the Realization of Integrated Engineering Survey System in South-to-North Water Diversion Project. Ph.D. Thesis, Wuhan University, Wuhan, China, 2016. [Google Scholar]
  33. Trebuňa, P.; Mizerák, M.; Trojan, J.; Rosocha, L.J.A.T. 3D scanning as a modern technology for creating 3D models. Acta Tecnol 2020, 6, 21–24. [Google Scholar] [CrossRef]
  34. Aryan, A.; Bosche, F.; Tang, P. Planning for terrestrial laser scanning in construction: A review. Autom. Constr. 2021, 125, 103551. [Google Scholar] [CrossRef]
  35. Dimas, E.; Briassoulis, D. 3D geometric modelling based on NURBS: A review. Adv. Eng. Softw. 1999, 30, 741–751. [Google Scholar] [CrossRef]
  36. Park, H. An approximate lofting approach for B-spline surface fitting to functional surfaces. Int. J. Adv. Manuf. Technol. 2001, 18, 474–482. [Google Scholar] [CrossRef]
  37. Date, A.W. Introduction to Computational Fluid Dynamics; Cambridge University Press: Cambridge, UK, 2005; pp. 273–283. [Google Scholar]
  38. Versteeg, H.K.; Malalasekera, W. An Introduction to Computational Fluid Dynamics; Pearson Schweiz Ag: Cham, Switzerland, 2007; Volume 20, 400p. [Google Scholar]
  39. Ansys Inc. ANSYS Fluent Theory Guide; Ansys Inc.: Canonsburg, PA, USA, 2013. [Google Scholar]
  40. Manninen, M.; Taivassalo, V.; Kallio, S. Mixture Model for Multiphase Flow; Technical Report VTT-PUB-288; Technical Research Centre of Finland: Espoo, Finland, 1996. [Google Scholar]
  41. Wulf, A.; Akdag, V. Tuned grid generation with ICEM CFD. In Surface Modeling Grig Generation, and Related Issues in Computational Fluid Dynamic (CFD) Solutions; NASA: Washington, DC, USA, 1995. [Google Scholar]
  42. Hodson, T.O. Root-mean-square error (RMSE) or mean absolute error (MAE): When to use them or not. Geosci. Model Dev. 2022, 15, 5481–5487. [Google Scholar] [CrossRef]
  43. Karunasingha, D.S.K. Root mean square error or mean absolute error? Use their ratio as well. Inf. Sci. 2022, 585, 609–629. [Google Scholar] [CrossRef]
Figure 1. Site investigation of the actual intake structure. (a) Sedimentation morphology, (b) Adverse flow patterns.
Water 16 00779 g001
Figure 2. Schematic of structure and characteristic sections.
Water 16 00779 g002
Figure 3. Field and instrument for flow field measurement.
Water 16 00779 g003
Figure 4. Leica P30 ground non-contact laser scanner. (a) The schematic of field operation, (b) Composition and principle of the instrument.
Water 16 00779 g004
Figure 5. The original point cloud model.
Water 16 00779 g005
Figure 6. Complete computational domain model.
Water 16 00779 g006
Figure 7. Schematic of the boundary conditions and grid division.
Water 16 00779 g007
Figure 8. Comparison of flow velocity values at test points on lX5-Z1.
Water 16 00779 g008
Figure 9. Cloud and vector plots of flow velocity distribution at section Z3 (Case1, Case3).
Water 16 00779 g009
Figure 10. Cloud and vector plots of flow velocity distribution in section Z3 (Case2, Case9, Case10).
Water 16 00779 g010
Figure 11. Distribution diagram of X axis average flow velocity in section X3.
Water 16 00779 g011
Figure 12. Distribution of sediment volume fraction near the bottom (Case2, Case3, Case9, Case10).
Water 16 00779 g012
Figure 13. Cloud and vector plots of flow velocity distribution in section Z3 (Case4~Case8).
Water 16 00779 g013
Figure 14. Distribution of sediment volume fraction near the bottom (Case4~Case8).
Water 16 00779 g014
Table 1. Screening results of sediment particle size.
Sieve Hole Size
(μm)
Sieve Residue
(%)
Cumulative Sieve Residue
(%)
60000
30000
1500.010.01
1250.030.04
901.231.27
754.826.09
635.8711.66
456.2921.35
Sieve bottom81.75100
Table 2. Design schemes for different working conditions.
No.CSf (kg/m3)Q (m3/s)Operation Combination
Case106.0#5 (1.6 m3/s); #2, 3, 4, 6, 7 (0.88 m3/s)
Case2156.0Same as case1
Case3306.0Same as case1
Case4306.0#5 (1.6 m³/s); #1, 3, 4, 6, 8 (0.88 m3/s)
Case5306.0#5 (1.6 m³/s); #1, 2, 3, 7, 8 (0.88 m3/s)
Case6305.28#1, 2, 3, 5, 7, 8# (0.88 m3/s)
Case7307.44#2, 3, 7 (0.88 m3/s); #1, 5, 8 (1.6 m³/s)
Case8308.88#3 (0.88 m³/s); #1, 2, 5, 7, 8 (1.6 m³/s)
Case9506.0Same as case1
Case10706.0Same as case1
Disclaimer/Publisher’s Note: The statements, opinions and data contained in all publications are solely those of the individual author(s) and contributor(s) and not of MDPI and/or the editor(s). MDPI and/or the editor(s) disclaim responsibility for any injury to people or property resulting from any ideas, methods, instructions or products referred to in the content.

