
Simulated Changes in Seasonal and Low Flows with Climate Change for Irish Catchments


Irish Climate Analysis and Research UnitS (ICARUS), Department of Geography, Maynooth University, W23 F2K8 Kildare, Ireland
*
Author to whom correspondence should be addressed.
Water 2022, 14(10), 1556; https://doi.org/10.3390/w14101556
Submission received: 14 March 2022
/
Revised: 6 May 2022
/
Accepted: 10 May 2022
/
Published: 12 May 2022
(This article belongs to the Section Water and Climate Change)
Abstract
:We assess changes in the seasonal mean and annual low flows (Q95) for 37 catchments across the Republic of Ireland. Two hydrological models (SMART and GR4J) are trained and evaluated for their ability to capture key hydrological signatures from observations before being forced with bias corrected outputs from 12 Earth System Models from the CMIP6 ensemble. Projected changes are derived for three shared socio-economic pathways (SSP126, SSP370 and SSP585) for the 2020s, 2050s, and 2080s. The results show a wide range of change in all metrics across the catchment sample. While even the direction of change is highly uncertain in spring and autumn, there is a tendency towards increased flows in winter and reduced flows in summer, together with large reductions in annual low flows. Under SSP370, the median reduction in summer flows across catchments for the 2080s simulated by GR4J is −21.3 percent (90 percent CI: 4.8 to −36.9 percent). For Q95, for the 2080s, GR4J returns a median reduction of −20.9 percent (90 percent CI: −2.5 to −38.2 percent), while SMART suggests a median reduction of −21.2 percent (90 percent CI: −6.0 to −36.9 percent). Such changes would pose significant challenges for water management, requiring significant adaptation. Notably, for low flows in particular, significant reductions in emissions under SSP126 result in more moderate future changes, indicating the importance of both adaptation and mitigation to sustainable water management.
1. Introduction
Climate change, through changes in precipitation and evapotranspiration, is expected to lead to alterations in the flow regime of catchments [1]. Understanding plausible projected changes is fundamental to adaptation in the water sector, with impacts having implications for water resource management [2], hydro power [3], aquatic ecosystems [4], and economic activity. The assessment of climate change impacts on catchment hydrology tends to follow a modelling chain that begins by downscaling/bias correcting climate model projections forced with future emissions scenarios to the catchment scale and then using these projections to force hydrological models to evaluate future changes relative to a reference period representing current conditions [5].
In Ireland, despite evident vulnerability across sectors to recent drought events in summer 2018 [6] and spring 2020, together with significant pressure on water supply systems, the aging infrastructure, and the little or no spare capacity to meet existing water demand in certain parts of the country [7], relatively little work has been conducted to evaluate future changes in mean and low river flows. Research has tended to focus on high flows and changes in floods [8,9]. Two published studies by Charlton et al. [10] and Steele Dunne et al. [11] are exceptions. Charlton et al. [10] employed a statistically downscaled output from HadCM3 under the Special Report on Emissions Scenarios (SRES) A1 emissions scenario to force a hydrological model for 10 km × 10 km grid cells over Ireland for a baseline (1961–1990) and two future time periods (2041–2070 and 2061–2090). Their results suggest decreases in the annual runoff, most markedly in the east and southeast of the country, with reductions particularly marked during summer in these regions.
Taking a catchment-based approach, Steele-Dunne et al. [11] employed precipitation and temperature projections from the ECHAM5 General Circulation Model, forced using the Special Report on Emissions Scenarios (SRES) A1B scenario, and downscaled with the Rossby Centre Atmosphere Model (RCA3) regional climate model to force the HBV light hydrological model to evaluate changes in the flow regimes of nine catchments. Their results suggest an amplification of the seasonal cycle of precipitation across the island for the 2021–2060 period with increases (decreases) in winter (summer) precipitation and increased temperatures in all seasons. Increases in streamflow of up to 20 percent for the months of October to April (winter half year) and decreases in flow of up to 60 percent during the months of May to September (summer half year) were simulated. However, both these studies only used a single climate model and are likely to have underestimated the range of plausible changes from the larger ensemble of models now available. Moreover, both studies were based on a single SRES emissions scenario that under-represented the range of plausible future emissions and has subsequently been replaced by Representative Concentration Pathways (RCPs) and, more recently, by the Shared Socioeconomic Pathways (SSPs). In addition, neither study evaluated the uncertainty due to the hydrological model structure.
Given the above vulnerabilities and research gaps, this study aimed to provide an updated assessment of the impacts of climate change on the seasonal means and low flows of 37 Irish catchments. In doing so, we attempted to better represent the plausible ranges of future change by employing 12 Earth System Models (ESMs) that comprise the recently available Coupled Model Intercomparison Project Phase 6 [12] ensemble forced using three SSP scenarios (SSP126, SSP370 and SSP585). Changes in future flow regimes were evaluated using two structurally different conceptual hydrological models.
2. Materials and Methods
2.1. Hydroclimatic Indices and Catchments
We assess future changes in seasonal (winter [DJF], spring [MAM], summer [JJA], autumn [SON]) mean and annual low flows (Q95; the flow exceeded 95 percent of the time) for 37 catchments across the Republic of Ireland, selected to be broadly representative of the range of catchment types present. Figure 1 shows the distribution of the catchments, while Table S1 (Supplementary Information) shows the key characteristics of the catchment sample calculated for the 1976–2005 period, including the catchment area, mean discharge (Q), mean precipitation (P), and the Q to P ratio, which is indicative of the catchment storage effects. The average catchment area was 737.8 km2, with the smallest catchment being 11 km2 and the largest being 2418 km2.
For each catchment, the gridded (1 km × 1 km) daily precipitation and temperature data [13] area averaged for the 1976–2005 period were used to derive inputs for hydrological models and to provide a representative reference series for bias correction (see below). The Daily Potential Evapotranspiration (PET) was derived from the air temperature data using the method of Oudin et al. [14]. While Penman–Monteith based estimates of PET are available for some stations in Ireland, they are not available for most catchments, nor are the datasets required as inputs extensive (e.g., wind speed, humidity). For training and verification, daily discharge data from the hydrological models for each catchment for the 1976–2015 period were obtained from the relevant hydrometric agencies, namely the Office of Public Works (https://waterlevel.ie/hydro-data/ accessed on 11 March 2022) and the Environmental Protection Agency (https://epawebapp.epa.ie/hydronet/#Water%20 Levels accessed on 11 March 2022).
2.2. Climate Models and Bias Correction
Daily precipitation and air temperature data for the 1976–2100 period were extracted for 12 members of the CMIP6 ensemble (see Table 1) forced by each of three Shared Socioeconomic Pathways (SSPs), including SSP126, SSP370, and SSP585. These SSPs represent a scenario of sustainability (SSP1), a rocky road marked by regional rivalry (SSP3), and a fossil-fuel-dependent future (SSP5), consistent with radiative forcing levels (watts per meter squared) analogous to RCP2.6, RCP7.0, and RCP8.5. For each catchment, daily precipitation and temperature data were extracted from the closest land-based GCM grid overlying the catchment centroid. Before using projections to force hydrological models, we bias-corrected the raw climate model output. Meresa et al. [9] compared the performances of five bias correction methods (change factor (CF), single gamma quantile mapping (SGQM), empirical quantile mapping (EQM), double gamma quantile mapping (DGQM), and Birnbaum–Sanders-based quantile mapping (BSM)) for Irish catchments, highlighting the good performance of double gamma quantile mapping in the reproduction of observed precipitation characteristics and the utility of the simpler empirical quantile mapping method for daily air temperature. Therefore, in this study, the DGQM method was used for the bias correction of daily precipitation climate projections. The gamma distribution was fitted to both the upper and lower 75th percentiles of the observed and simulated precipitation distributions. This helped to better capture the drizzle/low (dry) precipitation, and wet/intensity of precipitation days at the same time.
Bias correction was undertaken for the reference period 1976–2005. Based on the CDF of observed and simulated precipitation in the reference period (Po, 75th, Pb, 75th) and future period (Pfut, 75th), we derived two gamma parameter values (αo, βo) and used them to bias correct the raw model output. For the bias correction of temperature, we employed a simpler empirical quantile mapping method. Bias-corrected outputs from each of the 12 CMIP6 models employed were used to force hydrological models to assess changes in future seasonal and low flows under three SSP scenarios for three future time periods: the 2020s (2010–2039), the 2050s (2040–2069), and the 2080s (2070–2099).
Given concerns over the high climate sensitivity reported for some CMIP6 models [15], we also explored whether differences in simulated changes from these ESMs were discernable at the catchment scale. In Table 1, ESMs within our ensemble with high climate sensitivity are marked with an asterix. To discern whether ESMs with high climate sensitivity resulted in more/less severe projected changes, we visually assessed box plots of changes in winter and summer precipitation for the 2080s across all catchments under each SSP scenario.
2.3. Hydrological Models
We employed two structurally different lumped conceptual hydrological models to simulate future changes in catchment responses. Both models have been employed previously for climate change impact assessments in Ireland.
2.3.1. The GR4J Model
The GR4J (Génie Rural à 4 paramètres Journalier [16]) model is a parsimonious model that was developed as part of the airGR R hydrological modelling package [17]. It consists of four parameters (X1–X4) that describe the catchment water balance and routing. The model takes precipitation and potential evapotranspiration as inputs, with four parameters (X1–X4) describing the maximum soil moisture storage (mm) (X1), the groundwater exchange coefficient (mm) (X2), the maximum capacity of the routing store (mm) (X3), and the time to peak for the unit hydrograph or flow delay (days) (X4). Table 2 lists the parameters of the model and parameter ranges employed. The GR4J has been successfully applied in multiple Irish studies. Broderick et al. [8,18] demonstrated that the model performs well for a similar set of catchments to those employed here in terms of the temporal transition between contrasting climate periods and the reproduction of various hydrological signatures. The GR4J has also been used for flood [8,9] and low flow simulations [19] representing climate change, ensemble streamflow prediction [20], and predictions of ungauged conditions [21] in Irish catchments.
2.3.2. SMART Model
Our second model, the SMART model [22,23], is widely used in Ireland for water quality simulations [24], including those investigating climate change [25]. Taking precipitation and potential evapotranspiration as inputs, SMART consists of 10 parameters and represents five catchment flow pathways, each represented as a single linear reservoir, including overland flow, drain flow, interflow, shallow, and deep groundwater flow. As described by Hallouin et al. [24], soil moisture accounting is determined by whether conditions are energy-limited (PET < P) or water-limited (PET > P). In the former, effective precipitation is derived by applying a scaling correction (θT) and subtracting any direct evaporation. The parameter θH determines any direct surface runoff. The remaining surplus precipitation infiltrates into the soil, represented by six layers with a total moisture capacity of θZ. Once the moisture-holding capacity of a layer is exceeded, surplus moisture percolates downwards to a deeper layer if it has capacity; otherwise, it is intercepted by drains or eventually moves to shallow or deep groundwater stores. When PET > P, the model meets demands by evaporation from the soil layers, starting at the first layer and incrementally moving to the lower layers. The parameter θC represents evaporation decay as layers dry up. The outputs of each flow path are routed through a single linear reservoir, representing river routing (θRK). Table 2 lists the parameters of the SMART model and the ranges for each used in this study. Further details on SMART and its development are provided by Mocker et al. [22,23] and Hallouin et al. [24].
2.4. Hydrological Model Calibration and Evaluation
The same approach to calibration was employed for both models. Using Latin Hypercube Sampling [26], 30,000 parameter sets were sampled with a uniform distribution representing each model parameter. The resultant parameter sets were then evaluated against observations for the 1990–2015 period in each catchment. The year 1989 was used for the model warm-up. Parameter sets were evaluated using the Nash–Sutcliffe Efficiency [27] criterion derived from the log of flows (logNSE) with the best 150 parameter sets retained. Additional performance criteria were also employed, including the Percent Bias (PBias) and the performance of the median simulation from both models in capturing hydrological signatures representative of the range of flow conditions, namely, the 5th, 50th, and 95th percentiles of the CDF of daily flows, together with the runoff coefficient, skewness, and coefficient of variation (CV) of the observed daily flows. The resultant median simulation of the retained parameter sets was also used to evaluate future changes in seasonal and low flows for each model.
3. Results
3.1. Bias Correction
The performance levels of the DGQM and EQM bias correction methods were evaluated using the mean monthly precipitation and temperature indices in the reference period, respectively. For precipitation, the raw climate model outputs tended to underestimate precipitation in most catchments. This was particularly the case for small catchments in the southwest and west (e.g., catchments 22035, 38001). Following the bias correction, considerable improvement in the replication of observed monthly and seasonal patterns of precipitation was evident (Figure 2). For temperature, the raw climate model output showed a tendency to overestimate temperature, especially in the winter months. Again, following the bias correction, there was considerable improvement in the consistency of the observed and simulated monthly mean temperatures for all catchments (Figure 3). Therefore, the corrected daily precipitation and temperature data were used to force the GR4J and SMART hydrological models.
3.2. Hydrological Model Performance
Figure 4 shows the performance of the median simulations for both hydrological models for each catchment in terms of logNSE, NSE, and PBIAS, together with the key hydrological signatures during the evaluation period (1990–2015). GR4J and SMART performed similarly for the majority of catchments, with logNSE scores ranging from 0.50 to 0.94. For some catchments, GR4J performed better than SMART (e.g., catchments 07009, 23002 and 38001), while for others, the reverse was the case (e.g., catchments 06014, 26021 and 34001). Catchment 15003 was poorly simulated by GR4J (logNSE < 0.6), while catchment 38001 was poorly simulated by SMART, with both models performing poorly for catchment 26058. Lower logNSE scores tended to be associated with smaller catchments (e.g., catchment 26058 (60 km2), catchment 33001 (76 km2), catchment 38001 (111 km2)). For NSE, SMART marginally outperformed GR4J for most catchments, while for PBIAS, some large biases were evident for GR4J in catchments 24008 and 24030 and for SMART in catchment 27002. It was difficult to distinguish a consistently better model from the reproduction of hydrological signatures, with both models producing good results in terms of replicating the runoff coefficient and the percentiles of the CDF of daily flows (Figure 4) across catchments. This is particularly reassuring for the mean and low flows, given the focus of this study. Both models were less successful at capturing the skewness of observations. In terms of the CV, there were differences between models across the sample, with SMART showing a tendency to underestimate and GR4J a tendency to overestimate CV for some catchments.
3.3. Projected Changes in Seasonal Flows
Bias-corrected projections of precipitation and PET (derived from bias-corrected temperature using the method of Oudin et al. [14]) were used to force both hydrological models for three future time periods (2020s: 2010–2039; 2050s: 2040–2069; 2080s: 2070–2099) under three different SSPs (SSP126, SSP370, and SSP585). Percent changes in seasonal flows in each future period were derived relative to the baseline period 1976–2005. Projected changes for each SSP included the uncertainty derived from 12 CMIP6 ESMs and the hydrological model structure (GR4J and SMART). Below, we summarize changes in seasonal flows across the catchment sample for each SSP. The median percent changes for each catchment/season/SSP/hydrological model, together with 90 percent confidence intervals (henceforth CI), are provided as look-up tables in the Supplementary Information of which interested readers/end users can examine results for any catchment.
3.3.1. SSP126 Sustainable Future
Figure 5 shows the percent change in seasonal flows under SSP126 for each catchment, as simulated by GR4J and SMART. For all seasons, there was no clear direction of change, with model simulations spanning zero. Median changes across all catchments were similar for GR4J and SMART for the 2020s and 2050s. However, ranges of change were considerably greater for the SMART model. The largest increases in winter flows were simulated by SMART for the 2080s, with a median increase of 12.6 percent across all catchments (CI: 53.3 to 0.2 percent). Increases in winter flows for the 2080s for GR4J showed a median increase of 4.9 percent across all catchments (CI: 21.1 to −4.7 percent). GR4J tended to predict decreases for spring flows, while SMART tended to predict increases. For example, for the 2080s, GR4J simulated a median reduction of −10.3 percent across all catchments (CI: 1.4 to −19.9 percent), while SMART simulated a median increase of 4.4 percent (CI: 38.3 to −10.9 percent). The ranges of change were the largest for the SMART model. For the summer mean flows, the direction of change was again uncertain for all future time periods. For the 2080s, the median change in summer flows across all catchments was 1.8 percent (CI: 30.5 to −17.1 percent) for GR4J and −12.5 percent (CI: 38.2 to −34.8 percent) for SMART. Finally, for autumn, GR4J tended to show increases in flow, while SMART tended to show decreases. The median SON change simulated across catchments by GR4J for the 2080s was 18.2 percent (CI: 42.1 to −1.1 percent), while for SMART, a median change of −1.7 percent (CI: 34.7 to −25.5 percent) was simulated. For both hydrological models, projected increases/decreases in each season became progressively larger when moving from the early to the mid to late century.
3.3.2. SSP370 Rocky Road
Figure 6 shows the percent changes in seasonal flows under SSP370 for each catchment, as simulated by GR4J and SMART. The largest increases in winter flows were projected by the SMART model, with a median increase of 13.4 percent by the 2080s (CI: 32.2 to 2.9 percent). For winter in the 2080s, GR4J simulated a median increase of 6.9 percent (CI: 23.1 to −1.8 percent). In spring, while the simulation span increased and decreased, the median change for GR4J tended to show decreases in flow in each future time period, while SMART tended to show increases. For the 2080s, GR4J returned a median decrease of −6.0 percent (CI: 5.6 to −23.6 percent), while SMART returned a median increase of 2.3 percent (CI: 19.6 to −9.0 percent) for spring flows. For summer, projected changes from both hydrological models again spanned increases and decreases. However, GR4J projected the most substantial decreases in summer flows, with a median reduction of −21.3 percent (CI: 4.8 to −36.9 percent) by the 2080s. The equivalent prediction for SMART was −17.9 percent (CI: 11.4 to −38.6 percent). For both hydrological models, summer changes became increasingly negative, moving from the 2020s to the 2080s. In autumn, the median simulation from each model suggested modest increases in flows for the 2050s and 2080s; however, the ranges of change were large. For the 2080s, GR4J returned a median increase of 8.4 percent (CI: 32.5 to −8.5 percent), while SMART returned a median increase of 2.3 percent (CI: 29.9 to −12.6 percent). As for SSP126, increases/decreases under SSP370 became progressively greater over time.
3.3.3. SSP585 Fossil Fuel Intensive
Figure 7 shows the percent change in seasonal flows under the fossil-fuel-intensive SSP585 for each catchment, as simulated by GR4J and SMART. Again, the largest median increase in winter flows weas simulated by SMART for the 2080s (median 13.4 percent; CI: 28.6 to 5.5 percent). The equivalent for GR4J was a median increase of 8.5 percent (CI: 29.6 to 0.1 percent). For both models the range of changes shifted to the right (increases) with progression of the century. In spring, both hydrological models spanned increases and decreases, with median changes from GR4J suggesting progressively decreasing flows as the century progresses (2080s median −10.8 percent; CI: 8.6 to −20.9 percent), while SMART showed increases (2080s median 4.9 percent; CI: 19.2 to −15.4 percent). For summer, progressively larger decreases in flow were simulated with progression of the century. Reductions were typically greatest for the GR4J model with a median reduction in JJA flows of −25.0 percent by the 2080s (CI: −3.2 to −43.3 percent). SMART reductions in JJA flows were more modest, but still substantial, with a median reduction of −10.8 percent simulated for the 2080s (CI: 12.0 to −35.1 percent). The autumn results from both models spanned sign changes, with median simulations from both models tending towards increases in SON mean flows. For the 2080s, SMART returned a median increase of 1.8 percent (CI: 28.9 to −12.7 percent). GR4J showed a median increase of 5.2 percent (CI: 30.2 to −11.0 percent) for the same time period.
3.4. Projected Changes in Low Flows
Changes in annual low flows were evaluated using Q95, the flow exceeded 95 percent of the time during the reference period. Again, we summarize changes across the catchment sample, with median changes and 90 percent confidence intervals for each catchment/SSP/hydrological model provided in the Supplementary Information. Figure 8 presents the changes in Q95 for each future time period under SSP126, SSP370, and SSP585 for GR4J and SMART. For SSP126, the direction of change in low flows was found to be uncertain, spanning positive and negative changes. For GR4J, median reductions in Q95 of −3.4, −6.0, and −1.7 percent were simulated for the 2020s, 2050s, and 2080s across the catchment sample. However, the range of changes was large with 90 percent confidence intervals spanning 17.0 to −16.8 percent for the 2020s, 18.7 to −23.3 percent for the 2050s, and 19.2 to −18.5 percent for the 2080s. Similar results were obtained with the SMART model, with slightly greater reductions in Q95 for the 2080s (median −5.0 percent; CI: 15.8 to −23.3 percent).
For SSP370 and SSP585, simulated changes tended more towards reductions in Q95, especially for the middle and end of the century. For SSP370, for the 2080s, GR4J returned a median reduction of −20.9 percent in Q95 (CI: −2.5 to −38.2 percent), while SMART suggested a median reduction of −21.2 percent (CI: −6.0 to −36.9 percent). Unlike SSP126, where changes in low flows are not predicted to become more severe from the 2050s to the 2080s, under SSP370, a progressive reduction in low flows moving through the century was predicted. SSP585 showed the most severe reductions. For the 2050s, GR4J returned a median reduction in Q95 of −17.7 percent across catchments (CI: 1.9 to −35.2 percent), while SMART returned a median reduction of −18.1 percent (CI: 3.2 to −31.5 percent). By the 2080s, reductions were predicted to be more severe by both hydrological models. GR4J returned a median reduction of −23.2 percent (CI: −5.4 to −45.0 percent), while SMART returned a median reduction of −25.5 percent (CI: −6.1 to −41.8 percent).
3.5. Avoided Impacts from Mitigation
To further explore the differences in simulated impacts for the three SSPs considered, we examine the median changes simulated for seasonal and low flows across the catchment sample for the 2080s, assuming that differences between SSPs would be the greatest at this time. The results give an indication of the impacts avoided by greenhouse gas mitigation. From Figure 9, the largest differences between SSPs are evident for the annual Q95 low flows. For both SMART and GR4J, SSP126 resulted in more modest changes in low flows in comparison with SSP370 and SSP585, indicating the importance of mitigation efforts in avoiding the most extreme impacts. For seasonal mean flows, the differences between outcomes for various SSPs were less clear cut, with results depending on which hydrological model was employed. For example, for GR4J, clear differences were shown between the more modest impacts of SSP126 for summer mean flows and the more extreme changes simulated by the more fossil-fuel-intensive SSP370 and SSP585. However, this was not the case for SMART, where there was large overlap in the simulated median changes for each SSP in summer. This finding highlights the importance of hydrological model structural uncertainty in assessing avoided impacts due to mitigation. For both hydrological models, it was difficult to discern differences in impacts between SSPs for winter mean flows, with both models showing large overlap in projected changes across different SSPs.
3.6. ESMs with High Climate Sensitivity
To examine whether ESMs with high climate sensitivity show different results from others in our ensemble, simulated changes in winter and summer precipitation for the 2080s across our catchment sample for each SSP are shown in Figure 10. ESM abbreviations corresponding to high-sensitivity ESMs are marked with an asterix on the plot (see also Table 1). High-sensitivity ESMs do not appear to show systematic differences in simulated precipitation at the catchment scale, typically falling within the range of change simulated by other ensemble members. Similar results (not shown) were found for seasonal and low flow simulations with no obvious evidence that high-sensitivity ESMs produce results outside of the range of other ensemble members.
4. Discussion
This study evaluated simulated changes in seasonal mean and low flows for 37 Irish catchments under climate change pressure. Changes in hydrological response were derived from an ensemble of 12 Earth System Models from the CMIP6 archive, forced using three SSP scenarios (SSP126, SSP370 and SSP585). Projected changes in precipitation (bias corrected to the catchment scale using Double Gamma Quantile Mapping (DGQM)) and potential evapotranspiration (derived using the Oudin method from temperature projections, bias corrected to the catchment scale using Empirical Quantile Mapping (EQM)) were used to force two hydrological models to examine changes for the 2020s, 2050s, and 2080s relative to the baseline period of 1976–2005. Below we summarize the key results, implications, limitations, and possible directions for future work.
The results presented represent the most comprehensive assessment of the impacts of climate change on the mean and low flows in Ireland to date, extending previous analyses by Charlton et al. [10] and Steele Dunne et al. [11]. Key advances include the consideration of multiple catchments, climate models, SSPs, and hydrological models. Previous research has indicated the importance of including hydrological model uncertainties in assessments of future flows [28,29]. While this work included increased consideration of key components of the modeling chain in climate change impact assessments [30], it is not exhaustive. For instance, we did not include an assessment of hydrological model parameter uncertainty [31], nor did we use different downscaling or bias correction techniques [9]. We also assumed that the parameter sets derived to run our hydrological models would be transferable to future climates [18]. Our focus was on exploring projected changes from the CMIP6 archive, associated SSPs, and the hydrological model structure. Future work should attempt to expand the consideration of uncertainties considered here to further inform the plausible ranges of change that might be expected with climate change. Alternative approaches to the estimation of PET should also be considered. We also note the some of the catchments analyzed are small (<100 km2) and that future work should evaluate the impact of climate model resolution on simulated changes for such catchments.
Projected changes in seasonal and mean flows showed a wide range of plausible changes. For most seasons, the direction of change in mean flows is uncertain with ensemble members spanning positive and negative changes. However, the overall distribution of changes derived suggests increases in winter flows and decreases in summer flows. These findings are broadly consistent with the earlier studies outlined above and with recent studies in Northern Ireland [32], where large reductions in low flows were identified in simulations driven by the UKCP18 regional climate projections. For the shoulder seasons of spring and autumn, the overall direction of change is more uncertain. Given the lack of resilience in water supply systems in Ireland [7], the projected changes would have significant implications and require substantial adaptation effort. This is particularly the case for SSP370 and SSP585 by the 2050s and 2080s, where increases in winter flows and, in particular, decreases in summer flows could prove problematic for water resources management, freshwater ecosystems, and water quality. Substantial reductions in low flows (annual Q95) are also projected for the 2050s and 2080s across catchments, which would also prove problematic for a range of sectors. Importantly, our results show that reducing greenhouse gas emissions trajectories will have a large impact on the magnitude of reductions in summer flows (as simulated by the GR4J model) and low flows (from both hydrological models), whereas reductions under SSP126 for the 2080s were shown to be more modest in comparison to more fossil-fuel-intensive scenarios.
There were notable differences in the changes simulated by both hydrological models employed. Increases in winter led flows to be greatest for the SMART model, while reductions in summer and low flows tended to be greater for GR4J. In spring, SMART/GR4J tended towards modest increases/decreases; however, the ranges of change were large. The opposite was the case for autumn mean flows. Overall, the SMART model tended to result in a slightly larger spread of projected future impacts, which may be related to the added complexity of the model in terms of number of parameters relative to GR4J. The analysis of both models during verification showed similar performance levels across catchments with both models able to successfully simulate key hydrological signatures across the range of flow conditions. These results emphasize the importance of including different hydrological model structures in the assessment of climate change impacts [33,34].
The projected changes derived here will be of utility for informing adaptation in the water sector [35] including for water resource management, water quality assessments, freshwater ecosystem management, and implementation of the Water Framework Directive. While median changes are provided in the analysis, it is important that decision makers account for the full range of plausible changes simulated to ensure the development of robust adaptation strategies [36]. In addition to traditional top-down impact assessments, the results derived could feed into the development of storylines to inform adaptation planning [37], while the range of changes may be used to stress test adaptation options [35,38,39,40]. To assist in this process, detailed tables of projected changes for each catchment, SSP, and hydrological model are provided as part of the Supplementary Information. While this work sampled 37 catchments, future work could expand the range of catchments analyzed and further explore whether catchment characteristics (e.g., predominant landcover types, soil types, geology, baseflow etc.) play roles in modifying the response of catchments to climate change. It may also be possible to develop an emulator of climate change impacts [41] for mean and low flows from the results derived here, which could be used to (1) expand the uncertainty space sampled and (2) allow the development of results for ungauged catchments where observations are not available to train hydrological models.
5. Conclusions
The impacts of climate change were simulated for 37 catchments across the Republic of Ireland derived from 12 Earth System Models from the CMIP6 ensemble, forced with three shared socioeconomic pathways (SSP126, SSP370, SSP585). To integrate the uncertainty in future impacts due to hydrological model structure, we employed two conceptual, lumped hydrological models (SMART and GR4J). The results show wide ranges of plausible changes in the seasonal mean and low flows with increases in the winter mean flows and large reductions in the summer mean flows and annual low flows (Q95) for both SMART and GR4J for higher emissions pathways (SSP370 and SSP585). Notably, it is evident that more modest reductions in the summer mean and low flows can occur by the mid to end of the century if ambitious mitigation reductions can be achieved (SSP126). For spring and autumn, large ranges of change are evident, but the direction of change is unclear. We found little evidence that CMIP6 ESMs with high climate sensitivity produce simulated changes in precipitation outside the range of other ensemble members at the catchment scale. The derived projections will be useful for informing adaptation planning in the water sector.
Supplementary Materials
The following supporting information can be downloaded at: https://www.mdpi.com/article/10.3390/w14101556/s1, Table S1: List of 37 catchments with their drainage area, mean daily discharge (Qmean), mean daily precipitation (Pmean), and discharge to precipitation ratio (Q-to-P ratio) for the period 1976–2005; Table S2: Median and 90 percent confidence interval of projected changes (percent) in seasonal flows simulated for each catchment using the SMART hydrological model for each future time period and SSP; Table S3: Median and 90 percent confidence interval of projected changes (percent) in seasonal flows simulated for each catchment using the GR4J hydrological model for each future time period and SSP; Table S4: Median and 90 percent confidence interval of projected changes (percent) in annual Q95 low flows for each catchment using the SMART hydrological model for each future time period and SSP. Table S5: Median and 90 percent confidence interval of projected changes (percent) in annual Q95 low flows for each catchment using the GR4J hydrological model for each future time period and SSP.
Author Contributions
Conceptualization, H.M. and C.M.; Formal analysis, H.M., S.D. and C.M.; Funding acquisition, C.M.; Methodology, H.M. and S.D.; Supervision, C.M.; Writing—original draft, H.M., S.D., S.G. and C.M.; Writing—review & editing, H.M., S.D., S.G. and C.M. All authors have read and agreed to the published version of the manuscript.
Funding
This research was undertaken as part of the EPA funded project 2018-CCRP-MS.51: HydroPredict—Ensemble Riverflow Scenarios for Climate Change Adaptation.
Data Availability Statement
Data and materials are available from the corresponding author on request.
Acknowledgments
We acknowledge, with thanks, Met Éireann, The Office of Public Works (OPW) and The Environmental Protection Agency (EPA) for the provision of data.
Conflicts of Interest
The authors declare no conflict of interest.
References
- Kay, A.L. Simulation of river flow in Britain under climate change: Baseline performance and future seasonal changes. Hydrol. Process. 2021, 35, e14137. [Google Scholar] [CrossRef]
- Middelkoop, H.; Daamen, K.; Gellens, D.; Grabs, W.; Kwadijk, J.C.; Lang, H.; Parmet, B.W.; Schädler, B.; Schulla, J.; Wilke, K. Impact of climate change on hydrological regimes and water resources management in the Rhine basin. Clim. Chang. 2001, 49, 105–128. [Google Scholar] [CrossRef]
- Qin, P.; Xu, H.; Liu, M.; Du, L.; Xiao, C.; Liu, L.; Tarroja, B. Climate change impacts on Three Gorges Reservoir impoundment and hydropower generation. J. Hydrol. 2020, 580, 123922. [Google Scholar] [CrossRef]
- Whitehead, P.G.; Wilby, R.L.; Battarbee, R.W.; Kernan, M.; Wade, A.J. A review of the potential impacts of climate change on surface water quality. Hydrol. Sci. J. 2009, 54, 101–123. [Google Scholar] [CrossRef]
- Vetter, T.; Reinhardt, J.; Flörke, M.; Van Griensven, A.; Hattermann, F.; Huang, S.; Koch, H.; Pechlivanidis, I.G.; Plötner, S.; Seidou, O.; et al. Evaluation of sources of uncertainty in projected hydrological changes under climate change in 12 large-scale river basins. Clim. Chang. 2017, 141, 419–433. [Google Scholar] [CrossRef]
- Falzoi, S.; Gleeson, E.; Lambkin, K.; Zimmermann, J.; Marwaha, R.; O’Hara, R.; Green, S.; Fratianni, S. Analysis of the severe drought in Ireland in 2018. Weather 2019, 74, 368–373. [Google Scholar] [CrossRef] [Green Version]
- Kelly-Quinn, M.; Blacklocke, S.; Bruen, M.; Earle, R.; O’Neill, E.; O’Sullivan, J.; Purcell, P. Dublin Ireland: A city addressing challenging water supply, management, and governance issues. Ecol. Soc. 2014, 19, 10. [Google Scholar] [CrossRef] [Green Version]
- Broderick, C.; Murphy, C.; Wilby, R.L.; Matthews, T.; Prudhomme, C.; Adamson, M. Using a scenario-neutral framework to avoid potential maladaptation to future flood risk. Water Resour. Res. 2019, 55, 1079–1104. [Google Scholar] [CrossRef]
- Meresa, H.; Murphy, C.; Fealy, R.; Golian, S. Uncertainties and their interaction in flood hazard assessment with climate change. Hydrol. Earth Syst. Sci. 2021, 25, 5237–5257. [Google Scholar] [CrossRef]
- Charlton, R.; Fealy, R.; Moore, S.; Sweeney, J.; Murphy, C. Assessing the impact of climate change on water supply and flood hazard in Ireland using statistical downscaling and hydrological modelling techniques. Clim. Chang. 2006, 74, 475–491. [Google Scholar] [CrossRef]
- Steele-Dunne, S.; Lynch, P.; McGrath, R.; Semmler, T.; Wang, S.; Hanafin, J.; Nolan, P. The impacts of climate change on hydrology in Ireland. J. Hydrol. 2008, 356, 28–45. [Google Scholar] [CrossRef]
- O’Neill, B.C.; Tebaldi, C.; Vuuren, D.P.V.; Eyring, V.; Friedlingstein, P.; Hurtt, G.; Knutti, R.; Kriegler, E.; Lamarque, J.F.; Lowe, J.; et al. The scenario model intercomparison project (ScenarioMIP) for CMIP6. Geosci. Model Dev. 2016, 9, 3461–3482. [Google Scholar] [CrossRef] [Green Version]
- Walsh, S. A Summary of Climate Averages. The Irish Meteorological Service, 582. 2012. Available online: https://www.met.ie/climate-ireland/SummaryClimAvgs.pdf (accessed on 11 March 2022).
- Oudin, L.; Hervieu, F.; Michel, C.; Perrin, C.; Andréassian, V.; Anctil, F.; Loumagne, C. Which potential evapotranspiration input for a lumped rainfall–runoff model? Part 2—Towards a simple and efficient potential evapotranspiration model for rainfall–runoff modelling. J. Hydrol. 2005, 303, 290–306. [Google Scholar] [CrossRef]
- Zelinka, M.D.; Myers, T.A.; McCoy, D.T.; Po-Chedley, S.; Caldwell, P.M.; Ceppi, P.; Klein, S.A.; Taylor, K.E. Causes of higher climate sensitivity in CMIP6 models. Geophys. Res. Lett. 2020, 47, e2019GL085782. [Google Scholar] [CrossRef] [Green Version]
- Perrin, C.; Michel, C.; Andréassian, V. Improvement of a parsimonious model for streamflow simulation. J. Hydrol. 2003, 279, 275–289. [Google Scholar] [CrossRef]
- Coron, L.; Thirel, G.; Delaigue, O.; Perrin, C.; Andréassian, V. The suite of lumped GR hydrological models in an R package. Environ. Model. Softw. 2017, 94, 166–171. [Google Scholar] [CrossRef]
- Broderick, C.; Matthews, T.; Wilby, R.L.; Bastola, S.; Murphy, C. Transferability of hydrological models and ensemble averaging methods between contrasting climatic periods. Water Resour. Res. 2016, 52, 8343–8373. [Google Scholar] [CrossRef] [Green Version]
- Golian, S.; Murphy, C. Evaluation of Sub-Selection Methods for Assessing Climate Change Impacts on Low-Flow and Hydrological Drought Conditions. Water Resour. Manag. 2021, 35, 113–133. [Google Scholar] [CrossRef]
- Donegan, S.; Murphy, C.; Harrigan, S.; Broderick, C.; Foran Quinn, D.; Golian, S.; Knight, J.; Matthews, T.; Prudhomme, C.; Scaife, A.A.; et al. Conditioning ensemble streamflow prediction with the North Atlantic Oscillation improves skill at longer lead times. Hydrol. Earth Syst. Sci. 2021, 25, 4159–4183. [Google Scholar] [CrossRef]
- Golian, S.; Murphy, C.; Meresa, H. Regionalization of hydrological models for flow estimation in ungauged catchments in Ireland. J. Hydrol. Reg. Stud. 2021, 36, 100859. [Google Scholar] [CrossRef]
- Mockler, E.; Bruen, M.; Desta, M.; Misstear, B. Pathways Project Final Report Volume 4: Catchment Modelling Tool (No. 56). STRIVE Report. 2013. Available online: https://www.researchgate.net/publication/309104614_Pathways_Project_Final_Report_Volume_4_Catchment_Modelling_Tool (accessed on 11 March 2022).
- Mockler, E.M.; O’Loughlin, F.E.; Bruen, M. Understanding hydrological flow paths in conceptual catchment models using uncertainty and sensitivity analysis. Comput. Geosci. 2016, 90, 66–77. [Google Scholar] [CrossRef]
- Hallouin, T.; Bruen, M.; O’Loughlin, F.E. Calibration of hydrological models for ecologically relevant streamflow predictions: A trade-off between fitting well to data and estimating consistent parameter sets? Hydrol. Earth Syst. Sci. 2020, 24, 1031–1054. [Google Scholar] [CrossRef] [Green Version]
- O’Driscoll, C.; Ledesma, J.L.; Coll, J.; Murnane, J.G.; Nolan, P.; Mockler, E.M.; Futter, M.N.; Xiao, L.W. Minimal climate change impacts on natural organic matter forecasted for a potable water supply in Ireland. Sci. Total Environ. 2018, 630, 869–877. [Google Scholar] [CrossRef] [PubMed]
- Murphy, C.; Fealy, R.; Charlton, R.; Sweeney, J. The reliability of an ‘off-the-shelf’ conceptual rainfall runoff model for use in climate impact assessment: Uncertainty quantification using Latin hypercube sampling. Area 2006, 38, 65–78. [Google Scholar] [CrossRef] [Green Version]
- Nash, J.E.; Sutcliffe, J.V. River flow forecasting through conceptual models part I—A discussion of principles. J. Hydrol. 1970, 10, 282–290. [Google Scholar] [CrossRef]
- Trudel, M.; Doucet-Généreux, P.L.; Leconte, R. Assessing river low-flow uncertainties related to hydrological model calibration and structure under climate change conditions. Climate 2017, 5, 19. [Google Scholar] [CrossRef] [Green Version]
- Wilby, R.L.; Harris, I. A framework for assessing uncertainties in climate change impacts: Low-flow scenarios for the River Thames, UK. Water Resour. Res. 2006, 42, W02419. [Google Scholar] [CrossRef]
- Clark, M.P.; Wilby, R.L.; Gutmann, E.D.; Vano, J.A.; Gangopadhyay, S.; Wood, A.W.; Fowler, H.J.; Prudhomme, C.; Arnold, J.R.; Brekke, L.D. Characterizing uncertainty of the hydrologic impacts of climate change. Curr. Clim. Chang. Rep. 2016, 2, 55–64. [Google Scholar] [CrossRef] [Green Version]
- Wilby, R.L. Uncertainty in water resource model parameters used for climate change impact assessment. Hydrol. Process. 2005, 19, 3201–3219. [Google Scholar] [CrossRef]
- Kay, A.L.; Davies, H.N.; Lane, R.A.; Rudd, A.C.; Bell, V.A. Grid-based simulation of river flows in Northern Ireland: Model performance and future flow changes. J. Hydrol. Reg. Stud. 2021, 38, 100967. [Google Scholar] [CrossRef]
- Giuntoli, I.; Vidal, J.P.; Prudhomme, C.; Hannah, D.M. Future hydrological extremes: The uncertainty from multiple global climate and global hydrological models. Earth Syst. Dyn. 2015, 6, 267–285. [Google Scholar] [CrossRef] [Green Version]
- Bastola, S.; Murphy, C.; Sweeney, J. The role of hydrological modelling uncertainties in climate change impact assessments of Irish river catchments. Adv. Water Resour. 2011, 34, 562–576. [Google Scholar] [CrossRef]
- Wilby, R.; Murphy, C. Decision-making by water managers despite climate uncertainty. In The Oxford Handbook of Planning for Climate Change Hazards; Pfeffer, W.T., Smith, J.B., Ebi, K.L., Eds.; Oxford University Press: Oxford, UK, 2019; pp. 1–34. [Google Scholar] [CrossRef]
- Wilby, R.L.; Dessai, S. Robust adaptation to climate change. Weather 2010, 65, 180–185. [Google Scholar] [CrossRef] [Green Version]
- Shepherd, T.G.; Boyd, E.; Calel, R.A.; Chapman, S.C.; Dessai, S.; Dima-West, I.M.; Fowler, H.J.; James, R.; Maraun, D.; Martius, O.; et al. Storylines: An alternative approach to representing uncertainty in physical aspects of climate change. Clim. Chang. 2018, 151, 555–571. [Google Scholar] [CrossRef] [Green Version]
- Palutikof, J.P.; Street, R.B.; Gardiner, E.P. Looking to the future: Guidelines for decision support as adaptation practice matures. Clim. Chang. 2019, 153, 643–655. [Google Scholar] [CrossRef] [Green Version]
- Wilby, R.L.; Dawson, C.W.; Murphy, C.; Connor, P.O.; Hawkins, E. The statistical downscaling model-decision centric (SDSM-DC): Conceptual basis and applications. Clim. Res. 2014, 61, 259–276. [Google Scholar] [CrossRef] [Green Version]
- Hall, J.; Murphy, C. Vulnerability analysis of future public water supply under changing climate conditions: A study of the Moy catchment, Western Ireland. Water Resour. Manag. 2010, 24, 3527–3545. [Google Scholar] [CrossRef] [Green Version]
- Schnorbus, M.A.; Cannon, A.J. Statistical emulation of streamflow projections from a distributed hydrological model: Application to CMIP3 and CMIP5 climate projections for British Columbia, Canada. Water Resour. Res. 2014, 50, 8907–8926. [Google Scholar] [CrossRef]
Figure 1.
Distribution of the 37 catchments used in the analysis. The red line identifies the catchment boundary, while the green triangle indicates the location of the gauging station. The numbers listed are unique hydrometric codes used to identify gauges and correspond to those given in subsequent figures.
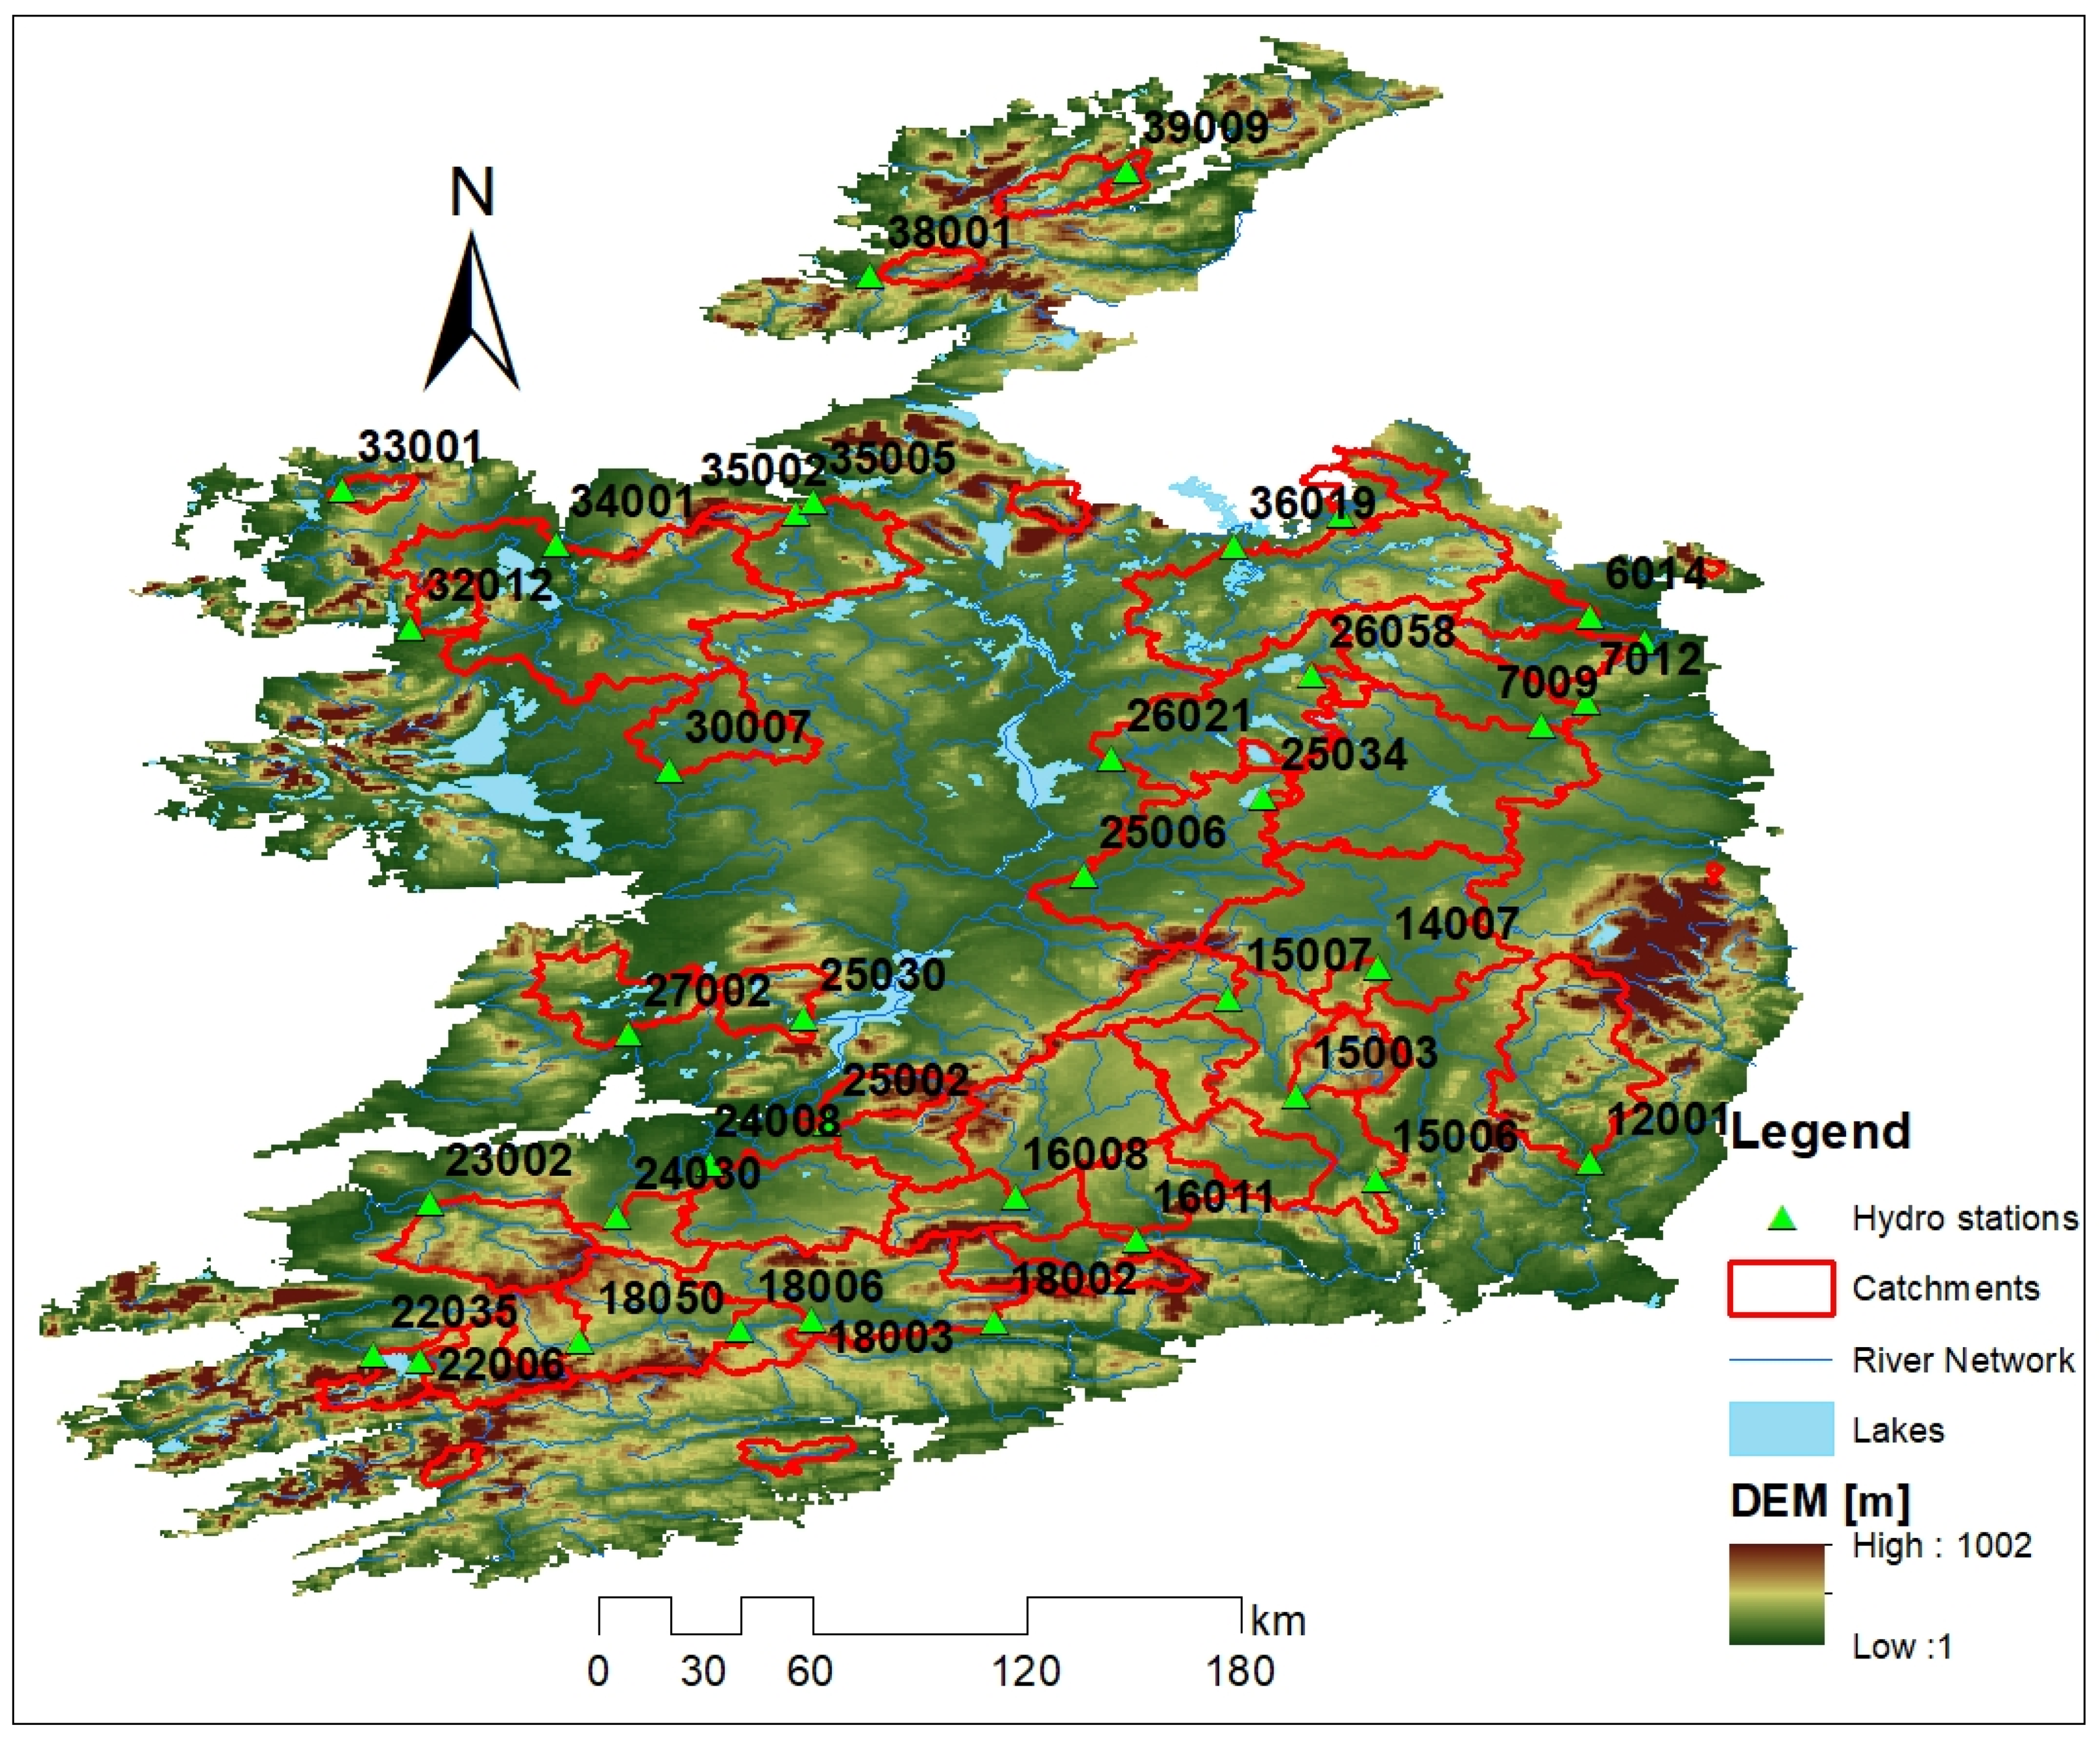
Figure 2.
Comparison between raw (black dots) and bias-corrected (green dots) monthly mean precipitation from 12 Earth System Models (ESMs) and observations (red line) during the reference period 1976–2005 for each catchment.
Figure 2.
Comparison between raw (black dots) and bias-corrected (green dots) monthly mean precipitation from 12 Earth System Models (ESMs) and observations (red line) during the reference period 1976–2005 for each catchment.
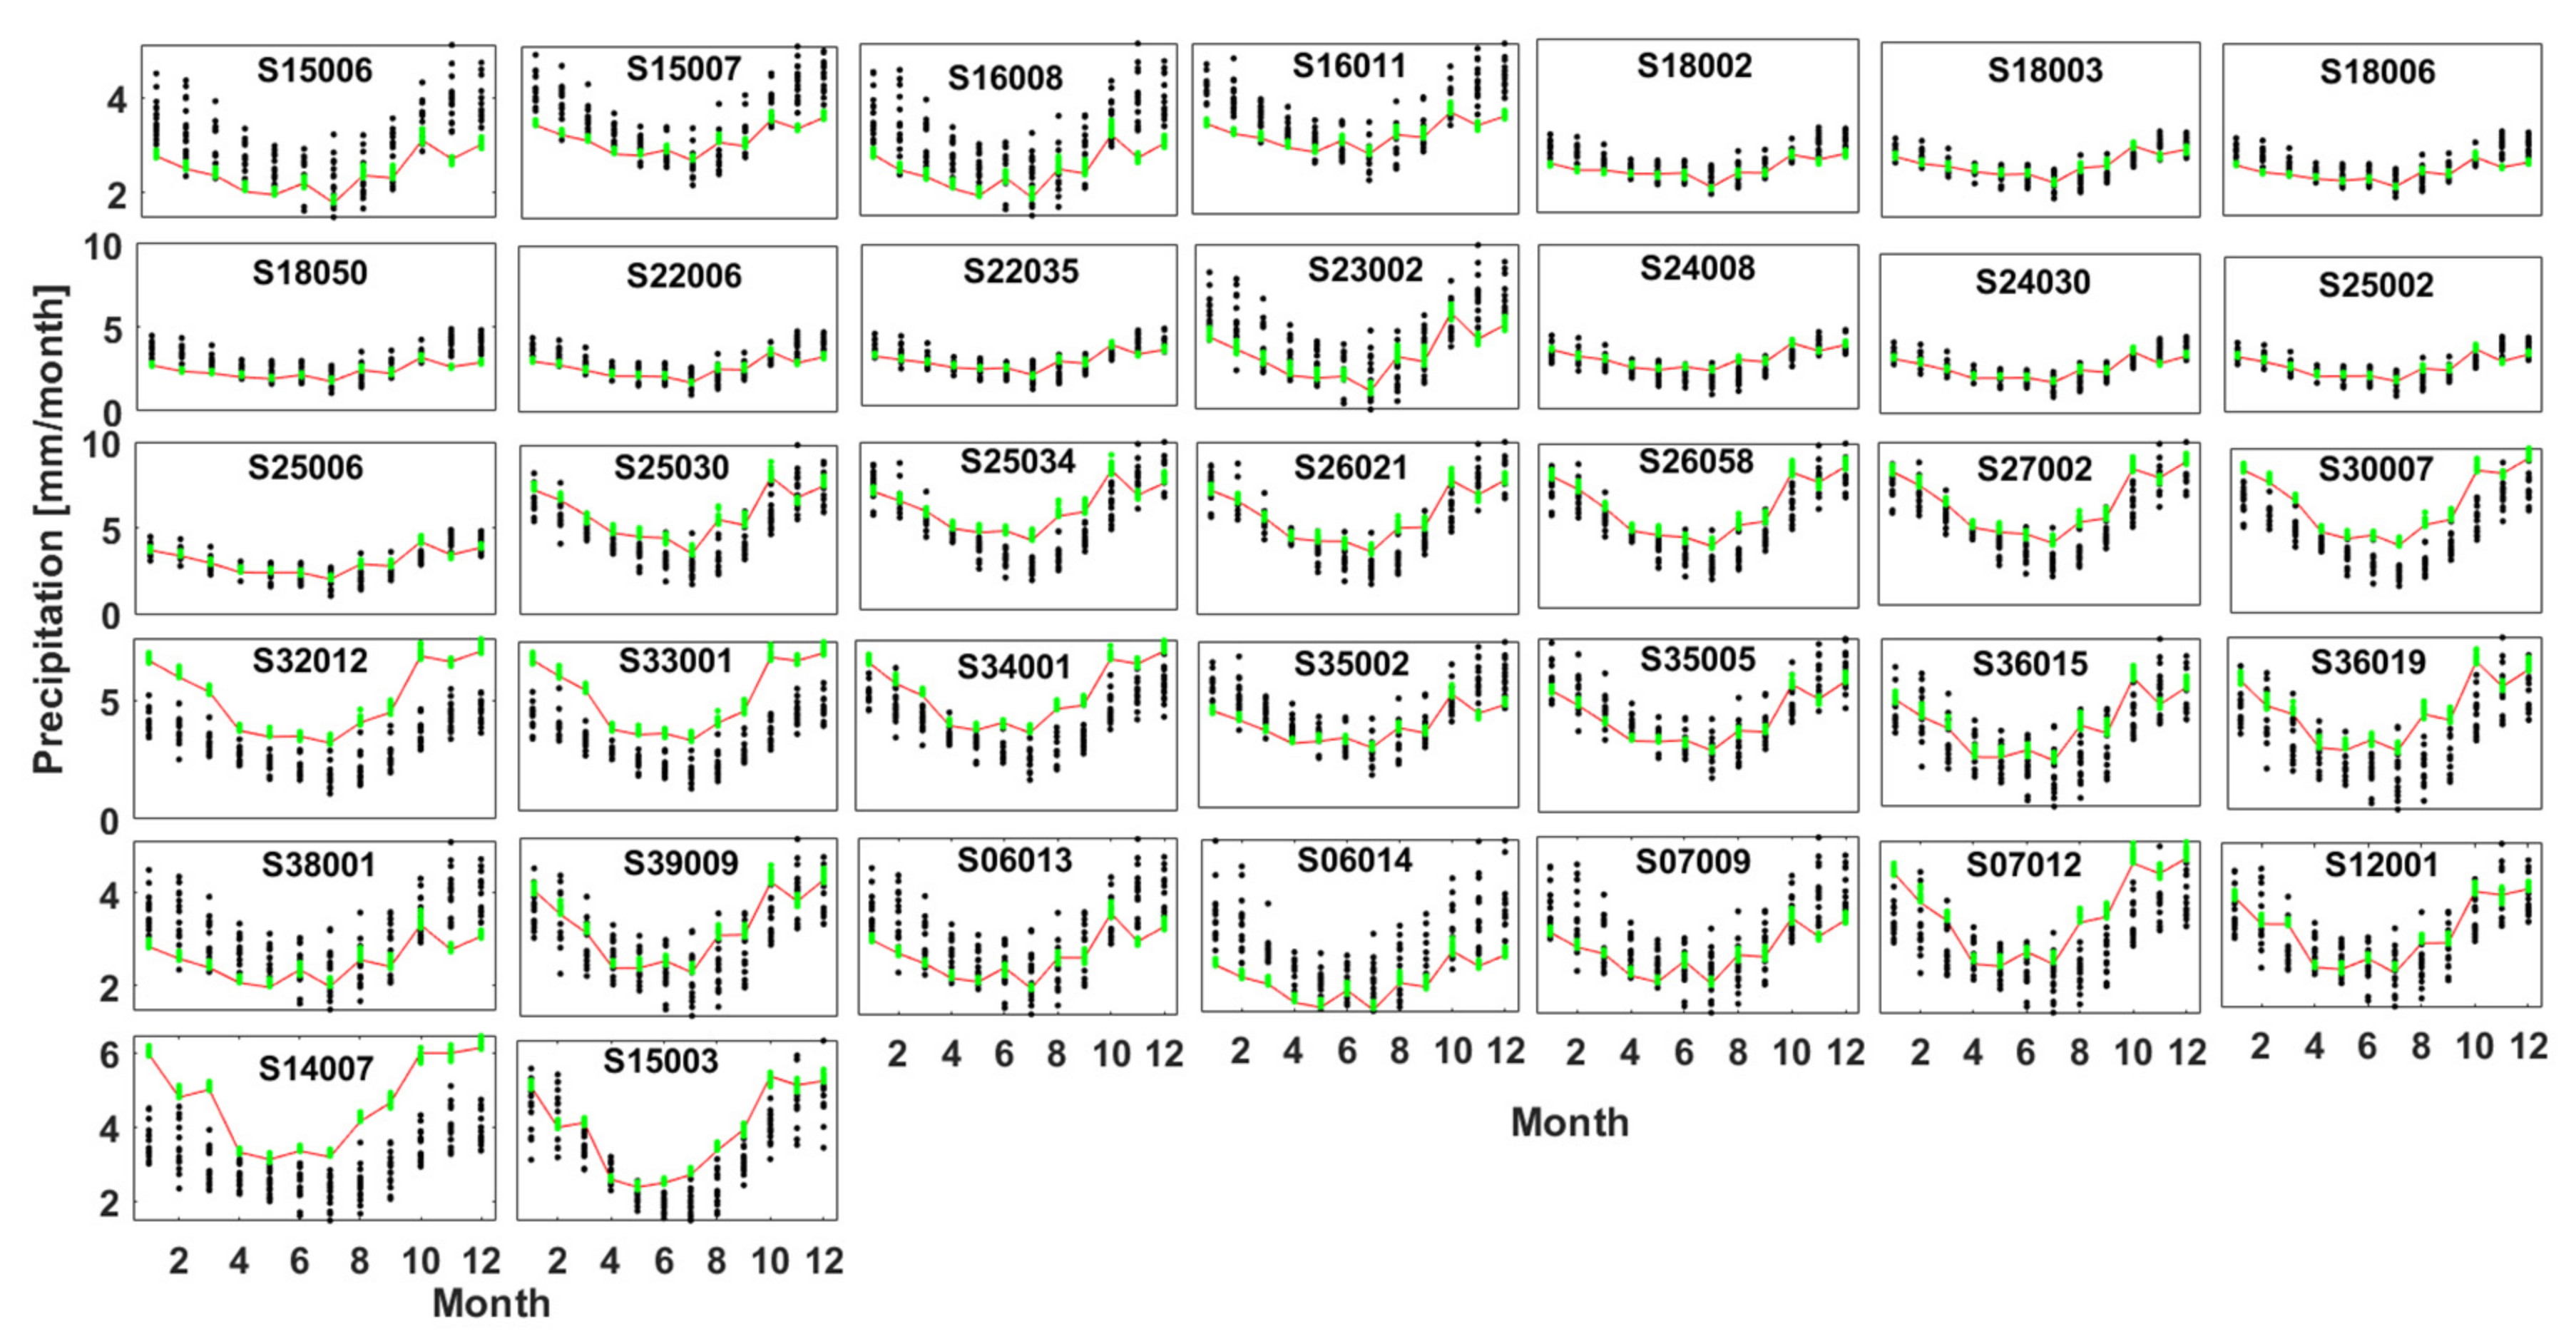
Figure 3.
As in Figure 2, but for the monthly mean temperature.
Figure 3.
As in Figure 2, but for the monthly mean temperature.

Figure 4.
Model performance for various hydrological signatures (ability to capture different percentiles of the CDF of daily flows (Q95, Q50, Q5), the skewness, and the Coefficient of Variation (CV) of observations and the runoff coefficient), together with PBIAS, NSE, and LogNSE skill scores for each catchment over the evaluation period (1990–2015).
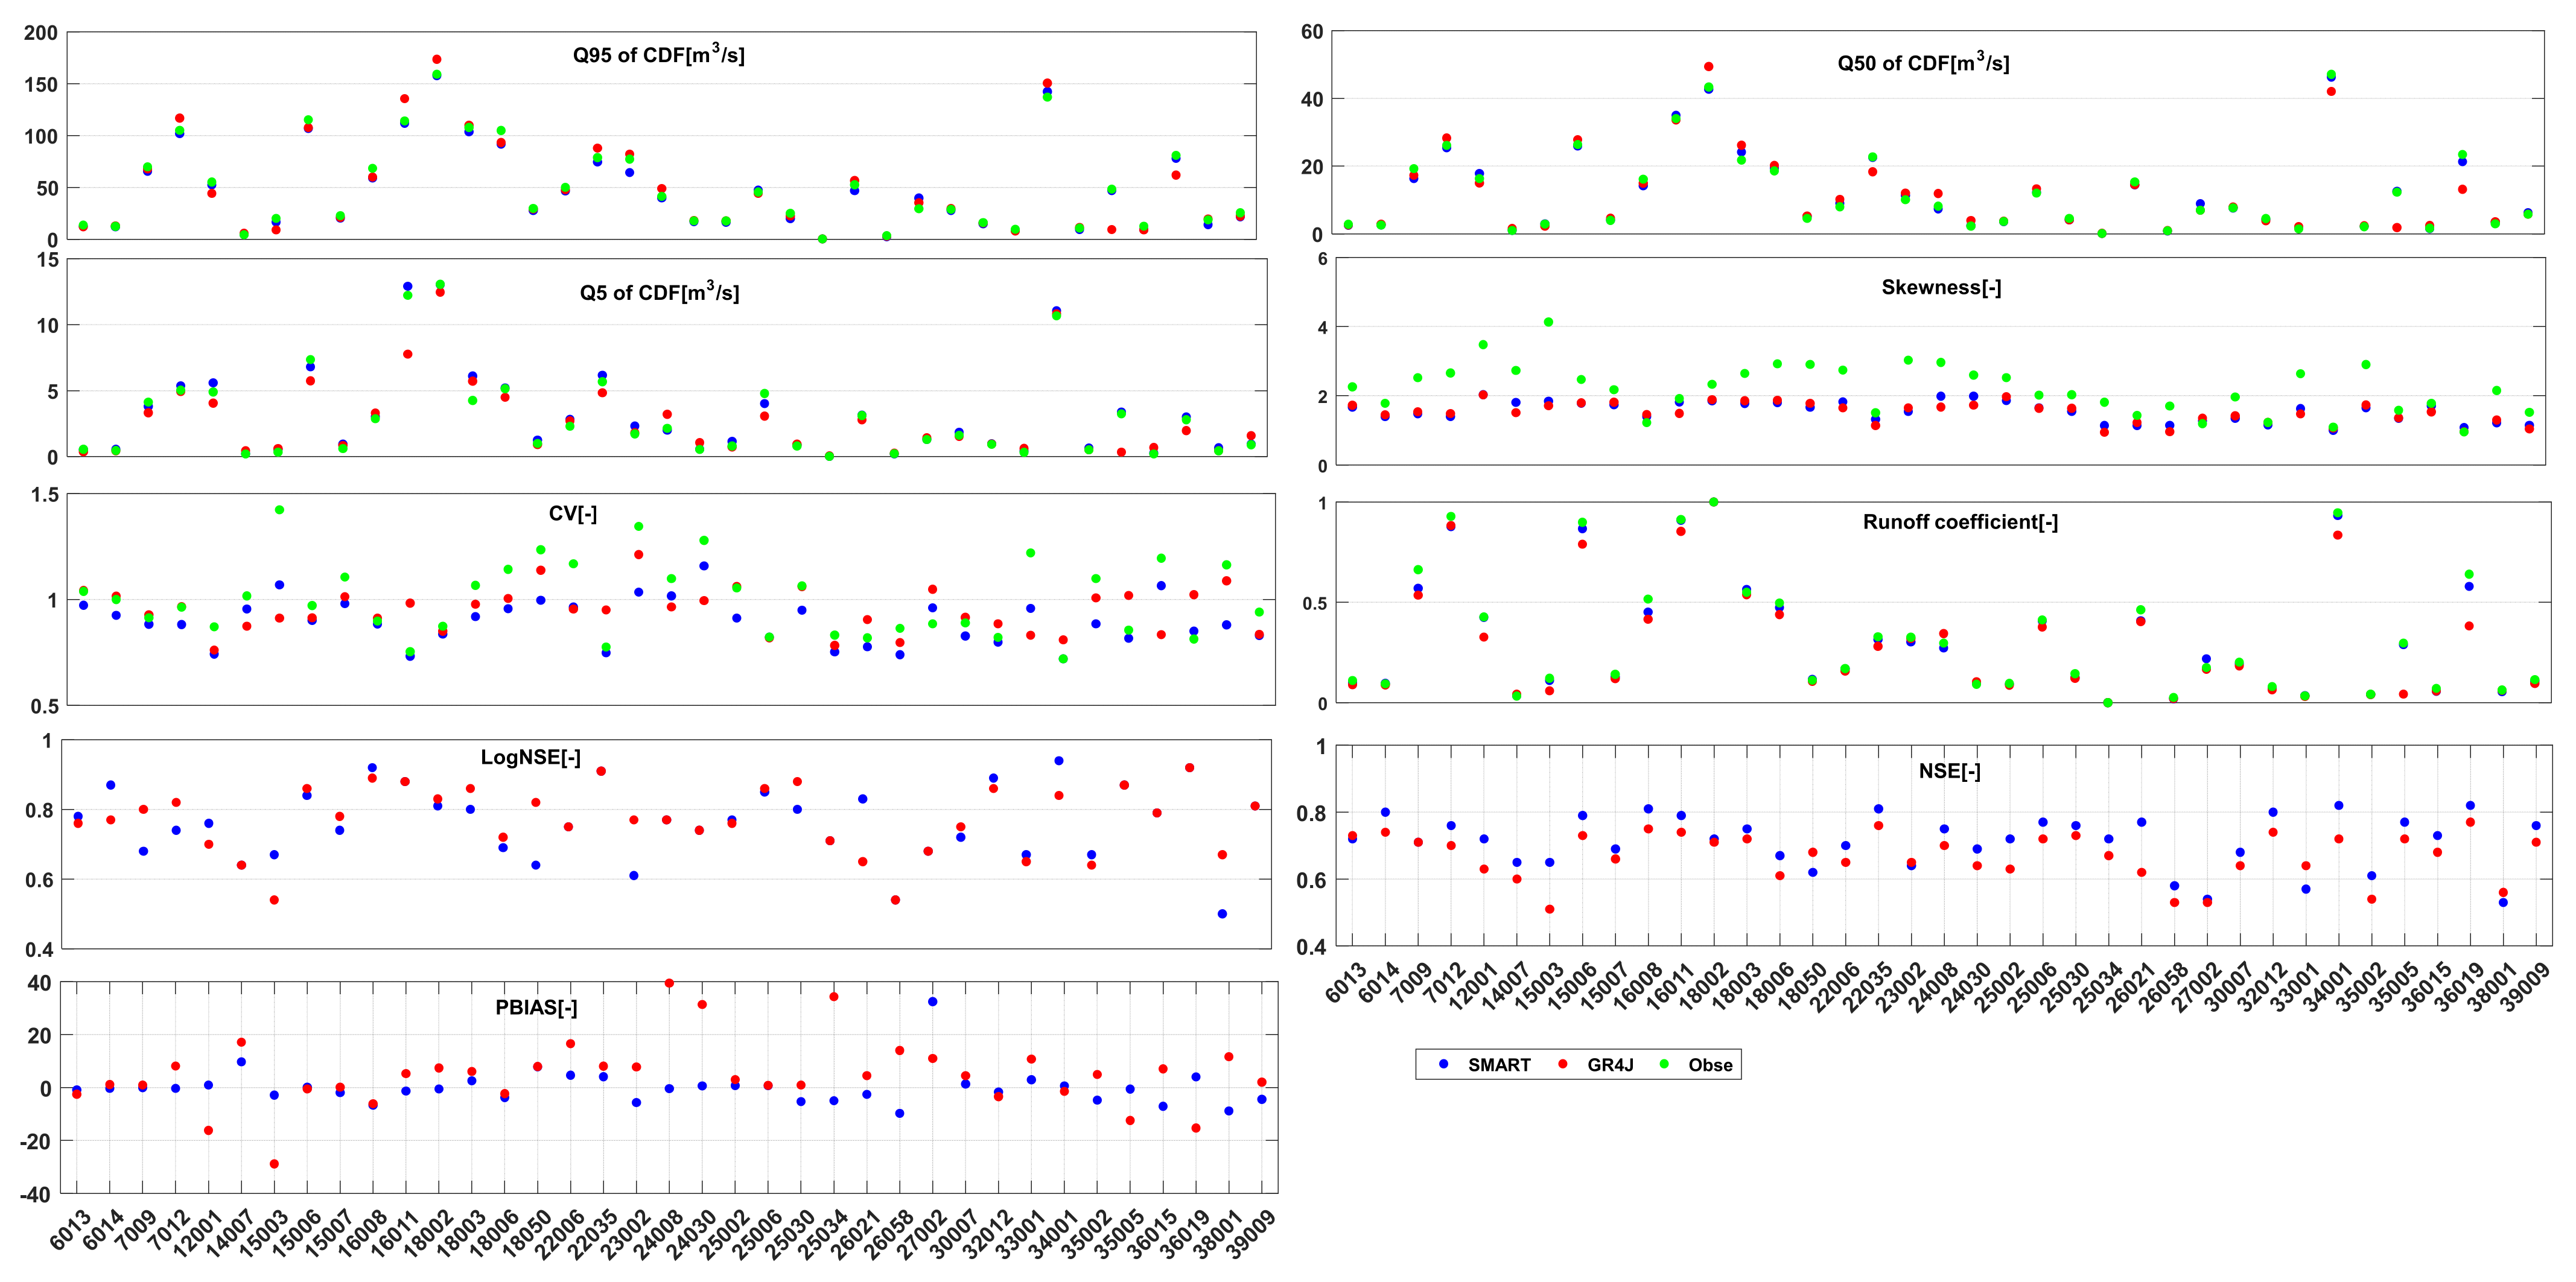
Figure 5.
Projected percent changes in seasonal flows derived from the GR4J model (A) and SMART model (B) forced by the bias-corrected outputs from 12 CMIP6 models under SSP126 for the 2020s (blue), 2050s (red), and 2080s (yellow) relative to the reference period 1976–2005.
Figure 5.
Projected percent changes in seasonal flows derived from the GR4J model (A) and SMART model (B) forced by the bias-corrected outputs from 12 CMIP6 models under SSP126 for the 2020s (blue), 2050s (red), and 2080s (yellow) relative to the reference period 1976–2005.
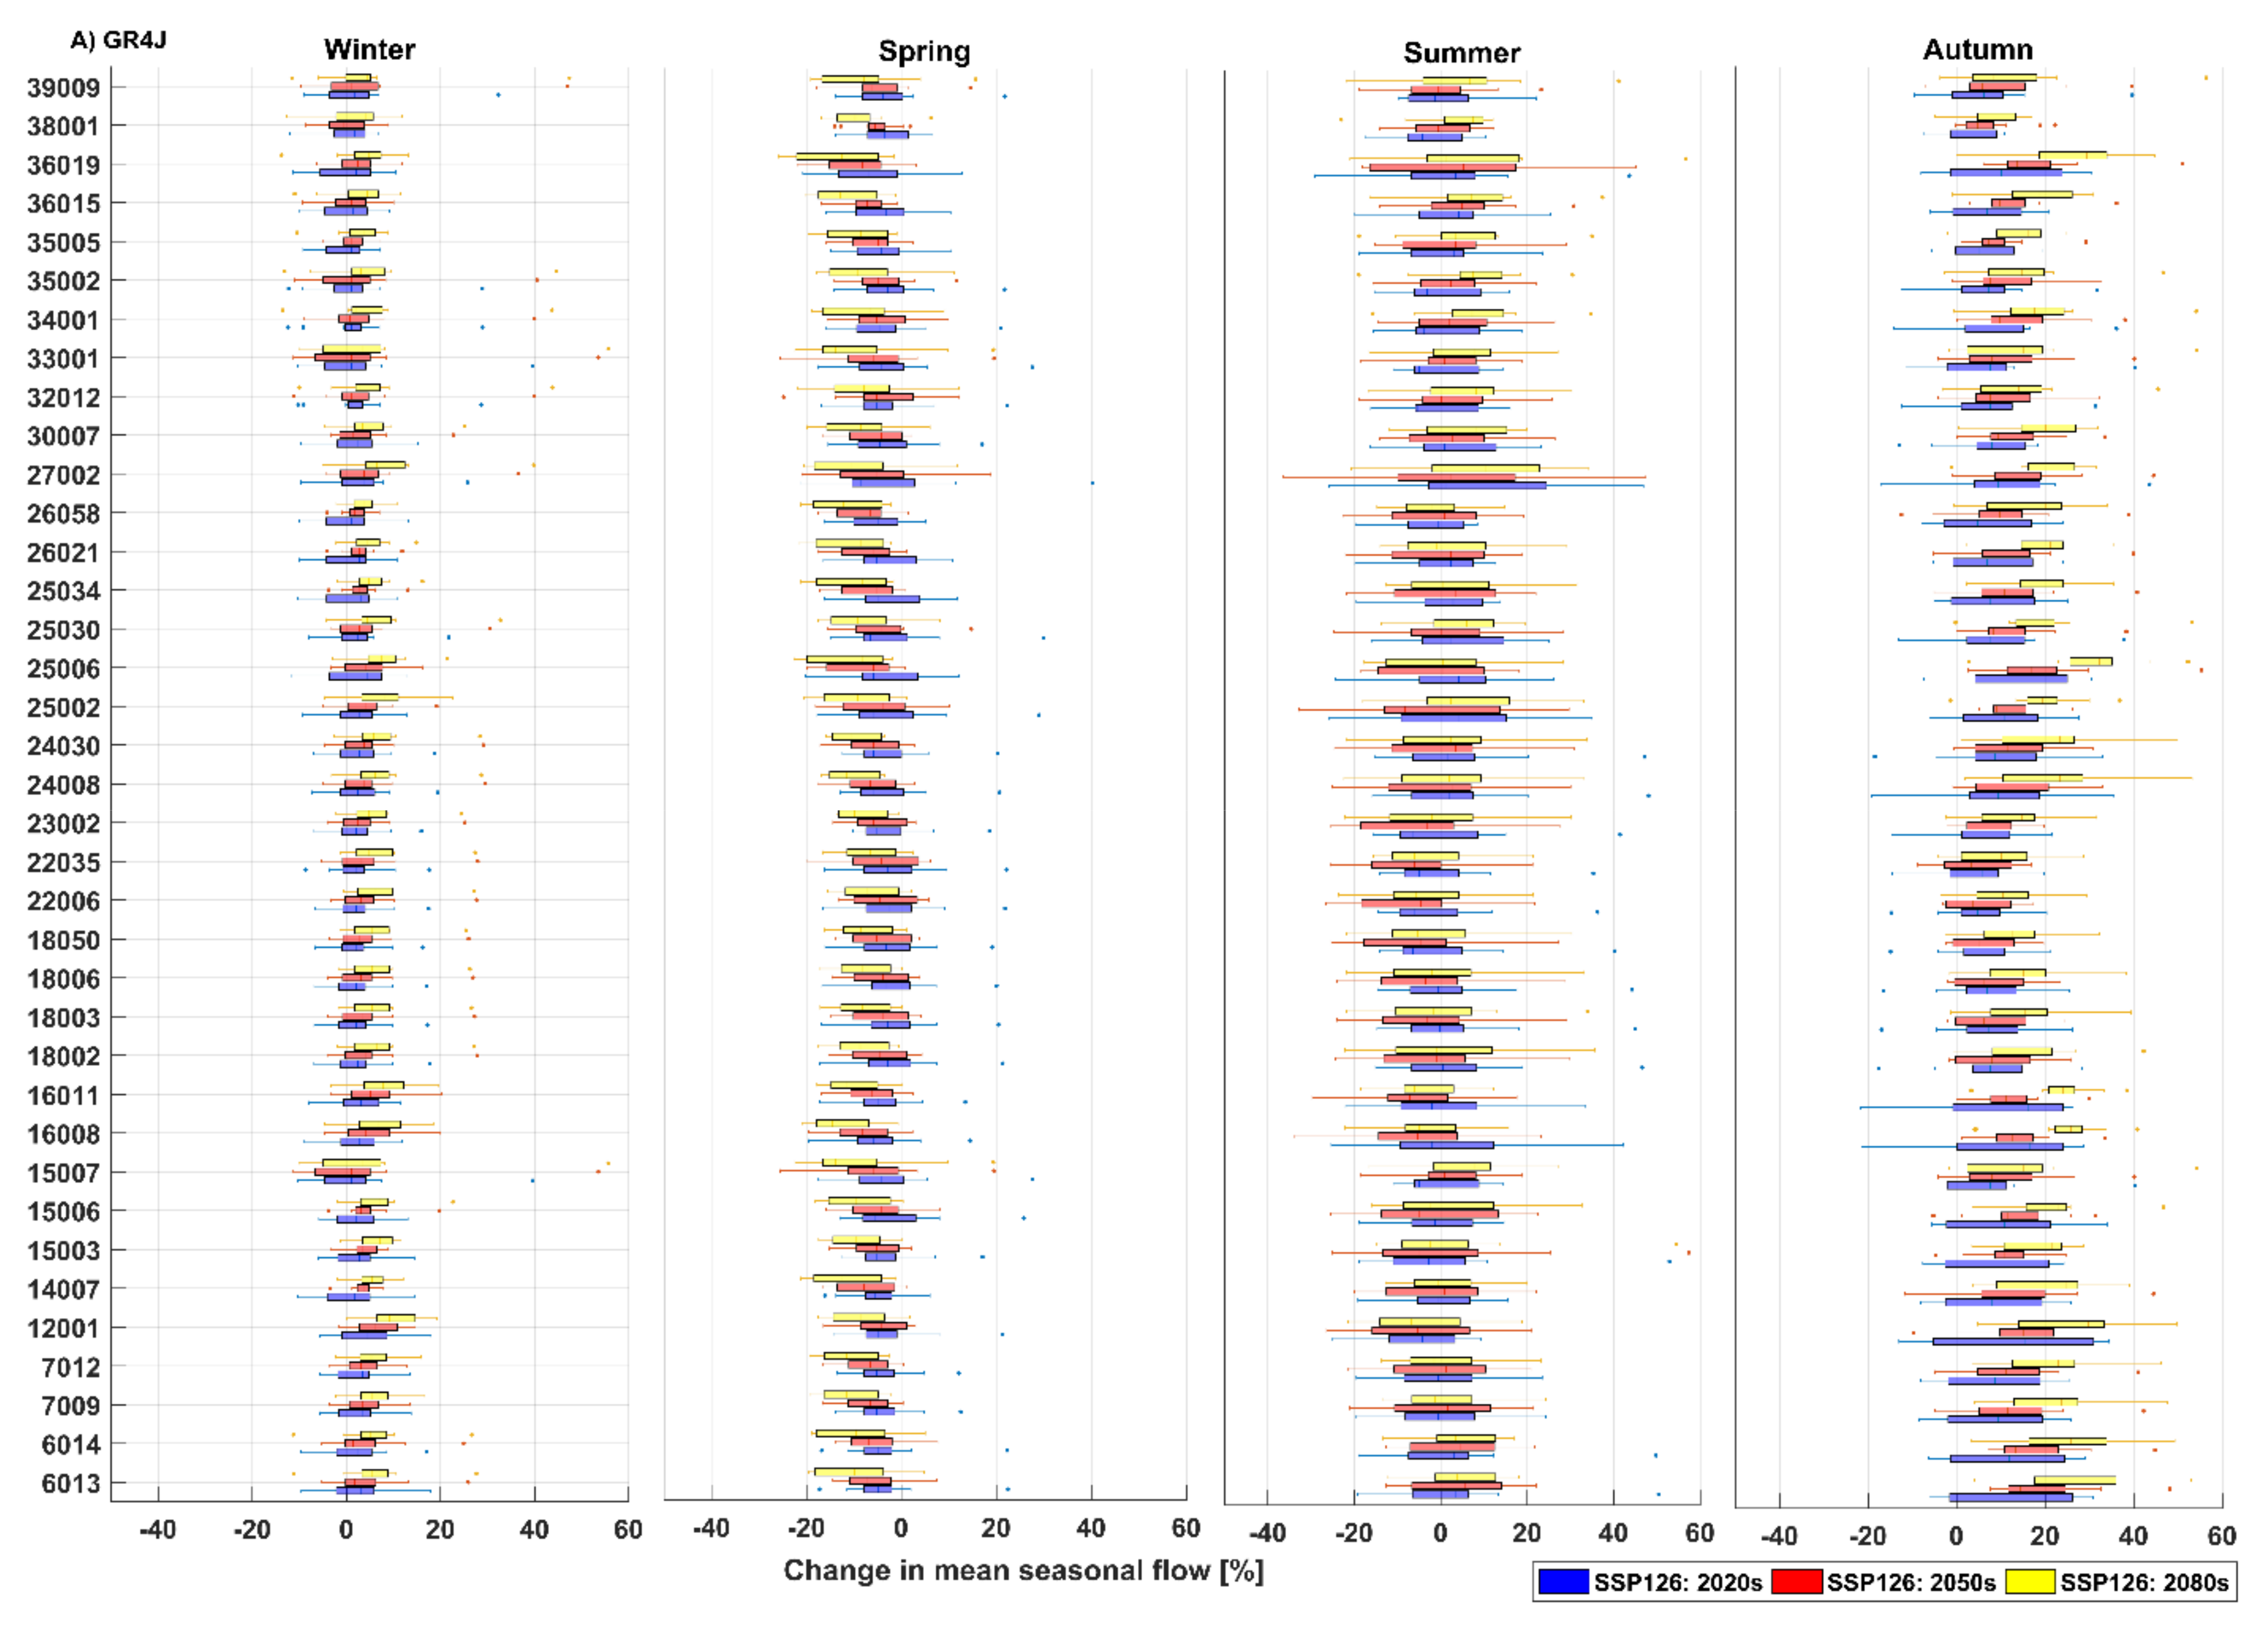
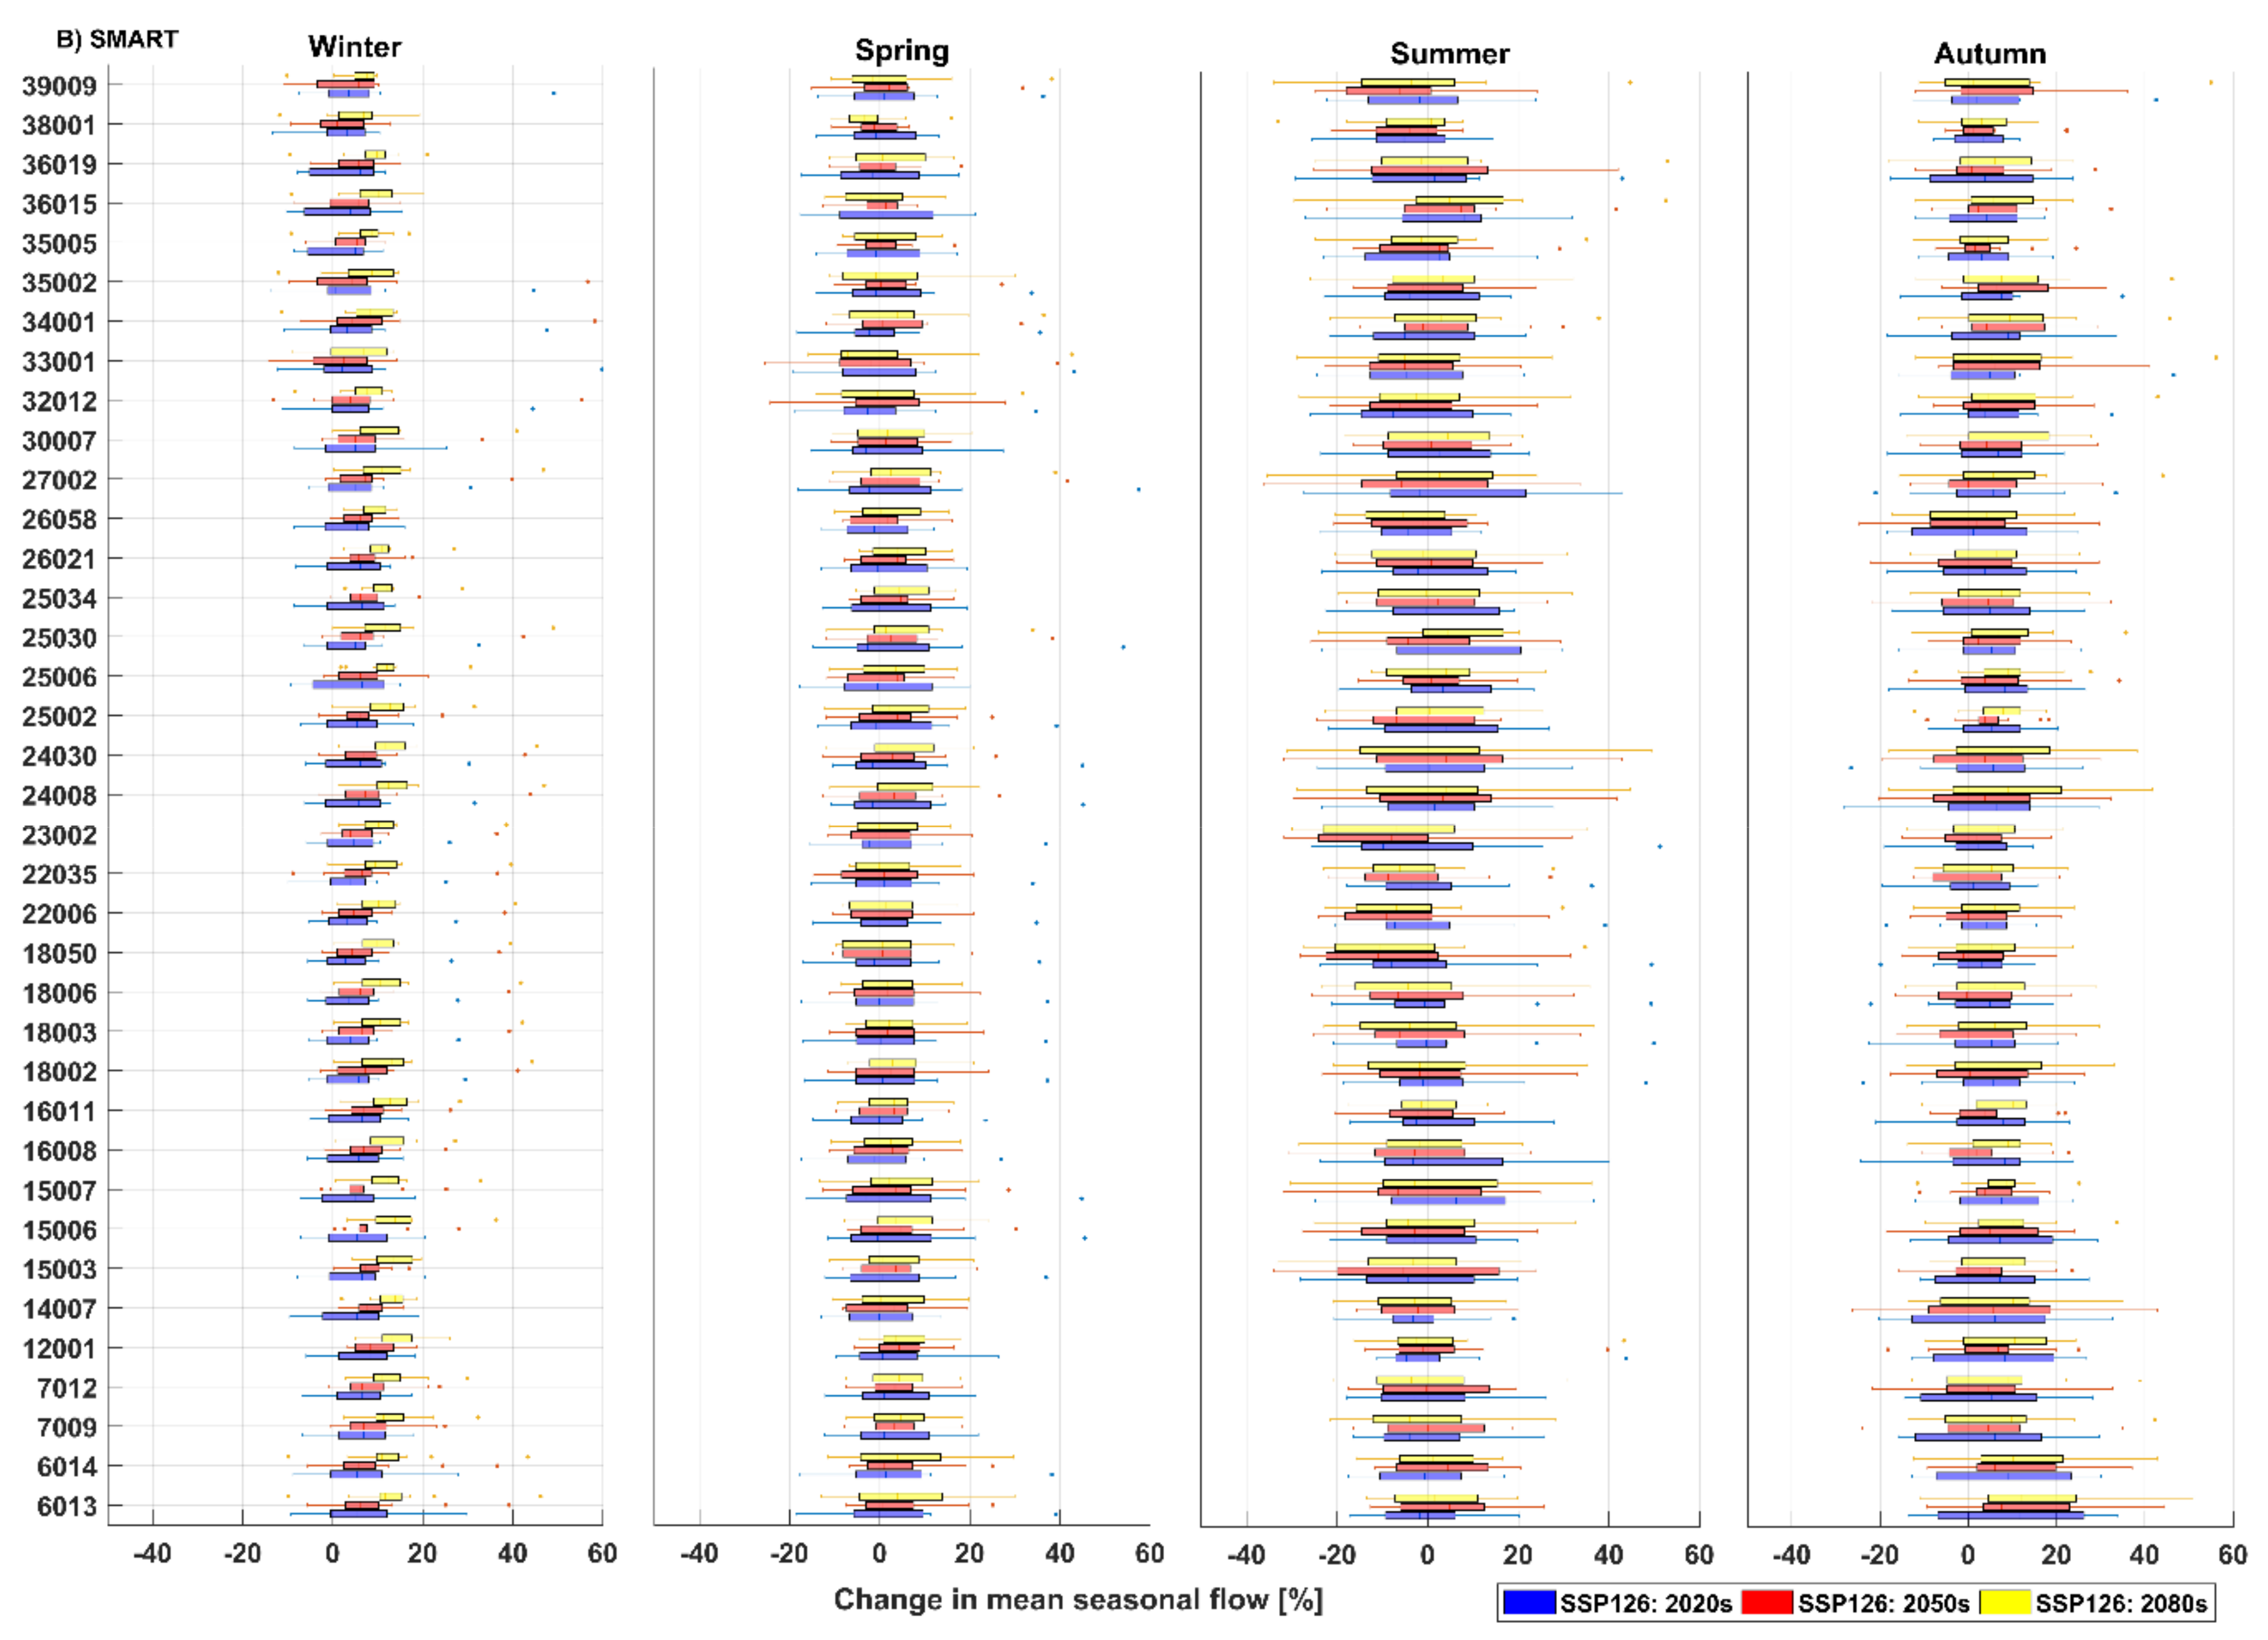
Figure 6.
As in Figure 5, but for SSP370.
Figure 6.
As in Figure 5, but for SSP370.
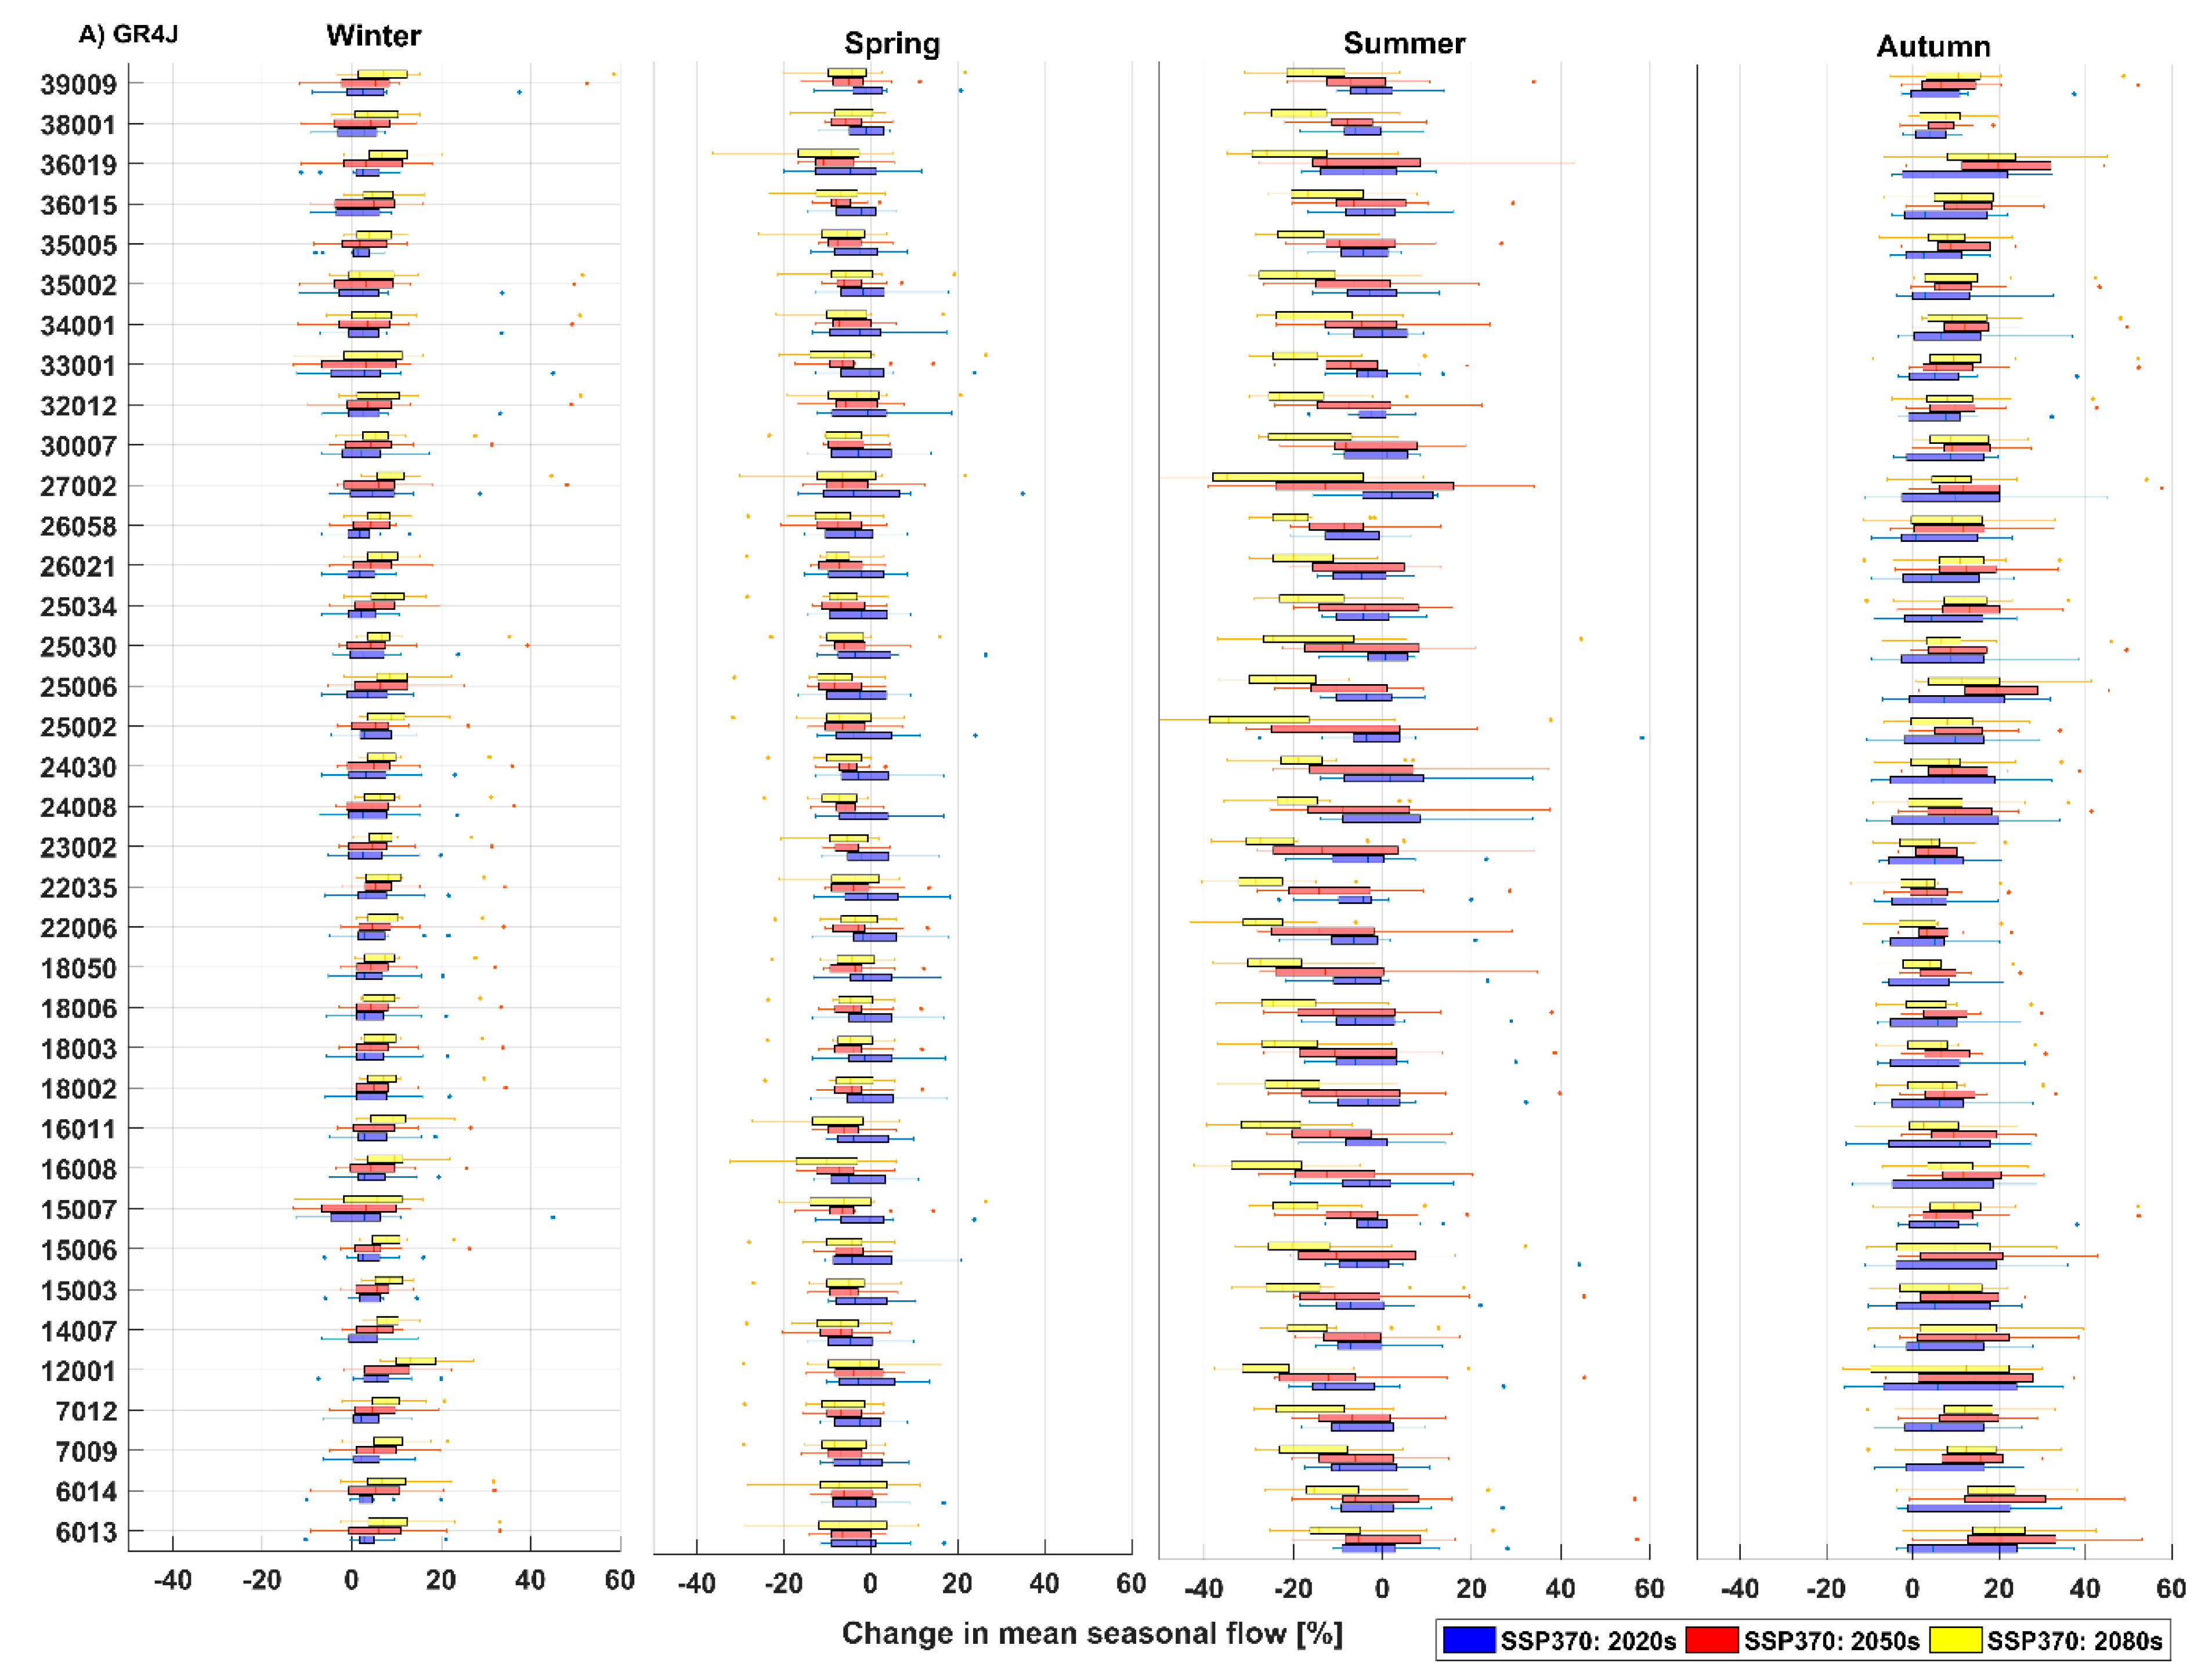
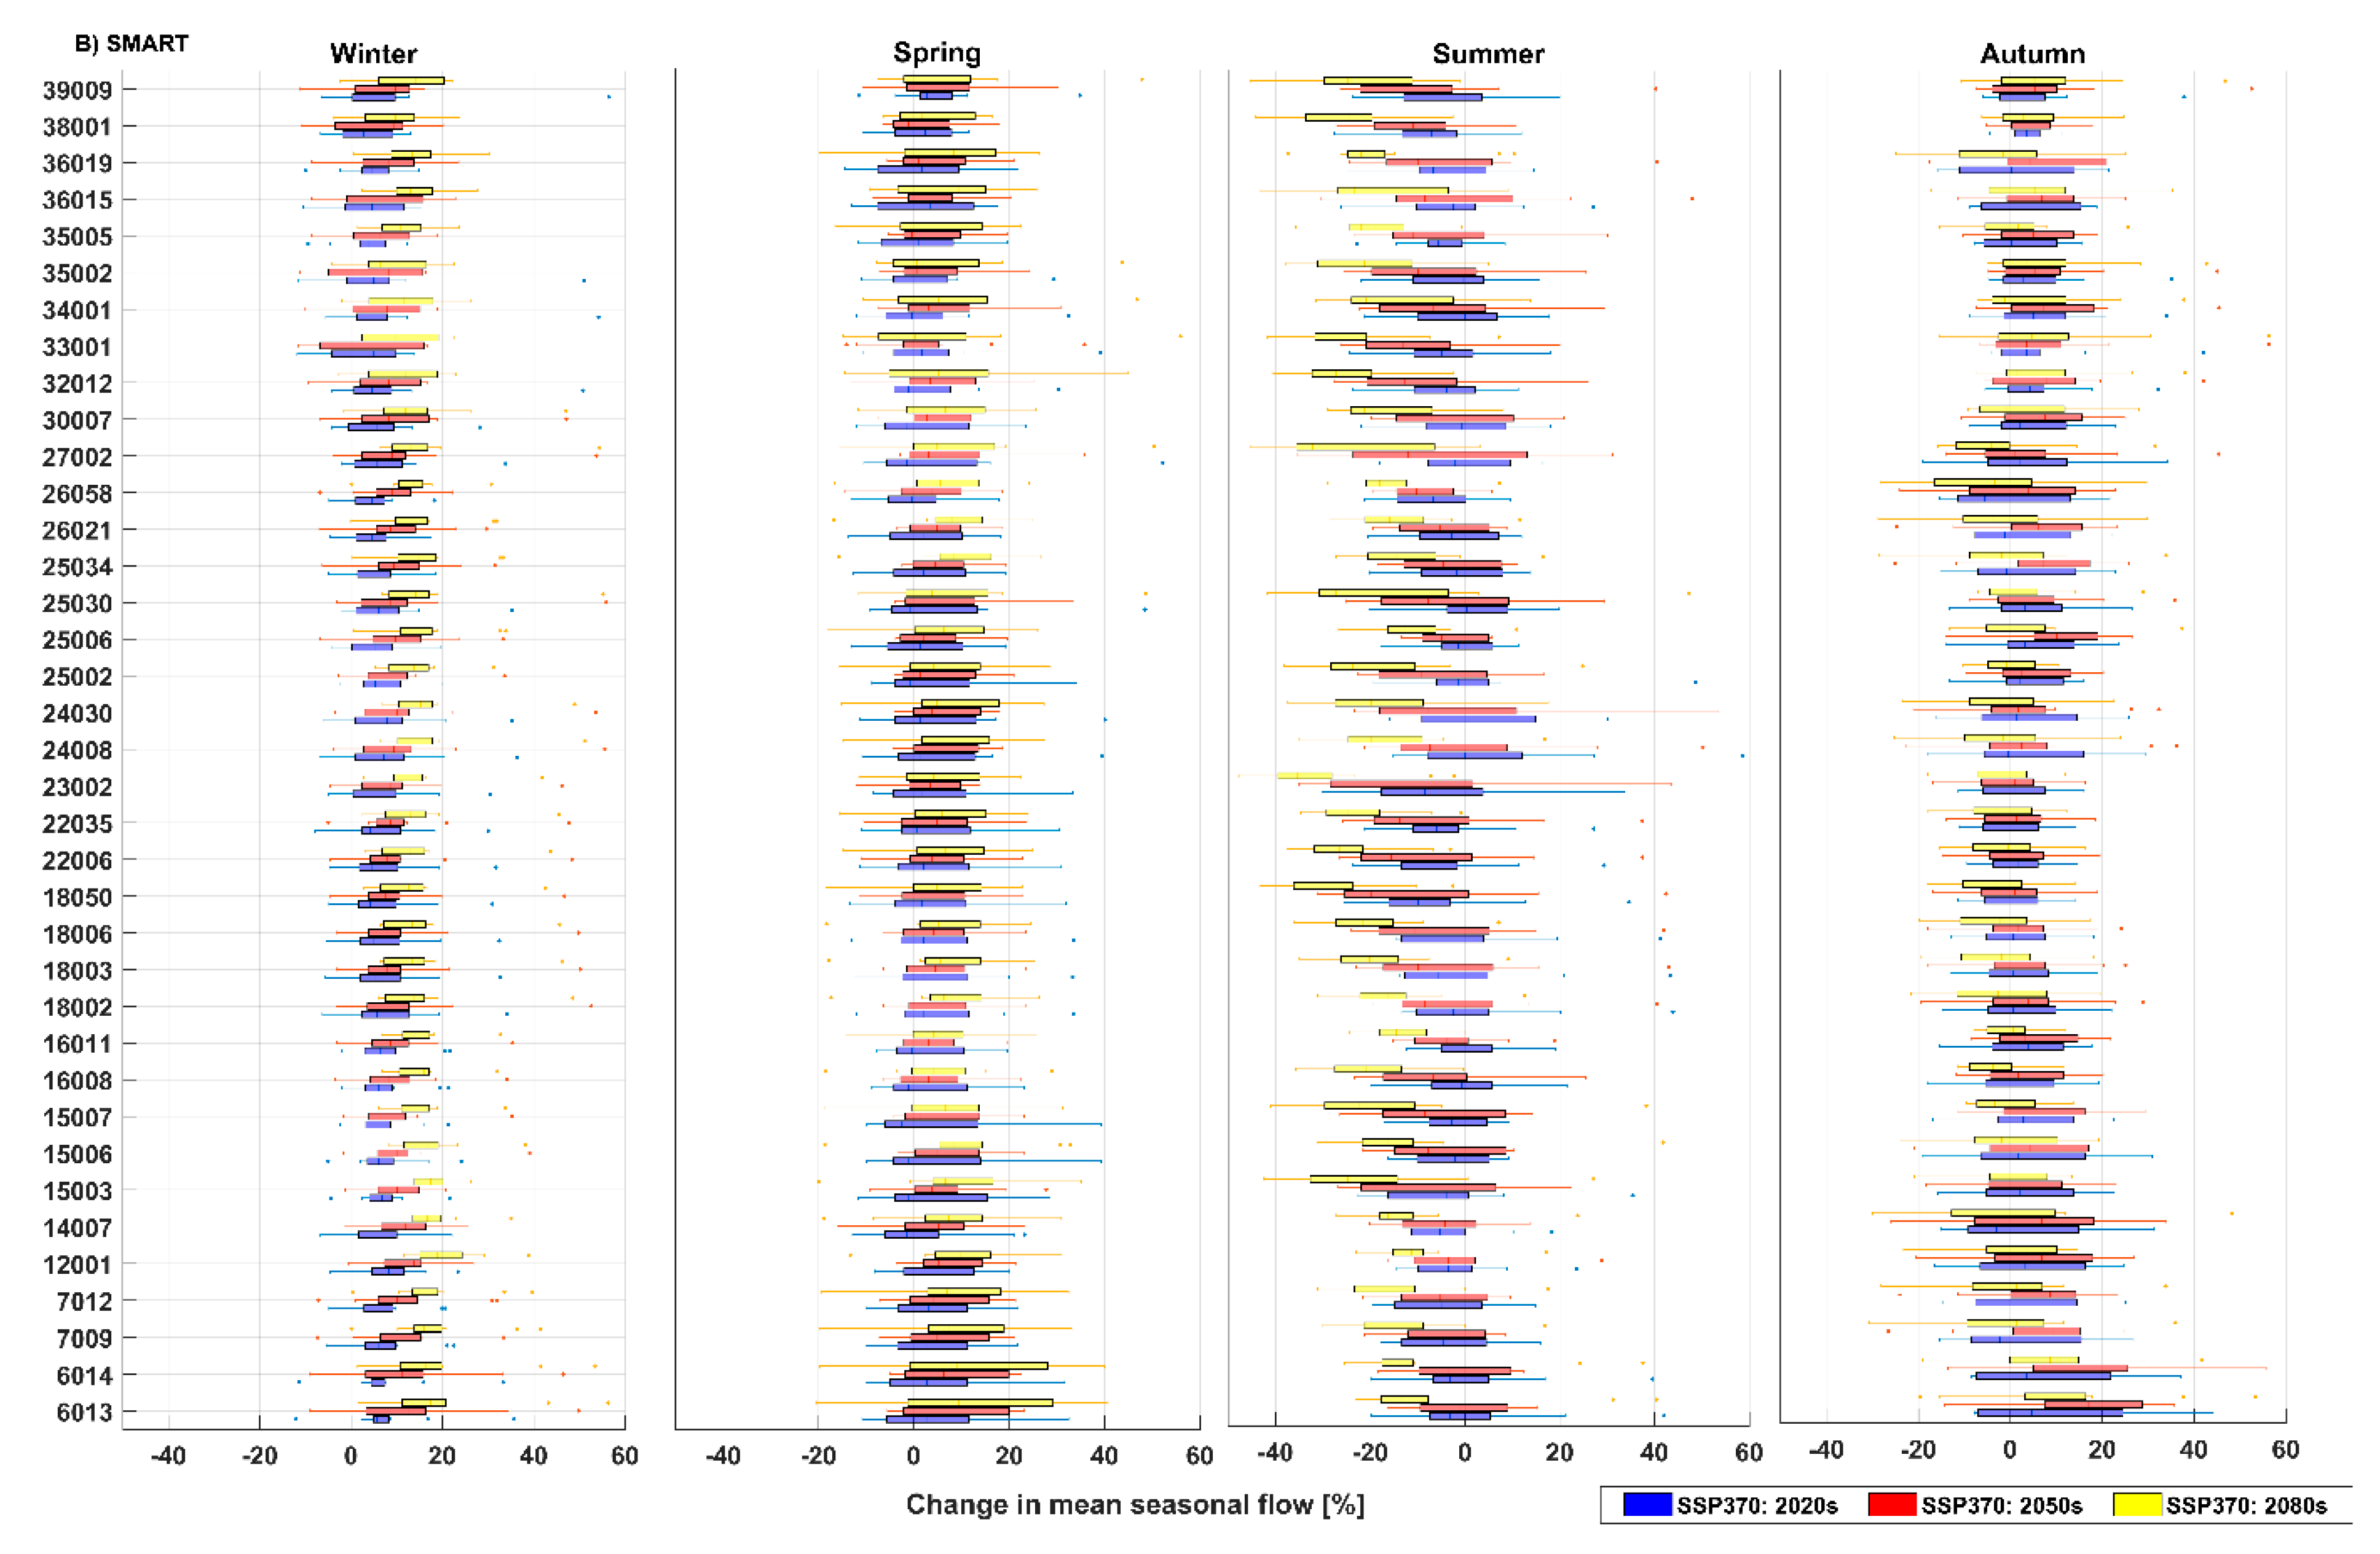
Figure 7.
As in Figure 5, but for SSP585.
Figure 7.
As in Figure 5, but for SSP585.


Figure 8.
Projected percent changes in the annual Q95 for the 2020s, 2050s, and 2080s relative to the reference period 1976–2005 for each catchment, as simulated for SSP126, SSP370, and SSP585 for the GR4J model (A) and SMART model (B).
Figure 8.
Projected percent changes in the annual Q95 for the 2020s, 2050s, and 2080s relative to the reference period 1976–2005 for each catchment, as simulated for SSP126, SSP370, and SSP585 for the GR4J model (A) and SMART model (B).
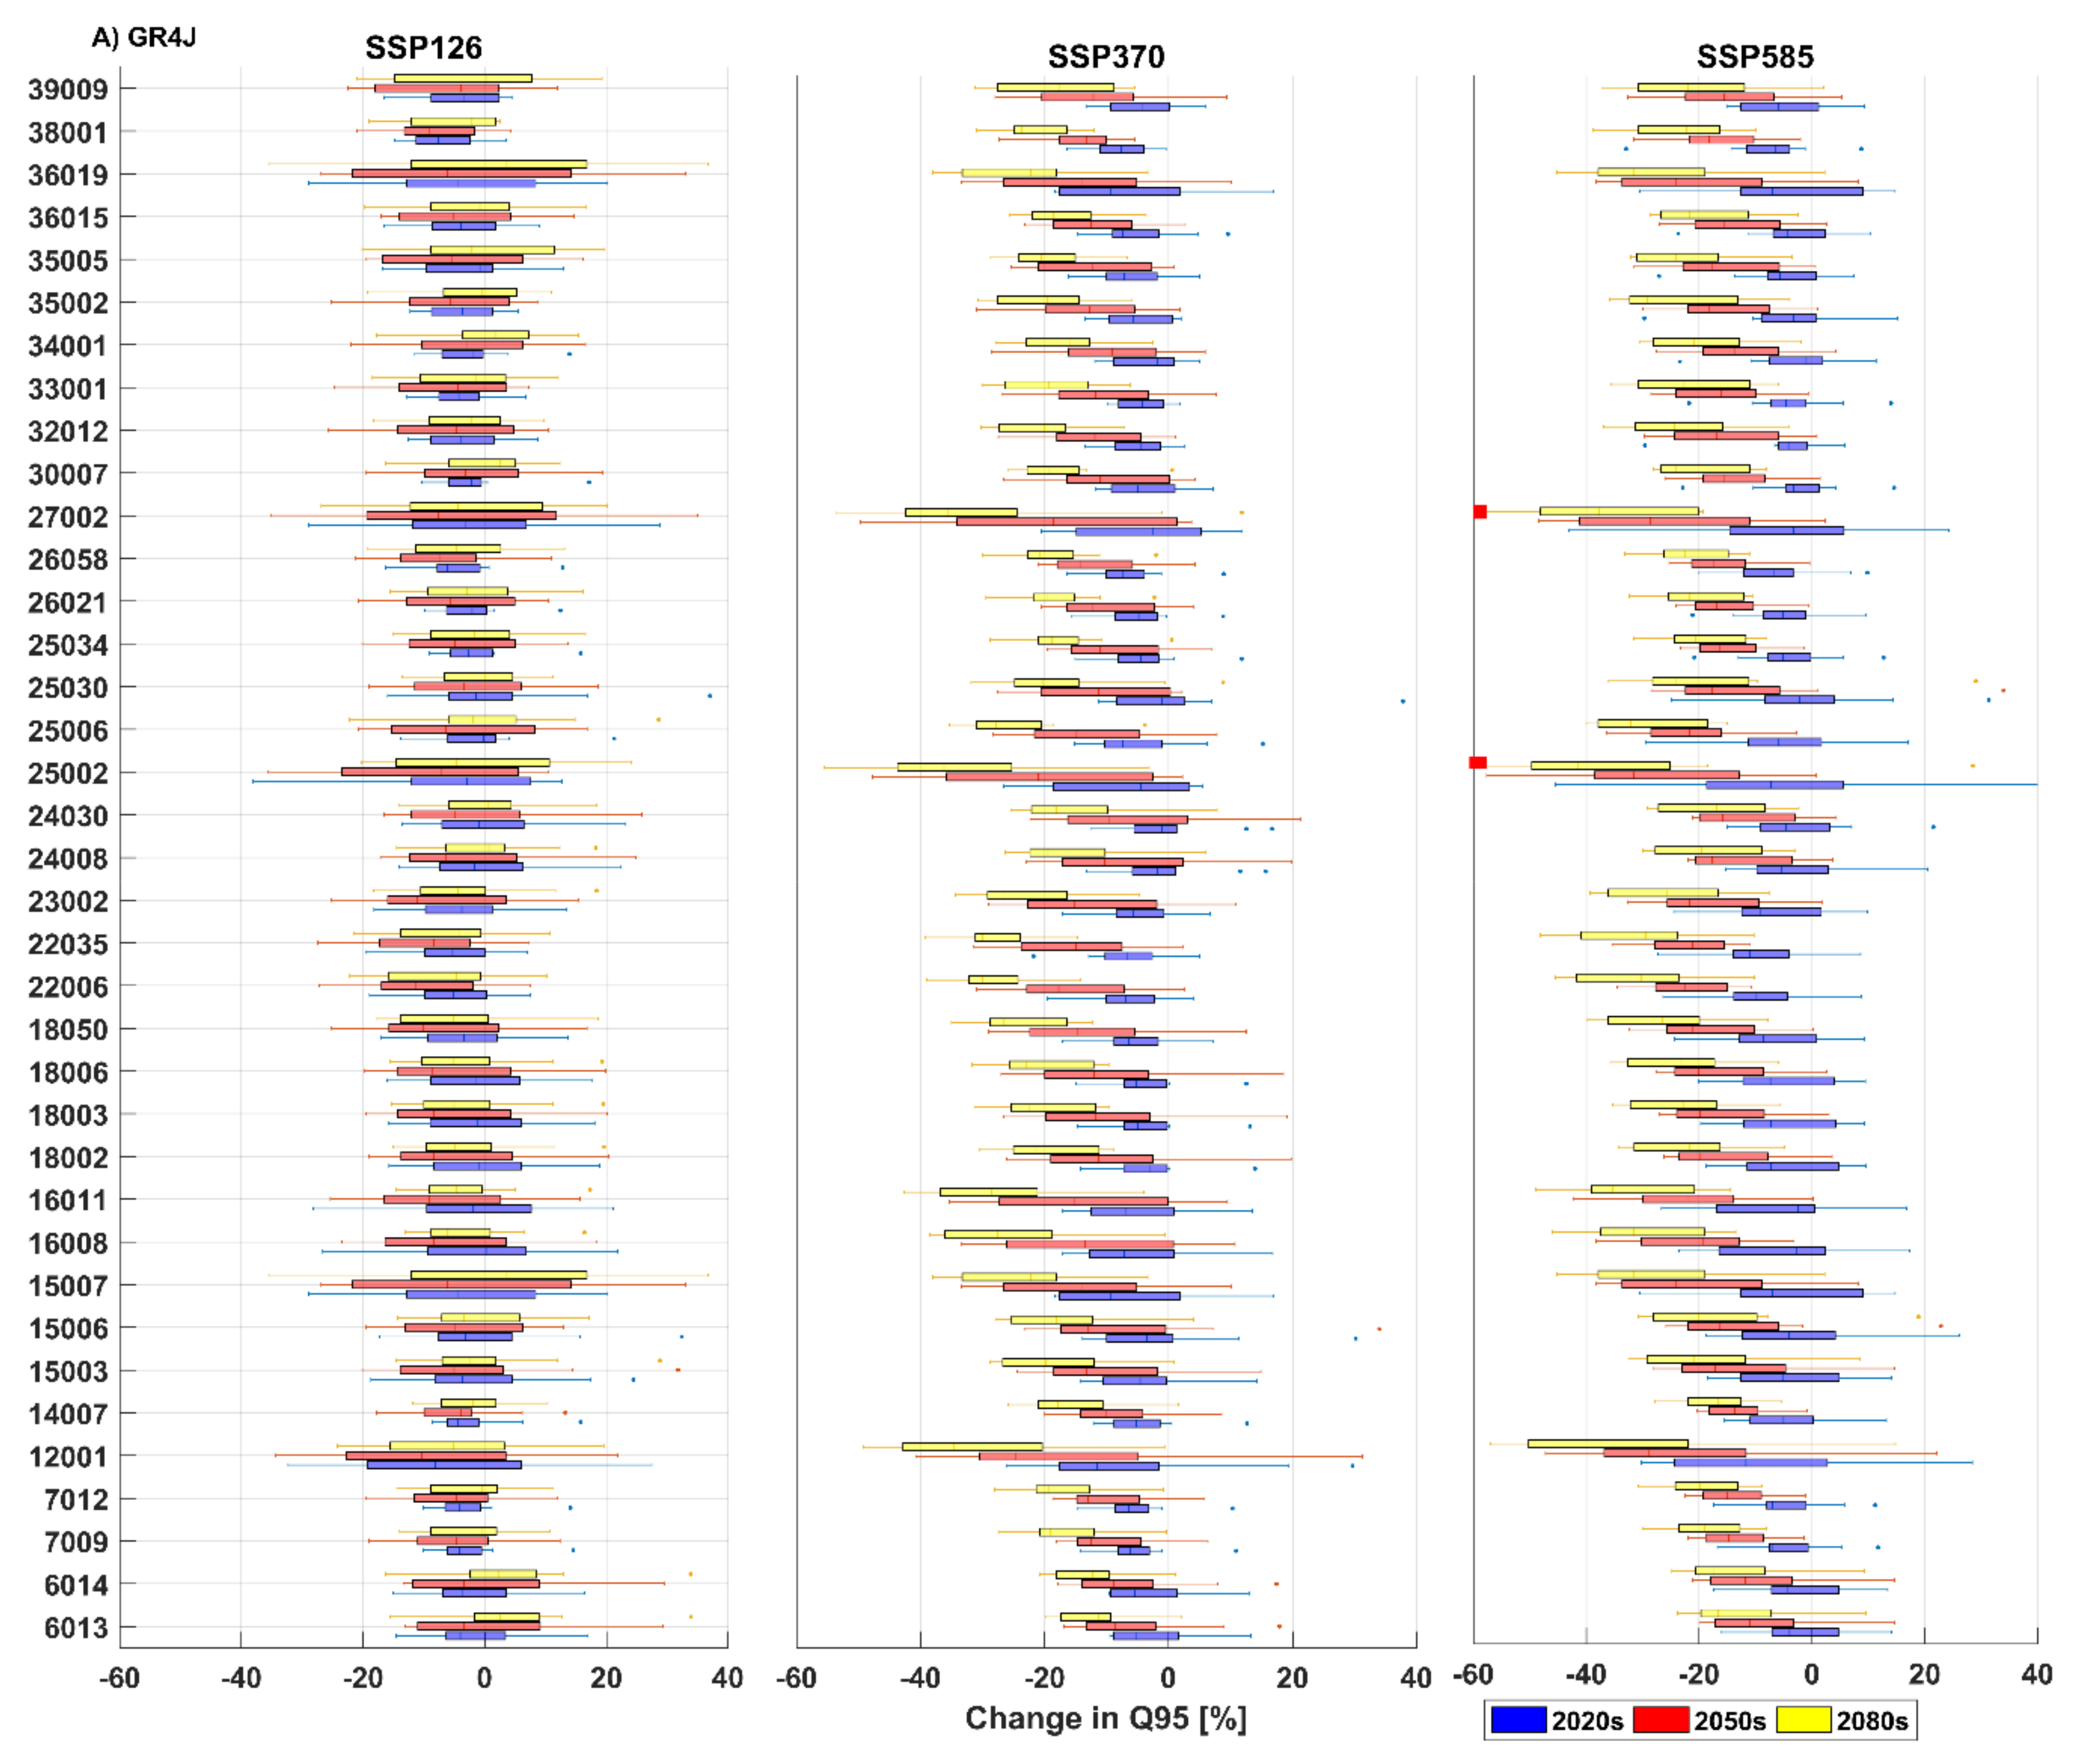

Figure 9.
Density functions of median changes in the seasonal mean and annual low flows simulated by SMART (left) and GR4J (right) across all catchments for each SSP during the 2080s.
Figure 9.
Density functions of median changes in the seasonal mean and annual low flows simulated by SMART (left) and GR4J (right) across all catchments for each SSP during the 2080s.

Figure 10.
Simulated changes (percent) for winter (left) and summer (right) precipitation in each catchment for the 2080s derived from each of the 12 climate models employed (see Table 1). Results are presented for SSP126 (top), SSP370 (middle), and SSP585 (bottom). High-sensitivity climate models are denoted by an asterix.


Table 1.
Details of the 12 CMIP6 Earth System Models (ESMs) included in the analysis. ESMs marked with an asterix indicate those showing high climate sensitivity.
Table 1.
Details of the 12 CMIP6 Earth System Models (ESMs) included in the analysis. ESMs marked with an asterix indicate those showing high climate sensitivity.
| Code | Institute | Parent Source ID | Institution ID |
|---|---|---|---|
| * CM1 | Commonwealth Scientific and Industrial Research Organisation, Australia | ACCESS-CM2 | CSIRO |
| * CM2 | Met Office Hadley Centre, UK | UKESM1-0-LL | MOHC |
| CM3 | Beijing Climate Center, China | BCC-CSM2-MR | BCC |
| CM4 | Global Fluid Dynamics Laboratory, USA | GFDL | NOAA-GFDL |
| CM5 | European: EC-EARTH consortium | EC-Earth | EC-EARTH consortium |
| * CM6 | National Center for Atmospheric Research, USA | CESM2 | NCAR |
| * CM7 | Met Office Hadley Centre, UK | HadGEM3-GC31-LL | MOHC |
| CM8 | JAMSTEC, AORI, NIES, and R-CCS, Japan | MIROC6 | MIROC |
| CM9 | Max Planck Institute for Meteorology, Germany | MPI-ESM1-2-HR | MPI-M |
| CM10 | Meteorological Research Institute, Japan | MRI-ESM2-0 | MRI |
| CM11 | NorESM Climate modeling Consortium, Norway | NorESM2-LM | NCC |
| * CM12 | Nanjing University of Information Science and Technology, China | NESM3 | NUIST |
Table 2.
Range of GR4J and SMART hydrological model parameters used for the sampling parameter sets.
Table 2.
Range of GR4J and SMART hydrological model parameters used for the sampling parameter sets.
| Model | Parameter | Description | Lower | Upper | Unit |
|---|---|---|---|---|---|
| GR4J | X1 | Capacity of the soil store production | 2.59 | 582.75 | mm |
| X2 | Water exchange coefficient | −4.02 | 4.81 | mm/d | |
| X3 | Capacity of the routing store | 18.24 | 500 | mm | |
| X4 | Time parameter for unit hydrographs | 0.12 | 5 | d | |
| SMART | T | Areal Rainfall Correction coefficient | 0.9 | 1.1 | (/) |
| C | Evaporation decay parameter | 0 | 1 | (/) | |
| H | Quick runoff coefficient | 0 | 0.3 | (/) | |
| D | Drain flow parameter | 0 | 1 | (/) | |
| S | Soil outflow coefficient | 0 | 0.013 | (/) | |
| Z | Effective soil depth | 15 | 150 | mm | |
| SK | Surface routing parameter | 1 | 240 | d | |
| FK | Interflow routing parameter | 48 | 1440 | d | |
| GK | Groundwater routing parameter | 1200 | 4800 | d | |
| RK | River routing parameter | 1 | 96 | d |
Publisher’s Note: MDPI stays neutral with regard to jurisdictional claims in published maps and institutional affiliations. |
© 2022 by the authors. Licensee MDPI, Basel, Switzerland. This article is an open access article distributed under the terms and conditions of the Creative Commons Attribution (CC BY) license (https://creativecommons.org/licenses/by/4.0/).
Share and Cite
MDPI and ACS Style
Meresa, H.; Donegan, S.; Golian, S.; Murphy, C. Simulated Changes in Seasonal and Low Flows with Climate Change for Irish Catchments. Water 2022, 14, 1556. https://doi.org/10.3390/w14101556
AMA Style
Meresa H, Donegan S, Golian S, Murphy C. Simulated Changes in Seasonal and Low Flows with Climate Change for Irish Catchments. Water. 2022; 14(10):1556. https://doi.org/10.3390/w14101556
Chicago/Turabian StyleMeresa, Hadush, Seán Donegan, Saeed Golian, and Conor Murphy. 2022. "Simulated Changes in Seasonal and Low Flows with Climate Change for Irish Catchments" Water 14, no. 10: 1556. https://doi.org/10.3390/w14101556
Note that from the first issue of 2016, this journal uses article numbers instead of page numbers. See further details here.