
GIS- and ICPR-Based Approach to Sustainable Urban Drainage Practices: Case Study of a Development Site in Florida


1
Emergent Technologies Institute, U.A. Whitaker College of Engineering, Florida Gulf Coast University, 16301 Innovation Lane, Fort Myers, FL 33913, USA
2
Department of Environmental Engineering, Civil Engineering and Construction Management, U.A. Whitaker College of Engineering, Florida Gulf Coast University, 10501 FGCU Blvd. So., Fort Myers, FL 33965, USA
3
Thomas L. Singleton Consulting, Inc., 285 Taylor Road, Monticello, FL 32344, USA
4
Albrecht Engineering Group, Limited Liability Company, Fort Pierce, FL 34979, USA
*
Author to whom correspondence should be addressed.
Water 2022, 14(10), 1557; https://doi.org/10.3390/w14101557
Submission received: 29 March 2022
/
Revised: 21 April 2022
/
Accepted: 9 May 2022
/
Published: 12 May 2022
(This article belongs to the Section Urban Water Management)
Abstract
:Stormwater control is an urgent concern in cities where the increased impervious surface has disrupted natural hydrology, particularly causing a reduction in groundwater recharge which is the source of potable water supply for many communities. Water managers are increasingly turning towards infiltration-based stormwater management options (ISMOs) to help minimize flooding and mitigate the impact of urbanization on the local hydrologic systems. This paper offers a unique hydrologic and hydraulic (H&H) modeling approach using the Geographic Information System (GIS) and Interconnected Pond and Channel Routing (ICPR) software to help quantify the associated flood stage and groundwater recharge benefits of using ISMOs. The proposed approach incorporated ICPR percolation links and utilization of the curve number and Green-Ampt infiltration methods into the case study design, as well as an analysis of the effectiveness of including low-impact development practices. This analysis shows a 13–36% reduction in stormwater volume leaving the proposed site when percolation links were utilized to account for percolation from the proposed ISMOs. These reduction provides an indirect estimate of groundwater recharge benefits. The conversion from impervious parking to a pervious one and inclusion of rainwater harvesting from the roof area resulted in a further reduction in peak stages ranging from 1.20 to 7.62 cm.
1. Introduction
Urbanization causes land use changes and increased impervious surfaces, which result in an increase in stormwater runoff that can potentially cause downstream flooding and changes in the local hydrology [1]. Effectively managing stormwater is a challenge faced by many cities around the globe and is increasingly difficult as urban populations grow [2,3]. An intensified hydrological cycle, increased extreme precipitation events, and the risk of flooding occurring in many regions as a result of climate change [4] make the challenge of stormwater management more complex. Stormwater management practices vary greatly in design, but most share the goal of mitigating the effects of runoff on receiving water bodies and the communities [5]. The first-generation best stormwater management practices, such as wet or dry ponds, were designed to reduce discharge through peak attenuation of the runoff generated in the watershed and release it slowly over time [6]. These practices, however, were historically designed with little regard to the design’s ability to maximize infiltration.
The implementation of infiltration-based stormwater management options helps minimize the impact of urbanization on water resources by reducing flooding, improving water quality, and maintaining groundwater recharge. Stormwater management approaches that emphasize infiltration and distributed storage may have the greatest potential for restoring natural pathways of water and the hydrological cycle [7,8]. For example, site-scale infiltration-based stormwater management options (ISMOs), such as bioretention [9], infiltration-based ponds [10], permeable pavements [11], and regenerative stormwater conveyance systems [12] have shown the potential to mitigate flooding and improve water quality. However, the connection between infiltration-based stormwater management and groundwater recharge is not straightforward [13]. Groundwater recharge can be highly spatially heterogeneous as a result of physical attributes including topography [14], arenosol type, depth to groundwater, and vadose zone porosity [15]. Storm characteristics, such as magnitude, duration, rate, and intensity, also play a key role in determining what part of precipitation becomes recharge [16]. While there is great consensus on the benefits of ISMOs, the existing stormwater modeling principles lack the emphasis and guidance to appropriately model stormwater percolation by an ISMO. In addition, a wide range of stormwater permit design criteria that have been implemented by environmental permitting agencies lacks a clear methodology to account for the infiltration capacities of the various ISMOs.
This paper aims to investigate the effectiveness of infiltration-based stormwater management options (ISMOs) to mitigate the impact of urbanization on groundwater recharge. It uses a unique percolation modeling approach to design ISMOs and quantify the associated flood stage and groundwater recharge volume benefits. The paper specifically applies the percolation model to design infiltration ponds, analyze percolation using the currently favored curve number (CN) and Green-Ampt (GA) hydrologic models, and evaluate the effectiveness of utilizing percolation with distributed low-impact development (LID).
2. Case Study
2.1. Case Study Site Description
A planned commercial development in Lehigh Acres, Florida, was used as a case study. Geographically, Lehigh Acres is located in eastern Lee County, Florida, at 26°36′30″ N, 81°38′21″ W. The geographic location of the study area is shown in Figure 1. Lehigh Acres is an intriguing focus study area since it represents one of the largest unincorporated areas in Florida in terms of population [17]. Most of the Lehigh Acres drainage basins discharge to the Caloosahatchee Estuary [18]. The Caloosahatchee Estuary was identified as an impaired water body by the Florida Department of Environmental Protection (FDEP) in 2005. Water quality environmental policy was established and continues to be managed by the FDEP to improve the dissolved oxygen and nutrients of the Caloosahatchee Estuary [19]. The planned development will require a permit through the Lehigh Acres Municipal Services Improvement District (LA-MSID) [20]. The existing vacant residential properties are proposed to be combined into a single 3630 m2 (0.897 ac) parcel to encompass the planned commercial development along Lee Boulevard (County Road 884). The project lies in a Federal Emergency Management Agency (FEMA) “X” flood zone, i.e., an area of minimal flood hazard that is outside the 500-year flood area and protected by a levee from 100-year floods [21].
The runoff from the site flows from the northern property line to the south and east. However, water is naturally retained on the site due to the surrounding development and the sidewalk along the southern boundary acting as a berm. Most of the arenosols (sandy soils) in this region are classified as having a high infiltration rate and a corresponding percolation ability [22]. The predevelopment arenosol classifications were obtained from the USDA/NRCS SSURGA soil survey (Figure 2).
According to the Lee County Land Development Code, 14 parking spaces are required per 93 m2 (1000 ft2) [23]. The planned development project consists of constructing a 152 m2 (1635 ft2) restaurant building and 31 associated parking spaces (eight more spaces than required). The resulting designated parking impervious area is 490 m2 (5274 ft2). The post-development runoff will be directed to detention areas. Combined with harvesting, rainwater from the 152 m2 (1635 ft2) roof, a 642 m2 (6909 ft2) impervious area will be reallocated for LID consideration in this study.
2.2. Study Area Stormwater Design Criteria
Stormwater management systems are designed in accordance with site-specific permit requirements. There are no common standardized criteria between countries or states for designing stormwater systems. However, there is a broad agreement between most standards to limit the generated total volume of runoff, flow rate, peak stage, and pollutant load and maintain the environmental quality. According to the South Florida Water Management District (SFWMD), the permittee must self-certify that the proposed development will not:
- Cause adverse flooding to on-site or off-site property;
- Cause adverse water quality and quantity impacts;
- Cause adverse impacts to wetlands, fish, or wildlife;
- Adversely affect public health, safety, and welfare;
- Impair navigation or surface water flows;
- Adversely affect nearby fishing or recreational uses [24].
With the proposed development being located within the SFWMD and LA-MSID jurisdiction, certain quantitative permitting guidelines are required. The SFWMD requires developers to maintain road and parking crown elevations higher than the 5-year 1-day design storm maximum flood stage, construct a perimeter berm top elevation that is higher than the 25-year 3-day design storm maximum flood stage, and meet a minimum building finish flood elevation that is higher than the 100-year 3-day design storm maximum flood stage [25]. However, because the project is less than 40,469 m2 (10 acres) of the total project area and less than 8094 m2 (two acres) of impervious surface, the development qualifies for a No Notice General 10-2 Permit for small projects. Similarly, because the development is less than 4047 m2 (one acre), a notice of intent permit with the Florida Department of Environmental Protection is not required [25]. The development does, however, necessitate an LA-MSID permit, which includes the following design criteria shown in Table 1.
However, the maximum discharge rate shown in Table 1 above is commonly not achieved due to the SFWMD design criterion that limits the maximum allowable bleeder diameter to 7.62 cm (3 in). This minimal bleeder size criterion was created to mitigate small bleeder clogging issues, but the policy creates a conflict in small developments where the post-development discharge rate is larger than the maximum allowable discharge rate. Small developments are also often not a candidate for wet retention due to the minimum geometry requirements, including a minimum of 30.5 m (100 ft) average width [25].
Concerning water quality design requirements, wet detention volume must provide for the first 2.54 cm (1.0 in) of runoff from the developed project or the total runoff of 6.35 cm (2.5 in) times the percentage of imperviousness, whichever is greater. For Environmental Resource Permit (ERP) applications where the proposed development’s discharge is routed to discharge to an impaired waterbody, additional protective design measures must be incorporated into the project to provide reasonable assurance that there are no adverse environmental impacts [25]. As LA-MSID is responsible to uphold high municipal separate storm sewer system water quality and BMP permitting standards, an additional 50% water quality treatment volume is often required for developments within the Orange River Drainage Basin [20].
3. Materials and Methods
3.1. Design Methodology for Infiltration-Based Stormwater Management Options (ISMOs)
This paper proposes a methodology for designing ISMOs based on two guiding principles: (i) ISMOs to help minimize flooding and mitigate the impact and (ii) ISMOs to maximize infiltration and augment water supply. It offers a unique hydrologic and hydraulic (H&H) modeling approach using the Geographic Information System (GIS) and Interconnected Pond and Channel Routing version 4 (ICPRv4) software [26] to help quantify the associated flood stage and groundwater recharge volume benefits of using ISMOs. The proposed approach incorporated ICPR version 4 “percolation links” into the H&H modeling to estimate groundwater recharge and meet permit requirements. Figure 3 shows a flow chart as a methodology for designing ISMOs that includes GIS-based study area characterization and ICPR model setup, an ISMO selection and percolation model, permit and design requirements, ISMO design/sizing, and estimation of groundwater recharge.
The methodology includes the application of GIS for study area/basin delineation and characterization for both pre-and post-development conditions. GIS-based study area characterization includes delineation and mapping of subbasins, drainage boundaries, topography, land use, land cover, and hydraulic soil groups. This facilitates the development of accurate spatial features for the ICPR model setup. The GIS data is imported into the ICPR model to develop hydrology and hydraulic features such as basins, nodes, links, and control structures.
The ISMO siting and selection step is used to identify potential locations/areas for implementing different types of ISMOs. The selection of suitable locations is based on the defined site suitability criteria, such as drainage area, slope, hydrological soil group, groundwater table depth, and road, stream, and building buffers.
This methodology offers a unique approach to better estimate percolation. In the case of post-development conditions, the percolation model for each retention area needs to provide a connection between the groundwater and ISMO storage nodes. The percolation model needs to include percolation links and percolation rings. Percolation links for ISMOs are used to move water from one node to another. For example, a percolation link can be used to connect a pond (e.g., a stage-area node type designated as “Pond”) to a groundwater sink (e.g., a time-stage node designated as “Soil Column”). The Pond receives inflow from runoff hydrographs. The flow rate for the percolation link depends on the water level in the pond and the location of the water table below and adjacent to the pond. A percolation ring is a perimeter ring around ISMOs and is used to specify saturated horizontal flow computations. Perimeter rings can be drawn and offset in ICPR [26]. For example, the perimeter ring can be placed around a pond and far enough away from the pond to allow the groundwater mound to dissipate into the ambient water table.
The design of ISMOs is guided by site-specific permit requirements for new developments and associated design storm events. The LA-MSID permitting criteria were used for the case study site development. A single ISMO or a combination of ISMOs could be modeled, designed, and analyzed for its/their performance in meeting the permit requirements (that focus on minimizing flooding and mitigating water quality impact) while maximizing groundwater recharge.
3.2. Predevelopment Conditions
The study area predevelopment surface cover is defined as an open pervious land. A polygon of the project limits was defined, which encompasses the construction limits, drainage basin boundary, surface cover, and subbasins (Figure 4).
The arenosols were classified through the GA parameters, which included values such as the saturated vertical hydraulic conductivity, moisture content, and pore size index represented as a percentage of the soil’s mass (decimal), bubble pressure, and depth to the water table (Table 2).
The predevelopment time of concentration was developed utilizing the TR-55 method for subbasins [27]. A node for each depression within the drainage boundary was digitized, as well as a boundary time-stage node for each outfall location with corresponding drainage connection links (Figure 5). The Light Detection and Ranging (LIDAR) elevations reference the North American Datum of 1983 (NAD 83), which is the horizontal and geometric control datum for the United States, Canada, Mexico, and Central America aligned to the Geodetic Reference System of 1980.
3.3. Post-Development Conditions
The post-development stormwater system design was an iterative process. The model results were utilized to refine the input data until the design adequately adhered to the permitting criteria. The proposed stormwater management area contours were delineated for each proposed stormwater management feature at the bottom and top of each proposed pond, as well as at 0.31 m (1 ft) intervals. The post-development surface cover categories of directly connected impervious areas (DCIAs), indirectly connected impervious areas, pervious surfaces, and pond stormwater management areas were also digitized for the entire drainage boundary. The case study arenosol zone includes type A for DCIAs and pervious areas and type D for the pond/wetland area. Figure 6 shows the post-development land cover and pond layout.
The same arenosol type was classified for the post-development conditions since there was assumed to be no arenosol augmentation as part of this development. The sub-drainage areas were then delineated based on the proposed grading plan for each stormwater area, as well as any unaffiliated areas within the proposed project limits. The post-development time of concentration was developed utilizing the TR-55 method. Stage-area nodes were digitized for each proposed stormwater management area and unaffected depressional areas, as well as the delineation of each hydraulic connection within and leaving the project drainage basin. To model the groundwater infiltration, groundwater boundary nodes were created for each stormwater management area. Graphical representation and placement of these features are given in Figure 7.
3.4. ICPR 4 Model Setup for ISMOs
The pre-and post-development GIS data were utilized to build the ICPR 4 model. Table 3 provides structure details utilized for this site to meet the permitting criteria for this specific location, as well as the corresponding ICPR model nomenclature. A visual representation of the ICPR 2D model diagram for the pre-and post-development conditions is given in Figure 8.
As shown in Figure 8b, flows within subbasins are directed to the two ponds, equalized through inlets connected with a pipe, and ultimately discharge the site through an inlet drop structure. The post-development model incorporates percolation links (Pond_Perc) that connect an ISMO (i.e., pond-stage area or volume node type) to a groundwater sink (i.e., a time-stage node). The flow rate for the percolation link depends on the water level in the pond, soil hydraulic conductivity, and the location of the water table below the pond. The details of the percolation link model and required parameters are discussed in the subsection below.
3.5. ISMO Percolation Model
For this case study, the post-development percolation links for each retention pond were digitized, which provided connection and interaction between the groundwater and storage nodes (Figure 9). The percolation link parameters utilized are shown in Table 4.
In addition to the three perimeter lengths, the offset distances from P-1 to P-2 and from P-2 to P-3 must be specified in the ICPR model. These do not have to be equal. The distance from P1 to P2 is typically shorter than from P2 to P3. For this study area, the perimeter lengths and offset distances shown in Figure 10 were used in the ICPR post-development model setup with percolation.
The following three design storms with varying simulation parameters were utilized to produce model results as summarized in Table 5.
4. Results and Discussion
4.1. ICPR 4 Model Results–Peak Stage and Maximum Flow Rate
Three design storm events were run to determine the maximum flow rate and stage for the study area. Table 6 demonstrates a summary of the peak stages of the proposed development. The initial water table was defined to be 0.3 m (1 ft) below the ground in the GA parameters, which means that the initial water table was at elevation 6.7 m NAVD (22.0 ft NAVD) for this specific site.
The 25-year 3-day SFWMD storm event was considered to determine the maximum pre- vs. post-development flow rate design requirement per the LA-MSID permitting guidelines [20]. The predevelopment maximum flow rate was 141 L/s (4.99 ft3/s) and the post-development flow rate was 11 L/s (0.39 ft3/s), with the 7.62 cm (3 in) bleeder placed at 6.7 m (22.0 ft) NAVD, which is the control elevation for this specific site (the lowest elevation at which water can be released through the control device).
4.2. Outfall Control Structure, Parking Crown, and Building Floor Elevations
To comply with the LA-MSID permitting guidelines [20], the results from a 25-year 3-days design storm were used to determine the minimum berm elevation. The maximum stage attained during the 25-year 3-day design storm was 7.58 m (24.87 ft) NAVD. The minimum proposed perimeter berm elevation should therefore be set at or above this peak stage elevation. The proposed outfall control structure grate top elevation should be set at or above 7.58 m (24.87 ft) NAVD. As a constructability consideration or inclusion of a factor of safety, the proposed outfall control structure grate top elevation could be rounded to 7.62 m (25.0 ft). The 7.62 cm (3 in) bleeder should be set at least 30.5 cm (1 ft) below the bottom of the dry detention areas to allow for proper infiltration to occur. Although not explicitly outlined in the permitting criteria, the best management practice could be to set the berm elevation at least 15.2 cm (0.5 ft) above the 25-year 3-day peak stage, or about 7.77 m (25.5 ft) NAVD. This would allow for a construction tolerance to account for any unexpected berm settling that may occur due to unforeseen arenosol loadings or improper earthwork compaction construction methods. For larger developments, peak stages can be influenced by high winds, which can stack retained stormwater along a given boundary. The abovementioned best management practice would also help mitigate the risk of peak stages exceeding the perimeter berm during storm events coupled with high winds.
With the 25-year 3-day design storm producing a peak stage of 7.58 m (24.87 ft) NAVD, the minimum road and parking lot grade should be greater than 7.58 m (24.87 ft) NAVD. For simplicity and constructability purposes, the development design could consider a proposed elevation of 7.62 m (25.0 ft) NAVD. The results from a 100-year 3-day design storm were used to determine the building floor elevation. Modeling the 100-year 3-day design storm, the system’s resulting peak stage was 7.64 m (25.05 ft) NAVD. The minimum building finished floor elevation within the development should be set at or above 7.64 m (25.05 ft) NAVD. As a best management practice, a safety factor can be applied to increase the proposed finished floor by 15.2 to 30.5 cm (from 0.5 ft to 1.0 ft).
4.3. Detention Pond Size for Water Quality
The first 2.54 cm (1 in) of runoff equate to 92 m3 (3258 ft3), whereas 2.5 times the percentage impervious area equals 94 m3 (3307 cubic ft3). Therefore, 94 m3 (3307 ft3) wet detention volume is required to be available for water quality below the water control structure grate top of 7.62 m (25.0 ft). As the LA-MSID is responsible for upholding high water quality and BMP permitting standards, an additional 50% water quality treatment volume was applied, which increased the required water quality treatment volume to 140.5 m3 (4960.5 ft3). As per the SFWMD conservative best management practice approach, an additional 1.27 cm (0.5 in) of treatment volume was applied to this development, which increased the required water quality treatment volume to 186.6 m3 (6589 ft3). From the stage/area tables developed for the north and south ponds through an interactive process, there was 234.4 m3 (8276 ft3) water quality volume provided below the elevation of 7.62 m (25.0 ft).
4.4. Infiltration Estimation Using ICPR 4 Percolation Links
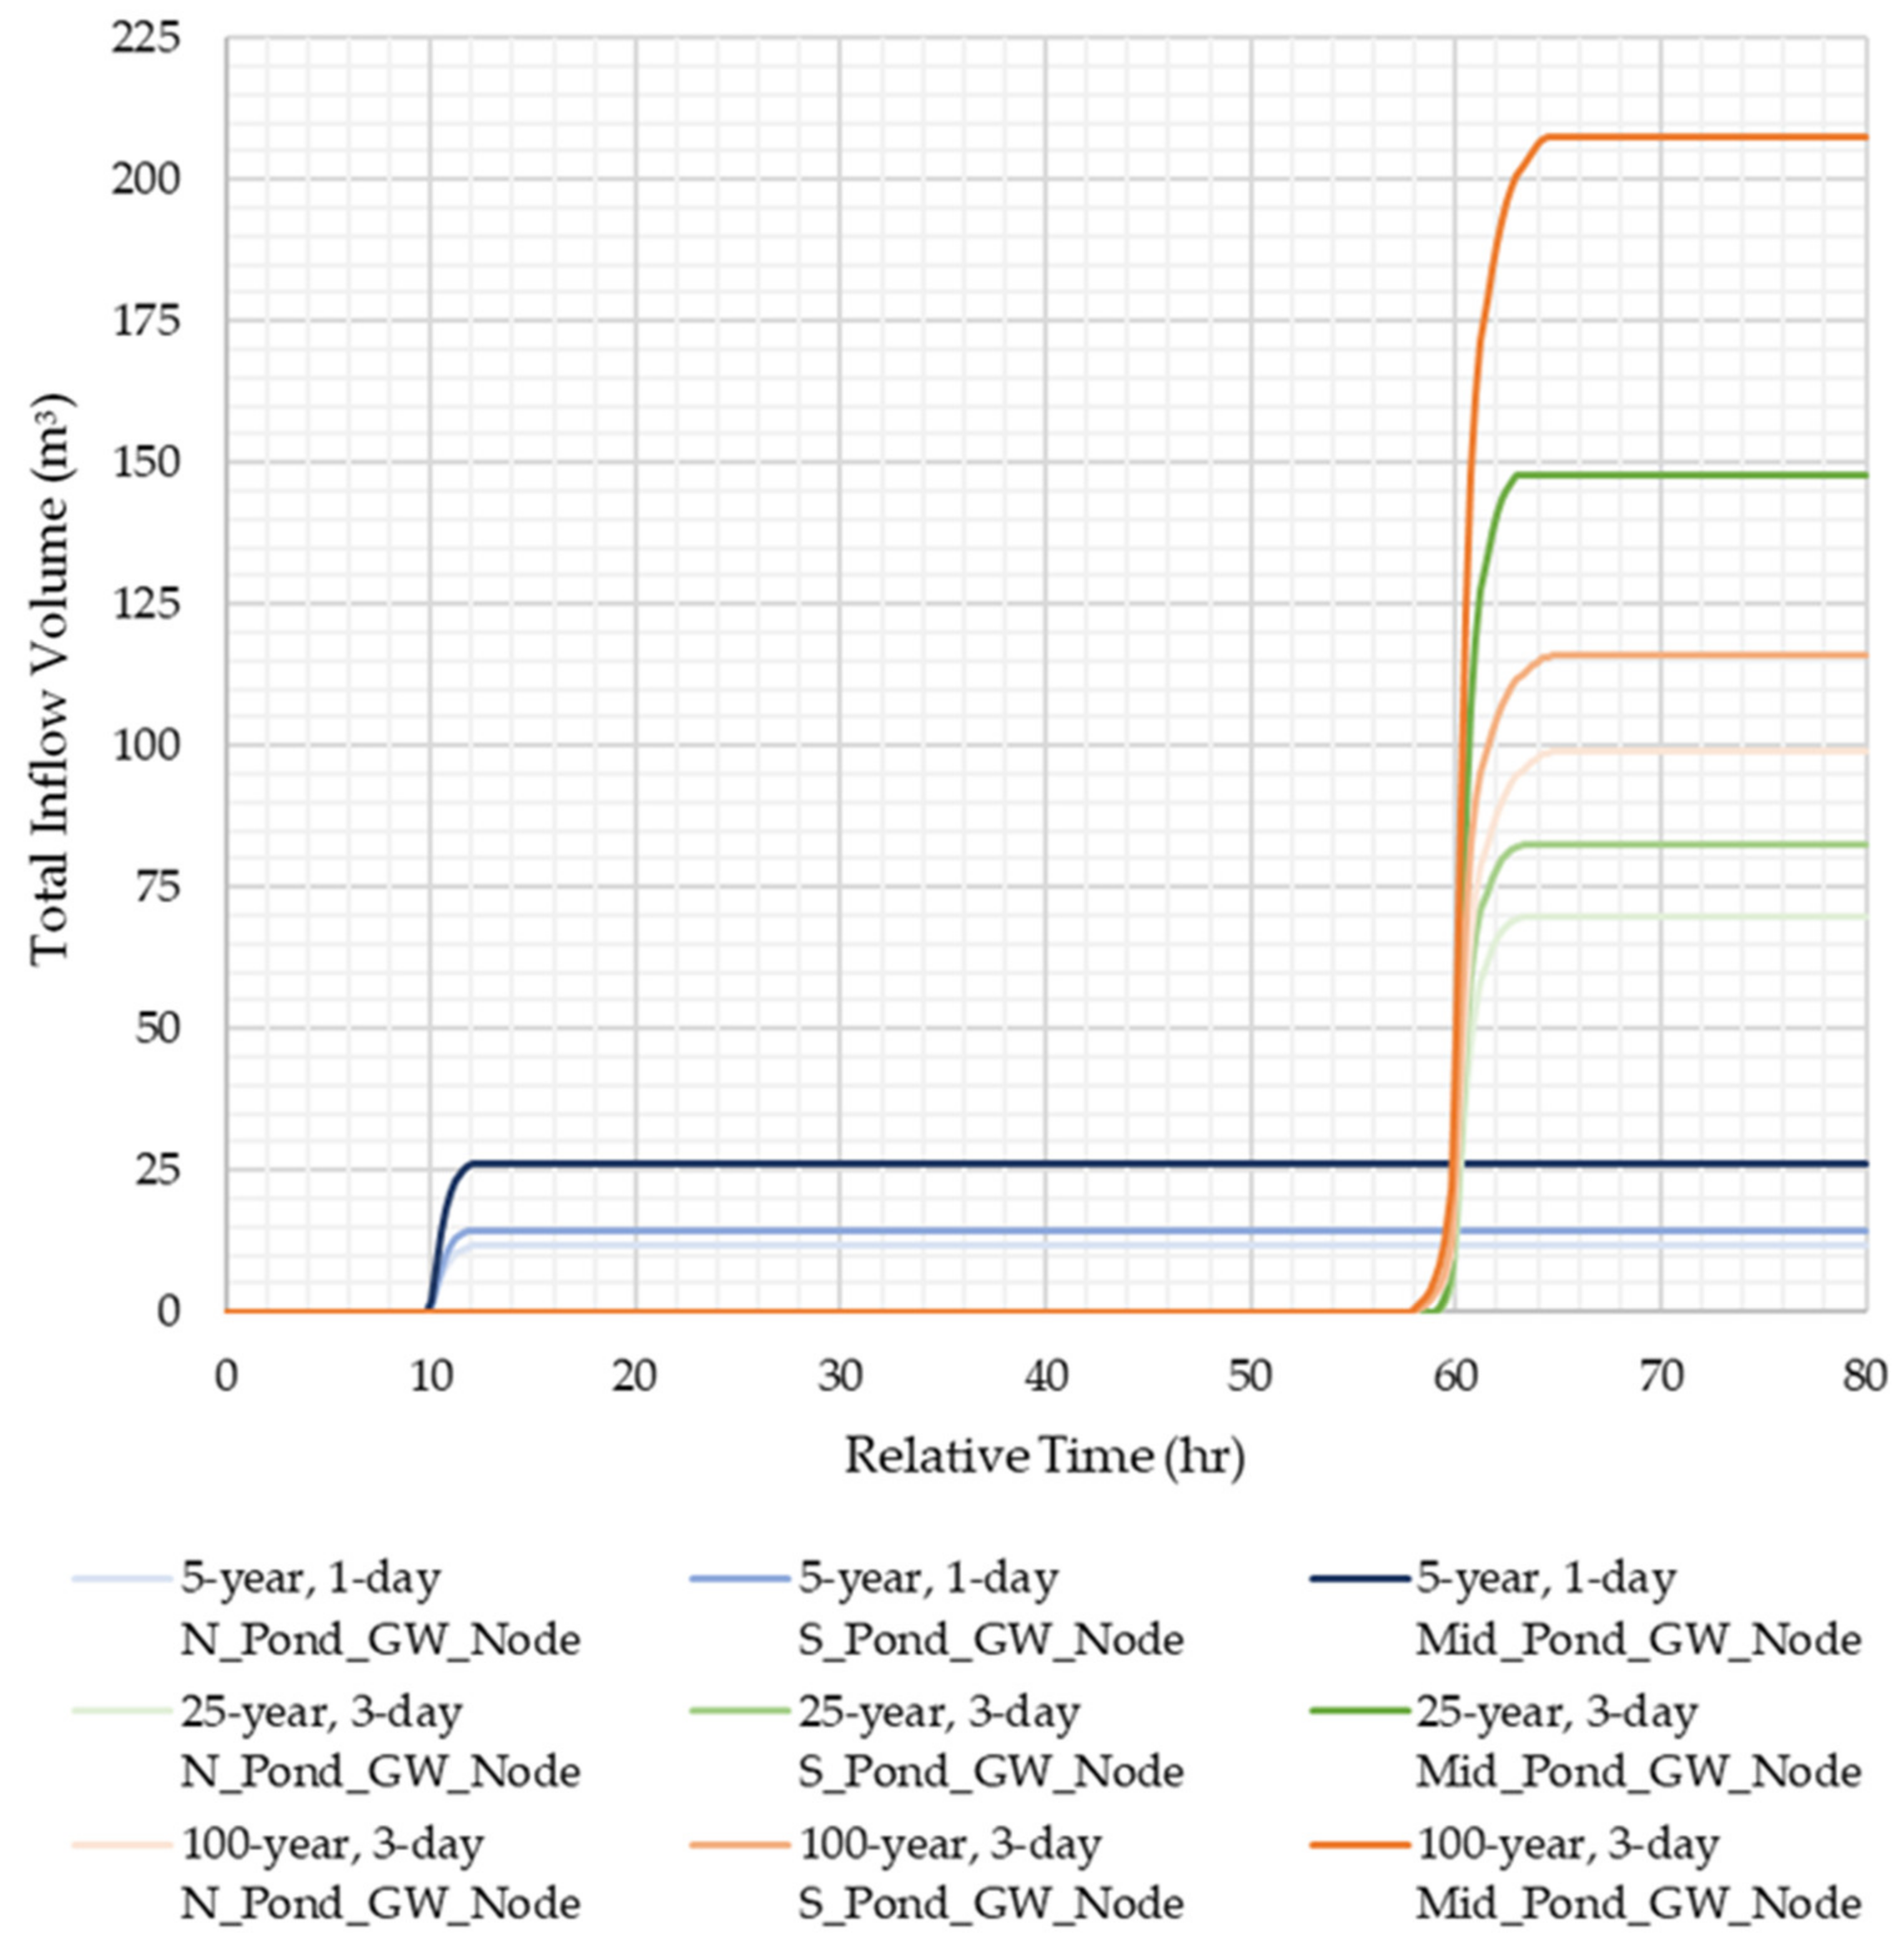
For smaller development sites, engineers often choose to estimate the arenosol storage rather than incorporate percolation estimations into their stormwater modeling. For example, the control elevation of the project was 6.7 m (22.0 ft) NAVD, with the average grade over the pervious area being about 7.55 m (24.77 ft) NAVD. The average depth to the water table was, therefore, 7.55 m (24.77 ft) minus 6.71 m (22.0 ft), which equals 0.84 m (2.77 ft). From the arenosol storage chart in the ERP Information Manual (compacted normal typical sandy), 5.1 cm (2.0 in) of arenosol storage under the pervious areas were available [28], which equates to about 1.5 cm (0.58 in) of arenosol storage over the entire site. This does not account for factors that impact percolation such as initial moisture content, water table elevation, and hydraulic conductivity. However, ICPR can estimate infiltration rates more precisely through the use of percolation links. The input values selected generated infiltration rates for a 5-year 1-day storm; a 25-year 3-day storm; and a 100-year 3-day storm (Figure 11).
The delay in infiltration was due to the initial abstraction and the fact that the various design storm hydrographs do not simulate higher rainfall amounts until later in the storm duration [29]. Note that the node labeled “Mid_Pond_GW_Node” represents the combined flow that is split between the northern and southern ponds.
4.5. Analysis of the Effectiveness of Utilizing Percolation Links
To evaluate the effectiveness of utilizing percolation links, four analyses were performed, including GA hydrology with and without percolation links and CN hydrology with and without percolation links. Table 7 shows the data utilized for the CN analysis.
The three storm events were run to analyze the effect of percolation in modeling ISMOs. Table 8 demonstrates the summary of the peak stages for the proposed development with and without percolation, as well as a comparison to the CN infiltration method.
The previously selected pond sizing was still adequate to meet the design requirement. The outfall control structure grate top, however would need to be raised to a minimum of 7.70 m (25.27 ft) if applying the modeling GA approach without percolation links or 7.67 m (25.17 ft) if applying the CN methodology without percolation links. This adjustment to the outfall control structure would also require an increase in the perimeter berm to 15.2 cm (6 in) above the corresponding 25-year 3-day peak stages. The minimum building finished floor elevation would likewise need to be raised above the 100-year 3-day peak stage of 7.73 m (25.37 ft) if applying the modeling GA approach without percolation links or 7.71 m (25.30 ft) if applying the CN methodology without percolation links. The increase in the perimeter berm and outfall control structure grate top elevation would allow for the water quality requirements to be met within the same pond footprints. Although the costs associated with the additional earthwork embankment are minimal for this development’s example; applied to a larger development, the additional costs could be considerable. The use of percolation links in modeling may therefore prove to be a cost-effective design alternative as compared to CN or GA modeling without percolation links for large development projects.
A volumetric comparison of pre- vs. post-development conditions with and without percolation link modeling is summarized in Table 9. Due to the 7.62 cm (3 in) bleeder, an increase in the post-development volume leaving the site was observed for the 5-year 1-day storm event. For the larger two storms, however, modeling with percolation links resulted in a reduction in stormwater volume leaving the site for both the CN and GA hydrology methods. Although a comparison of stormwater volume leaving the site from the pre- vs. post-development condition shows the benefit of modeling with percolation links, Table 9 provides a direct comparison of the post-development condition.
Modeling with percolation links is demonstrated to result in a substantial reduction in stormwater leaving the site vs. without percolation links. In comparing percolation infiltration methods for this specific development example, the CN method was shown to capture additional infiltration volume as compared to the GA method as 50 m3 (1757 ft3) of additional stormwater volume is retained on site for the 100-year 3-day storm event. In addition, 32–36% of the stormwater runoff volume leaving the site, when modeled without percolation, was demonstrated to instead infiltrate and contribute to groundwater recharge when modeled with percolation links for the 100-year 3-day storm event.
4.6. Analysis of the Inclusion of Distributed Low-Impact Development Components
LID is a land development strategy to manage rainfall at the source through interaction with nature to reduce the quantity of stormwater runoff leaving the site [30]. Improved water quality is also accomplished through decentralized small-scale control measures within the area of development [31]. Demonstrating the effectiveness of adopting LID practices in stormwater system design could lead to an increase in widespread adoption. For the investigated development, about half of the parcel area (Table 10) is proposed to be designated as impervious (building, pavement, and parking) and stormwater pond areas, with the remaining 25% allocated as pervious areas (open and sodded surfaces). The choice of LID component inclusion for analysis is focused on the relocation of impervious areas to pervious areas, where practical.
Three additional scenarios were modeled for the post-development condition. A rainwater harvesting scenario included reallocating 152 m2 (1635 ft2) of the DICA-impervious area (roof surface area) to be collected and stored in rain barrels. The pervious parking scenario included reallocating 490 m2 (5274 ft2) of the DICA-impervious area to a pervious area as pervious parking can allow for infiltration of runoff. The third scenario included the combination of utilizing both LID components.
The three storm events were run utilizing the GA model to analyze the effectiveness of including LID components. Table 11 demonstrates the summary of the peak stages for the proposed development when including LID components.
While larger storm events demonstrated about a 1.22 cm (0.5 in) reduction to the peak stage, the inclusion of both LID components with percolation resulted in a 7.62 cm (3 in) reduction in the peak stage for the 5-year 1-day storm event. This indicates that decentralized microscale implementation of LIDs with percolation can be used to better promote predevelopment site hydrology.
5. Limitations and Recommendations
A reduction in modeled peak stages should be analyzed with sound engineering judgment before adjusting design parameters. Although groundwater mounding effects were included in the modeling of the investigated development, the influence of the adjoining development’s stormwater facilities was not fully incorporated. Before reducing the proposed finished floor or perimeter berm elevations, a regional understanding of how extreme storm events have historically affected the region should be considered. For example, Lee County experienced two consecutive storm events in 2017, Invest 92 L (meteorology term for disturbed weather in the North Atlantic basin that has the potential to develop into a tropical cyclone) and Hurricane Irma. These cumulative rainfall events were categorized as 100-year storms, and even worse in some locations [19]. These storms caused significant structure flooding in downstream locations across Lee County, including along the Orange River. Widespread and prolonged roadway flooding also affected many citizens for several days [18]. These back-to-back large storm events reduced the percolation potential as the arenosols were already saturated leading into the second storm, which was a major hurricane. In addition, the event-based rainfall–runoff models such as the SCS and GA could show different sensitivity to saturation and hydraulic conductivity. However, the comparison and calibration of such models are a well-established topic and is not the focus of this paper.
During extreme storm events, basins and watersheds often merge or become unpredictable, depending on the path of the storm system [19]. The control elevation for this development was selected to be 6.71 m (22.00 ft) NAVD, which is greater than the receiving water body’s weir crest of 5.86 m (19.21 ft) NAVD, which should allow for positive discharge during normal seasonal storm events. Developers should seek to understand the hydrology and limitations of the downstream conveyance system. Although the study area is not historically prone to severe flooding during large storm events, the stormwater runoff from this development combined with other upstream developments can have a significant impact. Extreme storm events and the associated flooding impacts emphasize the need to include a review of regional studies and flood mitigation plans when considering localized development.
6. Conclusions
This study investigates the effectiveness of infiltration-based stormwater management options (ISMOs) to mitigate the impact of urbanization on groundwater recharge. It offered a unique hydrologic and hydraulic (H&H) modeling approach to design ISMOs with percolation and quantify the associated flood stage and groundwater recharge volume benefits. It provided new insight into the application of the GIS and ICPRv4 software to model a percolation link/ring, which captures the saturated horizontal and vertical flow between ISMOs and groundwater. The study used infiltration-based ponds as one of the ISMOs for planned development in Florida. Even though the comparison and calibration of curve number (CN) and Green-Ampt (GA) event-based rainfall–runoff models are well-established topics, this paper used the models to evaluate the percolation of ISMOs using ICPR. To analyze the effectiveness of utilizing percolation links, the same pond layout with two sets of analyses was performed, including pond design with and without percolation for both the CN and GA models. This analysis shows a significant reduction in quantified stormwater volume leaving the proposed site when percolation links were utilized to account for percolation from the proposed ISMO. More specifically, incorporation of percolation links into the H&H analysis resulted in a reduction of stormwater volume leaving the site for 5-year 1-day, 25-year 3-day, and 100-year 3-day design storms using a CN model with percolation (14%, 28%, and 32%), whereas using a GA model with percolation—by 13%, 33%, and 36%, respectively. These reductions provide an indirect estimate of groundwater recharge benefits.
In addition, the developed methodology is used to evaluate the impact of percolation integrated with other LID practices such as pervious parking and rainwater harvesting options. The inclusion of LID components was shown to further decrease the peak stages. It was shown that the conversion of impervious parking into pervious parking and the addition of rainwater harvesting from the 152 m2 (1635 ft2) roof area resulted in a reduction of peak stages ranging from 1.27 to 7.62 cm (0.5 to 3 in). While pervious pavement reduced peak discharge rates significantly by diverting stormwater into the ground, the rainwater harvesting option significantly increased the retention potential and helped reduce peaks of stormwater runoff conveyed to ISMOs. Coupled with an appropriate percolation modeling approach, ISMOs could play a key role in the integrated planning of water security and flood mitigation in urban areas. This will also help to reduce the pressure on the existing drainage system making urban water management effective and more sustainable.
Although this study fills the research gap through the case study in Florida, further studies should be performed to compare with similar studies across the nation. A maintenance plan should also be considered for each development. The plan should include routine removal of excessive and invasive vegetation, removal of sediment buildup in structures, and observation of the stormwater pond’s ability to percolate. A good maintenance plan increases the longevity of a drainage facility and allows for maximum percolation capacity during storm events. Properly designed, constructed, and maintained ISMOs provide the greatest benefit to water resources in the community.
Author Contributions
Conceptualization, T.L.S., S.T. and K.K.A.; methodology, T.L.S. and S.T.; validation, K.K.A.; formal analysis, D.W.S.; investigation, D.W.S.; resources, T.L.S. and S.T.; data curation, D.W.S.; writing—original draft preparation, D.W.S.; writing—review and editing, T.L.S., S.T. and K.K.A.; visualization, D.W.S.; supervision, S.T.; project administration, S.T. All authors have read and agreed to the published version of the manuscript.
Funding
This research received no external funding.
Institutional Review Board Statement
Not applicable.
Informed Consent Statement
Not applicable.
Data Availability Statement
Data are contained within the article.
Conflicts of Interest
The authors declare no conflict of interest.
References
- Aguiar, C.R.; Nuernberg, J.K.; Leonardi, T.C. Multicriteria GIS-Based Approach in Priority Areas Analysis for Sustainable Urban Drainage Practices: A Case Study of Pato Branco, Brazil. Eng 2020, 1, 96–111. [Google Scholar] [CrossRef]
- Grimm, N.B.; Faeth, S.H.; Golubiewski, N.E.; Redman, C.L.; Wu, J.; Bai, X.; Briggs, J.M. Global change and the ecology of cities. Science 2008, 319, 756–760. [Google Scholar] [CrossRef] [PubMed] [Green Version]
- Jiang, Y.; Zevenbergen, C.; Ma, Y. Urban pluvial flooding and stormwater management: A contemporary review of China’s challenges and ‘sponge cities’ strategy. Environ. Sci. Policy 2018, 80, 132–143. [Google Scholar] [CrossRef]
- Westra, S.; Alexander, L.V.; Zwiers, F.W. Global increasing trends in annual maximum daily precipitation. J. Clim. 2013, 26, 3904–3918. [Google Scholar] [CrossRef] [Green Version]
- Baker, D.B.; Richards, R.P.; Loftus, T.T.; Kramer, J.W. A new flashiness index: Characteristics and applications to midwestern rivers and streams. JAWRA J. Am. Water Resour. Assoc. 2004, 40, 503–522. [Google Scholar] [CrossRef]
- Burns, M.J.; Fletcher, T.D.; Walsh, C.J.; Ladson, A.R.; Hatt, B.E. Hydrologic shortcomings of conventional urban stormwater management and opportunities for reform. Landsc. Urban Plan. 2012, 105, 230–240. [Google Scholar] [CrossRef]
- Hood, M.J.; Clausen, J.C.; Warner, G.S. Comparison of Stormwater lag times for low impact and traditional residential development. JAWRA J. Am. Water Resour. Assoc. 2007, 43, 1036–1046. [Google Scholar] [CrossRef]
- Tsegaye, S.; Singleton, T.L.; Koeser, A.K.; Lamb, D.S.; Landry, S.M.; Lu, S.; Barber, J.B.; Hilbert, D.R.; Hamilton, K.O.; Northrop, R.J.; et al. Transitioning from gray to green (G2G)—A green infrastructure planning tool for the urban forest. Urban For. Urban Green. 2019, 40, 204–214. [Google Scholar] [CrossRef]
- Davis, A.P.; Hunt, W.F.; Traver, R.G.; Clar, M. Bioretention technology: Overview of current practice and future needs. J. Environ. Eng. 2009, 135, 109–117. [Google Scholar] [CrossRef]
- Wadhwa, A.; Kummamuru, P.K. A study on the effectiveness of percolation ponds as a stormwater harvesting alternative for a semi-urban catchment. AQUA—Water Infrastruct. Ecosyst. Soc. 2021, 70, 184–201. [Google Scholar] [CrossRef]
- Yu, Z.; Gan, H.; Xiao, M.; Huang, B.; Zhu, D.Z.; Zhang, Z.; Wang, H.; Lin, Y.; Hou, Y.; Peng, S.; et al. Performance of permeable pavement systems on stormwater permeability and pollutant removal. Environ. Sci. Pollut. Res. 2021, 28, 28571–28584. [Google Scholar] [CrossRef] [PubMed]
- Cizek, A.R. Quantifying the Stormwater Mitigation Performance and Ecosystem Service Provision in Regenerative Stormwater Conveyance (RSC). 2014. Available online: https://repository.lib.ncsu.edu/bitstream/handle/1840.16/9997/etd.pdf?sequence=2 (accessed on 28 October 2020).
- Bhaskar, A.S.; Hogan, D.M.; Nimmo, J.R.; Perkins, K.S. Groundwater recharge amidst focused stormwater infiltration. Hydrol. Process. 2018, 32, 2058–2068. [Google Scholar] [CrossRef]
- Delin, G.N.; Healy, R.W.; Landon, M.K.; Böhlke, J.K. Effects of topography and soil properties on recharge at two sites in an agricultural field. JAWRA J. Am. Water Resour. Assoc. 2000, 36, 1401–1416. [Google Scholar] [CrossRef]
- Thomas, B.F.; Behrangi, A.; Famiglietti, J.S. Precipitation intensity effects on groundwater recharge in the southwestern United States. Water 2016, 8, 90. [Google Scholar] [CrossRef] [Green Version]
- Tashie, A.M.; Mirus, B.B.; Pavelsky, T.M. Identifying long-term empirical relationships between storm characteristics and episodic groundwater recharge. Water Resour. Res. 2016, 52, 21–35. [Google Scholar] [CrossRef] [Green Version]
- Stroud, H.B. Rapid Growth and Development at Lehigh Acres, Florida Despite Faulty Layout and Design. Fla. Geogr. 2006, 36, 46–57. [Google Scholar]
- AIM Engineering & Surveying, Inc. Southern Lee County Flood Mitigation Plan. 2020. Available online: https://www.leegov.com/flooding/Documents/SOUTHERN%20LEE%20COUNTY%20FLOOD%20MITIGATION%20PLAN.pdf (accessed on 18 November 2020).
- AIM Engineering & Surveying, Inc. Hurricane Irma Post Storm Investigation. 2018. Available online: https://www.leegov.com/irma/Documents/FloodReports/aim.pdf (accessed on 16 November 2020).
- LA-MSID Permitting Policy. Available online: http://www.myecwcd.net/wp-content/uploads/2011/03/Section-4-Permitting-approved-9-21-2015.pdf (accessed on 27 November 2020).
- Flood Insurance Rate Maps. Available online: https://www.leegov.com/gis/maps/printable-maps/firm (accessed on 15 November 2020).
- Boggess, D.H.; Missimer, T.M. A Reconnaissance of Hydrogeologic Conditions in Lehigh Acres and Adjacent Areas of Lee County, Florida. 1975. Available online: https://pubs.er.usgs.gov/publication/ofr7555 (accessed on 9 October 2020).
- Lee County Land Development Code. Available online: https://library.municode.com/fl/lee_county/codes/land_development_code (accessed on 16 November 2020).
- South Florida Water Management District. Regulation—Permits. Available online: https://www.sfwmd.gov/doing-business-with-us/permits (accessed on 18 October 2020).
- Applicant’s Handbook Vol. II. Available online: https://www.sfwmd.gov/sites/default/files/documents/swerp_applicants_handbook_vol_ii.pdf (accessed on 15 November 2020).
- Streamline Technologies Inc. Interconnected Channel and Pond Routing Model. Available online: https://streamnologies.com/content/index.php/about-icpr-4/ (accessed on 23 October 2020).
- Conservation Engineering Division. Conservation Engineering Division Technical Release 55. 1986. Available online: https://www.nrcs.usda.gov/Internet/FSE_DOCUMENTS/stelprdb1044171.pdf (accessed on 18 November 2020).
- South Florida Water Management District. Environmental Resource Permit Information Manual. 2014. Available online: https://www.sfwmd.gov/sites/default/files/documents/archive_erp_swerp_manual_10032013.pdf (accessed on 2 November 2020).
- Lim, K.J.; Engel, B.A.; Muthukrishnan, S.; Harbor, J. Effects of Initial Abstraction and Urbanization on Estimated Runoff Using CN Technology. J. Am. Water Resour. Assoc. 2007, 42, 629–643. [Google Scholar] [CrossRef]
- Ahiablame, L.M.; Engel, B.A.; Chaubey, I. Effectiveness of Low Impact Development Practices: Literature Review and Suggestions for Future Research. Water Air Soil Pollut. 2021, 223, 4253–4273. [Google Scholar] [CrossRef]
- Martin-Mikle, C.J.; Beurs, K.M.; Julian, J.P.; Mayer, P.M. Identifying priority sites for low impact development (LID) in a mixed-use watershed. Landsc. Urban Plan. 2015, 140, 29–41. [Google Scholar] [CrossRef] [Green Version]
Figure 1.
The geographic location of the study area.
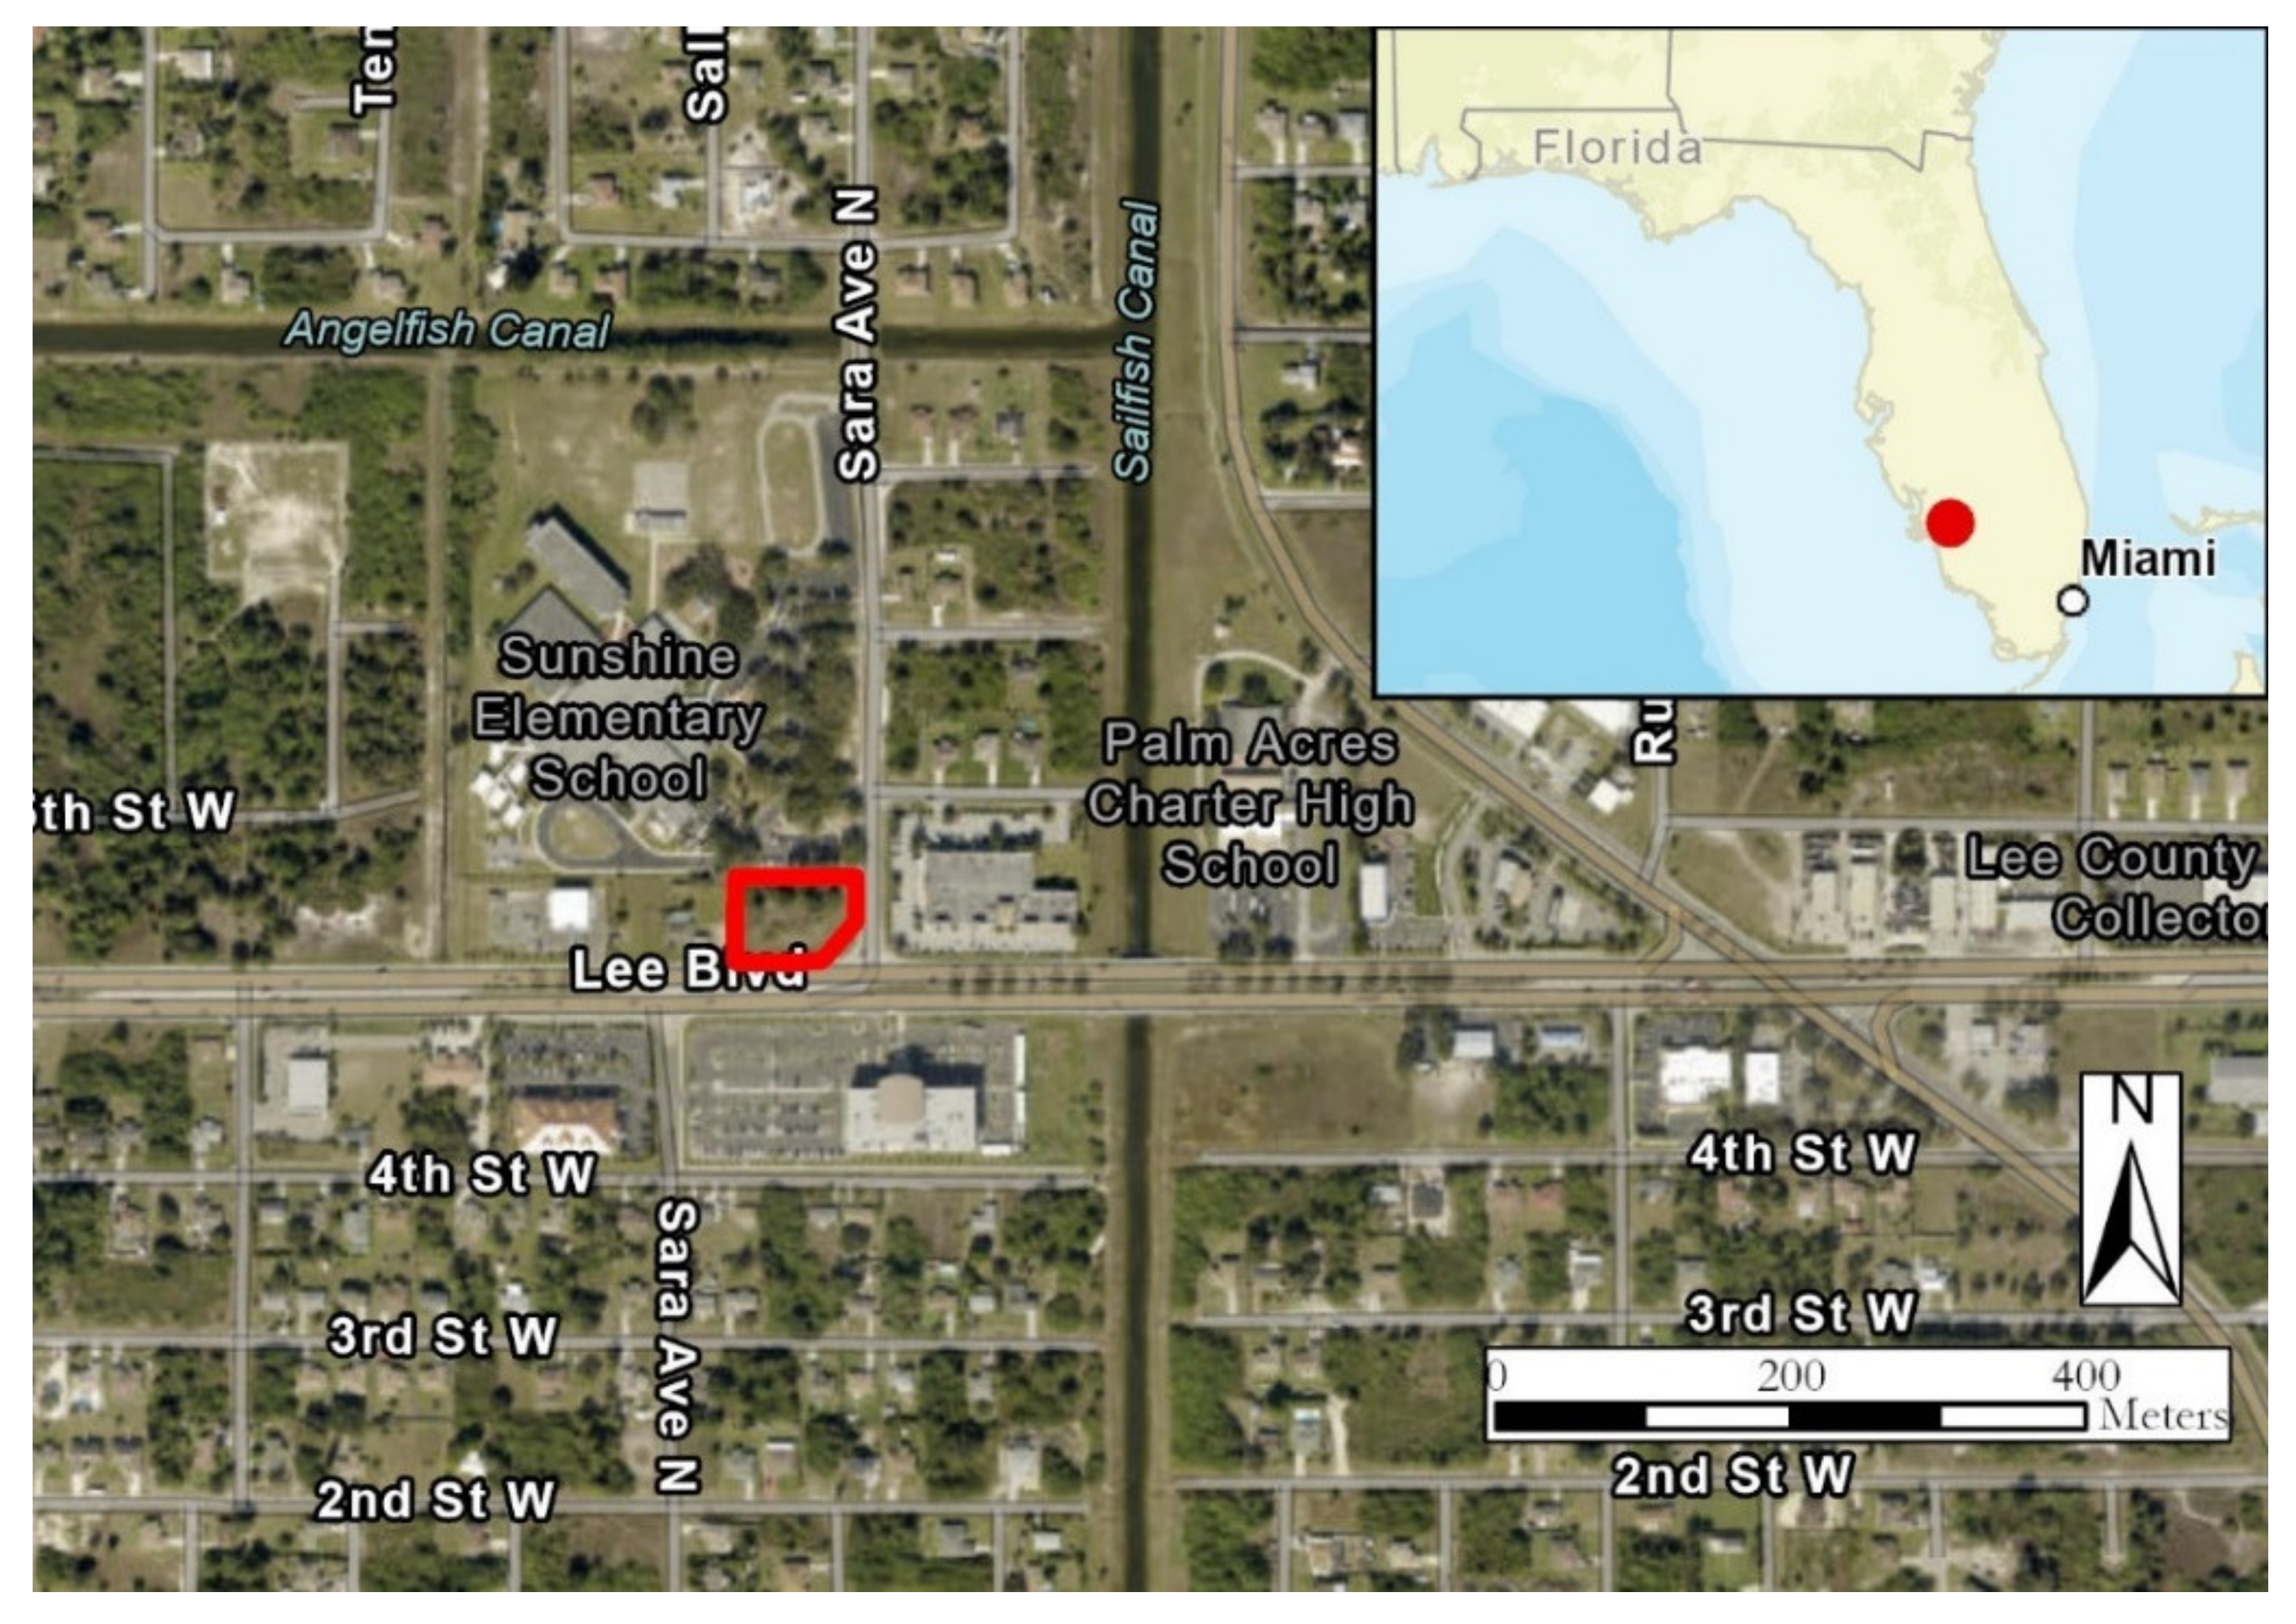
Figure 2.
Predevelopment arenosol classifications.

Figure 3.
The proposed GIS- and ICPR-based approach for the design of ISMOs and estimation of percolation.
Figure 3.
The proposed GIS- and ICPR-based approach for the design of ISMOs and estimation of percolation.
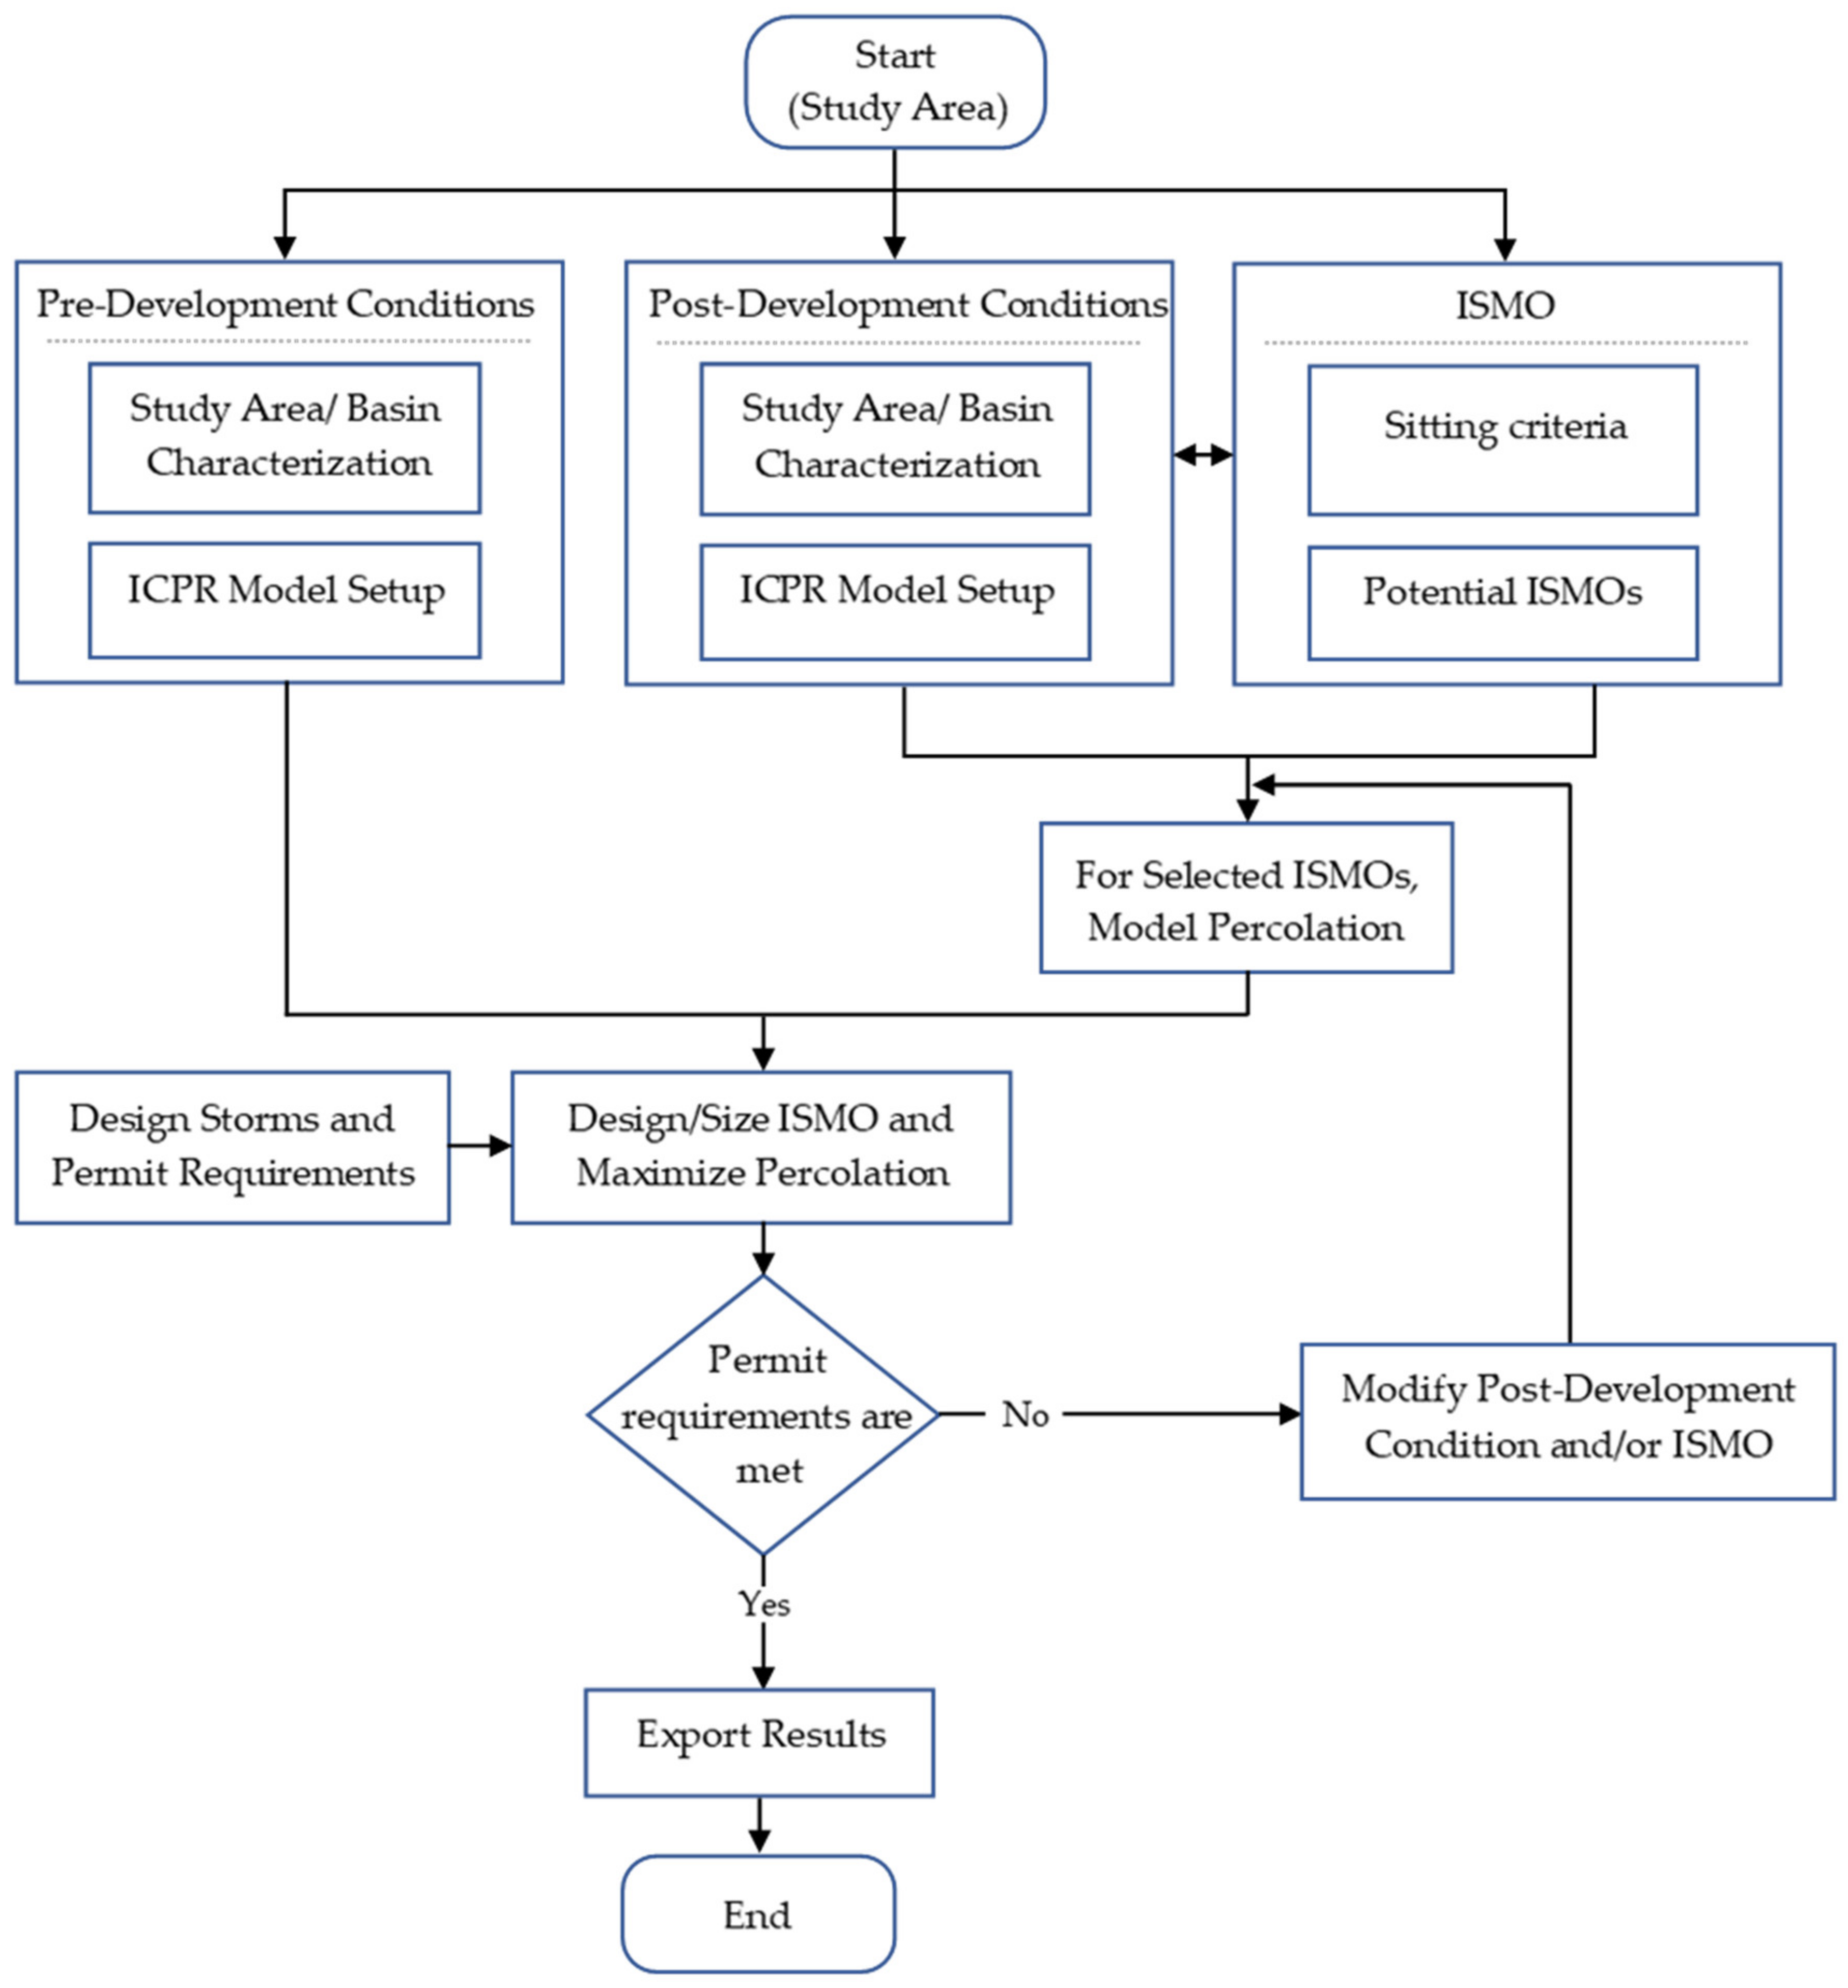
Figure 4.
Project limits.
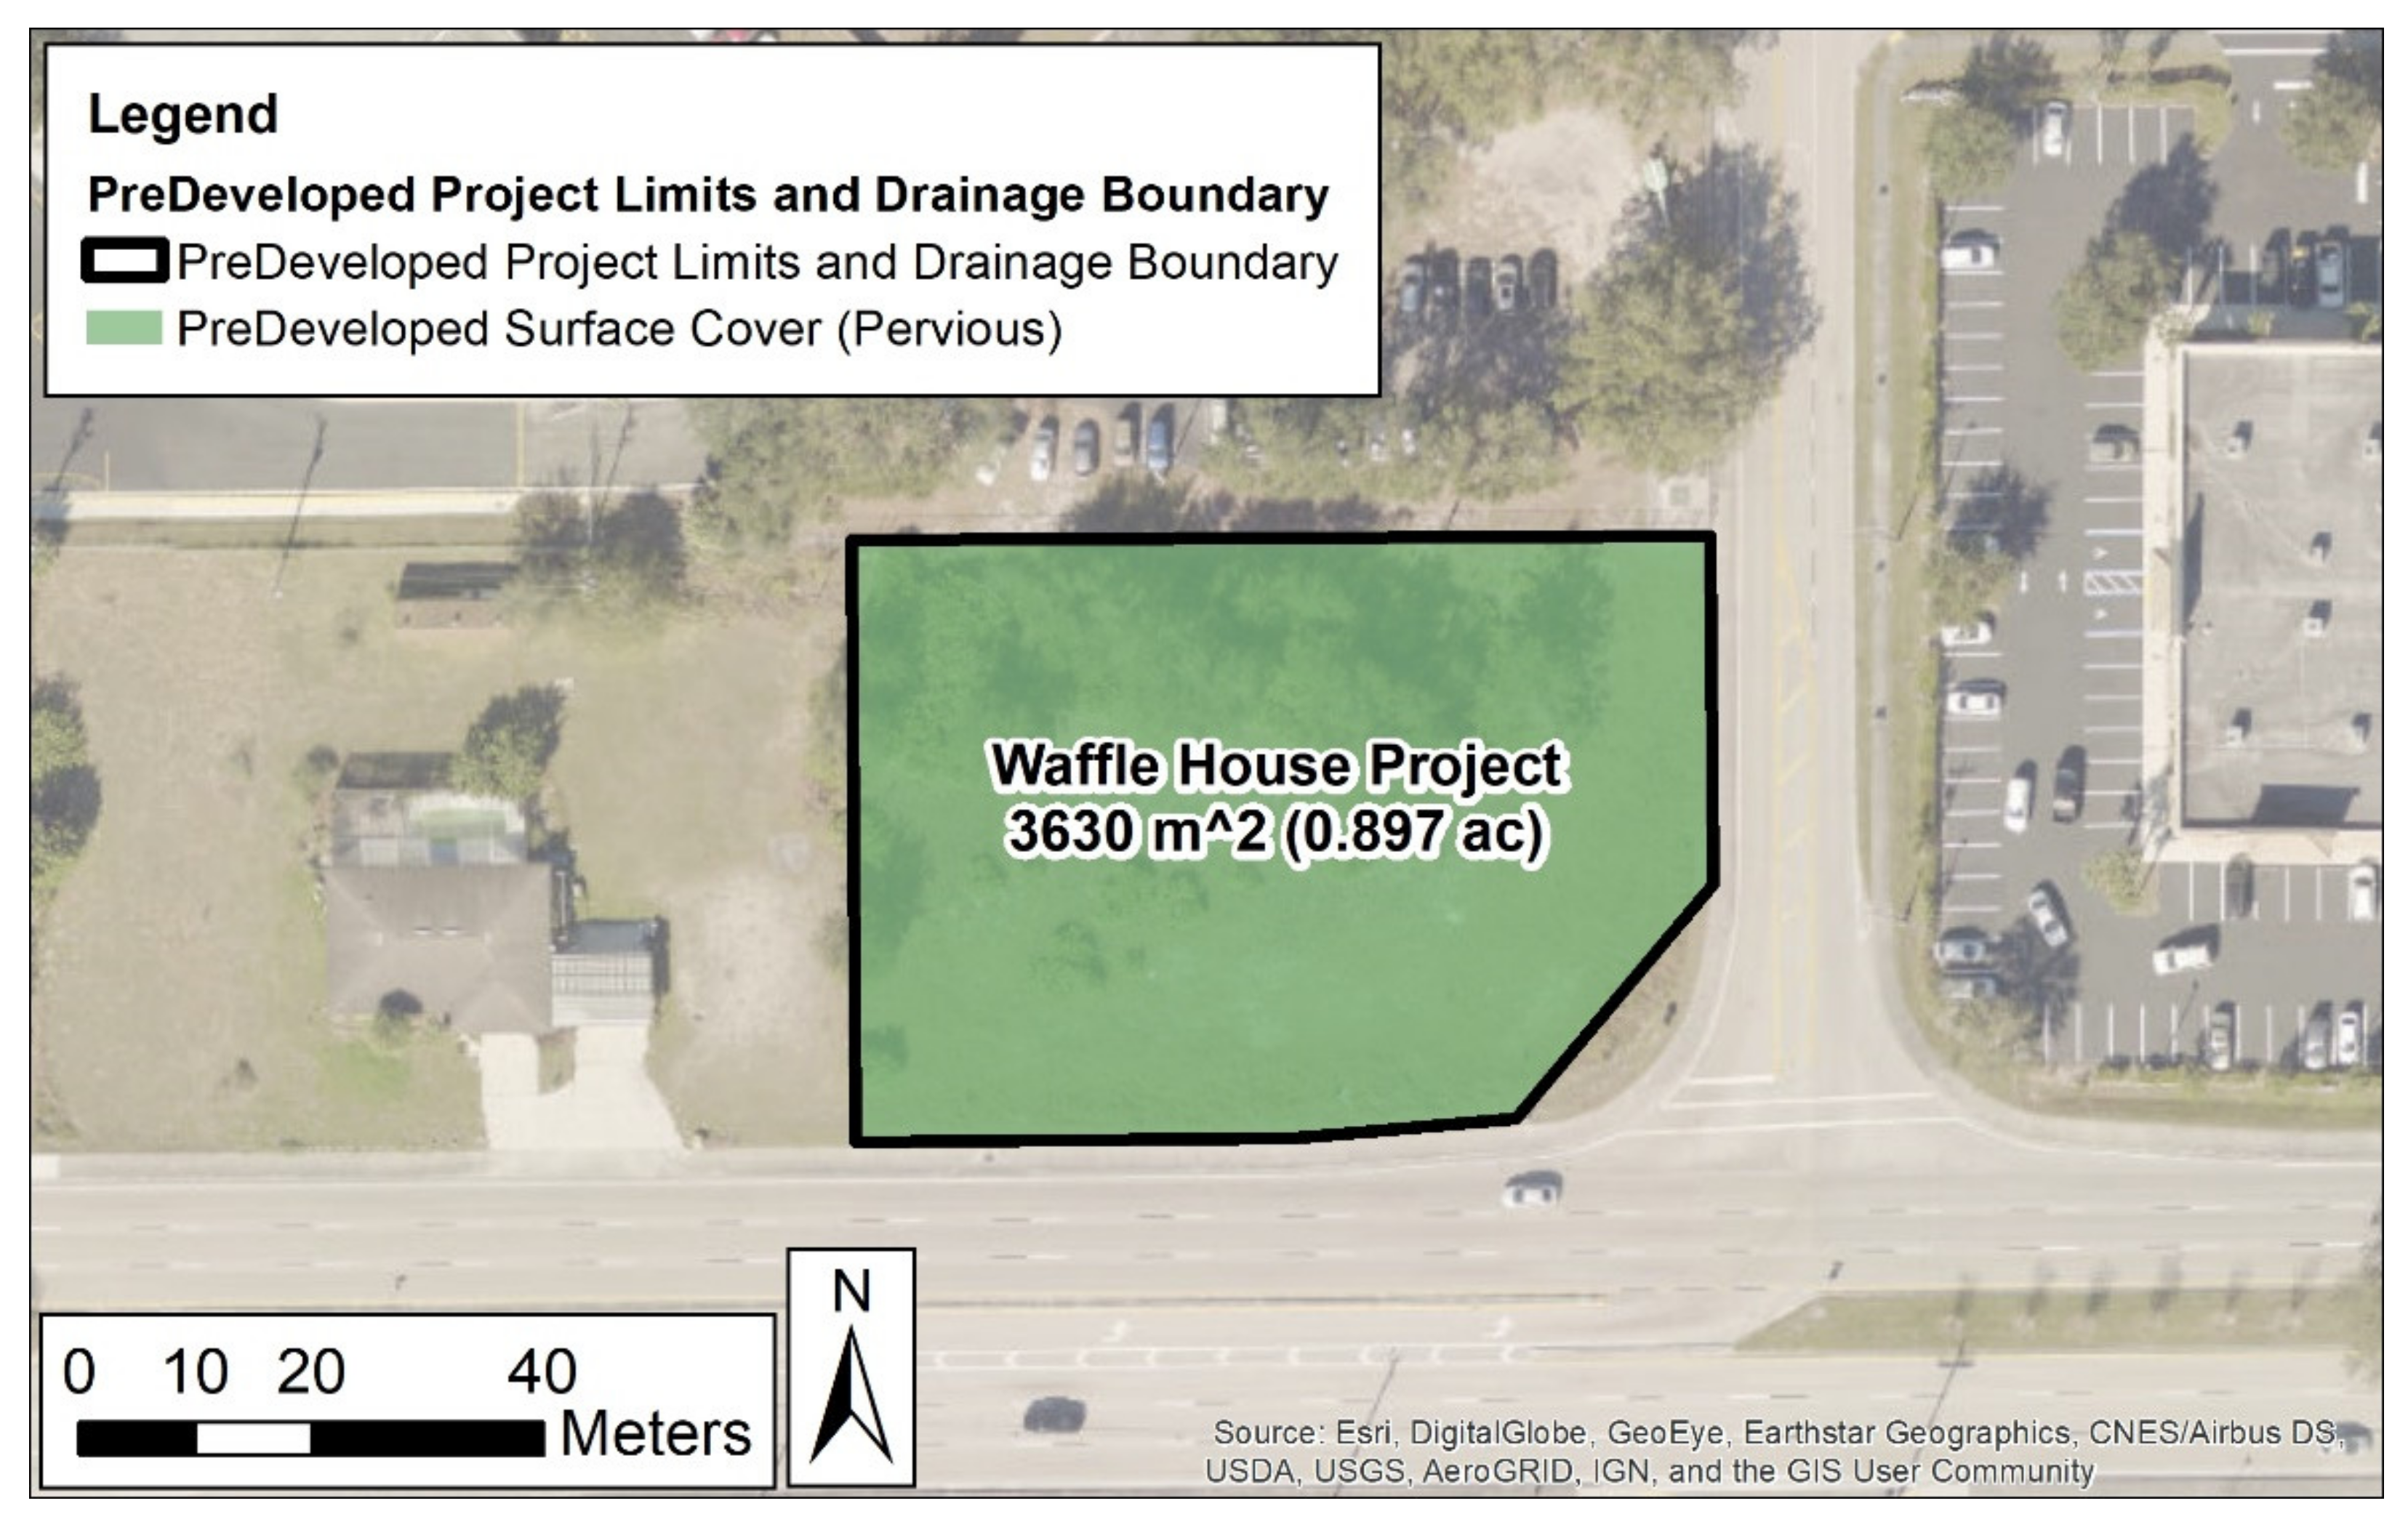
Figure 5.
Predevelopment storage node, boundary node, and hydraulic connections (links).
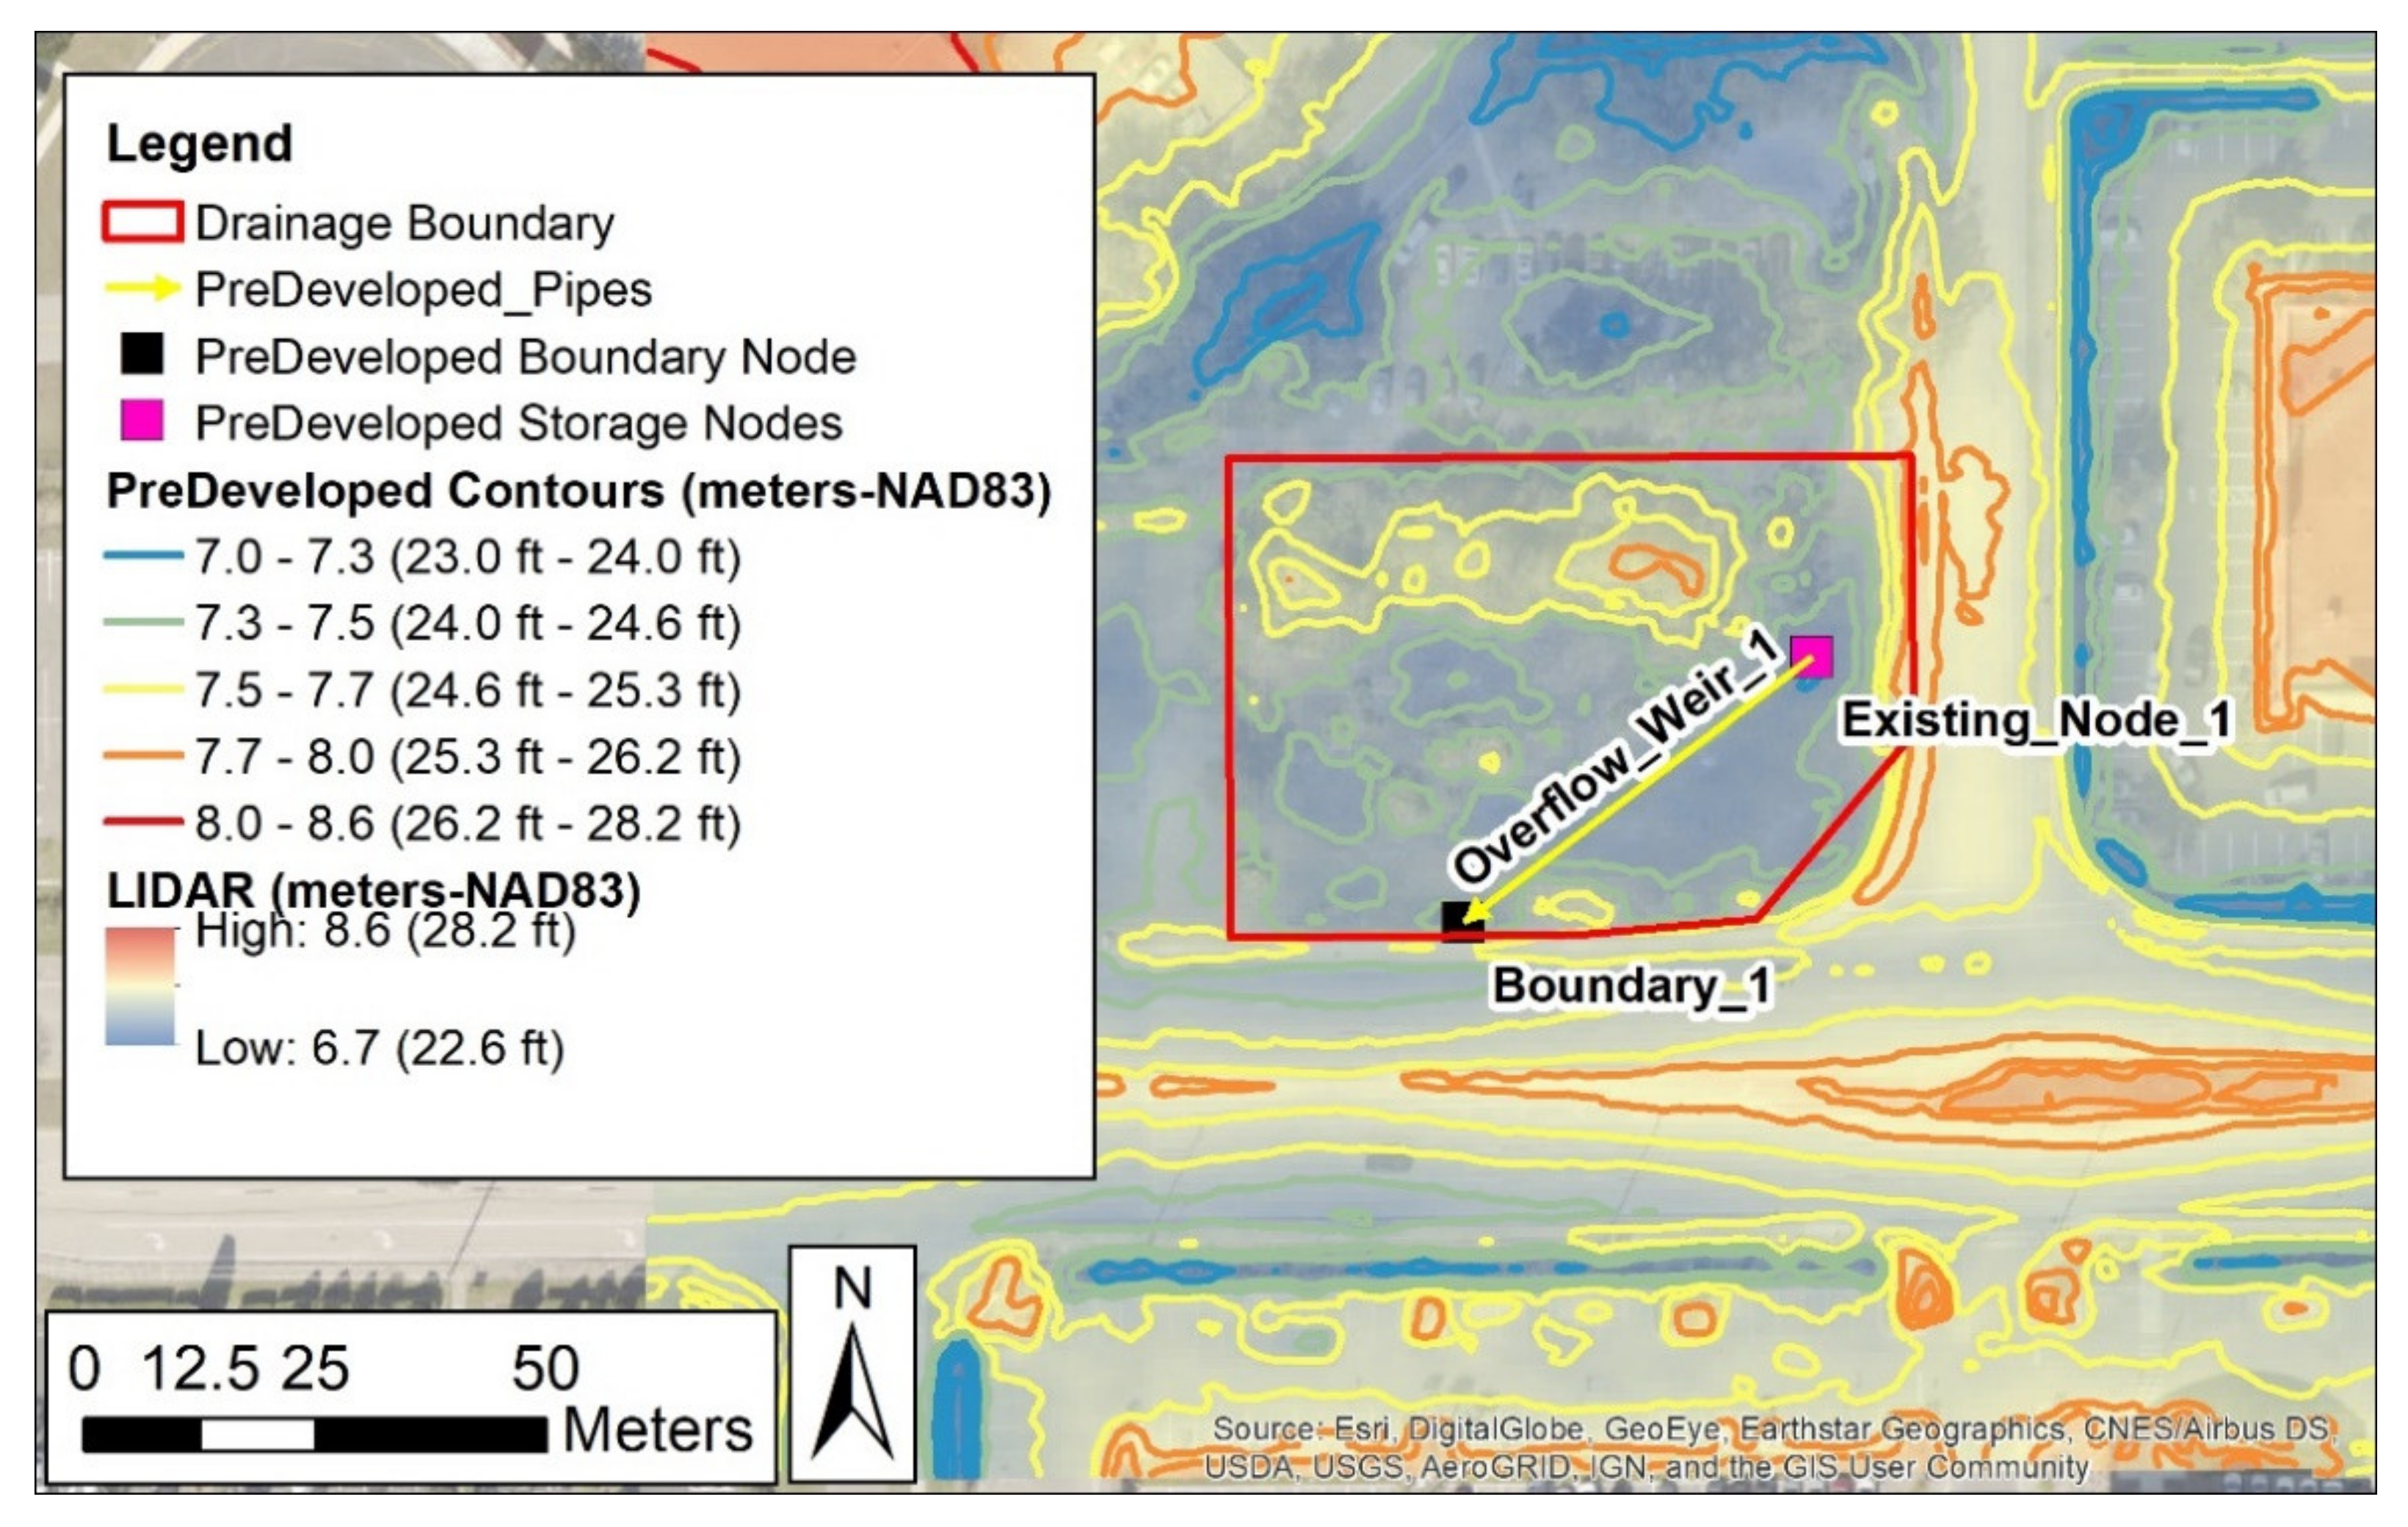
Figure 6.
Post-development pond contours and surface cover.

Figure 7.
Post-development subbasins, storage/groundwater nodes, and hydraulic connections.

Figure 8.
ICPR 4 stormwater model setup for the (a) predevelopment and (b) post-development site conditions.
Figure 8.
ICPR 4 stormwater model setup for the (a) predevelopment and (b) post-development site conditions.
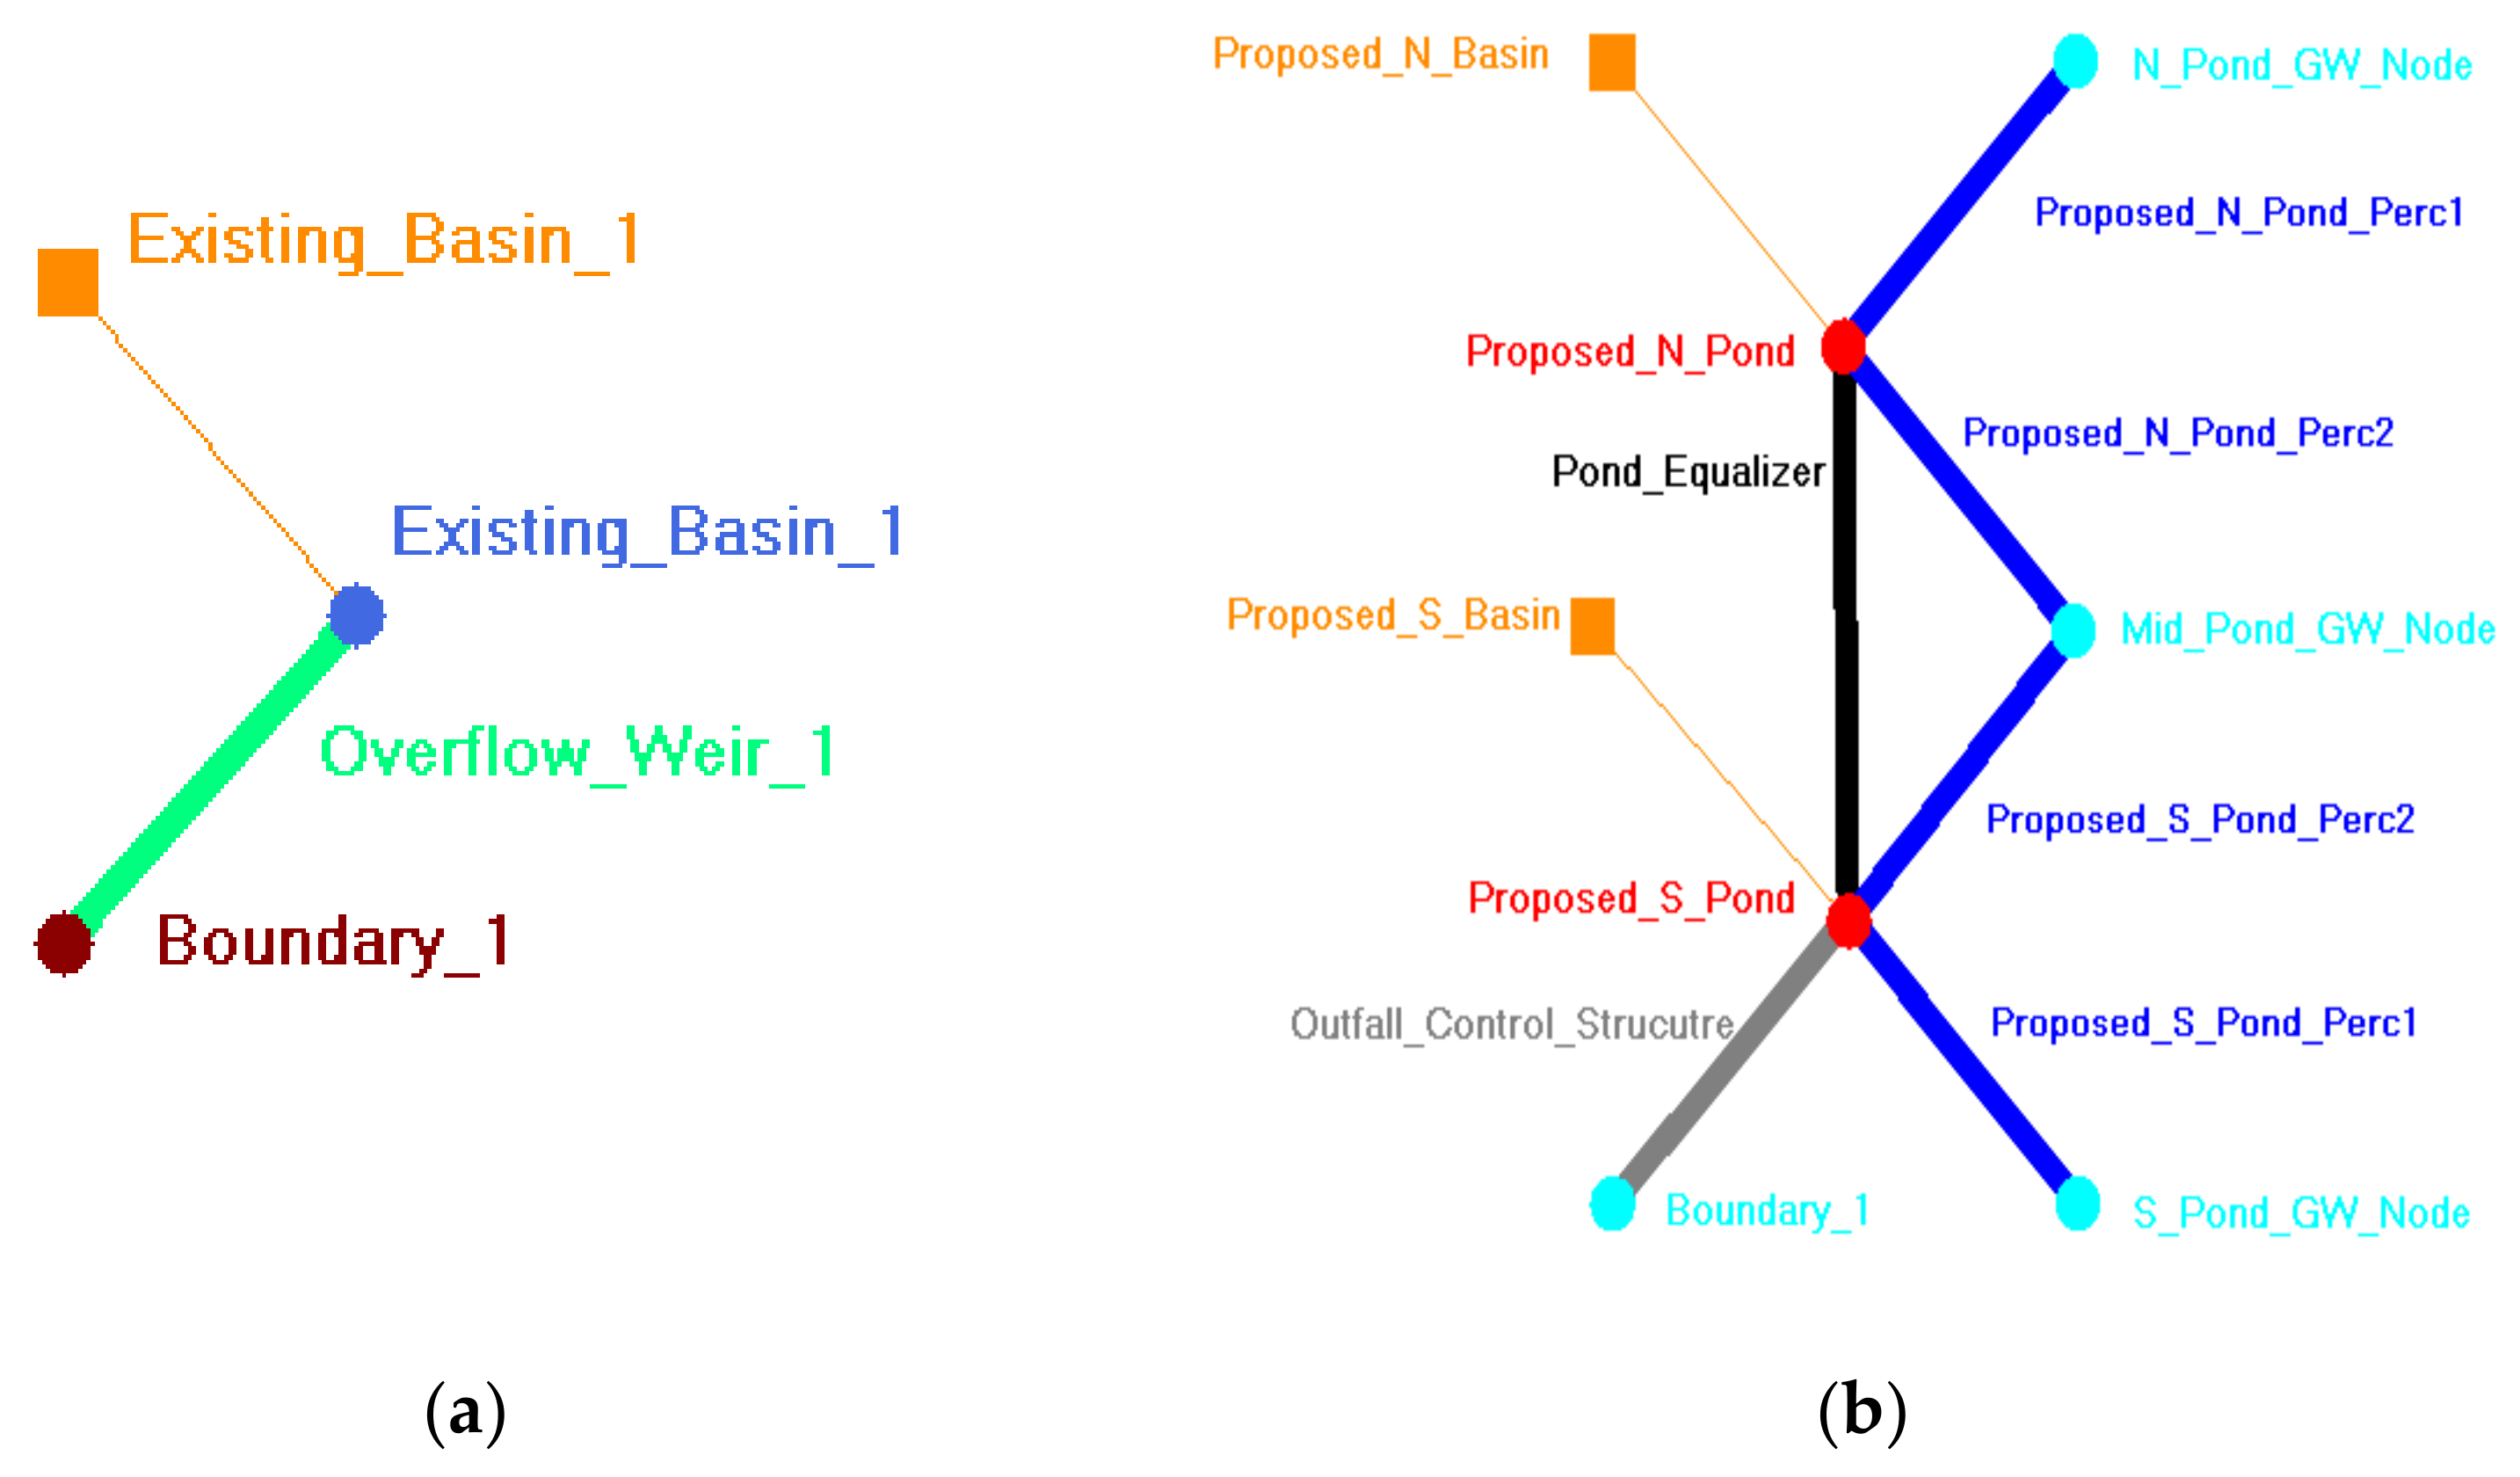
Figure 9.
Post-development percolation link delineation.
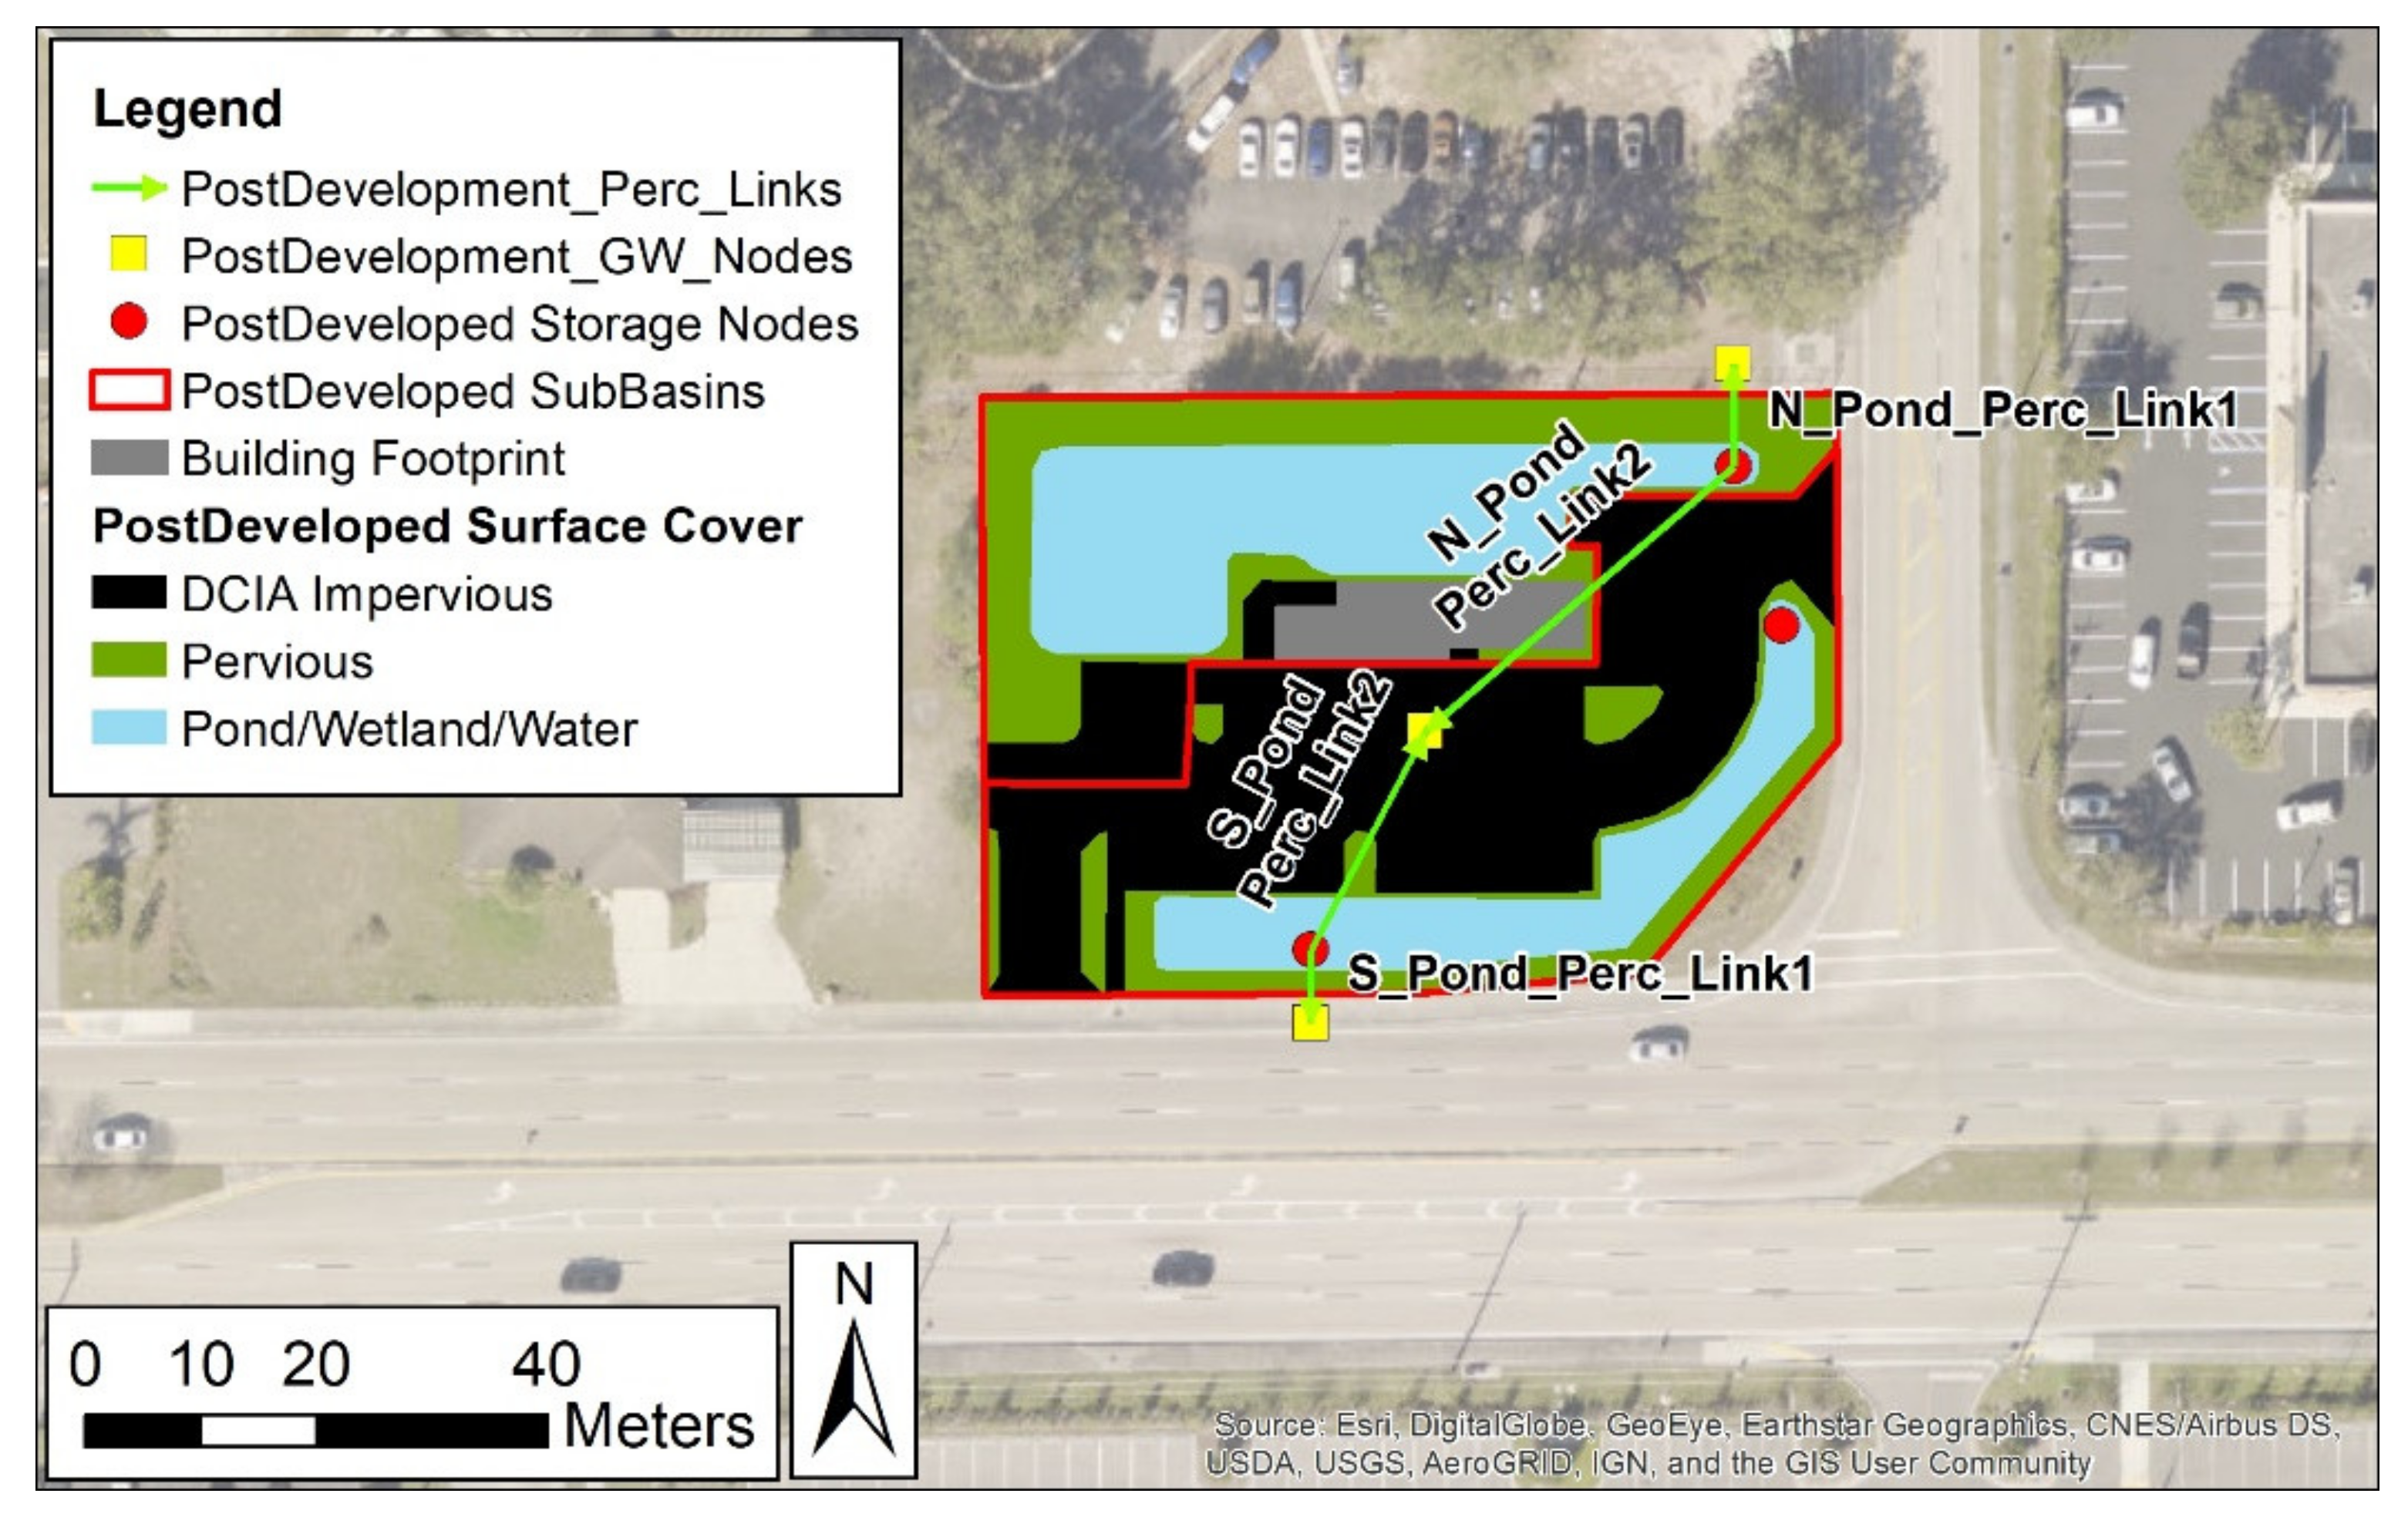
Figure 10.
Post-development percolation ring delineation.
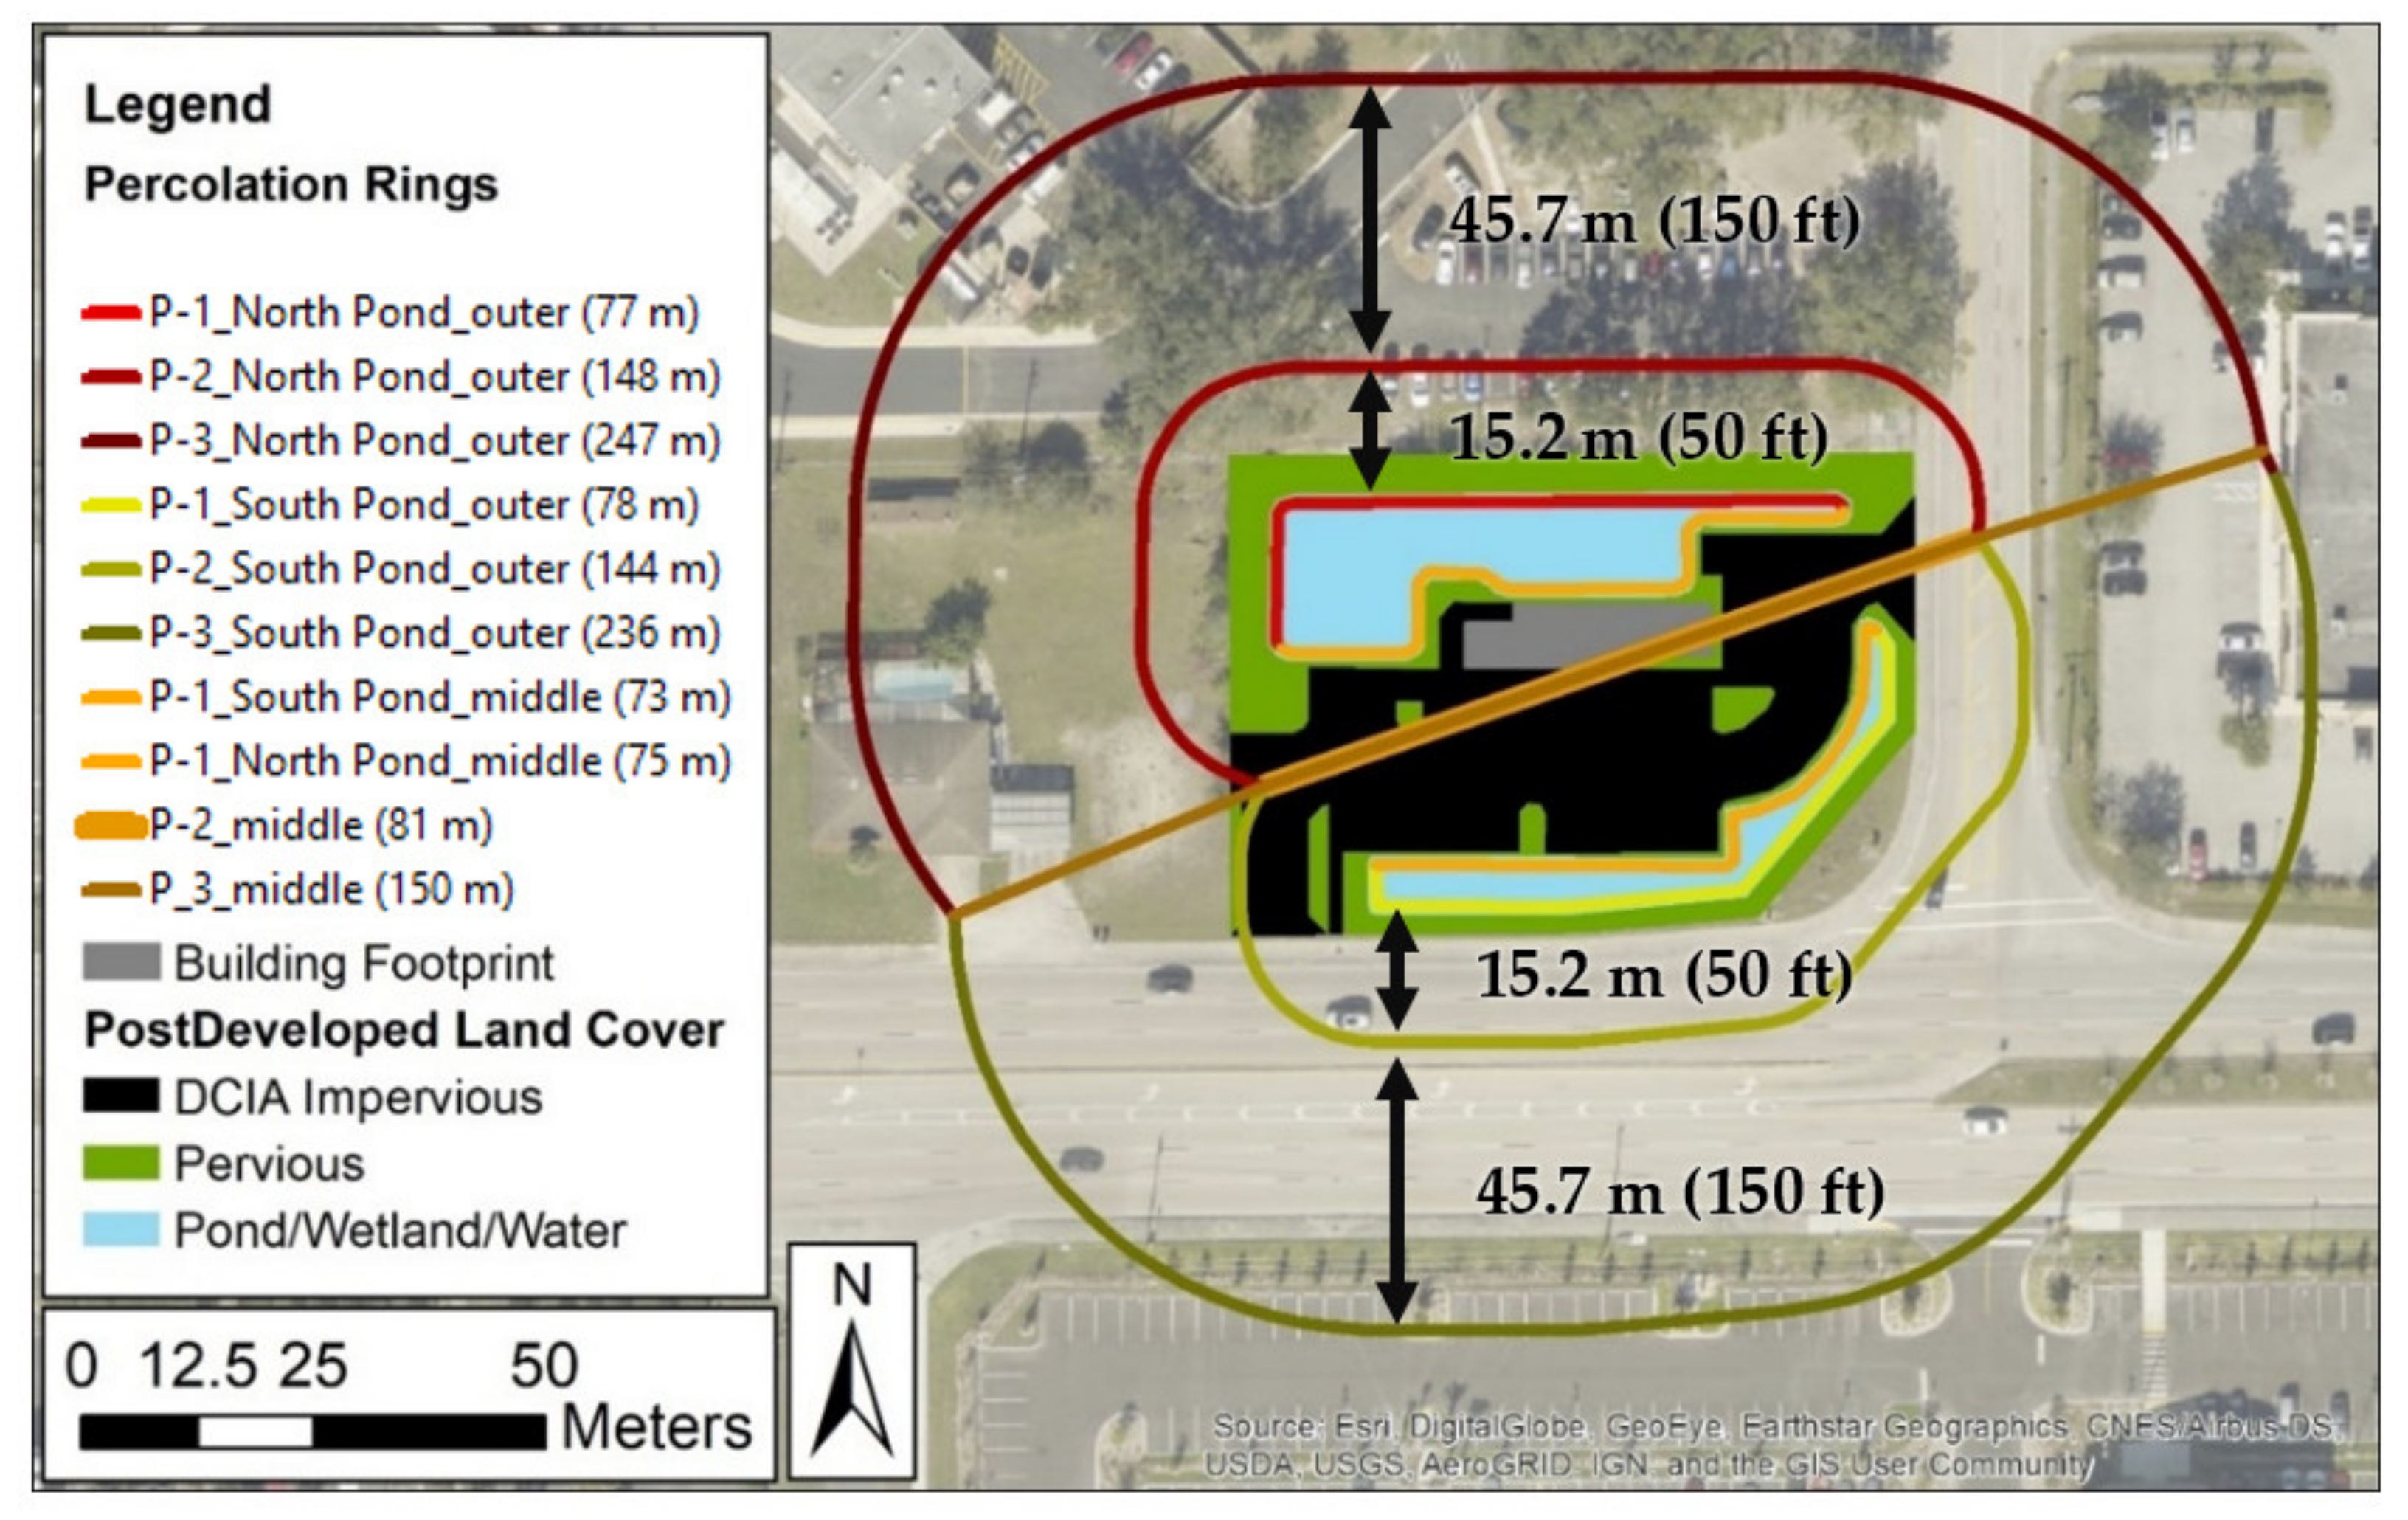
Figure 11.
Total inflow infiltration volume for the 5-year 1-day, 25-year 3-day, and the 100-year 3-day design storm events.
Figure 11.
Total inflow infiltration volume for the 5-year 1-day, 25-year 3-day, and the 100-year 3-day design storm events.

Table 1.
LA-MSID permitting criteria [20].
Table 1.
LA-MSID permitting criteria [20].
| Minimum Perimeter Berm, Road, and Parking Crown Elevation | Minimum Building Finished Floor Elevation | Minimum Water Quality Volume Provision | Maximum Discharge Rate from the Development |
|---|---|---|---|
| At or above the peak stage of the 25-year 3-day design storm event (27.9 cm (11.0 in) rainfall depth for this project’s location) | At or above the peak stage of the 100-year 3-day design storm event (35.6 cm (14.0 in) rainfall depth for this project’s location) | The greater of the first inch of runoff from the developed project or the total runoff of 6.4 cm (2.5 in) times the percentage of imperviousness | Limited to a maximum discharge of 0.33 m3/s/km2 (30 ft3/s/mi2) for the 25-year 3-day SFWMD design storm event |
Table 2.
Green-Ampt parameter inputs for the Immokalee sand.
| Green-Ampt Parameters | Values for the Immokalee Sand |
|---|---|
| Saturated vertical conductivity | 5.3 m/day (17.5 ft/day) |
| Saturated moisture content | 0.41 |
| Residual moisture content | 0.012 |
| Initial moisture content | 0.08 |
| Field moisture content | 0.08 |
| Wilting moisture content | 0.023 |
| Pore size index | 0.56 |
| Bubble pressure | 3.81 cm (1.5 in) |
| Allow recharge | No |
| Initial water table | 0.3 m (1 ft) |
Table 3.
Model structure description and nomenclature.
| Structure Description | Model Nomenclature |
|---|---|
| Contributing area (north, N; south, S) | Existing/Proposed_N(S)_Basin |
| Inlet to equalize the flow between the ponds | Existing/Proposed_N(S)_Pond |
| Equalizer pipe | Pond_Equalizer |
| Inlet drop structure | Outflow_Weir (Control)_Structure |
| Percolation links | Proposed_N(S)_Pond_Perc |
| Groundwater sink | N(S)_Pond_GW_Node |
| Outflow structure | Boundary_1 |
Table 4.
Percolation link parameters.
| Percolation Link Parameters | Value |
|---|---|
| Aquifer base elevation (below the water table) | 0.6 m (2 ft) |
| Horizontal conductivity | 9.1 m/day (30 ft/day) |
| Vertical conductivity | 4.6 m/day (15 ft/day) |
| Fillable porosity | 0.3 decimals |
| Layer thickness | 0.6 m (2 ft) |
| Buffer distance (from P-1 to P-2) | 15.2 m (50 ft) |
| Buffer distance (from P-2 to P-3) | 45.7 m (150 ft) |
Table 5.
Summary of the design storm simulation parameter input data.
| Storm Event | Rainfall Distribution Type | Hydrograph Method | Rainfall Data |
|---|---|---|---|
| 100-year 3-day | SFWMD-72 | NRCS | 35.6 cm (14.0 in) |
| 25-year 3-day | SFWMD-72 | Unit hydrograph | 27.9 cm (11.0 in) |
| 5-year 1-day | SCSI-24 | (UH 256) | 14.0 cm (5.5 in) |
Table 6.
Summary of the post-development peak stages.
| Storm Event | 100-Year 3-Day | 25-Year 3-Day | 5-Year 1-Day |
|---|---|---|---|
| Peak stage | 7.64 m NAVD | 7.58 m NAVD | 7.35 m NAVD |
| (25.05 ft NAVD) | (24.87 ft NAVD) | (24.12 ft NAVD) |
Table 7.
Curve number (CN) dataset.
| Arenosol Zone | Surface Cover Zone | CN |
|---|---|---|
| A | Pervious | 39 |
| A | DCIA-impervious | 98 |
| D | Pond/wetland/water | 80 |
Table 8.
Summary of the peak stages for the ICPR model run.
| Storm Event | 100-Year 3-Day | 25-Year 3-Day | 5-Year 1-Day |
|---|---|---|---|
| Peak stage (GA with percolation modeling) | 7.63 m (25.05 ft) | 7.58 m (24.87 ft) | 7.35 m (24.12 ft) |
| Peak stage (GA without percolation modeling) | 7.73 m (25.37 ft) | 7.70 m (25.27 ft) | 7.42 m (24.36 ft) |
| Peak stage (CN with percolation modeling) | 7.60 m (24.94 ft) | 7.54 m (24.74 ft) | 7.35 m (24.12 ft) |
| Peak stage (CN without percolation modeling) | 7.71 m (25.30 ft) | 7.67 m (25.17 ft) | 7.42 m (24.36 ft) |
Table 9.
A volumetric comparison of modeling with and without percolation links for the post-development condition.
Table 9.
A volumetric comparison of modeling with and without percolation links for the post-development condition.
| Storm Event Description | Predevelop. | Post-Development | |||||
|---|---|---|---|---|---|---|---|
| Without Percolation | With Percolation | ||||||
| CN Model | GA Model | CN Model | GA Model | ||||
| Volume Leaving the Site (m3) | Volume Leaving the Site (m3) | Volume Leaving the Site (m3) | Volume Leaving the Site (m3) | % Reduction, Modeling Percolation | Volume Leaving the Site (m3) | % Reduction, Modeling Percolation | |
| 5-year 1-day | 132.6 | 378.8 | 405.5 | 326.5 | 14% | 353.3 | 13% |
| 25-year 3-day | 637.7 | 812.0 | 913.2 | 583.5 | 28% | 613.0 | 33% |
| 100-year 3-day | 913.4 | 1061.4 | 1189.9 | 717.3 | 32% | 767.0 | 36% |
Table 10.
Allocation of the surface cover zone and the corresponding area.
| Surface Cover Zone | Area (m2) | Percent Allocation |
|---|---|---|
| DICA-impervious | 1643 (0.406 ac) | 46% |
| Pond/wetland/water | 1077 (0.266 ac) | 30% |
| Pervious | 886 (0.219 ac) | 25% |
Table 11.
Summary of the peak stages for the ICPR model run analyzing LID components.
| Storm Event | 100-Year 3-Day | 25-Year 3-Day | 5-Year 1-Day |
|---|---|---|---|
| I. Pond with percolation (no other LIDs) | |||
| Peak stage | 7.63 m (25.05 ft) | 7.63 m (24.87 ft) | 7.63 m (24.12 ft) |
| II. Rainwater harvesting and a pond with percolation | |||
| Peak stage reduction | 0.91 cm (0.36 in) | 0.91 cm (0.36 in) | 1.22 cm (0.48 in) |
| III. Pervious parking and a pond with percolation | |||
| Peak stage reduction | 0.30 cm (0.12 in) | 0.30 cm (0.12 in) | 5.18 cm (2.04 in) |
| IV. Rainwater harvesting, pervious parking, and a pond with percolation | |||
| Peak stage reduction | 1.22 cm (0.48 in) | 1.22 cm (0.48 in) | 7.62 cm (3.00 in) |
Publisher’s Note: MDPI stays neutral with regard to jurisdictional claims in published maps and institutional affiliations. |
© 2022 by the authors. Licensee MDPI, Basel, Switzerland. This article is an open access article distributed under the terms and conditions of the Creative Commons Attribution (CC BY) license (https://creativecommons.org/licenses/by/4.0/).
Share and Cite
MDPI and ACS Style
Schroeder, D.W.; Tsegaye, S.; Singleton, T.L.; Albrecht, K.K. GIS- and ICPR-Based Approach to Sustainable Urban Drainage Practices: Case Study of a Development Site in Florida. Water 2022, 14, 1557. https://doi.org/10.3390/w14101557
AMA Style
Schroeder DW, Tsegaye S, Singleton TL, Albrecht KK. GIS- and ICPR-Based Approach to Sustainable Urban Drainage Practices: Case Study of a Development Site in Florida. Water. 2022; 14(10):1557. https://doi.org/10.3390/w14101557
Chicago/Turabian StyleSchroeder, Daniel W., Seneshaw Tsegaye, Thomas L. Singleton, and Kevin K. Albrecht. 2022. "GIS- and ICPR-Based Approach to Sustainable Urban Drainage Practices: Case Study of a Development Site in Florida" Water 14, no. 10: 1557. https://doi.org/10.3390/w14101557
Note that from the first issue of 2016, this journal uses article numbers instead of page numbers. See further details here.