Deactivation Pattern of a “Model” Ni/MgO Catalyst in the Pre-Reforming of n-Hexane †


Abstract
:1. Introduction
- an increased production capacity with smaller reformer furnaces;
- a higher feedstock flexibility;
- enhanced SR tube and catalyst lifetime;
- design of innovative process configuration for low energy consumption and investment costs.
2. Results and Discussion
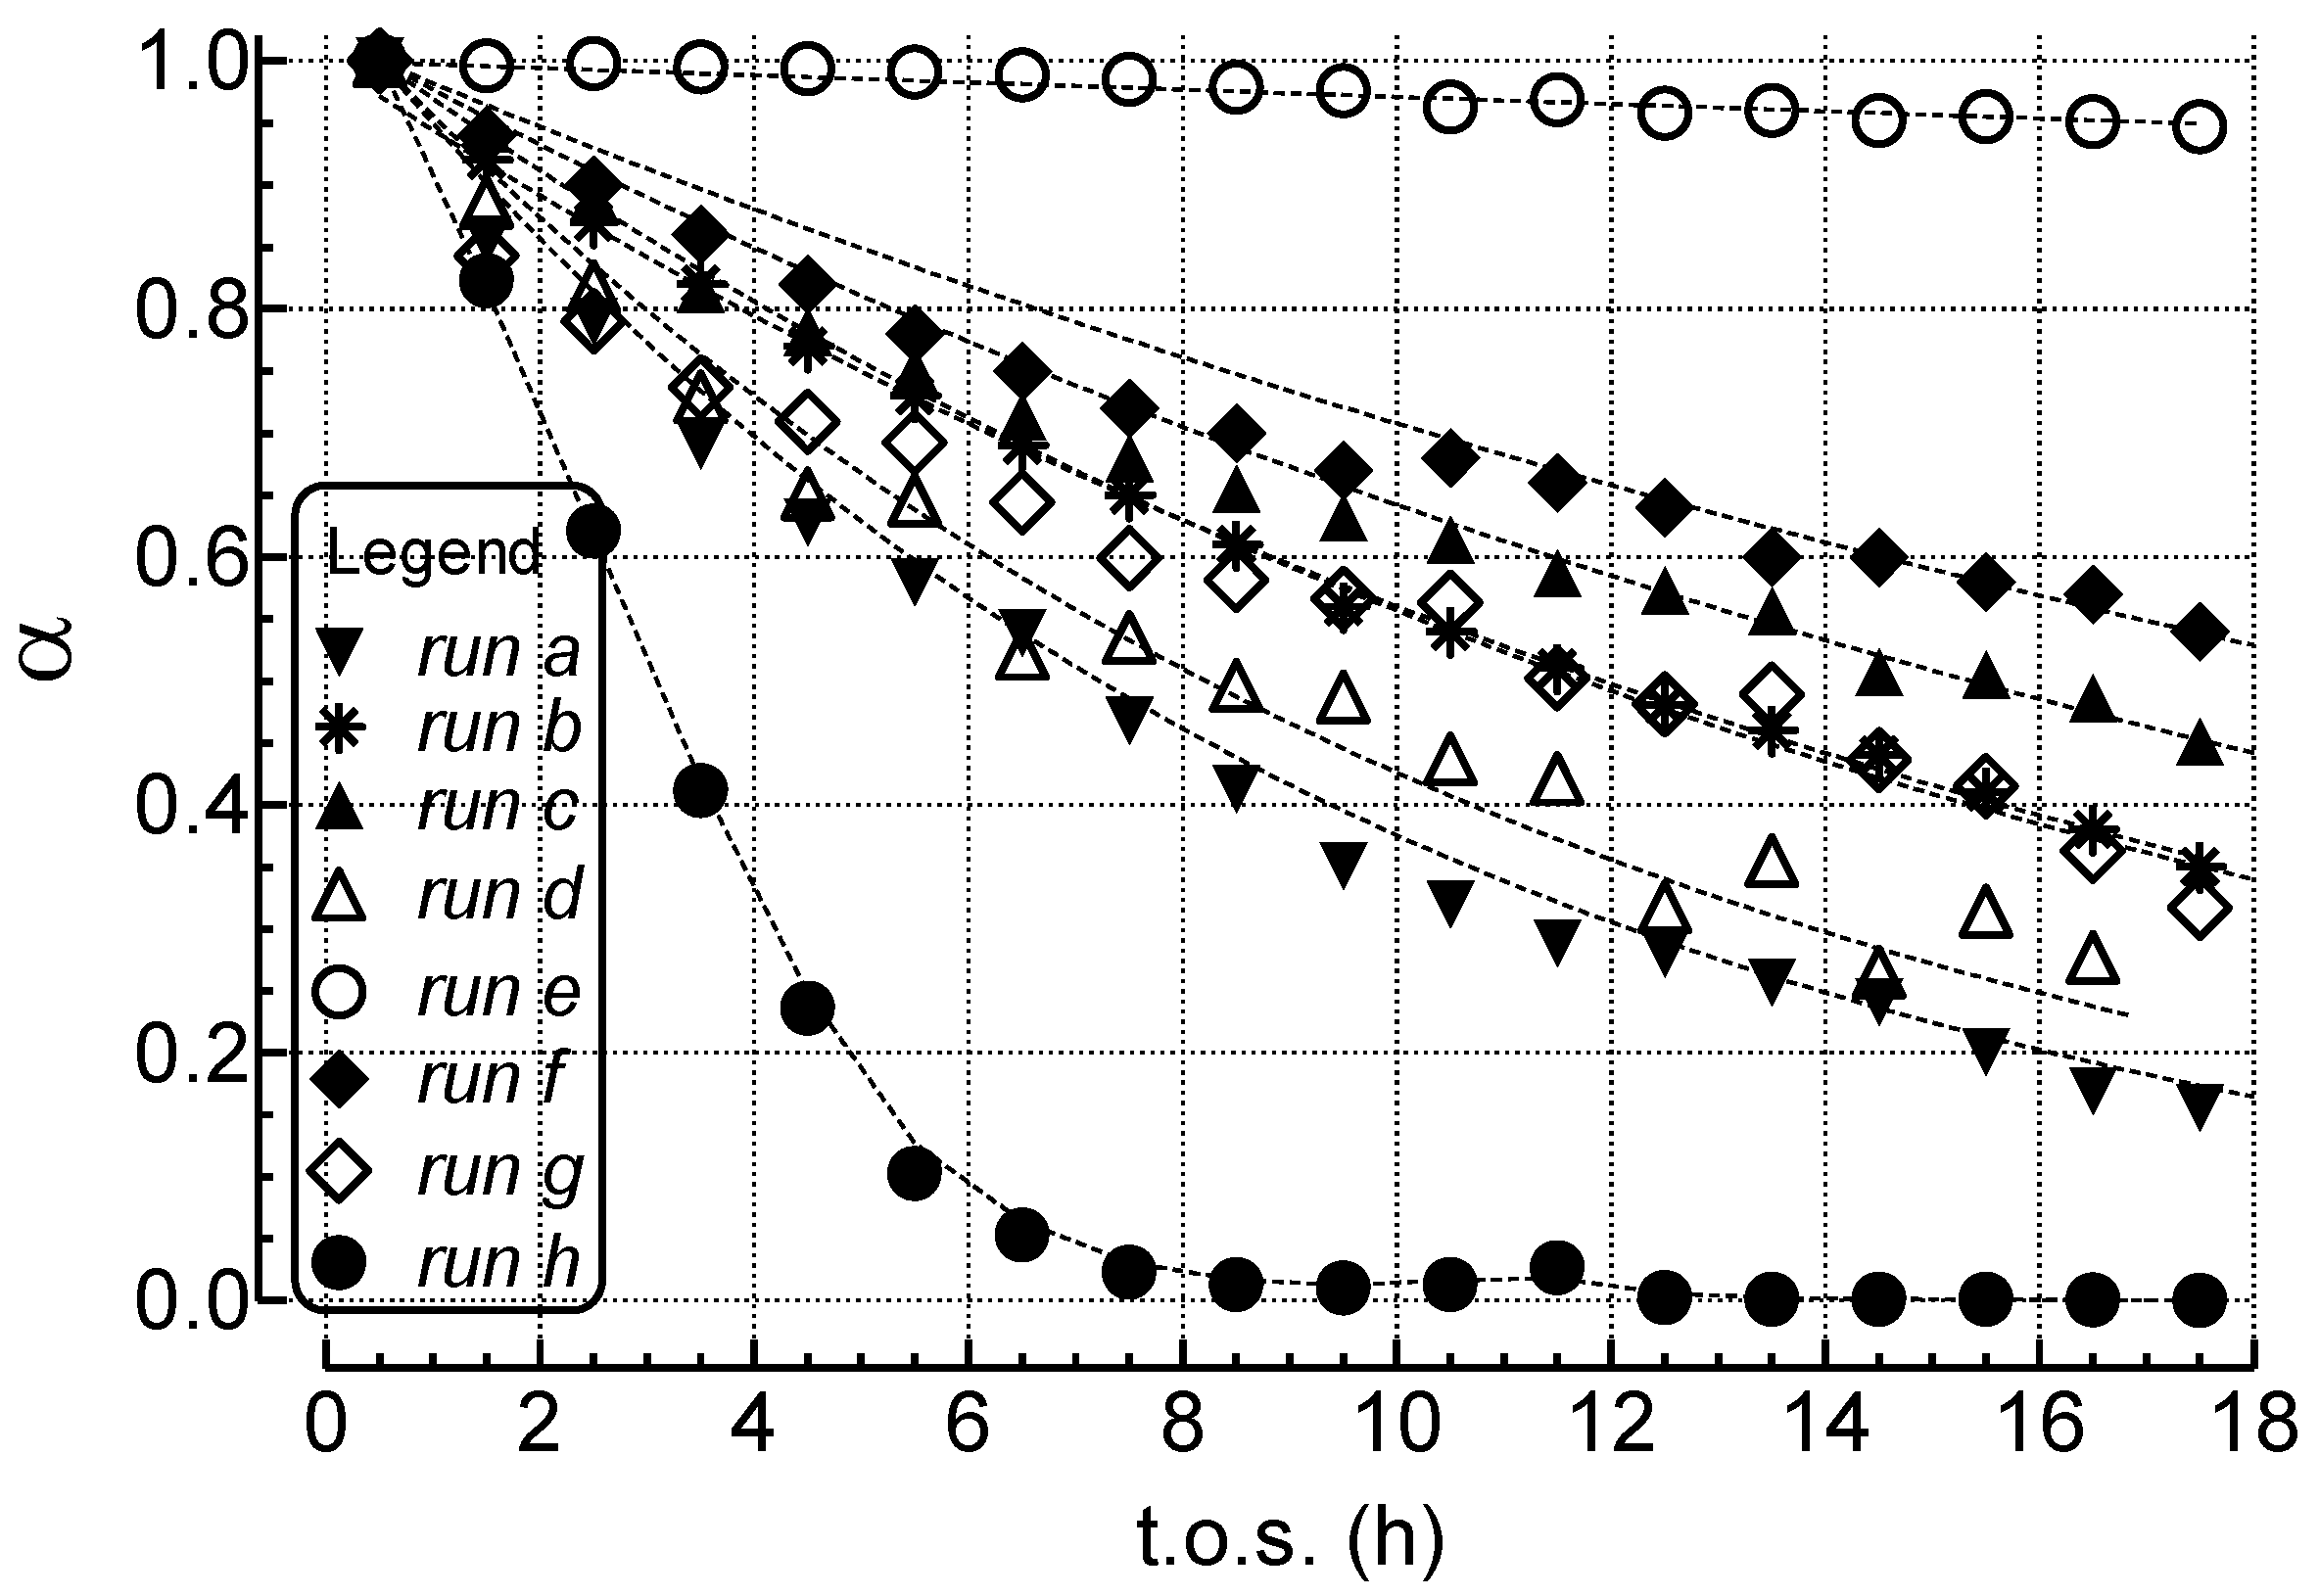
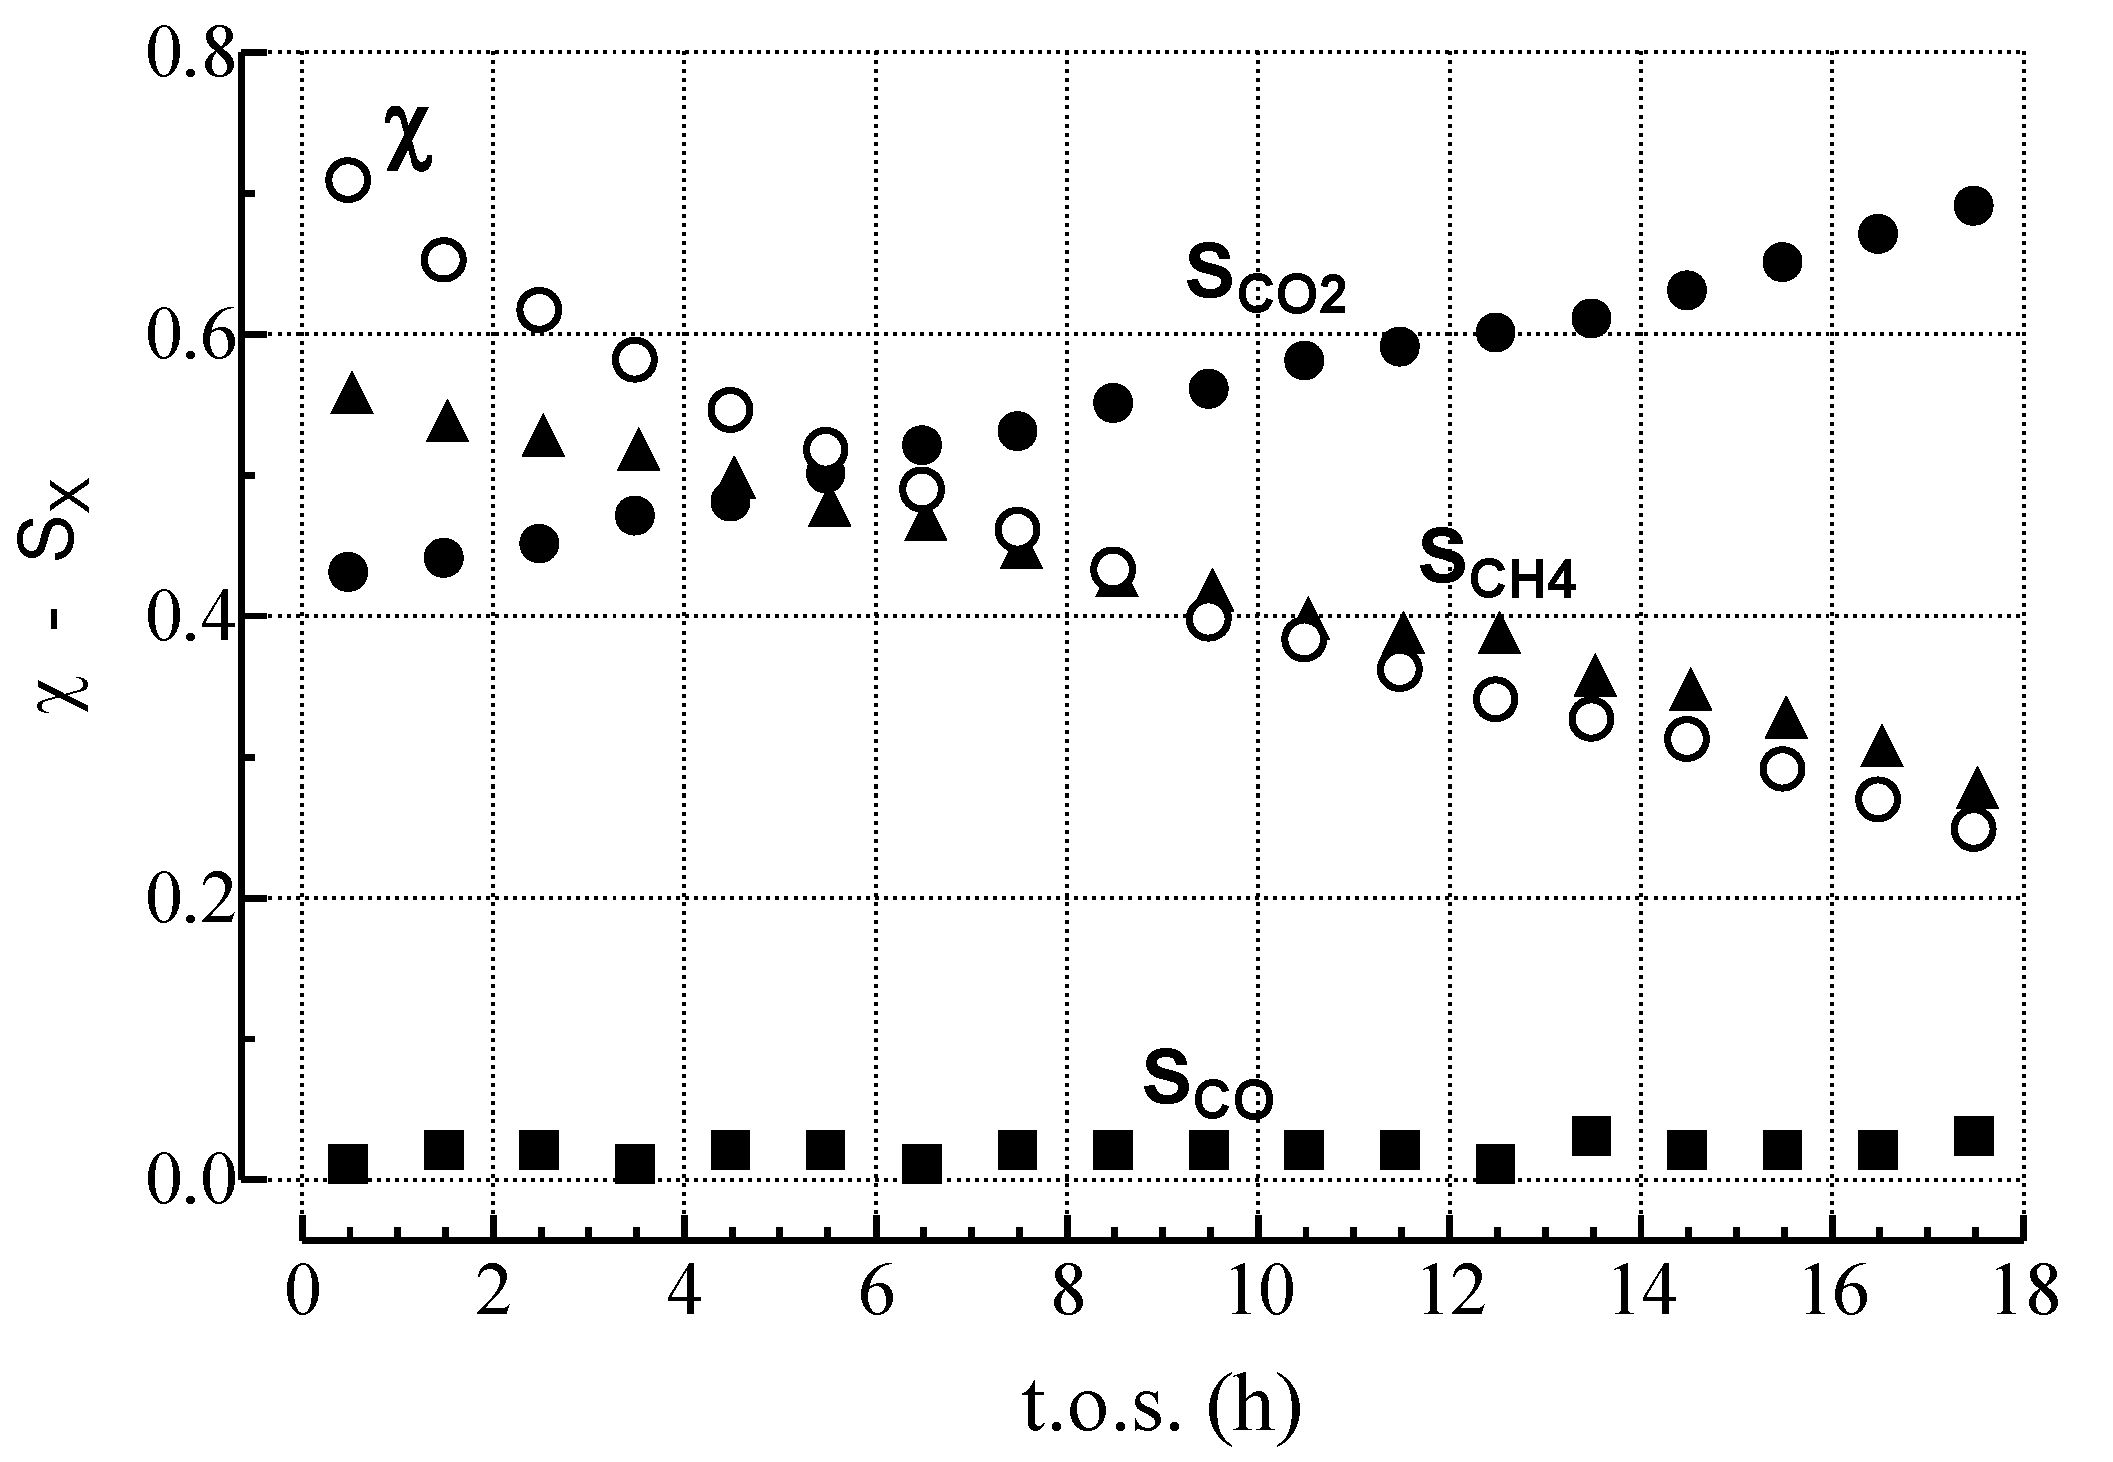
2.1. Effects of the Experimental Conditions on the Activity-Selectivity-Stability Pattern


| Run | P (atm) | S/C | GHSV a (h−1) | χC6H14 (%) | Reactor output (molC6H14 h−1 gcat−1) | SCH4 (%) | SCO2 (%) | SCO (%) | SC2–C5 (%) | WC b (g gcat−1) |
|---|---|---|---|---|---|---|---|---|---|---|
| a | 10 | 1.5 | 12,000 | 53–08 | 0.26 – 0.04 | 55–9 | 43–88 | 2–3 | - | 1.32 |
| b | 10 | 2.8 | 12,000 | 71–25 | 0.35–0.12 | 56–28 | 42–69 | 2–3 | - | 0.96 |
| c | 10 | 3.5 | 12,000 | 76–34 | 0.38–0.17 | 56–42 | 43–57 | 1–1 | - | 0.89 |
| d | 10 | 2.8 | 24,000 | 38–11 | 0.38–0.11 | 39–5 | 59–93 | 2–2 | - | 1.23 |
| e c | 10 | 2.8 | 24,000 | 77–73 | 0.77–0.73 | 98–97 | 1–2 | 0–0 | 1–1 | 0.03 |
| f | 15 | 2.8 | 12,000 | 69–37 | 0.51–0.27 | 60–50 | 39–49 | 1–1 | - | 0.75 |
| g | 5 | 2.8 | 12,000 | 67–21 | 0.17–0.05 | 49–25 | 49–73 | 1–2 | - | 1.02 |
| h d | 10 | 2.8 | 24,000 | 65–00 | 0.65–0.00 | 97–97 | 2–2 | 1–1 | - | 0.21 |


- amorphous carbon (Cβ),
- vermicular carbon (CV),
- bulk Ni carbide (Cγ), and
- crystalline, graphitic carbon (CC).
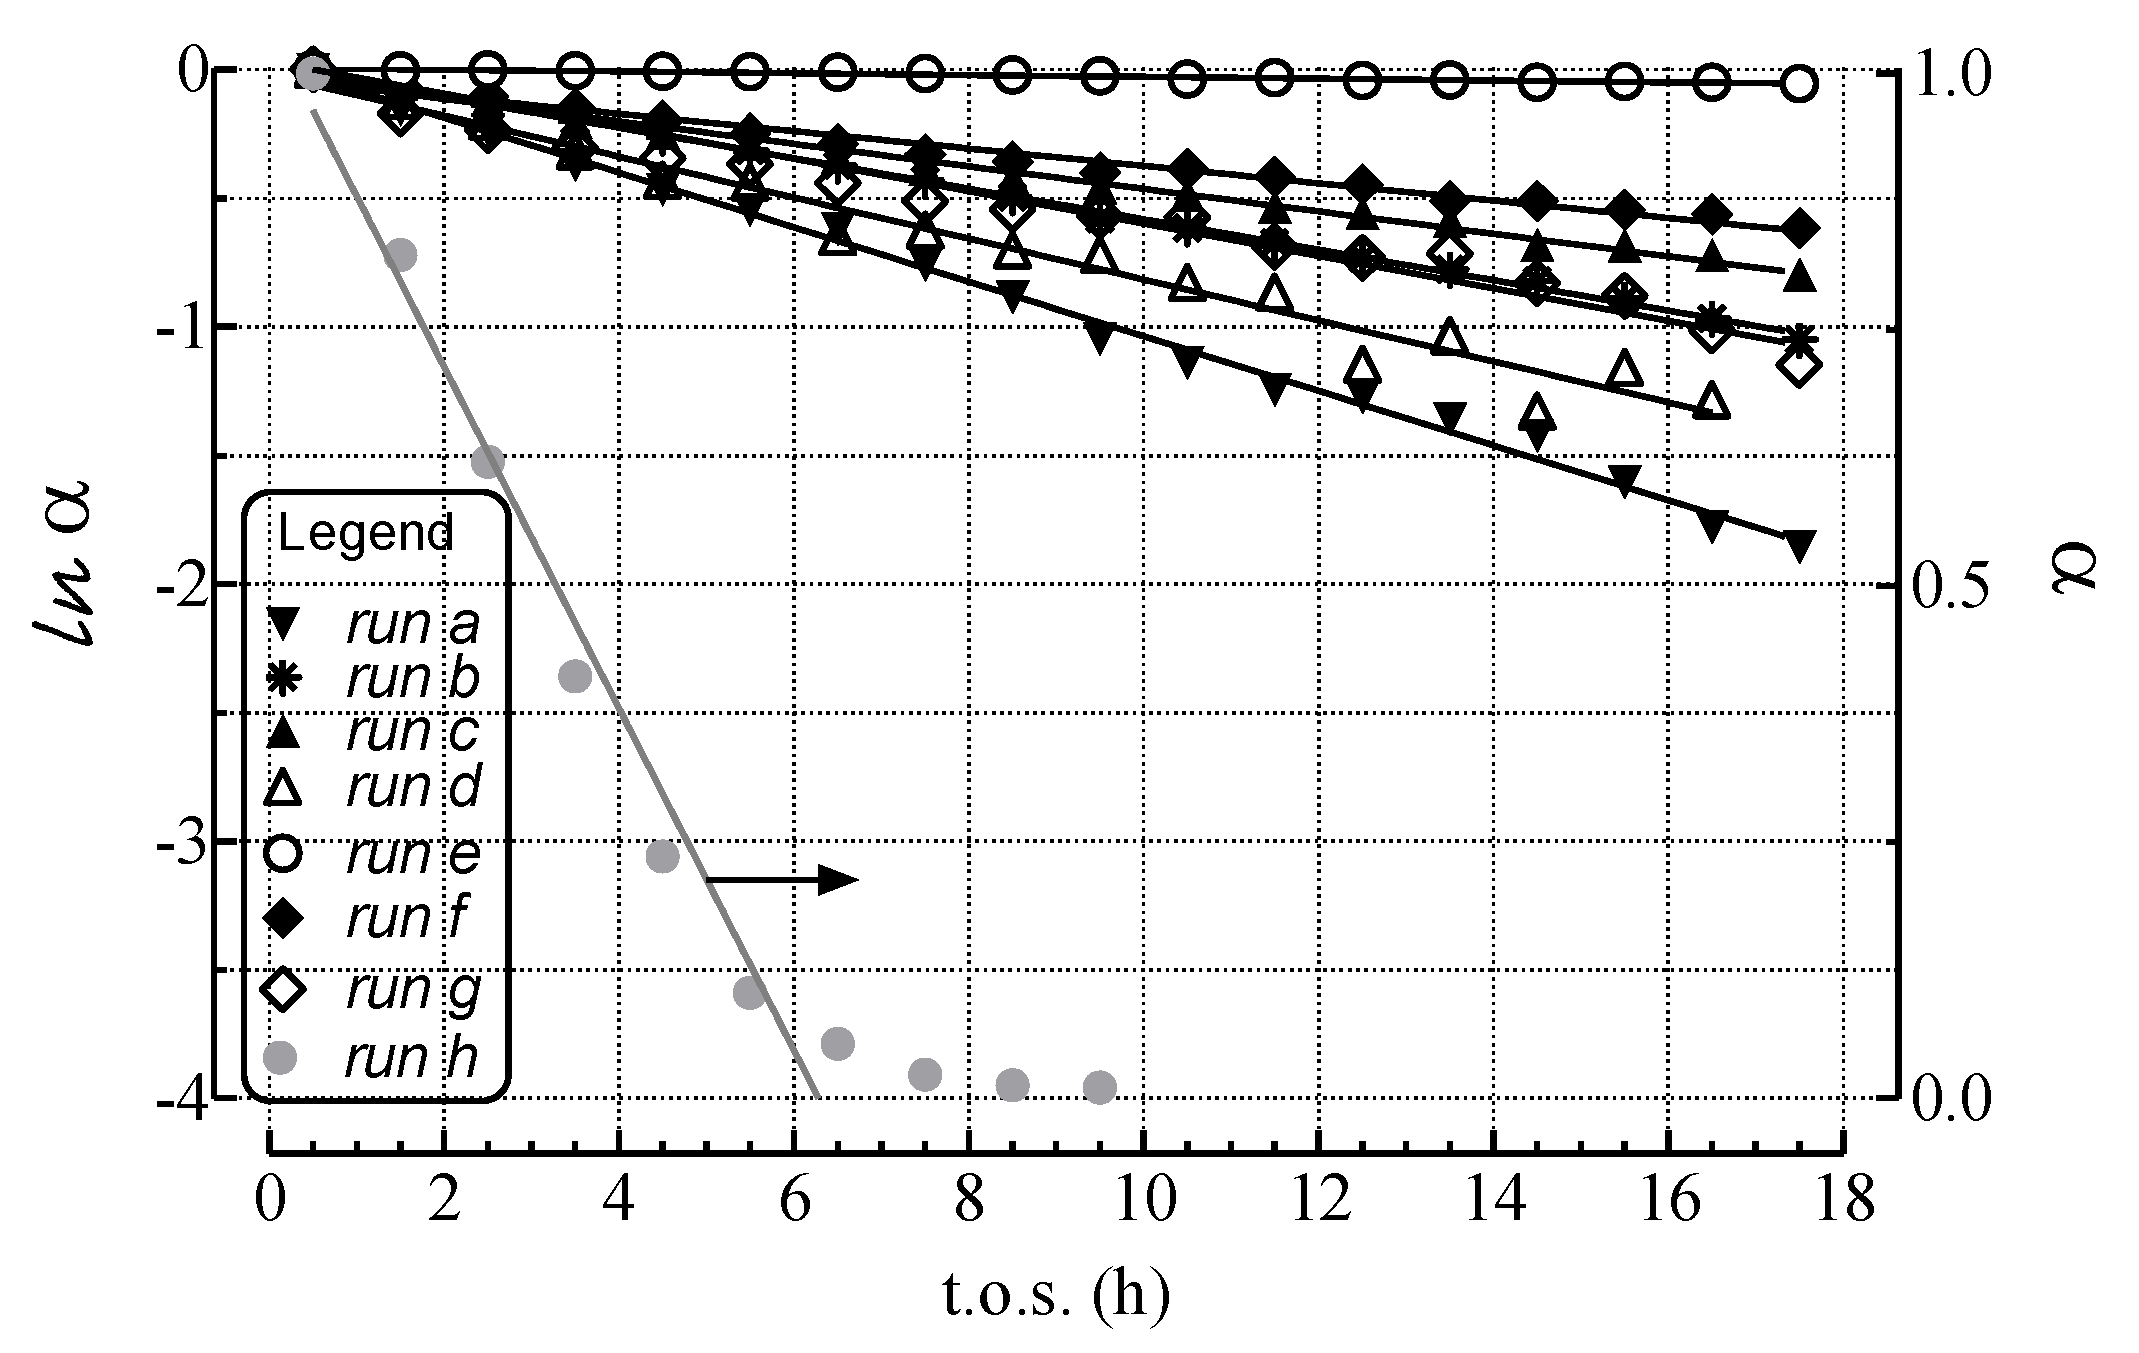
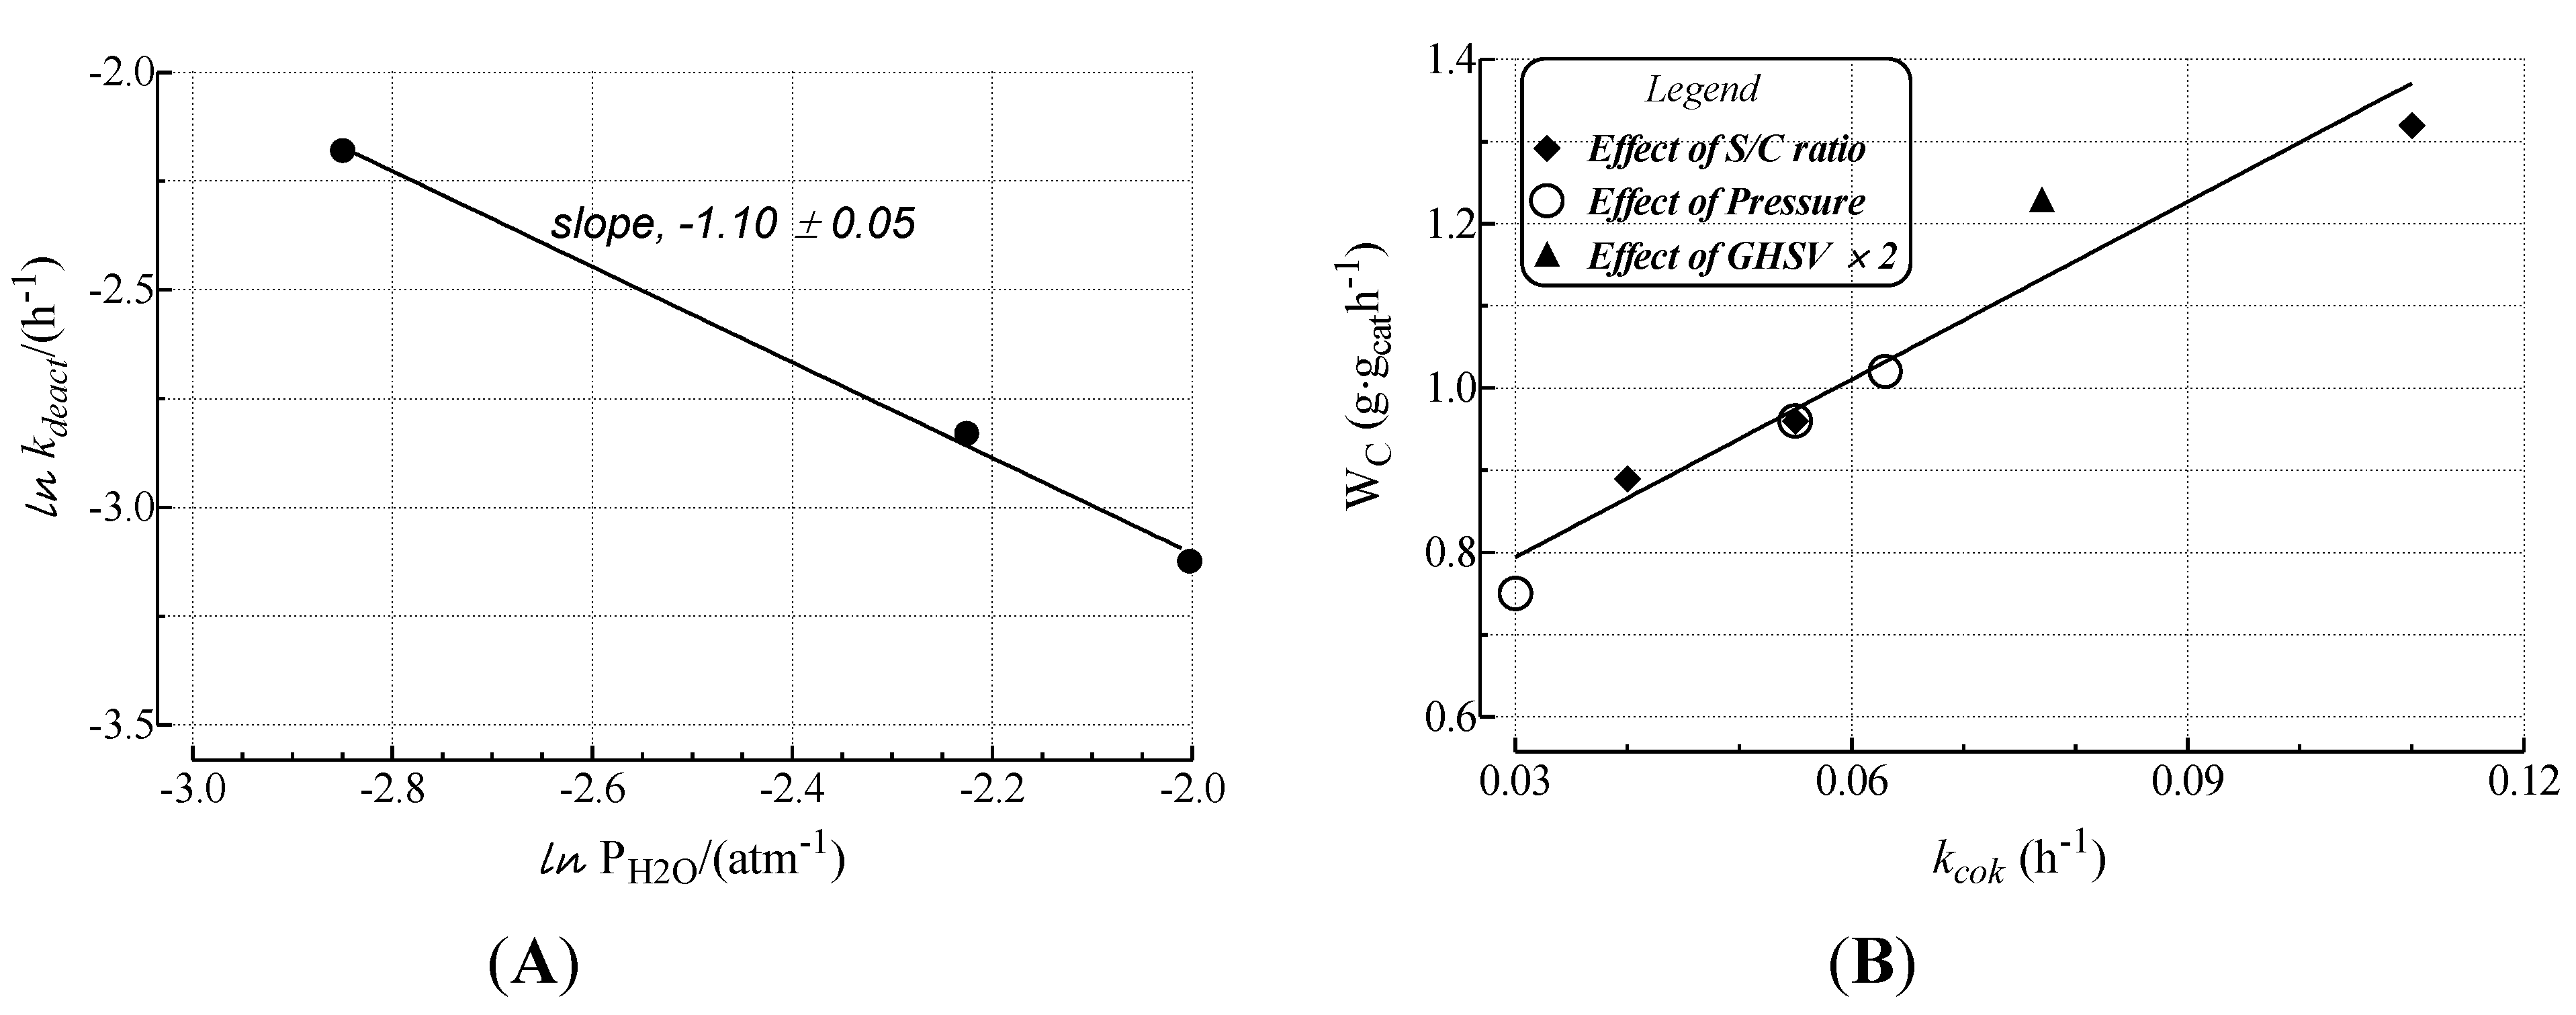
2.2. Modeling of Deactivation Phenomena


| Run | r2 | kcok a (h−1) |
|---|---|---|
| a | 1.00 | 1.1 × 10⁻¹ ± 2 × 10⁻³ |
| b | 1.00 | 5.5 × 10⁻² ± 6 × 10⁻⁴ |
| c | 0.99 | 7.0 × 10⁻² ± 1 × 10⁻³ |
| d | 0.97 | 7.7 × 10⁻²± 5 × 10⁻³ |
| e | 0.96 | - |
| f | 0.98 | 3.0 × 10⁻² ± 1 × 10⁻³ |
| g | 0.97 | 6.3 × 10⁻² ± 3 × 10⁻³ |
- The rates of deactivation by coking and sintering are small relative to the rate of the main reaction. Hence the pseudo steady-state approximation can be made. This is a reasonable assumption in view of 2–3 orders of magnitude differences between reaction and coking rates at any condition and t.o.s. [15];
- The rate of coking is slow enough that it is not influenced by a pore diffusional resistance for the deactivation process;
- Pore diffusion resistance for the main reaction is neglected which, at high reaction rates and conversions, would lower the concentration of hydrocarbon coke precursors into the pores, then lowering coking rates along the pores; similarly concentration gradients through the bed due to high conversions should cause a decrease in adsorbed carbon concentration through the bed. This is probably a poor assumption in view of the high conversions of this study. Thus, the rate constants could be significantly in error due to differences in pore diffusional resistance between runs and represent at best rough averages across pellets and bed.

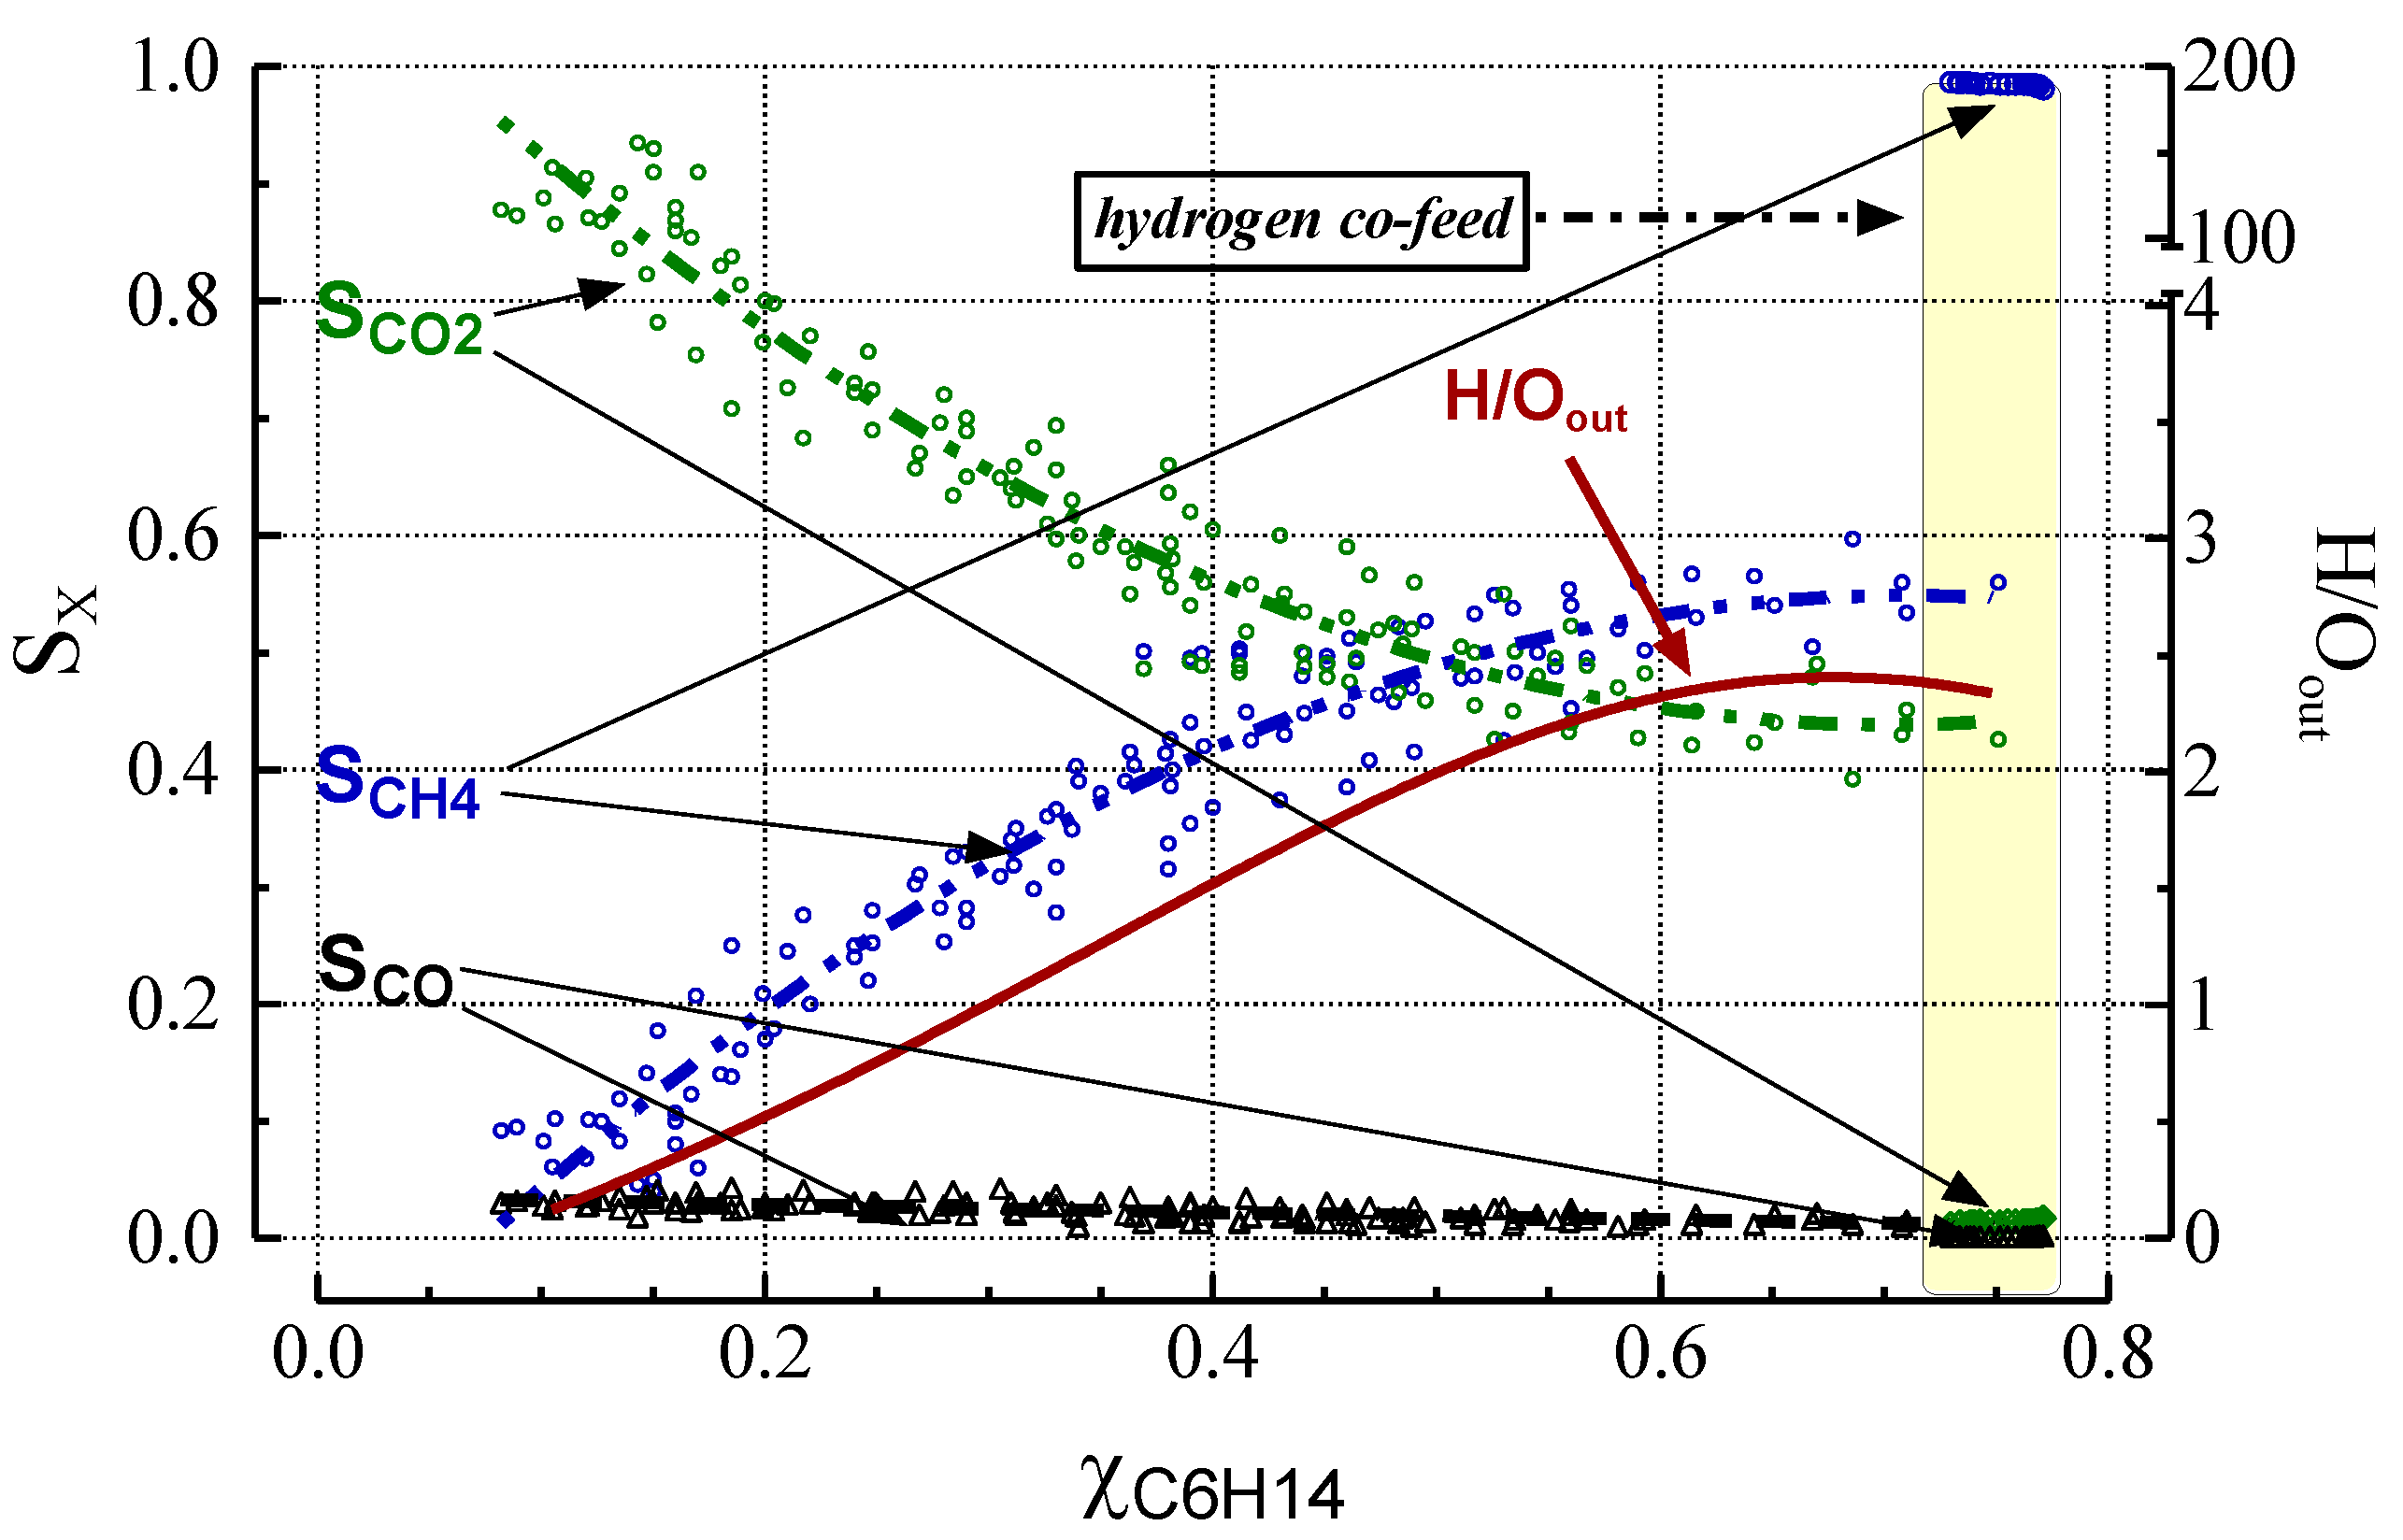
2.3. Effect of Deactivation on Product Selectivity and Surface Functionalities
| Reaction | Stoichiometry | KP a | ||
|---|---|---|---|---|
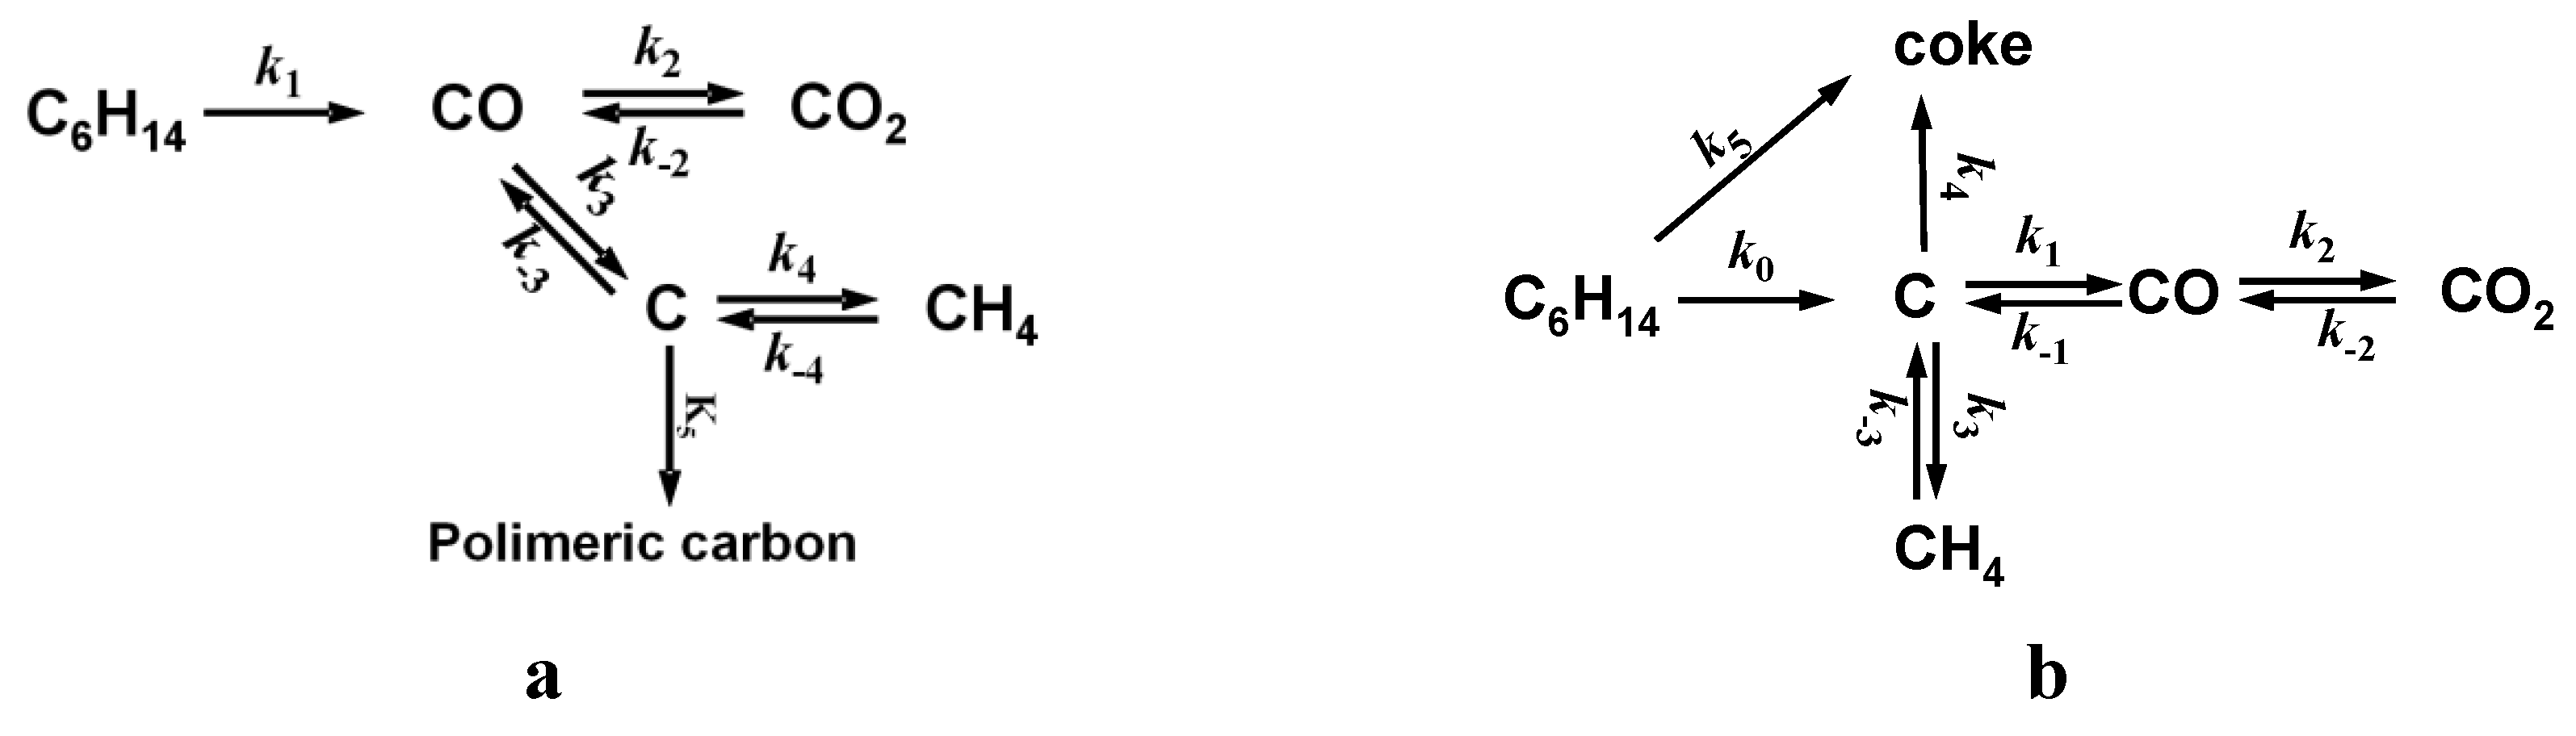
| CRK | C6H14 | ➞ | 6 C + 7 H2 | - |
| GAS | C + H2O | ⇆ | CO + H2 | 5.09 × 10⁻⁴ |
| WGS | CO + H2O | ⇆ | CO2 + H2 | 7.47 × 100 |
| MET | C + 2H2 | ⇆ | CH4 | 5.41 × 101 |
| DISP | 2 CO | ⇆ | C + CO2 | 1.47 × 10⁴ |
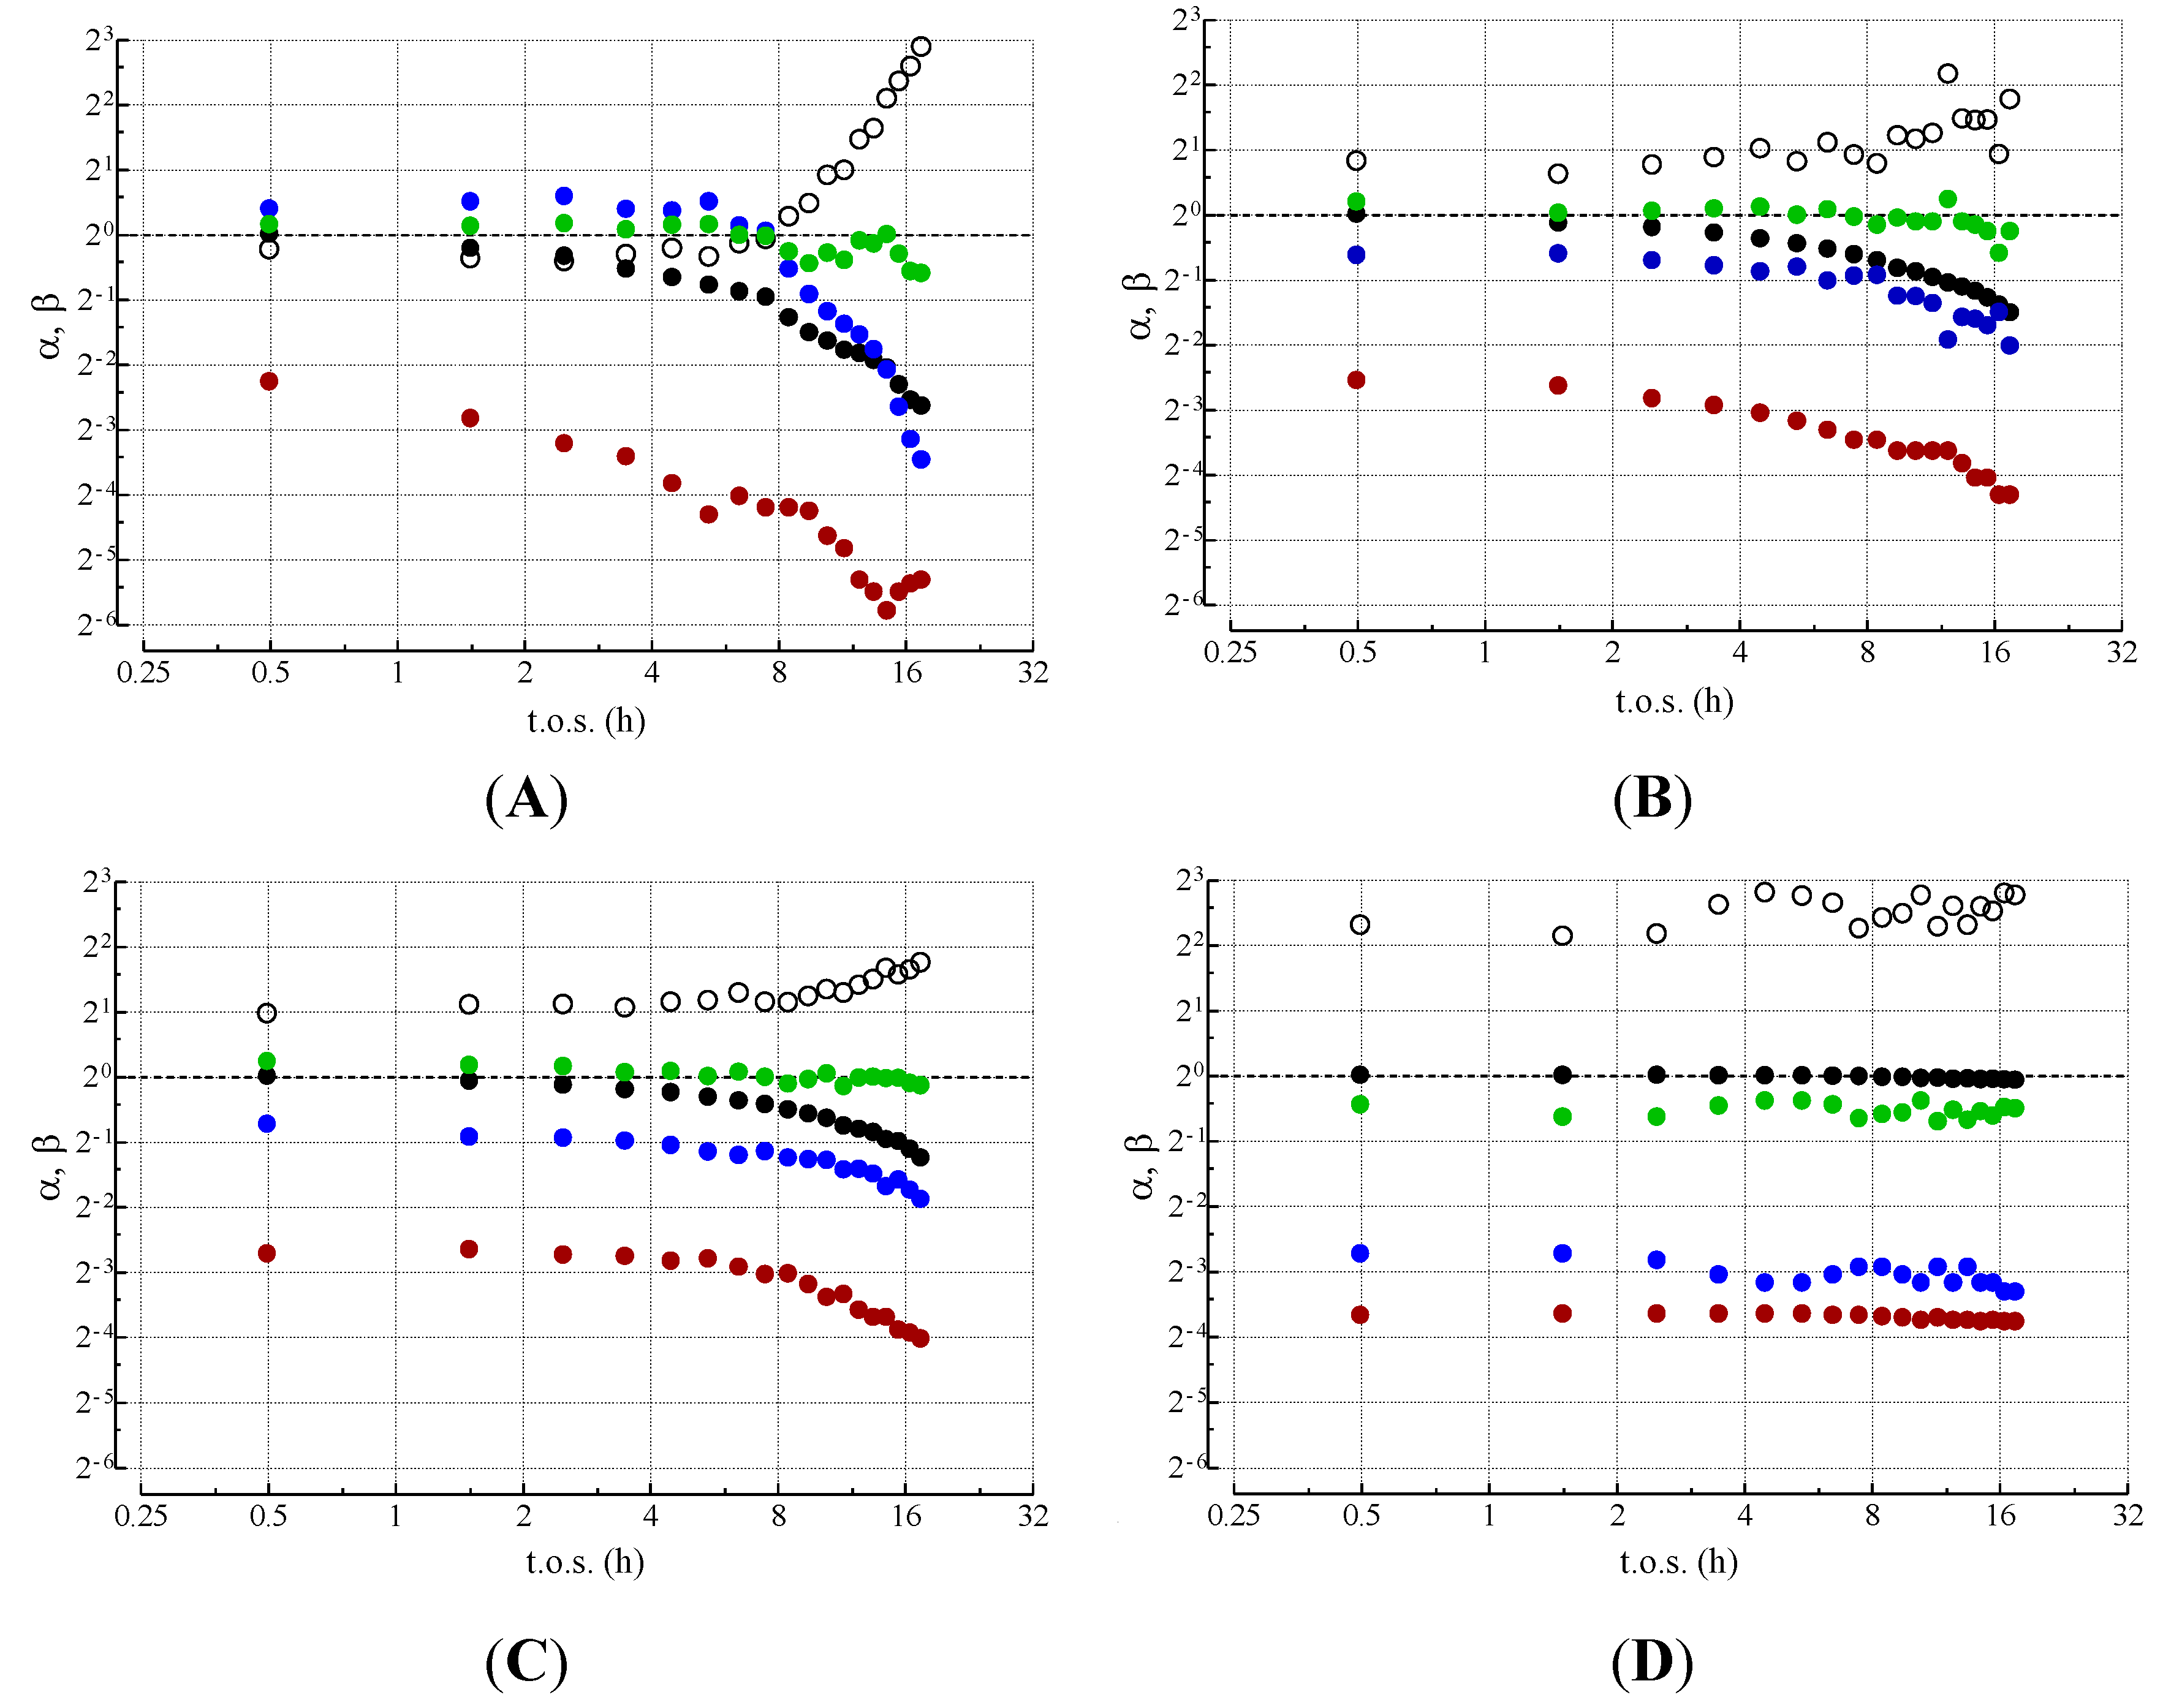
 ) βWGS; (○) βDISP; (
  ) βGAS; (
  ) βMET (reproduced from ref. [11] with the kind permission of Elsevier, copyright 2004).
) βWGS; (○) βDISP; ( ) βGAS; ( ) βMET (reproduced from ref. [11] with the kind permission of Elsevier, copyright 2004).
) βMET (reproduced from ref. [11] with the kind permission of Elsevier, copyright 2004).
) βWGS; (○) βDISP; ( ) βGAS; ( ) βMET (reproduced from ref. [11] with the kind permission of Elsevier, copyright 2004).
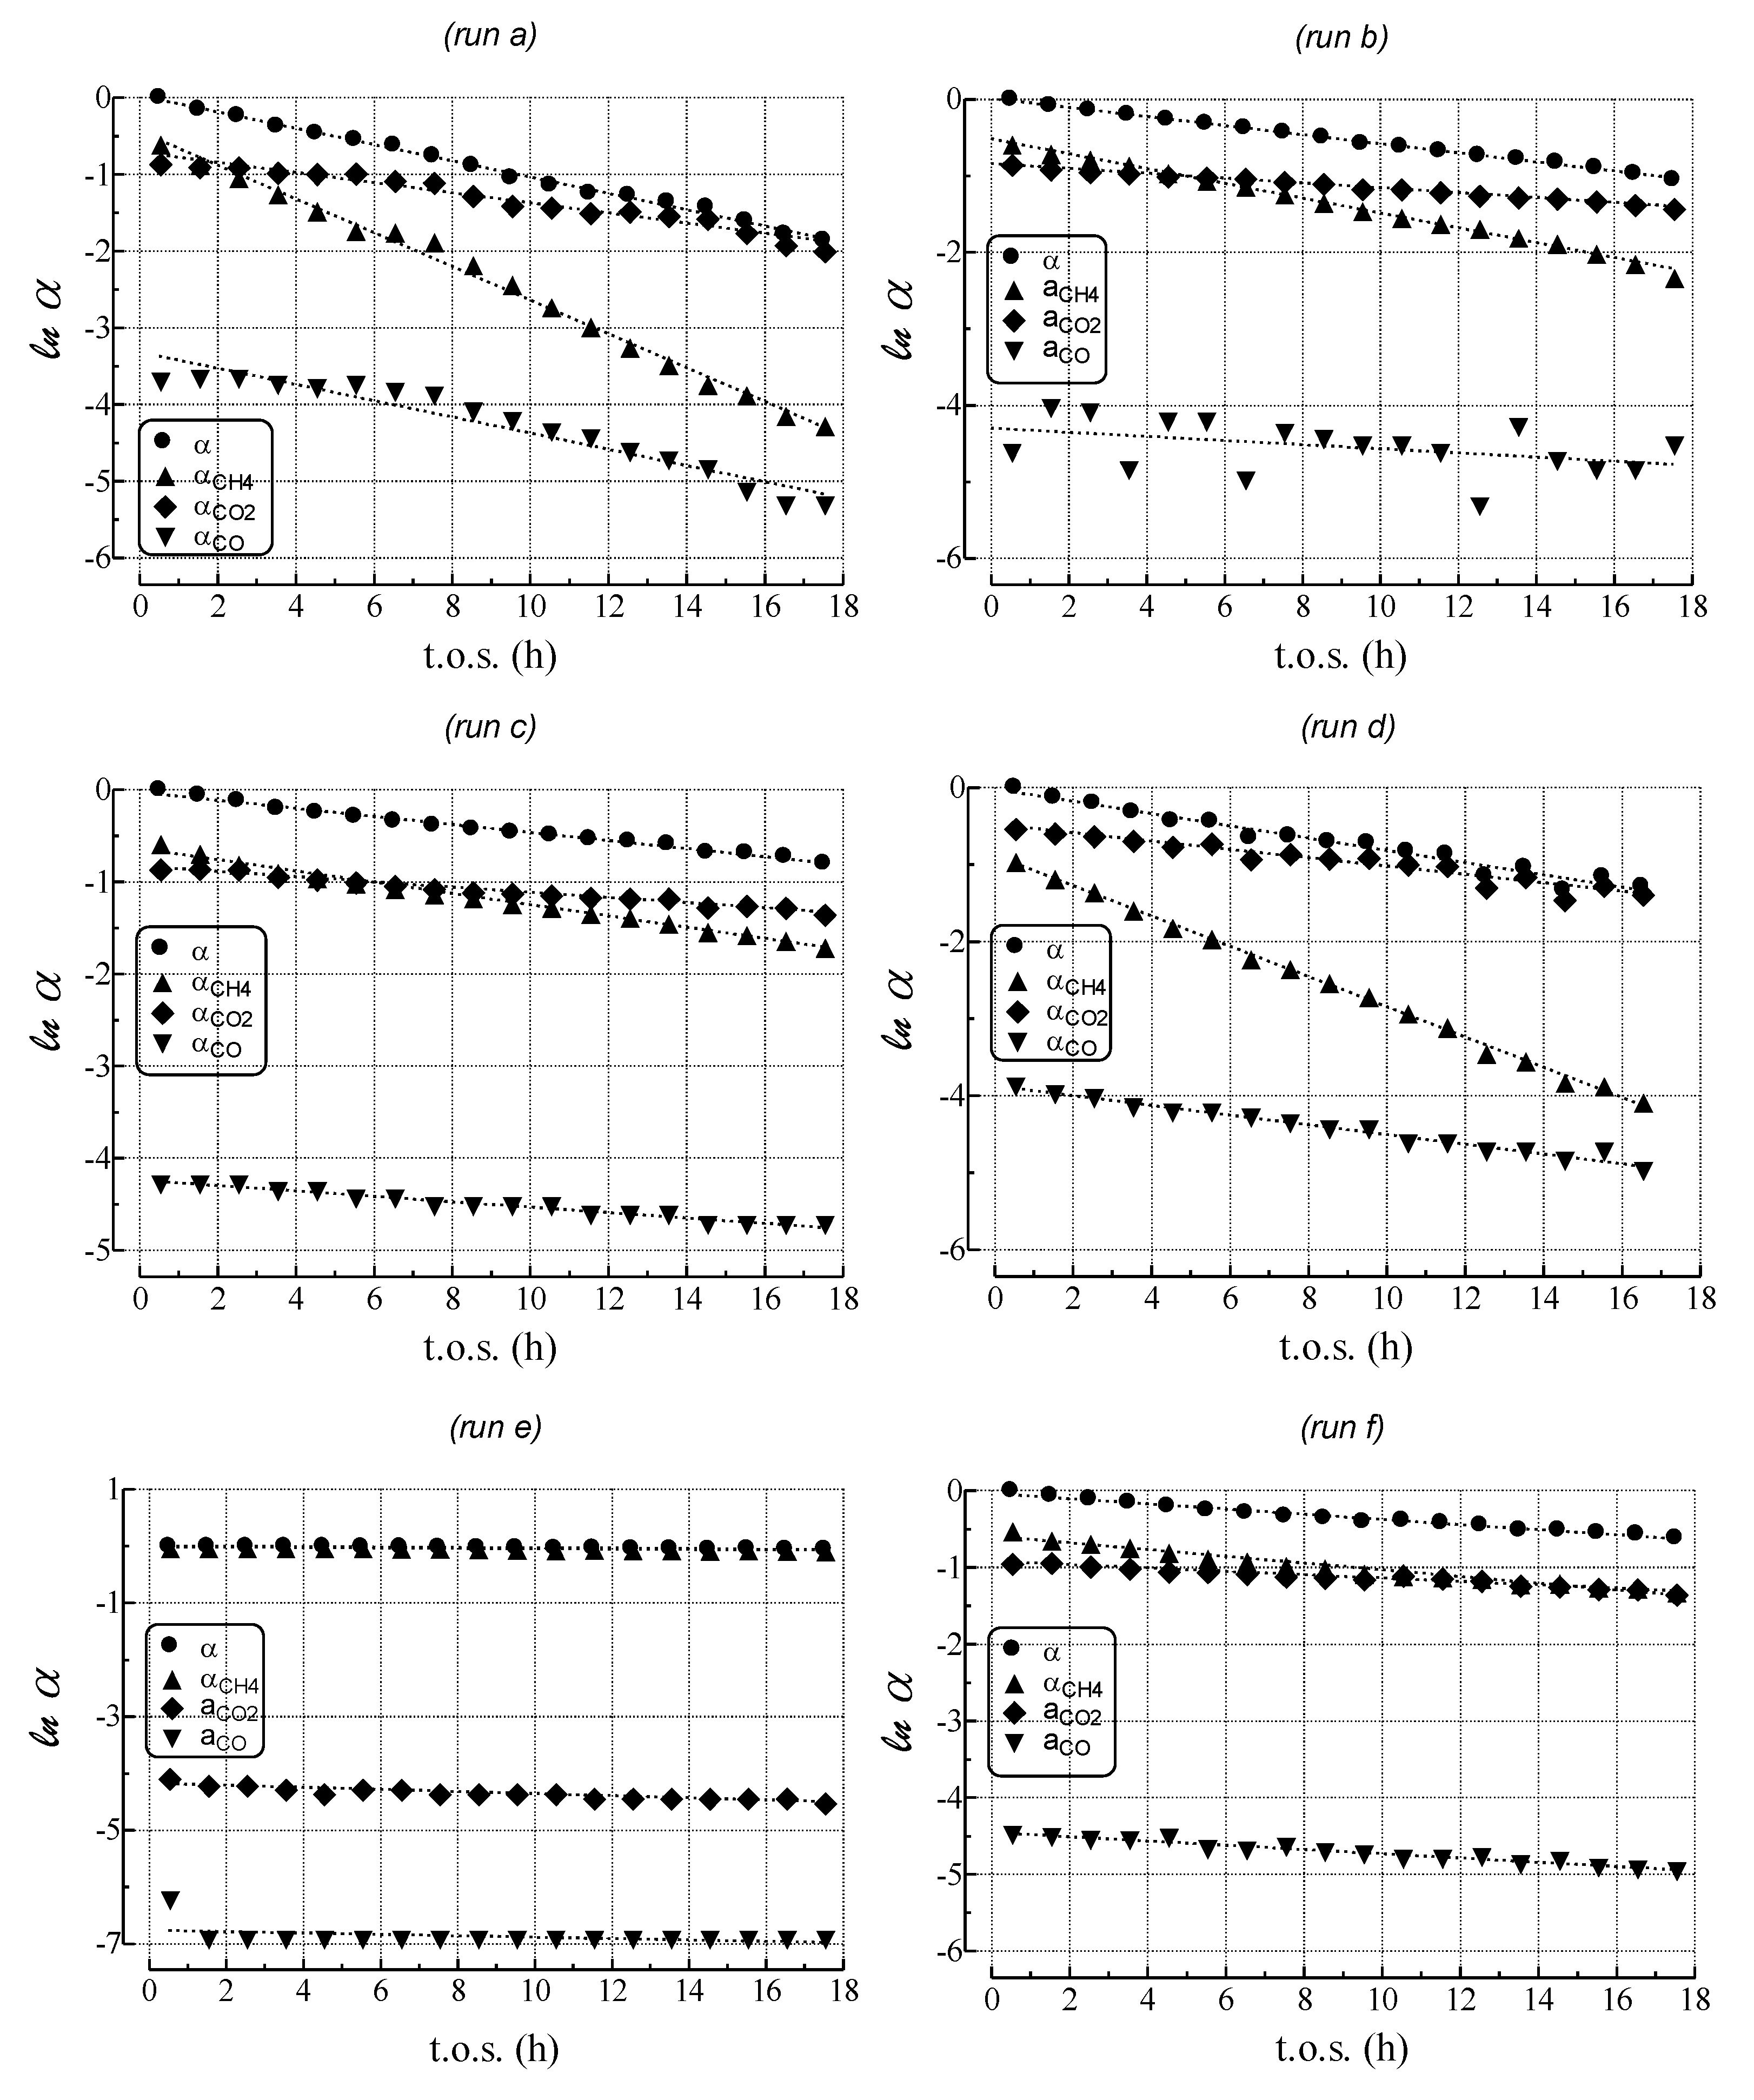
- MET rate (αCH4) decreases much more steeply than relative activity;
- GAS rate (αCO) decreases similar to relative activity;
- WGS rate (αCO2) decreases less than relative activity.

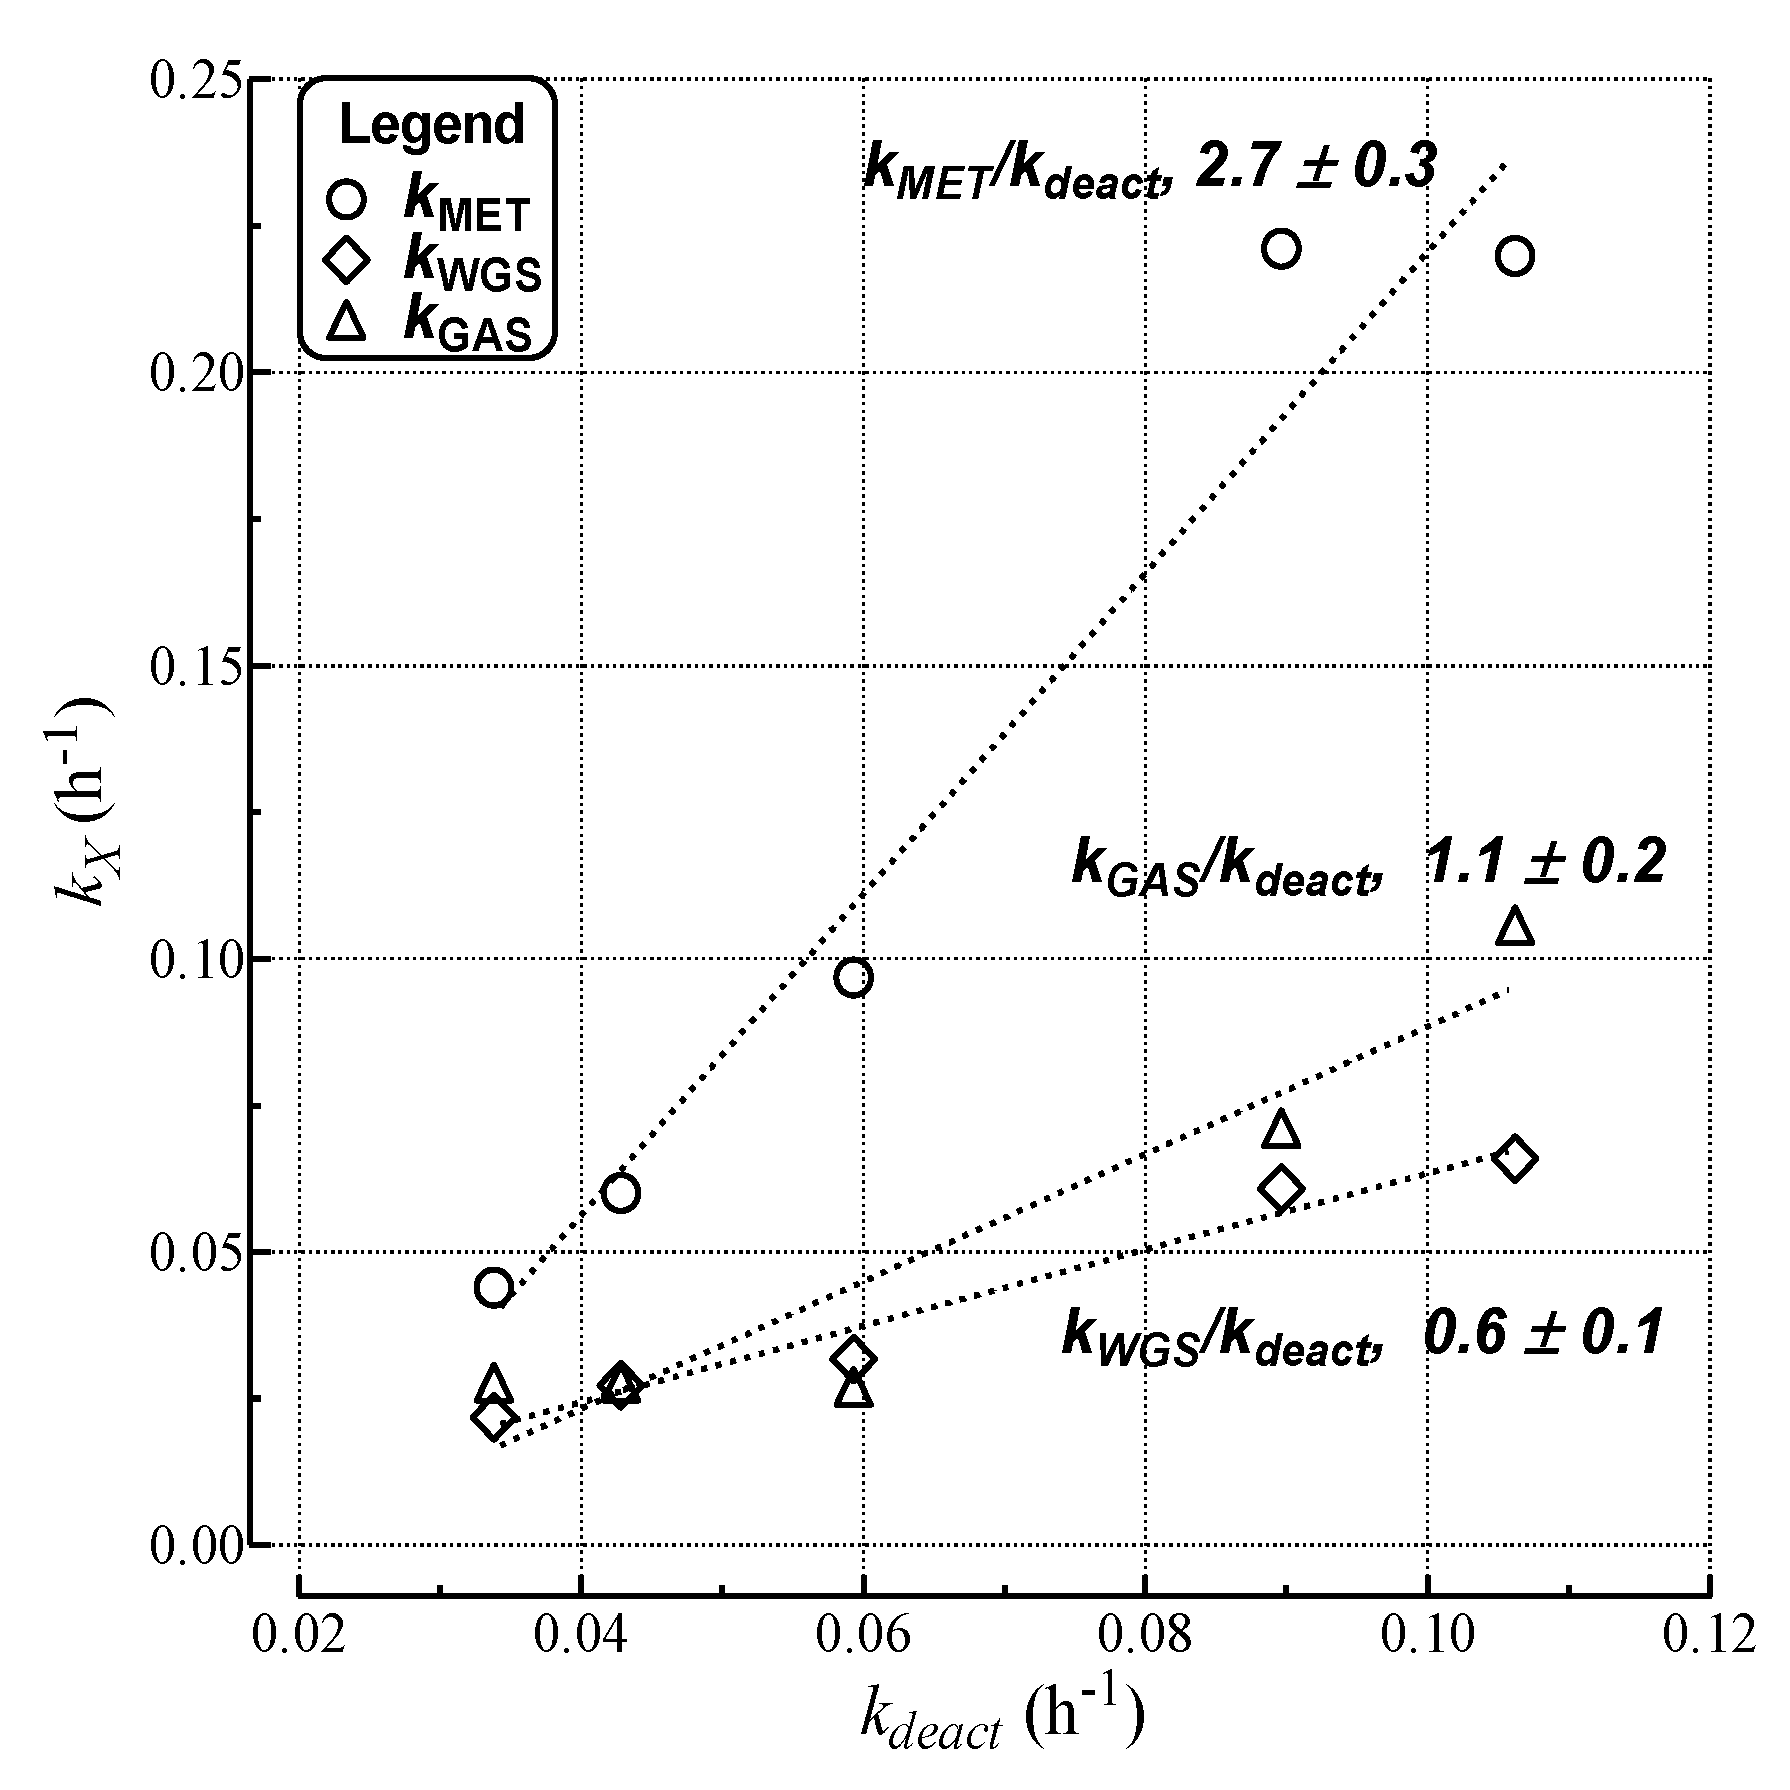
| Run | kdeact a (h−1) | kcok a (h−1) | kMET (h−1) | kGAS (h−1) | kWGS (h−1) |
|---|---|---|---|---|---|
| a | 1.1 × 10⁻¹ | 1.1 × 10⁻¹ | 2.2 × 10⁻¹ | 1.1 × 10⁻¹ | 6.6 × 10⁻² |
| b | 5.9 × 10⁻² | 5.6 × 10⁻² | 9.7 × 10⁻² | 2.7 × 10⁻² | 3.2 × 10⁻² |
| c | 4.4 × 10⁻² | 4.0 × 10⁻² | 6.0 × 10⁻² | 2.8 × 10⁻² | 2.7 × 10⁻² |
| d | 8.1 × 10⁻² | 7.7 × 10⁻² | 2.2 × 10⁻¹ | 7.1 × 10⁻² | 6.1 × 10⁻² |
| e | 3.5 × 10⁻³ | 0.000 | 3.5 × 10⁻³ | 1.2 × 10⁻² | 1.9 × 10⁻² |
| f | 3.4 × 10⁻² | 3.0 × 10⁻² | 4.4 × 10⁻² | 2.8 × 10⁻² | 2.2 × 10⁻² |

3. Experimental Section
3.1. Catalyst Preparation
3.2. Catalyst Testing
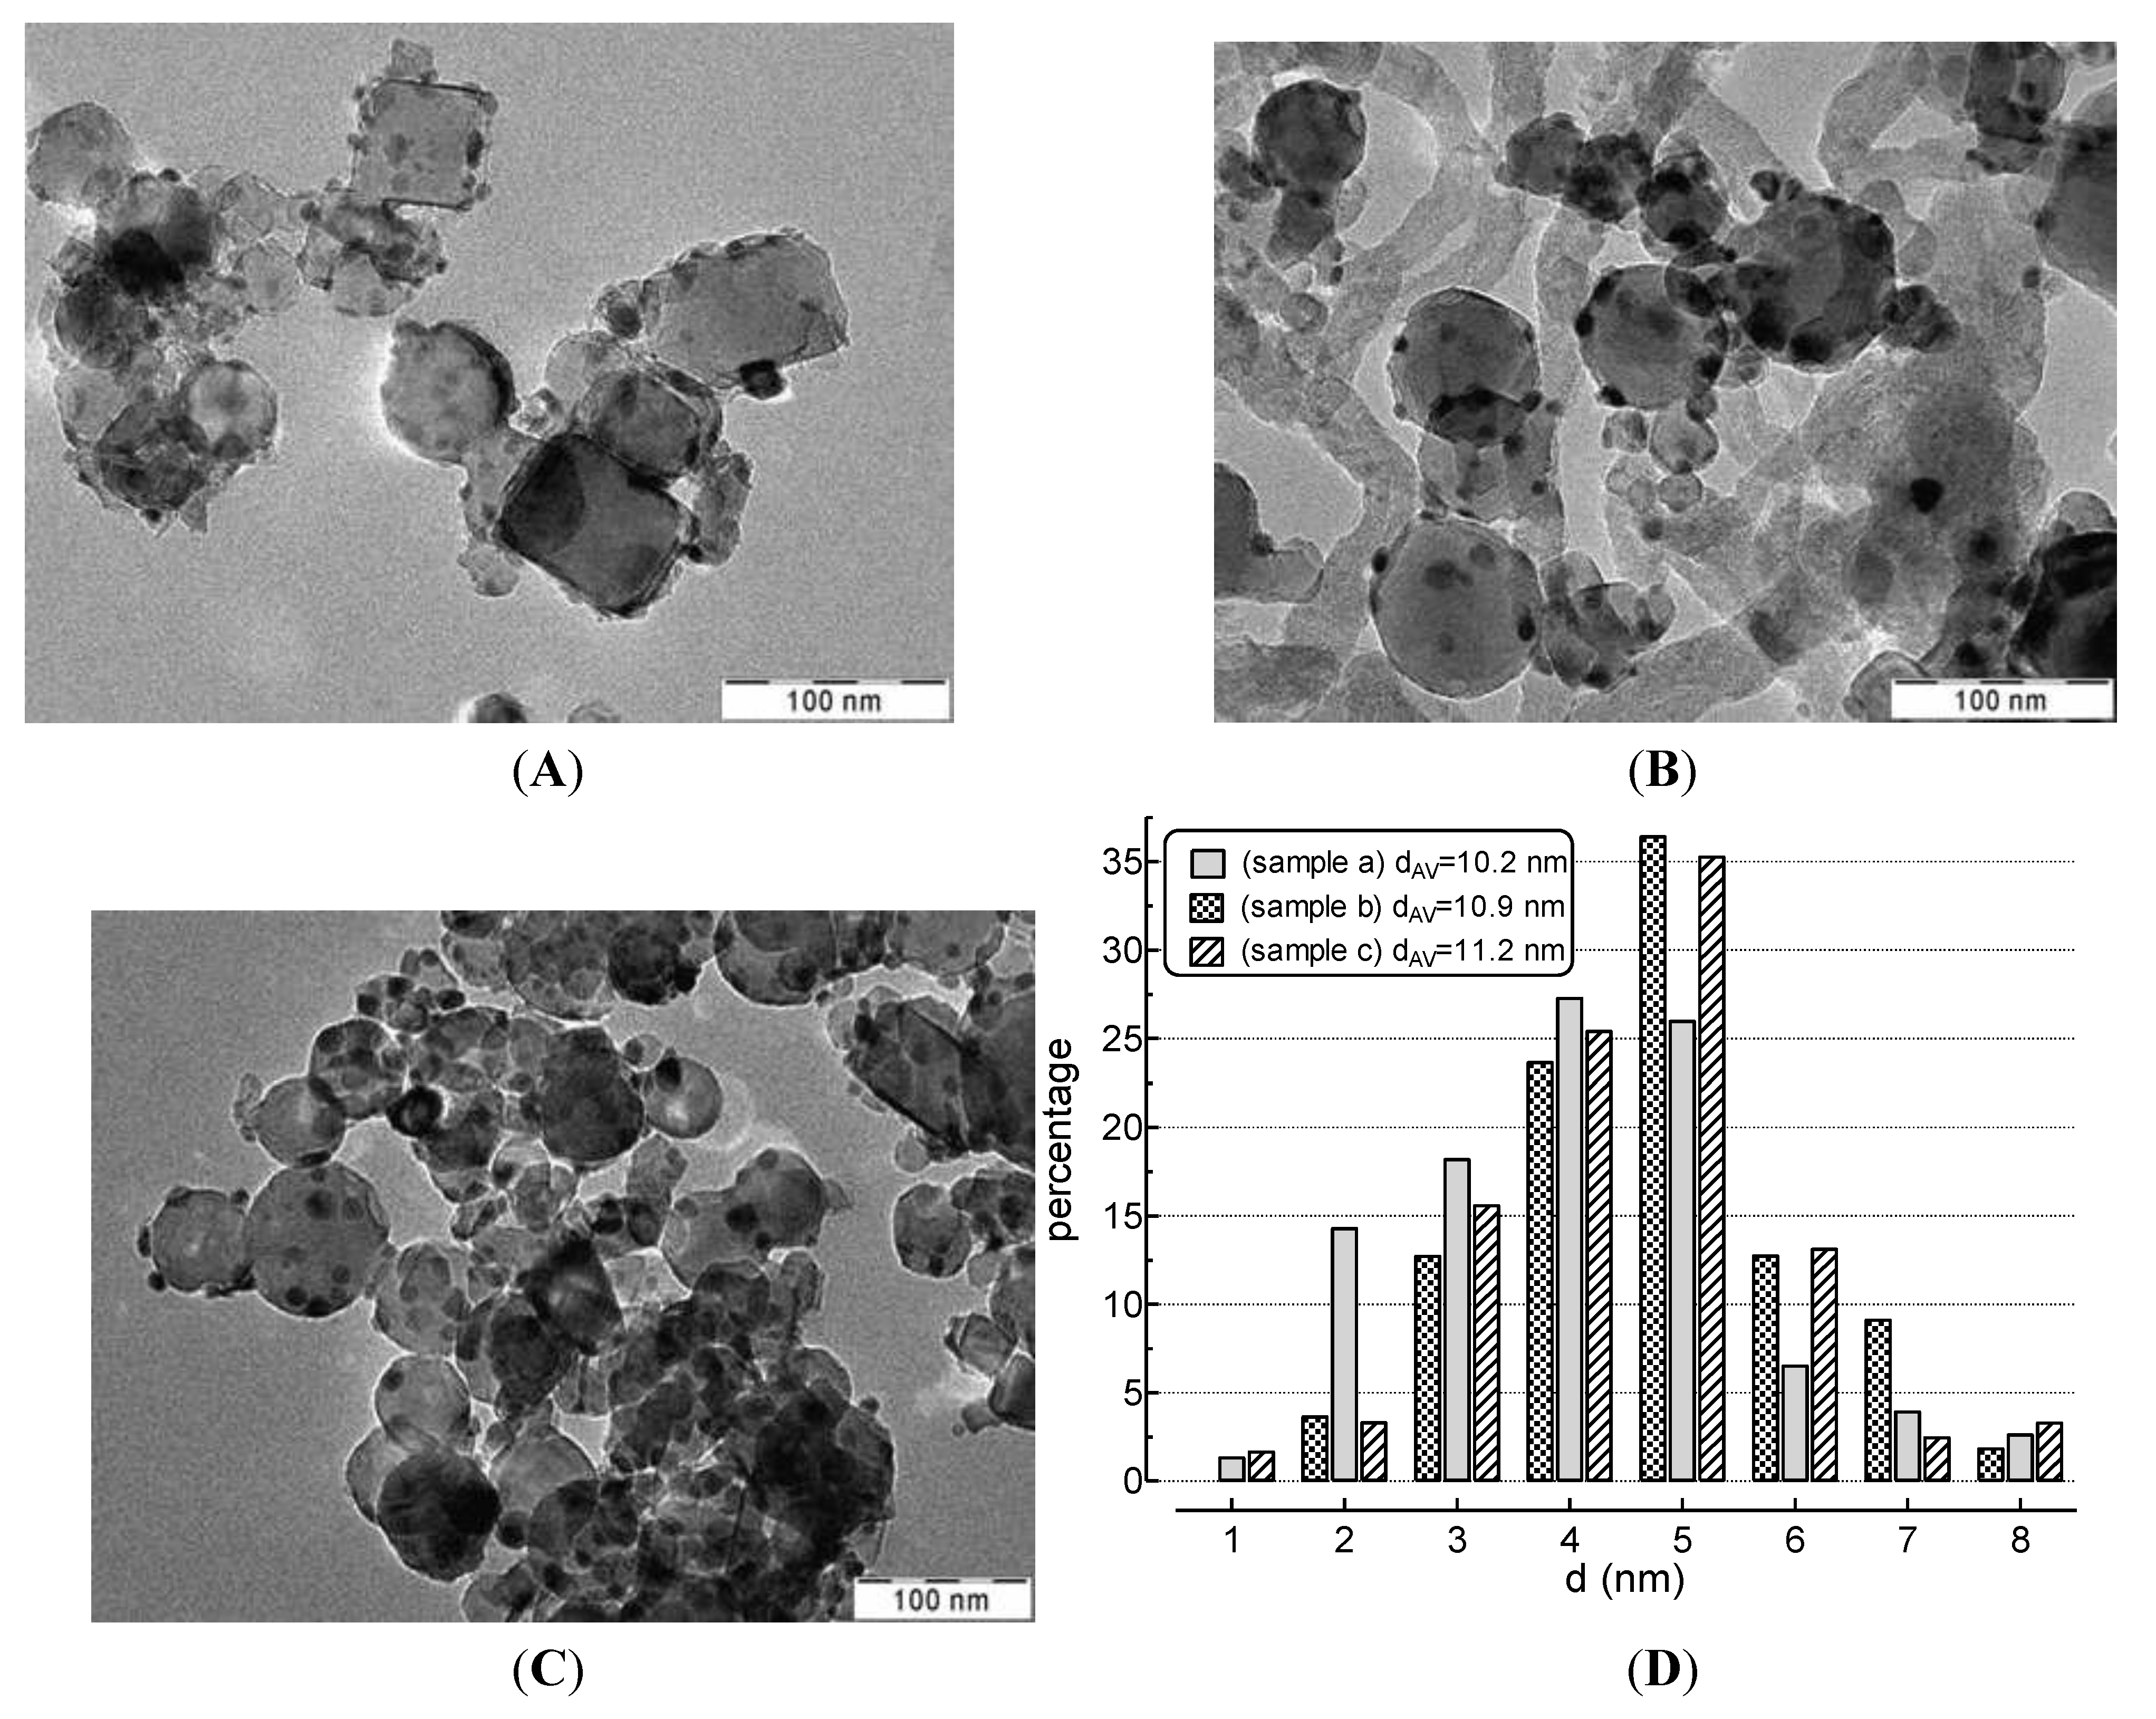
3.3. Catalyst Characterization
4. Conclusions
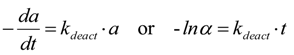
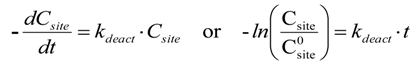
- Deactivation of Ni/MgO by carbon deposition and coking follows a pseudo 1st-order dependence on active site concentration, consistent with an exponential decay with t.o.s. That deactivation by coke and carbon formation is not simple first order in site concentration, is evident from observed decreases in deactivation rate constants with increasing S/C ratio, P, and contact time.
- Comparison of thermodynamic predictions with experimental values of outlet stream composition leads to the conclusion that the kinetics of hexane cracking/reforming, carbon gasification and methanation reactions control the rate of coking; methanation is the critical, rate limiting step responsible for coke deposition in the near absence of H2. Carbon formation via the Boudouard reaction is apparently thermodynamically and kinetically favored.
- Under simulated industrial pre-reforming conditions at a high H2 concentration, hydrogen substantially increases reaction throughput by speeding up hydrogenolysis, CO formation via the water-gas-shift, and methanation reactions. H2 at high concentrations gasifies coke and carbon precursors, thereby largely preventing formation of coke and inactive carbons.
- S-poisoning by thiophene co-feeding causes a sharp drop in catalytic activity due to irreversible poisoning; however, strong pore diffusional resistances in catalyst pellets and bed prevent an accurate analysis of the poisoning mechanism and kinetics.
Author Contributions
Conflict of Interest
References
- Piel, W.J. Transportation fuels of the future? Fuel Process. Tech. 2001, 71, 167–179. [Google Scholar] [CrossRef]
- Nagase, S.; Takami, S.; Hirayama, A.; Hirai, Y. Development of a high efficiency substitute natural gas production process. Catal. Today 1998, 45, 393–397. [Google Scholar] [CrossRef]
- Cromarty, B.J.; Hooper, C.W. Increasing the throughput of an existing hydrogen plant. Int. J. Hydrogen Energy 1997, 22, 17–22. [Google Scholar] [CrossRef]
- Aitani, A.M. Processes to enhance refinery-hydrogen production. Int. J. Hydrogen Energy 1996, 21, 267–271. [Google Scholar] [CrossRef]
- Fierro, J.L.G.; Peña, M.A.; Gómez, J.P. New catalytic routes for syngas and hydrogen production. Appl. Catal. A 1996, 144, 7–57. [Google Scholar] [CrossRef]
- Rostrup-Nielsen, J.; Christiansen, L.J. Concept in Syngas Manufacture. In Catalytic Science Series; Imperial College Press: London, UK, 2011; Volume 10. [Google Scholar]
- Bartholomew, C.H.; Farrauto, R.G. Fundamental of Industrial Catalytic Processes, 2nd ed.; J. Wiley & sons, Inc.: Hobken, NJ, USA, 2006; pp. 339–371. [Google Scholar]
- Wang, X.; Gorte, R.J. A study of steam reforming of hydrocarbon fuels on Pd/ceria. Appl. Catal. A 2002, 224, 209–218. [Google Scholar] [CrossRef]
- Zou, X.; Wang, X.; Li, L.; Shen, K.; Lu, X.; Ding, W. Development of highly effective supported nickel catalysts for pre-reforming of liquefied petroleum gas under low steam to carbon molar ratios. Int. J. Hydrogen Energy 2010, 35, 12191–12200. [Google Scholar] [CrossRef]
- Shen, K.; Wang, X.; Zou, X.; Wang, X.; Lu, X.; Ding, W. Pre-reforming of liquefied petroleum gas over nickel catalysts supported on magnesium aluminum mixed oxides. Int. J. Hydrogen Energy 2011, 36, 4908–4916. [Google Scholar] [CrossRef]
- Arena, F.; Trunfio, G.; Alongi, E.; Branca, D.; Parmaliana, A. Modeling the activity-stability pattern of Ni/MgO catalysts in the pre-reforming of n-hexane. Appl. Catal. A 2004, 266, 155–162. [Google Scholar] [CrossRef]
- Ayabe, A.; Omoto, H.; Utaka, T.; Kikuchi, R.; Sasaki, K.; Teraoke, Y.; Educhi, K. Catalytic autothermal reforming of methane and propane over supported metal catalysts. Appl. Catal. A 2003, 241, 261–269. [Google Scholar] [CrossRef]
- Rostrup-Nielsen, J. Activity of nickel catalysts for steam reforming of hydrocarbons. J. Catal. 1973, 31, 173–181. [Google Scholar] [CrossRef]
- Rostrup-Nielsen, J. Catalysis, Science and Technology; Springer: Berlin, Germany, 1983. [Google Scholar]
- Arena, F. Basic Relationships in the Pre-Reforming of n-Hexane on Ni/MgO Catalyst. AIChE J. 2006, 52, 2823–2831. [Google Scholar] [CrossRef]
- Christensen, T.S. Adiabatic prereforming of hydrocarbons—An important step in syngas production. Appl. Catal. A 1996, 138, 285–309. [Google Scholar] [CrossRef]
- Rostrup-Nielsen, J.; Alstrup, I. Innovation and science in the process industry: Steam reforming and hydrogenolysis. Catal. Today 1999, 53, 311–316. [Google Scholar] [CrossRef]
- Sperle, T.; Chen, D.; Lødeng, R.; Holmen, A. Pre-reforming of natural gas on a Ni catalyst. Criteria for carbon free operation. Appl. Catal. A 2005, 282, 195–204. [Google Scholar] [CrossRef]
- Bartholomew, C.H. Carbon deposition in methanation and steam reforming. Catal. Rev. Sci. Eng. 1982, 24, 67–112. [Google Scholar] [CrossRef]
- Butt, J.B.; Petersen, E.E. Activation, Deactivation and Poisoning of Catalysts; Academic Press; Inc.: San Diego, CA, USA, 1998. [Google Scholar]
- Forzatti, P.; Lietti, L. Catalyst deactivation. Catal. Today 1999, 52, 165–181. [Google Scholar] [CrossRef]
- Bartholomew, C.H. Mechanism of catalyst deactivation. Appl. Catal. A 2001, 212, 17–60. [Google Scholar] [CrossRef]
- Kroll, V.C.H.; Swaan, H.M.; Mirodatos, C. Methane Reforming Reaction with Carbon Dioxide Over Ni/SiO2 Catalyst. Deactivation Studies. J. Catal. 1996, 161, 409–422. [Google Scholar] [CrossRef]
- Tailleur, R.G.; Davila, Y. Optimal Hydrogen Production through Revamping a Naphtha-Reforming Unit: Catalyst Deactivation. Energy Fuels 2008, 22, 2892–2901. [Google Scholar] [CrossRef]
- Sehested, J.; Carlsson, A.; Janssens, T.V.W.; Hansen, P.L.; Datye, A.K. Sintering of nickel steam-reforming catalysts on MgAl2O4 spinel supports. J. Catal. 2001, 197, 200–209. [Google Scholar] [CrossRef]
- Ashrafi, M.; Pfeifer, C.; Pröll, T.; Hofbauer, H. Experimental Study of Model Biogas Catalytic Steam Reforming: 2. Impact of Sulfur on the Deactivation and Regeneration of Ni-Based Catalysts. Energy Fuels 2008, 22, 4190–4195. [Google Scholar] [CrossRef]
- Gallego, J.; Batiot-Dupeyrat, C.; Barrault, J.; Mondragón, F. Severe Deactivation of a LaNiO3 Perovskite-Type Catalyst Precursor with H2S during Methane Dry Reforming. Energy Fuels 2009, 23, 4883–4886. [Google Scholar] [CrossRef]
- Arena, F.; Parmaliana, A. Strategies of design of Ni/MgO catalysts for the reforming of hydrocarbon to hydrogen/syngas. Curr. Top. Catal. 2006, 5, 69–88. [Google Scholar]
- Parmaliana, A.; Arena, F.; Frusteri, F.; Coluccia, S.; Marchese, L.; Martra, G.; Chuvilin, A. Magnesia Supported Nickel Catalysts. Part II: Surface properties and reactivity in CH4 steam reforming. J. Catal. 1993, 141, 34–47. [Google Scholar] [CrossRef]
- Frusteri, F.; Spadaro, L.; Arena, F.; Chuvilin, A. TEM evidence for factors affecting the genesis of carbon species on bare and K-doped Ni/MgO catalysts during the dry-reforming of methane. Carbon 2002, 40, 1063–1070. [Google Scholar] [CrossRef]
- Arena, F.; Horrell, B.A.; Cocke, D.L.; Parmaliana, A.; Giordano, N. Magnesia-Supported Nickel Catalysts. I: Structure and morphological properties. J. Catal. 1991, 132, 58–67. [Google Scholar] [CrossRef]
- Suzuki, T.; Iwanami, H.; Yoshinari, T. Steam reforming of kerosene on Ru/Al2O3 catalyst to yield hydrogen. Int. J. Hydrogen Energy 2000, 25, 119–126. [Google Scholar] [CrossRef]
- Ming, Q.; Healey, T.; Allen, L.; Irving, P. Steam reforming of hydrocarbon fuels. Catal. Today 2002, 77, 51–64. [Google Scholar] [CrossRef]
- Beeckman, J.W.; Nam, I.-S.; Froment, G.F. Stochastic modeling of catalyst deactivation by site coverage. Stud. Surf. Sci. Catal. 1987, 34, 365–379. [Google Scholar] [CrossRef]
- Jackson, S.D.; Thomson, S.J.; Webb, G. Carbonaceous deposition associated with the catalytic steam-reforming of hydrocarbons over nickel alumina catalysts. J. Catal. 1981, 70, 249–263. [Google Scholar] [CrossRef]
- Snoeck, J.-W.; Froment, G.F.; Fowles, M.J. Filamentous carbon formation and gasification: thermodynamics, driving force, nucleation, and steady-state growth. J. Catal. 1997, 169, 240–249. [Google Scholar] [CrossRef]
- Chen, F.; Zha, S.; Dg, J.; Liu, M. Pre-reforming of propane for low-temperature SOFCs. Solid State Ionics 2004, 166, 269–273. [Google Scholar] [CrossRef]
- Sughrue, E.L.; Bartholomew, C.H. Kinetics of carbon monoxide methanation on nickel monolithic catalysts. Appl. Catal. 1982, 2, 239–256. [Google Scholar] [CrossRef]
- Rostrup-Nielsen, J. Sulfur Poisoning. In Progress in Catalyst Deactivation; Figuerido, J.L., Ed.; Martinus Nijhoff Publisher: The Hague, The Netherlands, 1982; pp. 209–227. [Google Scholar]
- Sidjabat, O.; Trimm, D.L. Nickel-magnesia catalysts for the steam reforming of light hydrocarbons. Top. Catal. 2000, 11/12, 279–282. [Google Scholar] [CrossRef]
- Fujita, S.; Terenuma, H.; Nakamura, M.; Takezawa, N. Mechanisms of methanation of CO and CO2 over Ni. Ind. Eng. Chem. Res. 1991, 30, 1146–1151. [Google Scholar] [CrossRef]
© 2014 by the authors; licensee MDPI, Basel, Switzerland. This article is an open access article distributed under the terms and conditions of the Creative Commons Attribution license (http://creativecommons.org/licenses/by/3.0/).
Share and Cite
Trunfio, G.; Arena, F. Deactivation Pattern of a “Model” Ni/MgO Catalyst in the Pre-Reforming of n-Hexane. Catalysts 2014, 4, 196-214. https://doi.org/10.3390/catal4020196
Trunfio G, Arena F. Deactivation Pattern of a “Model” Ni/MgO Catalyst in the Pre-Reforming of n-Hexane. Catalysts. 2014; 4(2):196-214. https://doi.org/10.3390/catal4020196
Chicago/Turabian StyleTrunfio, Giuseppe, and Francesco Arena. 2014. "Deactivation Pattern of a “Model” Ni/MgO Catalyst in the Pre-Reforming of n-Hexane" Catalysts 4, no. 2: 196-214. https://doi.org/10.3390/catal4020196
APA StyleTrunfio, G., & Arena, F. (2014). Deactivation Pattern of a “Model” Ni/MgO Catalyst in the Pre-Reforming of n-Hexane. Catalysts, 4(2), 196-214. https://doi.org/10.3390/catal4020196