1. Introduction
Metastatic spread still remains the main cause of deaths in breast cancer. There are two main routes of cancer cells dissemination in breast cancer: lymphatic and hematogenous.
Axillary lymph node status is one of the most important prognostic factors for survival in breast cancer [
1]. However, clinical studies have shown that approximately 25% of patients with negative lymph node status still develop systemic recurrence and die of the disease [
2,
3,
4]. This might suggest that hematogenous spread occurs in a substantial number of patients and is independent of lymphatic involvement.
The hematogenous route of dissemination can be manifested as disseminated cells in bone marrow (DTCs) or circulating tumor cells (CTCs) in the bloodstream of cancer patients. In the pooled analysis of 4,703 patients with operable breast cancer DTCs have been shown to be a negative prognostic factor [
5], like CTCs analyzed in a recent meta-analysis [
6]. The number of CTCs carries prognostic information in both early [
7,
8] and metastatic breast cancer [
9,
10,
11]. Also, CTCs detected via PCR-based methods have been shown to be associated with poor prognosis in a number of studies [
12,
13], summarized by Zhao [
14]. CTCs may constitute seeds for subsequent growth of metastasis in distant organs, according to Paget’s “seed and soil hypothesis” [
15]. Nevertheless, they represent a heterogeneous population of tumor cells and only some of them are capable of developing metastasis.
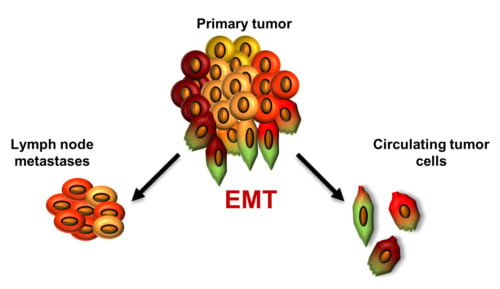
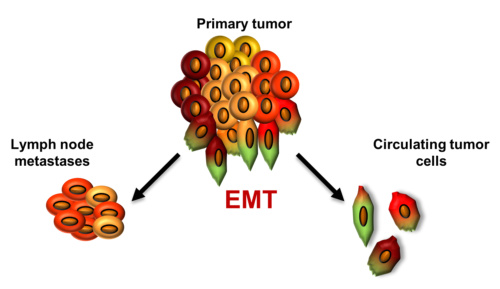
Epithelial-mesenchymal transition (EMT) has been found to be crucial in cancer dissemination, endowing tumor cells with metastatic and cancer stem cell properties [
16,
17]. It is characterized by downregulation of epithelial markers (e.g., cytokeratin 8, 18, 19, E-cadherin, claudins, occludins) and upregulation of mesenchymal markers (e.g.,
N-cadherin, fibronectin, vimentin, tenascin C) [
18], what results in numerous phenotypic changes such as the loss of cell-cell adhesion and cell polarity, and the acquisition of migratory and invasive properties [
19,
20]. TWIST1, SNAI1 and SNAI2 are transcription factors governing EMT [
19]. Their increased expression in primary tumor (PT) has been associated with poor prognostic clinico-pathological features and worse outcome in breast and other cancers [
21,
22,
23]. Also increased expression of
TWIST1 and
SNAI1 in lymph node metastasis (LNM) of early breast cancer patients, reported previously by our group, conferred worse prognosis, confirming the correlation of EMT with aggressive disease behavior [
24]. EMT seems to be involved in metastatic potential of CTCs [
25,
26,
27]. Mesenchymal markers on CTCs have been detected in numerous studies [
28,
29,
30], they occurred more frequently in metastatic compared to early breast cancer [
26]. Mesenchymal CTCs were associated with disease progression [
30] and allowed more accurate prediction of worse prognosis than the expression of epithelial markers alone [
31].
Correlation of CTCs presence in blood with lymphatic spread is still controversial. Some studies have revealed that CTCs might be shed by primary tumors independently of lymph node status [
7,
32,
33,
34,
35], while other presented strong correlations between CTCs and lymph node involvement [
36], compiled also by recent meta-analysis [
14].
It has been hypothesized that some tumors, like breast cancer [
37,
38,
39], may spread preferentially via lymphatic pathways to lymph nodes, whereas others, e.g., sarcomas [
37,
39], may metastasize directly via a hematogenous route at an early stage. These pathways are governed by the biological characteristics of the primary tumor (PT), complemented by factors in the metastatic host environment [
40]. A preferential metastasis route might result from differences in structure and accessibility of lymphatic and hematogenous vasculature in the primary tumor [
41]. We have hypothesized that tumor cells disseminated via lymphatic or hematogenous route show different levels of EMT activation as a result of varying changes cancer cells need to adapt in order to enter and survive in those circulatory systems.
In the current study we have prospectively examined patterns of metastatic spread to lymph nodes and peripheral blood in a group of patients with early breast cancer. We have evaluated gene expression patterns of EMT-related markers in PT and correlated them with the pattern of metastatic spread for the individual tumors as determined by the presence or absence of lymph node metastases (LNM) or CTCs. We also compared EMT-related gene expression pattern in PT with expression patterns in LNM and CTCs enriched blood fractions (CTCs-EBF). The focus was also put on comparison of epithelial and mesenchymal CTCs phenotypes in relation to clinical data.
3. Discussion
Cancer dissemination and metastasis formation remain the most intensively investigated issues in cancer research. Recent findings suggested that distinct lymphatic and hematogenous metastatic pathways exist in early breast cancer and that these pathways are governed by specific biological markers [
40]. Since EMT was shown to play critical role in cancer dissemination, we focused on gene expression profiles related to lymphatic and hematogenous dissemination. We therefore analyzed the expression of mesenchymal markers connected with EMT activation (
VIM,
TWIST1,
SNAI1 and
SNAI2) in PT, CTCs-EBF and LNM of breast cancer patients.
First, we tried to elucidate if gene expression profile of EMT-related markers in PT correlates with the pattern of metastatic spread. We have found that examined profile of PT did not correlate with hematogenous spread expressed as positivity either for CTCs epithelial (
CK19+) or mesenchymal (
VIM+) phenotype or
CK19+ and/or
MGB1+ and/or
HER2+ (data not shown). Interestingly,
SNAI1 and
VIM negative status in PT correlated with lymph node involvement, suggesting that EMT was not involved in lymphatic dissemination. The anatomy of lymphatic vessels/system might make it easier for tumor cells to metastasize to lymph nodes. Lymphatic capillaries lack tight junctions that are present in blood vessels and are not surrounded by pericytes [
42]. It was also shown that lymphatic endothelial cells might facilitate intravasation of tumor cells [
43] and tumor cells can be transported to lymph nodes by mechanical forces arising from intratumoral interstitial fluid pressure [
44]. Permeability of lymphatic vessels could also allow for passage of E-cadherin connected cells clusters [
41,
45]. If fewer restrains are put on tumor cells metastasizing via the lymphatic route it is conceivable that these cells do not need to acquire special abilities to metastasize to the lymph nodes. Whereas more severe obstacles that tumor cells encounter during hematogenous dissemination force them to acquire additional properties like motility, induced by EMT. Following this reasoning, the study of Giampieri
et al. [
46] showed that most tumor cells which had arrived in lymph nodes present collective migration phenotype. Moreover, these cells are incapable of forming hematogenous metastases [
46], whereas cells exhibiting single migration pattern (like those after EMT) are. Hematogenous metastases were also reduced by inhibiting TGF-β signaling, known for induction of EMT. Interestingly, inhibiting TGF-β signaling did not affect lymphatic metastases as visualized by the presence of collectively invading cancer cells in lymph nodes. These observations support our results, showing that EMT in PT is not required for lymph nodes invasion.
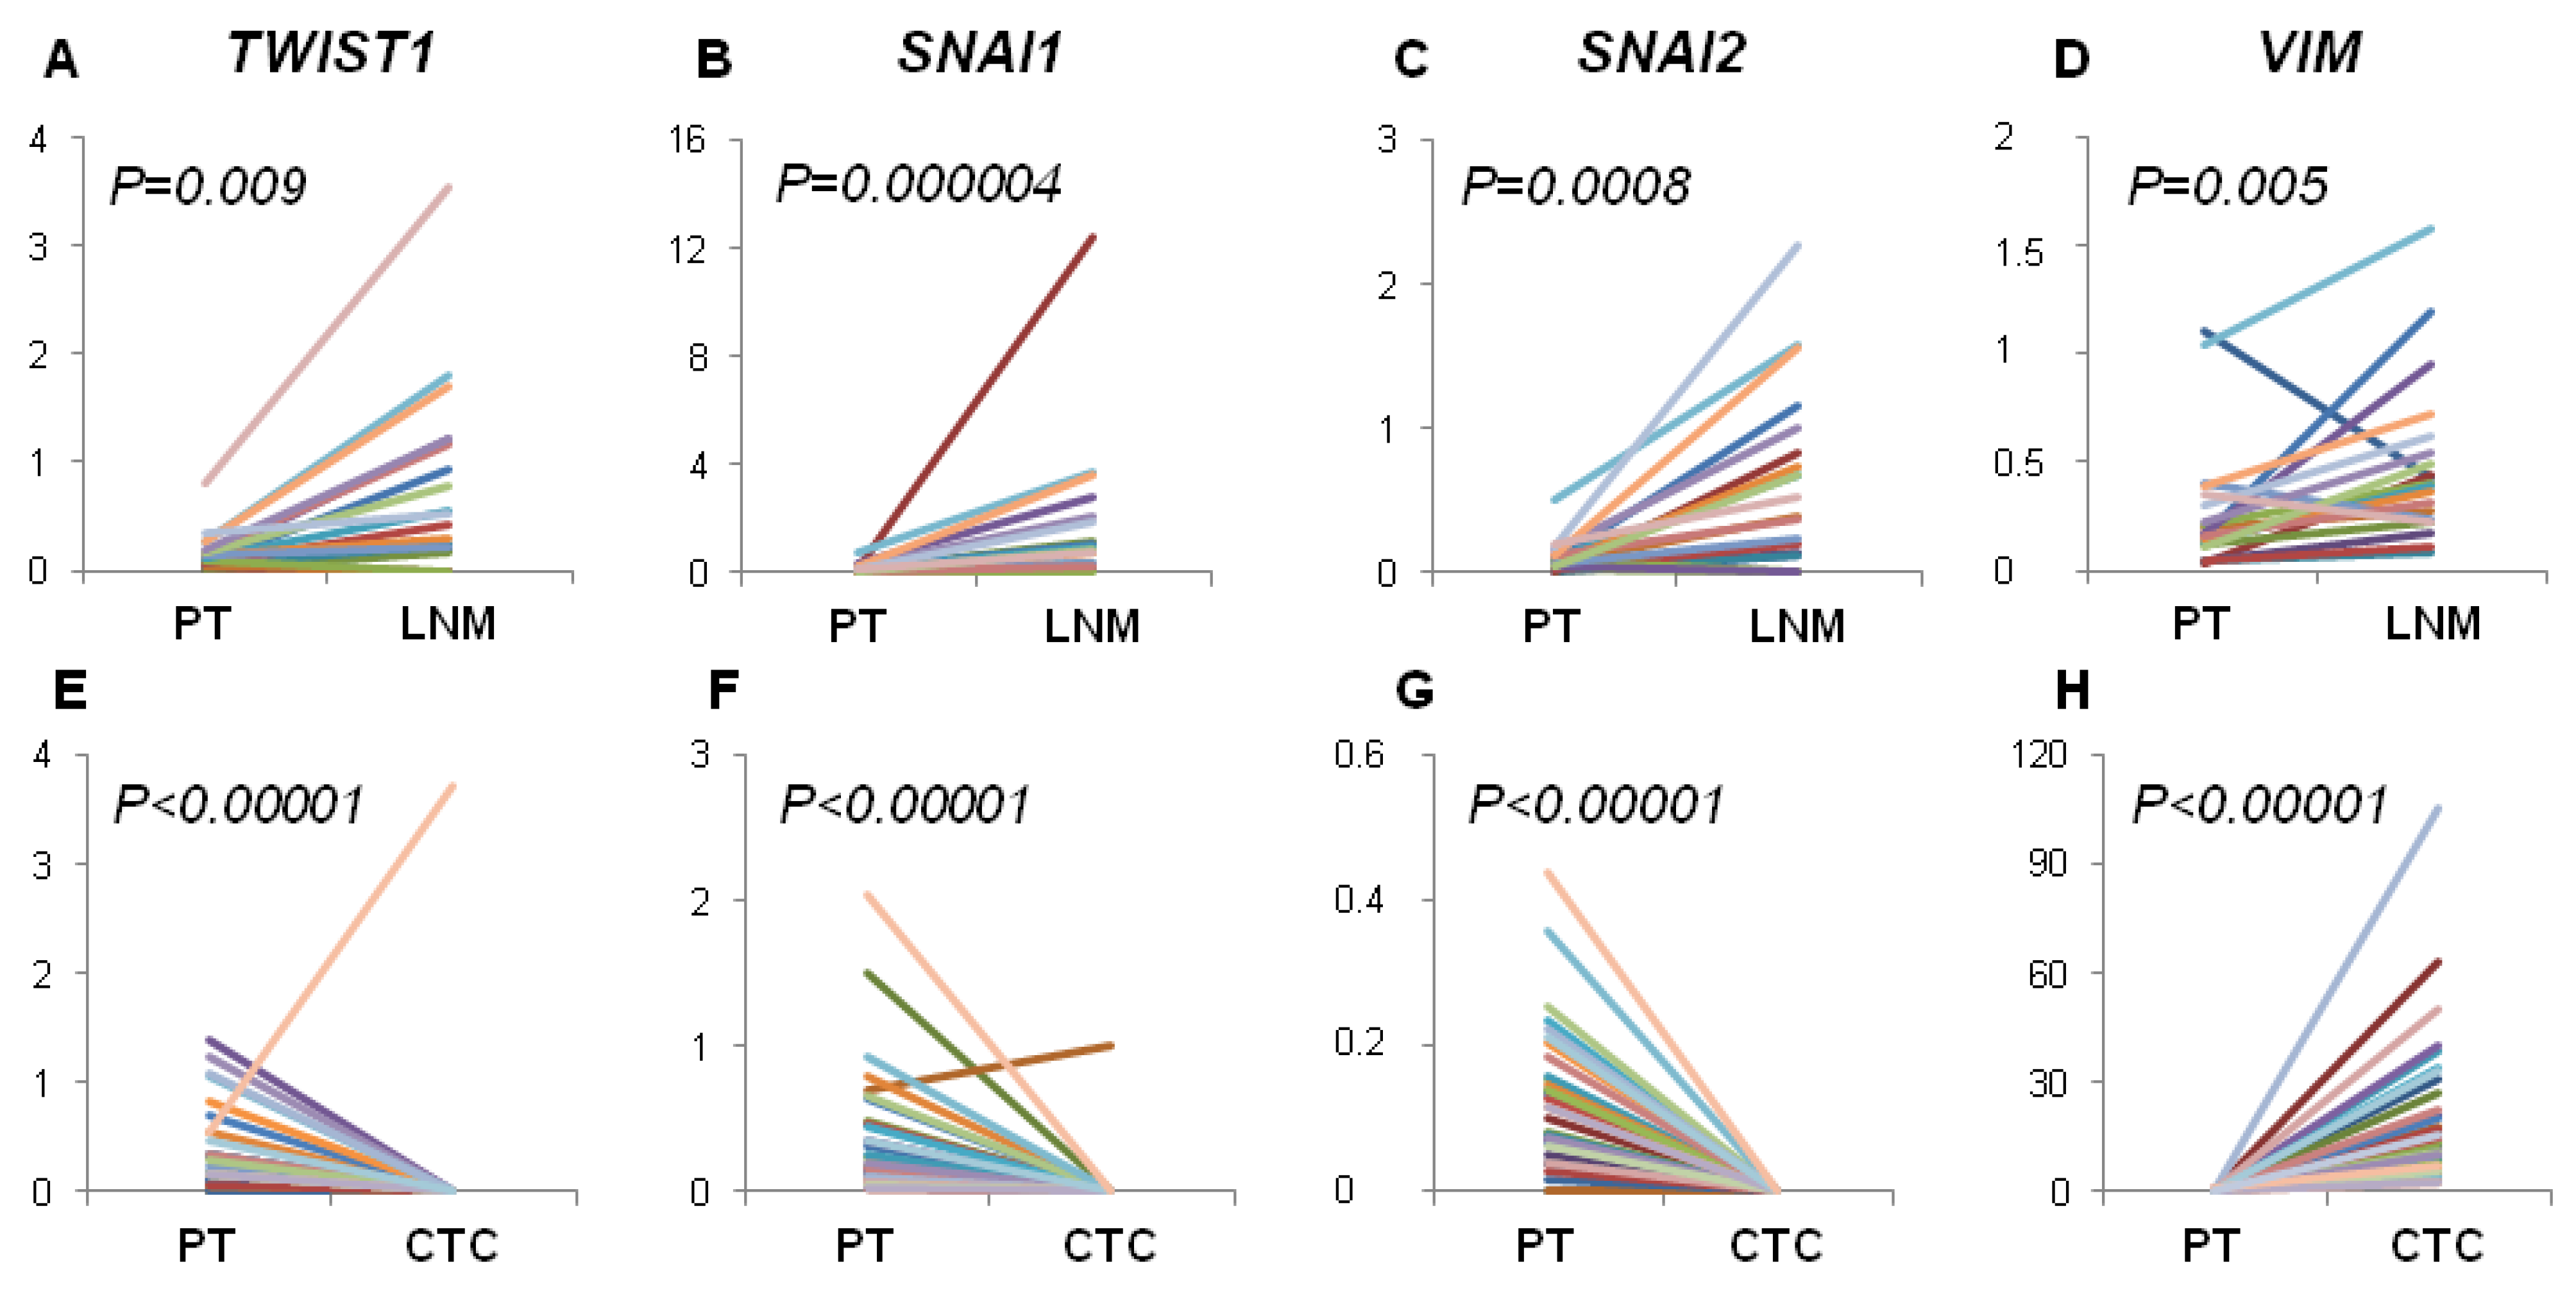
Contrary, we observed increased expression of EMT-related markers in LNM compared to PT and their frequent status conversion rate (15%–35%) from negative in PT to positive in LNM. This finding would indicate that EMT in lymph nodes is more effectively activated than in PT, thus lymph nodes might serve as tumor cells conditioning centers, at which selection of more malignant phenotypes takes place. Our previous results also showed that spread to lymph nodes is not related to EMT process in primary tumor but high expression of
TWIST1 and
SNAI1 in LNM, as well as negative-to-positive conversion of
SNAI1 confer worse prognosis, confirming the correlation of EMT with aggressive disease behavior [
24].
On the other hand,
TWIST1,
SNAI1 and
SNAI2 gene expression level was significantly decreased in CTCs-EBF compared to PT, while the level of
VIM was increased in CTCs-EBF. It should be kept in mind that EMT might not be the only process involved in tumor cells dissemination. Recent report by Marinari
et al. showed that epithelial cells can detach from the epithelial layer in a process of delamination [
47]. This could explain presence of epithelial cancer cells in blood. Although we did not observe a direct correlation between expression of EMT-related markers in PT and CTCs detection rate it should be noted that
TWIST1,
SNAI1,
SNAI2, being transcription factors, can be expressed at low levels what hampers their detection in rare CTCs and in isolated sections of PT due to time and space-limited activation of EMT process. This could also explain the occurrence of switch in gene expression status from positive in PT to negative in CTC-EBF in case of
TWIST1,
SNAI1 and
SNAI2. Nevertheless, elevated expression of
VIM, but not
TWIST1 and
SNAI1, was observed in TGF-β-treated, motile breast cancer cells in the study of Giampieri
et al. [
46].
Moreover, we noticed that the profile of analyzed gene expression was more conserved between PT and LNM than between PT and CTCs-EBF. This could reflect higher histological similarity of solid tumors and metastases versus solid tumors and CTCs present in blood. However, analysis of single CTCs would be required to confirm this finding.
PCR was demonstrated as the most sensitive technique for detecting CTCs [
48,
49]. Also, using negative selection with anti-CD45 antibodies that allows for epithelial markers-independent CTCs enrichment, is especially important if CTCs with mesenchymal phenotype are to be captured. As shown by Mego
et al. both AdnaTest
TM and CellSearch
® are unable to isolate cells that completed EMT [
35] as EpCam may be lost due to EMT [
50]. Therefore, we applied negative selection of CTCs and PCR based approach to reliably examine EMT-related markers.
In our study we have found epithelial CTCs-EBF defined as
CK19+ in 27% of cases, what is in agreement with previous PCR-based studies of early breast cancer patients exploiting CK19 as CTCs marker [
13,
51,
52,
53]. Analyzing expression of a panel of different cytokeratins could increase CTCs detection rate, however validity of this approach remains to be determined. As shown by Joosse
et al. [
54] breast cancer cells express various cytokeratins, which can be affected by their molecular subtype. Using cocktail of antibodies against cytokeratins they increased CTCs detection rate in metastatic breast cancer patients. Future research detecting CTCs using PCR based methods should consider using multiple cytokeratins detection in single- or multiplex assays. Multimarker-based detection of CTCs was reported to give higher sensitivity [
32,
48,
55,
56,
57]. Like others have reported [
48,
56], a multimarker approach based on addition of
MGB1 alone or together with
HER2 gave higher detection rates in our study (34 and 55%, respectively). Mesenchymal phenotype of CTCs-EBF defined as
VIM+ was observed in 22% of cases, defined as
VIM+ and/or
SNAIL+ and/or
TWIST1+ in 25%, what also remains concordant with reported wide range of detection rate of mesenchymal CTCs 15%–77% [
26,
28,
31,
35,
58].
The mesenchymal phenotype of CTCs was found to correlate with more aggressive tumor characteristics [
25,
26] and disease progression [
30]; it also occurred more frequently in metastatic compared to early breast cancer [
26,
30]. Analysis of mesenchymal markers in CTCs allowed more accurate prediction of worse prognosis than the expression of epithelial markers alone [
31]. In patients with primary breast cancer the overexpression of EMT-inducing transcription factors (
TWIST1,
SNAIL1,
SLUG,
ZEB1, and
FOXC2) was more frequently detected in those who received neoadjuvant therapies, than in those who did not, which suggests that neoadajuvant therapy is unable to eliminate CTCs undergoing EMT [
35].
In regard to lymph nodes involvement and CTCs detection rate, no clear association is apparent. Some studies show similar CTCs detection rate in LNM− and LNM+ breast cancer patients [
7,
32,
33,
35,
59], which would indicate similar seeding potential of the tumor, but not similar colonization potential of the disseminated cells. However, preliminary results from a large SUCCESS trial revealed a correlation between CTCs presence and lymph nodes involvement [
36] implying different seeding potential and possibly colonization potential. We have found significantly different CTCs detection rate (defined as
CK19+/MGB1+ or
CK19+/MGB1+/HER2+) between LNM− and LNM+ patients (20%
vs. 47%,
p = 0.009 and 41%
vs. 69%,
p = 0.008, respectively), what supports the notion that tumors from LNM+ patients have superior seeding potential in comparison to LNM− patients. We would not have drawn the same conclusion if
CK19 was the only CTCs marker in our study, as in that case there was no significant difference in CTCs marker detection rate between LNM− and LNM+ patients (20%
vs. 32%,
p = 0.17). Also the study of Pecot [
60] shows that cytokeratin expression should not be an ultimate marker for CTCs identification as cytokeratin-negative cancer cells can be found both in circulation and within primary tumors.
We are aware of limitations of our study, like the relatively small sample size and short follow-up period, which does not allow for assessing the impact of the analyzed markers on patients’ survival. However, it must be underlined that patients in this prospective study are still under observation and survival analysis will be done when data are mature. The method we applied—RT-qPCR—has many advantages, including high sensitivity and reproducibility, but it does not allow visualization of CTCs, and therefore, the detection of CTCs with EMT phenotype by this method is an indirect assessment. Obtained results are expressed as average gene expression obtained for the pool of cancer cells, so no heterogeneity within PT, LNM or individual CTCs can be analyzed. But the method has been carefully standardized [
24]. Moreover, the results we present are strictly correlative in nature and present the general dependence between variables. Hence, the molecular characteristics of CTCs-EBF associated with lymph node involvement is a hypothesis generating finding, in line with recent publications [
30]. Additional analyses aiming at understanding molecular mechanisms of the observed phenomenon are required to corroborate our hypothesis.
4. Experimental
4.1. Clinical Material
This study included 99 consecutive breast cancer patients treated at the Medical University Hospital in Gdansk between April 2011 and January 2013. Inclusion criteria were signed inform consent, primary operable breast cancer confirmed by histological examination and chemonaive status. Patients who received previous systemic treatment were not eligible for the study. Detailed characteristics of the studied group is presented in
Table 8. ER and PgR were scored according to classical Allred system with cut-point 3 for positive result. HER2 positivity was based on standard criteria: 3+ in immunohistochemistry or positive result in fluorescence in situ hybridization (FISH), as previously described [
61]. Median follow-up time was 1.6 years (0.2 to 2.6 years). To date, five deaths were observed, which is insufficient for performing survival analysis; however, follow-up data continue to be collected.
Table 8.
Patients’ characteristics.
Table 8.
Patients’ characteristics.
| Variable | Number of cases (%) |
|---|
| N | 99 | (100) |
| Age Median (range) | 62 (33–85.5) |
| T stage | | |
| T1 | 36 | (36) |
| T2 | 54 | (55) |
| T3 | 3 | (3) |
| T4 | 5 | (5) |
| Tx | 1 | (1) |
| N stage | | |
| N0 | 44 | (44) |
| N1-3 | 55 | (56) |
| Grade | | |
| G1 | 13 | (13) |
| G2 | 50 | (51) |
| G3 | 35 | (35) |
| Missing data | 1 | (1) |
| Histological type | | |
| Ductal | 75 | (76) |
| Lobular | 12 | (12) |
| Other | 11 | (11) |
| Missing data | 1 | (1) |
| HER2 status * | | |
| Negative | 71 | (72) |
| Positive | 26 | (26) |
| Missing data | 2 | (2) |
| HR status | | |
| Negative | 19 | (19) |
| ER and/or PgR positive | 80 | (81) |
| Molecular subtype | | |
| Luminal A | 33 | (33) |
| Luminal B (HER2-) | 24 | (24) |
| Luminal B (HER2+) | 20 | (20) |
| HER2+ | 6 | (6) |
| Triple negative | 13 | (13) |
| Missing data | 3 | (3) |
Tumors were divided into five surrogate intrinsic subtypes [
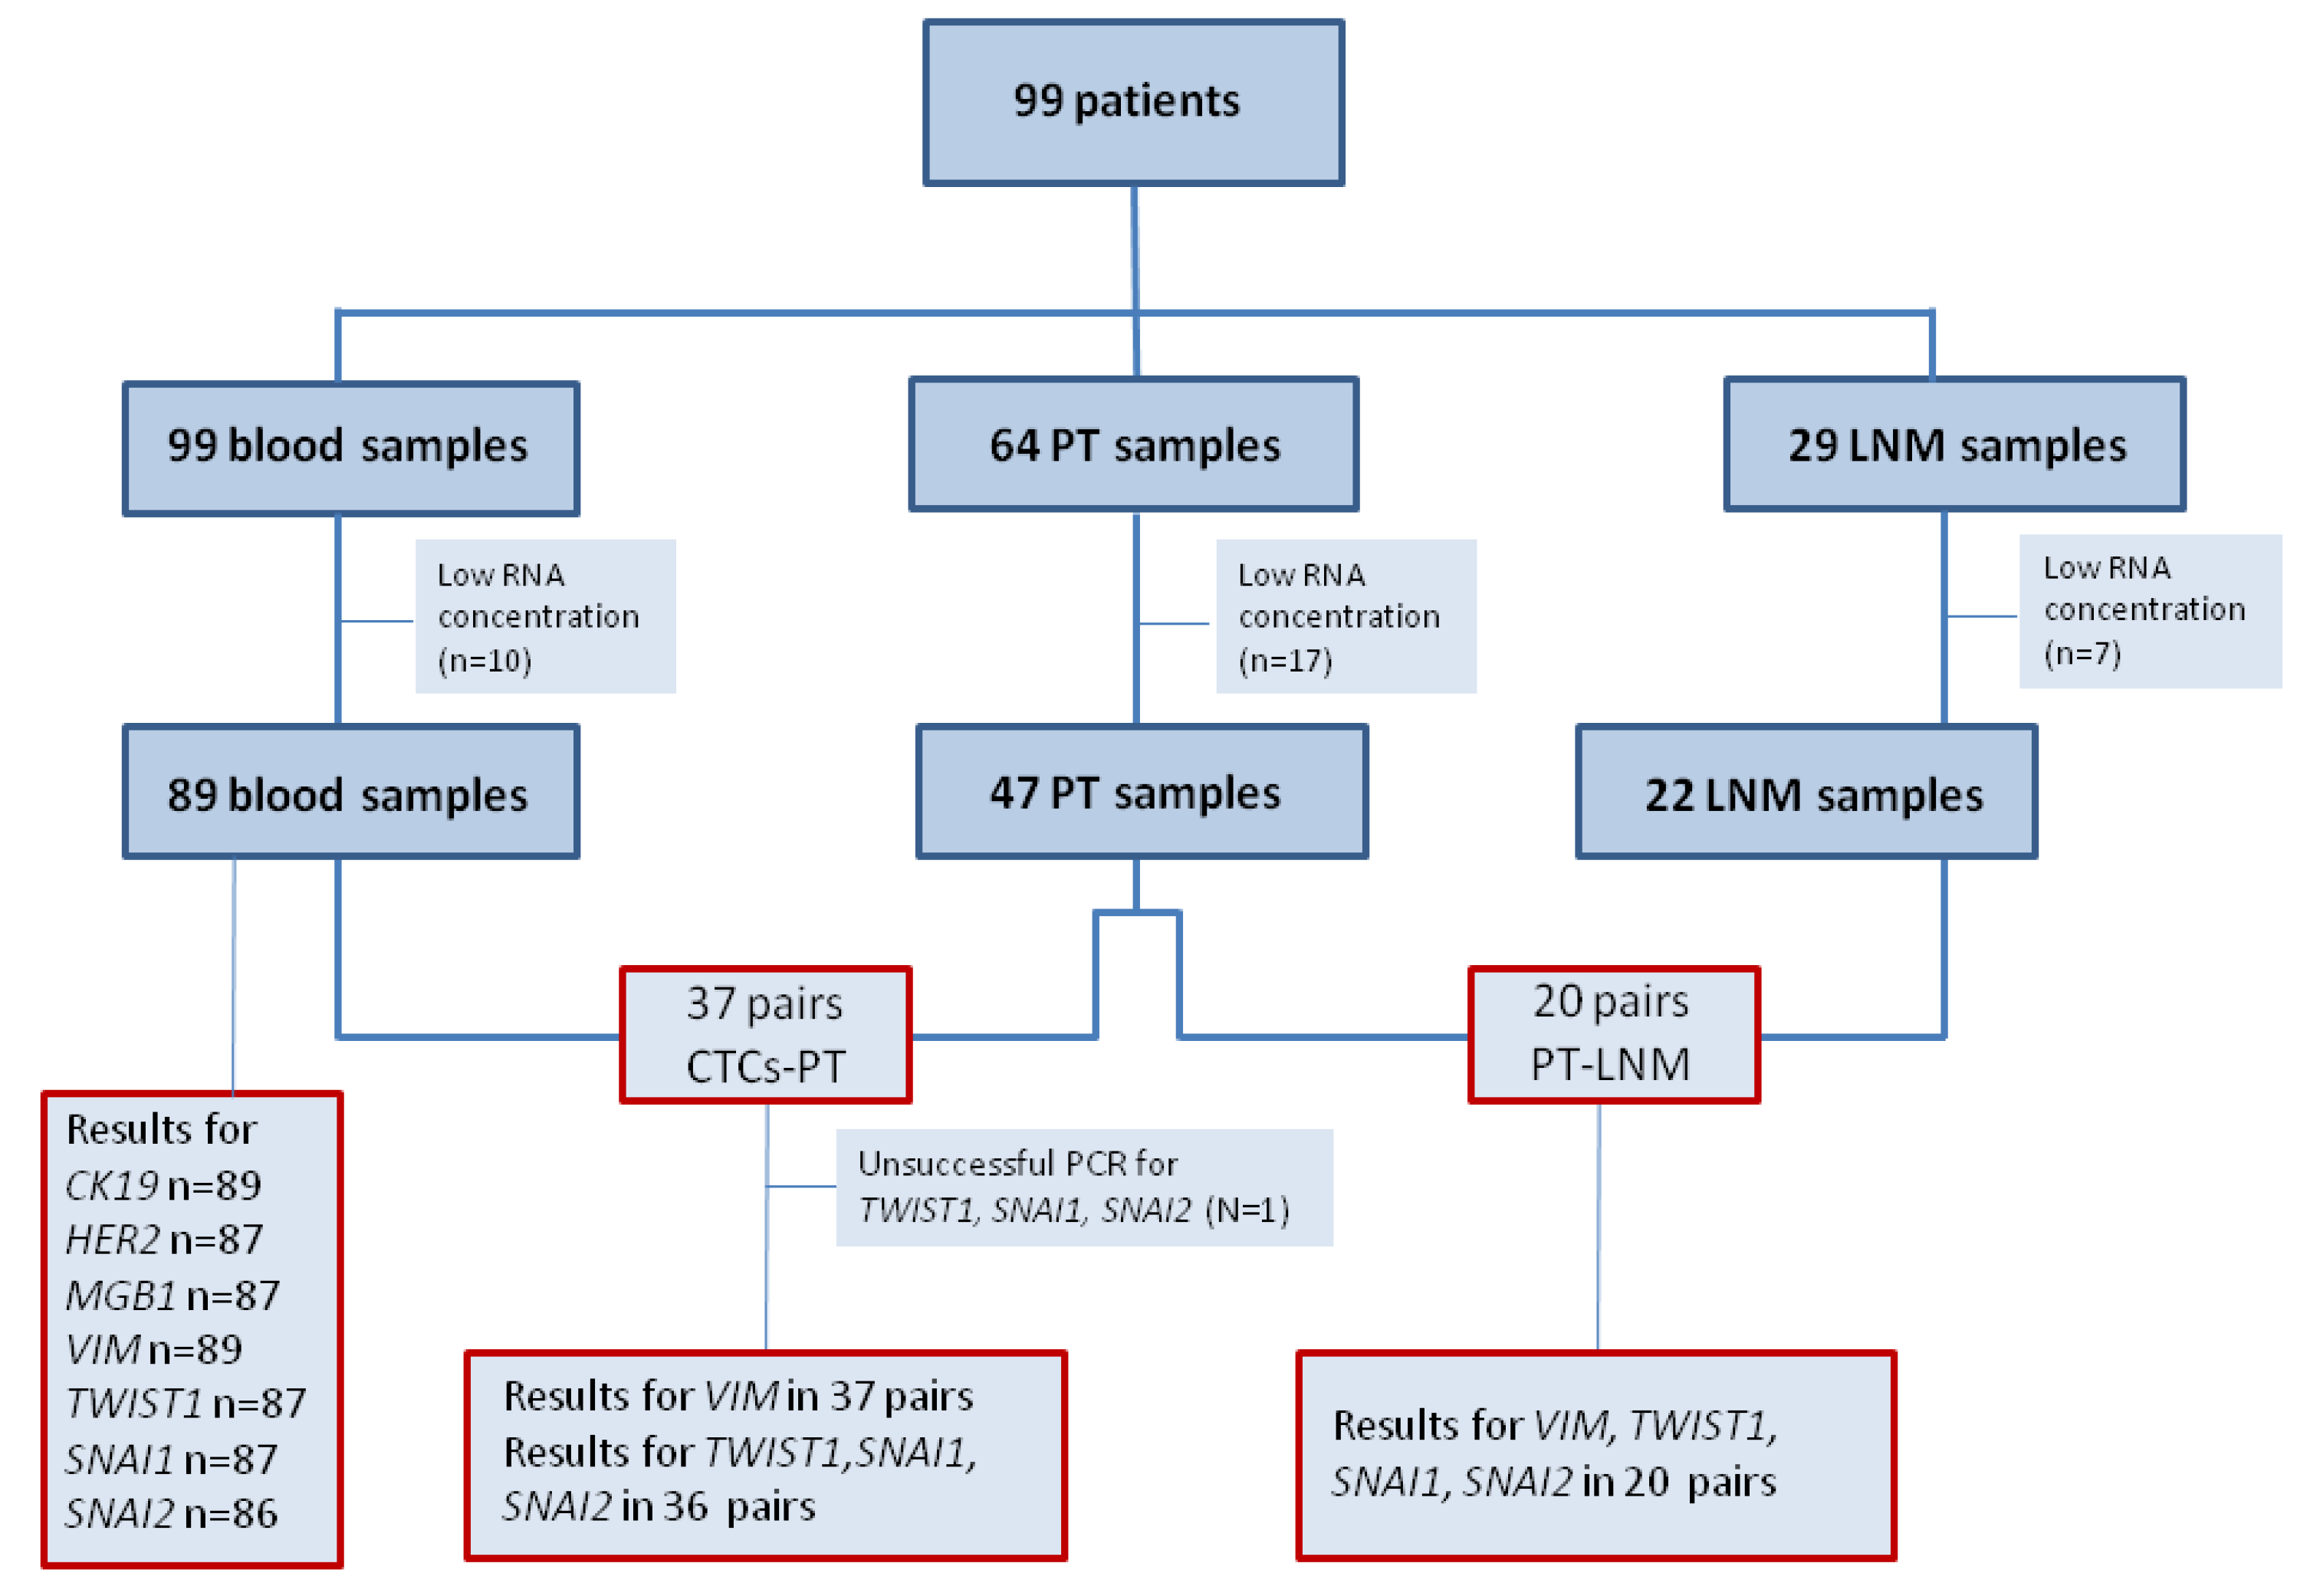
62] based on the expression of ER, PgR, HER2, tumor grade and/or Ki-67: (1) Luminal A—ER+ and/or PgR+, HER2−, Ki-67 below 14% or G1/2; (2) luminal B (HER2-negative)—ER+ and/or PgR+, HER2−, Ki-67 above 14% or G3; (3) luminal B (HER2-positive)—ER+ and/or PgR+, HER2+, any Ki-67 or any G; (4) HER2+—ER− and PgR−, HER2+; (5) Triple negative (TNBC)—ER−, PgR−, HER2−. From 99 breast cancer patients peripheral blood samples (N = 99), matched PT (N = 47) and LNM (N = 22) were collected (
Figure 2).
Figure 2.
Flow chart of analyzed samples.
Figure 2.
Flow chart of analyzed samples.
Abbreviations: PT—primary tumor, LNM—lymph node metastasis, n—number of cases.
Peripheral blood samples were drawn (5–10 mL) to the EDTA-coated tubes before tumor excision and systemic therapy initiation. To minimize possibility of keratinocytes contamination during skin punctuation, first few milliliters of blood were discarded. Samples were stored at 4 °C (for no longer than 24 h) until they were subjected to CTC-enrichment. Blood samples from 12 healthy women were similarly drawn and processed.
PT and LNM removed during surgery were examined by a pathologist and subjected to formalin fixation (4% neutral-buffered formalin for up to 24 h) and paraffin embedding. Samples sections were stained with hematoxin-eosin to visualize primary tumors/lymph nodes metastases morphology, what allowed for selection of representative fragments containing invasive tumor component. Ten micrometer sections were cut and stored at 4 °C until RNA isolation. Additionally, sections of non-cancerous breast tissue and non-involved lymph nodes were collected. The study was conducted in accordance with the Declaration of Helsinki and approved by the local Ethical Committee of the Medical University of Gdansk.
4.3. Reverse Transcription
RNA (up to 10 µL) isolated from both CTC-enriched fractions and PT and LNM samples was reverse transcribed with Transcriptor cDNA First Strand Synthesis Kit (Roche, Basel, Switzerland) using random hexamers as primers. To monitor presence of contaminants that might influence both reverse transcription and qPCR 1 µL of external RNA molecule (RNA Spike from Solaris RNA Spike Control Kit, Thermo Scientific, Rockford, IL, USA) was added to each patient’s sample and control sample (containing water instead of isolated RNA thus carrying no inhibitors). cDNA samples were stored at −20 °C until gene expression analysis. Exogenous molecule was detected in qPCR, cycle thresholds (Cq) of control and patients’ samples were compared to assess the occurrence of inhibition (detection of RNA Spike molecule at later cycles indicated inhibition).
4.4. Real-Time PCR (qPCR)
Gene expression analysis was performed using pre-design, commercially available assays containing primers and probes (TaqMan Gene Expression Assay, Applied Biosystems, Foster City, CA, USA) for detection of TWIST1 (Hs00361186_m1, UniGene Hs.644998), SNAI1 (Hs00195591_m1, UniGene Hs.48029), SNAI2 (Hs00950344_m1, UniGene Hs.360174), CK19 (KRT19, Hs01051611_gH; UniGene Hs.654568), HER2 (Hs99999005_mH; UniGene Hs.446352), MGB1 (SCGB2A2; Hs00935948_m1; UniGene Hs.46452) and reference genes GAPDH (Hs99999905_m1, UniGene Hs.544577) and YWHAZ (Hs03044281_g1; UniGene Hs.492407). Reference genes were chosen based on their expression stability (M parameter) in 10 samples of CTCs-EBF, 10 PT and 10 LNM assessed using geNorm applet (M parameter for GAPDH—0.395, 0.641 and 0.485 in CTCs-EBF, PT and LNM, respectively; M parameter for YWHAZ—0.500, 0.641 and 0.374 in CTCs-EBF, PT and LNM, respectively). TaqMan® Universal PCR Master Mix (Applied Biosystems) was used, 4 µL of diluted cDNA was added per reaction, giving a total reaction volume of 20 µL. Reactions were performed in duplicate on 96-well plates in CFX96 thermal cycler (Bio-Rad, Hercules, CA, USA). Inter-run calibrator (cDNA obtained from healthy breast tissue) and no template controls were included in every plate. Moreover, in case of YWHAZ and CK19 (the only assays that could detect also genomic DNA) genomic DNA contamination was monitor adding the same amount of untranscribed RNA to a PCR reaction. The samples was considered genomic DNA-free if the Cq difference between the sample containing RNA and cDNA was equal to or higher than 5.
Gene expression was calculated with a qBasePLUS software version 2.1 using a modified ∆∆Ct approach that corrects for a run-to-run variation. Gene expression levels were scaled to control samples—in the case of CTC-enriched samples the control samples were the samples with minimal expression level of each gene; in case of PT—healthy FFPE breast sample was chosen as a control, and for LNM non-involved FFPE lymph node. CTC-enriched blood samples were considered positive for expression of a given gene when the expression of that gene was higher than the highest expression in healthy control samples. For PT and LNM median value of gene expression was a cut-off value for positivity. For multimarker method, CTCs positivity was defined as positivity for at least one of the markers (CK19, MGB1 or HER2).
4.5. Statistical Analysis
The patients’ characteristics were summarized using the median (range) for continuous variables and frequency (percentage) for categorical variables. Categorical variables were compared by Fisher’s exact test, and continuous variables were compared by the Spearman’s rank order test. Mann-Whitney test was used to examine correlations between quantitative values (gene expression level, age) and qualitative parameters (T stage, grade, LN status). Significance was defined as
p < 0.05. STATISTICA software [
63] was used for statistical analyses.
Concordance between PT and LNM or CTCs-EBF was measured by estimating Cohen’s kappa coefficient (κ) with Medcalc software [
64]. The level of agreement based on κ values was assessed using the Landis and Koch criteria: 0.00–0.20, slight agreement; 0.21–0.40, fair agreement; 0.41−0.60, moderate agreement; 0.61–0.80, substantial agreement; and 0.81–1.00, almost perfect agreement [
65].

 ,
, 
