Article

Research on High-Precision, Low Cost Piezoresistive MEMS-Array Pressure Transmitters Based on Genetic Wavelet Neural Networks for Meteorological Measurements

1
Jiangsu Key Laboratory of Meteorological Observation and information Processing, Nanjing University of Information Science and Technology, Nanjing 210044, China
2
Jiangsu Collaborative Innovation Center on Atmospheric Environment and Equipment Technology, Nanjing University of Information Science and Technology, Nanjing 210044, China
3
School of Electronic and Information Engineering, Nanjing University of Information Science and Technology, Nanjing 210044, China
4
School of Physics and Optoelectronic Engineering, Nanjing University of Information Science and Technology, Nanjing 210044, China
*
Authors to whom correspondence should be addressed.
These authors contributed equally to this work.
Micromachines 2015, 6(5), 554-573; https://doi.org/10.3390/mi6050554
Submission received: 4 February 2015 / Revised: 21 April 2015 / Accepted: 29 April 2015 / Published: 6 May 2015

Abstract

:
This paper provides a novel and effective compensation method by improving the hardware design and software algorithm to achieve optimization of piezoresistive pressure sensors and corresponding measurement systems in order to measure pressure more accurately and stably, as well as to meet the application requirements of the meteorological industry. Specifically, GE NovaSensor MEMS piezoresistive pressure sensors within a thousandth of accuracy are selected to constitute an array. In the versatile compensation method, the hardware utilizes the array of MEMS pressure sensors to reduce random error caused by sensor creep, and the software adopts the data fusion technique based on the wavelet neural network (WNN) which is improved by genetic algorithm (GA) to analyze the data of sensors for the sake of obtaining accurate and complete information over the wide temperature and pressure ranges. The GA-WNN model is implemented in hardware by using the 32-bit STMicroelectronics (STM32) microcontroller combined with an embedded real-time operating system µC/OS-II to make the output of the array of MEMS sensors be a direct digital readout. The results of calibration and test experiments clearly show that the GA-WNN technique can be effectively applied to minimize the sensor errors due to the temperature drift, the hysteresis effect and the long-term drift because of aging and environmental changes. The maximum error of the low cost piezoresistive MEMS-array pressure transmitter proposed by us is within 0.04% of its full-scale value, and it can satisfy the meteorological pressure measurement.

1. Introduction

Meteorological disasters are the natural disasters that seriously threaten national security and people’s lives. According to incomplete statistics, several billion U.S. dollars are lost annually because of meteorological disasters. Obviously, the meteorological service level should be improved to achieve disaster preparedness and reduction of damage. Numerical weather prediction and climate analysis can provide important information for early warning of natural disasters [1,2], which strongly relies on the accurate measurement of meteorological elements [3] such as pressure, temperature, humidity, wind speed, direction, etc. Since meteorological pressure measurement is one of the important tasks, a lot of high-precision pressure sensors should be applied for measuring atmospheric pressure in vast regions, which is especially helpful in weather forecasting. Recently, various high-precision pressure sensors have been produced with the development of technology. For some typical examples, the GE (General Electric) company released silicon resonant pressure sensors such as series of resonant pressure transducers (RPT) whose parameters are as follows: measuring range: 500–1150 hPa, precision: ±0.01% FS, stability: 100 ppm/year. These sensors not only can be used for measuring the atmospheric pressure, but also as pressure calibration instruments. Vaisala Company has also launched a digital barometer, PTB330 (Vaisala Company, Helsinki, Finland), which is based on the silicon capacitive pressure sensor. It also has high precision and stability (±0.01% FS). Honeywell Company successfully developed a meteorological industry-specific precision pressure sensor, PPT0016AWN2VA-S255 (Honeywell Company, Morristown, NJ, USA), whose overall accuracy including the temperature effect is ±0.3 hPa, and long-term stability is less than 0.3 hPa/year. At present, these high-precision MEMS pressure sensors mentioned above are fully compliant with the requirements of the meteorological industry and have been applied in the meteorological ground stations and sounding instruments. However, they are expensive and not suitable for large-scale deployment and use.
It is worth noting that micromachining manufacturing technology has developed greatly in recent years, and relatively high-precision silicon piezoresistive pressure sensors have been researched and developed [4,5], such as NPC-1210-015A-3L (MEMS pressure sensor from GE NovaSensor, Fremont, CA, USA) which has one-thousandth accuracy and stability at room temperature. This type of sensor has several advantages such as high sensitivity, high frequency response, low cost and mass production. However, it also exhibits non-idealities like offset, temperature drift, nonlinearity, hysteresis and aging in addition to the drift due to environmental effects, and, thus, the piezoresistive pressure sensor [4,5] can not be directly applied to meteorological measurements. For the sake of solving the above problems, a compensation technique based on the software/hardware co-design is a desirable option from the perspective of large-scale usage, where a data fusion compensating algorithm is developed by using software, and it is finally hardware implemented by utilizing a microcontroller or field programming gate array (FPGA) chip [6,7,8].
As far as we know, owing to strong generalization capability and self-adaptability and good intelligence of the artificial neural network (ANN), these piezoresistive pressure sensors can be trained to learn any function provided that sufficient sample information is given during the training process coupled with judiciously chosen neural models. This self-learning ability of the ANN can eliminate the use of complex and arcane mathematical analysis [9]. Therefore, the ANN is now a well-known software compensating technique for modeling the sensor behavior to approximate functional relationship between input and output of a sensor [6,7,8,9,10,11,12,13]. Specifically, the ANN has been widely used to compensate the temperature drift errors [9,10], the nonlinear error [6,11,12] and hysteresis errors [8,11,13] of MEMS humidity, temperature and pressure sensors. The main advantage of the ANN algorithm for error compensation is that one need not have full knowledge of the physics of the sensor, and an iterative procedure is applied over the measured data in the interest of obtaining an accurate expression utilized for error compensation [8]. To the best of our knowledge, the neural network optimized by a genetic algorithm possesses better accuracy, stability and versatility compared with the traditional ANN [14,15]. It may be more suitable for solving the problem about nonlinear fitting, hysteresis effect and temperature compensation of the pressure sensor.
In this paper, in order to improve the measuring precision of the piezoresistive pressure sensor, we have proposed a versatile compensation method based on the array average measurement of MEMS pressure sensors and the data fusion technique using the wavelet neural network optimized by the genetic algorithm (GA-WNN) to mainly solve the nonlinear error, temperature drift and hysteresis error as well as the random error. Specifically, the array consists of four MEMS piezoresistive pressure sensors within a thousandth of accuracy. The proposed GA-WNN incorporates intelligence into the pressure sensor system by using the 32-bit advanced RISC machines microcontroller from STMicroelectronics (Geneva, Switzerland, ARM-STM32 microcontroller) combined with an embedded real time operating system µC/OS-II. The calibration and test experiments are conducted to optimize and evaluate the performance of the low cost MEMS-array pressure transmitter (digital pressure measurement system) proposed by this paper, and the experimental results indicate that it can obtain high precision and good long-term stability and fulfill the basic needs of meteorological pressure measurement.

2. Hardware Design, Software Compensation Algorithm and Experiment Setup

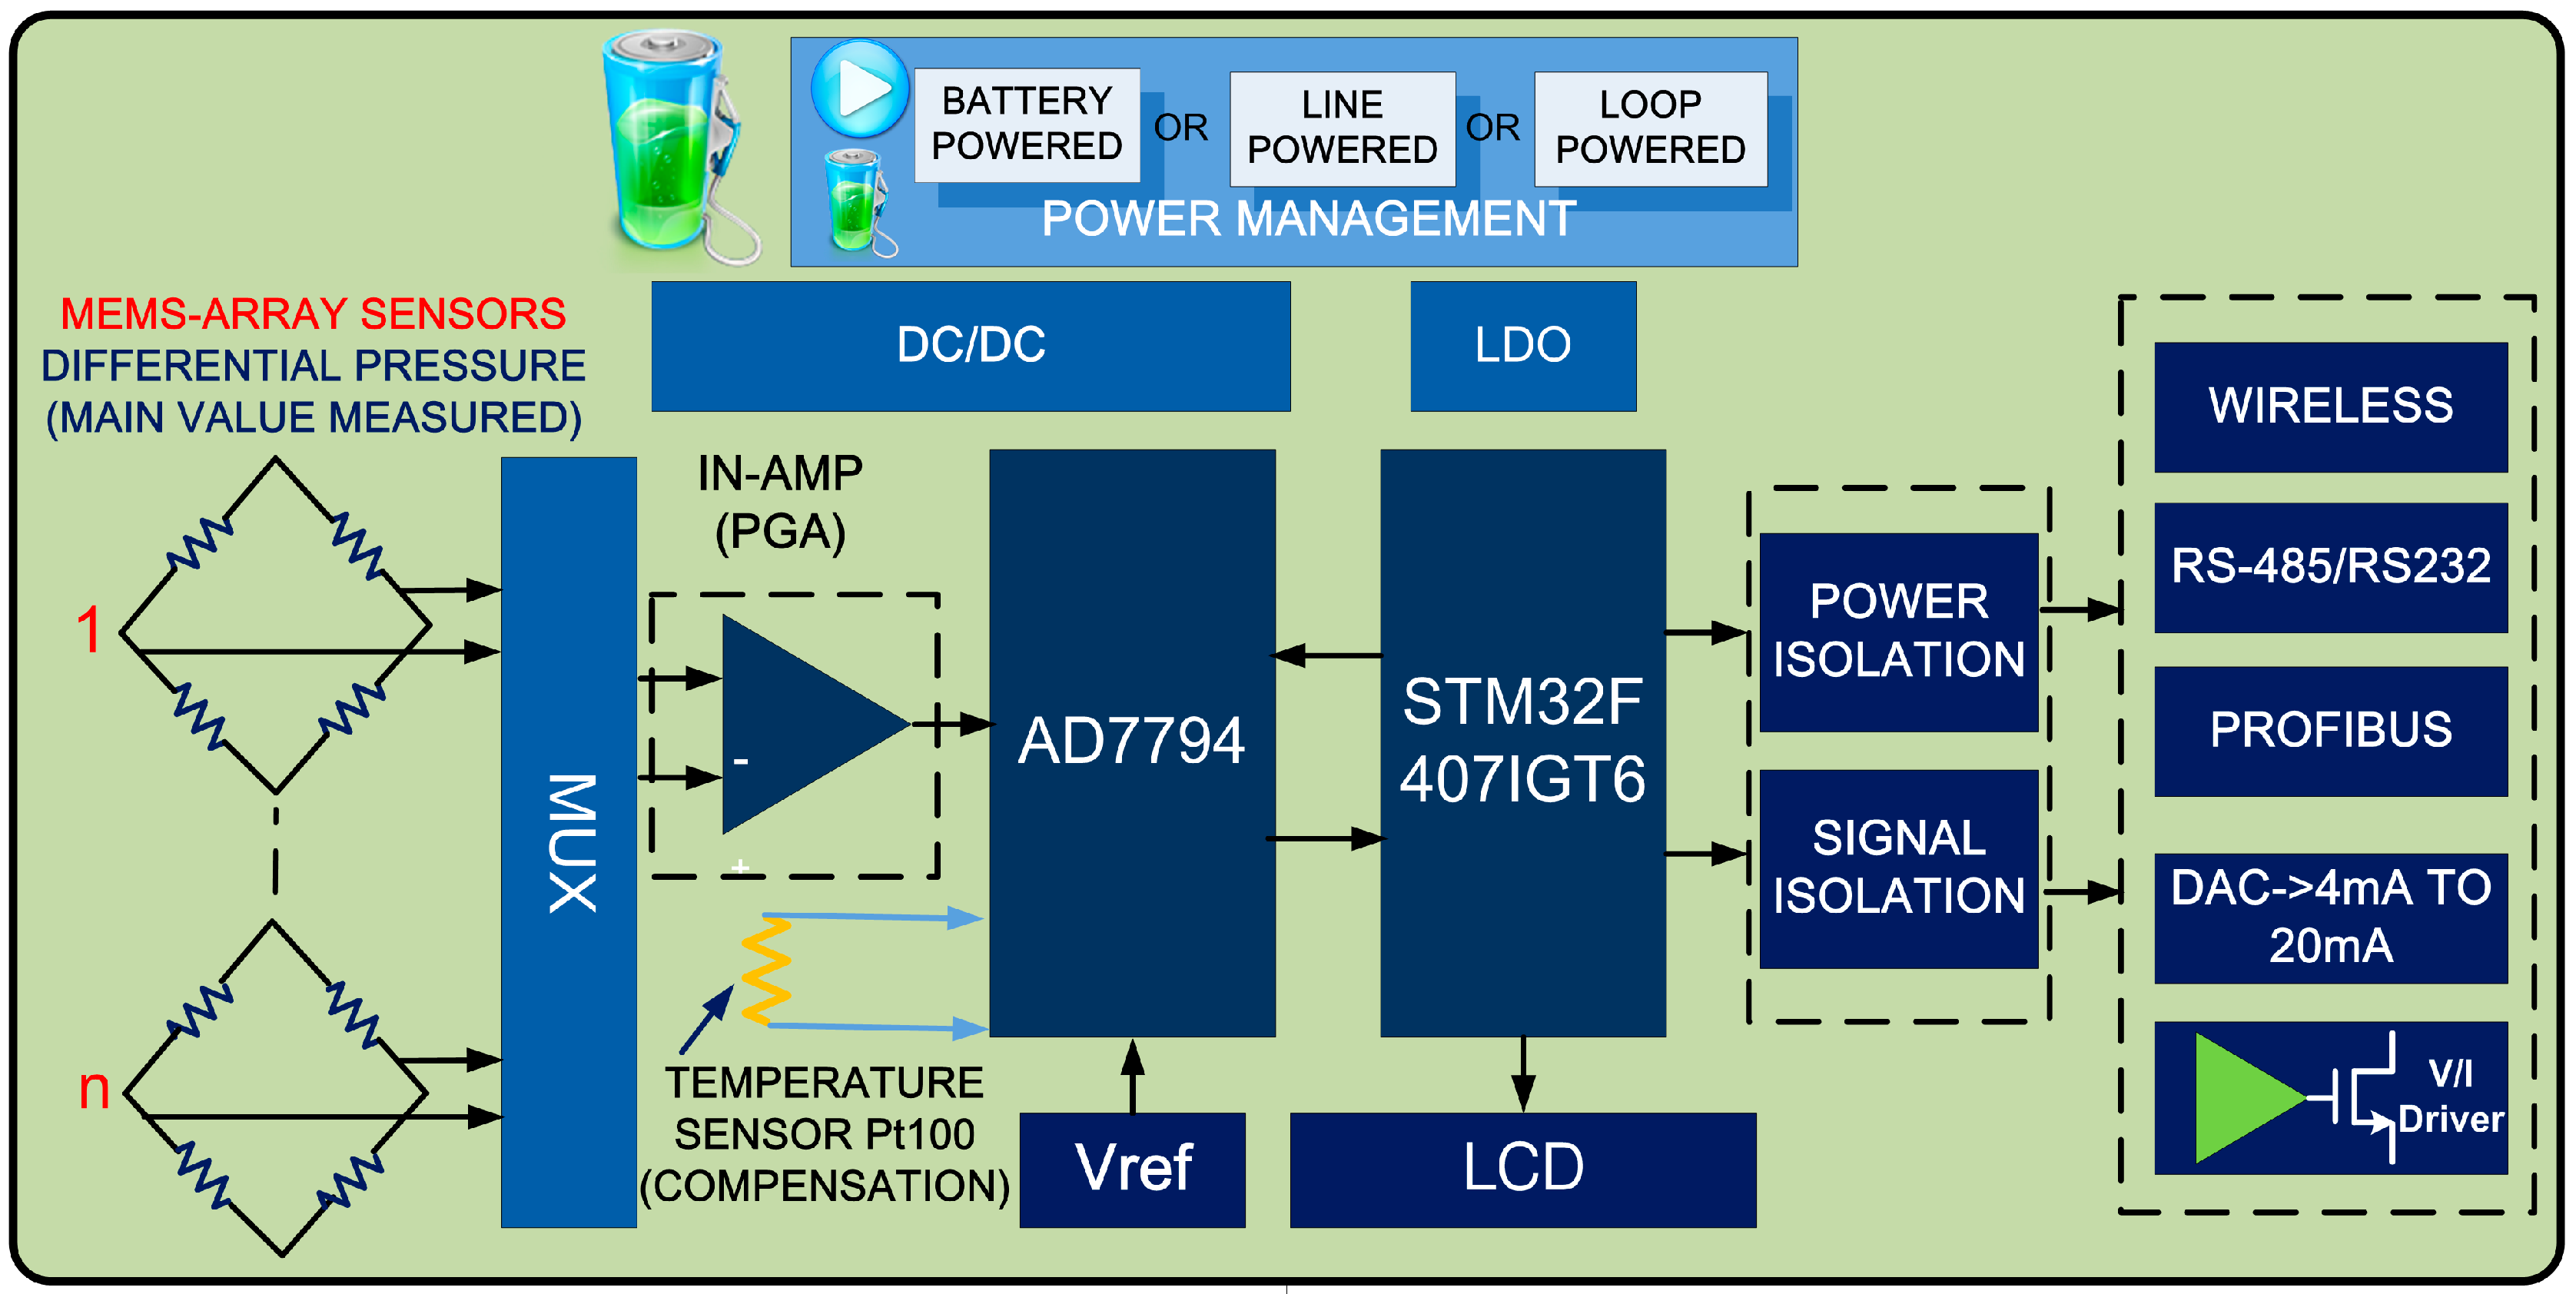
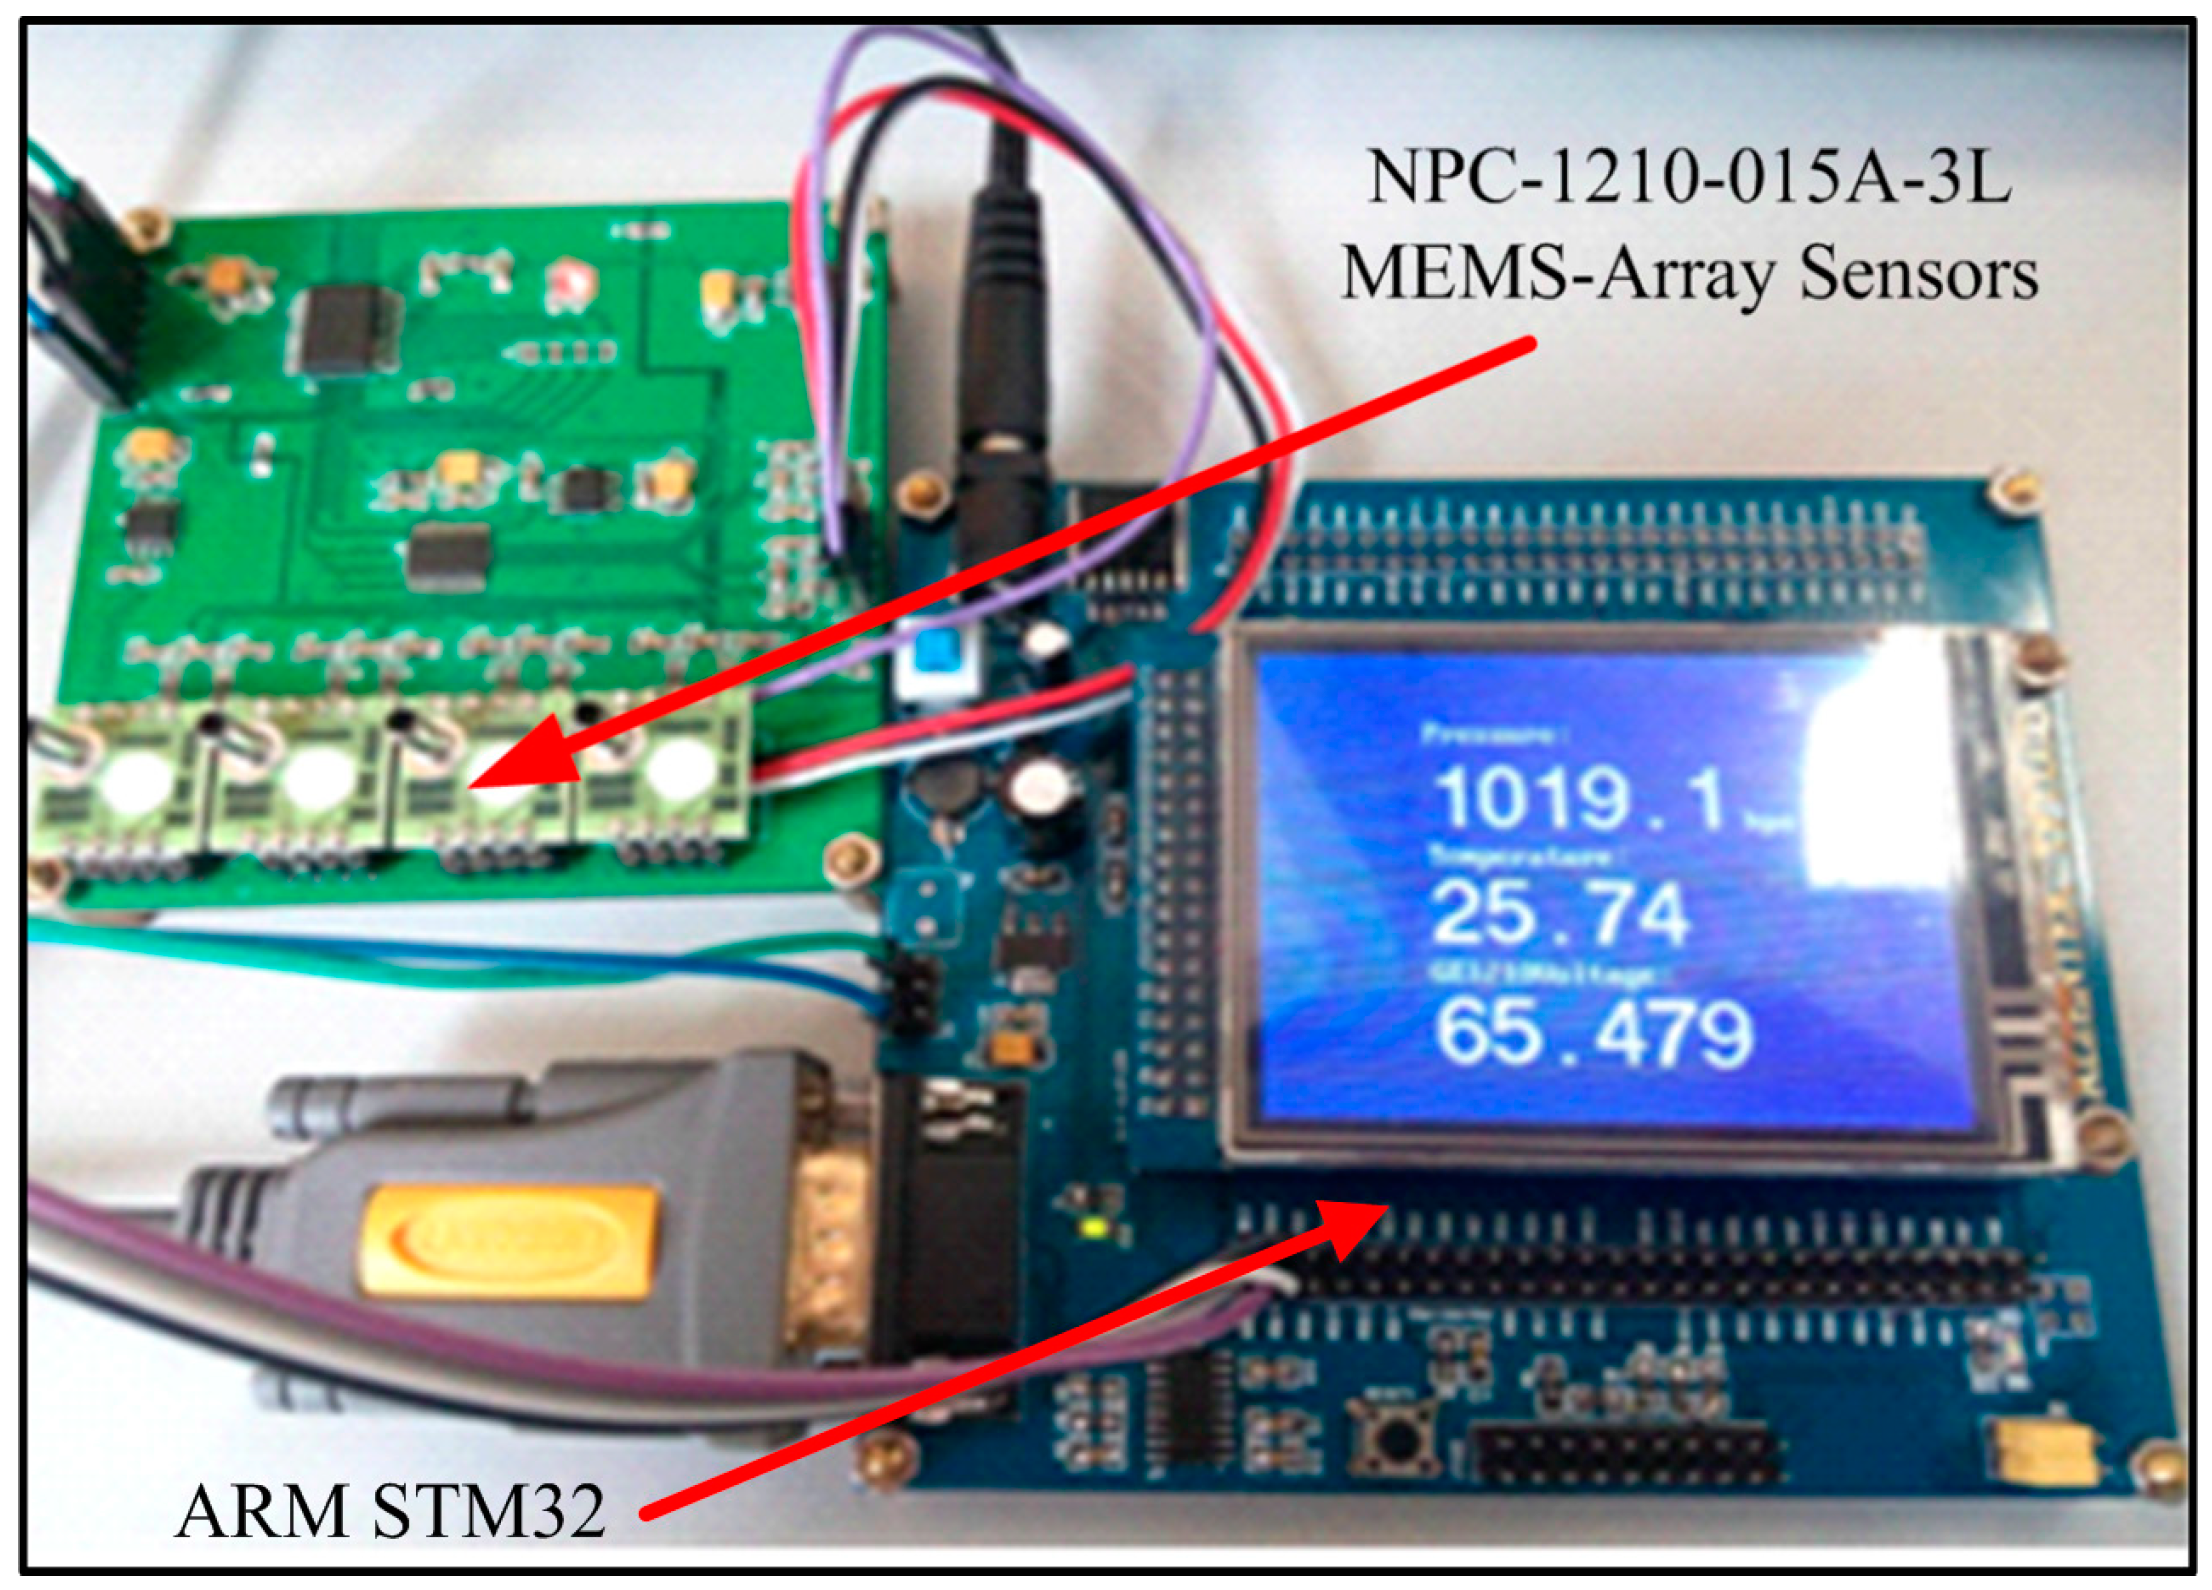
2.1. Optimized Hardware Design for the Piezoresistive MEMS-Array Pressure Transmitter

Figure 1 provides the systematic diagram for the hardware implementation of the complete scheme. In the proposed digital MEMS-array pressure transmitter, the pressure-sensitive core element consists of four NPC-1210-015A-3L (GE NovaSensor, Fremont, CA, USA) MEMS pressure sensors, which are supplied with the constant operating voltage from the constant voltage source circuit. In general, the accuracy of this type of piezoresistive pressure sensor is about ±0.1% at room temperature. It is noted that if n pressure sensors are used to measure the pressure at the same time, the overall average error becomes 1 / n of the original measurement error according to the statistical averaging theory. Therefore, when one applies several sensors to constitute an array measurement to give the average output voltage of MEMS-array pressure sensors, it not only can reduce human errors and factory errors but also can weaken the intrinsic random error of the sensor due to creep. In other word, this kind of hardware design by making an array measurement can improve the measurement accuracy to some extent. Our previous study has also shown that this array measurement method is helpful to ameliorate the accuracy and stability of the pressure measuring system [15]. Taking into account that these piezoresistive sensors are cheap, it is feasible to measure atmospheric pressure by using a sensor array. In this MEMS-array pressure transmitter, the temperature measurement is by means of Pt100 (Heraeus Holding GmbH, Hanau, Germany) resistance thermometer. This kind of temperature-sensitive element can provide on-site accurate temperature data for temperature drift compensation based on the GA-WNN.
Figure 1. System block diagram for the digital MEMS-array pressure transmitter and the hardware is implemented by using the sensor array and ARM-STM32.
Micromachines 06 00554 g001
As shown in Figure 1, the hardware system uses the analog to digital converter (ADC) as the signal conditioning and conversion module and the microprocessor as the digital signal-processing module. On the one hand, since the maximum output of the selected silicon piezoresistive pressure sensor is about 80 mV and the accuracy of meteorological measurements is required to be about 0.3 hPa, this means that the hardware circuit must be able to measure microvolt-level voltage and stabilize at the 10 mV level. Therefore, the differential output voltages of the sensors are read by the 24-bit and low noise AD7794 (Analog Devices, Inc., Norwood, MA, USA)sigma-delta ADC, which makes use of several different internal low-pass filters and modifies the filter coefficients based on the actual sample rate. On the other hand, in order to make the complete embedded system cost effective and easy to display, the GA-WNN compensation algorithm is implemented by utilizing a high-speed microprocessor. Because the algorithm module is complex, it must use an ultra-fast digital microprocessor, and STM32F407IGT6 (STMicroelectronics) are adopted in our work. In addition, it is necessary to avoid the coupling of digital noise into the high-precision analog section by using the excellent isolation of digital and analog circuits. What’s more, analog and digital grounds are also isolated from each other with a 0 ohm resistance as the single point of common ground. The photograph of the designed digital MEMS-array pressure transmitter is presented in Figure 2. This pressure transmitter has several advantages such as high precision, low cost and mass production. As we can see, these measured and corrected temperature and pressure signals are finally displayed on an LCD screen or transmitted to the host computer by using the serial port.
Figure 2. Photograph of the designed digital MEMS-array pressure transmitter.
Micromachines 06 00554 g002

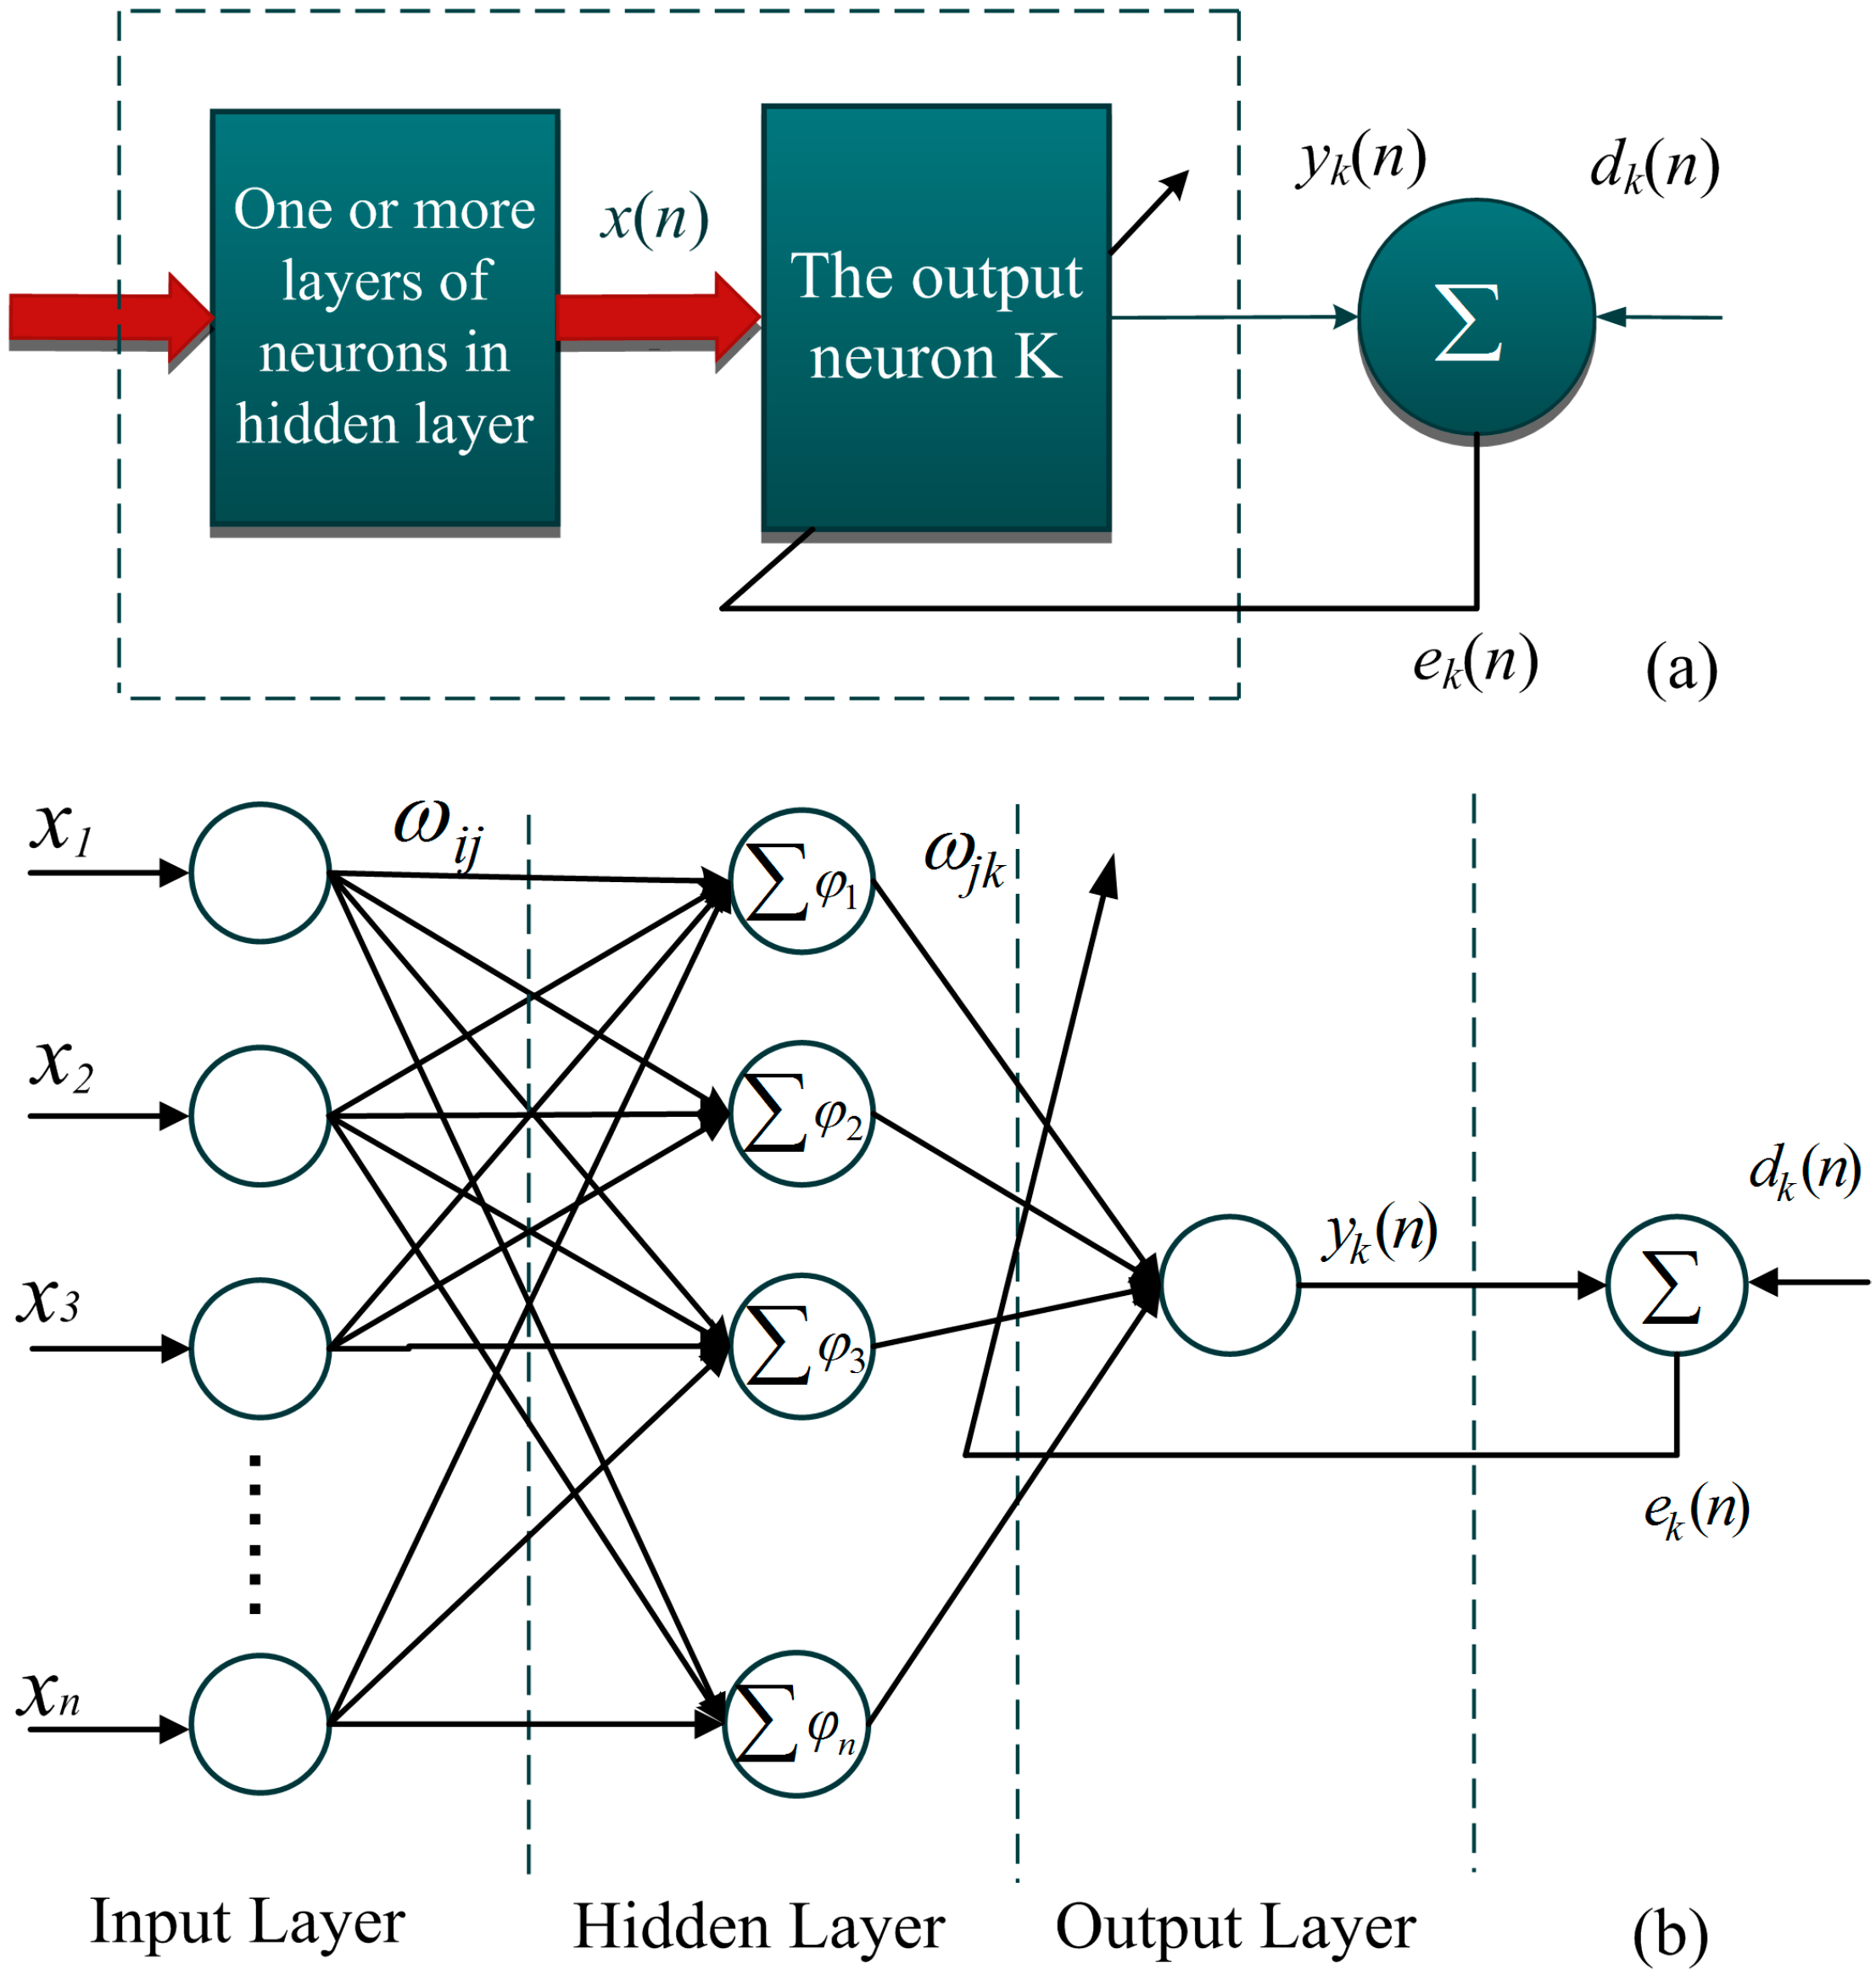
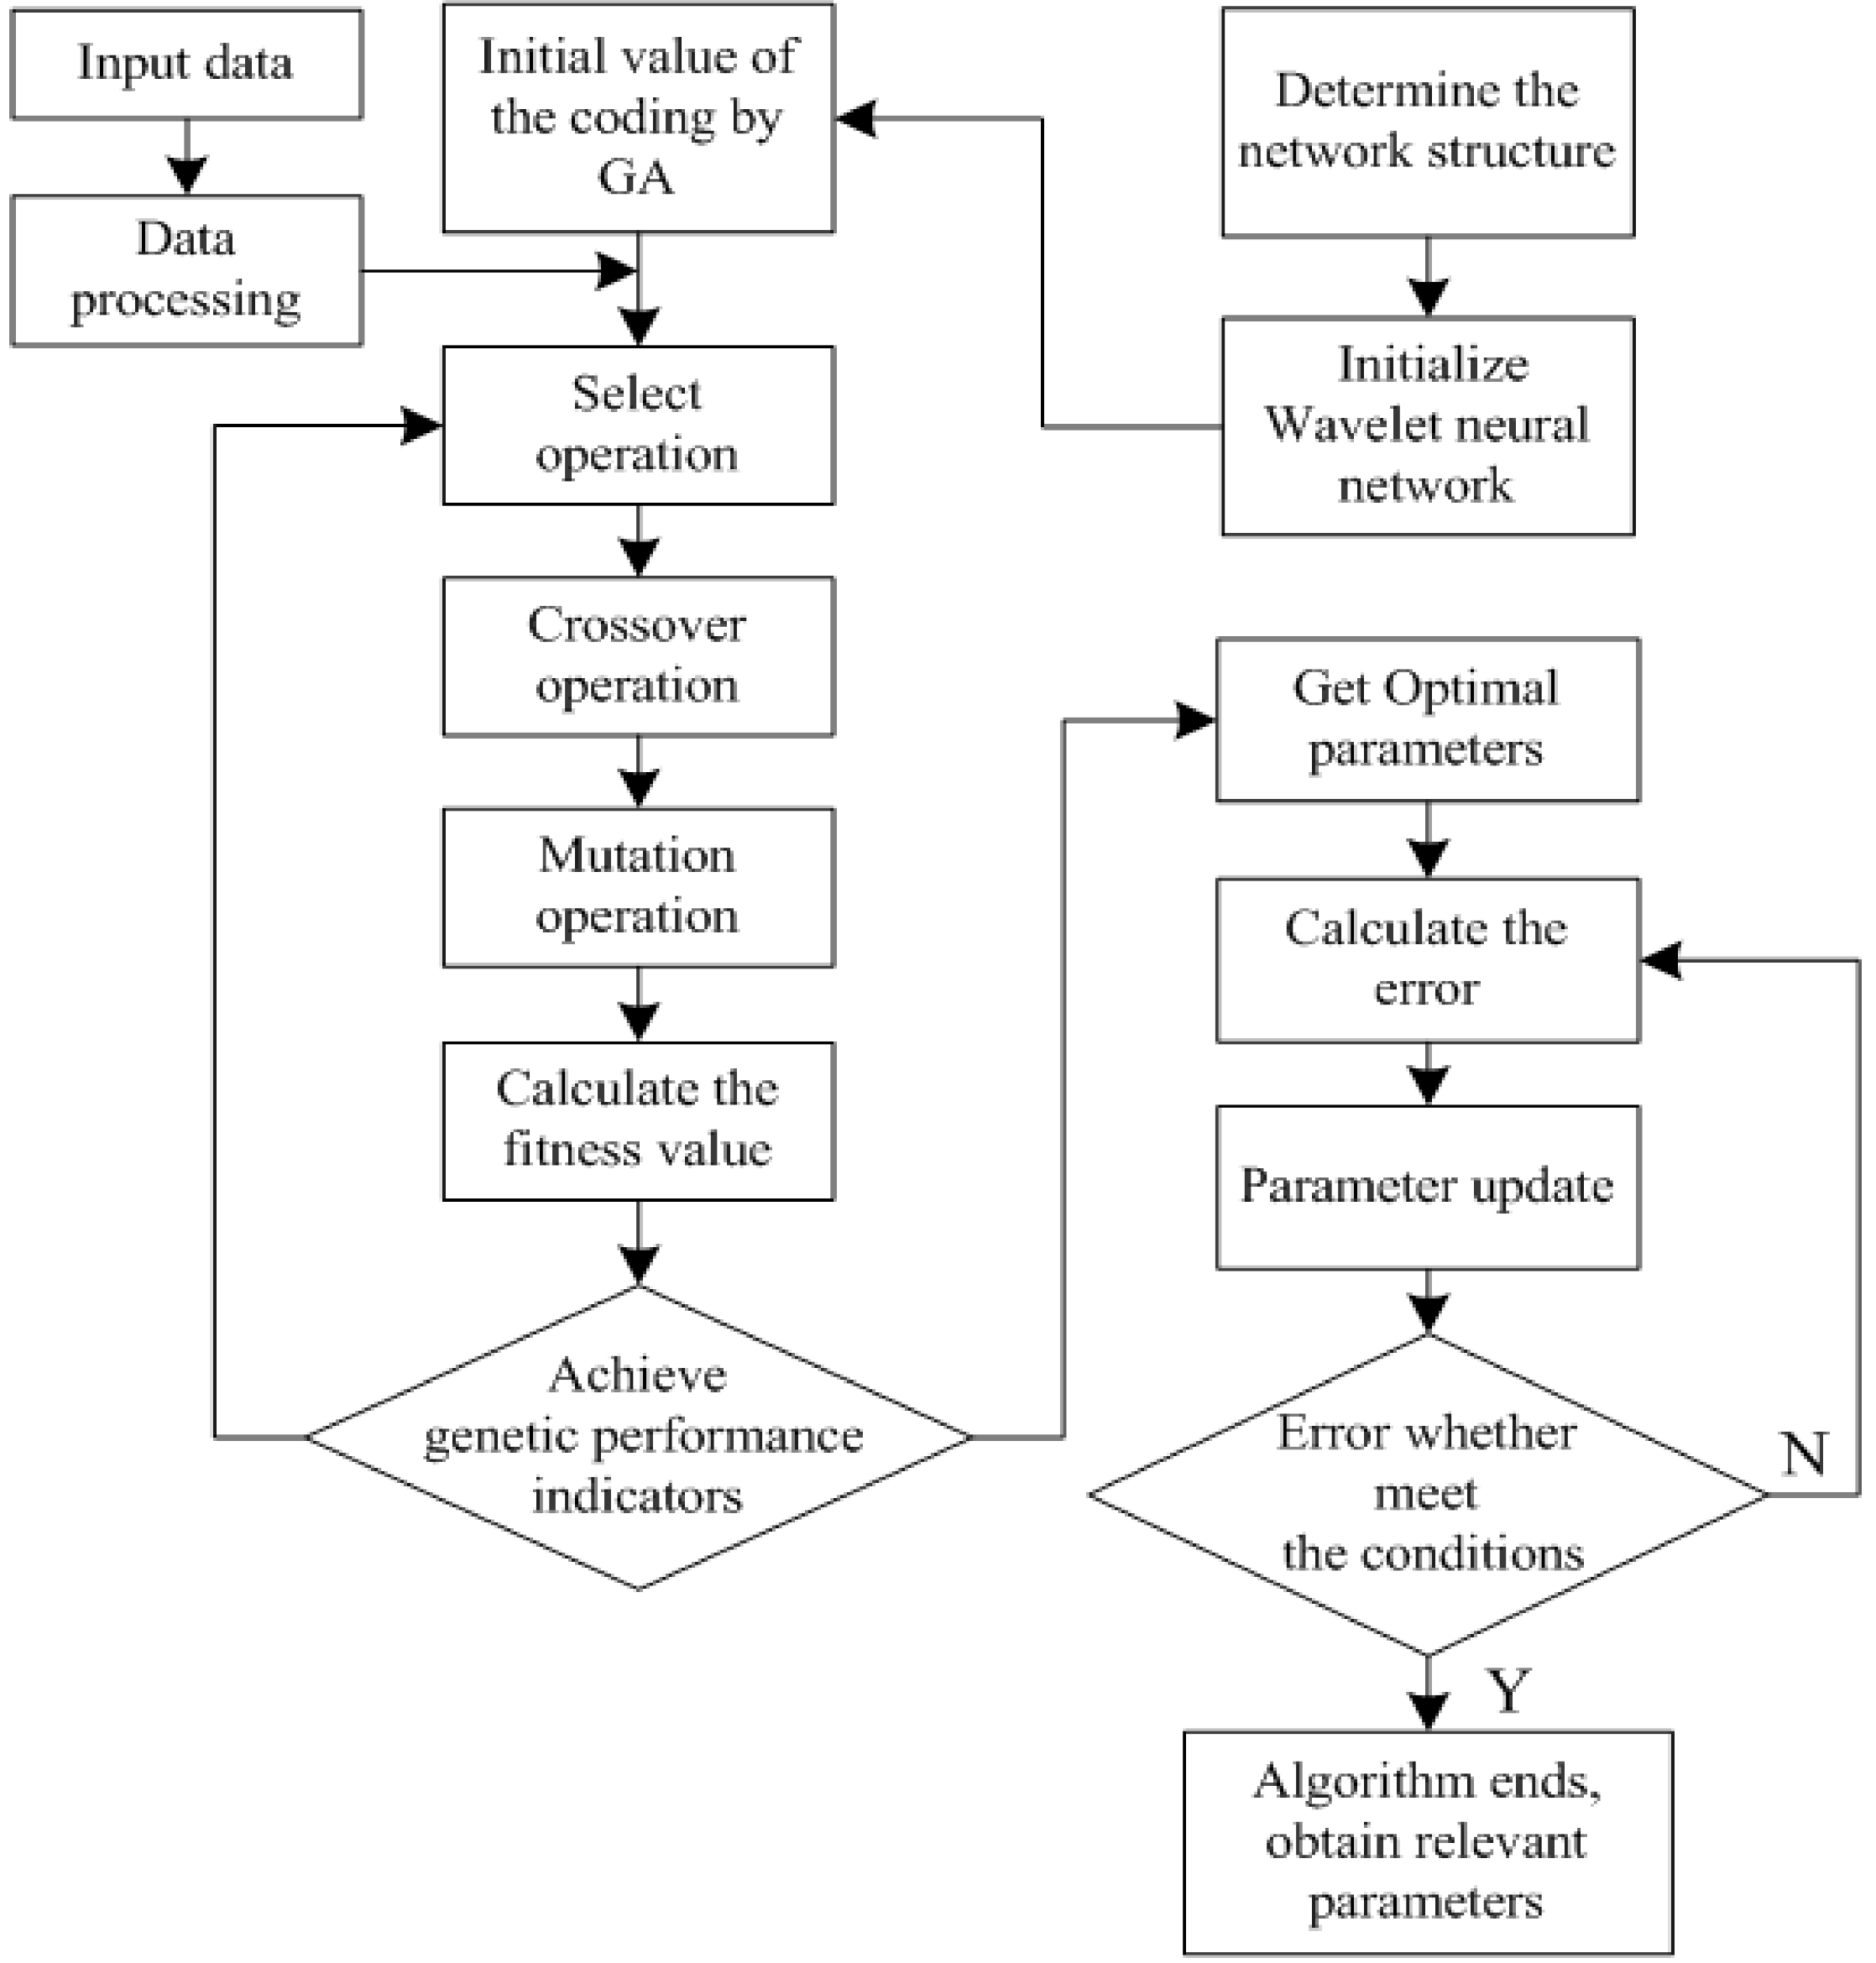
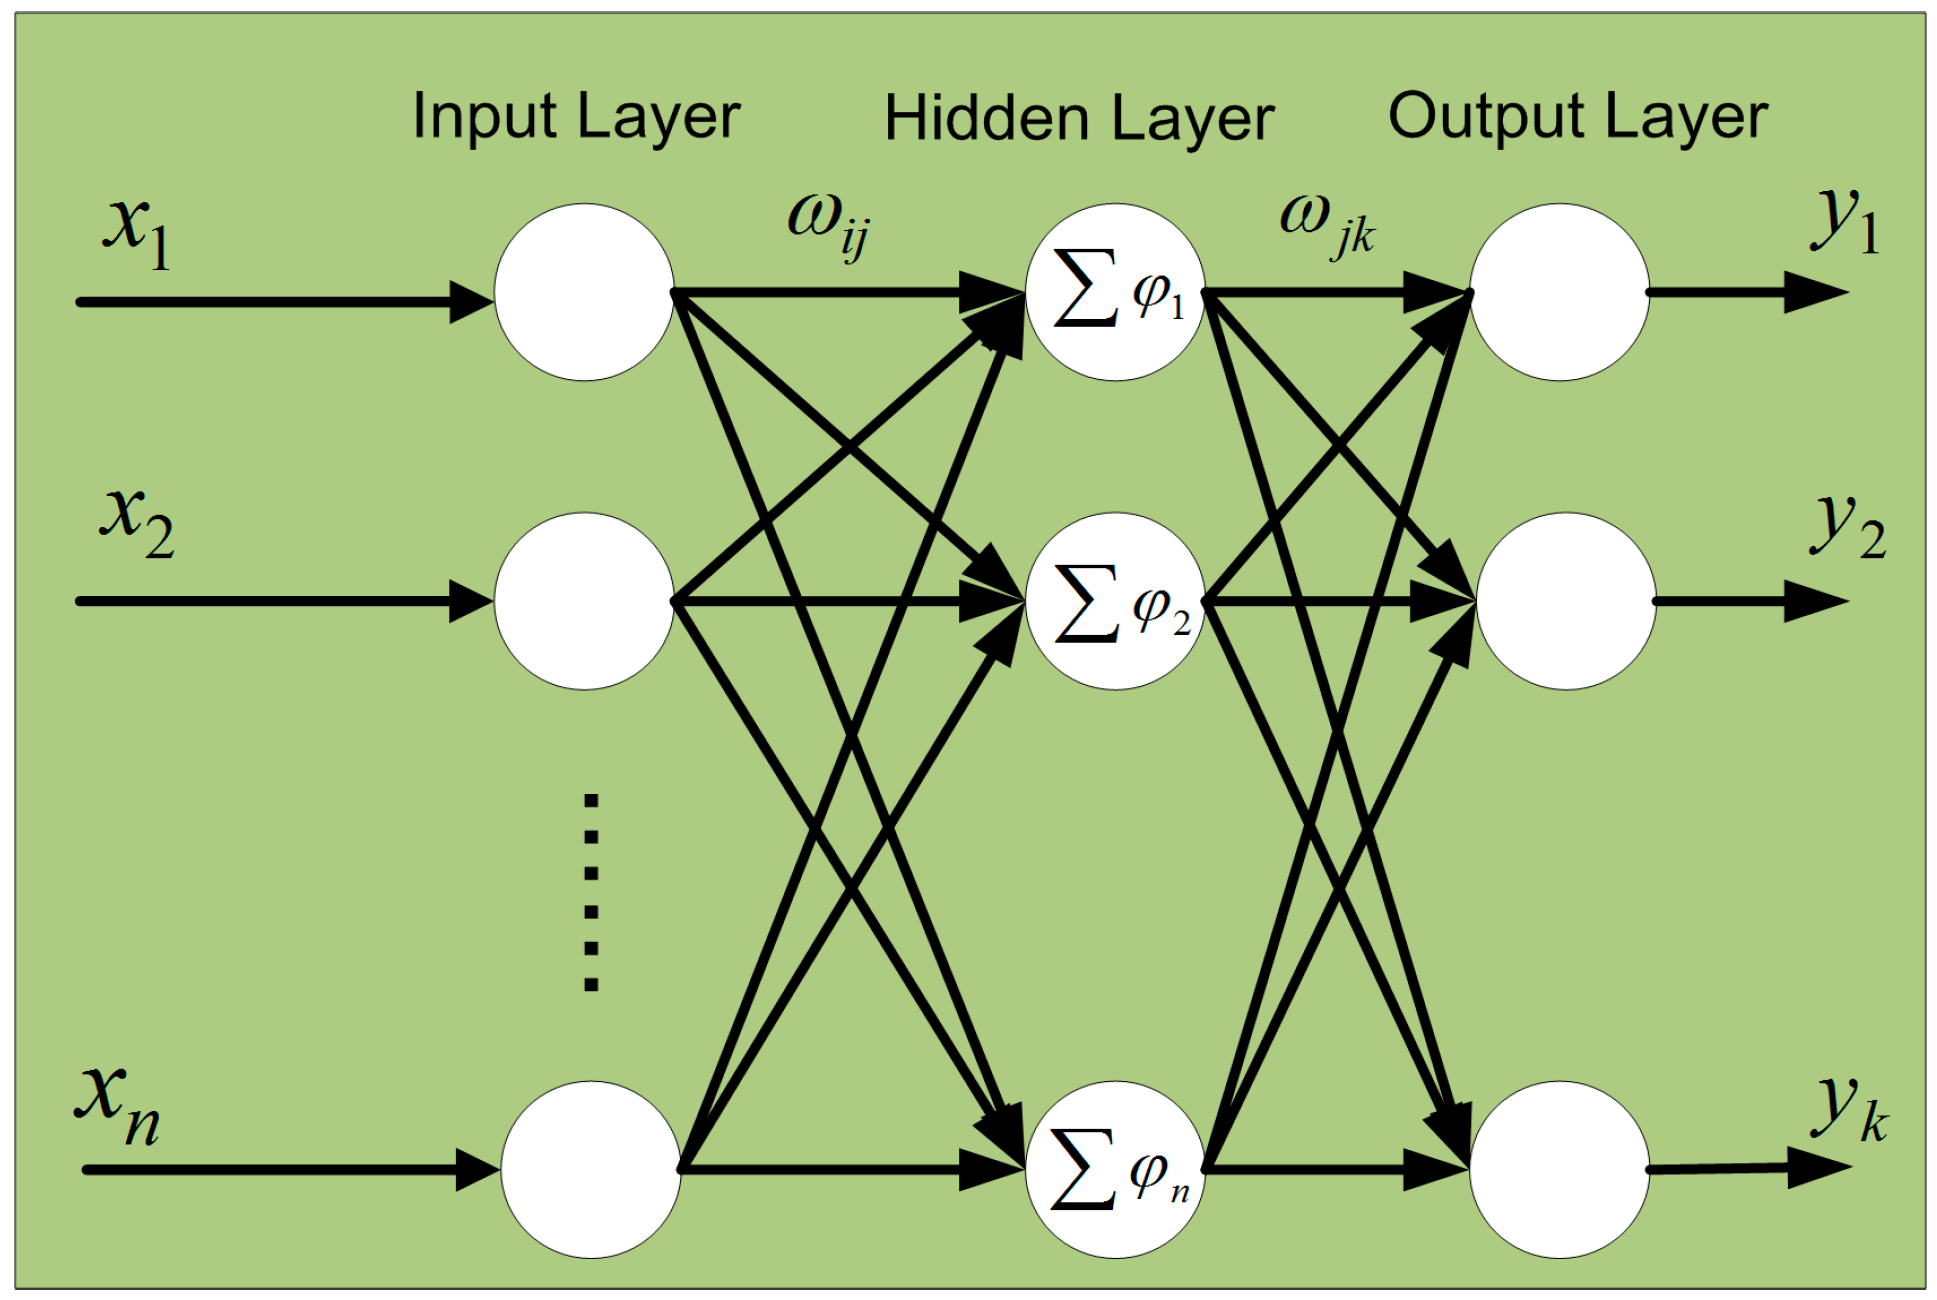
2.2. GA-WNN Compensation Algorithm

Since the wavelet neural network [16,17,18] has good nonlinear quality, fully distributed storage structure, and fault-tolerance, especially the local time-frequency characteristics and zoom capability, it is suitable for solving the problem about nonlinear fitting, hysteresis effect and temperature compensation of the pressure sensor. Wavelet neural network is the feedforward neural network that is based on the wavelet function as the activation function of the neurons. Compared with the backward propagation (BP) and radial basis function (RBF) neural networks based on the sigmoid function, wavelet neural network has the advantages of simple structure, fast convergence speed and controllable convergence precision. It is of prime importance that the neural network has the ability to learn from the environment and improve their behavior by learning from pervious experiences. Thus, it is necessary to introduce the learning process of the neural network. The neural network learns its environment through an iterative process that consists of adjusting its weights and bias levels.
At present there are five commonly used learning algorithms: error correction learning algorithm, memory-based learning algorithm, Hebb learning algorithm, network competitive learning algorithm and Boltzmann learning algorithm. In this paper, the wavelet neural uses error-correction learning algorithm to adjust the weights of network and the parameters of wavelet function, so that the output value of the wavelet neural network continuously approaches the target until the end of the iteration. The error correction learning algorithm is a closed-loop supervised learning algorithm. As long as there is sufficient input/output data and ample study time, this learning algorithm can complete tasks such as function approximation, fitting, prediction and so on. As shown in Figure 3, the error correction process of the weights of wavelet neural network ω i j , ω j k and the scale factor and shift factor of wavelet function a j , b j is as follows:
(1) Calculate the error between the output value of network and target value:
e = k = 1 m y n ( k ) y ( k )
where yn(k) is the desired output, y(k) is the output for the wavelet neural network, and k is the iteration number.
(2) Recalculate the connection weights, the scale factor and shift factor according to prediction error e.
ω n , k ( i + 1 ) = ω n , k i + Δ ω n , k ( i + 1 ) + λ × ( ω n , k i ω n , k i 1 )
a k ( i + 1 ) = a k i + Δ a k ( i + 1 ) + λ × ( a k i a k ( i 1 ) )
b k ( i + 1 ) = b k i + Δ b k ( i + 1 ) + λ × ( b k i b k ( i 1 ) )
where λ is the momentum learning rate, and Δ ω n , k ( i + 1 ) , Δ a k ( i + 1 ) and Δ b k ( i + 1 ) are calculated according to the network prediction error:
Δ ω n , k ( i + 1 ) = η e ω n , k ( i ) ,   Δ a n , k ( i + 1 ) = η e a n , k ( i ) ,   Δ b n , k ( i + 1 ) = η e b n , k ( i )
where η is the learning efficiency, which is the decisive factor of error correction learning.
Figure 3. Schematic diagram of the error correction learning algorithm: (a) the neural network block, (b) the neurons’ signal-flow.
Micromachines 06 00554 g003
A variety of algorithm models for various simulations can be established by using MATLAB (MathWorks, Natick, MA, USA). The diagram of the wavelet neural network model proposed in the paper is plotted in Figure 4. x i is the inputting-sample to the wavelet neural network model. y k manifests the pressure value obtained from the neural network. d k is the standard pressure. e is the error between the output of the neural network and the standard. ω i j is the weights between input-layer nodes i (i = 1, 2, 3, ...) and hidden-layer nodes j (j = 1, 2, 3, ...) and ω j k represents the threshold between hidden layer nodes j (j = 1, 2, 3, ...) and output-layer nodes k (k = 1, 2, 3, ...). a j and b j is the scale and shift factor about hidden-layer nodes j, respectively.
Figure 4. Topological structure of the wavelet neural network model.
Micromachines 06 00554 g004
The input and output model of the wavelet neural network can be expressed as:
y k = 1 1 + e x j = 0 n ω j k φ a , b [ ( i = 0 m ω i j x i b j ) / a j ]
The hidden-layer nodes use Morlet wavelet as the wavelet function, whose mathematical expression is given as:
φ ( x ) = cos ( 1.75 t ) exp ( t 2 / 2 )
In order to improve the convergence speed of the network, the form error function using entropy function, whose mathematical expression is given as:
E = i = 1 M j = 1 N [ t j i ln y j i + ( 1 t j i ) ln ( 1 y j i ) ]
where M is the number of iterations, and t j i and y j i are the j-th expected and actual output value in the module i-th.
The genetic algorithm is a kind of method to simulate the natural evolvement process to search for the optimal solution [19]. As a kind of random searching method, the genetic algorithm can realize the automatic optimization of specific target, and does not need to be familiar with the problem to be solved in the specific areas of information, and it is not affected by the search space. Hence, the genetic algorithm can optimize the wavelet neural network. Here, we do not intend to detail the genetic algorithm. As illustrated in Figure 5, the main ideal of the GA-WNN compensation algorithm is as follows [20,21]: Firstly, the genetic algorithm is adopted to optimize the structure of the neural network, the initial weights, threshold, shift and extension factor, in order to locate a better searching space. Implementation steps of this algorithm include population initialization, fitness evaluation, selection, crossover, mutation, and termination judgment. Then, it can find best weights, threshold, shift and extension factor in this better searching space by employing the wavelet neural network. Finally, these weights, threshold, shift and extension factor are input into Equation (6). In the genetic algorithm, the fitness is used to evaluate the superiority of the individual. The smaller the fitness, the worse the individual. The individual is selected according to the fitness. The probability of the high fitness individual that inherited the next generation is bigger. Here, we select the inverse of squared error as the fitness function:
fitness = 1 1 2 i 1 k [ y ( i ) y m ( i ) ] 2 + 1
In Equation (9), k refers to iterations of genetic algorithm, y(i) is the output values of the network, and ym(i) is the calibration value.
Figure 5. Flowchart of the GA-WNN compensation algorithm.
Micromachines 06 00554 g005

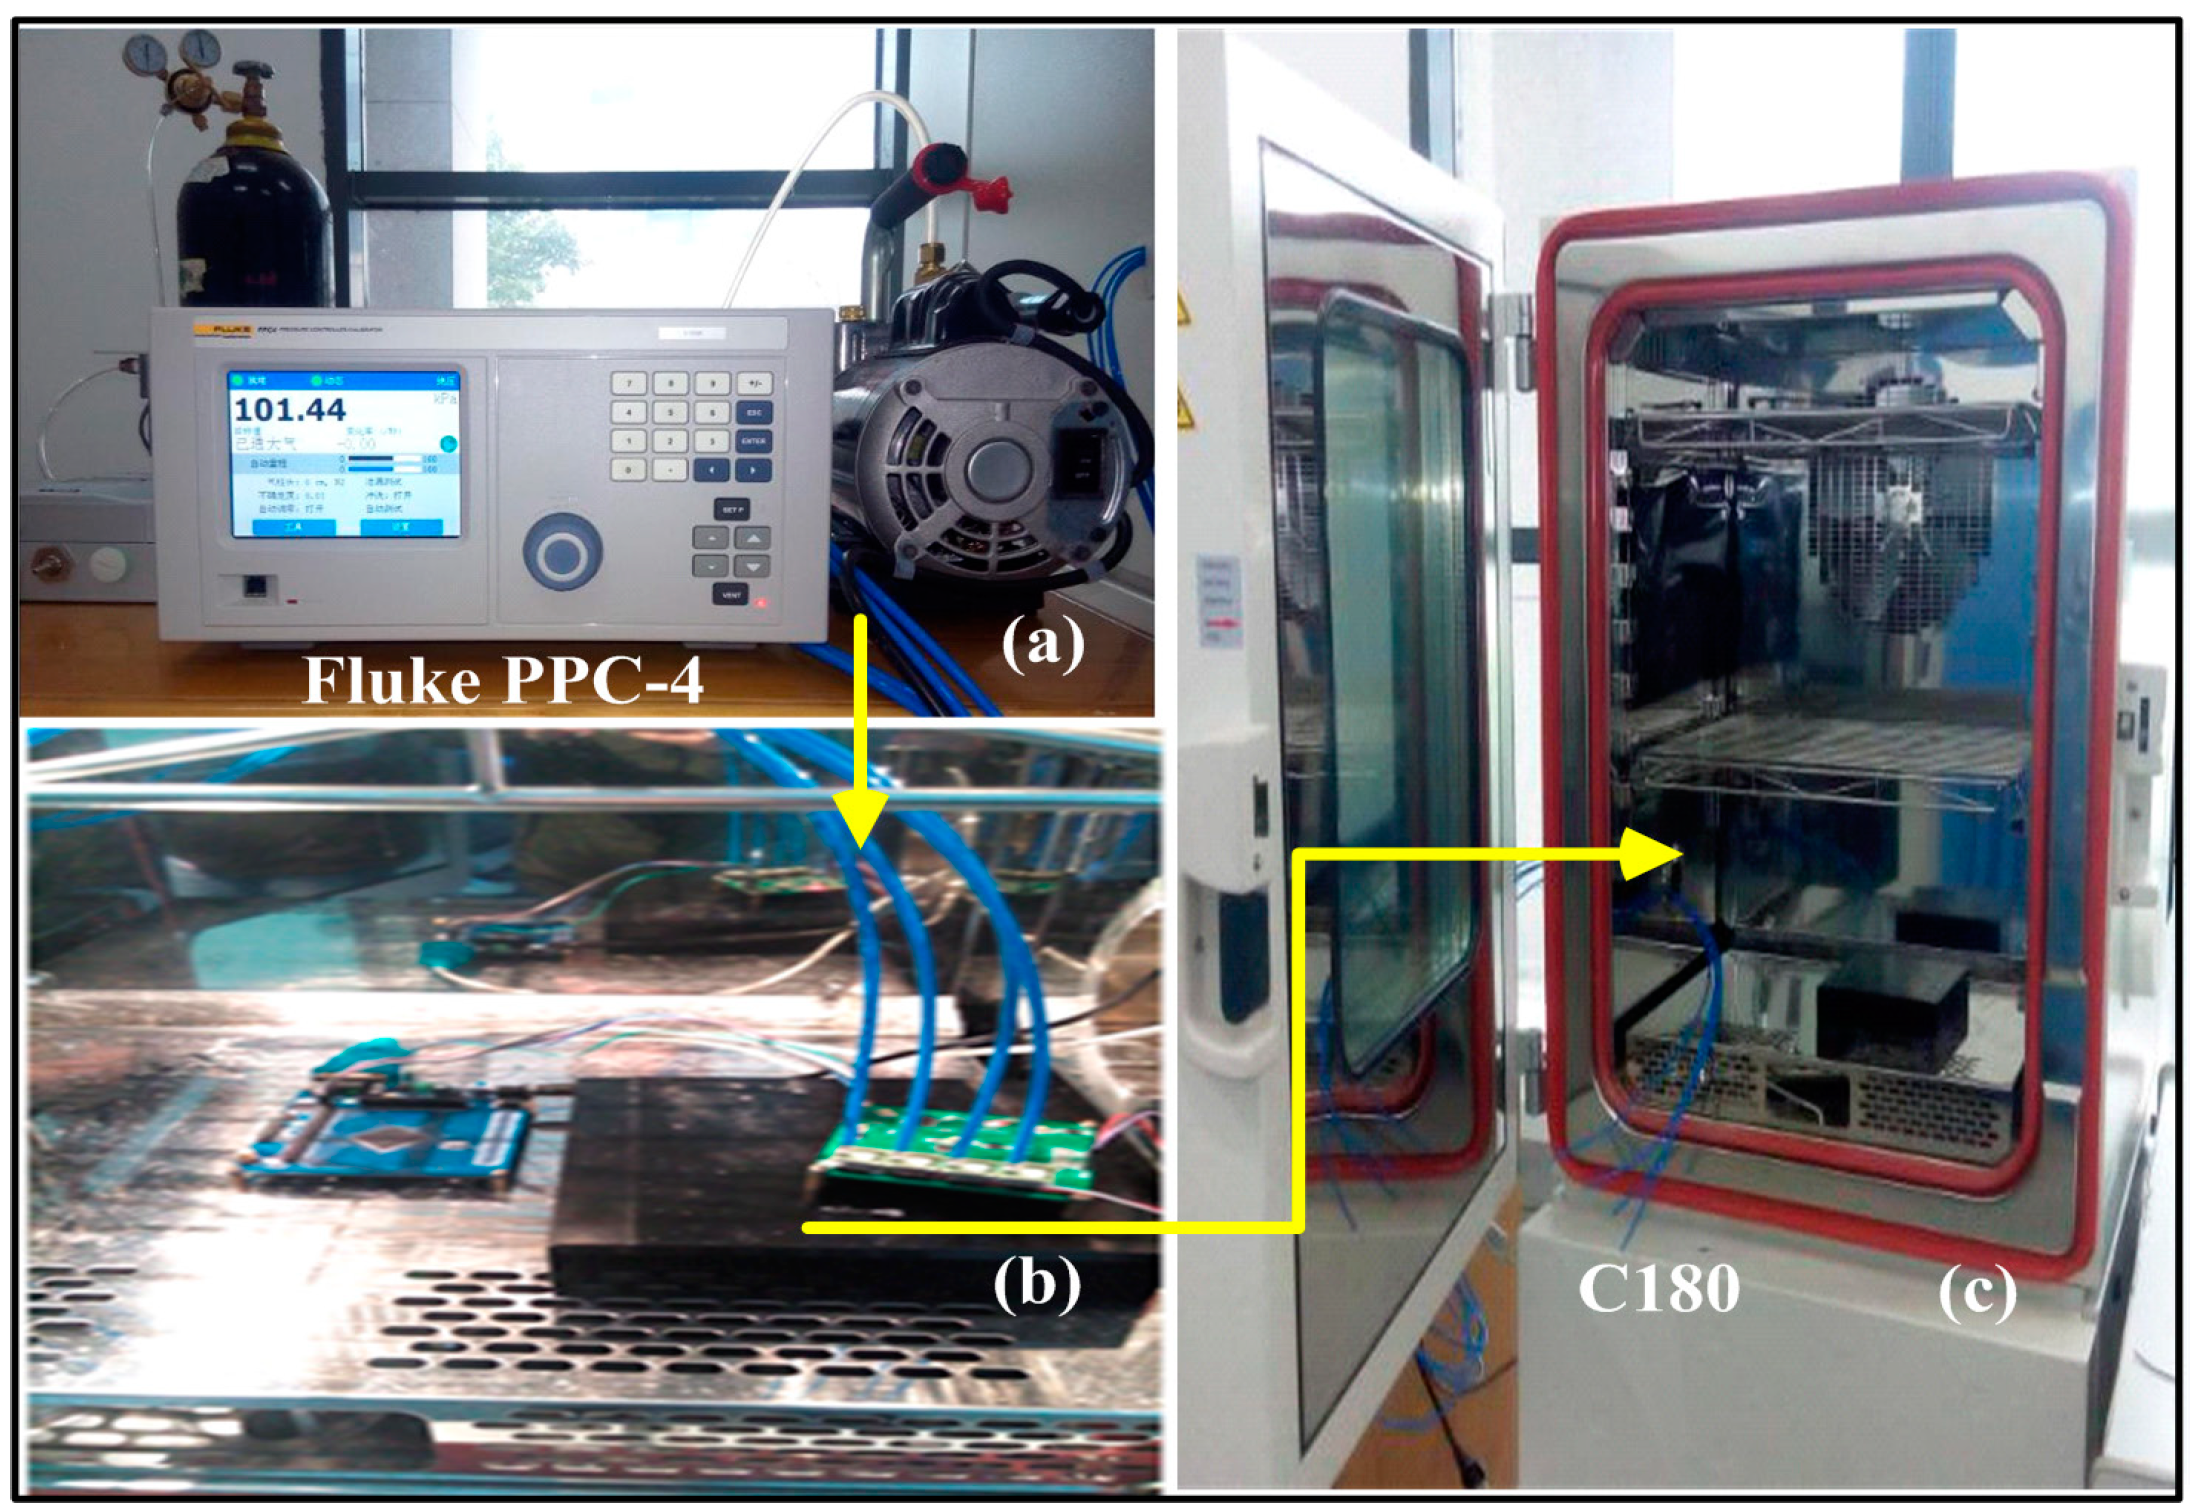
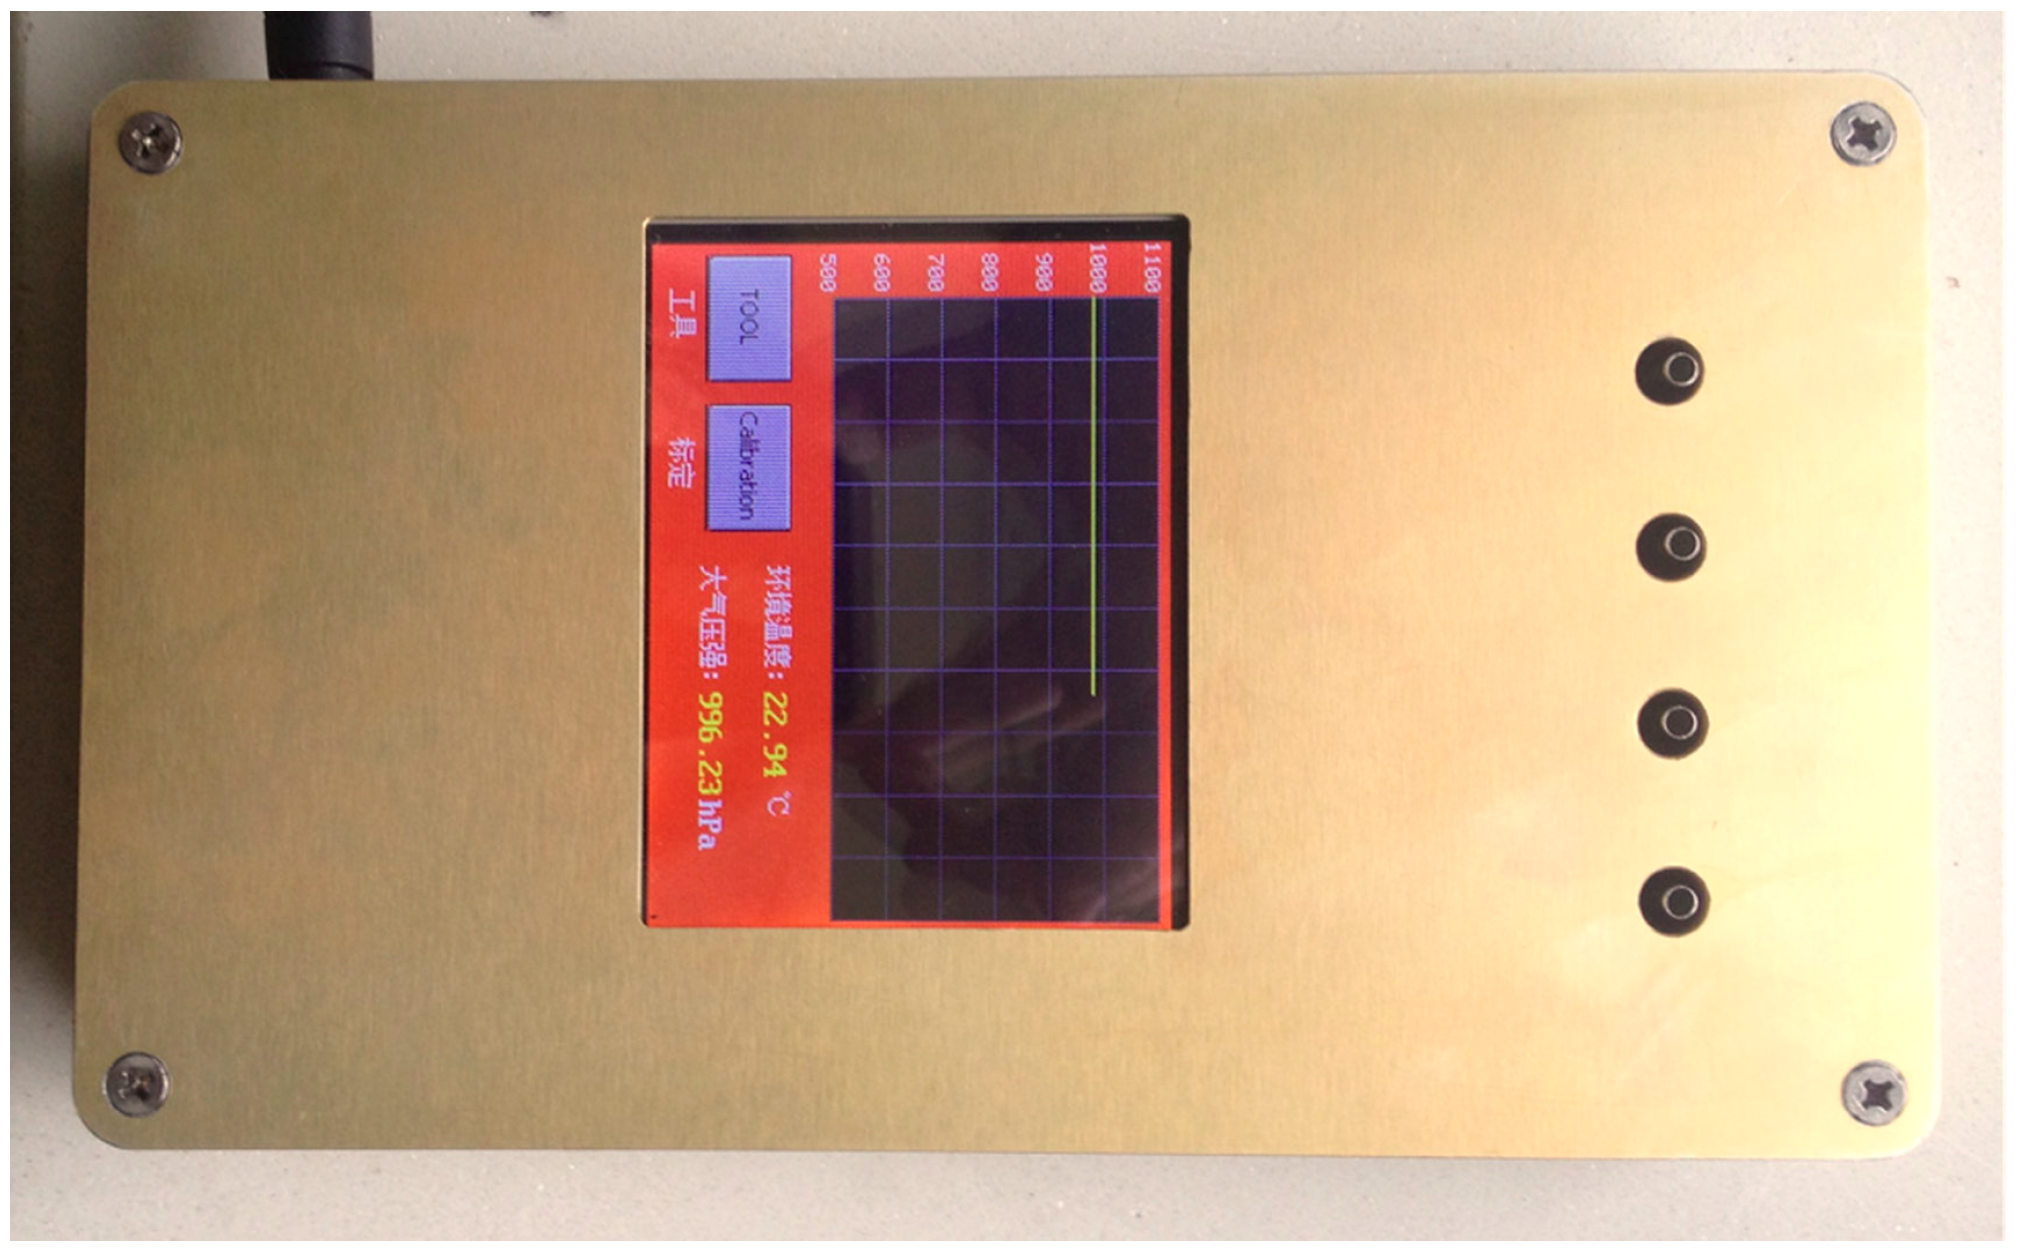
2.3. Calibration Experiment Setup

Figure 6 displays our calibration experiment setup, which consists of a standard pressure generator and a constant temperature chamber. Figure 6a shows the Fluke PPC-4 pressure generator (Fluke Corporation, Everett Reed, WA, USA), whose precision is about eight hundred thousandths and can accurately provide the calibration pressure. Figure 6b exhibits our experiment devices, measuring circuit and air duct. The C180 constant temperature and humidity chamber is shown in Figure 6c. In particular, the calibration procedure is as follows: Firstly, the digital MEMS-array pressure transmitter without calibration is put into the C180 constant temperature chamber. Through the adapter, the airway of Fluke PPC-4 pressure generator is divided into four parts, which are connected to the air inlets of the sensor array. At the same time, the pressure generator is used to produce the standard calibration pressure that we want to get, such as 500 hPa, 600 hPa, 700 hPa and so on. And then pressure voltage values and temperature voltage value are measured by using our MEMS-array pressure sensors and temperature sensor. Secondly, the temperature in the experimental chamber is changed in the wide ranges in order to facilitate calibration pressure and temperature drift compensation. It is worth noting that experiments are performed in the C180 constant temperature and humidity chamber, and the main environmental factors we considered in the paper are pressure and temperature. In fact, it is difficult to fix or control the humidity in our test. For example, moisture in the air remains frozen when the temperature drops below 0 °C. Fortunately, the humidity has no impact on the measurement of the pressure and temperature. Thirdly, the data fusion algorithm based on the GA-WNN is introduced to establish the function relationship between the standard calibration pressures obtained by the Fluke pressure generator and the pressure voltage values as well as the temperature values obtained by our transmitter in a wide range of temperature and pressure. Fourthly, the GA-WNN algorithm and the function relationship which minimizes the sensor errors due to the temperature drift, the hysteresis effect and the long-term drift is written into the embedded system that allows digital pressure transmitter real-time and online display pressure data. Finally, we conduct the experiments to test the prediction performance of the GA-WNN algorithm based on the comparison between data that is not processed by algorithm and the data that is processed by algorithm. In the following section, we discuss in detail the compensation effect of the GA-WNN algorithm for piezoresistive MEMS-array sensors.
Figure 6. Photographs of calibration and test experimental setups: (a) Fluke PPC-4 standard pressure generator; (b) Digital MEMS-array pressure transmitter in constant temperature chamber; (c) C180 constant temperature and humidity chamber.
Micromachines 06 00554 g006

3. Results and Discussion

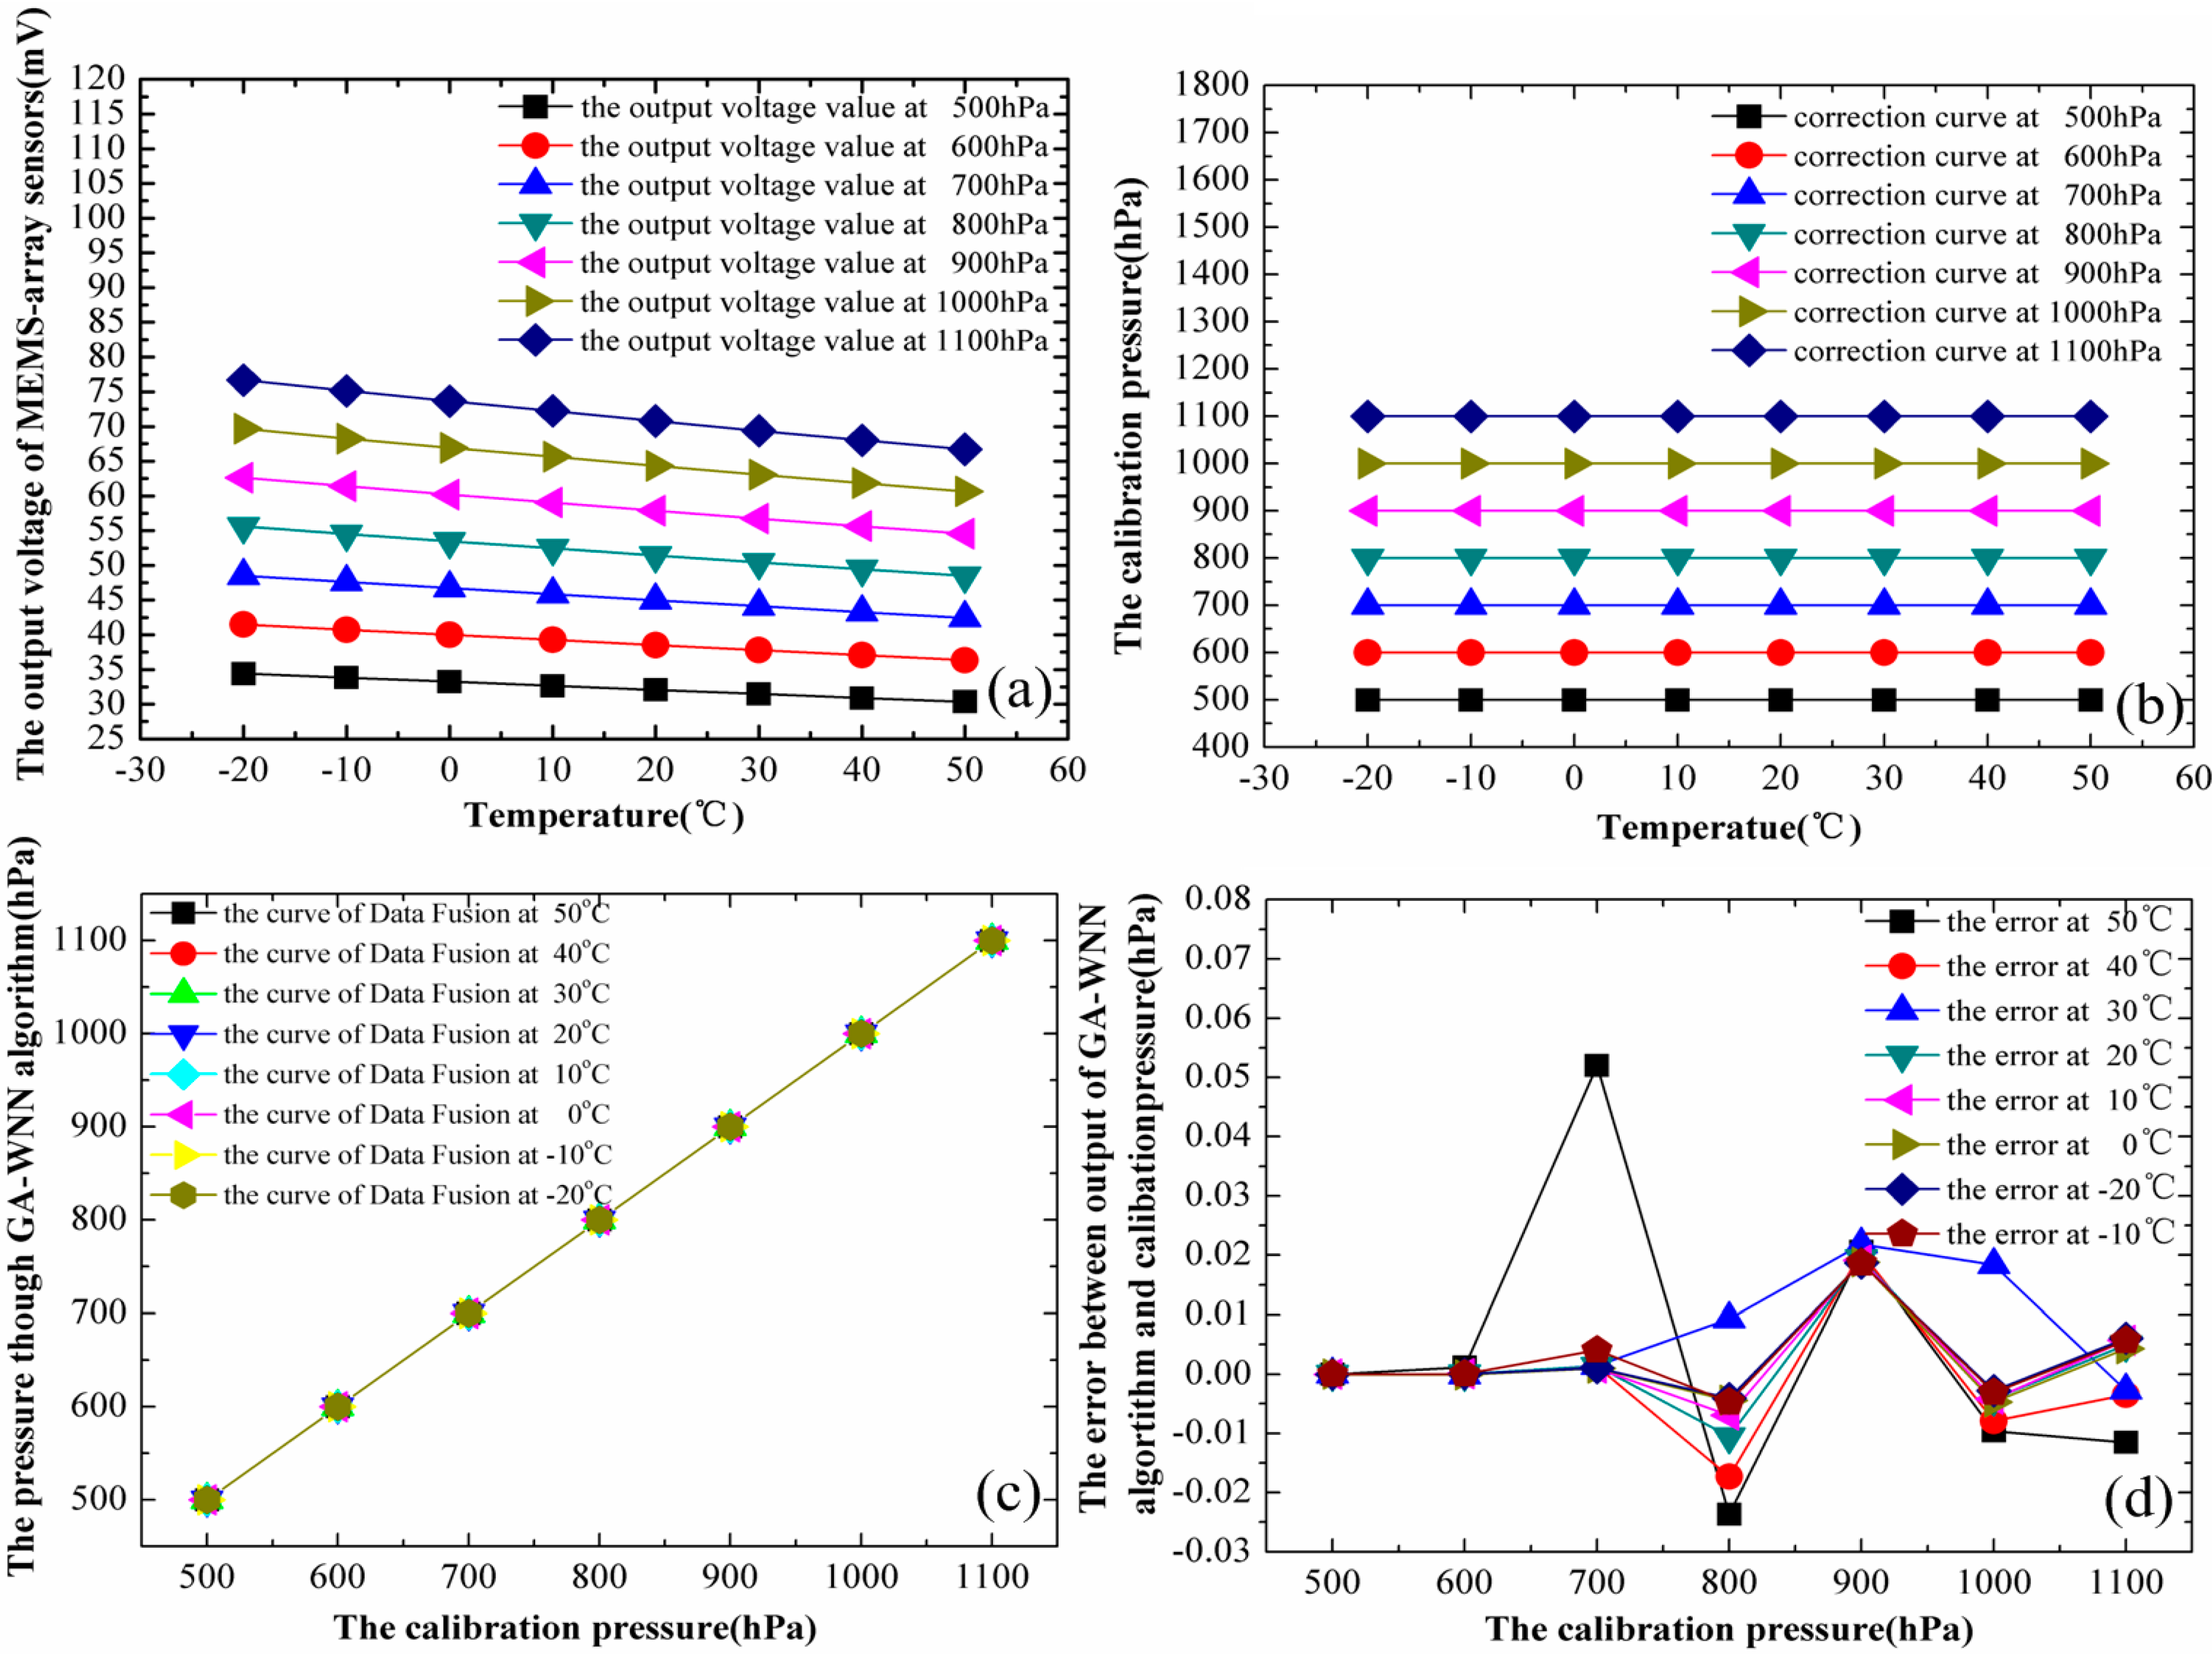
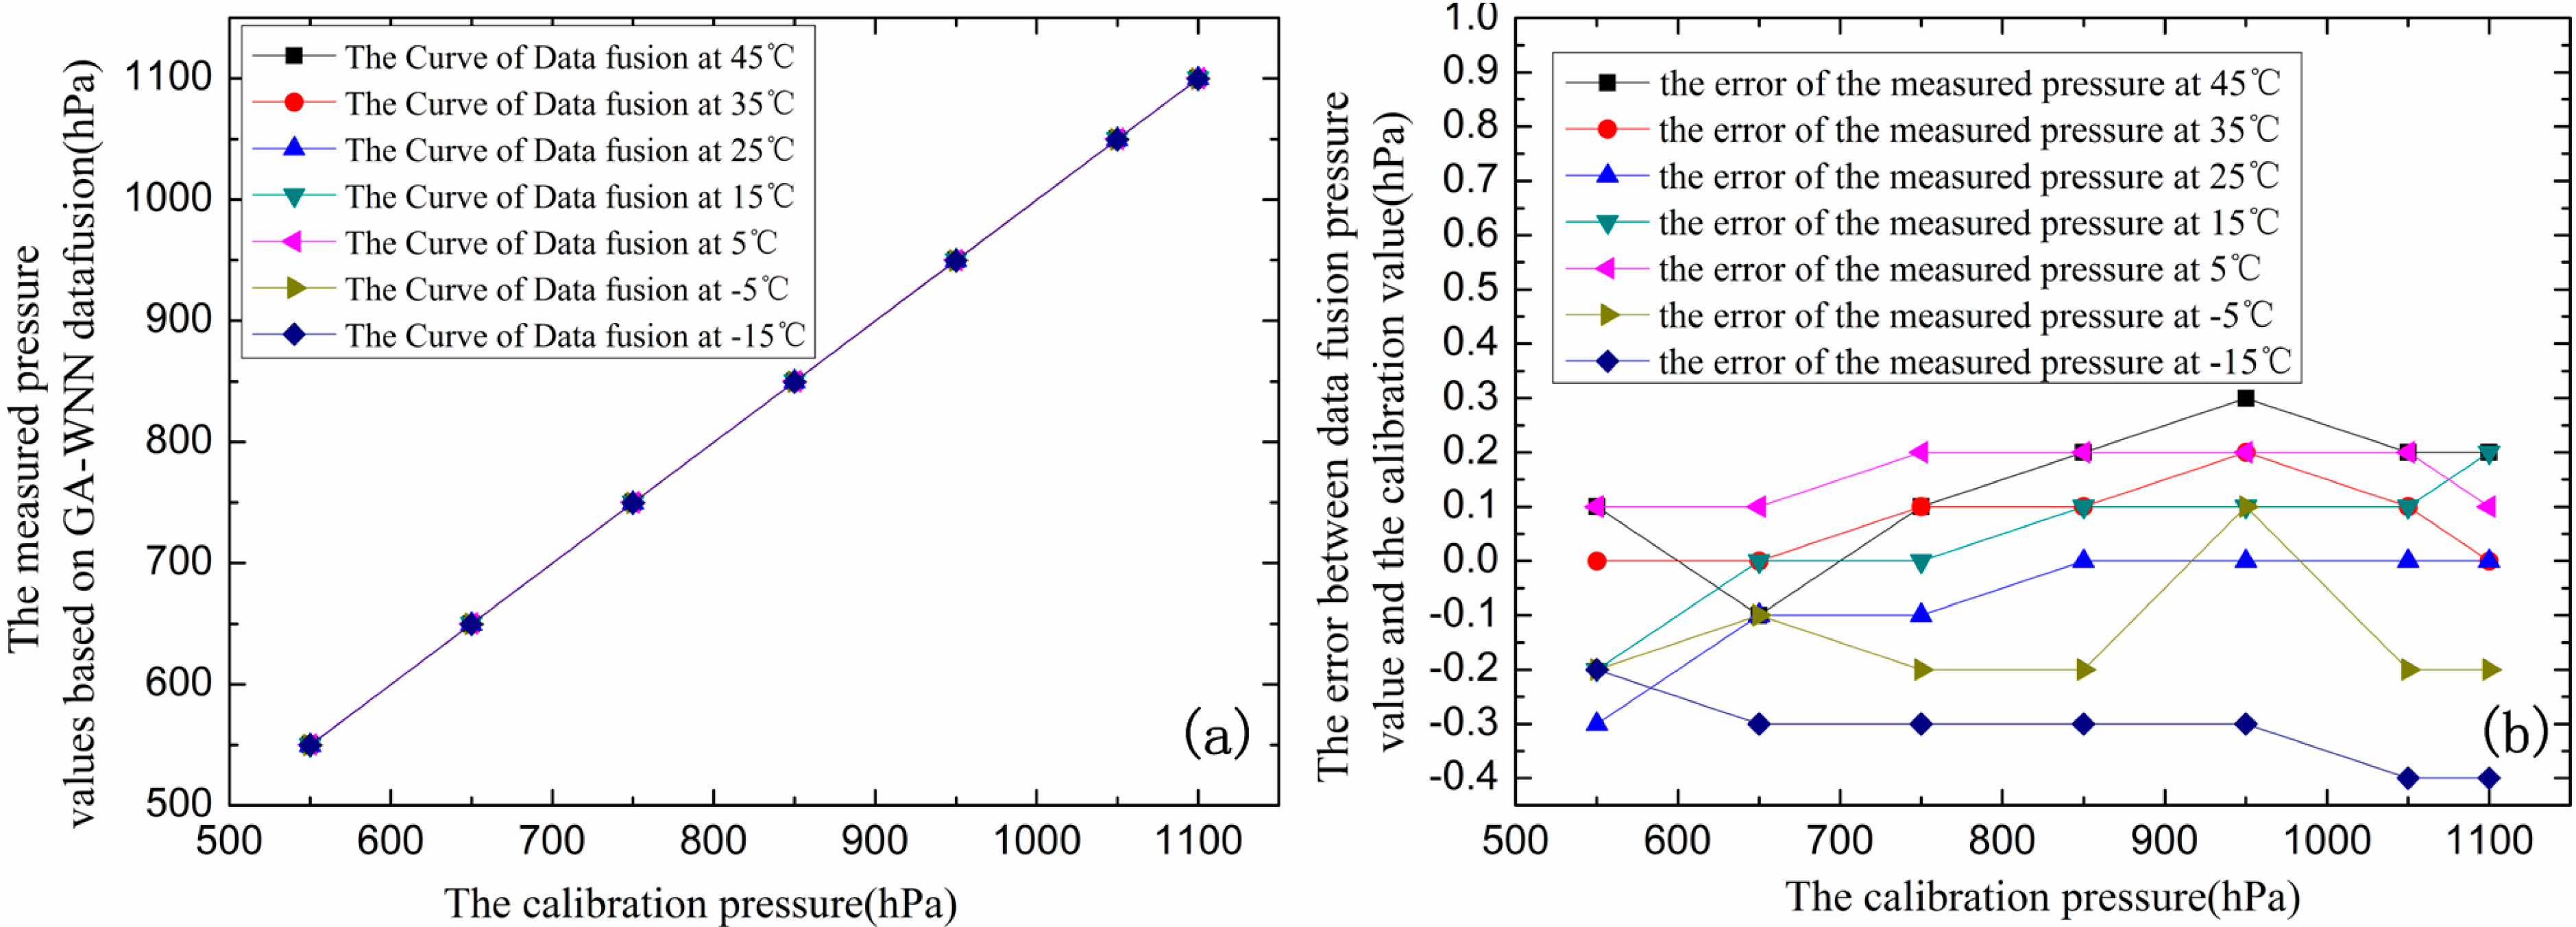
3.1. Temperature Compensation by the GA-WNN Algorithm

The calibration output voltages of the MEMS-array sensors under different pressure and different temperature (the calibration sample data) for training GA-WNN compensation algorithm are experimentally measured, which are listed in Table 1. The output standard pressure of the Fluke pressure generator is marked as P, and the Up represents the average output voltage of the MEMS-array sensors. From Table 1, it is found that the Up changes with temperature T and hence there is a drift in the sensor output characteristics. The temperature drift can especially cause a few mV errors at full scale. Obviously, these pressure sensors are seriously influenced by the temperature. We then apply the MATLAB to establish a data model based on the GA-WNN algorithm and process these training sample data.
Table 1. The calibration sample data of the MEMS-array pressure sensors for the training of the genetic algorithm-wavelet neural network (GA-WNN), which are obtained with pressures from 500 to 1100 hPa and with temperatures from −20 to 50 °C.
TemperatureP/hPa50060070080090010001100
T = 50 °CUp/mV30.2636.3542.4448.5254.5960.6766.74
T = 40 °CUp/mV30.8737.0743.2649.4655.6561.8368.01
T = 30 °CUp/mV31.4737.7944.1150.4356.7563.0669.37
T = 20 °CUp/mV32.1038.5745.0451.5057.9764.4270.78
T = 10 °CUp/mV32.6839.2945.8952.5159.1065.6972.27
T = 0 °CUp/mV33.2339.9846.7253.4660.2066.9273.64
T = −10 °CUp/mV33.8440.7447.6454.5361.4268.2975.15
T = −20 °CUp/mV34.3741.4448.5155.5762.6169.6676.70
Firstly, the training data must be pre-processed to prevent nodes quickly reaching a saturated state and becoming unable to continue learning. According to the mapminmax function of MATLAB, the normalized formula is as follows:
y = ( y max y min ) × ( x x min ) ( x max x min ) + y min
If the data is normalized to (−1,1), ymax is 1 and ymin is −1. x is the output value of pressure sensor array at a reference temperature. xmax is the maximum output value and xmin is the minimum value. According to this formula, the training data in Table 1 can be normalized. Then, theoretical studies have proven that the three-layer neural network can realize any complex nonlinear mapping problem, so the prediction model adopts a three-layer wavelet neural network with a single hidden layer for temperature compensation. This paper sets the input layer with 2 nodes (corresponding to the temperature signal and pressure signal without compensation), the hidden layer with 11 nodes, and the output layer with 1 node. Crossover probability is 0.75 and mutation probability is 0.01. The termination condition of the genetic algorithm is that the fitness value is greater than 0.95. When the sum of square-error is 0.001 by using the error back-propagation algorithm, the wavelet neural network ends. After these genetic neural network parameters are set up, the normalized input and output data as the sample can be put into the network for training.
Based on the calibration sample data in Table 1, Figure 7 summarizes the experimental results of MEMS-array sensors before and after the temperature and nonlinear compensation through the GA-WNN data fusion algorithm. Specifically, Figure 7a shows that the output voltages of MEMS pressure sensors without calibration drift very obviously with the temperature changing, which is a monotonic trend. It is observed that the higher the temperature, the lower the value of the output voltage. This result reveals that output voltage of MEMS piezoresistive pressure sensor must be compensated and corrected. Figure 7b displays that the output pressure data of sensors in different air pressures with temperature changes that are compensated by the GA-WNN algorithm, are less influenced by the temperature. As we can see, the corrected pressure values based on the GA-WNN compensation algorithm are substantially unchanged in the −20–50 °C range. Figure 7c illustrates the relationship curves between the corrected pressures through the GA-WNN data fusion and the calibration pressures at different temperature, which coincide together and are highly linear over the 500–1100 hPa range. This result indicates that the influence of the temperature can be neglected once the GA-WNN algorithm is applied. Figure 7d gives the absolute error between the output pressure that is compensated by the GA-WNN data fusion algorithm and standard calibration pressure obtained by Fluke pressure generator. It is noteworthy that the maximal error after compensation of the GA-WNN algorithm is 0.055 hPa, which demonstrates that our compensation method is accurate and effective.
As shown in Figure 7, the compensation effect of GA-WNN is good. At this time, connection weights between the input layer and hidden layer ω 1 , connection weights between the output layer and hidden layer ω 2 , scale factor a and shift factor b is:
ω 1 = { 0.5418 ,     0.3111 0.7912 , 0.2433 0.1834 ,     0.9170 0.2621 , 0.0879 0.5472 , 0.5814    0.3150 , 0.0868    0.1624 ,     1.0157    0.5720 , 0.1455    0.9523 ,     0.3345 0.2505 , 0.1335 0.8609 , 0.2076 } ω 2 = { 0.6975 0.0059 ​  0.8203    1.0531    0.0818 0.6628 0.3666 0.6697    0.0085    0.8586 0.5682 } a = { 0.4335    0.2264 0.2599    0.7606    0.7855    0.7656    0.7280 0.3396    0.1018 0.0374 0.5022 } b = { 0.5461    0.2255    0.3202    0.7667    0.7817    0.8635    0.7047 0.3864    0.1007 0.1628 0.7141 }
After the wavelet neural network was trained by the calibration sample data in Table 1, the connection weights and other important parameters can be obtained. Then the GA-WNN algorithm is ported to the embedded µC/OS-II operating system in the form of C language procedures by using STM32 microprocessor. In the case, the proposed MEMS-array pressure transmitter can measure and give the air pressure in real time (detailed contents of the embedded implementation process are described in Section 3.5.). However, we need to do the test experiments under the other pressures and temperatures to further verify this compensation algorithm at actual situation and to ensure reliability. The experiments are tested on 550 hPa, 650 hPa, 750 hPa, 850 hPa, 950 hPa, 1050 hPa, 1100 hPa pressure points that are selected at 45 °C, 35 °C, 25 °C, 15 °C, 5 °C, −5 °C and −15 °C. The results of test experiments are listed in Table 2 and plotted in Figure 8. The highly linear relationships between the actual measurement pressures of our transmitter corrected through the GA-WNN data fusion and the calibration pressures at different temperature are illustrated in Figure 8a. From Figure 8b, it is clear that the maximum error of the actual measured pressure is within 0.4 hPa compared with the standard calibration pressure produced by Fluke pressure generator, and most of the errors are smaller than 0.3 hPa. Thus, this digital MEMS-array pressure transmitter would eliminate the effect of temperature and achieve high accuracy to meet the basic requirements of meteorological measurements.
Figure 7. (a) Dependence of the output voltages of MEMS-array pressure sensors without compensation on the temperatures with pressures from 500 to 1100 hPa. (b) Dependence of corresponding calibrated pressure values after correction through GA-WNN data fusion on the temperatures under different pressure. (c) The relationship curves between the corrected pressures and the calibration pressures with temperatures from −20–50 °C. (d) The absolute error between the corrected pressures and the calibration pressures at different temperature.
Micromachines 06 00554 g007
Figure 8. (a) The relationships between the actual measurement pressures of the digital MEMS-array pressure transmitter designed in the paper and the calibration pressure of the Fluke pressure generator at different temperature. (b) The absolute error between them.
Micromachines 06 00554 g008
Table 2. When the test pressure is 550 hPa, 650 hPa, 750 hPa, 850 hPa, 950 hPa, 1050 hPa, 1100 hPa, the actual measurement pressures of MEMS-array pressure transmitter at 45 °C, 35 °C, 25 °C, 15 °C, 5 °C, −5 °C and −15 °C.
P/hPa55065075085095010501100
T = 45 °C550.1649.9750.1850.2950.31050.21100.2
T = 35 °C550.0650.0750.1850.1950.21050.11100.0
T = 25 °C549.7649.9749.9850.0950.01050.01100.0
T = 15 °C549.8650.0750.0850.1950.11050.11100.2
T = 5 °C550.1650.1750.2850.2950.21050.21100.1
T = −5 °C549.8649.9749.8849.8949.91049.81099.8
T = −15 °C549.8649.7749.7849.7949.71049.61099.6

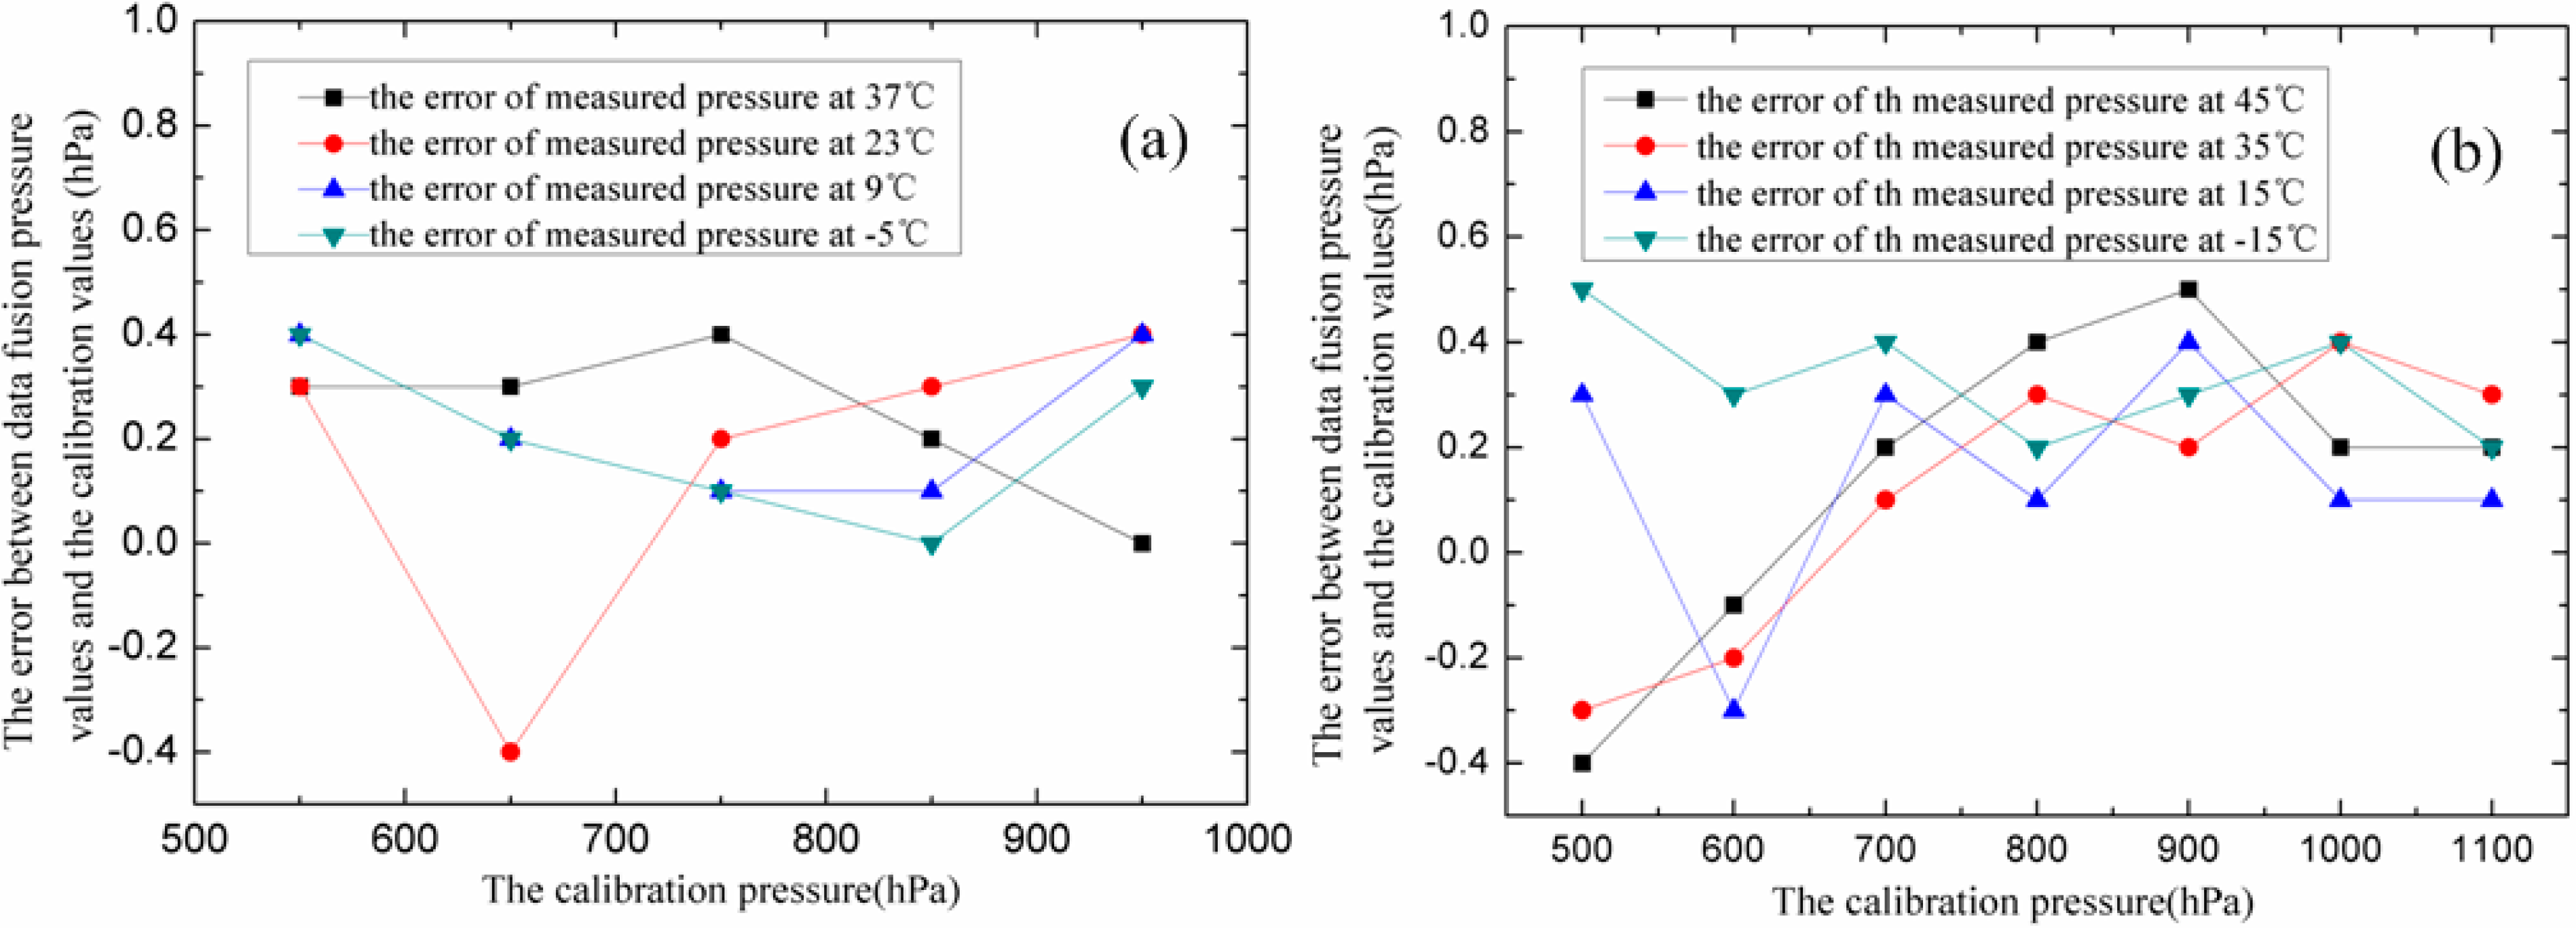
3.2. System Evaluation

In order to further research the specific effect of the GA-WNN algorithm on the array of MEMS piezoresistive pressure sensors, the temperature sensitivity coefficient and the zero temperature drift coefficient are used as the key indicators for the system evaluation.
(1) The full-scale output and the temperature sensitivity coefficient:
α s = Δ U m Δ T × U F S
where Δ T denotes the difference between the maximum and minimum working temperature, UFS represents the full-scale output of the pressure sensor, and Δ U m is the maximum drift value of the output when the temperature changes in Δ T . When the temperature changes from −20–50 °C, the output UFS without processing by the GA-WNN algorithm is 76.70 mV, and Δ U m = 76.70–66.74 = 9.96 mV. Thus, the thermal sensitivity coefficient α s = 1.86 × 10⁻³ /°C. However, after being compensated and corrected by the GA-WNN algorithm, UFS = 1100 hPa and Δ U m = 1100.2–1099.6 = 0.6 hPa, so α s is easy to be less than 7.79 × 10⁻⁶ /°C.
(2) The zero point output and the zero temperature drift coefficient:
α 0 = Δ U 0 m Δ T × U F S
where Δ U 0 m is the maximum drift value of the zero point output when the temperature changes in Δ T . When the temperature changes from −20–50 °C, the output UFS without processing by the GA-WNN algorithm is 76.70 mV, Δ U 0 m = 34.37–30.26 = 4.11 mV, so the zero temperature drift coefficient α 0 is 7.65 × 10⁻⁴ /°C. After being compensated and corrected by the GA-WNN algorithm, UFS = 1100 hPa, Δ U 0 m = 550.1–499.7 = 0.4 hPa, and α 0 is 5.19 × 10⁻⁶ /°C.
From the above calculation and analysis, we can find that the values of the temperature sensitivity coefficient and the zero temperature drift coefficient, after correction through GA-WNN data fusion, reduce several orders of magnitude compared with the data that are not processed by the GA-WNN algorithm, which means that the GA-WNN compensation algorithm is very effective to deal with temperature drift.

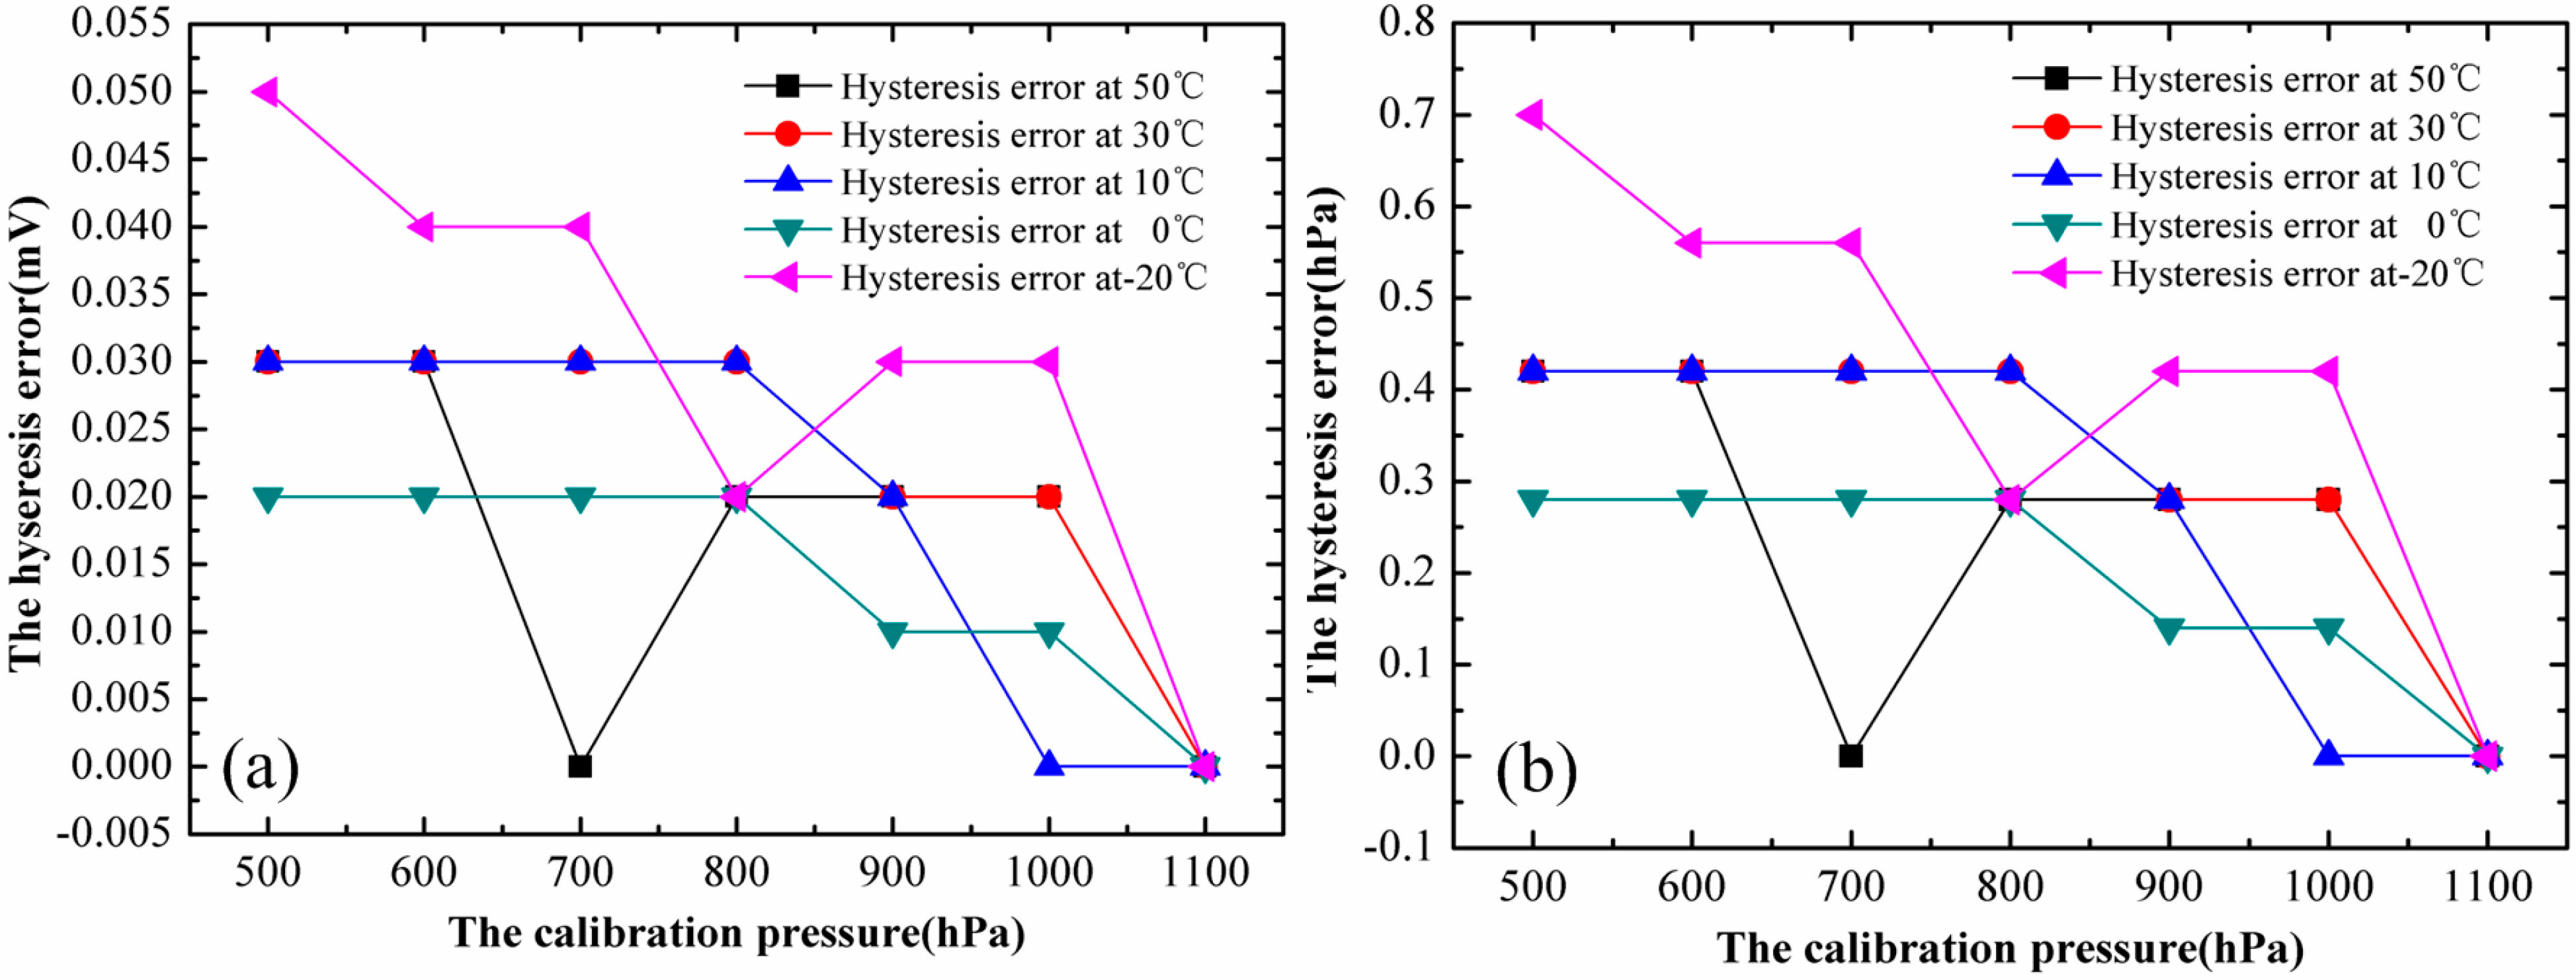
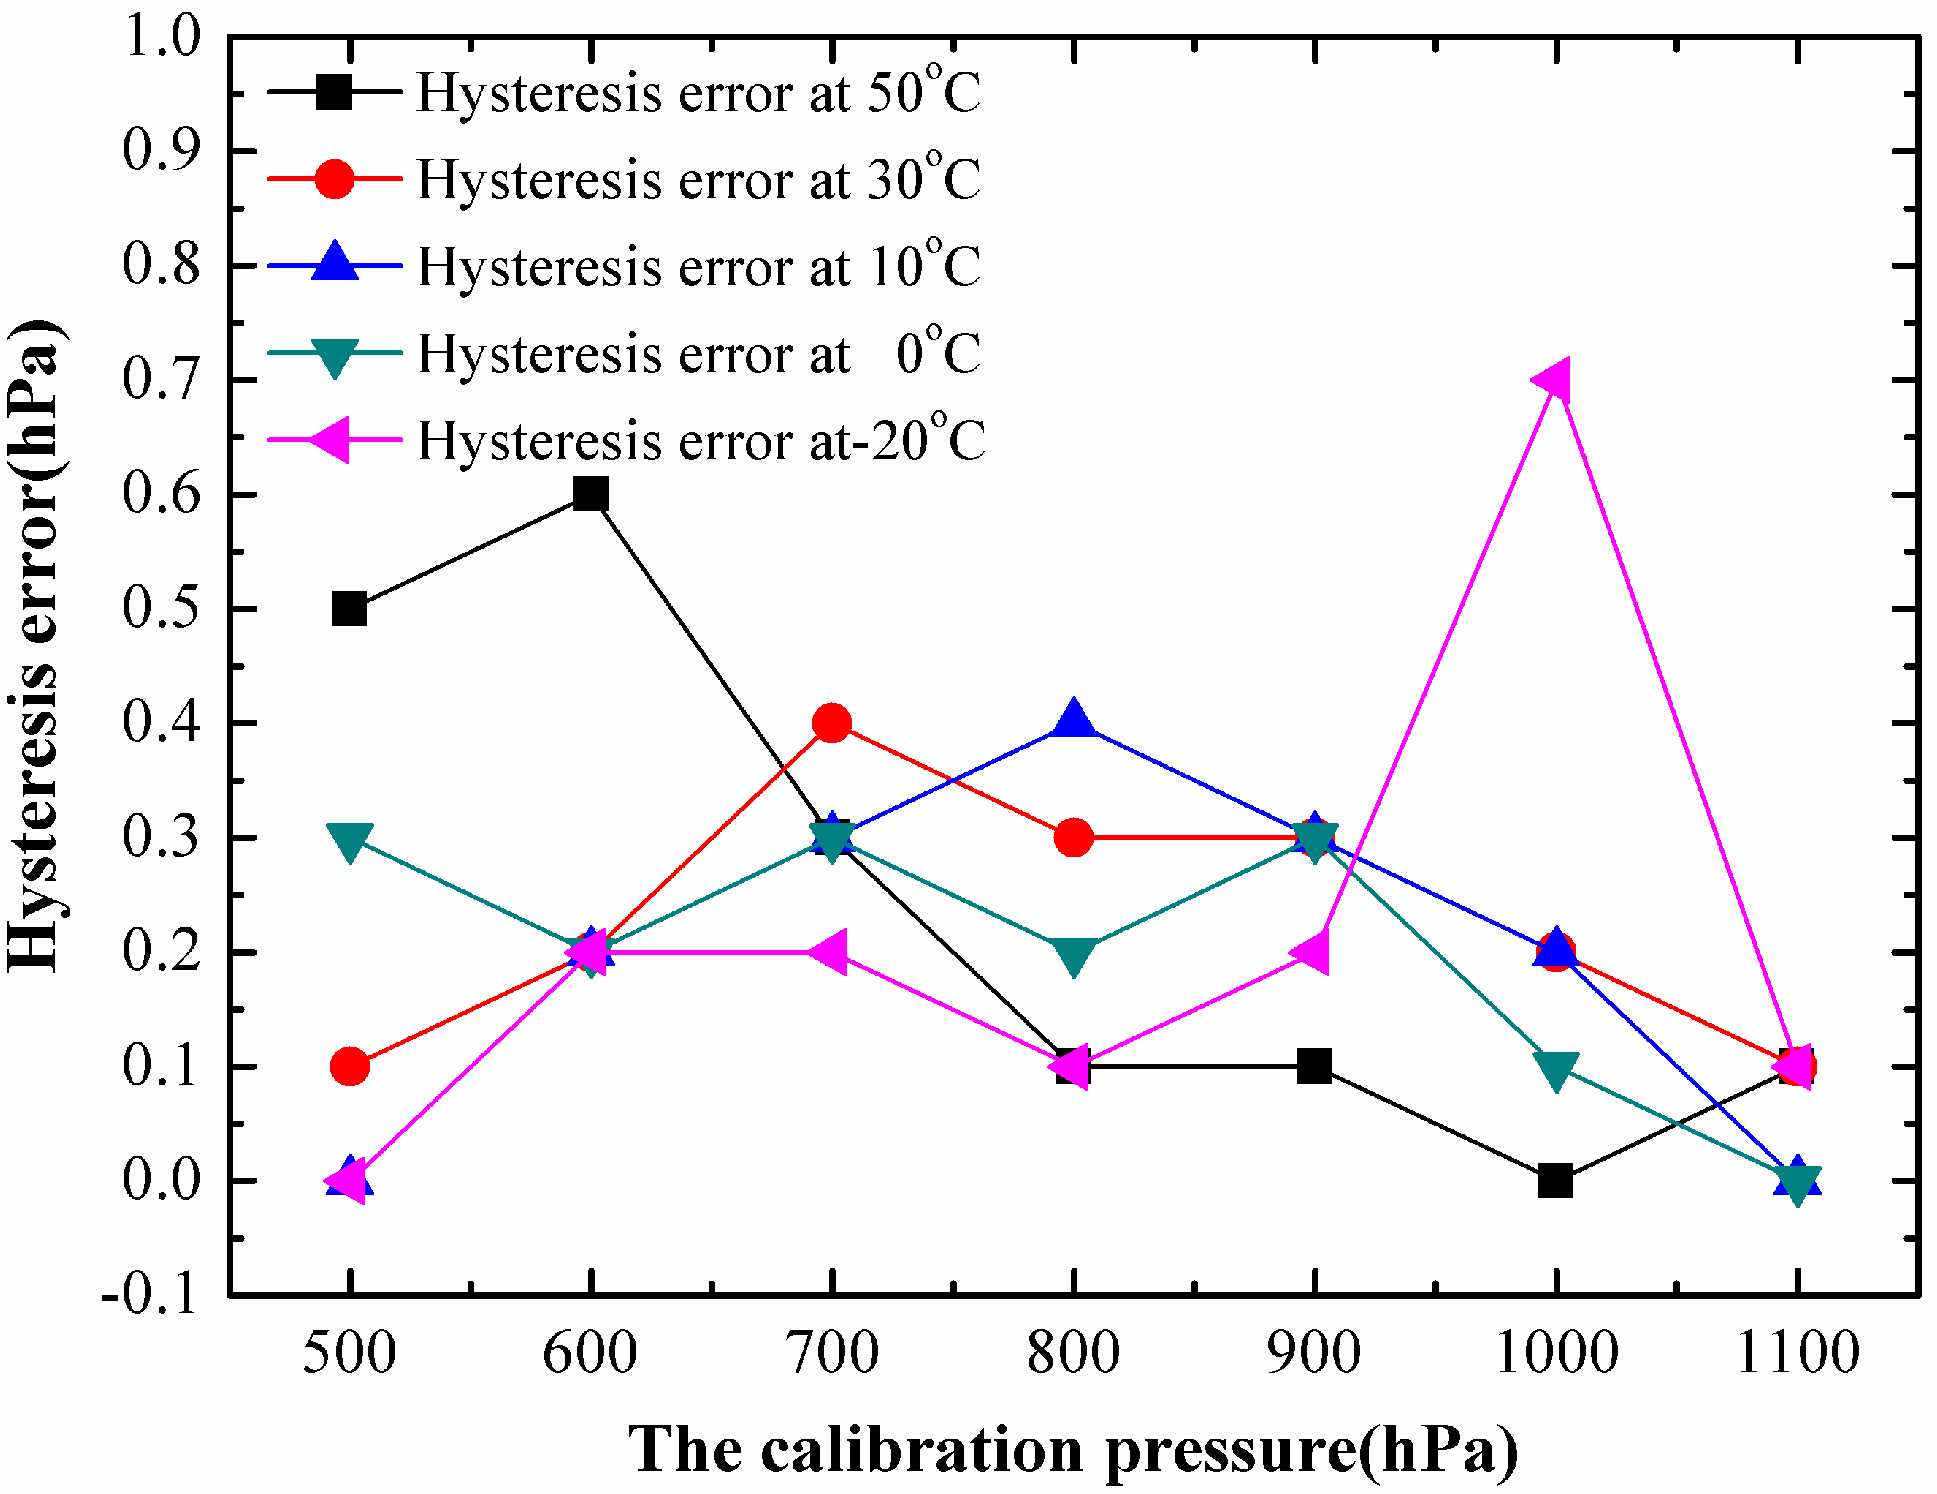
3.3. Hysteresis Effect Compensation

The hysteresis is an important concern for most of the sensors for practical applications. It is even more important for high-precision measurements. It is a deviation of the sensor output at specified points of the input signal when it is approached from the opposite direction. The percentage hysteresis for the sensor can be defined as [22]:
Hysteresis = max ( U i n c U d e c ) U F S × 100 %
In the equation, Uinc is the actual sensor output with an increase in pressure, Udec is the sensor output for a decrease in pressure and UFS is the full-scale sensor output.
In order to obtain the sensor output independent of hysteresis in the measuring range, the sensor output should be compensated in such a way that its offset voltage due to hysteresis effect will be minimized [11]. Here, it is necessary to introduce the hysteresis measurement of the pressure sensor. According to the standard of machinery industry JB/T 10524-2005, we can perform the hysteresis experiment. Considering the measuring range of NPC-1210-015A-3L MEMS pressure sensor and the complexity of the test as well as the full-scale precision, we take the following steps to measure hysteresis. Firstly, we control the pressure generator to provide 500 hPa pressure to the sensor array and write down the output voltages of the sensor array. Secondly, we make the pressure generator at 600 hPa and write down the output voltages of the sensor array, and then adjust the pressure generator back to 500 hPa. Thirdly, we set the pressure generator at 700 hPa and write down the output voltages of the sensor array, and then adjust the pressure generator back to 500 hPa. According to this method, the sensor array is used to measure the increased pressure until 1100 hPa. Similarly, one can apply the same method to obtain the output voltages of the sensor array while decreasing the pressure. Finally, the experiment results without compensation are shown in Table 3 and Figure 9, where measurement data are obtained at 50 °C, 30 °C, 10 °C, 0 °C and −20 °C. It is not difficult to find that the array of MEMS pressure sensors has hysteresis effects, and the influence of temperature is significant. The maximum difference value during the pressure increasing and pressure decreasing cycle (hysteresis error) is 0.05 mV. This will lead to a 0.7 hPa (0.11%FS) error at −20 °C, as shown in Figure 9b, it is noted that many hysteresis errors are more than 0.4 hPa. For the high-precision meteorological pressure sensor, these errors are large enough to potentially affect its measurement accuracy. Fortunately, these hysteresis errors can be weakened through the self-correcting ability of the GA-WNN compensation algorithm.
After dealing with hysteresis effects by the GA-WNN compensation algorithm, Table 4 lists the corrected atmospheric pressures by data fusion in the pressure increasing and decreasing cycle. From Table 4, it can be found that most of the hysteresis errors at different temperatures have been decreased, and the maximum error between the corrected pressures in the pressure-increasing (the pressure-decreasing) process and the calibration pressure is within 0.4 hPa. In other words, the maximum error of the low cost piezoresistive MEMS-array pressure transmitter proposed by us is within 0.04% of its full-scale value. As plotted in Figure 10, the vast majority of the absolute hysteresis errors after compensation by using the GA-WNN algorithm are distributed below 0.4 hPa, and the impact of temperature on hysteresis errors is reduced. This shows that the low cost MEMS-array pressure transmitter based on the GA-WNN compensation algorithm can reduce hysteresis effectively and meet the basic requirement of meteorological operations.
Table 3. The output voltage of the sensor array without compensation during the pressure increasing and pressure decreasing cycle at 50 °C, 30 °C, 10 °C, 0 °C, and −20 °C.
TemperatureP/hPa50060070080090010001100
T = 50 °CUinc/mV30.2636.3542.4448.5254.5960.6766.74
Udec/mV30.2936.3842.4448.5454.6166.6966.74
T = 30 °CUinc/mV31.4437.7844.1150.4456.7763.0969.41
Udec/mV31.4737.8144.1450.4756.7963.1169.41
T = 10 °CUinc/mV32.6339.2445.8552.4559.0565.6572.23
Udec/mV32.6639.2745.8852.4859.0765.6572.23
T = 0 °CUinc/mV33.2039.9546.7053.4460.1866.9073.62
Udec/mV33.2239.9746.7253.4660.1966.9173.63
T = −20 °CUinc/mV34.3741.4448.5155.5762.6169.6676.70
Udec/mV34.4241.4848.4555.5962.6469.6976.70
Figure 9. (a) The hysteresis error of the sensor array output signal at different temperatures. (b) The corresponding pressure hysteresis error at different temperatures.
Micromachines 06 00554 g009
Table 4. The compensated and corrected pressures during the pressure increasing and pressure decreasing cycle at 50 °C, 30 °C, 10 °C, 0 °C, and −20 °C.
TemperatureP/hPa50060070080090010001100
T = 50 °CPinc/hPa499.7599.8700.0800.2900.31000.31100.3
Pdec/hPa500.2600.4700.3800.3900.41000.31100.4
T = 30 °CPinc/hPa499.7599.7699.6799.8899.8999.81099.8
Pdec/hPa499.6599.9700.0800.1900.11000.01099.9
T = 10 °CPinc/hPa499.7599.7699.6799.6899.7999.71099.7
Pdec/hPa499.7599.9699.9800.0900.0999.91099.7
T = 0 °CPinc/hPa499.6599.8699.7799.8899.7999.81099.8
Pdec/hPa499.9600.0700.0800.0900.0999.91099.8
T = −20 °CPinc/hPa499.6599.9699.8799.7899.81000.31099.7
Pdec/hPa499.6599.7699.6799.6899.6999.61099.6
Figure 10. The hysteresis error after compensation by using the GA-WNN algorithm at 50 °C, 30 °C, 10 °C, 0 °C, and −20 °C.
Micromachines 06 00554 g010

3.4. Long-Term Drift Compensation

The long-term drift of the MEMS pressure sensor as a result of its aging is one of the important constraints for its practical applications. The aging of the sensor material is a very slow process at room temperature and thus results in continuous changes with time in the structure of pressure sensor (creep) and its physical parameters. It is noted that none of the stabilizing treatments can prevent the aging completely, so data fusion techniques should be utilized to compensate the long-term drift [11,23]. In the paper, the long-term drift compensation for the array of pressure sensors is based on periodic training of the GA-WNN compensation algorithm, which has the capability to learn dynamic systems through a retraining process using new data patterns. Figure 11a,b illustrate the compensated results based on the GA-WNN data fusion, which uses the data set after piezoresistive pressure sensors were stored for 3 and 6 months at room temperature, respectively. It may be clearly seen that the overall error is about 0.4 hPa (0.04% of its full-scale value), which shows that the GA-WNN algorithm can be used to minimize the sensor error due to long-term drift.
Figure 11. The errors between the corrected pressures of the digital MEMS-array pressure transmitter by data fusion and the calibration pressures from the Fluke pressure generator at different temperatures. (a) After the storage for 3 months. (b) After the storage for 6 months.
Micromachines 06 00554 g011

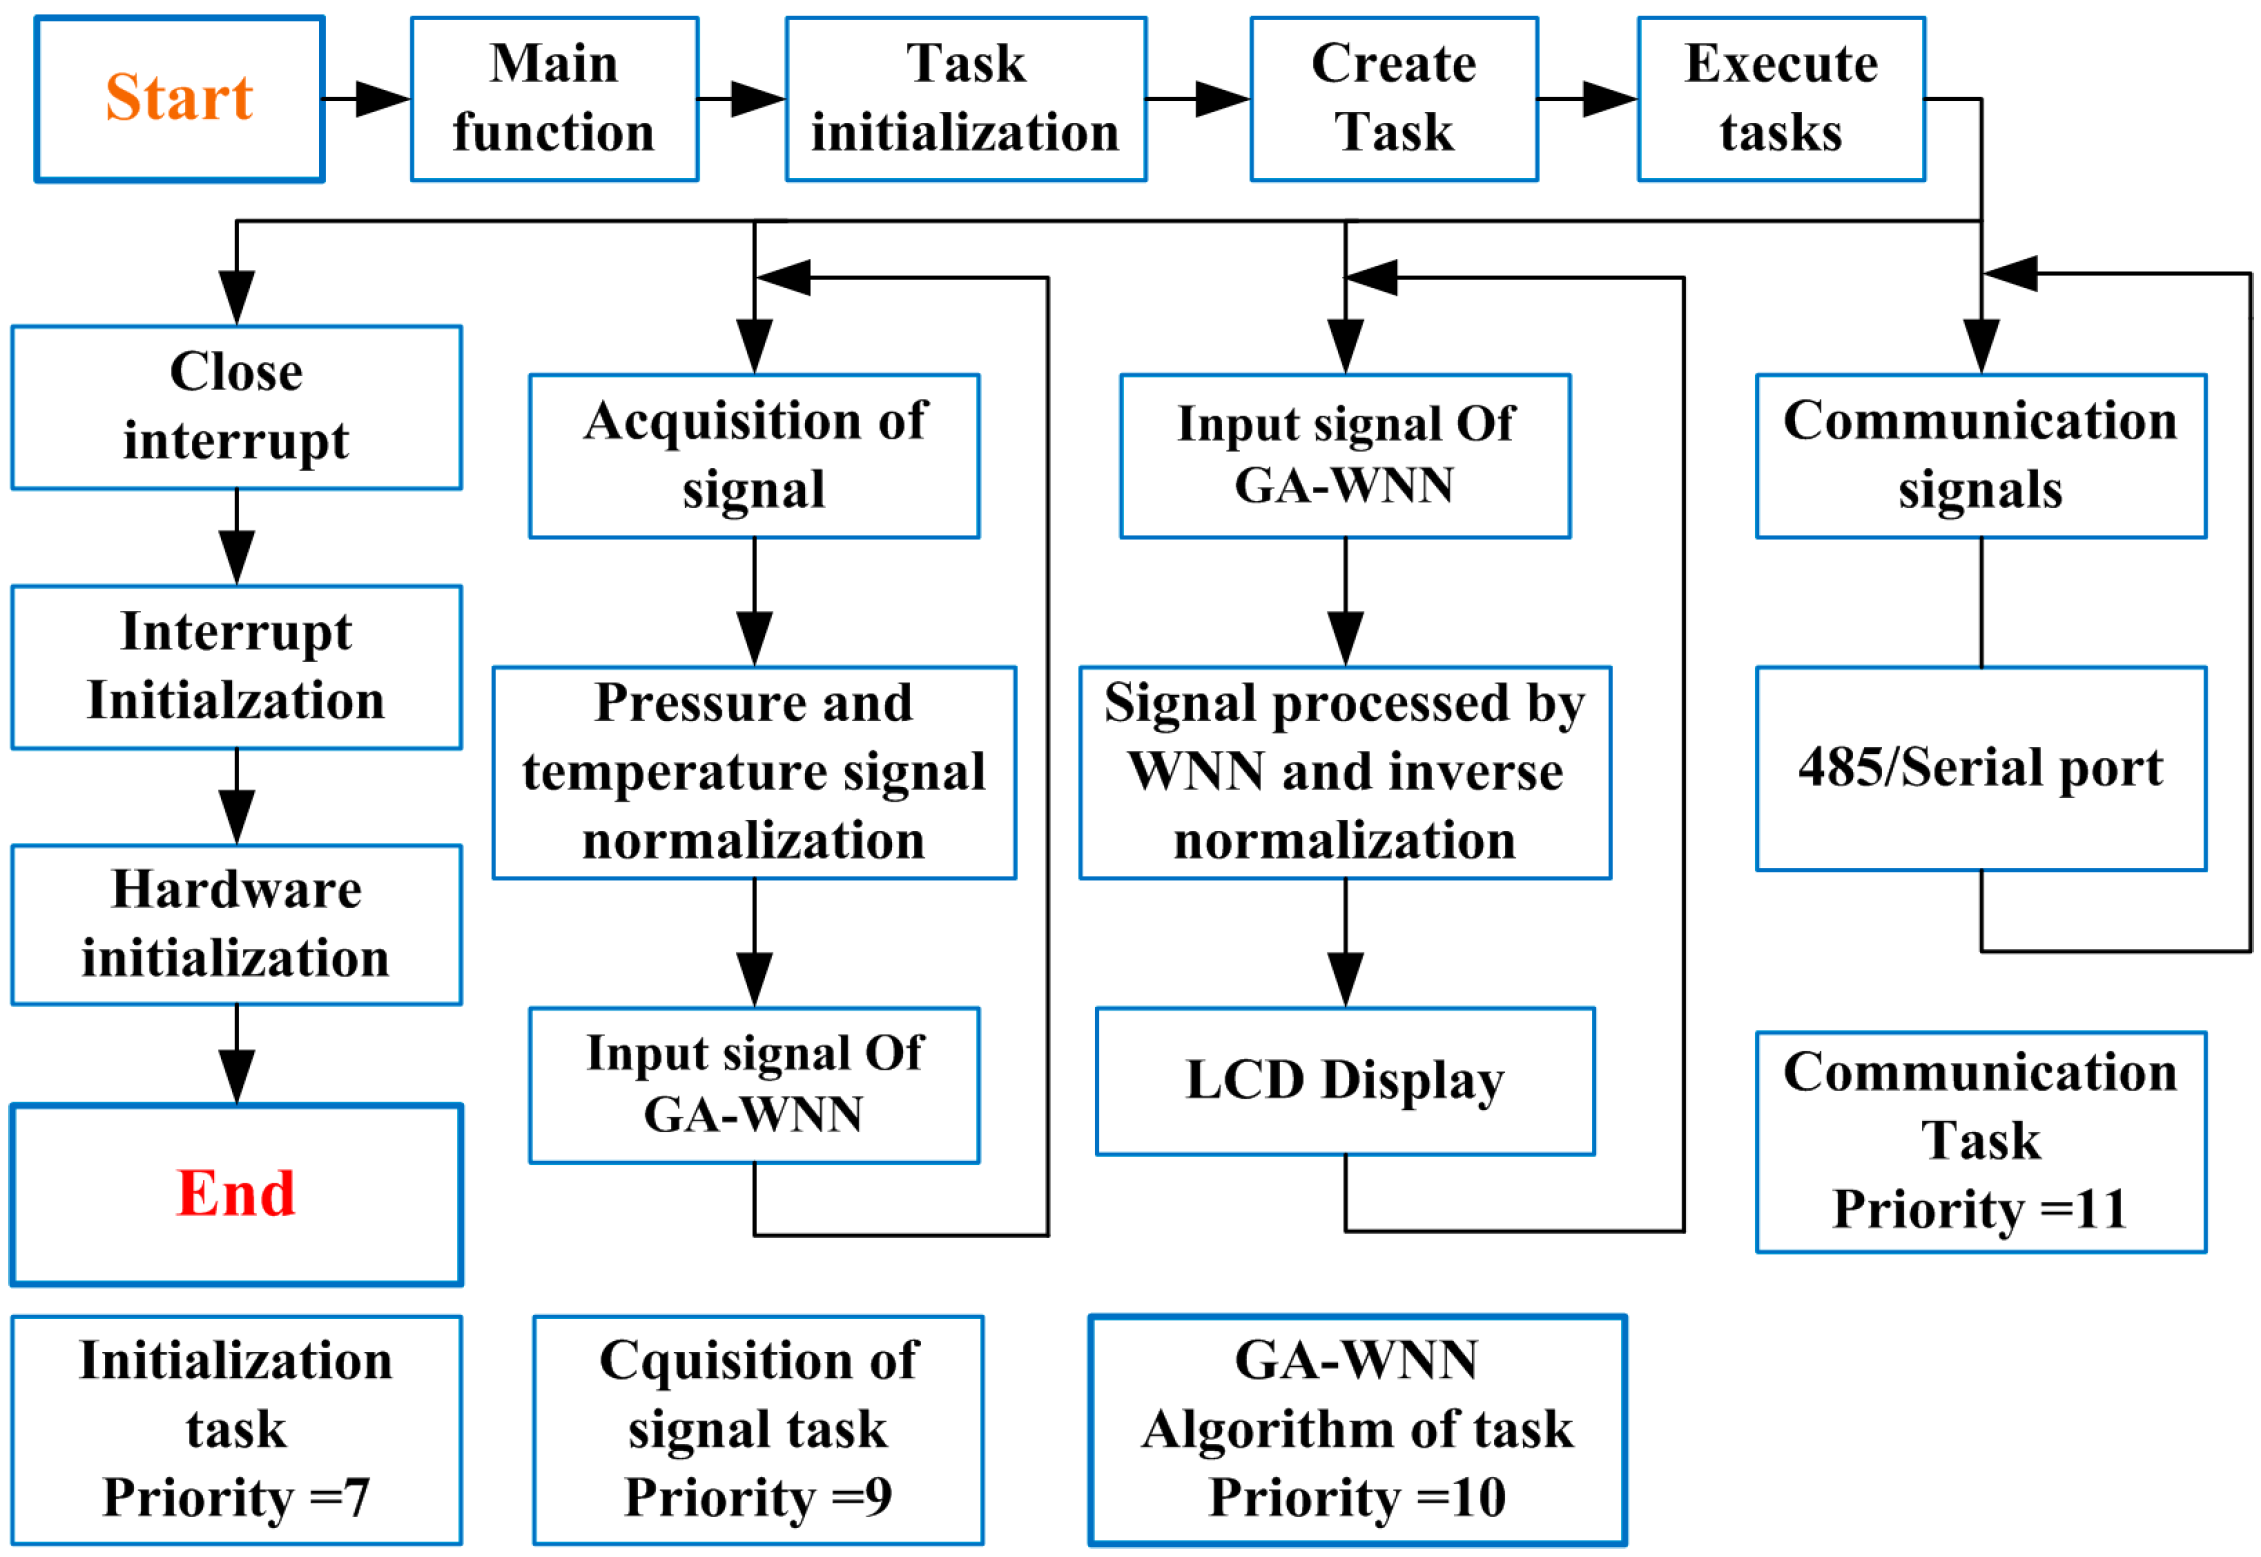
3.5. The Embedded Implementation Process

As mentioned above, the GA-WNN compensation algorithm is firstly realized by MATLAB program. The final weight (vji), threshold (ωkj), shift factor (bj) and scale factor (aj) of the trained network are stored as the type of array in the flash memory. According to the GA-WNN compensation algorithm in MATLAB, the program code is then rewritten in C language and now runs under the µC/OS-II operating system [24,25]. The software implementation process for the GA-WNN algorithm in the µC/OS-II operating system using STM32 microprocessor is presented in Figure 12. It can be observed that the software implementation process is comprised of four main tasks, and the priority is determined by both the order of the task and its impact on system security. Furthermore, for hardware implementation of the trained GA-WNN algorithm model of the sensor array, the pressure and temperature outputs of the measurement circuits are required as the input parameters to the STM32. The outputs of the sensors are scaled to provide the normalized values for the training GA-WNN algorithm in the microprocessor. Figure 13 gives the interactive interface of piezoresistive MEMS-array pressure transmitter, which provides the viewer with the dynamic pressure curve, and lets users utilize it simply and enjoyably.
Figure 12. Software implementation process for the GA-WNN compensation algorithm in the µC/OS-II operating system.
Micromachines 06 00554 g012
Figure 13. Interactive interface system of high-precision, low cost piezoresistive MEMS-array pressure transmitter based on the μC/OS and μCGUI.
Micromachines 06 00554 g013

4. Conclusions

The output signal of traditional silicon piezoresistive pressure sensor in full scale is nonlinear, and its zero point and sensitivity will drift with temperature changing, and the hysteresis and long-term drift are relatively large too. Therefore, the overall precision is very low. In light of the above reasons, the piezoresistive pressure sensor is rarely applied in meteorological measurement, but it has the significant advantage of low cost and mass production. In this study, we offer a versatile compensation method based on data fusion by using the GA-WNN algorithm and the array average measurement of MEMS pressure sensors for compensating and correcting the outputs of the silicon piezoresistive pressure sensors. Using the array of MEMS pressure sensors, removing the maximum and minimum value and averaging the rest not only can eliminate the bad data but also can reduce the intrinsic random error of the sensor due to creep. What is more, the GA-WNN algorithm can significantly reduce the temperature drift, hysteresis effect and long-term drift. The results of comparative experiments confirm that the compensation method is effective and can greatly improve the measuring accuracy of the piezoresistive pressure sensors. Finally, the GA-WNN model is implemented in hardware by using the STM32 microcontroller combined with an embedded real time operating system µC/OS-II to make the MEMS-array sensor output be direct digital readout, and the interactive interface is also given. The maximum error of the low cost digital piezoresistive MEMS-array pressure transmitter proposed by us is within 0.04% of its full-scale value. Therefore, the high-precision pressure transmitter that can be applied in a wide range of temperatures and pressures meets the basic requirements of the meteorological industry.

Acknowledgments

This project is supported by the National Natural Science Foundation of China (Nos. 61306138, 61307113, 41275042), Natural Science Foundation of Jiangsu Province (No. BK2012460) and the Priority Academic Program Development of Jiangsu Higher Education Institutions (PAPD). All the authors gratefully acknowledge their support.

Author Contributions

All work with relation to this paper have been accomplished by all authors’ efforts. Yusheng Wu performed most of the experiments and the fabrication. The idea and design of MEMS-array digital pressure transmitter based on genetic wavelet neural network were proposed by Jiahong Zhang and Qingquan Liu. The experiments of the pressure transmitter were completed with help from Xiaoli Mao, and Min Li. Fang Gu prepared the figures and organized the paper. Jiahong Zhang and Yusheng Wu wrote the manuscript. Lastly, every segment related to this paper was accomplished under the guidance of Jiahong Zhang. All authors reviewed the manuscript.

Conflicts of Interest

The authors declare no conflict of interest.

References

  1. Elliott, W.P.; Ross, R.J. Effects on climate records of changes in national weather service humidity processing procedures. J. Clim. 1998, 11, 2424–2436. [Google Scholar] [CrossRef]
  2. Wick, G.A.; Neiman, P.J.; Ralph, F.M.; Hamill, T.M. Evaluation of forecasts of the water vapor signature of atmospheric rivers in operational numerical weather prediction models. Weather Forecast. 2013, 28, 1337–1352. [Google Scholar] [CrossRef]
  3. Hautefeuille, M.; O’Flynn, B.; Peters, F.H.; O’Mahony, C. Development of a Microelectromechanical system (MEMS)-based multisensor platform for environmental monitoring. Micromachines 2011, 2, 410–430. [Google Scholar] [CrossRef]
  4. Nagesh, C.; Paily, R.P. Fabrication and testing of an osmotic pressure sensor for glucose sensing application. Micromachines 2014, 5, 722–737. [Google Scholar] [CrossRef]
  5. Dumont-Fillon, D.; Tahriou, H.; Conan, C.; Chappel, E. Insulin micropump with embedded pressure sensors for failure detection and delivery of accurate monitoring. Micromachines 2014, 5, 1161–1172. [Google Scholar] [CrossRef]
  6. Patra, J.C.; Panda, G.; Baliarsingh, R. Artificial neural network-based nonlinearity estimation of pressure sensors. IEEE Trans. Inst. Meas. 1994, 43, 874–881. [Google Scholar] [CrossRef]
  7. Khan, S.A.; Shahani, D.T.; Agarwala, A.K. Sensor calibration and compensation using neural network. ISA Trans. 2003, 42, 337–352. [Google Scholar] [CrossRef] [PubMed]
  8. Islam, T.; Ghosh, S.; Saha, H. ANN-based signal conditioning and its hardware implementation of a nanostrucured porous silicon relative humidity sensor. Sens. Actuators B Chem. 2006, 120, 130–141. [Google Scholar] [CrossRef]
  9. Pramanik, C.; Islam, T.; Saha, H. Temperature compensation of piezoresistive micro-machined porous silicon pressure sensor by ANN. Microelectron. Reliab. 2006, 46, 343–351. [Google Scholar] [CrossRef]
  10. Li, X.; Liu, Q.; Pang, S.X.; Xu, K.X.; Tang, H.; Sun, C.S. High-temperature piezoresistive pressure sensor based on implantation of oxygen into silicon wafer. Sens. Actuators A Phys. 2012, 179, 277–282. [Google Scholar] [CrossRef]
  11. Wang, X.; Ye, M. Hysteresis and nonlinearity compensation of relative humidity sensor using support vector machines. Sens. Actuators B Chem. 2008, 129, 274–284. [Google Scholar] [CrossRef]
  12. Murugan, S.; Umayal, S.P. A review on enhancing the linearity characteristic of different types of transducers-a comparative study. Int. J. Mod. Eng. Res. 2013, 3, 1186–1191. [Google Scholar]
  13. Islam, T.; Saha, H. Hysteresis compensation of a porous silicon relative humidity sensor using ANN technique. Sens. Actuators B Chem. 2006, 114, 334–343. [Google Scholar] [CrossRef]
  14. Gao, M.J.; Hu, L.M. Research on nonlinear emendation of pressure sensor based on the genetic wavelet neural network. Chin. J. Sens. Actuators 2007, 20, 816–819. (In Chinese) [Google Scholar]
  15. Zhang, J.H.; Fu, Y.; Ge, Y.X.; Gu, F.; Yao, J.H.; Huang, Q.; Li, M. The study on the application of GA-BP neural network in the pneumatic pressure-type relative altimeter. Chin. J. Sens. Actuators 2014, 27, 1002–1008. (In Chinese) [Google Scholar]
  16. Du, Z.M.; Jin, X.Q.; Yang, Y.Y. Fault diagnosis for temperature, flow rate and pressure sensors in VAV systems using wavelet neural network. Appl. Energy 2009, 86, 1624–1631. [Google Scholar] [CrossRef]
  17. Zhao, H.; Mi, Y.H. Approaches to realize temperature compensation of pressure sensor based on genetic wavelet neural network. In Proceedings of 6th International Conference on Natural Computation (ICNC 2010), Yantai, China, 10–12 August 2010.
  18. Shi, Y.; Han, Q.L.; Lian, Q.X. The Method of Neural Network Design and Example Analysis; The Publishing House of Beijing University of Posts and Telecommunications: Beijing, China, 2009; pp. 77–86. (In Chinese) [Google Scholar]
  19. Kermani, B.G. Using neural network and genetic algorithm to enhance performance in an electronic nose. IEEE Trans. Biomed. Eng. 1999, 46, 429–439. [Google Scholar] [CrossRef] [PubMed]
  20. Yang, S.L.; Ma, J.J.; Wang, C.H.; Zhang, S.M. Prediction of short-term transportation flow based on optimizing wavelet neural network by genetic algorithm. Adv. Mater. Res. 2013, 694–697, 2715–2720. [Google Scholar] [CrossRef]
  21. Sahay, R.R.; Srivastava, A. Predicting monsoon floods in rivers embedding wavelet transform, genetic algorithm and neural network. Water Resour. Manag. 2014, 28, 301–317. [Google Scholar] [CrossRef]
  22. Fraden, J. HandBook of Modern Sensors, Physics: Design and Applications; Springer: Berlin, Germany, 2003; pp. 20–21. [Google Scholar]
  23. Islam, T.; Saha, H. Study of long-term drift of a porous silicon humidity sensor and its compensation using ANN technique. Sens. Actuators A Phys. 2007, 133, 472–479. [Google Scholar] [CrossRef]
  24. Wu, Y.M.; Luo, H.J. Improvement of task scheduling and supervision mechanism in µC/OS-II system. Comput. Eng. 2009, 35, 266–268. (In Chinese) [Google Scholar]
  25. Wang, J.; Ye, R.Y. Optimization of µC/OS-II and its application in smart transmitters. Proc. Autom. Instr. 2010, 31, 5–7. [Google Scholar]

