1. Introduction
Here we demonstrate a micro-droplet assay for determination of ethanol concentration in cell cultures. As a proof-of-concept demonstration, we show the use of this assay to optimize ethanol production from the bacterium
Zymomonas mobilis (
Z. mobilis)—a microorganism which is considered one of the future sources of energy [
1]. The method that we report can provide a useful tool for droplet based methods for (i) studies of fermentation processes and (ii) optimization of incubation conditions.
In the face of depleting oil and gas resources, there is a growing interest in alternative energy sources. Biofuels, ecological sources of energy—mainly biodiesel and bioethanol—represent only a tiny fraction (<4%) of the total consumption of fuels [
2]. This motivates the growing interest in developing new genetically modified organisms [
3], e.g., enabling production of ethanol from lignocellulosic biomass [
4].
Z. mobilis is a Gram-negative bacterium which produces ethanol in anaerobic conditions. The productivity of ethanol reaches up to 12% (
w/
v), varies between strains and depends on conditions of incubation (concentration and types of carbon sources, temperature and pH) [
5,
6].
Z. mobilis offers several attractive features. These bacteria metabolize sugars into ethanol and carbon dioxide with few side products, which typically include glycerine, esters and higher alcohols [
7]. The lack of side products significantly increases the yield and decreases the complexity of downstream processes. Moreover,
Z. mobilis characterizes low biomass production (only 2% of the source of carbon is converted into biomass) [
6] and a high rate of metabolism of glucose through the Entner-Doudoroff pathway [
7]. Furthermore, these bacteria can ferment large variety of substrates and have high tolerance for osmotic stress [
6] and concentration of ethanol (up to 16%) [
8].
Typically, wild types of these bacteria are able to produce ethanol only from fructose and glucose [
9]. Much work is thus oriented towards (i) research of new wild types and (ii) genetic engineering. The first approach concentrates on searching for strains displaying the ability to metabolize other sugars, e.g., cellulose [
10] or xylose [
11]. The second approach focuses on inducing mutagenesis resulting in, e.g., ability to simultaneously use xylose and glucose by
Z. mobilis [
12] or an increase of tolerance for the presence of metabolite products [
13]. The widespread interest in the use of
Z. mobilis in production of biofuels motivates the search for precise and easy-to-use assays.
Droplet microfluidic systems offer powerful tools in screening of reaction conditions, e.g., Cao
et al. [
14,
15] and Churski
et al. [
16] independently presented the use of such systems in screening of two-dimensional interactions between antibiotics. Earlier, Song
et al. [
17], Damean
et al. [
18], Niu
et al. [
19], Sun
et al. [
20], Wang
et al. [
21] and Agresti
et al. [
22] reported systems to generate sequences of droplets scanning concentrations of one substance (up to four orders of magnitude) and used them to screening of biochemical reactions. Miller
et al. [
23] demonstrated a microfluidic system that exploits Taylor-Aris dispersion to create a concentration gradient within about 10,000 droplets per compound. Guo
et al. [
24] presented an optofluidic device for real-time, high-throughput (2000 droplets per second) quantitative analysis of droplet contents.
Microfluidics can also serve as a good platform in screening of reaction conditions for more efficient ethanol production by new mutants of Z. mobilis targeted to exhibit higher production of ethanol. Bacterial mutants can be encapsulated in thousands of microdroplets containing a range of compositions of reagents (e.g., sugars). Droplets with compositions which enable high production of ethanol can be detected with the use of the colorimetric assay described in this paper.
The most popular colorimetric method of determination of ethanol concentration uses two enzymes, alcohol oxidase (AOX) and horseradish peroxidase (HRP) and it is specific to ethanol. AOX oxidizes one mole of ethanol into one mole of acetaldehyde and one mole of H2O2 as a side product.
HRP catalyzes colorimetric reaction of two moles of H2O2 with a chromogen.
This colorimetric reaction can use a range of chromogenes, e.g.: (i) PSA and 4-AAP [
25,
26], (ii) 4-aminophenazone and chromotropic acid [
27], (iii) 3,3’,5,5’-tetramethylbenzidine (TMB) [
28], and (iv) phenazine methosulphate-3-(4,5-dimethylthiazol-2-yl)-2,5-diphenyltetrazolim bromide (PMS-MTT) [
29].
The limitation of the methods outlined above is in narrow dynamic range of concentration of ethanol that can be addressed, typically not wider than one order of magnitude [
25,
26,
27]. Further, the assays typically require great dilution of the sample, e.g., 2000-fold [
28]. The necessity to dilute is unwanted because it complicates the procedure and may significantly decrease the precision of the measurement. This is especially important in testing habitats of unknown yield of production of ethanol, as testing might require several repeated assays with different dilution ratios.
Chen
et al. [
30] used microfluidic technology to detect ethanol in small, undiluted samples. They used a chromium reduction in potassium dichromate. Their method can be used to determine concentrations ranging between 2% and 6% (
v/
v). Unfortunately this is not specific to ethanol; other alcohols and sugars can also reduce potassium dichromate.
Recently, Abalde-Cela
et al. [
31] showed a microdroplet platform for detection of ethanol-producing cyanobacteria with the use of above described enzyme assay consisted of AOX and HRP. They used Amplex Red (AR) which reacts with hydrogen peroxide and forms the fluorescent molecule, resorufin. They encapsulated cells with the use of flow-focusing junction. After 48 h of incubation they injected the picoliter droplets with the components of above enzymatic assay in a device comprising a microfluidic T-junction surrounded by two electrodes. Finally, they used this platform to distinguish the strain of cyanobacteria which had the highest productivity of ethanol. Although this procedure may introduce cross-contamination between droplets containing different strains or conditions for growth, this work shows the clear potential of droplet microfluidics for screening of large libraries of strains and conditions for the most effective production of biofuels.
Here we demonstrate an assay of ethanol concentration that provides an increased dynamic range and is compatible with droplet microfluidic screening technologies. The assay comprises two enzymes—alcohol oxidase (AOX) and horseradish peroxidase (HRP)—and a colorimetric readout system of phenol-4-sulfonic acid (PSA) and 4-aminoantipyrine (4-AAP). In our method the bacterial cultures, each contained in a separate droplet, are merged with discrete droplets comprising the reagents for the enzymatic assay, thus eliminating the risk of cross-contamination between cultures upon preparation of the assay. The method provides high repeatability (a relative error of measured ethanol concentration <5%), high specificity for ethanol, low consumption of reagents and over almost two logs in dynamic range (from 1 g·L−1 up to 70 g·L−1), potentially alleviating the need for dilution of the sample. As a model demonstration, we use the optimized assay to screen the ethanol productivity of Z. mobilis vs. the initial concentration of glucose.
2. Experimental Section
2.1. Chip Fabrication
We fabricated the microfluidic chips in polycarbonate. We milled microchannels with the use of CNC machine (Computer Numerical Control machine). Then, we bonded two polycarbonate slabs together by pressing them at 130 °C. We modified the surface of the polycarbonate channels with Aculon-E (Aculon Inc., San Diego, CA, USA) to increase their hydrophobic character.
2.2. Flow Rate Control
We pressurized perfluorinated oil FC 3283 (3M, Saint Paul, MN, USA) with 0.5% (w/v) of PFPE-PEG-PFPE (Z.D. CHEMIPAN, Warsaw, Poland) in pressure containers by connecting them to a source of pressurized air from a compressor. We controlled the overpressure in containers with the use of pressure reducers (Bosch Rexroth, Lohr am Main, Germany). Each container had four outlets, each outlet equipped with magnetic normally-closed valves (V165 V16, Sirai, Bussero, Italy). Application of 24 V opens the valve. We used oil as the continuous carrier phase. The aqueous samples were deposited directly onto the chip and driven by the flow of oil through the droplet-generation junctions and channels for cycling the droplets.
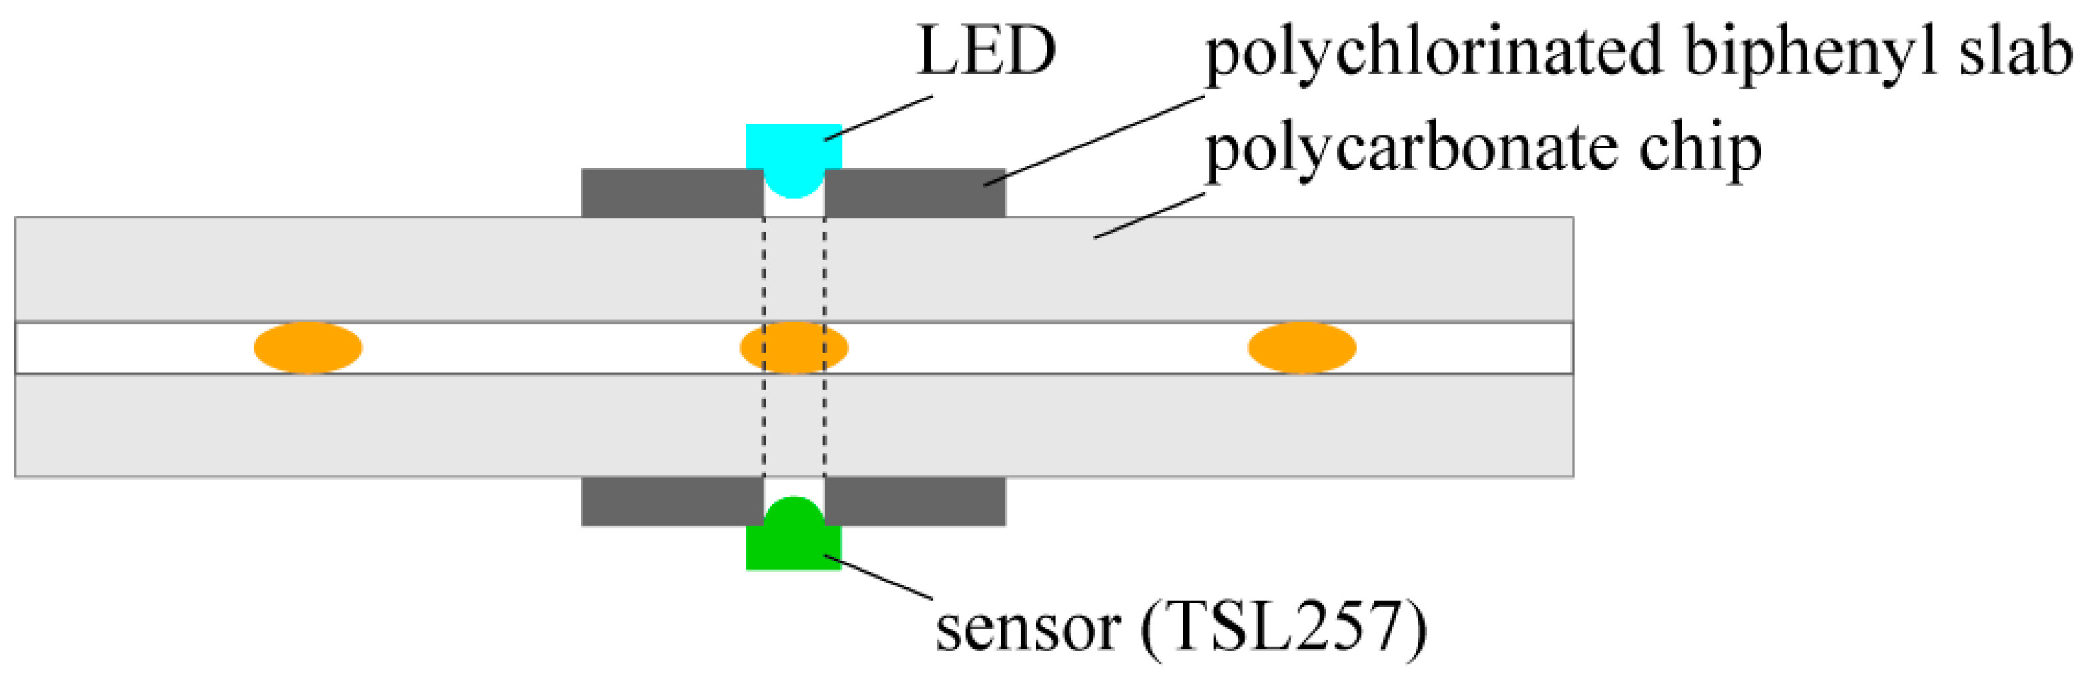
2.3. Detection of Droplets
We detected the position of droplets with the use of a high-sensitivity low-noise light-to-voltage optical converter (TSL257, AMS-TAOS USA INC., Plano, LA, USA) and a yellow led diode (HMIB-44WY-TR7, HUEY JANN ELECTRONICS, Taichung, Taiwan) which were connected to a digital input of the NI card port and a programmable current source board (based on the LT3092, Linear Technology, Milpitas, CA, USA), respectively. The electronic elements were located on the opposite sides of the chip
MERGE ca. 5 mm before a merging chamber to enable directly passing the light from an LED to a converter through the chip (
Figure 1). Prior to experiment, the light intensity was adjusted to the transparency of droplets and logic thresholds of the NI (National Instrument, Austin, TX, USA) card (a low/high state) with the use of the programmable current source board. The LabView software (National Instruments, Austin, TX, USA) interpreted a low/high state of the digital input as a presence/absence of a droplet under the sensor. Therefore, the whole process of the steering had feedback and hence the appropriate states of valves were set.
Figure 1.
Scheme of the integrated detector.
Figure 1.
Scheme of the integrated detector.
2.4. Microorganisms, Media and Growth Conditions
We obtained bacteria Z. mobilis (strain 3881) from the Agricultural University of Poznan, Poland. Bacteria were incubated in two stages. Firstly, we cultured them in a liquid medium containing 80 g·L−1 of glucose, 10 g·L−1 of yeast extract, 1 g·L−1 of KH2PO4, 1 g·L−1 of (NH4)2SO4, and 0.5 g·L−1 of MgSO4; pH = 6.8. After 24 h of incubation in 30 °C, we seeded bacteria into a fresh medium with the composition of: 10 g·L−1 of glucose, 5 g·L−1 of yeast extract, 2 g·L−1 of MgSO4; pH = 5.5, and incubated through the next 24 h in 30 °C. After that time, bacteria were suspended to optical density 0.2, what gives cell concentration of 1.15 × 10⁶ CFU·mL−1 and were ready to use them in the fermentation experiment. The medium for fermentation contained 5 g·L−1 of yeast extract, 2 g·L−1 of MgSO4 and glucose in two initial concentrations: 24 g·L−1 and 240 g·L−1. Further glucose was diluted in medium without glucose. Thus, we obtained final concentrations from 0 to 240 g.
3. Results and Discussion
3.1. Micro-Droplet System
Microfluidic droplet-on-demand systems [
14,
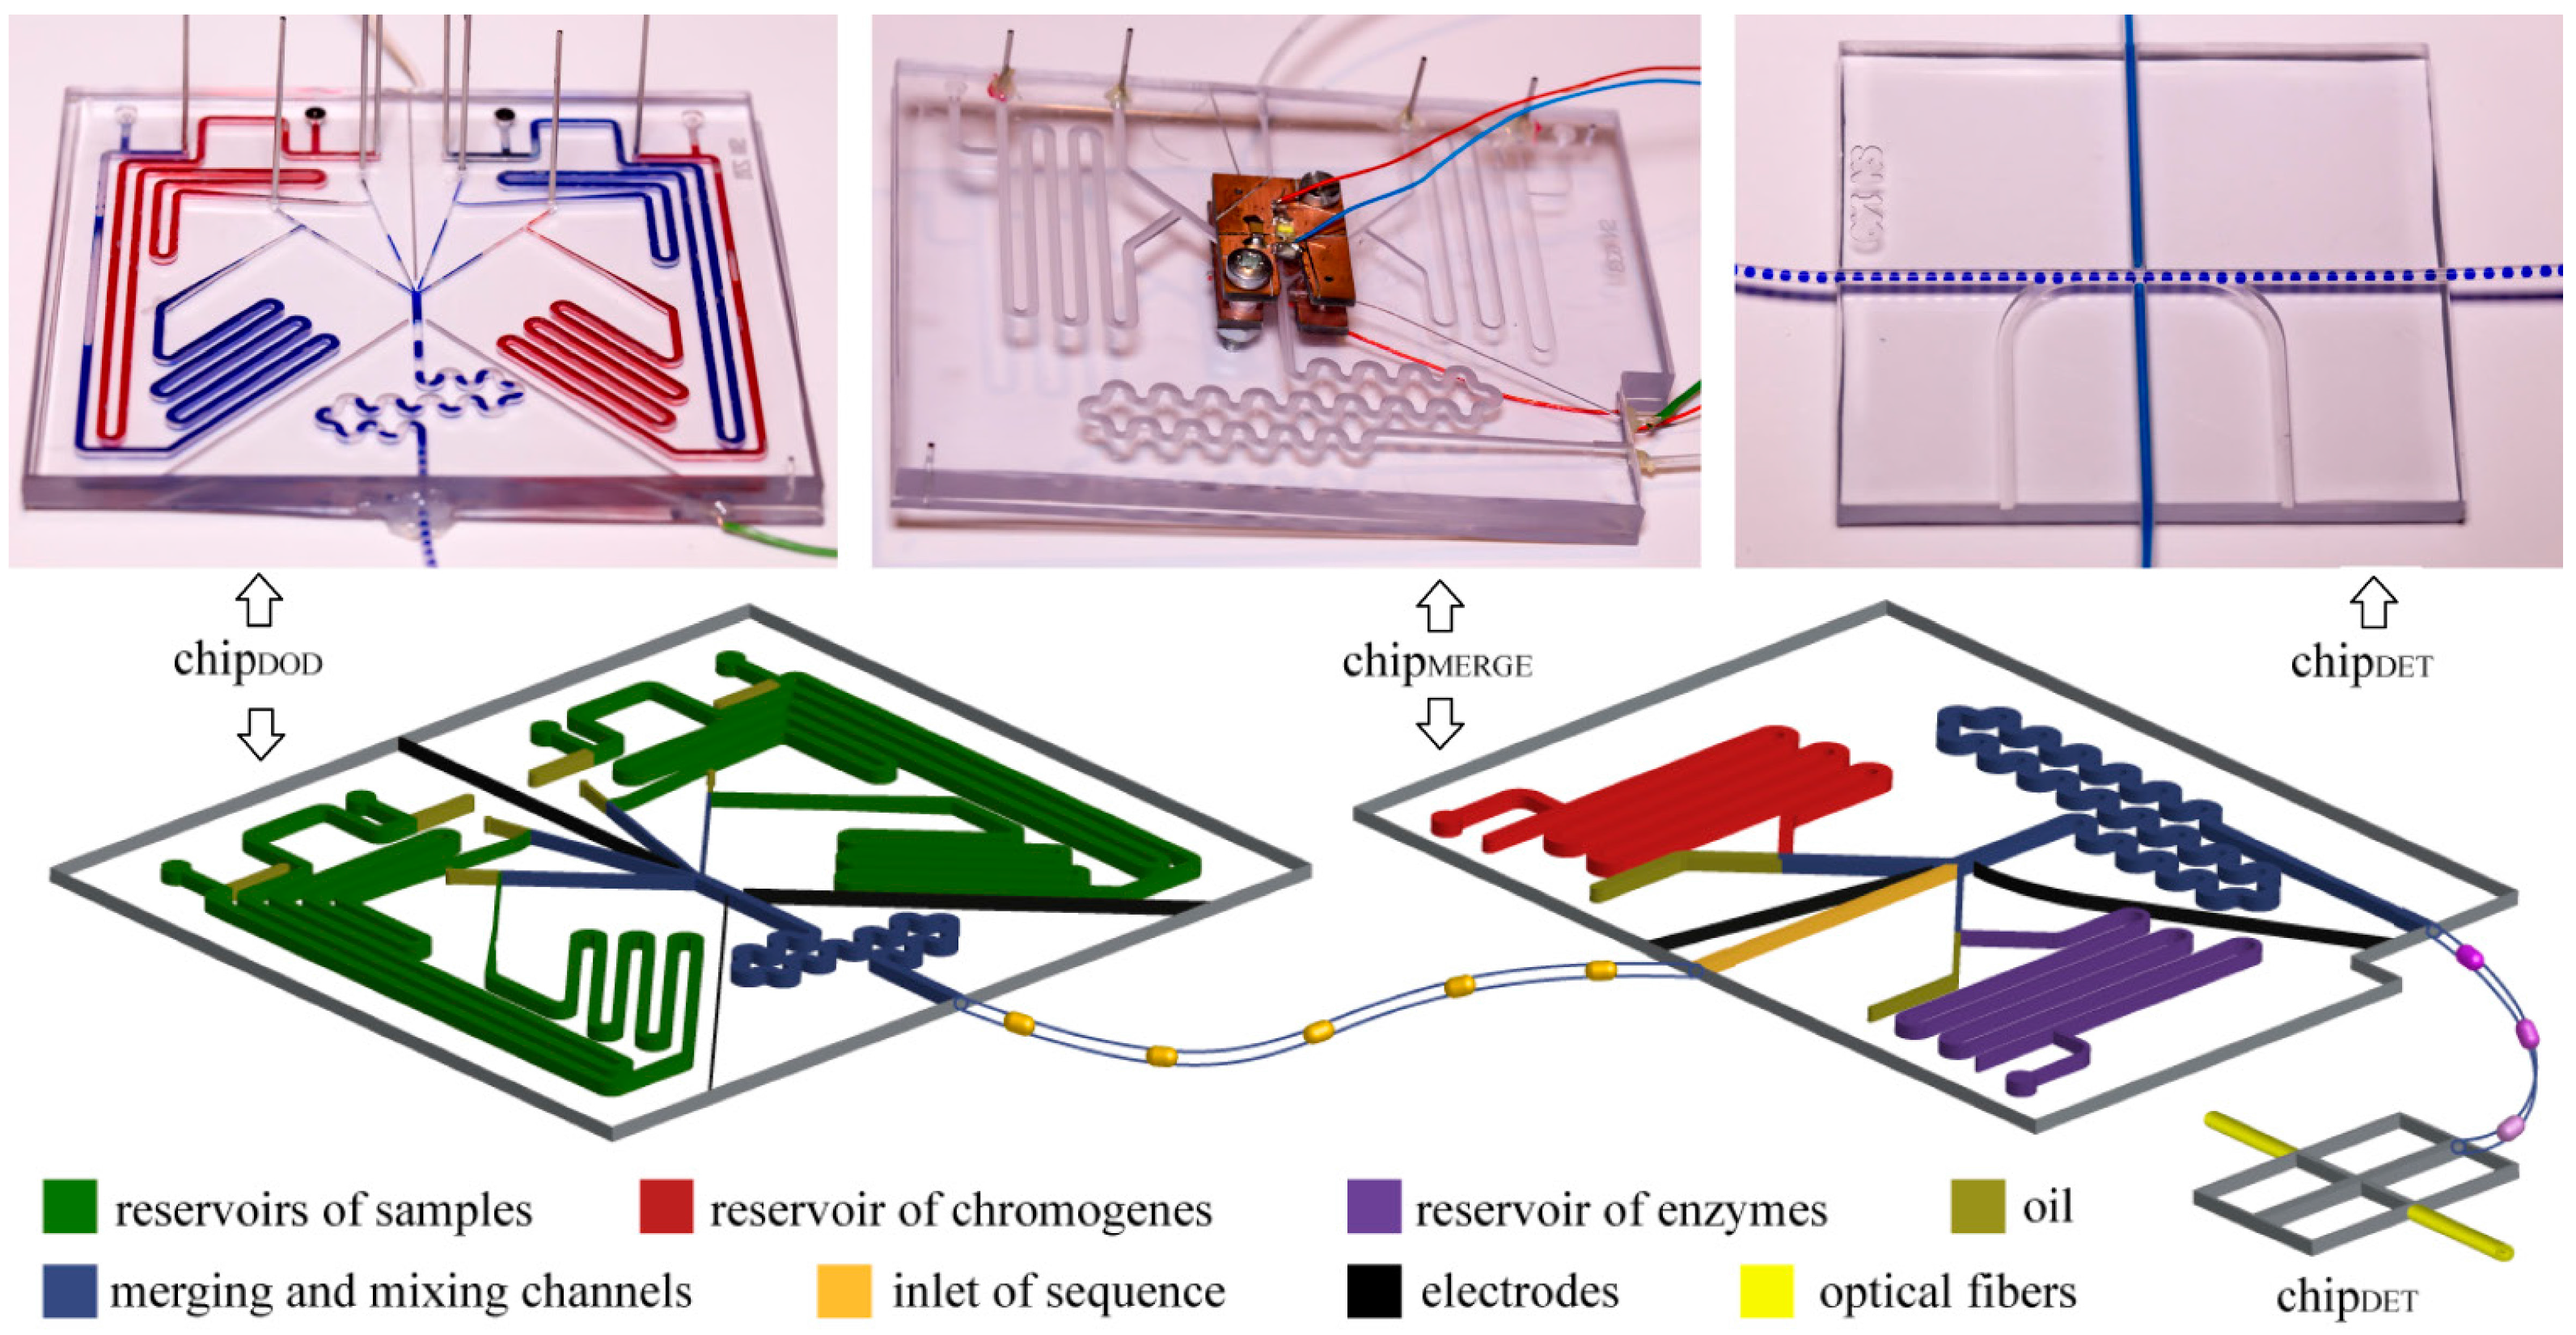
16] provide (i) high precision for metering small samples of liquid, (ii) precise control over mixing and chemical composition of droplets, and (iii) ability to control the time of reaction. We designed and fabricated a microfluidic system comprising three microfluidic chips that enable (i) generation of droplets with predefined composition, (ii) incubation of these droplets, (iii) merging post-fermentative droplets with droplets containing enzymes and chromogenes, and (iv) optical detection of concentration of ethanol in droplets (
Figure 2).
Figure 2.
Photographs and schematic illustrations of the microfluidic chips. The whole system includes: (i) chipDOD used to generate droplets of predefined composition, (ii) polyethylene tubing used to store the droplets for incubation, (iii) chipMERGE used to merge post-fermentative droplets with droplets containing chromogenes and enzymes, and (iv) chipDET used to measure the concentration of ethanol in droplets.
We generated droplets with predefined compositions with the use of the chip
DOD. We used this chip to generate “droplets on demand” [
14]. We generated these droplets in four T-junctions. The channels at the junction were 400 µm wide and 400 µm tall each. We used on-chip reservoir of samples—an additional channel that was 1 mm wide and 1 mm tall and accommodated a port for a pipette tip that terminated in a circular groove that housed an O-ring seal (I.D. 0.78 mm, O.D. 2.78 mm). Reservoirs on-chip minimize consumption of reagents and enable the use of samples with small volumes. Outlets of the T-junctions were connected to the merging chamber surrounded with three electrodes supplied with oscillating electric potential (~1.5 kV, 100 kHz) which induced coalescence of droplets. Electric fusion is necessary, because of addition of surfactant, which stabilizes droplets, to the oil phase. We generated droplets with final volumes from 1.4 µL to 2.1 µL, depending on an experiment, and at frequency of
ca. 0.33 Hz.
We incubated the droplets in a polyethylene tubing (I.D. 0.78 mm, O.D. 1.22 mm) coiled on 50 mL Falcon™ tubes. We disconnected the polyethylene tubing from a chip, closed the inlet and outlet of the tubing by connecting them and incubated the tubing. During incubation, droplets stayed in the tubing.
We used the chipMERGE to merge each of the post-fermentative droplets with a droplet containing a mixture of chromogenes (PSA and 4-AAP) and with a droplet containing a mixture of enzymes (AOX and HRP). The inlet channel (1.2 mm wide and 1.2 mm tall) was equipped with the photo-detector of the droplets ca. 5 mm upstream of the merging chamber. A signal signifying the arrival of a droplet triggered generation of droplets with chromogenes and enzymes in T-junctions supplied from on-chip reservoirs. The channels in the reservoir and junction sections were 1.2 mm wide and 1.2 mm tall channels for chromogenes and 400 µm wide and 400 µm tall for enzymes. Merging chamber was 1.2 mm wide and 1.2 mm tall and was surrounded with two electrodes that facilitate electrocoalescence. As the droplets containing the bacterial cultures were merged with droplets containing the reagents for the enzymatic assay, and not with a continuous stream of the reagents, our system completely eliminates the risk of cross-contamination between cultures upon preparation of the assay.
We measured optical absorbance of the indicator of concentration of ethanol in the chipDET. The chip coaxially aligns two optical fibers, connected to a light source and a spectrometer (USB2000+, Ocean Optics, Dunedin, FL, USA), perpendicularly to the axis of the polyethylene tubing (BD Intramedic, I.D. 0.78 mm, O.D. 1.22 mm).
Three chips were permanently connected with the use of polyethylene tubing, to eliminate any possibility of losing any of the droplets in the screen. Tubing was embedded in chips with the use of epoxy glue (Poxipol, Montevideo, Uruguay).
3.2. Colorimetric Assay
The measurement of concentration of ethanol should be independent of the presence of other components of fermentation broth. Vojnović
et al. [
25] shown that there is no significant influence on this colorimetric system of
d-galactose,
d-glucose, succinate, glycerol, and acetate.
where Q stands for the quinoneimine dye.
Typically in AOX/HRP assays the concentration of HRP is one order of magnitude higher than the concentration of AOX, e.g., Rodionov
et al. [
32] used assay with 4-AAP and 8-hydroxyquinoline, 6 U·mL
−1 of HRP and 0.75 U·mL
−1 of AOX. In contrast to standard assays, we used non-immobilized AOX and HRP.
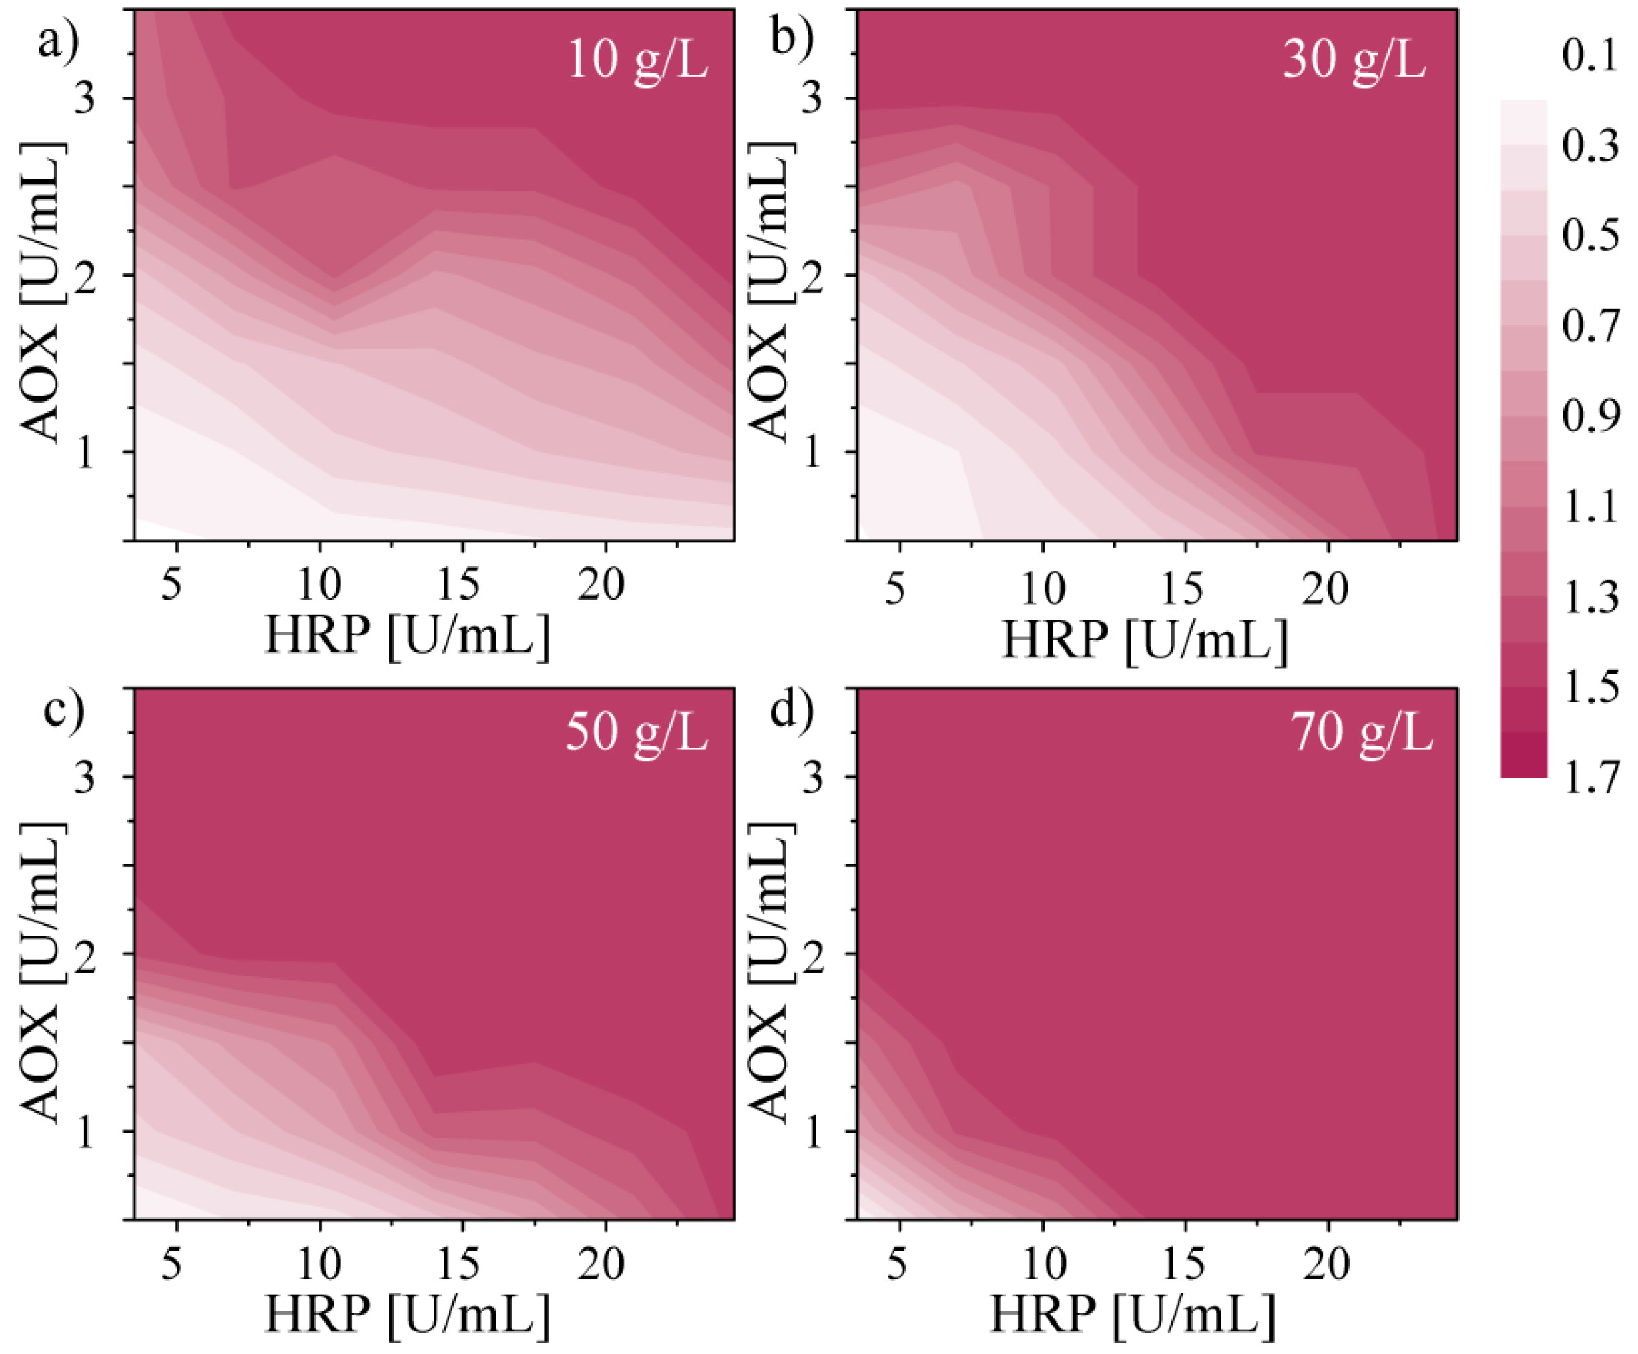
3.3. Role of the Concentration of Enzymes
In order to optimize composition of enzymes in our assay we performed two-dimensional screens of the role of concentrations of AOX and HRP. We filled reservoirs of the chip
DOD with (i) ethanol with chromogenes, (ii) solution of AOX, (iii) solution of HRP, and (iv) phosphate buffer. We generated 3 sequences of 49 droplets with a volume of 2.1 µL for each concentration of ethanol (10, 30, 50 and 70 g·L
−1). In each sequence the concentration of AOX varied from 0.5 to 3.5 U·mL
−1 and concentration of HRP varied between 3.5 and 24.5 U·mL
−1. Concentration of chromogenes in droplets was 0.4 mM of 4‑AAP, and 25 mM of PSA (composition optimized by Vojinović
et al. [
25]). As explained in detail below, we used a ratio of 1 to 8 between the volume of the sample of ethanol and the volume of the assay. This ratio is even ten-fold higher (
i.e., offering lower dilution of the sample) than typically used [
32]. This improvement stems from the use of non-immobilized enzymes. Because the consumption of enzymes in the micro-droplet assay is very low, the higher-than-typical use of enzymes does not significantly impair the cost of measurement. Nonetheless, as discussed below, the screen allows us to minimize the use of enzymes by tuning the concentrations to the expected range of concentrations of ethanol in bacterial cultures. After 20 min of incubation at room temperature we measured the absorbance of quinoneimine dye at 490 nm (
Figure 3).
We found that at higher concentrations of ethanol absorbance saturates at lower concentrations of enzymes. Z. mobilis (strain 3881) typically produces up to 70 g·L−1 of ethanol. We used the results of the screen to optimize the concentrations of enzymes in the droplets (0.75 U·mL−1 of AOX and 12 U·mL−1 of HRP) to provide for a wide dynamic range (up to 70 g·L−1) while at the same time minimizing the use of the enzymes.
Figure 3.
Maps of measured absorbance of quinoneimine dye at 490 nm with the use of enzymes AOX (0.5 to 3.5 U·mL−1) and HRP (3.5 to 24.5 U·mL−1) and chromogenes PSA (25 mM) and 4-AAP (0.4 mM) for four concentrations of ethanol (10, 30, 50 and 70 g·L−1). Absorbance was measured with the use of the chipDET.
3.4. Concentration of Chromogenes
Figure 3 also shows that the amount of chromogenes determine the dynamic range of the assay. Addition of higher volume of the solution of chromogenes to the sample of ethanol results in a shift of the dynamic range to higher concentrations. Moreover, an excessively high concentration of chromogenes, which are generally toxic to enzymes, in a droplet added to a post-fermentative droplet can result in fast deactivation of enzymes. Thus, we examined the concentration of chromogenes (the minimum ratio between the volume of the sample of ethanol and the volume of mixture of chromogenes and enzymes), which enables detection of the concentration of ethanol up to 70 g·L
−1.
We generated droplets with the use of the chip
DOD. We filled reservoirs with (i) ethanol (10, 30, 50 and 70 g·L
−1), (ii) mixture of chromogenes, (iii) mixture of enzymes, and (iv) phosphate buffer. For each concentration of ethanol we generated sequence of 9 droplets and we repeated each sequence 3 times. Volumes of droplets in the sequence increased linearly from 700 nL to 1500 nL. Final droplets contained 100 nL of sample of ethanol. In each droplet, the concentration of enzymes was: 0.75 U·mL
−1 of AOX and 12 U·mL
−1 of HRP, and the concentration of chromogenes was 0.4 mM of 4‑AAP, and 25 mM of PSA (composition optimized by Vojinović
et al. [
25]).
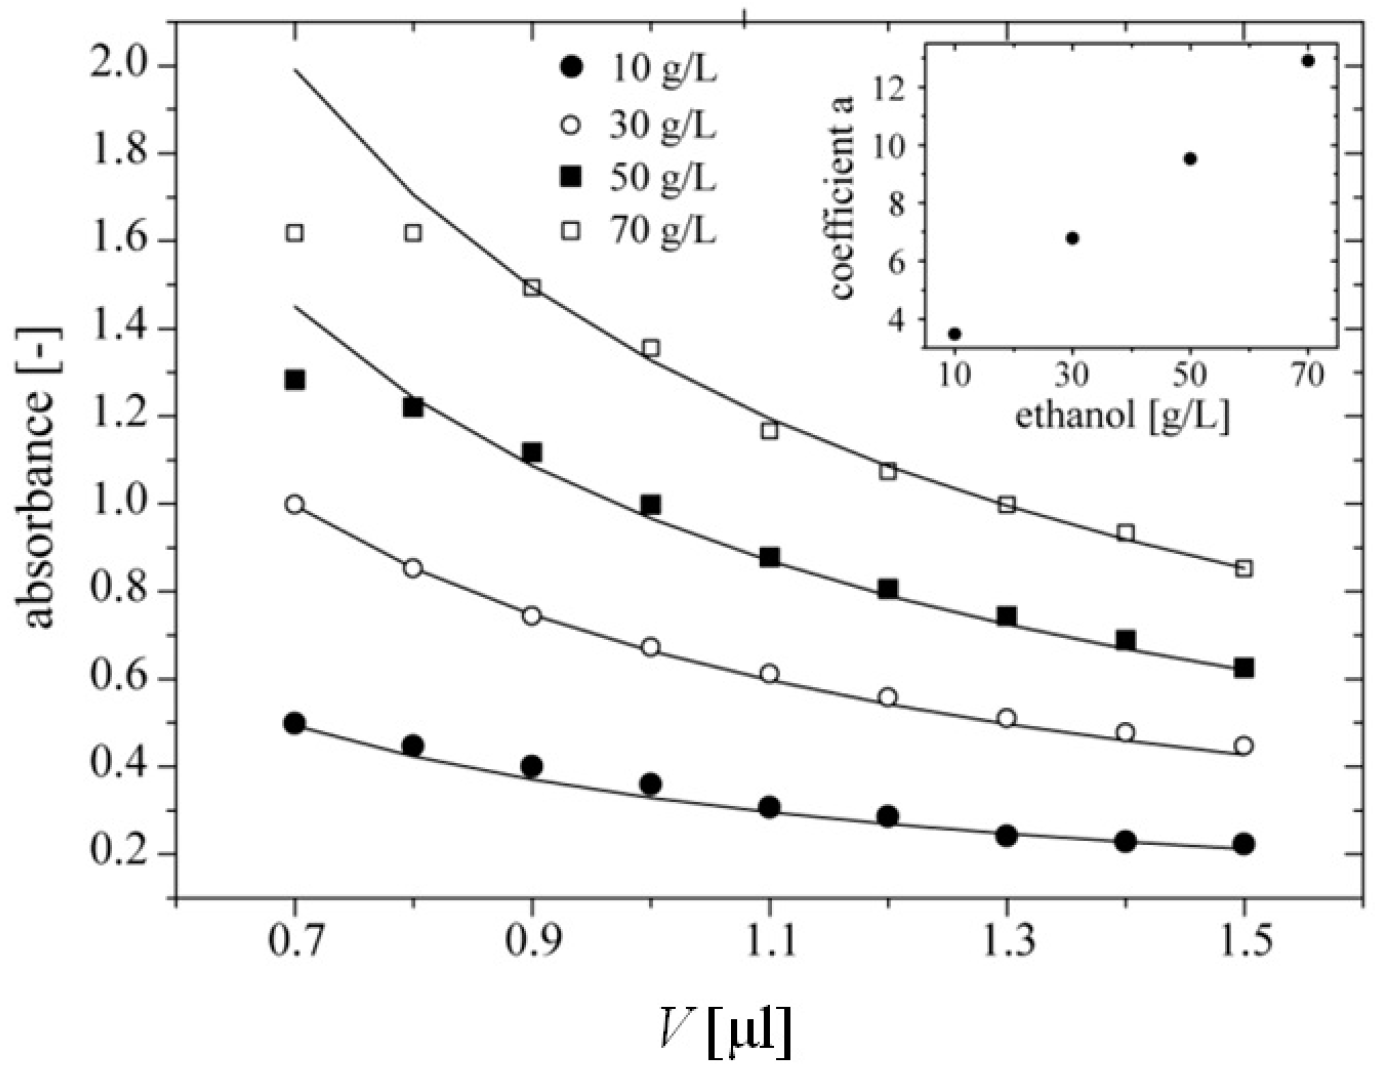
After 20 min of incubation at room temperature we measured the absorbance of quinoneimine dye at 490 nm (
Figure 4). The data should follow the relation
Abs =
a·(
V)
−1, where
V is the volume of the droplet. We fitted these theoretical curves to the series of measurements with the use of Origin 9.0 (OriginLab, Northampton, MA, USA). Coefficients “a” of these curves were: 3.5, 6.8, 9.5, 12.9 and grew proportionally to the concentration of ethanol (
Figure 4, Inset). We found that for droplets with volume lower than 900 nL, the measured absorbance saturates at concentrations of ethanol 50 and 70 g·L
−1. These droplets contained 100 nL of sample of ethanol and 800 nL of mixture of chromogenes (0.4 mM of 4‑AAP, and 25 mM of PSA) and enzymes (0.75 U·mL
−1 of AOX and 12 U·mL
−1 of HRP). This showed that merging post-fermentative droplet with chromogenes and enzymes with a volume ratio of 1:8 produces a final concentration of chromogenes at 0.35 mM of 4‑AAP, and 22.2 mM of PSA provides a dynamic range in this assay of up to 70 g·L
−1. This value is sufficient for the studies on fermentation of glucose by
Z. mobilis. Lower ratios of the volume of ethanol to the volume of mixture of chromogenes and enzymes result in saturation of absorption. The saturation can be circumvented with the use of a higher intensity for the light source.
Figure 4.
Dependence of absorbance of quinoneimine dye at 490 nm on the volume of a droplet. Each droplet contained 100 nL of sample of ethanol, enzymes (0.75 U·mL−1 of AOX and 12 U·mL−1 of HRP) and chromogenes (0.4 mM of 4‑AAP, and 25 mM of PSA). Inset shows linear dependence between coefficient “a” of fitted curves following equation Abs = a·(V)−1 and the concentration of ethanol in a 100 nL sample.
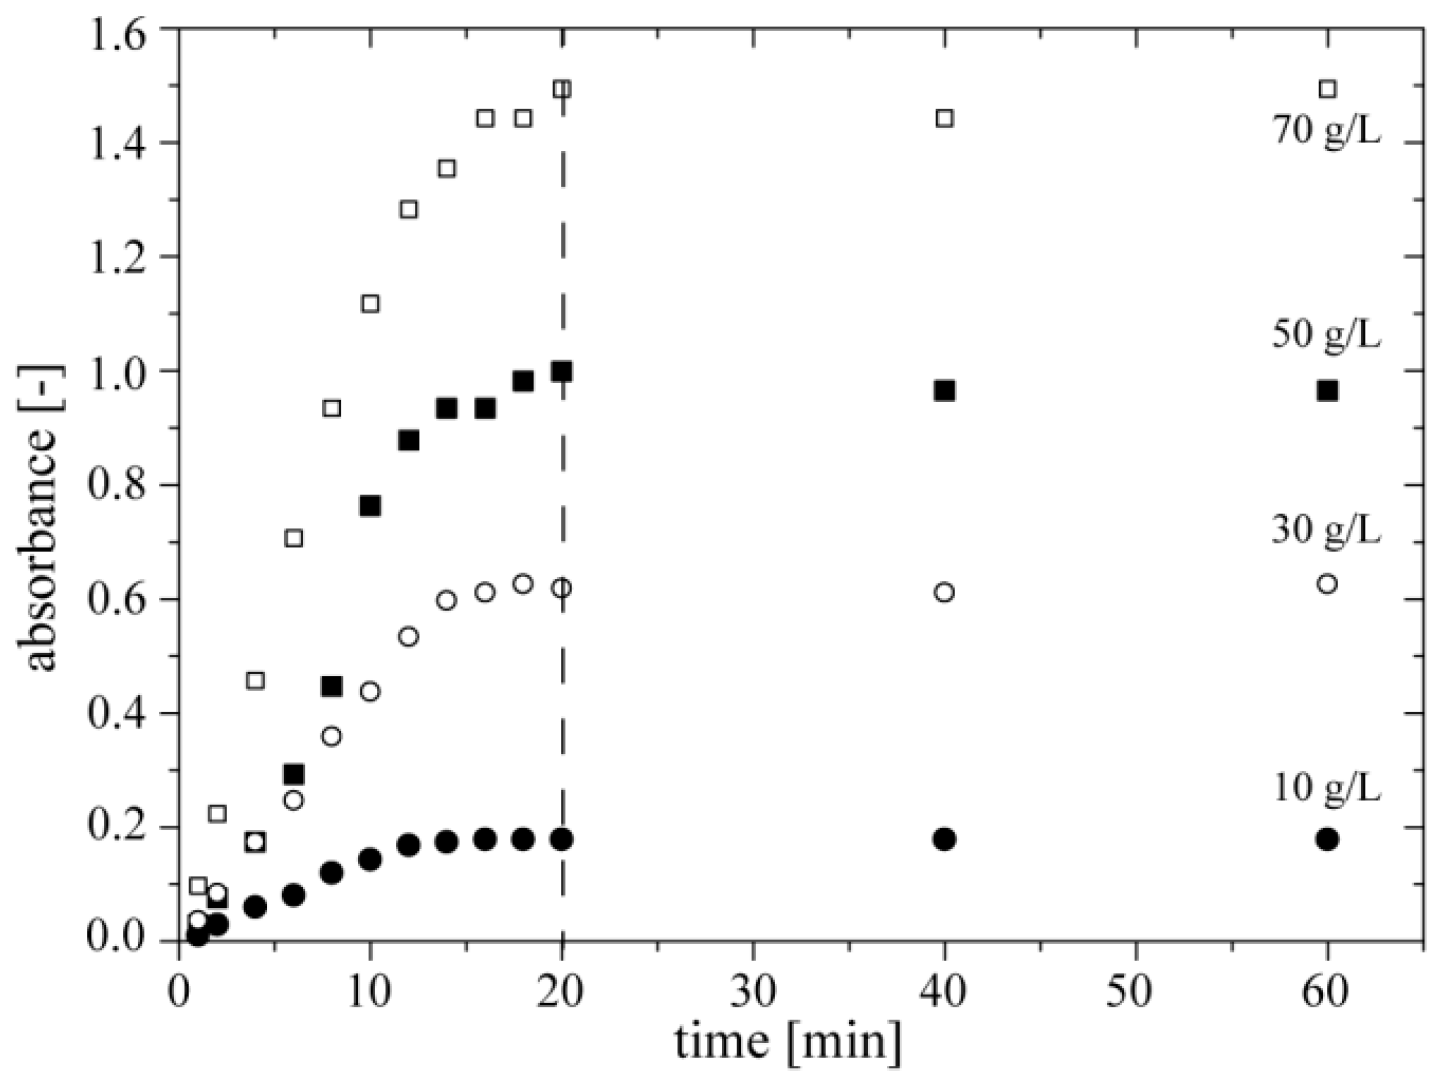
3.5. Time of Measurement
We also screened the kinetics of the colorimetric reaction for four different concentrations of ethanol. In this experiment we filled only three reservoirs of the chip
DOD with (i) ethanol (with concentrations of 10, 30, 50, and 70 g·L
−1), (ii) a mixture of enzymes and (iii) a mixture of chromogenes. We generated four sequences of 13 droplets, each repeated 3 times, by merging 100 nL of ethanol, 100 nL of a mixture of enzymes, and 900 nL of a mixture of chromogenes. We found that absorbance at 490 nm reaches the maximum after ~20 min of reaction. Therefore, in further experiments we measured absorbance of quinoneimine dye after 20 min of incubation (
Figure 5).
Figure 5.
Dependence of absorbance of quinoneimine dye at 490 nm on time of colorimetric reaction for four concentrations of ethanol (10, 30, 50 and 70 g·L−1).
Figure 5.
Dependence of absorbance of quinoneimine dye at 490 nm on time of colorimetric reaction for four concentrations of ethanol (10, 30, 50 and 70 g·L−1).
3.6. Dynamic Range
In the final step of optimization we tested the dynamic range for system of three chips, which consisted of: (i) the chip
DOD used to generate of droplets with different concentration of ethanol, (ii) the chip
MERGE used to merge this sequence with droplets with enzymes and chromogenes, and (iii) the chip
DET to detect optically absorbance of quinoneimine dye in droplets. We stored on the chip
DOD: (i) solutions of ethanol of two concentrations: 10 and 100 g·L
−1, and (ii) phosphate buffer. We generated 3 sequences of 20 droplets with volume of 2.1 µL and with the concentrations of ethanol between 1 and 100 g·L
−1. We filled the reservoirs on the chip
MERGE with (i) a mixture of enzymes and (ii) a mixture of chromogenes. On chip
MERGE we merged droplets generated on the chip
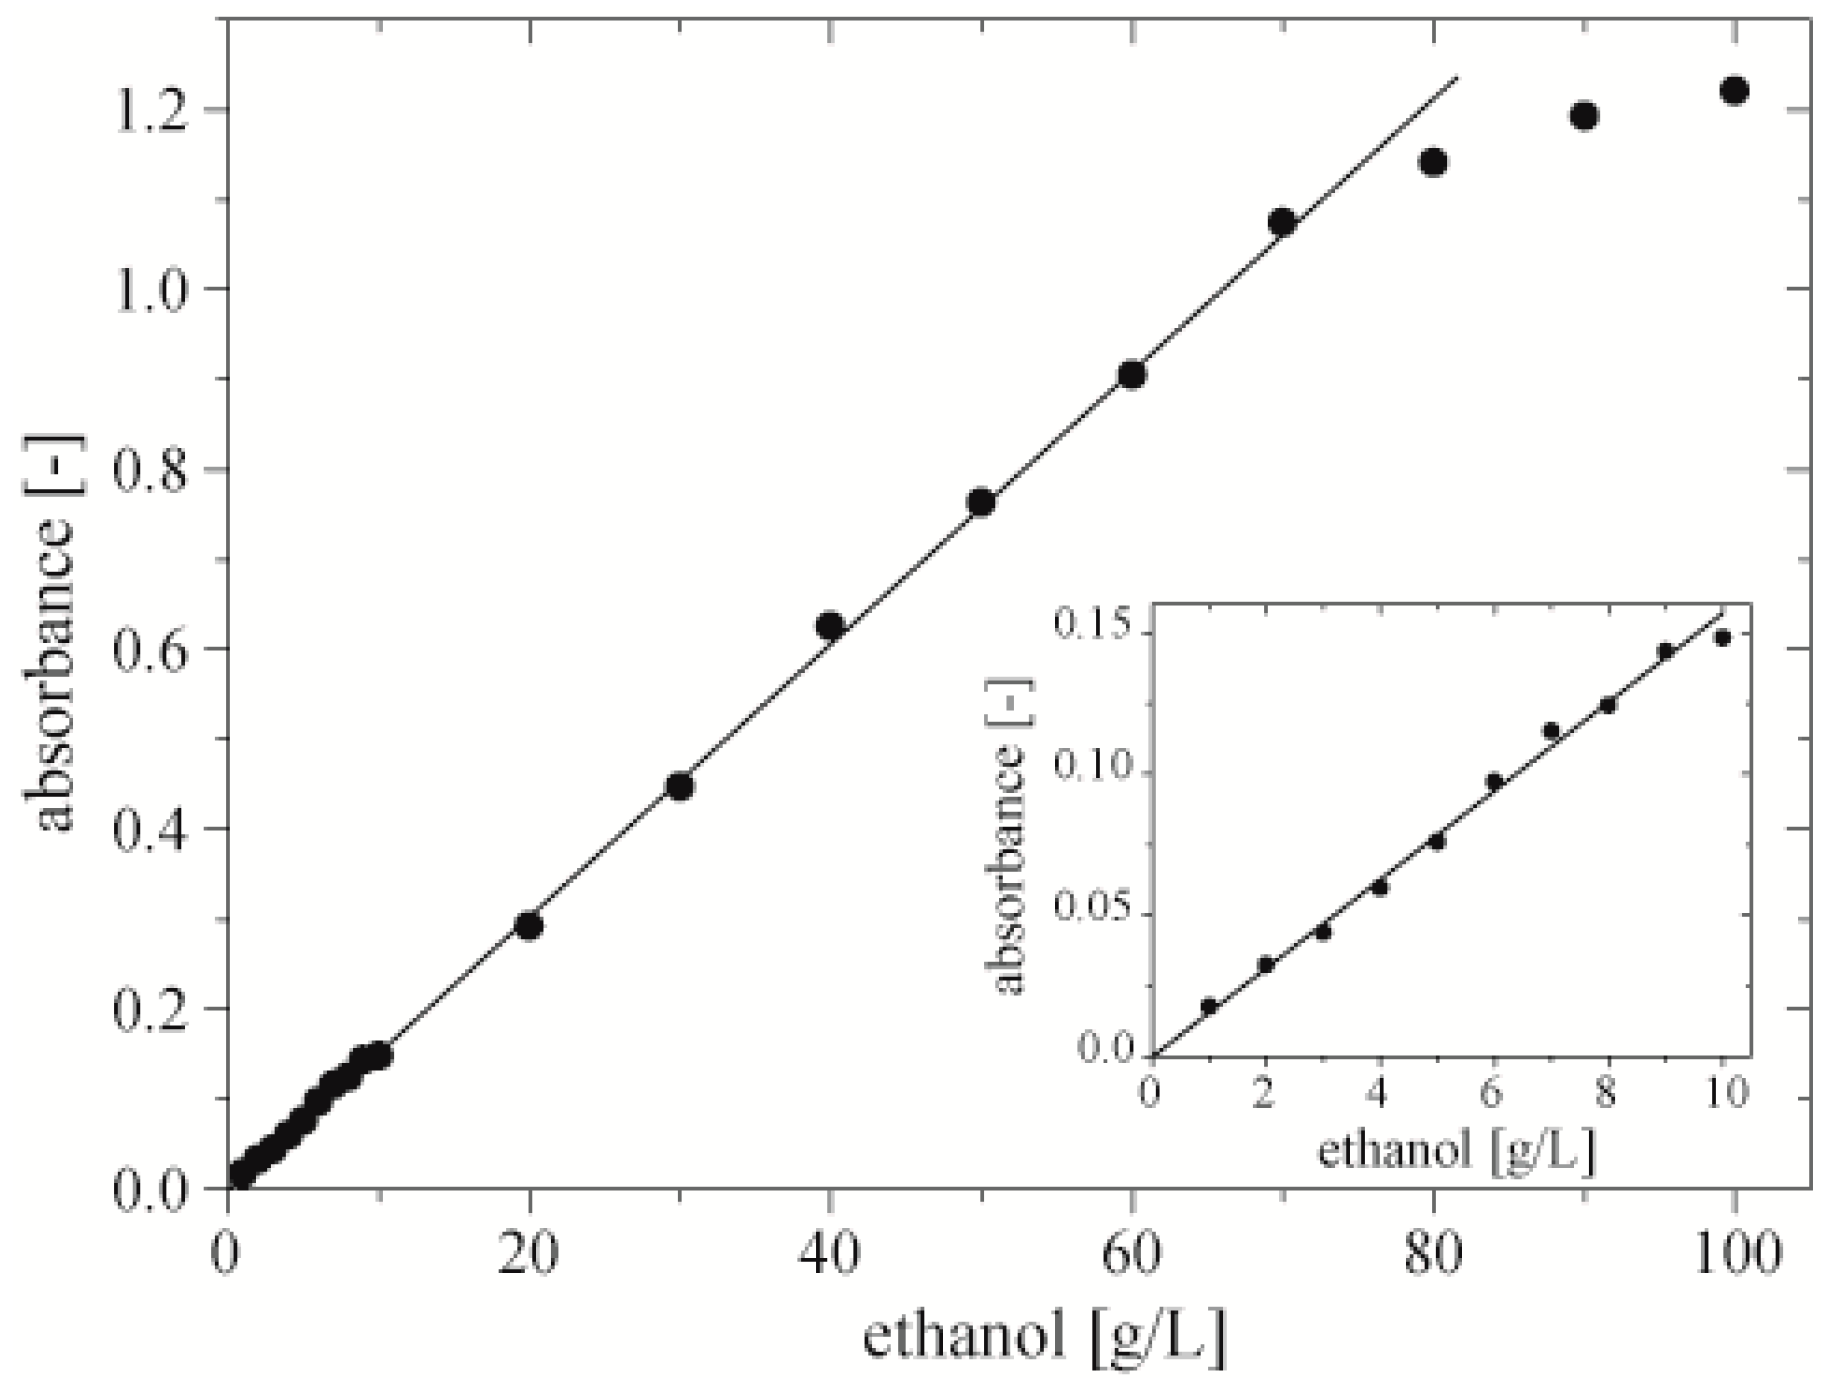
DOD with droplets with the components of the assay. We found that between 1 and 70 g·L
−1 absorbance is proportional to the concentration of ethanol. Below 1 g·L
−1 absorbance is too low to collect reliable data. Over 70 g·L
−1 the amount of chromogenes is insufficient to react fully with H
2O
2 produced in reaction catalyzed by AOX (
Figure 6). The resolution of detection depends on the range of concentration of ethanol and the intensity of light (
Table 1). In order to maximize the range of reliable measurement, we adjusted the intensity of light with the use of absorptive neutral density filters kits (NEK02, Thorlabs, Newton, NJ, USA).
The dynamic range of 1 to 70 g·L−1 perfectly covers the range of ethanol concentration yielded in typical bioprocesses. Moreover, by changing, e.g., the time of incubation or ratio between volume of sample and volume of chromogenes, the dynamic range can be shifted to higher or lower values. We assume that the dynamic range of this assay is limited not only by saturation of the measured absorbance for higher concentrations, but also by the lower level of detection of our optical setup (the light source and the spectrometer) Thus, dynamic range can be extended by the use of a more stable source of light and a more sensitive spectrometer.
We checked if the presence of bacteria in droplets has an impact on the measured value of absorbance. We measured the concentration of ethanol with the use of optimized concentrations of enzymes and chromogenes in a sequence of three droplets (each repeated 3 times) with an initial ethanol concentration of 5, 10, and 20 g·L−1, one sequence with bacteria in droplets, the second without. We noticed no difference in the measured values of absorbance, signifying that the presence of bacteria in the droplets did not influence the readout of the assay.
Figure 6.
Dynamic range of the microfluidic assay. Inset shows dependence of absorbance on concentration of ethanol for concentrations of ethanol 1–10 g·L−1.
Figure 6.
Dynamic range of the microfluidic assay. Inset shows dependence of absorbance on concentration of ethanol for concentrations of ethanol 1–10 g·L−1.
Table 1.
The detection resolution of our method vs. the range of ethanol concentration.
Table 1.
The detection resolution of our method vs. the range of ethanol concentration.
| The range of concentration of ethanol | The resolution of detection |
|---|
| 0.01–1 g·L−1 | 0.02 g·L−1 |
| 0.1–10 g·L−1 | 0.15 g·L−1 |
| 1–100 g·L−1 | 0.95 g·L−1 |
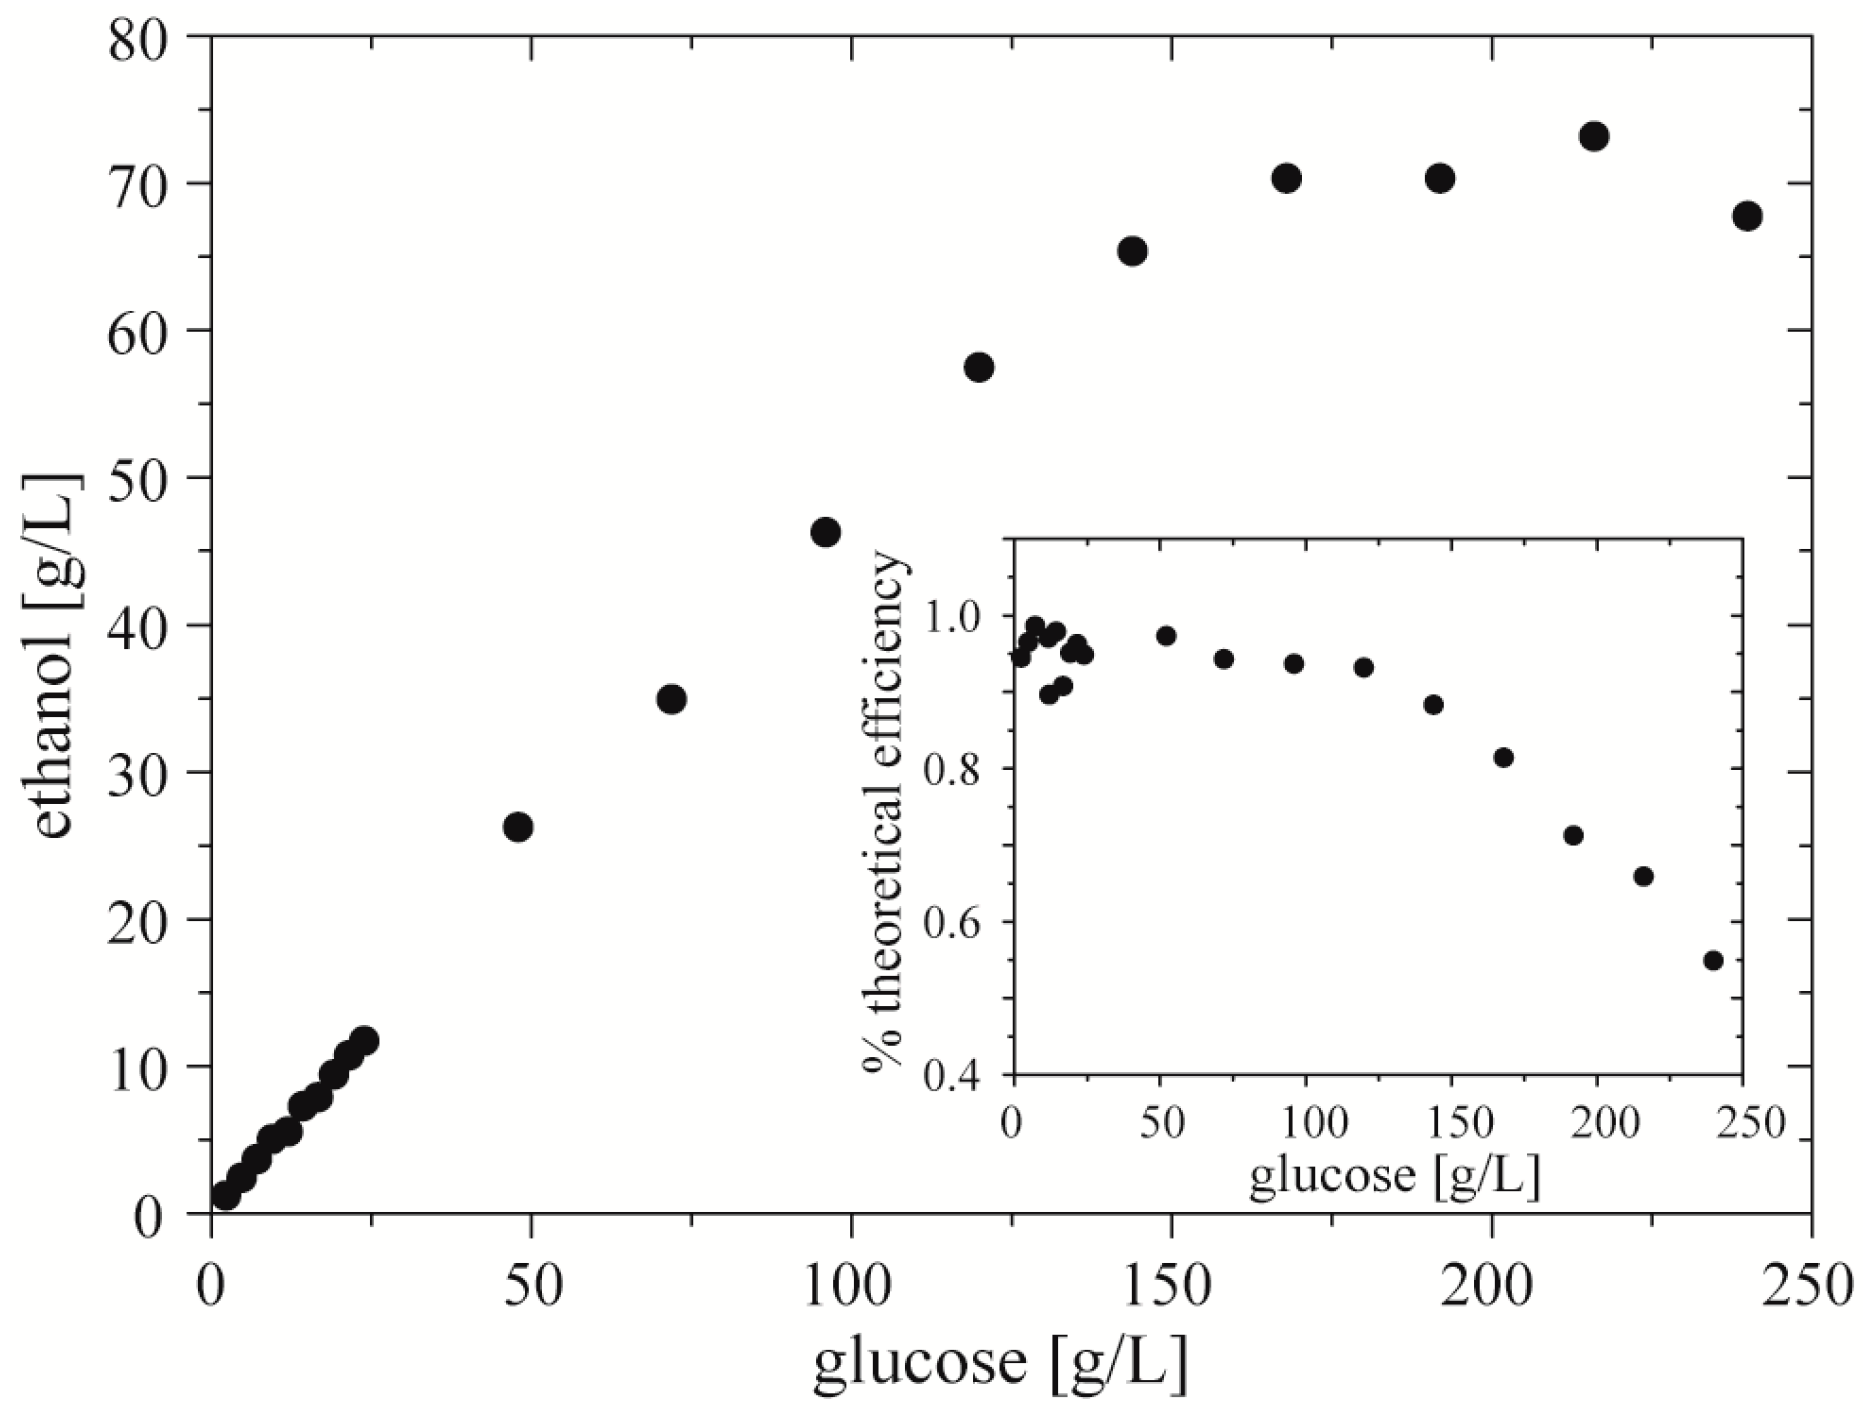
3.7. Screening the Ethanol Productivity of Bacteria
In a model test of the use of the droplet assay with cell cultures, we screened the ethanol productivity vs. concentration of glucose using Z. mobilis (strain 3881). We filled the reservoirs on the chipDOD with: (i) inoculum of bacteria, (ii) culturing medium with glucose in two concentrations, 24 g·L−1 and 240 g·L−1, (iii) and culturing medium. We used the chipDOD to generate 3 repetitions of a sequence of 19 droplets each of volume of 1.4 µL. Each droplet contained 100 nL of inoculum. Then we incubated these droplets at 30 °C over 36 h. After incubation we used the chipMERGE to merge each post-fermentative droplet with droplets of mixture of enzymes and a mixture of chromogenes. After 20 min of incubation we measured absorbance of quinoneimine dye in the droplets.
We found a linear correlation between concentration of glucose and of ethanol up to
ca. 150 g·L
−1 of glucoses in the starting medium. Higher concentrations of glucose did not produce proportionally higher concentrations of the alcohol. It showed that glucose with concentration above 150 g·L
−1 limits efficiency of bacteria of ethanol production, and over 220–230 g·L
−1 decreases total amount of produced ethanol (
Figure 7). These results are consistent with the data measured by
Nowak et al. [
33] and Szambelan
et al. [
34]. They showed that glucose with concentration over 240 g·L
−1 inhibits the growth of cells of
Z. mobilis (strain 3881). Moreover, for lower amounts of glucose they found that efficiency of ethanol production is around 95% of theoretical efficiency.
Figure 7.
Productivity of ethanol vs. initial concentration of glucose by Z. mobilis. Inset shows percent of theoretical (stoichiometric) efficiency of ethanol production vs. initial concentration of ethanol.
Figure 7.
Productivity of ethanol vs. initial concentration of glucose by Z. mobilis. Inset shows percent of theoretical (stoichiometric) efficiency of ethanol production vs. initial concentration of ethanol.
4. Conclusions
We demonstrated and characterized in detail a microfluidic assay for determination of ethanol concentration in micro-droplets. We provided an example of the use of our system in screening the efficiency of fermentation by Z. mobilis vs. sugar concentration with a dynamic range of 1–70 g·L−1. The dynamic range of the assay presented here can be shifted into lower or higher values by addition of more or less chromogene mixture to the post-fermentation droplets.
In the model demonstration in our manuscript, we show the dependence of ethanol production on glucose concentration. One can easily extend this technique to search for an optimal chemical environment in which microbes could produce ethanol from poor food sources. Such a screening system can serve as a platform for finding the most attractive media for fermentation at a rate significantly higher than with the use of classic culturing techniques. Our equipment allows automated generation of droplets with various chemical compositions (which actually means a different bioreactor), incubation and detection and is a great alternative to laborious procedures in biological laboratories.
The implementation of the known enzymatic assay for ethanol detection into the micro-droplet format (i) significantly decreased the volume of sample per assay, allowing for application in high-throughput screening, and (ii) allowed us to extend the range of concentration of ethanol which can be determined. In macroscale methods, because of the high sensitivity of the assay, samples (e.g., post-fermentative mixture, beer, wine) should be diluted up to 2000 times [
28]. Our method enables detection in samples of concentration up to 70 g·L
−1 without dilution. Compared to another existing enzymatic droplet microfluidic method [
31], our method is characterized in detail and optimized, which makes it potentially useful in research on different aspects of fermentation processes.
The method for measuring the concentration of ethanol that we described in this report can be adopted to screen droplets of diameters as small as half of the width of channel. In our system the smallest droplets that we could detect had a volume of 300 nL. We have also checked that the measurement of the optical density can be performed on droplets as small as 100 nL. The detection of the presence of droplets can be performed on much smaller drops—our system detects even droplets with volumes of less than 1 nL in channels of cross-section of 100 × 100 µm2. It is also important that the interface of the droplets can be distinguished from the background; in our system a change in optical converter voltage of at least 0.05 V triggers detection. In practice, the contrast of indices of refraction between aqueous solutions and an immiscible oil should satisfy this criterion, but this needs to be verified experimentally, especially for smaller droplets than those used in our study. The detection module itself can be used with microfluidic systems oriented at rapid screening, as it enables detection of droplets at frequencies well above 100 Hz and can be tuned for detection and measurement up to frequencies of the order of 1 kHz.
In the face of the growing interest in alternative sources of energy, the system described herein can provide a useful tool for high-throughput microfluidic methods for screening of incubation conditions and screening libraries of mutants in directed evolution experiments.


