Article

Raman-Spectroscopy Based Cell Identification on a Microhole Array Chip

1
Leibniz Institute of Photonic Technology (IPHT), Albert-Einstein-Str. 9, D-07745 Jena, Germany
2
Center for Sepsis Control and Care (CSCC), Jena University Hospital, Erlanger Allee 101, D-07747 Jena, Germany
3
Fraunhofer Institute for Biomedical Engineering (IBMT), Ensheimer Straße 48, D-66386 St. Ingbert, Germany
4
Institute of Physical Chemistry and Abbe Center of Photonic, Friedrich-Schiller-University Jena, Helmholtzweg 4, D-07743 Jena, Germany
5
Department of Internal Medicine II, Haematology and Medical Oncology, Jena University Hospital, Erlanger Allee 101, D-07747 Jena, Germany
*
Author to whom correspondence should be addressed.
Micromachines 2014, 5(2), 204-215; https://doi.org/10.3390/mi5020204
Submission received: 11 December 2013 / Revised: 5 April 2014 / Accepted: 8 April 2014 / Published: 22 April 2014
(This article belongs to the Collection Lab-on-a-Chip)

Abstract

:
Circulating tumor cells (CTCs) from blood of cancer patients are valuable prognostic markers and enable monitoring responses to therapy. The extremely low number of CTCs makes their isolation and characterization a major technological challenge. For label-free cell identification a novel combination of Raman spectroscopy with a microhole array platform is described that is expected to support high-throughput and multiplex analyses. Raman spectra were registered from regularly arranged cells on the chip with low background noise from the silicon nitride chip membrane. A classification model was trained to distinguish leukocytes from myeloblasts (OCI-AML3) and breast cancer cells (MCF-7 and BT-20). The model was validated by Raman spectra of a mixed cell population. The high spectral quality, low destructivity and high classification accuracy suggests that this approach is promising for Raman activated cell sorting.

Graphical Abstract

1. Introduction

Tumor diseases belong—beside cardiovascular diseases—to the most frequent causes of death in Germany and most other western countries. The number of tumor cells circulating in peripheral blood of patients and its time-dependent evolution are important markers to diagnose the disease, assess the success of therapy and estimate the prognosis. The technologies that are currently available for circulating tumor cell (CTC) isolation, the utility of CTCs as a diagnostic and prognostic marker in various cancers and molecular properties of these rare cells were reviewed [1,2,3]. Current detection technologies are based on (i) free DNA or RNA circulating in plasma from patients with cancer; (ii) physical properties of CTCs that include the larger size of most epithelial cells and differences in density, charge or migratory properties; and (iii) antibodies against specific cell surface antigens such as epithelial cell adhesion molecule (EpCAM, CD326). The CellSearch system (Veridex) is a widely used FDA (U.S. Food and Drug Administration) approved method that uses ferrofluids loaded with an EpCAM antibody to capture CTCs that are subsequently visualized by staining with a cocktail of antibodies against cytoplasmic epithelial cytokeratins [4]. Recently techniques based on nanomaterials and miniaturized systems are coming up [5]. However, a gold standard for benchmarking various technologies concerning their absolute accuracy, sensitivity and specificity in detecting CTCs does not yet exist. The Veridex system, for example, suffers from relatively low sensitivity scoring only a fraction of patients with metastatic cancer positive for CTCs, with a median yield of approximately one CTC per milliliter and typically low purity [6]. Other experimental approaches have been developed using a microfluidic platform with anti-EpCAM coated microposts and a herringbone chip which makes use of a microvortex mixing device [7].
Our group initiated a research program to utilize Raman spectroscopy for detection of CTCs. Main advantages of Raman spectroscopy are high specificity overcoming the limitation due to the expression of specific cell-surface markers and non-destructivity enabling live cell sorting. First classification models were reported for Raman images of dried blood and tumor cells [8] and Raman spectra of cells in optical tweezers [9]. The combination of optical manipulation with Raman spectroscopy offers great advantages for single cell analysis and has recently been reviewed [10]. Microfluidic chips with optical traps were described for Raman spectroscopy of single cells at 514 nm [11] and 785 nm excitation [12]. Distinction of normal from tumor cells and identification of tumor cells were achieved with high accuracy. The further potential of such and other chip-scale microscopy imaging platforms for high throughput sample analysis has been reviewed recently [13].
On the way to an automated analysis with an increased sample (ultimately blood) throughput for CTC screening, microarrays with a silicon nitride membrane were fabricated from silicon wafers using microsystem technology. Those microarrays provide versatile tools for high-throughput and parallel multiplex analysis in clinical diagnostics and research. Here, cells are no longer randomly distributed in solution, but immobilized in regular arrangement on microholes by gentle underpressure [14,15,16]. Subsequently, different characterization methods can be performed on the same cell. Microhole chips were previously used in combination with impedance spectroscopy for monitoring adhesion, proliferation and membrane integrity effects [14,17]. In other approaches these chips were used as a size-selective filter, combined with different biomarkers for high-throughput cell characterization [16,18]. Further, they have been used as a fluorescence-in situ hybridization platform [15].
Clinical translation of Raman assisted cell sorting also requires higher throughput. Therefore, the current contribution combines Raman spectroscopy with microhole arrays for cell identification. First, leukocytes extracted from peripheral blood and three tumor cells that could be present as CTCs in blood were immobilized on the microchip array. For the liquid handling the chip was integrated into a fluidic adapter and coupled to a negative pressure system. Then, Raman images were collected from cells on the chip and a classification model was trained and validated by Raman spectra of a mixed cell population. Such a microsystem holds the potential to be connected to a cell picking system for CTC sorting in the future.

2. Materials and Methods

2.1. Cell Culture and Sample Preparation

Blood samples were obtained from healthy donors with informed consent according to the Ethics Committee of the Jena University Hospital. All experiments were performed in compliance with the relevant laws and institutional guidelines. Leukocytes were isolated by erythrocyte lysis as previously described [19,20]. The few erythrocytes which were still present in the sample after that separation step did not interfere with the measurement as they were too small (disks of size ~7 µm × ~2 µm) and could not be retained by the microholes on the chip. Breast carcinoma derived tumor cells (MCF-7, BT-20), and acute myeloid leukemia cells (OCI-AML3) were prepared from cell cultures as described previously [8,9]. Briefly, cells were cultivated in DMEM (MCF-7, BT-20) or RPMI1640 (OCI-AML3) with 10% FCS (Biochrom, Berlin, Germany). They were harvested by trypsinization and subsequent centrifugation, washed with PBS buffer and fixed with 0.4% paraformaldehyde. The concentration of the cell suspension was adjusted to a final concentration of 100,000 cells per milliliter PBS. For the mixed cell experiments tumor cells were pre-labeled with fluorescence-conjugated antibodies: BT-20 with FITC-CD326 (ex. 495 nm, em. 520 nm), MCF-7 with APC-CD326 (ex. 595–650 nm, em. 660 nm) and OCI-AML3 with PerCP-CD45 (ex. 490 nm, em. 620 nm). All antibodies were obtained from Becton-Dickinson (Heidelberg, Germany). For Raman experiments 50 µL leukocytes were mixed with 50 µL MCF-7, 50 µL BT-20 and 50 µL OCI-AML3 cells. Control experiments were carried out with pure cell populations to assure that the fluorophore did not influence the Raman spectra.

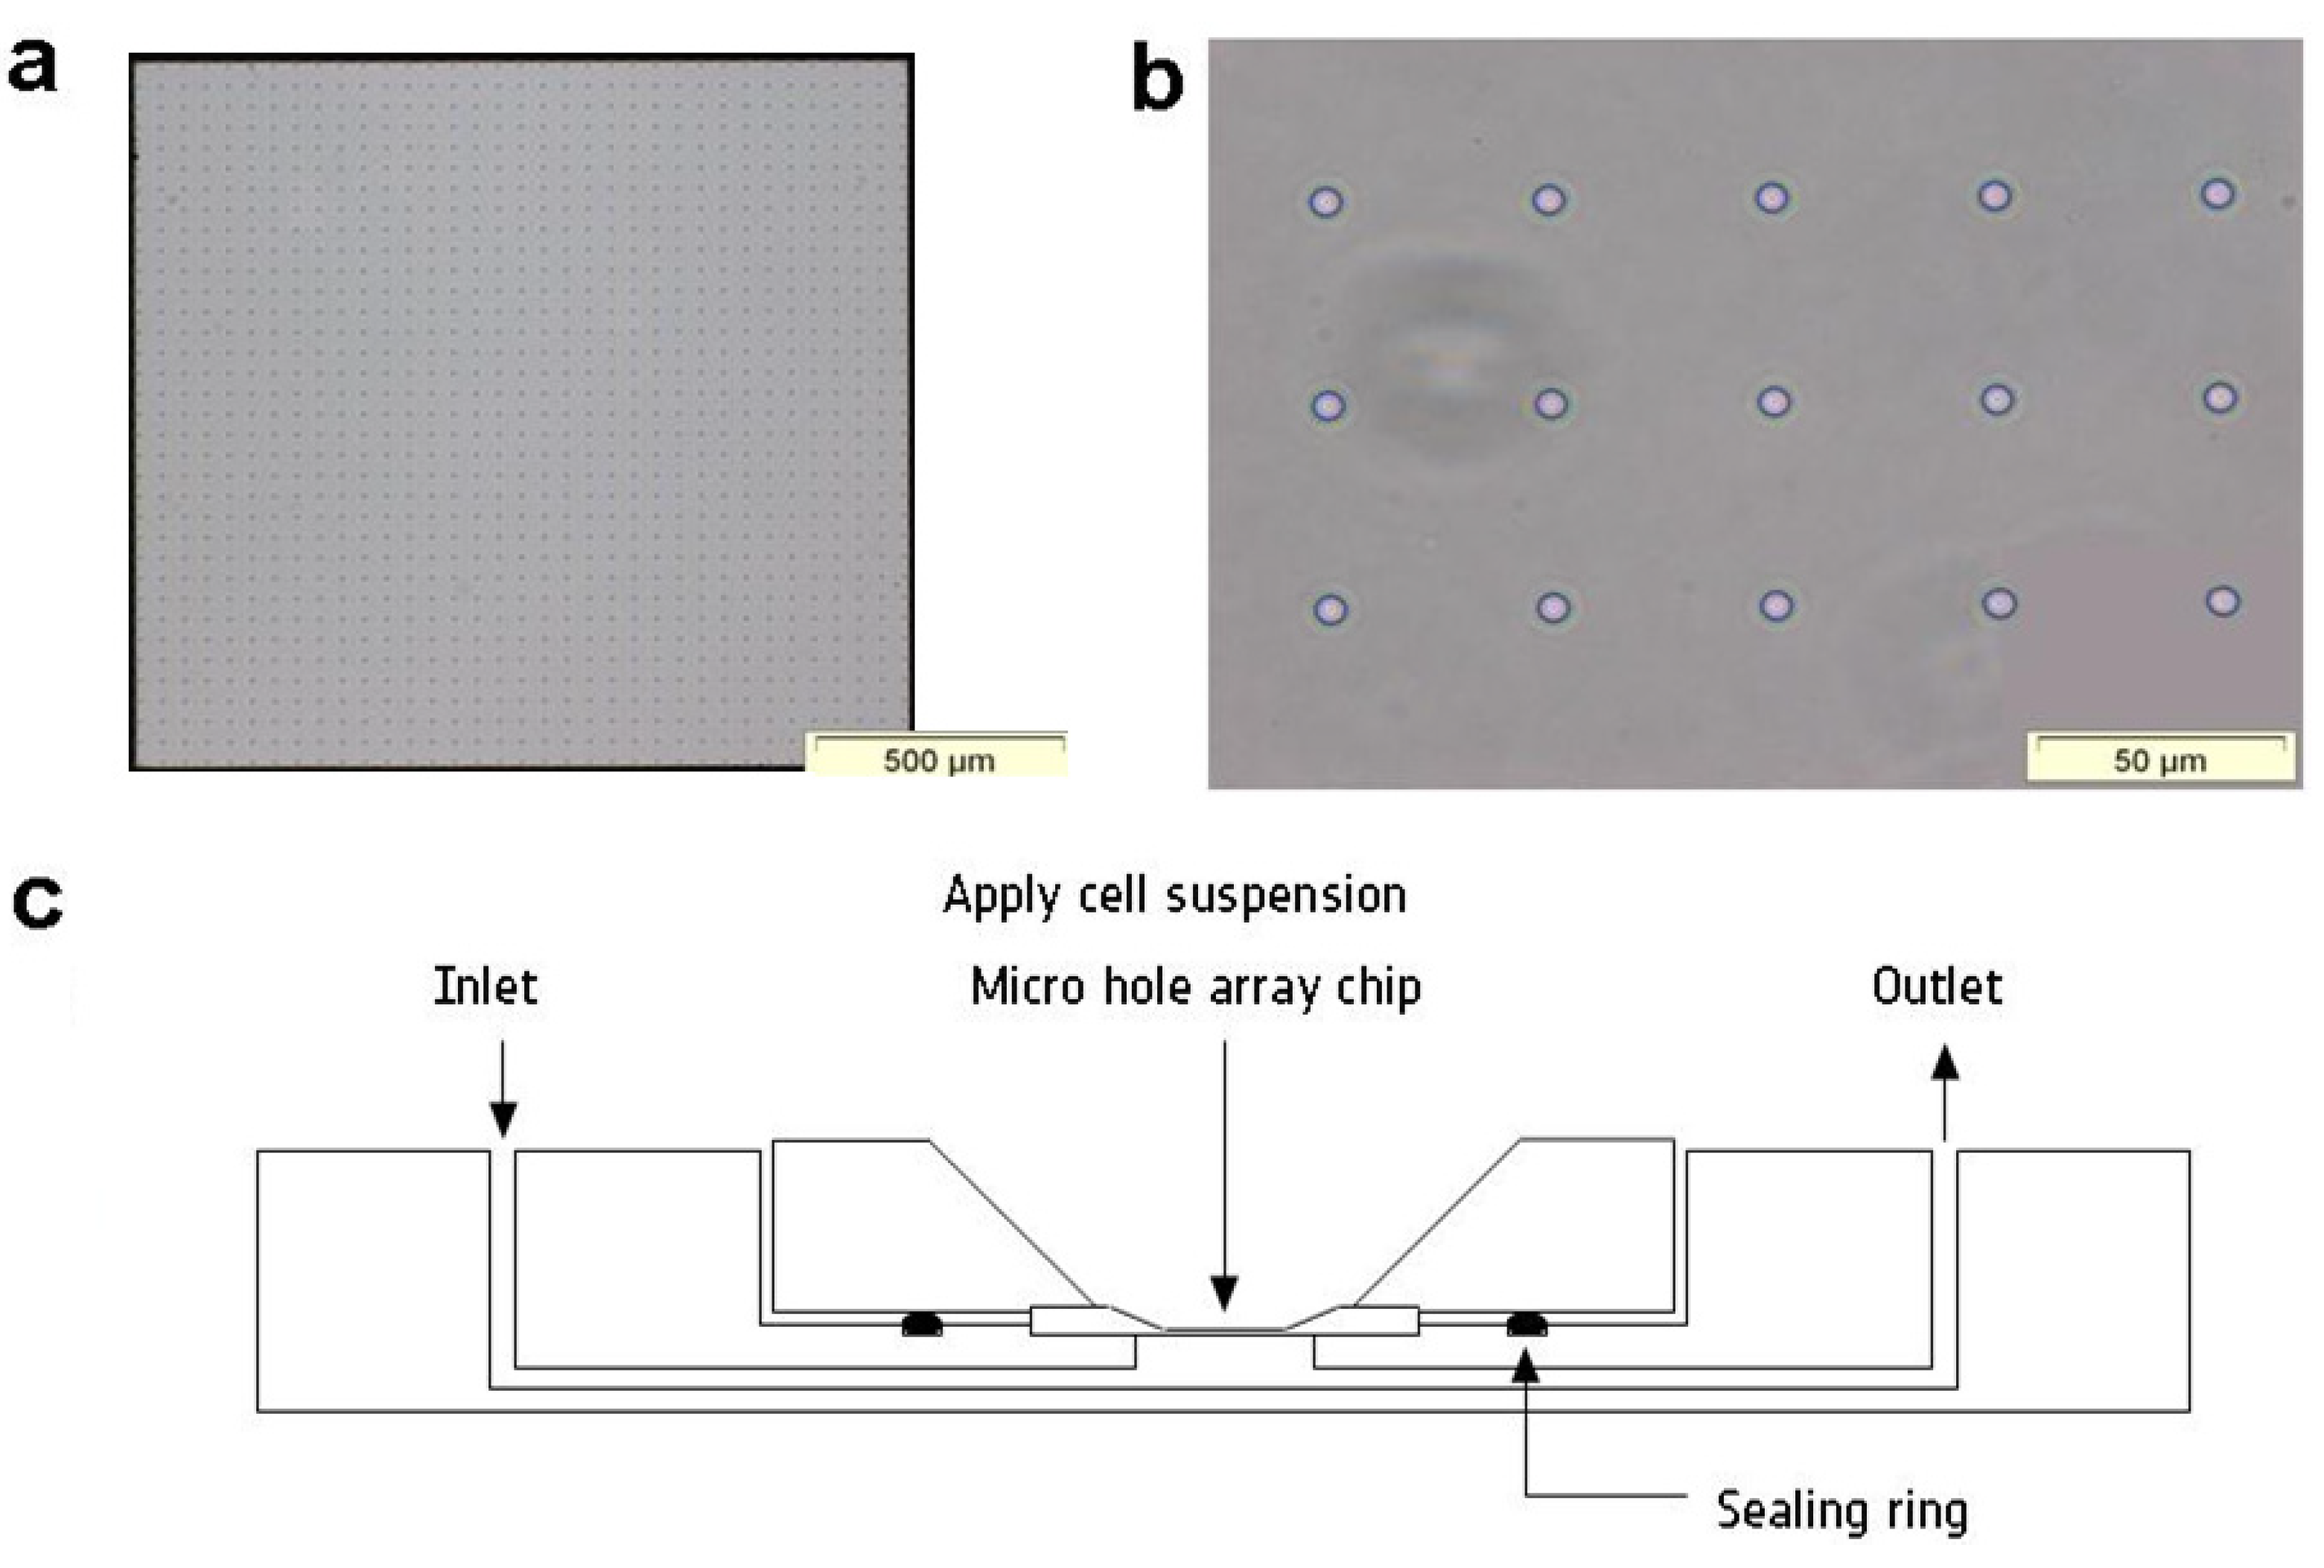
2.2. Microhole Array Chip

The microhole array chip is based on a 300 µm thick silicon wafer. A 1 µm silicon nitride layer (Si3N4) was deposited on both sides by plasma-enhanced chemical vapor deposition (PECVD). After patterning by photolithography and reactive ion etching the silicon nitride layer on the wafer backside was used as etching mask during anisotropic etching of the silicon wafer in aqueous potassium hydroxide (KOH) solution. The front side silicon nitride layer acted as an etch stop and formed a free-standing thin membrane. Regularly arranged microholes were realized in this membrane by photolithography and reactive ion etching from the wafer front side. The microholes are 5 µm in diameter. The total size of the membrane was 1545 µm × 1545 µm, comprising an array of 35 × 35 holes with a pitch of 40 µm (Figure 1a,b).
Figure 1. (a,b) Phase-contrast images of the empty membrane with different magnification. 35 × 35 holes, holes size: 5 µm, hole pitch (spacing): 40 µm; Si3N4 membrane thickness: 1µm. (c) Schematic view of the microhole chip integrated in a fluidic adapter.
Micromachines 05 00204 g001
A fluidic adapter was used for connecting the chip to a fluidic system (Figure 1c). The adapter has two fluidic connections (inlet and outlet). A tight sealing between the chip and the adapter was achieved by using a sealing ring. The negative pressure underneath the silicon nitride membrane was generated by a venturi injector (Festo, Esslingen-Berkheim, Germany) and was monitored by a pressure sensor (SensorTechnics, Puchheim, Germany). The input positive pressure to the venturi injector was controlled by a fine regulating valve (BelloFram, Newell, WV, USA).

2.3. Raman Measurements

Raman measurements were performed with a Raman microspectrometer (RXN1, Kaiser Optical Systems, Ann Arbor, MI, USA) equipped with an upright microscope. Laser excitation at 785 nm from a single mode diode laser (model xtra, Toptica, Gräfelfing, Germany) was used to excite the Raman signal and focused through a 60×/NA 1.0 water immersion objective (Nikon, Tokyo, Japan) giving 75 mW on the sample. The Raman signal was accumulated for 8 s, collected in backscattering geometry and detected on a Peltier-cooled, back-illuminated, deep-depletion CCD chip (Andor, Belfast, Northern Ireland) after passing a holographic transmissive grating.
For training the Raman classification model purified cell populations were loaded on the microhole chip and Raman maps with a step size of 1.5 µm between adjacent spectra were recorded from individual cells. Cells from each cell type were characterized in replica measurement on three different days from three different batches. For the unknown mixture automated Raman maps were acquired over a larger chip area with a step size of 20 µm, yielding alternating one spectrum per cell and one spectrum from the chip background.

2.4. Fluorescence Analysis

To verify the correctness of the Raman classification model, the microhole chips with the mixed cells were dried after the Raman measurements by leaving a constant underpressure to avoid displacement of the cells.
Fluorescence measurements of the dried chips with the stained cells were carried out at a Zeiss LSM 510 META. To excite the fluorescence of the labeled OCI-AML3 and BT-20 cells the 488 nm line of an argon ion laser was used. The fluorescence was detected with a bandpass filter (565–615 nm to detect the stained OCI-AML3 cells and 500–530 nm to visualize the labeled BT-20 cells). The fluorescence of the APC-labeled MCF-7 was excited with a HeNe laser (633 nm) and detected through a 650–710 nm bandpass filter.

2.5. Statistical Analysis

Statistical analysis of the Raman data was performed using GNU-R [21]. To minimize contributions from Si3N4 the spectra were truncated to the spectral region 595 to 1510 cm−1. Background correction was performed by sensitive non-linear iterative peak-clipping (SNIP) algorithm (order = “4”, smooth = TRUE, window = “3”) [22]. Within the maps the Raman spectra of the cells were identified via a threshold criterion using the Raman intensity of the CH deformation band around 1449 cm−1 > 200 counts. The cell spectra were vector normalized prior calculating an average spectrum for each cell for training a support vector machine (SVM) model. This is a large margin classification model that maximizes the margin of the groups and thus achieves a good discrimination between these groups. The dimension was reduced by applying principal component analysis (PCA) and using only the first 15 scores to construct the classification model with linear SVM. For training of the SVM model the libSVM library [23] was applied and the binary support vector machine was combined to a multi-class model by the one-against-one (OAO) scheme. The model was evaluated with 10fold cross validation and then used to assign the identity of the unknown cells in the mixture. For those spectra data pretreatment was identical as for the training data set, except that no average spectrum was calculated.

3. Results and Discussion

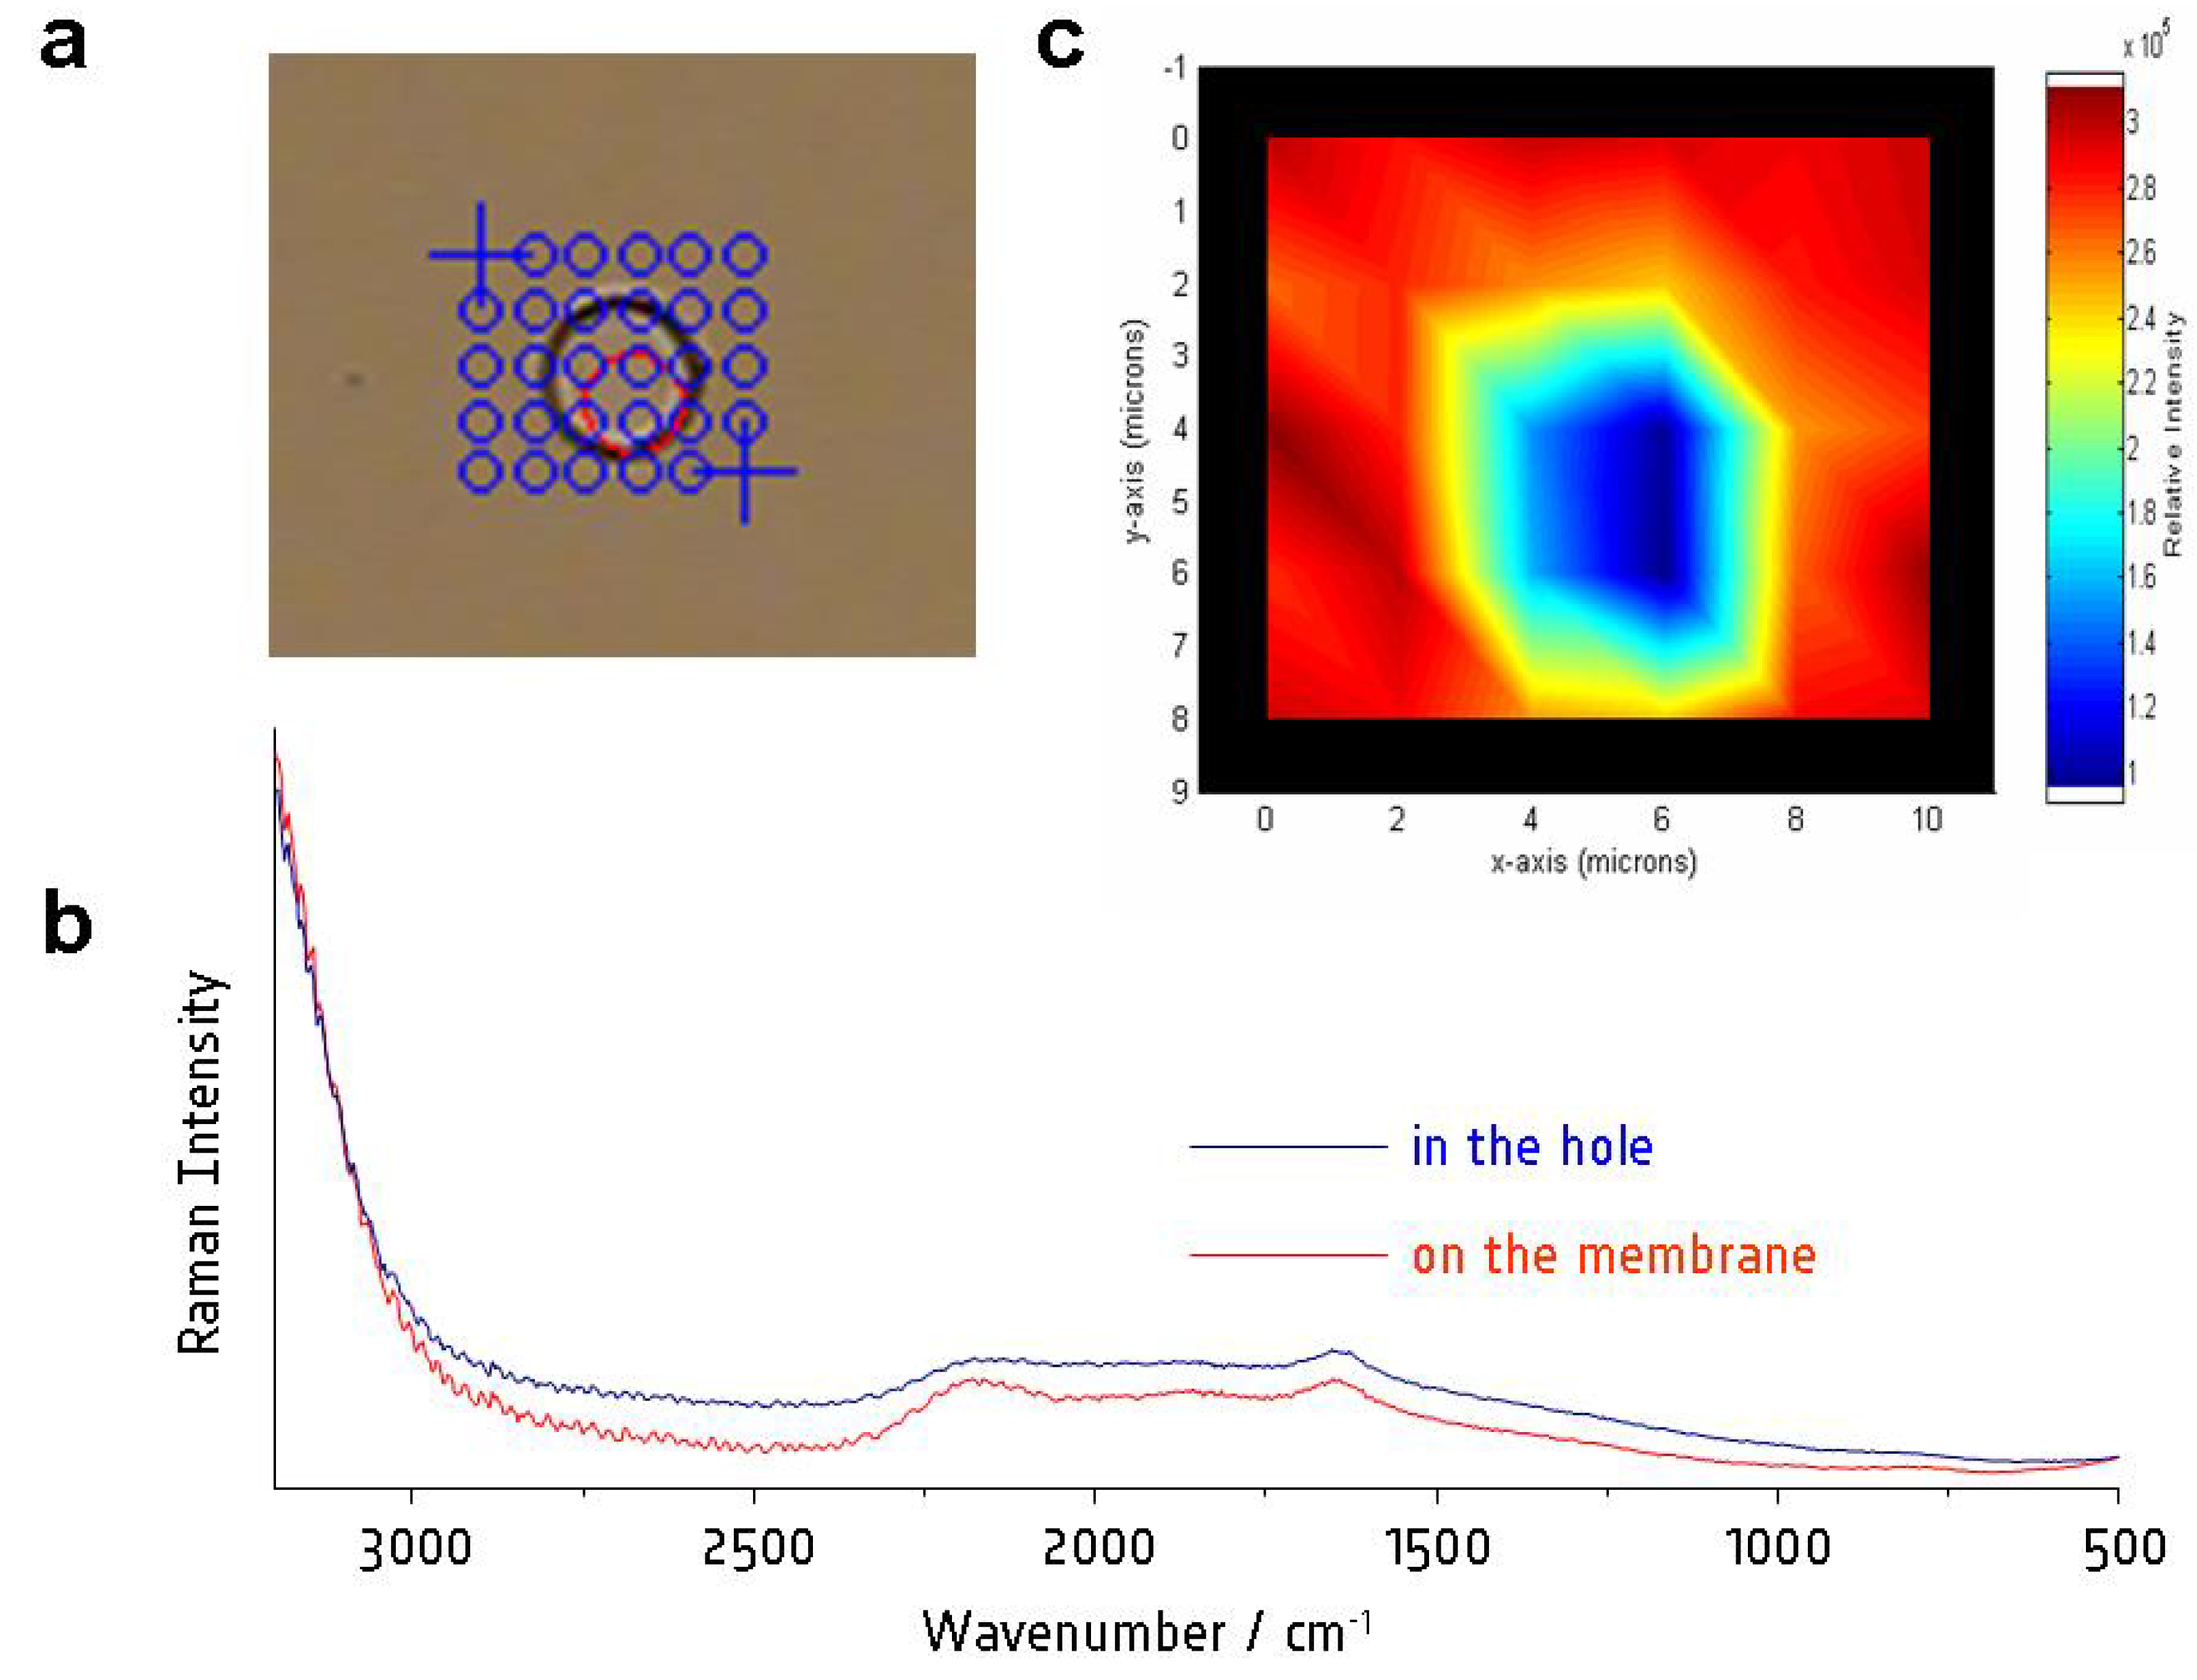
3.1. Characterization of the Microhole Chip by Raman Spectroscopy

The membrane of the microhole chip acts as direct support for the investigated cells. A Raman map over one microhole was collected to determine the spectral contributions of the substrate as shown in Figure 2a. Typical spectra are depicted in Figure 2b. Overall, the signals due to Si3N4 near 2180 cm−1 (H2–Si–N2 and H–Si–N3 stretching vibration [24]) are relatively broad and weak that demonstrates its applicability for Raman spectroscopy. Raman signals of the wafer material silicon that are expected near 520 cm−1 are not evident. Further spectral contributions are found near 1630 and above 3000 cm−1 due to water. The false color map of the integrated intensity centered at 2180 cm−1 visualizes that the membrane material Si3N4 is less intense in the microhole (Figure 2c). For further spectroscopic analysis of cells captured on the microhole chip, the spectra were truncated at 1510 cm−1 to leave out the variation of the Si3N4 intensities around 2180 cm−1 and the spectral region at 1630 cm−1 where the signals of the cellular amide I band and the background signals from the surrounding water overlap.
Figure 2. (a) White light image of empty microhole and grid used for Raman mapping; (b) Representative Raman spectra from different positions on the chip: over an empty hole and on the Si3N4 membrane; (c) False color Raman map depicting the intensity distribution of the Hx–Si–Nx stretching vibration around 2180 cm−1.
Micromachines 05 00204 g002

3.2. Capturing Cells on the Microhole Chip

The cell suspension, containing 10,000 cells in 100 µL buffer was applied to the chip in a single injection. A negative pressure of around 5 mbar was applied to the backside of the chip membrane, guiding the cells to the microholes and let them settle down on the array as depicted in Figure 3a for three MCF-7 cells and in Figure 4b for the cell mixture. Once the cells were entrapped on the microholes, the negative pressure was slightly increased to approximately 7–9 mbar to keep the cells on the holes during the Raman mapping and to counteract the optical tweezers force of the laser used for Raman excitation. The regular pattern of evenly spaced cells allows the directed and specific investigation of one cell after the other and still being able to move back to one particular cell if it is of interest. This enables a “two level inspection”: first, all cells are analyzed in a fast scanning mode with only one to three spectra per cell. In a second step, the few cells of interest (suspected circulating tumor cells) are investigated with a more detailed analysis with more (>10) spectra per cell. During capture and measurement the cells are kept in aqueous solution which resembles their natural environment and no drying induced denaturation effects are introduced.
Figure 3. (a) MCF-7 captured on the holes; and (b) corresponding false color Raman map highlighting the intensity distribution of the CH stretching band around 2940 cm−1; (c) averaged Raman spectra of the different cell types investigated on the chip.
Micromachines 05 00204 g003
Figure 4. (a) Decision value plot of the support vector machine (SVM) model; (b) white light image of unknown cells in mixture; and (c) Raman based assignment of those cells; (d) after the measurement the cells were dried on the membrane; and (e) investigated by fluorescence microscopy with 488 nm excitation and a bandpass filter 565–615 nm. (fluorescence dyes used: PerCP for OCI-AML3 and FITC for BT-20).
Micromachines 05 00204 g004

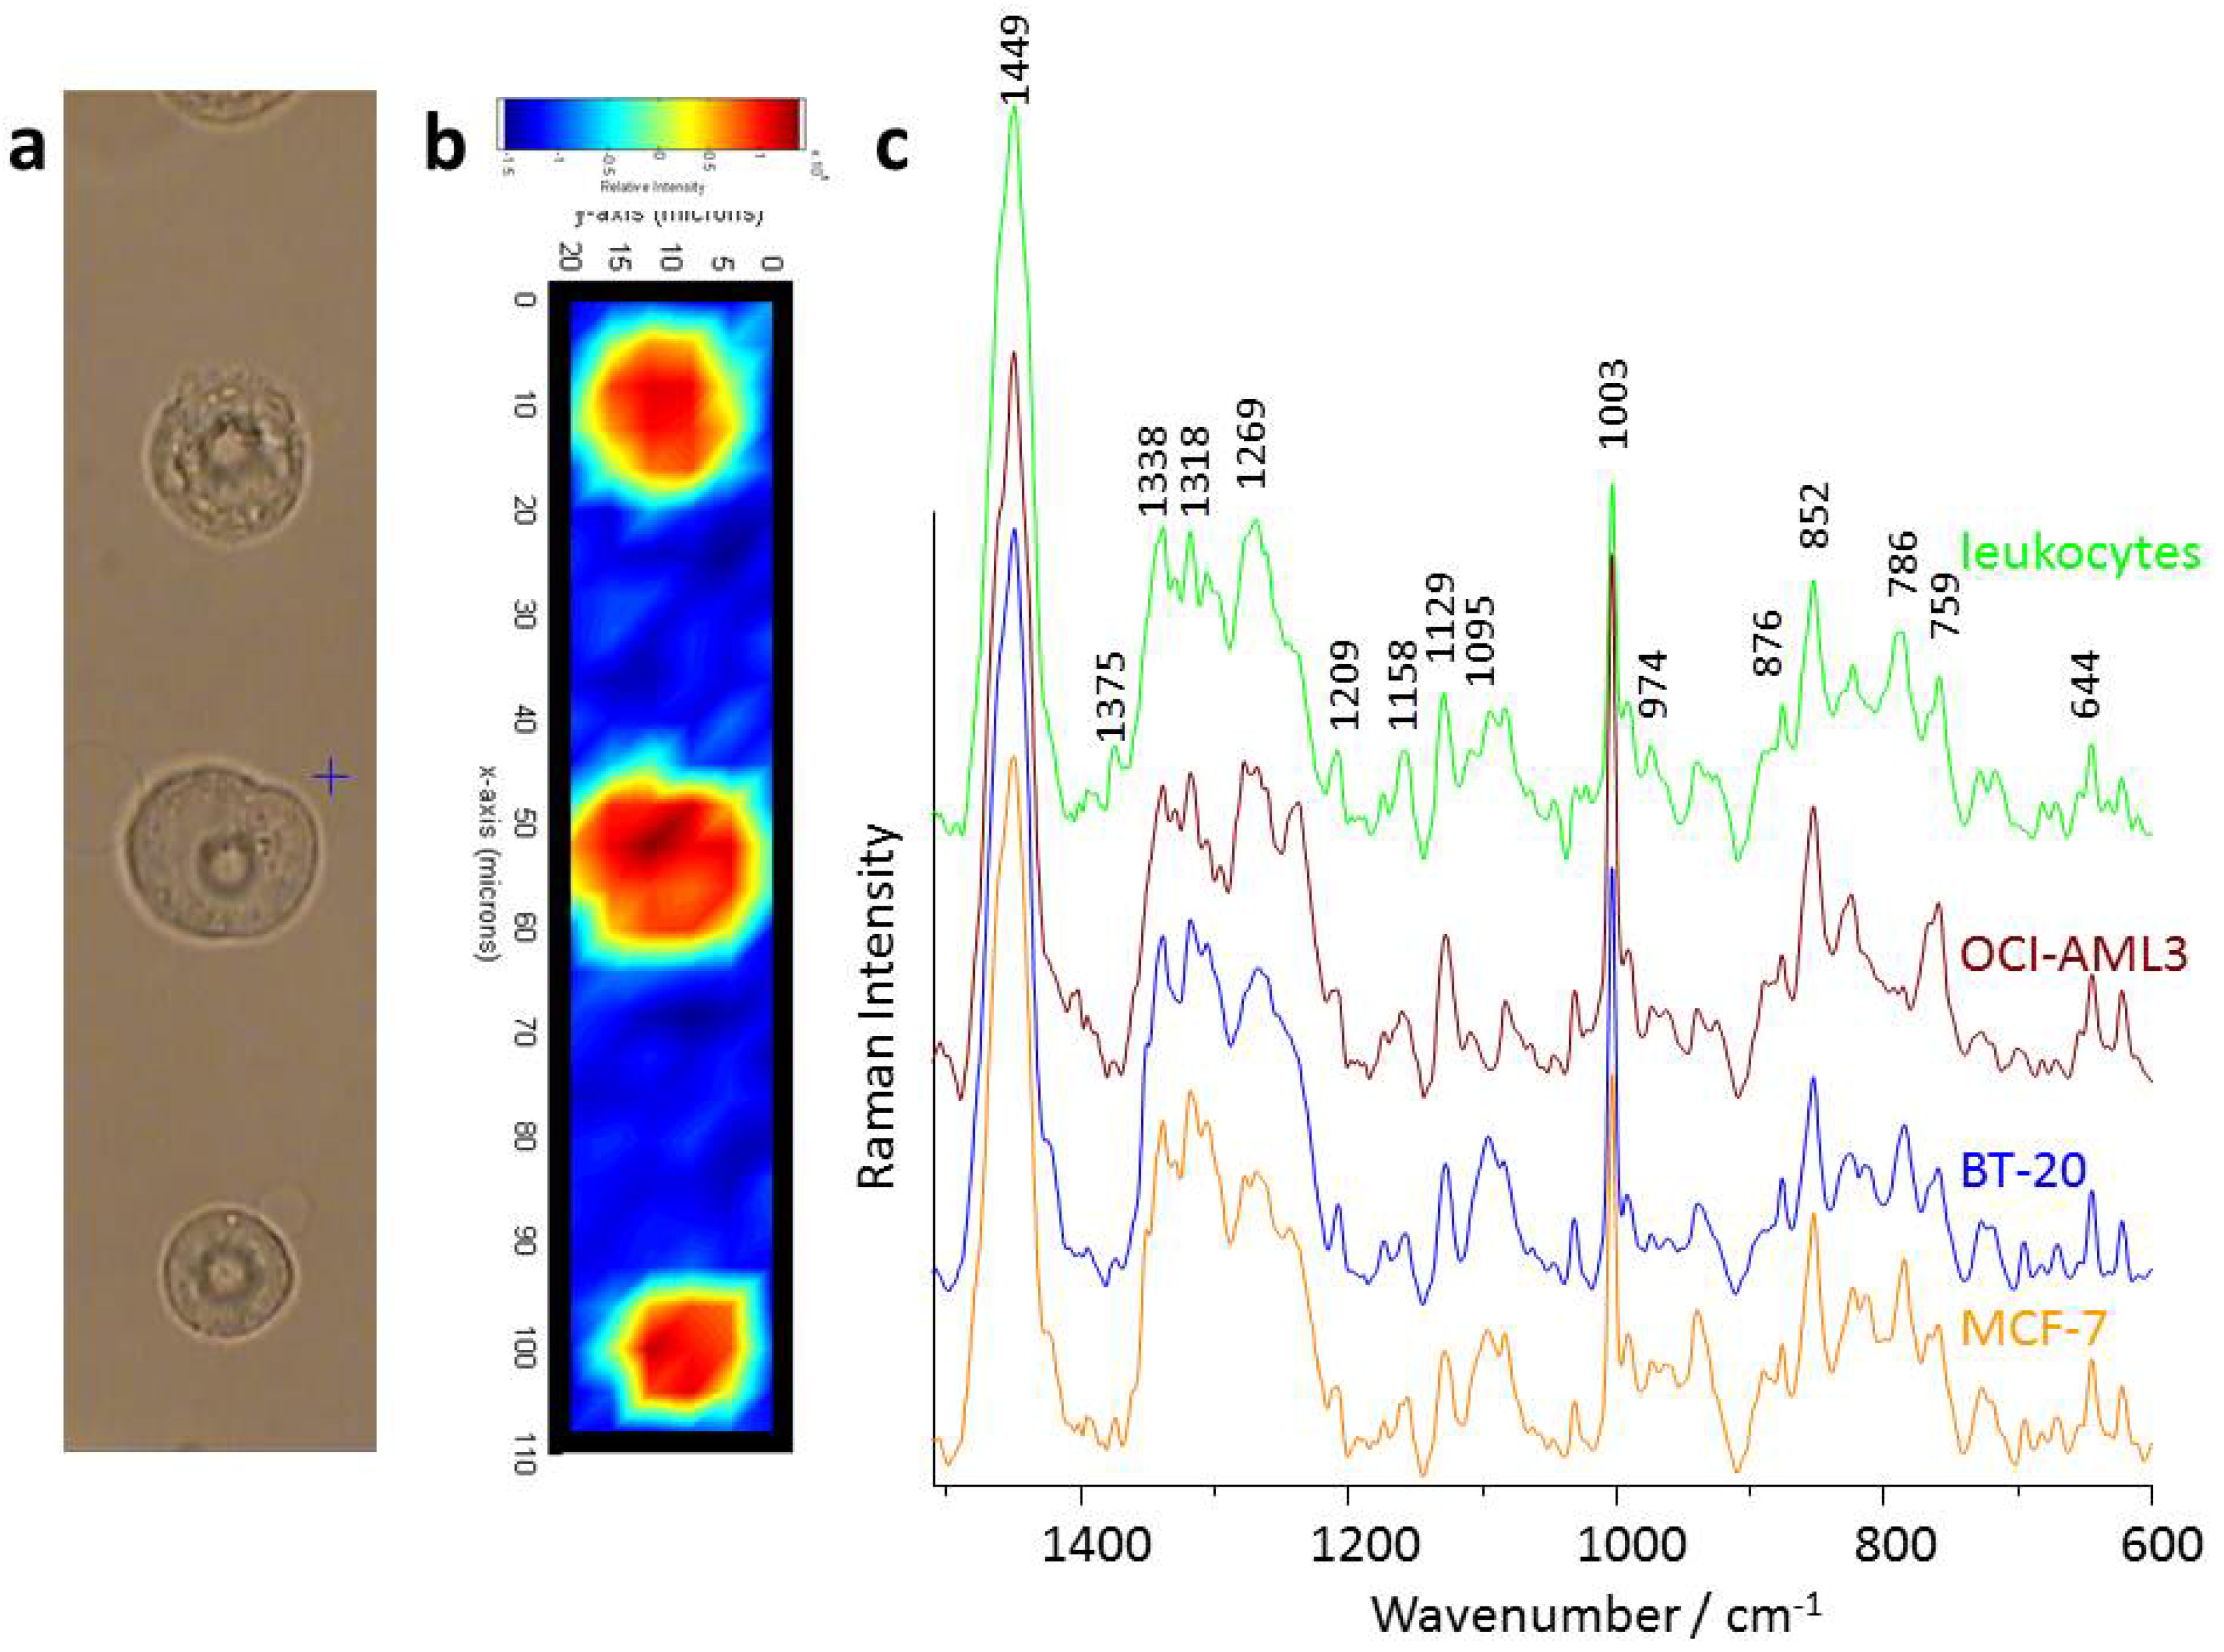
3.3. Raman Spectroscopy of Captured Cells in Solution

In order to collect spectra of known cells to train the statistical classification model pure cell populations were loaded onto the chip. Raman maps encompassing several cells from each cell population were recorded as shown for three MCF-7 cells in Figure 3a,b. The cells remain stable on the microhole positions during the acquisition time as can be seen from the Raman false color image depicted in Figure 3b showing the intensity distribution of the CH stretching vibration centered around 2940 cm−1. The position and size of the captured cells over the microholes are clearly resolved. The bottom cell is smaller than the cell in the center. This indicates that the negative positioning pressure around 7–9 mbar applied from the backside of the chip is strong enough to keep the cell’s position in solution for the time of analysis.
Figure 3c depicts the averaged Raman spectra from the four investigated cell types: normal leukocytes which are found in healthy volunteers and patients, and three different tumor cell types representing circulating tumor cells which could be present in the peripheral blood of cancer patients: OCI-AML3 for a patient with acute myeloid leukemia and the two closely related BT-20 and MCF-7 cells, which could be found in patients suffering from breast cancer. The Raman spectra exhibit a good signal to noise ratio and show all the typical vibrational bands that are expected for those cells from previous experiments and literature data. As the spectral region is truncated to the wavenumber region 595 to 1510 cm−1 (in order to keep the influence of the chip membrane minimal), the most prominent feature in the cell spectra is the CH2 deformation vibration centered around 1449 cm−1. The aromatic ring breathing mode of phenylalanine is detected at 1003 cm−1, nucleic acid contributions are observed around 786 cm−1 and 1095 cm−1. Overall, it can be stated that a good agreement is found with the spectra of the same cells recorded under different conditions, such as dried on CaF2 [8] and kept by laser tweezers in solutions [9]. Therefore, the reader is directed to those publications for a more detailed band assignment of the cell spectra. The spectra show that the presented microhole device is suitable for single cell analysis using Raman spectroscopy.

3.4. Raman Based Classification Model of Captured Cells

The averaged cell spectra were used to build a classification model using support vector machines. The result is visualized in Figure 4a using three out of the six decision values from the one-against-one (OAO) scheme. It can be seen, that the individual spectra of the same cell type form distinct spectra clouds. The clouds formed by the Raman spectra of leukocytes and of OCI-AML3 cells are very well separated from the clouds of both breast cancer cell types that slightly overlap. The details of the prediction accuracy of the classification model using 10fold cross validation is presented in Table 1. An overall accuracy of 84% can be achieved on single cell level. As discussed with the visualized classification model no false classification is observed for the leukocytes and OCI-AML3 cells, while it was difficult for the model to distinguish between BT-20 and MCF-7 cells. For the latter a prediction accuracy of only 2/3 could be achieved. This result agrees with previous Raman-based classification after wavelength modulated excitation [25]. If a good differentiation is necessary much larger sample sizes are needed [26]. For clinical purposes the most relevant question is to identify the cancer cells in the blood and to distinguish them unambiguously from the body’s own “healthy” leukocytes. For those purposes the classification model trained with spectra from the newly presented set-up shows very good characteristics (Table 2): all cancer cells were correctly identified as cancer cells yielding 100% true positives and thus 100% sensitivity; there were no false positives, i.e., no leukocyte was falsely identified as a cancer cell, thus resulting in 100% specificity (all leukocytes are correctly identified as leukocytes).
Table 1. Confusion table for individual cells of the classification model (SVM with linear kernel) for the evaluation with 10fold cross validation. On the cell level a prediction accuracy of 84% can be achieved.
Predicted labels
LeukocytesOCI-AML3BT-20MCF-7
True labelsLeukocytes22000
OCI-AML301900
BT-2000126
MCF-701510
Table 2. Confusion table reduced to a binary classifier relevant for diagnosing the disease to determine true positives (sensitivity: 100%), false positives (0%) and specificity (100%).
Predicted labels
Healthy cellTumor cell
True labelsHealthy cell22 (100%)0 (0%)
Tumor cell0 (0%)53 (100%)

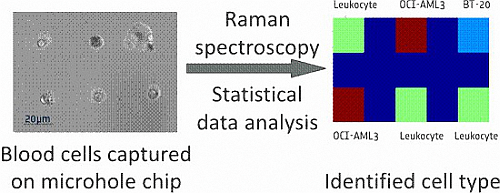
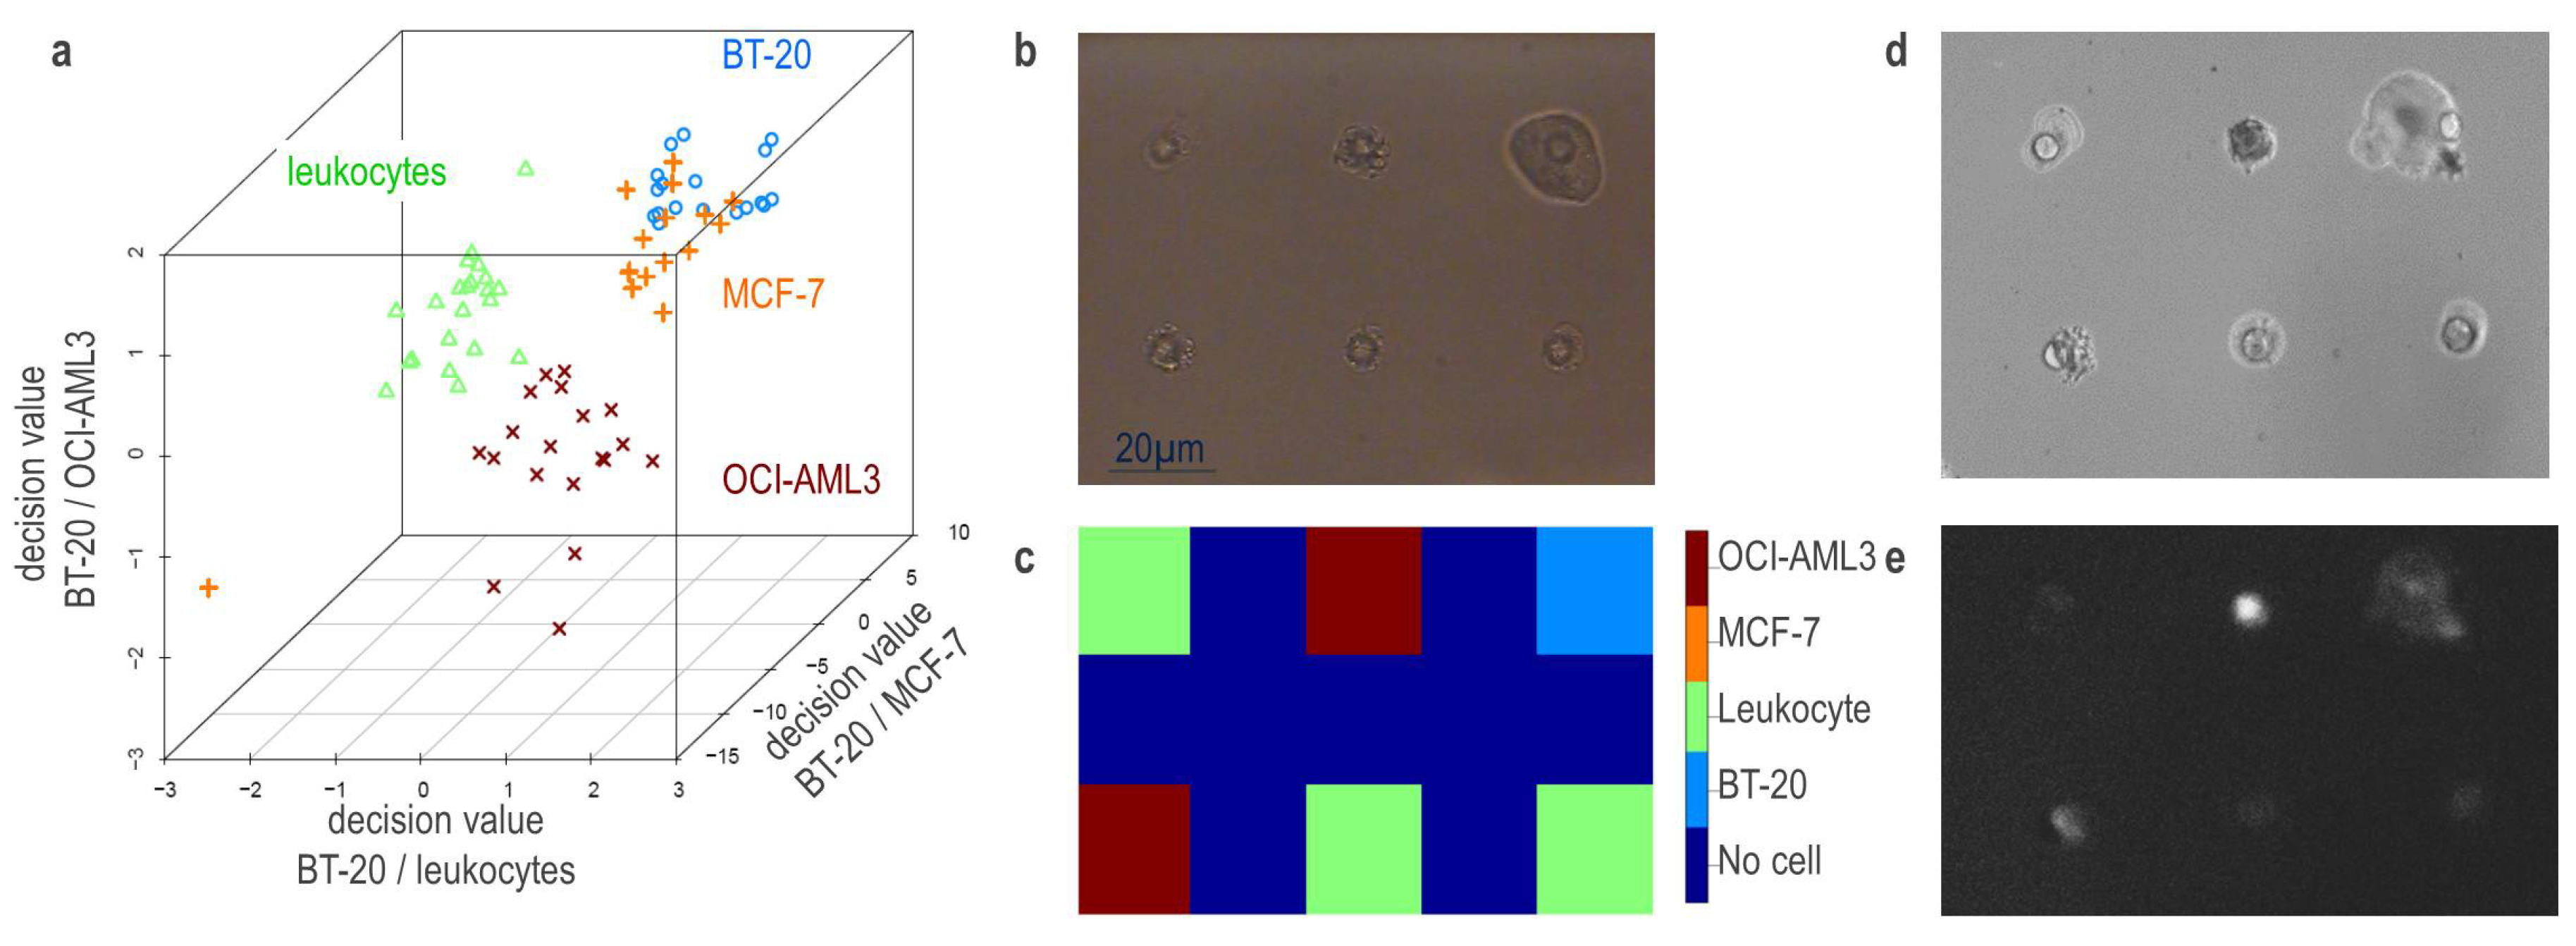
3.5. Identification of Captured Cells in Mixtures

In a next step, a mixture of the different cells was loaded onto the chip. As described above, the cells were entrapped on the microholes of the chip by the negative pressure as can be seen in Figure 4b. While for training the classification model several spectra per cell have been recorded, now the automation feature of the presented device was assessed. In an automated sampling mode each 20 µm a spectrum was recorded with an accumulation time of 8 s, resulting alternating in a spectrum of a cell captured on a microhole and a background spectrum from the empty membrane. Figure 4c shows the result of the assignment of the unknown cells using the support vector machine based classification model. Correctly, the background spectra are assigned as no cell while all the cell spectra could be assigned to the respective cell type with high certainty. The identity of the OCI-AML3, BT-20 and MCF-7 cells was verified by staining the cells before the experiment with dye-conjugated antibodies. Figure 4d shows a white light image of the dried sample after spectroscopic analysis and the corresponding fluorescence image is depicted in Figure 4e. The settings of the image in Figure 4e are optimized to observe the PerCP fluorescence of the OCI-AML3 cells (ex. 488 nm, em. 565–615nm). With these settings the FITC fluorescence of the BT-20 cells can be seen as a week signal as well. No fluorescence could be detected when exciting the leukocytes. Thus, the automated assignment of the classification model based on the Raman data could be verified by the fluorescence assignment.

4. Conclusions and Outlook

It was demonstrated that individual cells can be captured from solution on predefined spots (the holes) on the microhole chips made of a silicon nitride membrane on a silicon carrier structure. The captured cells in solution can be characterized by means of Raman spectroscopy using either single spectrum acquisition for fast initial information or Raman maps for more detailed characteristics. The Raman spectra were successfully used to build a classification model with support vector machines. The very good specificity and no false positive and false negative predictions concerning healthy leukocytes and tumor cells demonstrate the potential power of the system for future cell screening.
The microhole chip offers a high potential for the micromanipulation and sorting of cells. An automation of capturing single cells from cell suspension on predefined spots, collecting their Raman maps and release selectively the unaffected cells seems very feasible. The regularly spaced holes allow future complete automation of readout which will increase the speed of cell analysis. However, with the current technology high-throughput analysis of full blood will still remain challenging. To even further improve the speed, combination of the microhole chip with other Raman based techniques, such as coherent Raman scattering [27] is imaginable. Furthermore, using advanced pressure management systems, selected cells of interest (e.g., the cancer cells) can selectively be released after the analysis and subjected to further analysis, such as molecular biological assays (PCR) or activity testing with chemotherapeutic drugs. This approach is also compatible with recently described multimodal biophotonics workstation for live cell analysis [28].

Acknowledgments

Hagen Thielecke is acknowledged for initiating that project. The technical assistance of Cornelia Jörke is greatly appreciated. We thank Frank Stracke for recording the LSM images.
Financial support of the European Union via EFRE and the EU project “HemoSpec” (CN 611682), the TMBWK (Project: B714-07037) and the Federal Ministry of Education and Research (BMBF) within the project RamanCTC (FKN 13N12685) as well as the Integrated Research and Treatment Center “Center for Sepsis Control and Care” (FKZ 01EO1002) is highly acknowledged.

Author Contributions

U. Neugebauer, C. Kurz, T. Velten, C. Krafft and J. Popp designed the research; U. Neugebauer, C. Kurz, J.H. Clement, T. Berger and T. Bocklitz performed the research (U. Neugebauer, Raman measurements, C. Kurz, chip set-up, J.H. Clement and T. Berger, cell isolation and preparation, T. Bocklitz, statistical analysis); U. Neugebauer, C. Kurz, T. Bocklitz, T. Velten, J.H. Clement, C. Krafft and J. Popp wrote the paper.

Conflicts of Interest

The authors declare no conflict of interest.

References

  1. Yu, M.; Stott, S.; Toner, M.; Maheswaran, S.; Haber, D.A. Circulating tumor cells: Approaches to isolation and characterization. J. Cell Biol. 2011, 192, 373–382. [Google Scholar] [CrossRef]
  2. Pantel, K.; Alix-Panabieres, C. Real-time Liquid Biopsy in Cancer Patients: Fact or Fiction? Cancer Res. 2013, 73, 6384–6388. [Google Scholar] [CrossRef]
  3. Gorges, T.M.; Pantel, K. Circulating tumor cells as therapy-related biomarkers in cancer patients. Cancer Immunol. Immunother. 2013, 62, 931–939. [Google Scholar] [CrossRef]
  4. Riethdorf, S.; Fritsche, H.; Mueller, V.; Rau, T.; Schindibeck, C.; Rack, B.; Janni, W.; Coith, C.; Beck, K.; Jaenicke, F.; et al. Detection of circulating tumor cells in peripheral blood of patients with metastatic breast cancer: A validation study of the CellSearch system. Clin. Cancer Res. 2007, 13, 920–928. [Google Scholar] [CrossRef]
  5. Yoon, H.J.; Kozminsky, M.; Nagrath, S. Emerging role of nanomaterials in circulating tumor cell isolation and analysis. ACS Nano 2014, 8, 1995–2017. [Google Scholar] [CrossRef]
  6. Attard, G.; Swermenhuis, J.F.; Olmos, D.; Reid, A.H.M.; Vickers, E.; A’Hern, R.; Levink, R.; Coumans, F.; Moreira, J.; Riisnaes, R.; et al. Characterization of ERG, AR and PTEN Gene Status in Circulating Tumor Cells from Patients with Castration-Resistant Prostate Cancer. Cancer Res. 2009, 69, 2912–2918. [Google Scholar] [CrossRef]
  7. Stott, S.L.; Hsu, C.-H.; Tsukrov, D.I.; Yu, M.; Miyamoto, D.T.; Waltman, B.A.; Rothenberg, S.M.; Shah, A.M.; Smas, M.E.; Korir, G.K.; et al. Isolation of circulating tumor cells using a microvortex-generating herringbone-chip. Proc. Natl. Acad. Sci. USA 2010, 107, 18392–18397. [Google Scholar] [CrossRef]
  8. Neugebauer, U.; Clement, J.H.; Bocklitz, T.; Krafft, C.; Popp, J. Identification and differentiation of single cells from peripheral blood by Raman spectroscopic imaging. J. Biophotonics 2010, 3, 579–587. [Google Scholar] [CrossRef]
  9. Neugebauer, U.; Bocklitz, T.; Clement, J.H.; Krafft, C.; Popp, J. Towards detection and identification of circulating tumor cells using Raman spectroscopy. Analyst 2010, 135, 3178–3182. [Google Scholar]
  10. Chan, J.W. Recent advances in laser tweezers Raman spectroscopy (LTRS) for label-free analysis of single cells. J. Biophotonics 2013, 6, 36–48. [Google Scholar] [CrossRef]
  11. Dochow, S.; Krafft, C.; Neugebauer, U.; Bocklitz, T.; Henkel, T.; Mayer, G.; Albert, J.; Popp, J. Tumor cell identification by means of Raman spectroscopy in combination with optical traps and microfluidic environments. Lab Chip 2011, 11, 1484–1490. [Google Scholar] [CrossRef]
  12. Dochow, S.; Beleites, C.; Henkel, T.; Mayer, G.; Albert, J.; Clement, J.; Krafft, C.; Popp, J. Quartz microfluidic chip for tumor cell identification by Raman spectroscopy in combination with optical traps. Anal. Bioanal. Chem. 2013, 405, 2743–2746. [Google Scholar] [CrossRef]
  13. Zheng, G.A. Chip-scale microscopy imaging. J. Biophotonics 2012, 5, 639–649. [Google Scholar] [CrossRef]
  14. Kurz, C.M.; Buth, H.; Sossalla, A.; Vermeersch, V.; Toncheva, V.; Dubruel, P.; Schacht, E.; Thielecke, H. Chip-based impedance measurement on single cells for monitoring sub-toxic effects on cell membranes. Biosens. Bioelectron. 2011, 26, 3405–3412. [Google Scholar] [CrossRef]
  15. Matsunaga, T.; Hosokawa, M.; Arakaki, A.; Taguchi, T.; Mori, T.; Tanaka, T.; Takeyama, H. High-efficiency single-cell entrapment and fluorescence in situ hybridization analysis using a poly(dimethylsiloxane) microfluidic device integrated with a black poly(ethylene terephthalate) micromesh. Anal. Chem. 2008, 80, 5139–5145. [Google Scholar] [CrossRef]
  16. Hosokawa, M.; Arakaki, A.; Takahashi, M.; Mori, T.; Takeyama, H.; Matsunaga, T. High-density microcavity array for cell detection: Single-cell analysis of hematopoietic stem cells in peripheral blood mononuclear cells. Anal. Chem. 2009, 81, 5308–5313. [Google Scholar]
  17. Cho, S.; Thielecke, H. Micro hole-based cell chip with impedance spectroscopy. Biosens. Bioelectron. 2007, 22, 1764–1768. [Google Scholar] [CrossRef]
  18. Kurz, C.M.; Maurer, A.; Thees, K.; Schillberg, S.; Velten, T.; Thielecke, H. Impedance-controlled cell entrapment using microhole-array chips allows the isolation and identification of single, highly productive cells. Sens. Actuators B Chem. 2011, 158, 345–352. [Google Scholar] [CrossRef]
  19. Pachmann, K.; Clement, J.H.; Schneider, C.P.; Willen, B.; Camara, O.; Pachmann, U.; Hoffken, K. Standardized quantification of circulating peripheral tumor cells from lung and breast cancer. Clin. Chem. Lab. Med. 2005, 43, 617–627. [Google Scholar]
  20. Schwalbe, M.; Pachmann, K.; Hoffken, K.; Clement, J.H. Improvement of the separation of tumor cells from peripheral blood cells using magnetic nanoparticles. J. Phys. Condens. Matter 2006, 18, S2865–S2876. [Google Scholar] [CrossRef]
  21. R Development Core Team. R: A Language and Environment for Statistical Computing; R Foundation for Statistical Computing: Vienna, Austria, 2007. [Google Scholar]
  22. Ryan, C.G.; Clayton, E.; Griffin, W.L.; Sie, S.H.; Cousens, D.R. SNIP, a statistics-sensitive background treatment for the quantitative analysis of pixe spectra in geosience aplications. Nucl. Instrum. Methods Phys. Res. Sect. B 1988, 34, 396–402. [Google Scholar] [CrossRef]
  23. Chang, C.-C.; Lin, C.-J. LIBSVM: A library for support vector machines. ACM Trans. Intell. Syst. Technol. 2011, 2, 1–27. [Google Scholar] [CrossRef]
  24. Giorgis, F.; Pirri, C.F. Characterization and Physical Properties of Non-Crystalline and Nanostructured Silicon-Based Alloys. In Slicon-Based Materials and Devices; Singh, N.H., Ed.; Acedemic Press: San Diego, CA, USA, 2001; pp. 187–236. [Google Scholar]
  25. Dochow, S.; Bergner, N.; Krafft, C.; Clement, J.; Mazilu, M.; Balagopal, B.; Marchington, R.; Dholakia, K.; Popp, J. Classification of Raman spectra of single cells with autofluorescence suppression by wavelength modulated excitation. Anal. Methods 2013, 5, 4608–4614. [Google Scholar] [CrossRef]
  26. Beleites, C.; Neugebauer, U.; Bocklitz, T.; Krafft, C.; Popp, J. Sample size planning for classification models. Anal. Chim. Acta 2013, 760, 25–33. [Google Scholar] [CrossRef]
  27. Suhalim, J.L.; Boik, J.C.; Tromberg, B.J.; Potma, E.O. The need for speed. J. Biophotonics 2012, 5, 387–395. [Google Scholar] [CrossRef]
  28. Esseling, M.; Kemper, B.; Antkowiak, M.; Stevenson, D.J.; Chaudet, L.; Neil, M.A.A.; French, P.W.; von Bally, G.; Dholakia, K.; Denz, C. Multimodal biophotonic workstation for live cell analysis. J. Biophotonics 2012, 5, 9–13. [Google Scholar] [CrossRef]

