
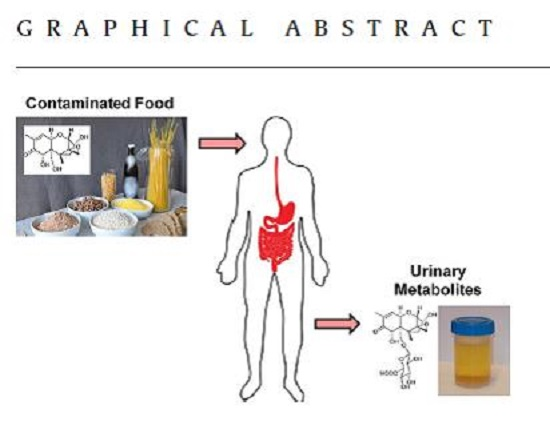
Determination of Deoxynivalenol in the Urine of Pregnant Women in the UK

 , , ,
, , ,  ,
, 
Abstract
:
1. Introduction
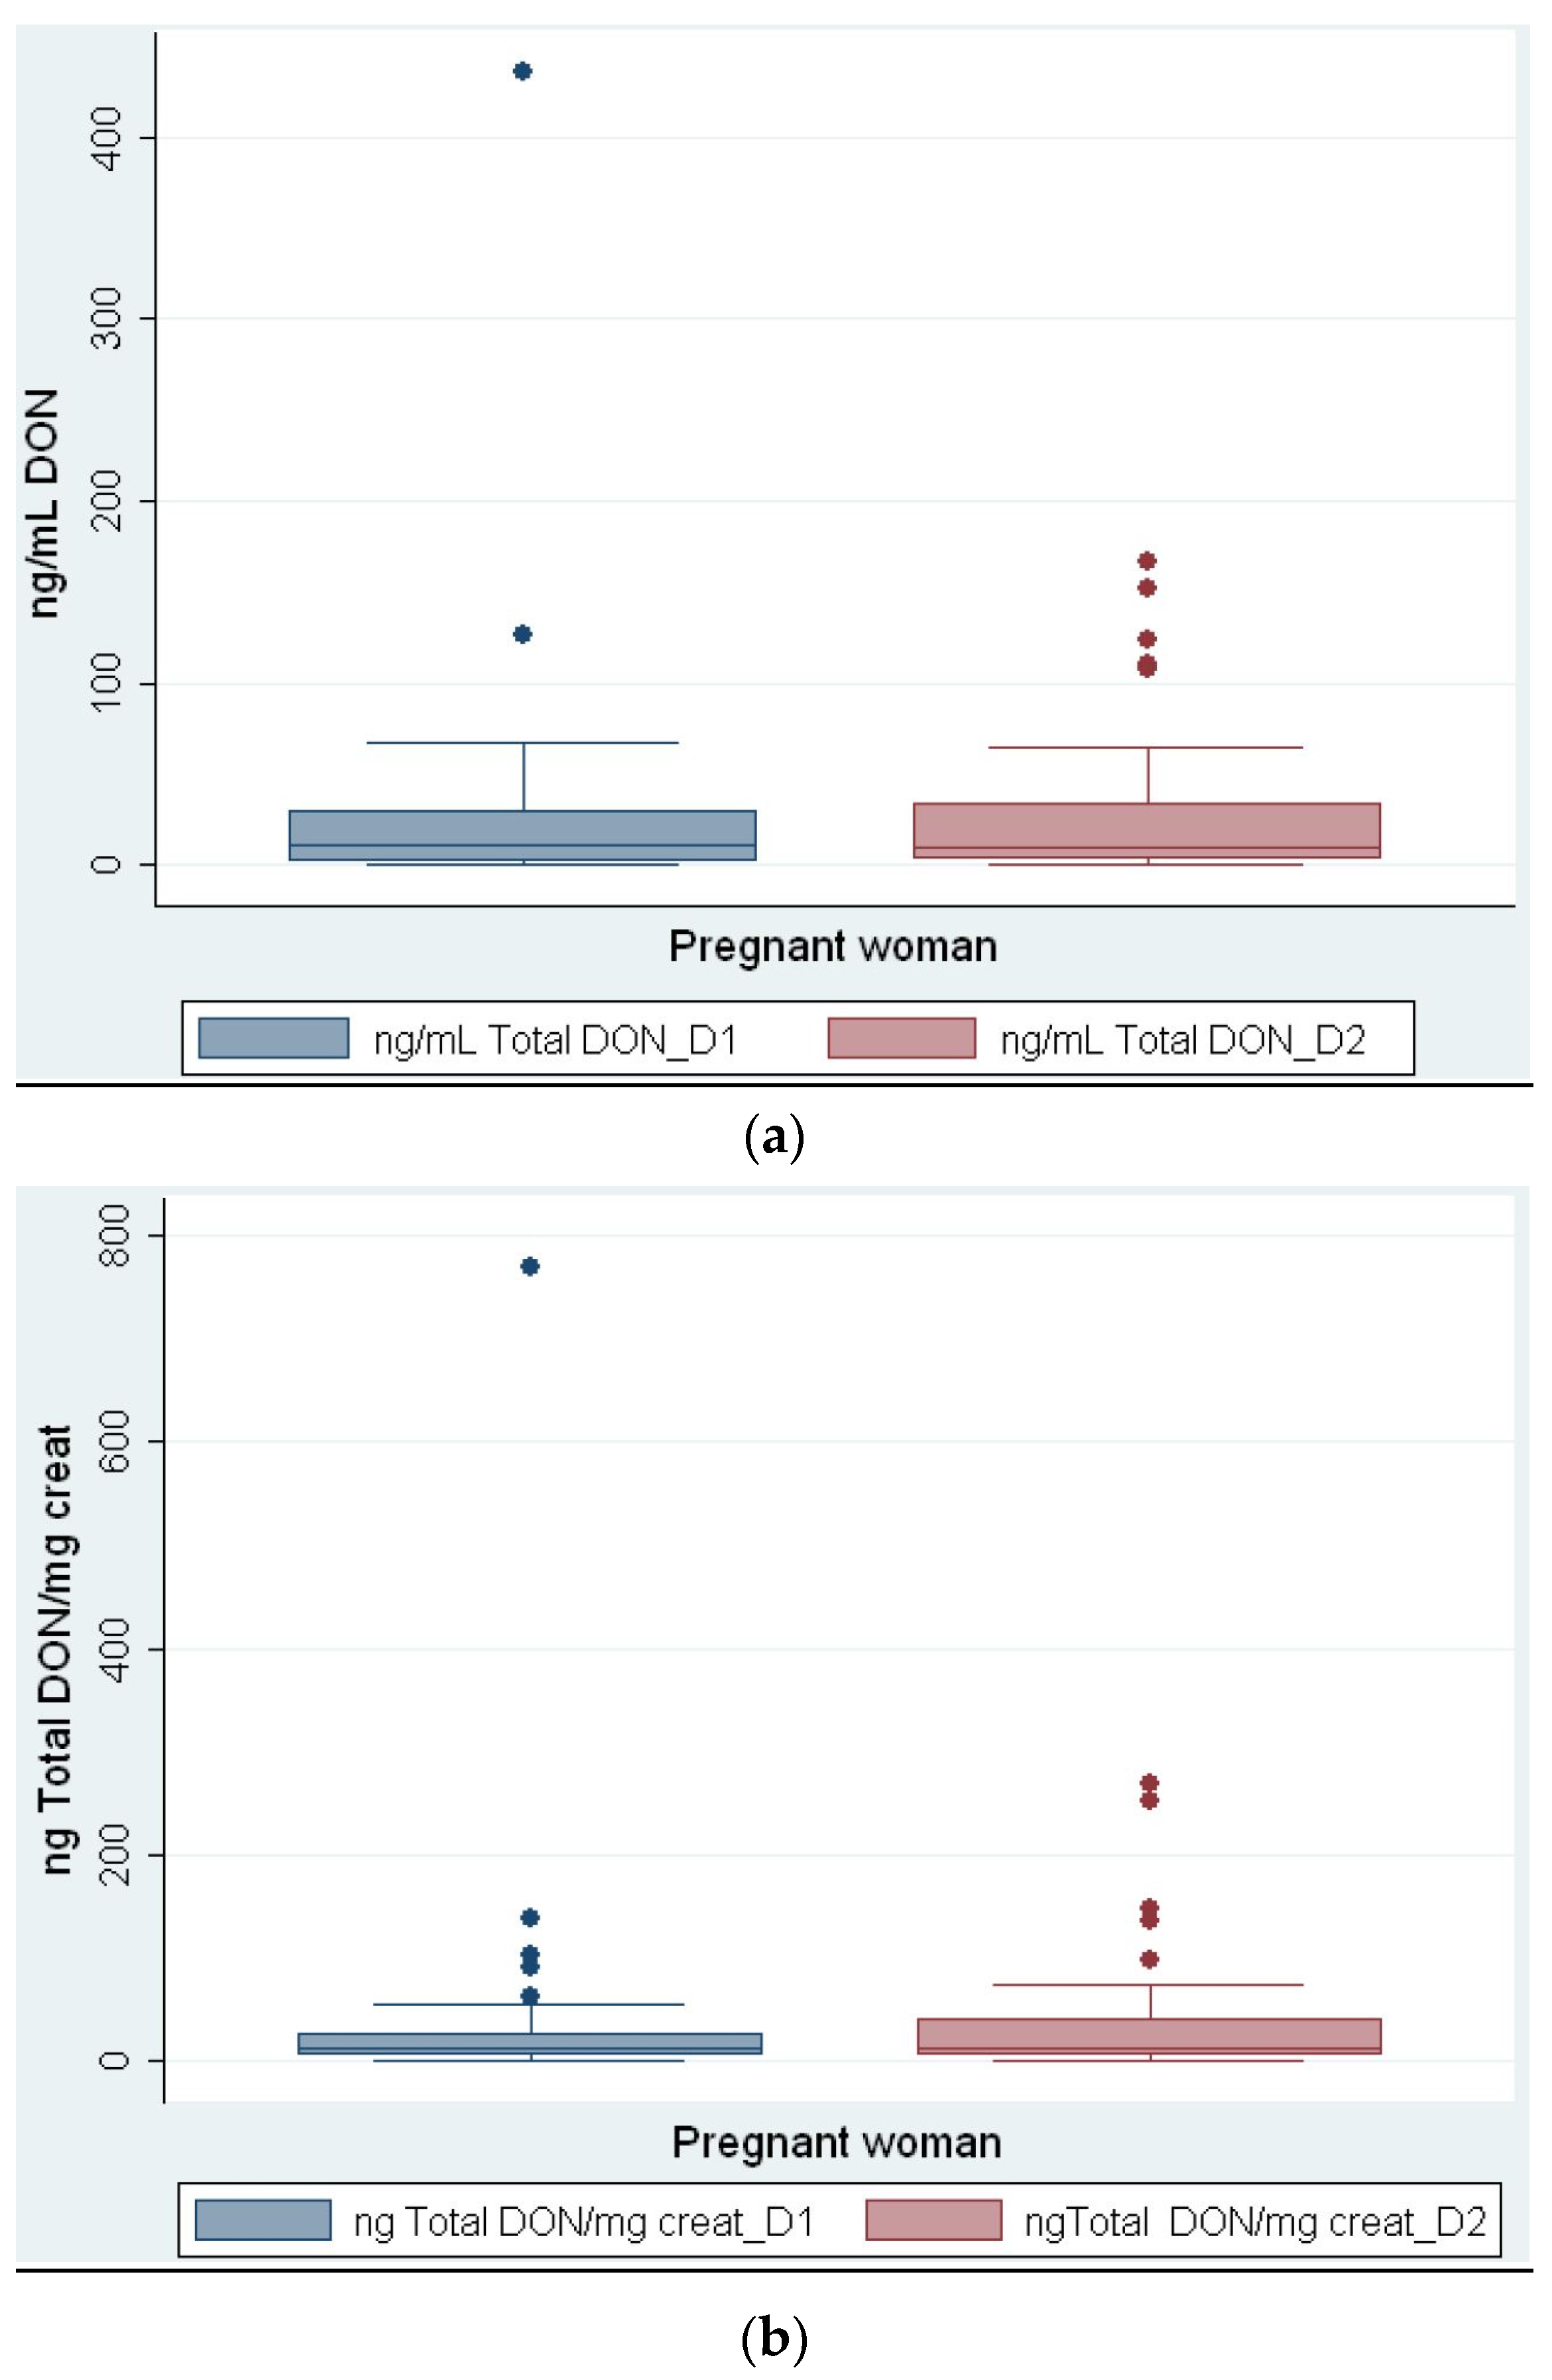
2. Results
3. Discussion
4. Conclusions
5. Experimental Section
5.1. Ethics
Recruitment
5.2. Methods
5.2.1. Aliquot 1
5.2.2. Aliquot 2
5.2.3. LC-MS Analysis—DON Determination
5.2.4. LC-MS Analysis—DOM-1 Determination
5.2.5. Creatinine Analysis
5.2.6. Dietary Analysis
Acknowledgments
Author Contributions
Conflicts of Interest
Abbreviations
| b.w. | Body weight |
| FFQ | Food frequency questionnaire |
| DON | Deoxynivalenol |
| EFSA | European Food Safety Authority |
| NHANES | National Health and Nutrition Examination Survey |
| BMI | Body Mass Index |
| DOM-1 | De-epoxi Deoxynivalenol |
| rTDI | recommended tolerable daily intake |
| GM | Geometric mean |
| PMTDI | Provisional maximum tolerable daily intake |
| ARfD | Acute Reference Dose |
| LC-MS | liquid chromatography–mass spectrometry |
| UK | United Kingdom |
References
- Scientific Committee on Food (SCF). Opinion of the Scientific Committee on Food on Fusarium toxins. Part 6: Group Evaluation of T-2 Toxin, HT-2 Toxin, Nivalenol and Deoxynivalenol. Available online: http://ec.europa.eu/food/fs/sc/scf/out123_en.pdf (acessed on 3 October 2016).
- Eriksen, G.S.; Alexander, J. Fusarium Toxins in Cereals—A Risk Assessment; Nordic Council of Ministers: Copenhagen, Denmark, 1998. [Google Scholar]
- World Health Organization. Evaluation of Certain Mycotoxins in Food; Fifty-Sixth Report of the Joint FAO/WHO Expert Committee on Food Additives; WHO Technical Report Series; WHO: Geneva, Switzerland, 2002; Volume 906, pp. 1–62. [Google Scholar]
- Joint Expert Committee on Food and Additives (JECFA). Evaluation of Certain Food Additives and Contaminants; Report of the Seventy-Second Meeting of the Joint FAO/WHO Expert Committee on Food Additives; WHO Technical Report Series; WHO: Geneva, Switzerland, 2010; p. 105. [Google Scholar]
- Turner, P.C.; Burley, V.J.; Rothwell, J.A.; White, K.L.; Cade, J.E.; Wild, C.P. Deoxynivalenol: Rationale for development and application of a urinary biomarker. Food Addit. Contam. Part A Chem. Anal. Control Expo. Risk Assess. 2008, 25, 864–871. [Google Scholar] [CrossRef] [PubMed]
- Tiemann, U.; Brüssow, K.-P.; Dannenberger, D.; Jonas, L.; Pöhland, R.; Jäger, K.; Dänicke, S.; Hagemann, E. The effect of feeding a diet naturally contaminated with deoxynivalenol (DON) and zearalenone (ZON) on the spleen and liver of sow and fetus from day 35 to 70 of gestation. Toxicol. Lett. 2008, 179, 113–117. [Google Scholar] [CrossRef] [PubMed]
- Jakovac-Strajn, B.; Vengust, A.; Pestevsek, U. Effects of a deoxynivalenol-contaminated diet on the reproductive performance and immunoglobulin concentrations in pigs. Vet. Rec. 2009, 165, 713–718. [Google Scholar] [PubMed]
- Prelusky, D.B.; Trenholm, H.L. The efficacy of various classes of anti-emetics in preventing Deoxynivalenol-induced vomiting in swine. Nat. Toxins 1993, 1, 296–302. [Google Scholar] [CrossRef] [PubMed]
- Pestka, J.J.; Lin, W.S.; Miller, E.R. Emetic activity of the trichothecene 15-acetyldeoxynivalenol in swine. Food Chem. Toxicol. 1987, 25, 855–858. [Google Scholar] [CrossRef]
- Pestka, J.J.; Smolinski, A.T. Deoxynivalenol: Toxicology and potential effects on humans. J. Toxicol. Environ. Health B Crit. Rev. 2005, 8, 39–69. [Google Scholar] [CrossRef] [PubMed]
- Myllynen, P.; Immonen, E.; Kummu, M.; Vähäkangas, K. Developmental expression of drug metabolizing enzymes and transporter proteins in human placenta and fetal tissues. Expert Opin. Drug Metab. Toxicol. 2009, 5, 1483–1499. [Google Scholar] [CrossRef] [PubMed]
- Brera, C.; De Santis, B.; Debegnach, F.; Miano, B.; Moretti, G.; Lanzone, A.; Del Sordo, G.; Buonsenso, D.; Chiaretti, A.; White, K.; et al. Experimental study of deoxynivalenol biomarkers in urine. EFSA J. 2015, 12. [Google Scholar] [CrossRef]
- Food Standards Agency. Food Portion Sizes, 3rd ed.; TSO: London, UK, 2005. [Google Scholar]
- Council for Agricultural Science and Techology. Mycotoxins: Risks in Plant, Animal, and Human Systems; CAST: Ames, IA, USA, 2003. [Google Scholar]
- Hepworth, S.J.; Hardie, L.J.; Fraser, L.K.; Burley, V.J.; Mijal, R.S.; Wild, C.P.; Azad, R.; McKinney, P.A.; Turner, P.C. Deoxynivalenol exposure assessment in a cohort of pregnant women from Bradford, UK. Food Addit. Contam. Part A Chem. Anal. Control Expo. Risk Assess. 2012, 29, 269–276. [Google Scholar] [CrossRef] [PubMed]
- Turner, P.C.; Rothwell, J.A.; White, K.L.; Gong, Y.; Cade, J.E.; Wild, C.P. Urinary deoxynivalenol is correlated with cereal intake in individuals from the United kingdom. Environ. Health Perspect. 2008, 116, 21–25. [Google Scholar] [CrossRef] [PubMed]
- Ali, N.; Blaszkewicz, M.; Nahid, A.A.; Rahman, M.; Degen, G.H. Deoxynivalenol Exposure Assessment for Pregnant Women in Bangladesh. Toxins 2015, 7, 3845–3857. [Google Scholar] [CrossRef] [PubMed]
- Piekkola, S.; Turner, P.C.; Abdel-Hamid, M.; Ezzat, S.; El-Daly, M.; El-Kafrawy, S.; Savchenko, E.; Poussa, T.; Woo, J.C.S.; Mykkänen, H.; et al. Characterisation of aflatoxin and deoxynivalenol exposure among pregnant Egyptian women. Food Addit. Contam. Part A Chem. Anal. Control Expo. Risk Assess. 2012, 29, 962–971. [Google Scholar] [CrossRef] [PubMed]
- Slimani, N.; Deharveng, G.; Charrondière, R.U.; van Kappel, A.L.; Ocké, M.C.; Welch, A.; Lagiou, A.; van Liere, M.; Agudo, A.; Pala, V.; et al. Structure of the standardized computerized 24-h diet recall interview used as reference method in the 22 centers participating in the EPIC project. European Prospective Investigation into Cancer and Nutrition. Comput. Methods Prog. Biomed. 1999, 58, 251–266. [Google Scholar] [CrossRef]
- Welch, A.A.; Luben, R.; Khaw, K.T.; Bingham, S.A. The CAFE computer program for nutritional analysis of the EPIC-Norfolk food frequency questionnaire and identification of extreme nutrient values. J. Hum. Nutr. Diet. 2005, 18, 99–116. [Google Scholar] [CrossRef] [PubMed]
- Cade, J.E.; Burley, V.J.; Warm, D.L.; Thompson, R.L.; Margetts, B.M. Food-frequency questionnaires: A review of their design, validation and utilisation. Nutr. Res. Rev. 2004, 17, 5–22. [Google Scholar] [CrossRef] [PubMed]
- Vioque, J.; Navarrete-Muñoz, E.M.; Gimenez-Monzó, D.; García-de-la-Hera, M.; Granado, F.; Young, I.S.; Ramón, R.; Ballester, F.; Murcia, M.; Rebagliato, M.; et al. Reproducibility and validity of a food frequency questionnaire among pregnant women in a Mediterranean area. Nutr. J. 2013, 12. [Google Scholar] [CrossRef] [PubMed]
- Centers for Disease Control and Prevention (CDC). Available online: http://www.cdc.gov/nchs/nhanes/nhanes_questionnaires.htm (accessed on 23 June 2014).
- Cheyette, C.; Balolia, Y. A Visual Guide to Carbohydrate & Calorie Counting for People with Diabetes; Chello publishing limited: London, UK, 2010. [Google Scholar]
- European Food Safety Authority (EFSA). Evaluation of the FoodEx, the food classification system applied to the development of the EFSA Comprehensive European Food Consumption Database. EFSA J. 2011, 9, 27. [Google Scholar] [CrossRef]
© 2016 by the authors; licensee MDPI, Basel, Switzerland. This article is an open access article distributed under the terms and conditions of the Creative Commons Attribution (CC-BY) license (http://creativecommons.org/licenses/by/4.0/).
Share and Cite
Wells, L.; Hardie, L.; Williams, C.; White, K.; Liu, Y.; De Santis, B.; Debegnach, F.; Moretti, G.; Greetham, S.; Brera, C.; et al. Determination of Deoxynivalenol in the Urine of Pregnant Women in the UK. Toxins 2016, 8, 306. https://doi.org/10.3390/toxins8110306
Wells L, Hardie L, Williams C, White K, Liu Y, De Santis B, Debegnach F, Moretti G, Greetham S, Brera C, et al. Determination of Deoxynivalenol in the Urine of Pregnant Women in the UK. Toxins. 2016; 8(11):306. https://doi.org/10.3390/toxins8110306
Chicago/Turabian StyleWells, Liz, Laura Hardie, Courtney Williams, Kay White, Yunru Liu, Barbara De Santis, Francesca Debegnach, Georgio Moretti, Stephanie Greetham, Carlo Brera, and et al. 2016. "Determination of Deoxynivalenol in the Urine of Pregnant Women in the UK" Toxins 8, no. 11: 306. https://doi.org/10.3390/toxins8110306
APA StyleWells, L., Hardie, L., Williams, C., White, K., Liu, Y., De Santis, B., Debegnach, F., Moretti, G., Greetham, S., Brera, C., Rigby, A., Atkin, S., & Sathyapalan, T. (2016). Determination of Deoxynivalenol in the Urine of Pregnant Women in the UK. Toxins, 8(11), 306. https://doi.org/10.3390/toxins8110306