Article

Geographical Patterns in Cyanobacteria Distribution: Climate Influence at Regional Scale

1
Limnologie sarl, 16 rue Paul Langevin, Rennes 35200, France
2
Ecole des Hautes Etudes en Santé Publique de Rennes (EHESP), Sorbonne Paris Cité, Avenue du Professeur Léon Bernard-CS 74312, Rennes Cedex 35043, France
3
Institut National de la Santé Et de la Recherche Médical (INSERM), Unité 185, Institut de Recherche Santé Environnement et Travail (IRSET), Laboratoire d'Etude et Recherche en Environnement et Santé (LERES), 101 rue de Tolbiac, 75654 Paris Cedex 13, France
*
Author to whom correspondence should be addressed.
Toxins 2014, 6(2), 509-522; https://doi.org/10.3390/toxins6020509
Submission received: 30 October 2013 / Revised: 15 January 2014 / Accepted: 20 January 2014 / Published: 28 January 2014
(This article belongs to the Collection Marine and Freshwater Toxins)

Abstract

:
Cyanobacteria are a component of public health hazards in freshwater environments because of their potential as toxin producers. Eutrophication has long been considered the main cause of cyanobacteria outbreak and proliferation, whereas many studies emphasized the effect of abiotic parameters (mainly temperature and light) on cell growth rate or toxin production. In view of the growing concerns of global change consequences on public health parameters, this study attempts to enlighten climate influence on cyanobacteria at regional scale in Brittany (NW France). The results show that homogeneous cyanobacteria groups are associated with climatic domains related to temperature, global radiation and pluviometry, whereas microcystins (MCs) occurrences are only correlated to local cyanobacteria species composition. As the regional climatic gradient amplitude is similar to the projected climate evolution on a 30-year timespan, a comparison between the present NW and SE situations was used to extrapolate the evolution of geographical cyanobacteria distribution in Brittany. Cyanobacteria composition should shift toward species associated with more frequent Microcystins occurrences along a NW/SE axis whereas lakes situated along a SW/NE axis should transition to species (mainly Nostocales) associated with lower MCs detection frequencies.

1. Introduction

Since their appearance in the public health debate, cyanobacteria and their toxins have gradually become a major concern for public health authorities [1,2].
While relations between cyanobacterial blooms and eutrophication are widely acknowledged [3], the influence of meteorological parameters is of growing concern in a changing climate context. Some recent review articles outline that in hotter environments, cyanobacteria could be advantaged compared to other planktonic taxa, and health issues associated with cyanobacterial toxin occurrences could thus become more pregnant [4,5,6,7,8,9].
However, if a changing climate can lead to predictable consequences on larger time and/or geographical scales, extrapolating these changes to the short term and on local scale is still complex [10]. It can be noted, for example, that local, long term studies related to single lakes can lead to different or diverging conclusions [11,12,13], whereas all studies acknowledge that climate change should lead to major modifications in phytoplankton populations [14,15,16], although counter-examples exist [17].
Common abiotic parameters such as light and temperature have long been shown to influence selection and growth rates of potentially toxic species [18,19,20,21,22,23] and toxin biosynthesis [24,25,26,27,28]. These results emphasize the possible consequences of a large scale environment warming up on health hazards related to cyanobacteria [6,7,16,23,29,30,31].
In this context, this paper aims at studying climate influence on cyanobacteria on a regional scale in Brittany (north-western France). Preliminary studies have already shown that the local oceanic-type climate of Brittany has been warming up for the last 30 years [32], and that cyanobacteria are widely encountered in most recreational lakes [33]. In the same time, available interannual monitoring data tend to show that cyanobacteria are increasingly present, with expansion parameters related to climate and lake morphology [34]. The present study is based on the observation that climate evolution at regional scale is of the same magnitude of latitudinal meteorological gradients, leading to the hypothesis that a comparison between eastern and western Brittany can give insights of the potential future situation regarding cyanobacteria (species composition, toxin occurrences) in a 30-year timespan.

2. Results and Discussion

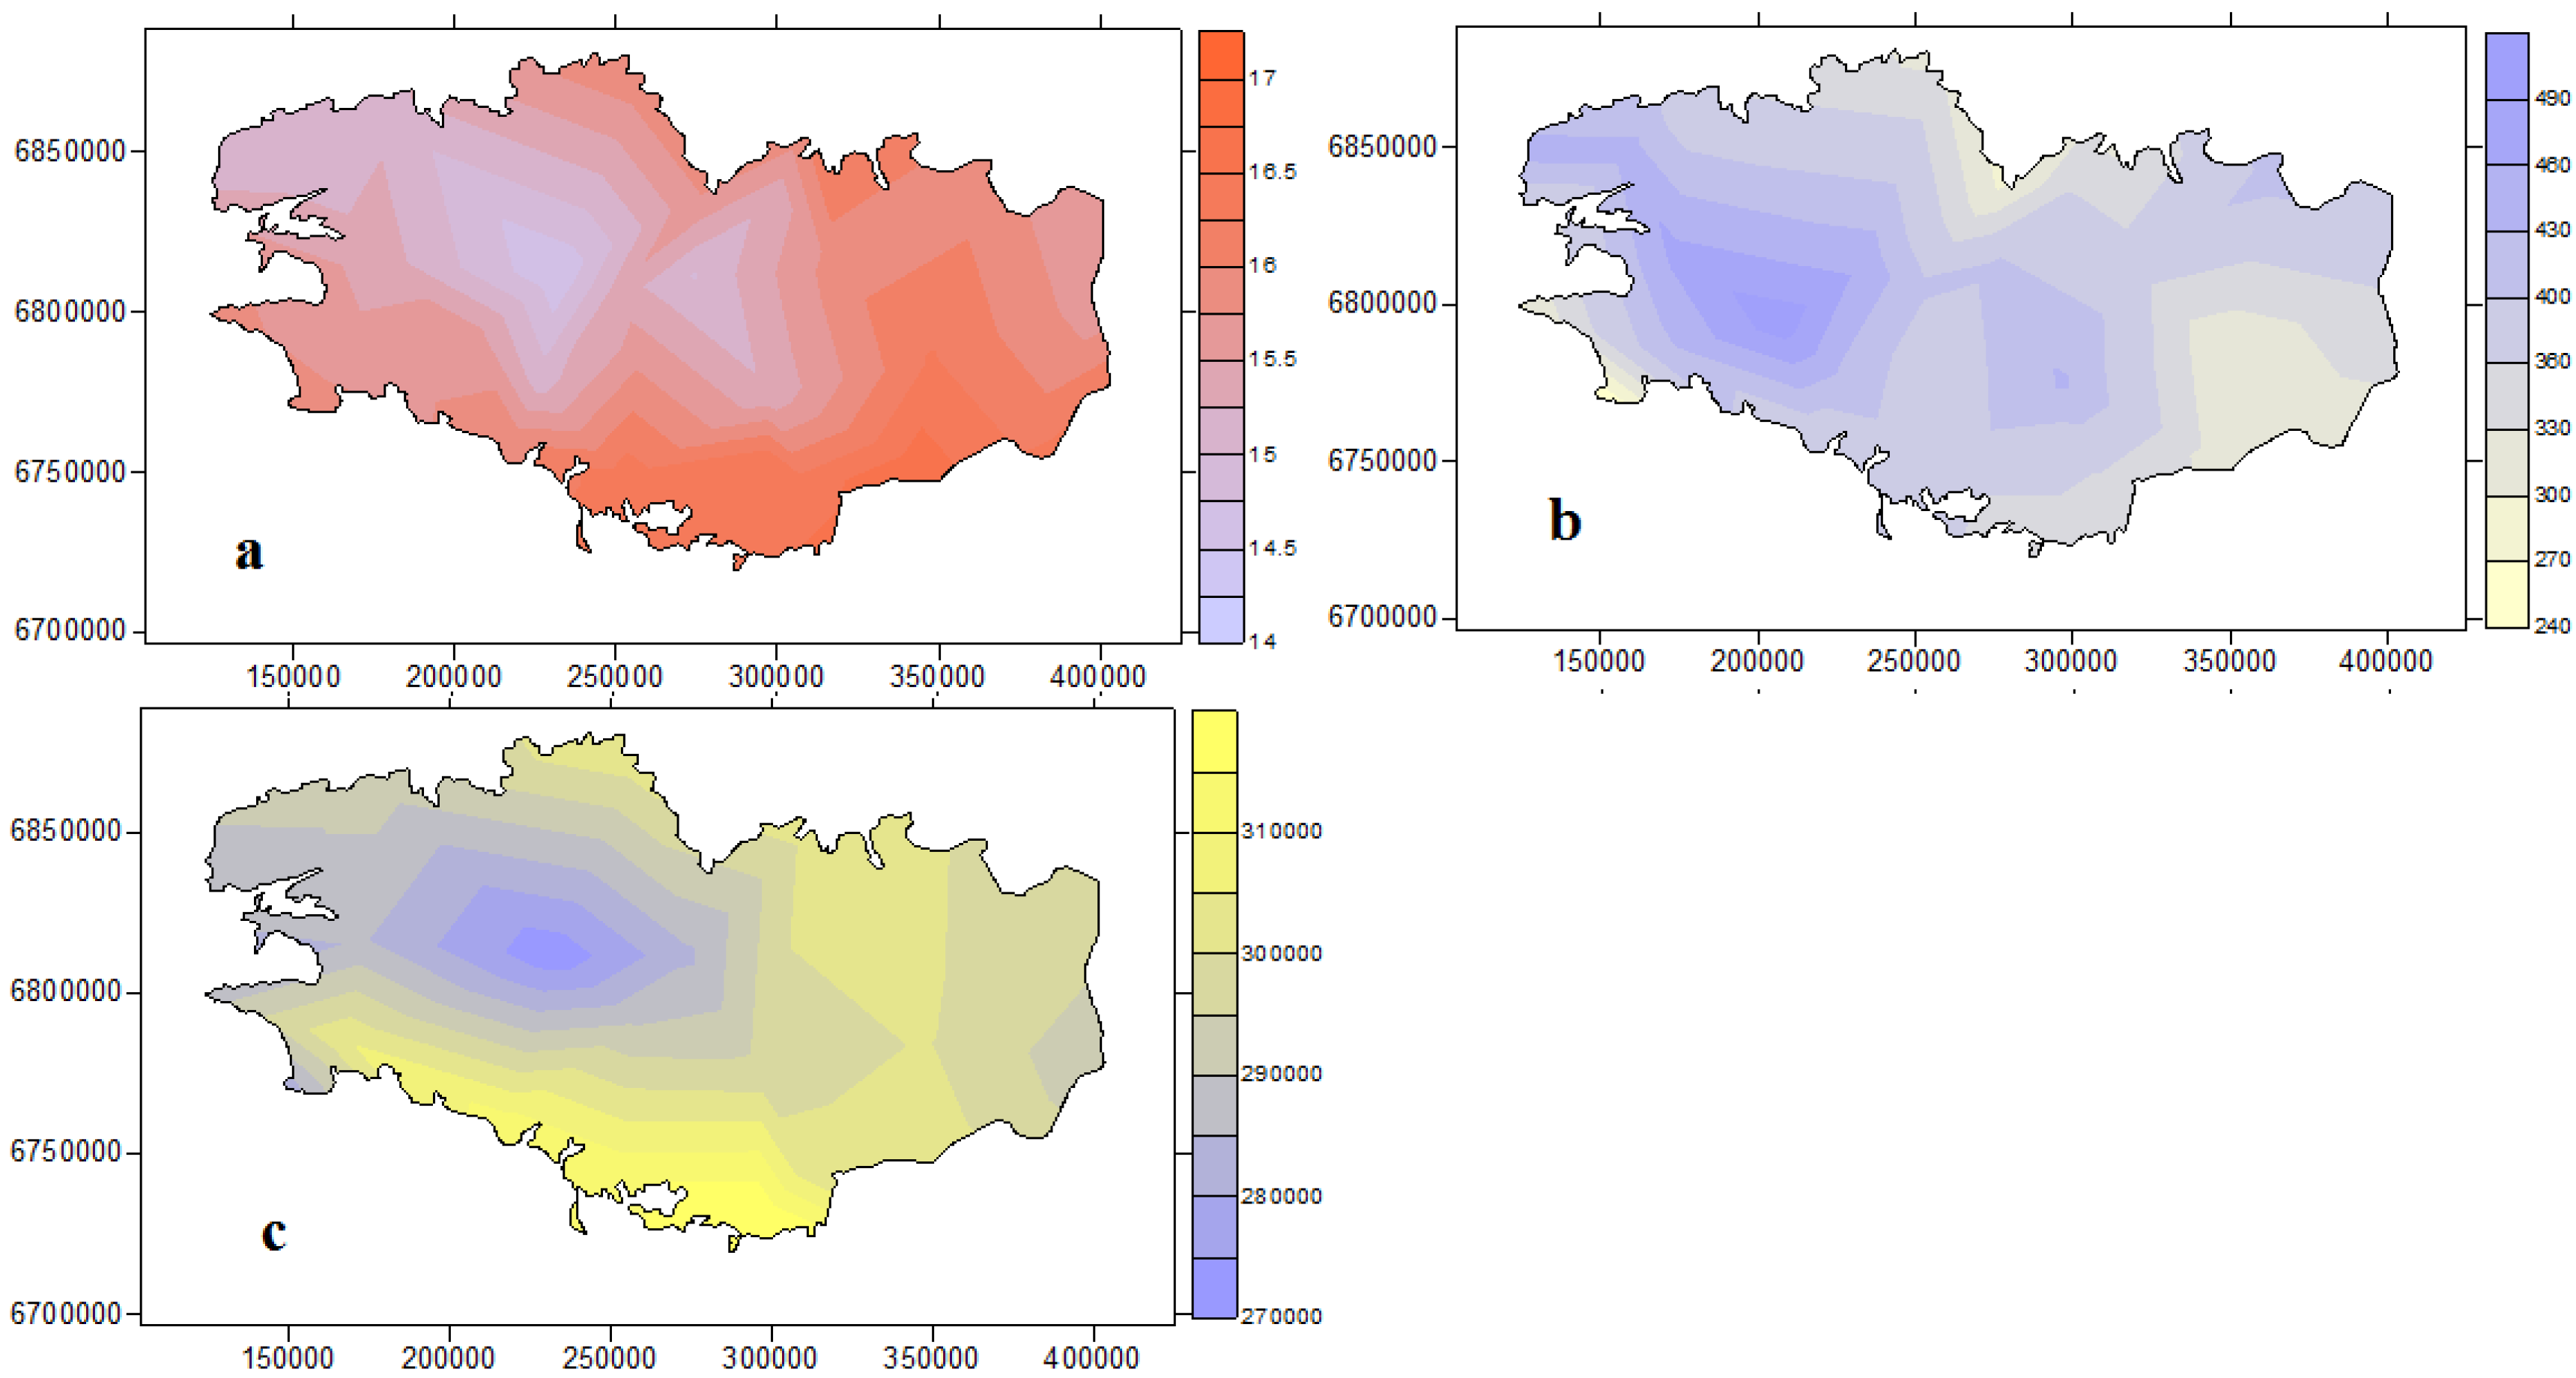
2.1. Regional Climate Characteristics

Brittany is characterized by an oceanic climate and mild conditions all year round, summarized in Table 1. These parameters follow a longitudinal gradient along a WNW-ESE axis, with a colder/wetter NW quadrant and drier/hotter SE quadrant (Figure 1). In the following study, only May–October conditions were considered for the evaluation of cyanobacteria distribution as no recreational water monitoring is conducted during the other months.
Table 1. Meteorological parameters expressed as monthly means from 2004 to 2011 in Brittany.
ParameterDecember–MarchMay–October
MinimunMeanMaximunMinimunMeanMaximun
Mean Temperature (°C)3.76.69.212.215.920.1
Mean Pluviometry (mm)498411925.561.1137.3
Mean Global Radiation (kW/m²)8.6517.5334.3022.5549.5467.51
Figure 1. Meteorological parameters for the May–October period from 2004 to 2011. (a) Mean temperature (°C); (b) Cumulated pluviometry (mm); (c) Cumulated global radiation (kW/m²).
Toxins 06 00509 g001

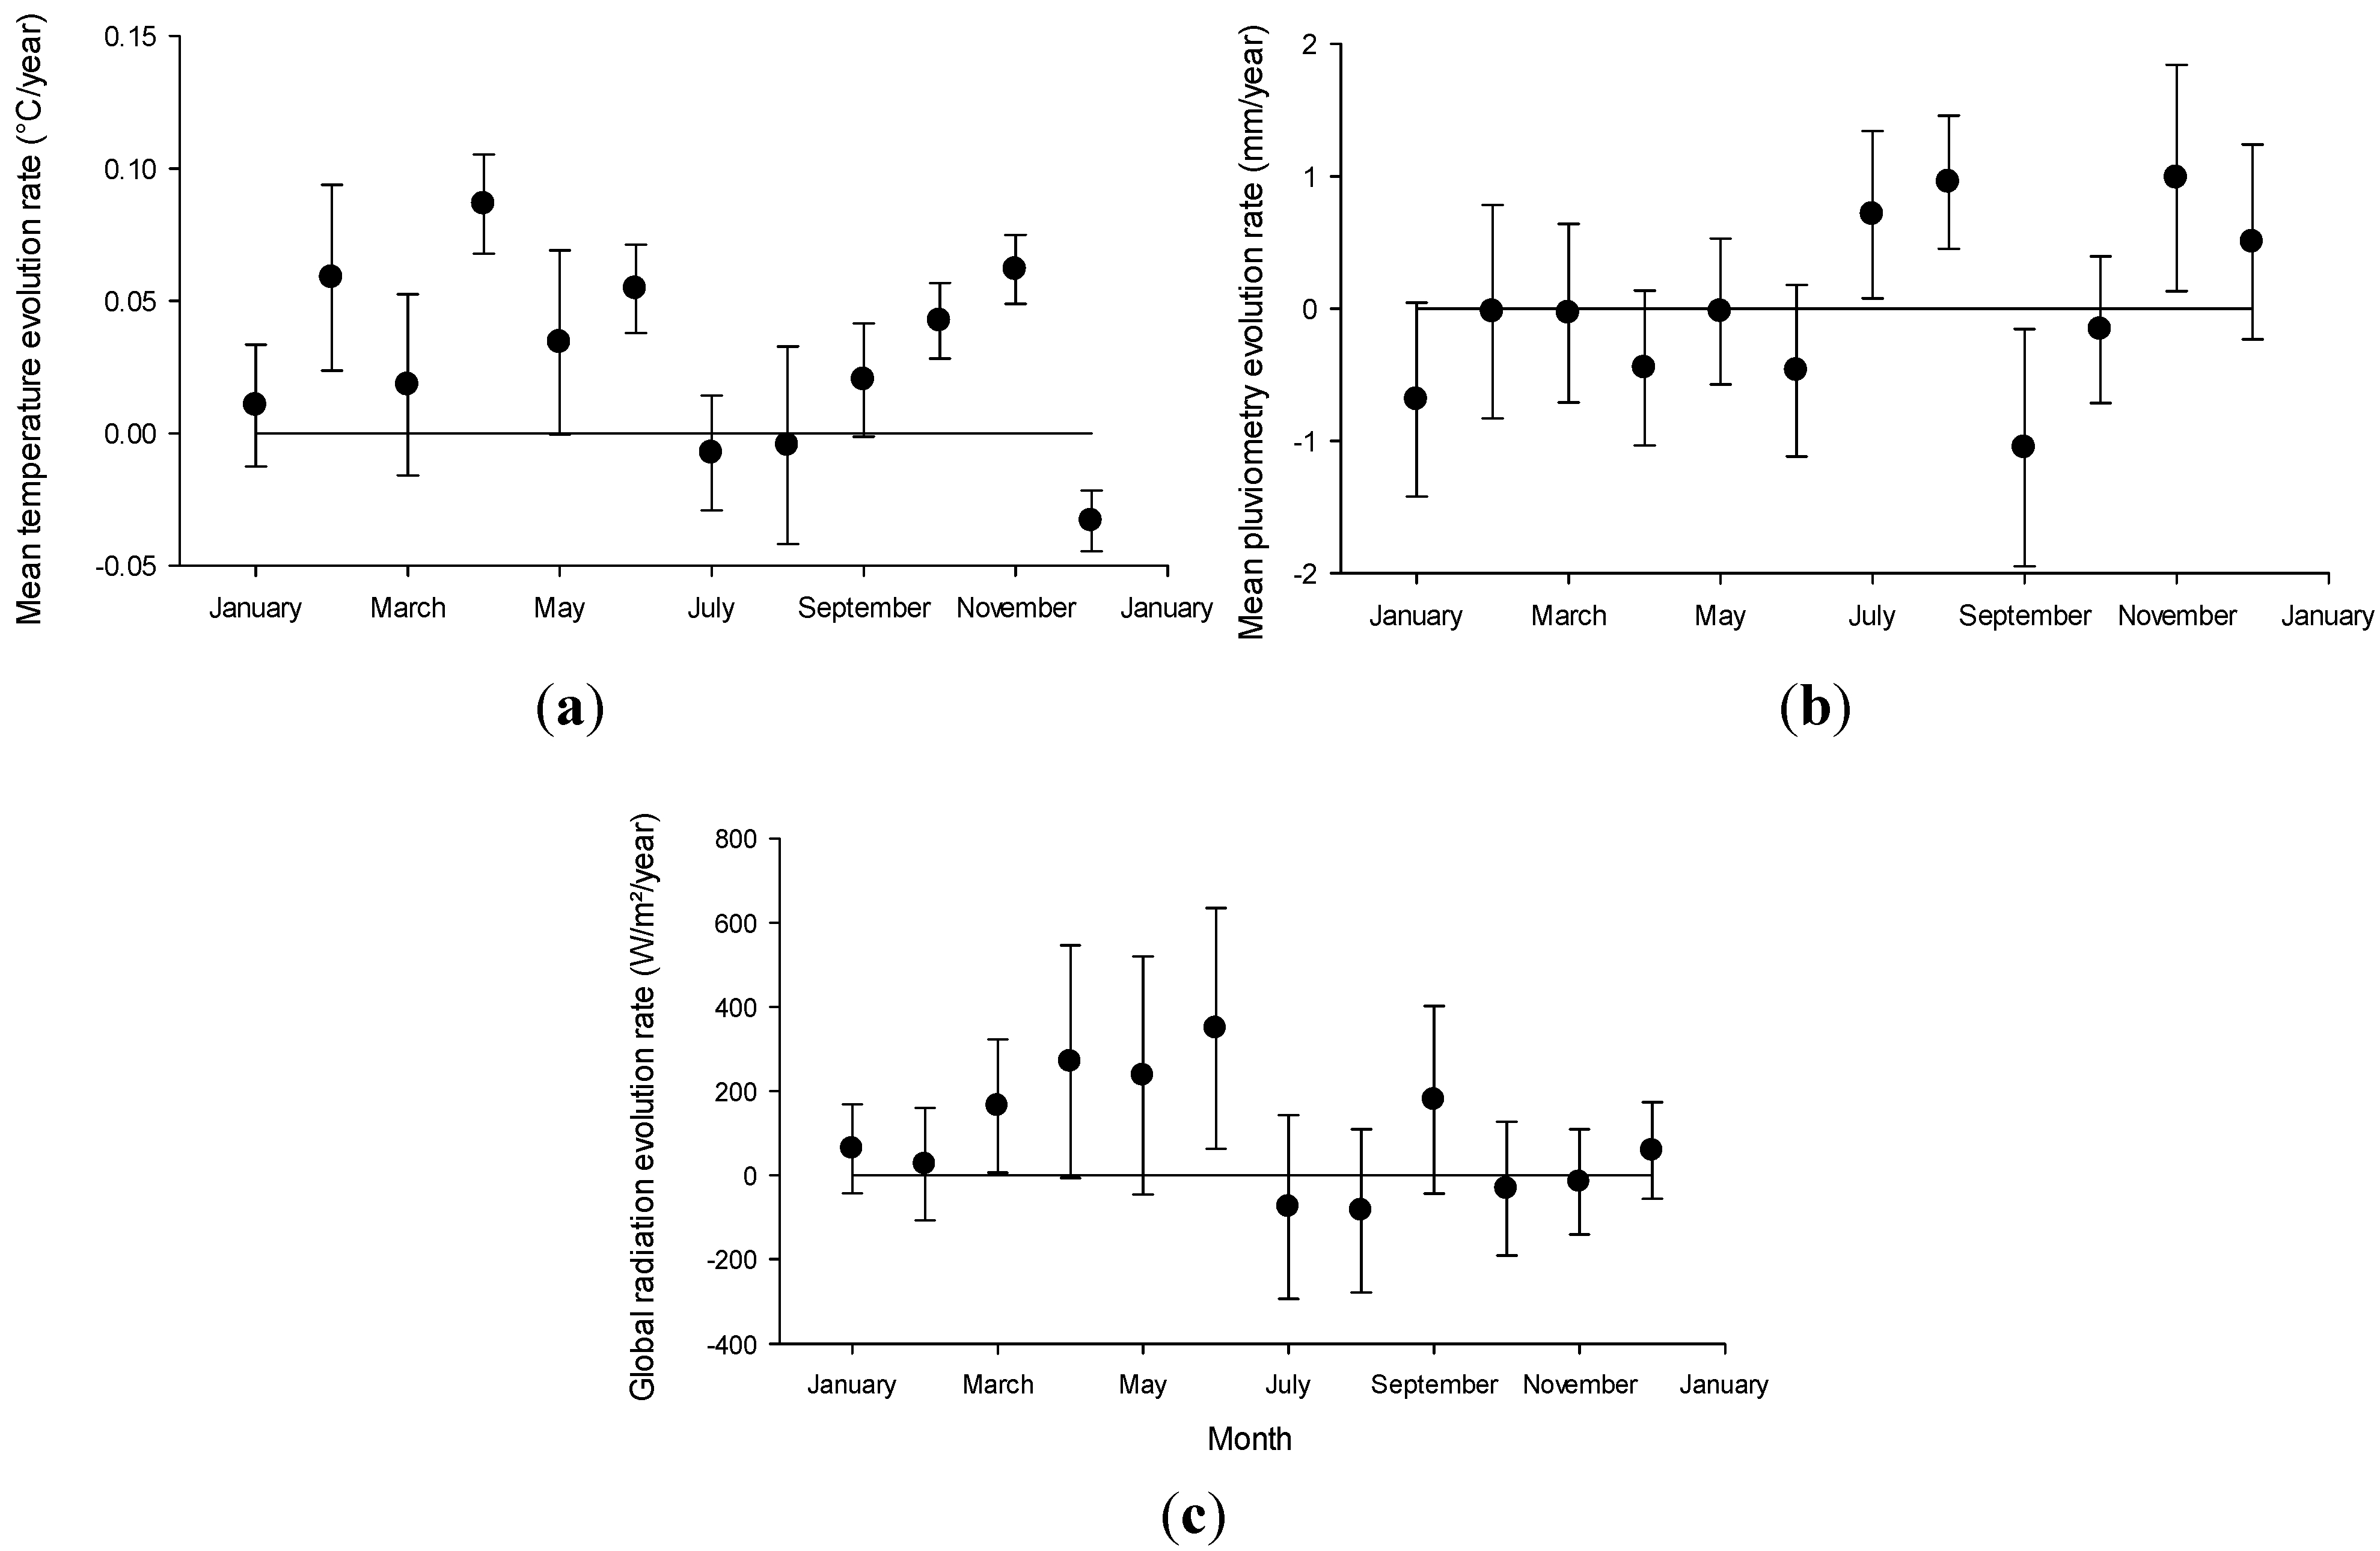
2.2. Regional Climate Projected Evolution

Interannual climate evolution was characterized for the 30-year timespan 1982–2011. Mean monthly data from the 34 meteorological stations nearest to the lakes (21 stations for global radiation) were approximated through linear regression curves. At regional scale, evolution rates for the May–October period show mean temperature and cumulated global radiation increases (+2.8 °C and +8 kW/m² for 100 year extrapolations); but no significant cumulated pluviometry evolution. These evolution rates are close to regional NW-SE climatic gradients (2 °C; 4 kW/m²; and 210 mm) and to interannual mean amplitudes (2.6 °C; 31 kW/m² and 154 mm) for the period 2004–2011. These results support the hypothesis that comparison between eastern and western Brittany can be a tool for evaluating the effect of climate change at regional scale in the short term.
This regional evolution is associated with strong local variations: for a 30-year extrapolation, for example, site-specific evolution ranges from −0.6 to +2.3 °C, cumulated rainfall from −180 to +122 mm and cumulated global radiation from −4.7 to +11.5 kW/m². Faster evolution rates are concentrated in spring and early summer (Figure 2), with April to June showing the highest positive rates for temperature and global radiation, whereas in autumn months, only temperatures tend to increase. On the other hand, July and August, commonly the hottest months in oceanic climates, tend to show increasing rainfall and decreasing global radiation.
Figure 2. Climate parameters evolution rate extrapolated from 1982–2011 data (mean ± sd). (a) mean monthly temperature; (b) mean monthly cumulated rainfall; (c) mean monthly cumulated global radiation.
Toxins 06 00509 g002

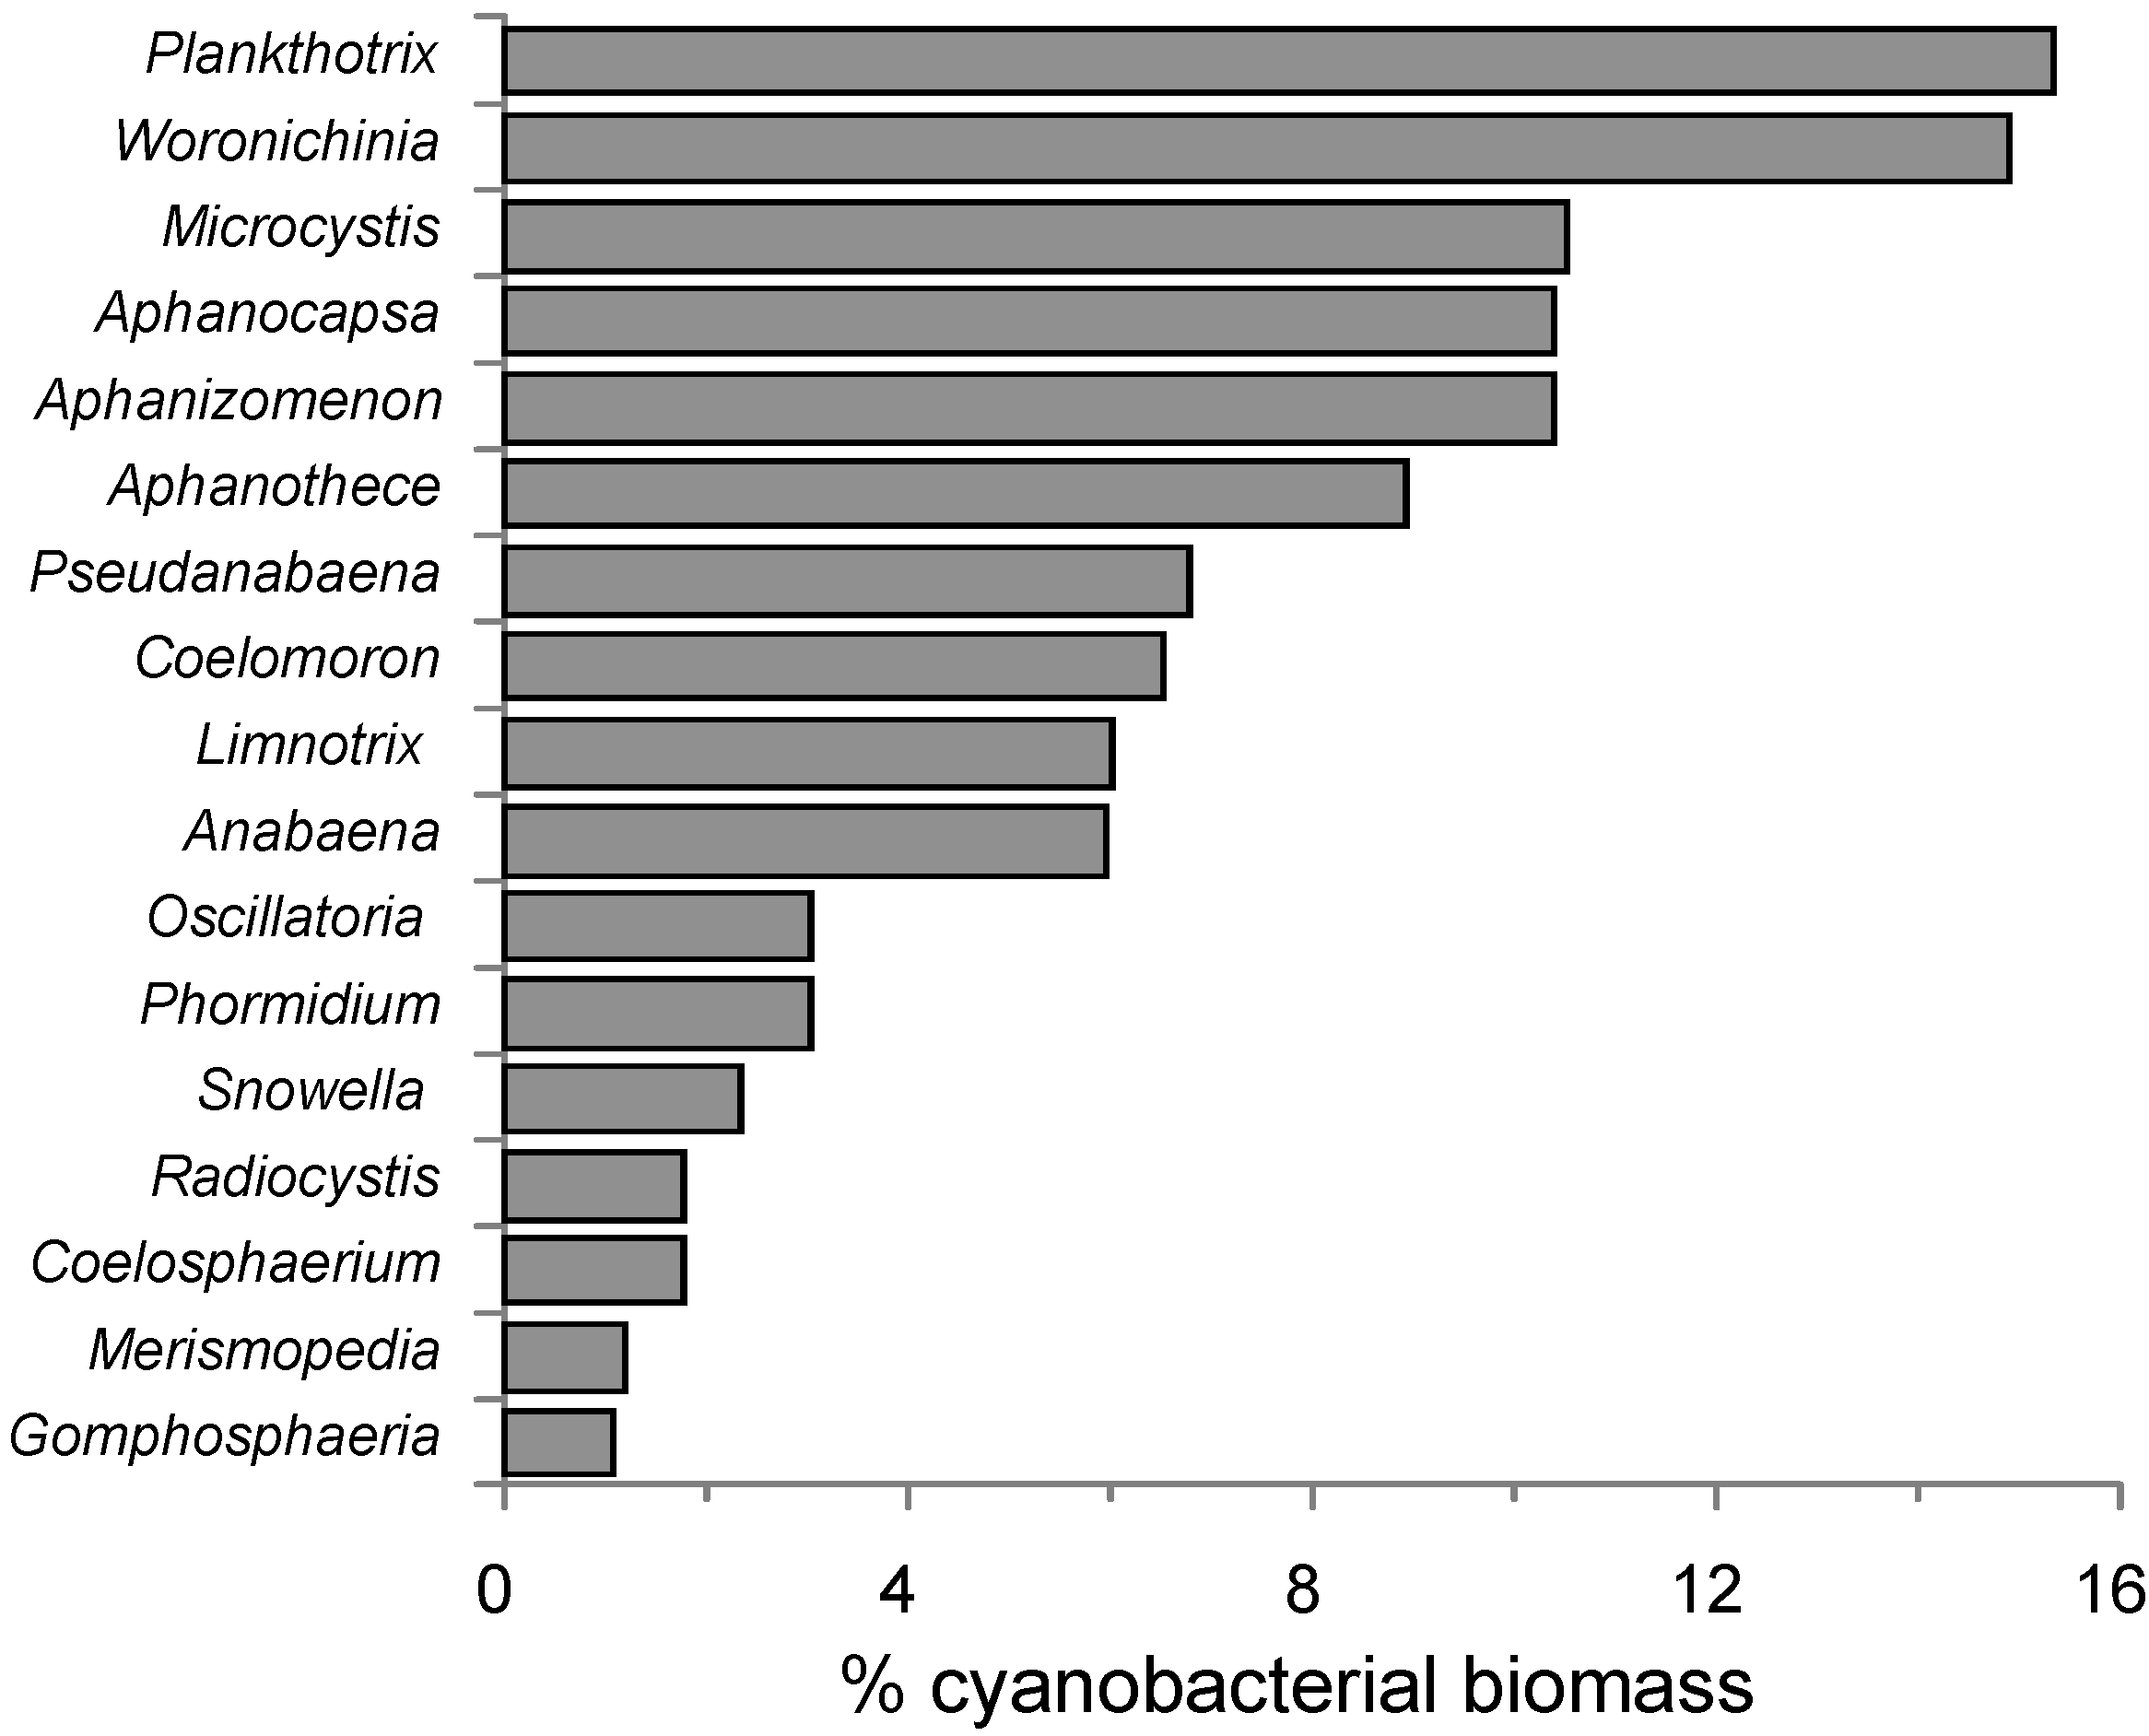
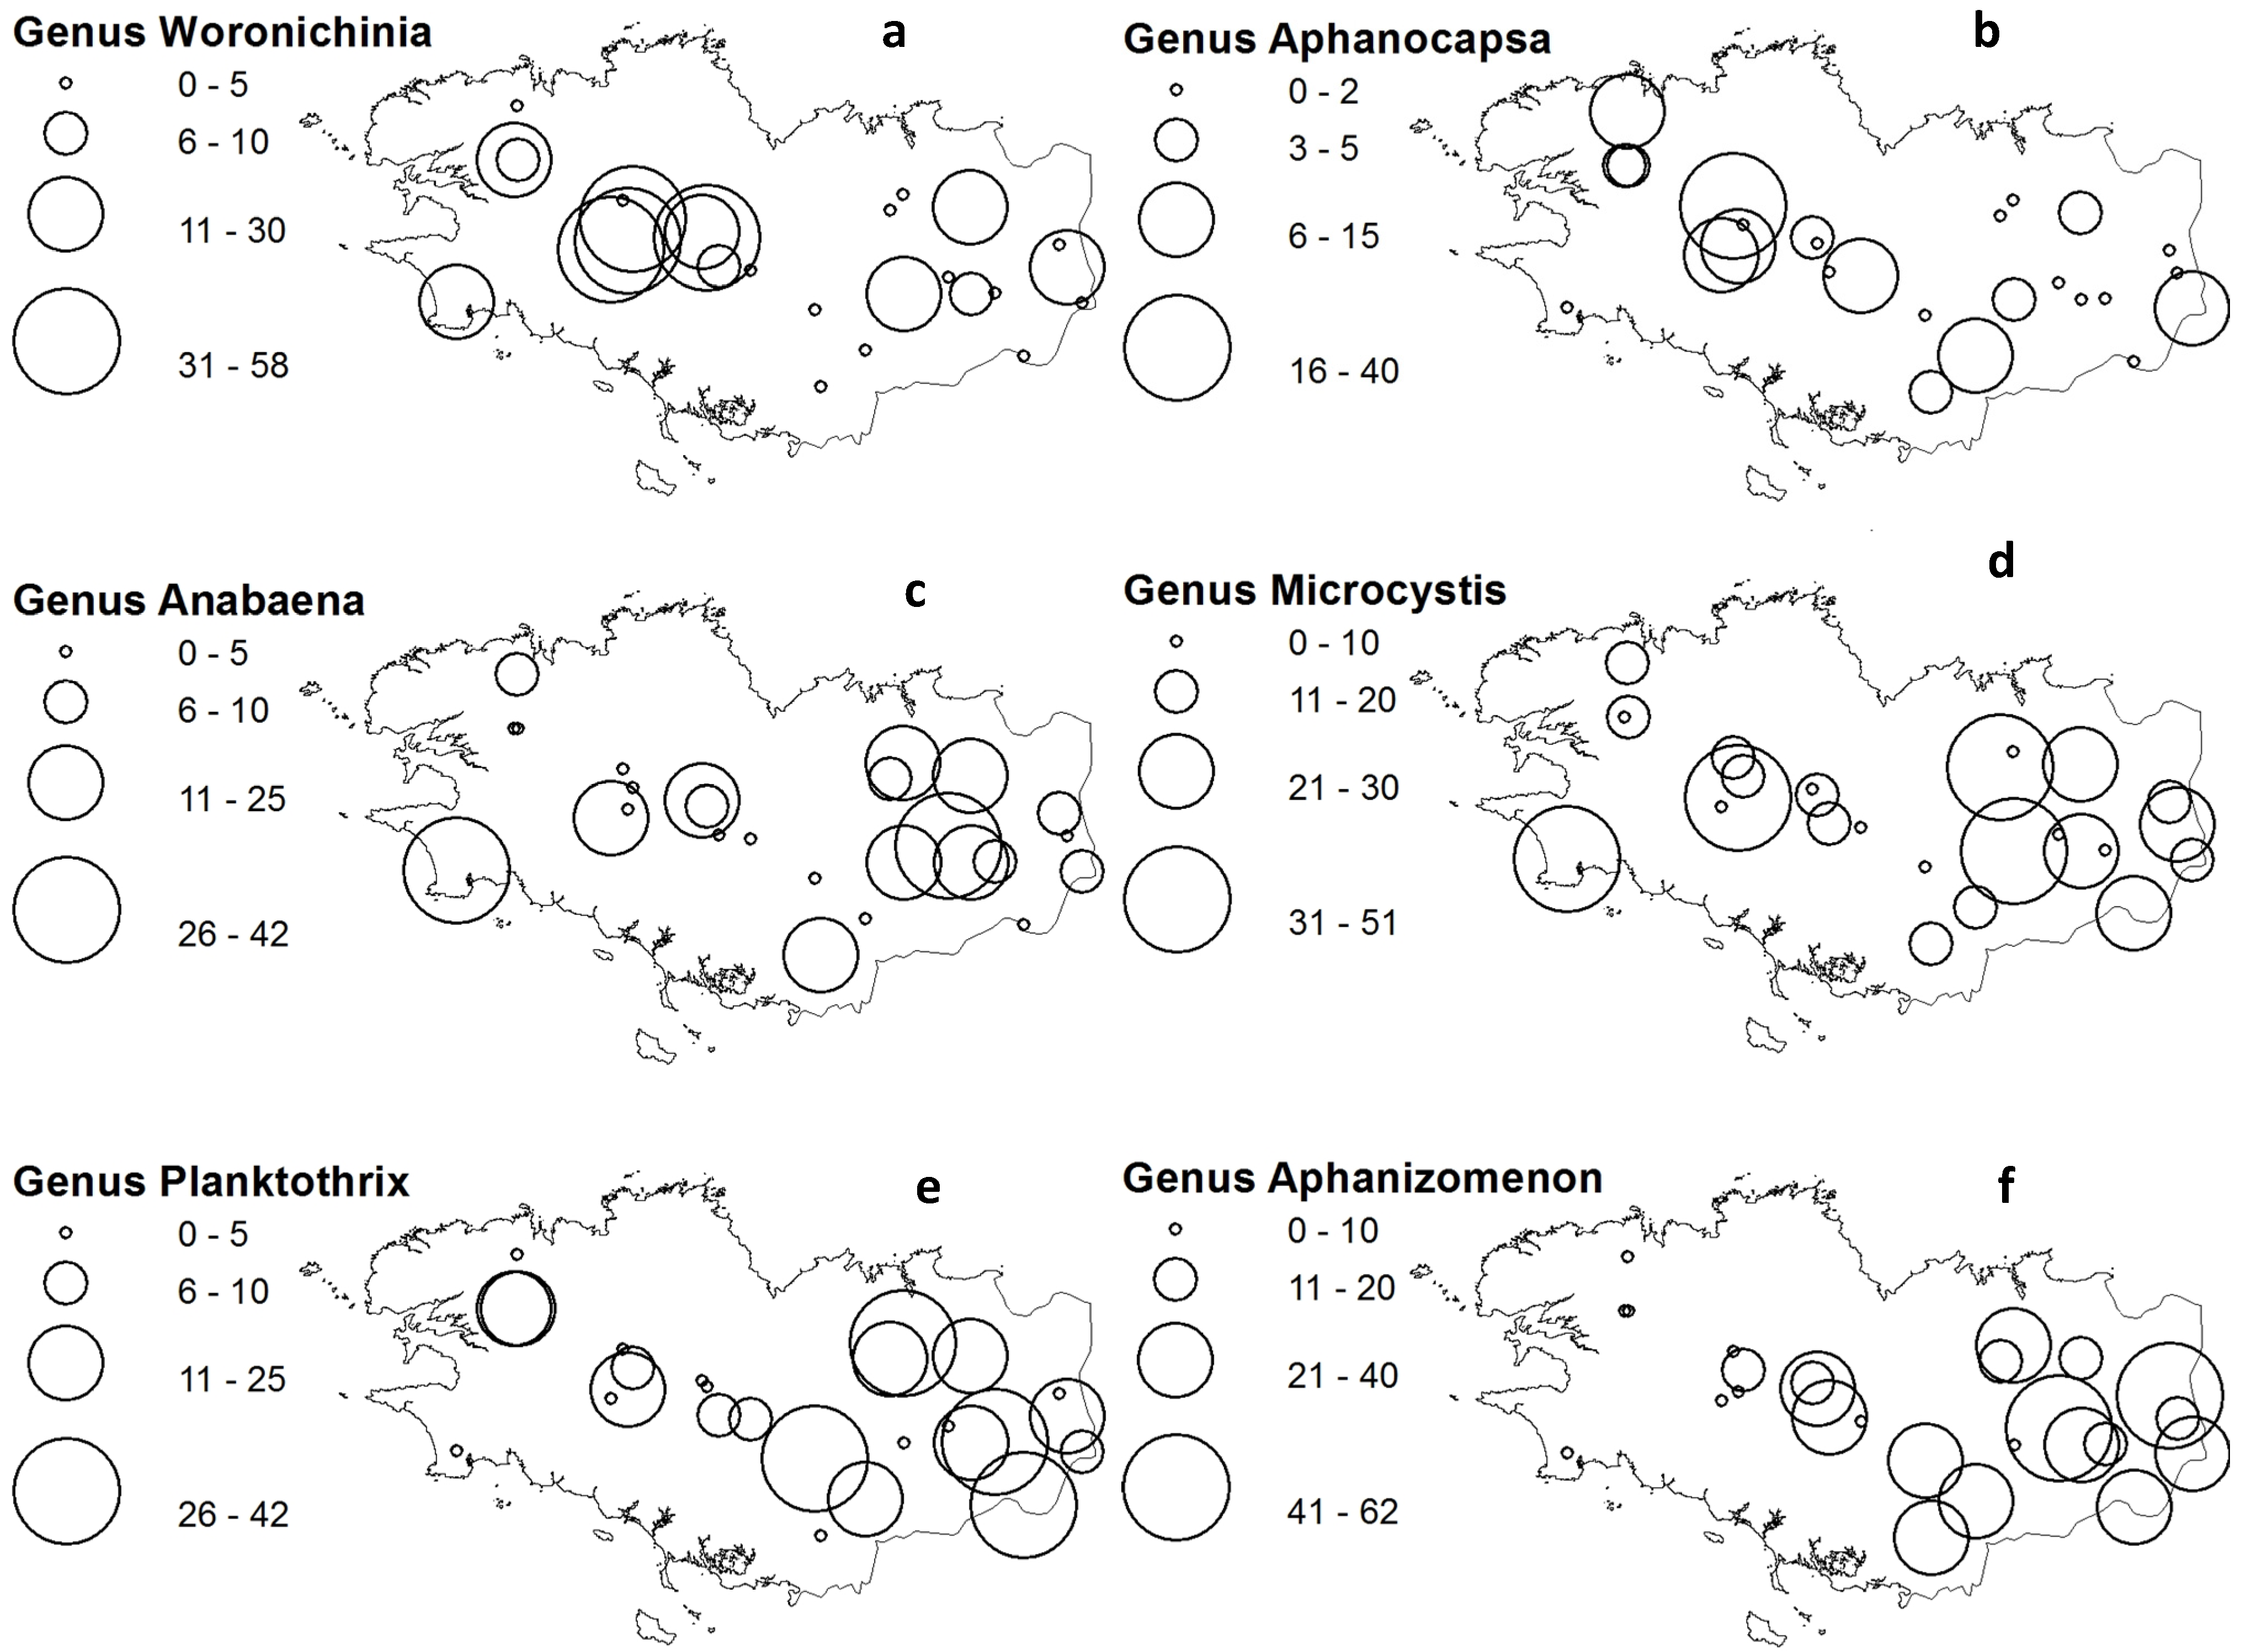
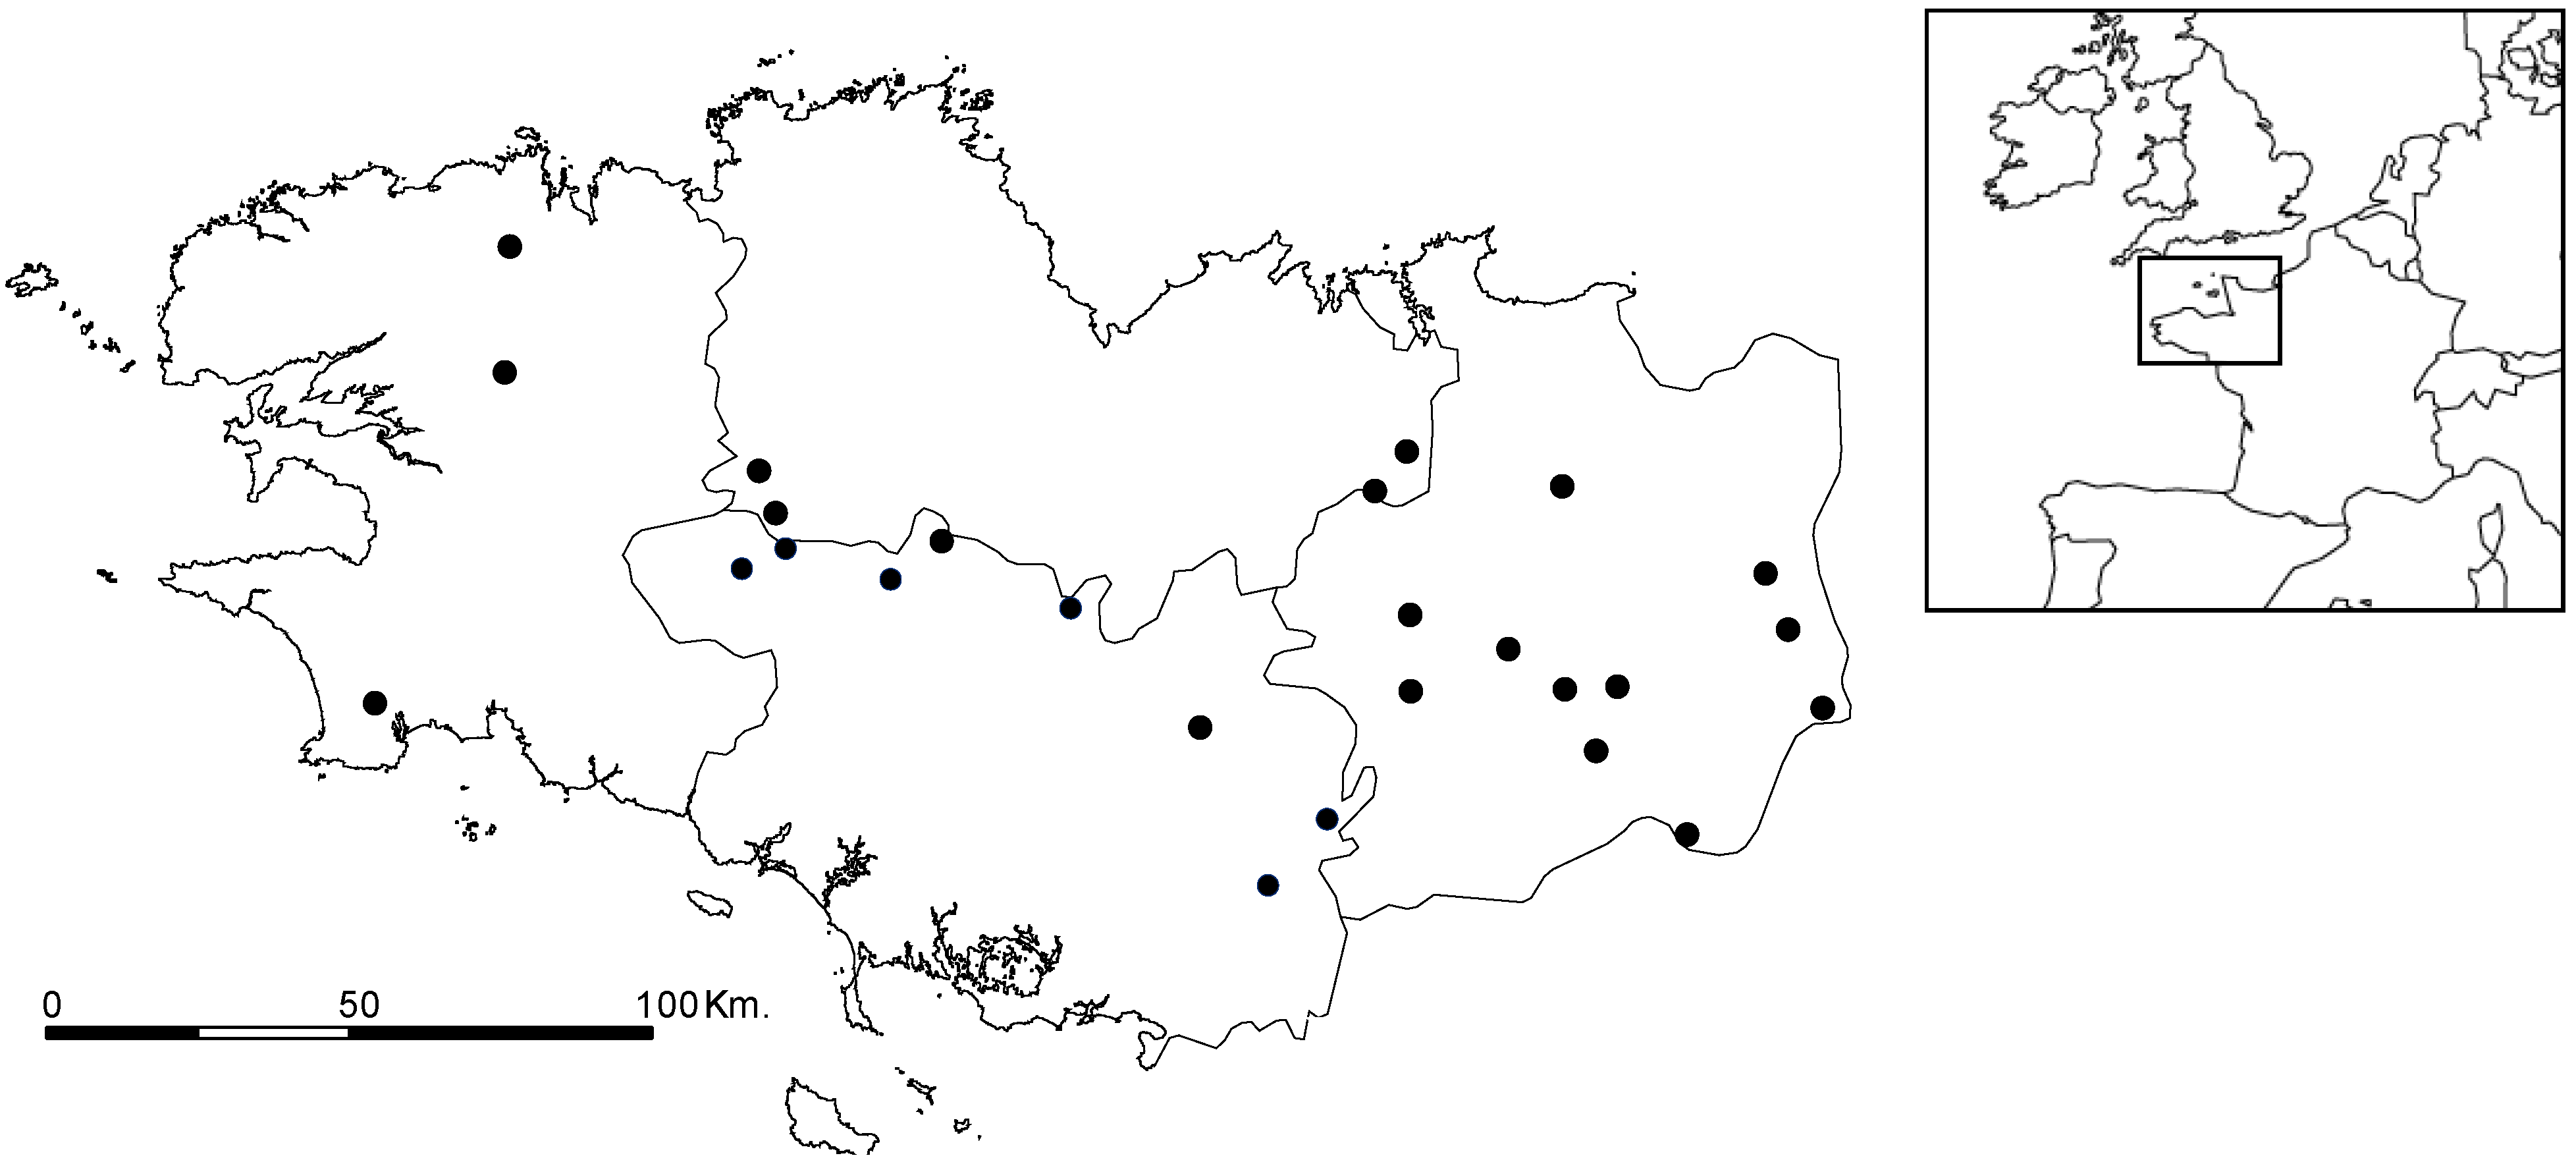
2.3. Cyanobacteria Distribution

In the 2004–2011 data, 27 common genera accounted for 0.1%–16% of total cyanobacteria biovolume (Figure 3). The highest contribution could be credited to Planktothrix and Woronichinia (15.5%–16%), whereas Microcystis, Aphanocapsa, Aphanothece and Aphanizomenon ranged from 9% to 11%. The genus Anabaena only accounted for 6.3% of cyanobacteria biomass, but was included in this analysis because of its potential toxicity. These seven generic groups accounted for 76% of all cyanobacteria biovolumes. In all subsequent analyses, Aphanocapsa and Aphanothece data were pooled together as identification confusions were considered possible.
Geographical distribution of these taxa was mapped with ESRI ArcView as local genus-specific mean % biomass for the period 2004–2011 (Figure 4). This illustrates regional tendencies, with higher % biomass for Woronichinia and Aphanocapsa in the north-western quadrant, for Microcystis and Anabaena from centre to east, whereas Planktothrix and Aphanizomenon are higher contributors in the south-east quadrant.

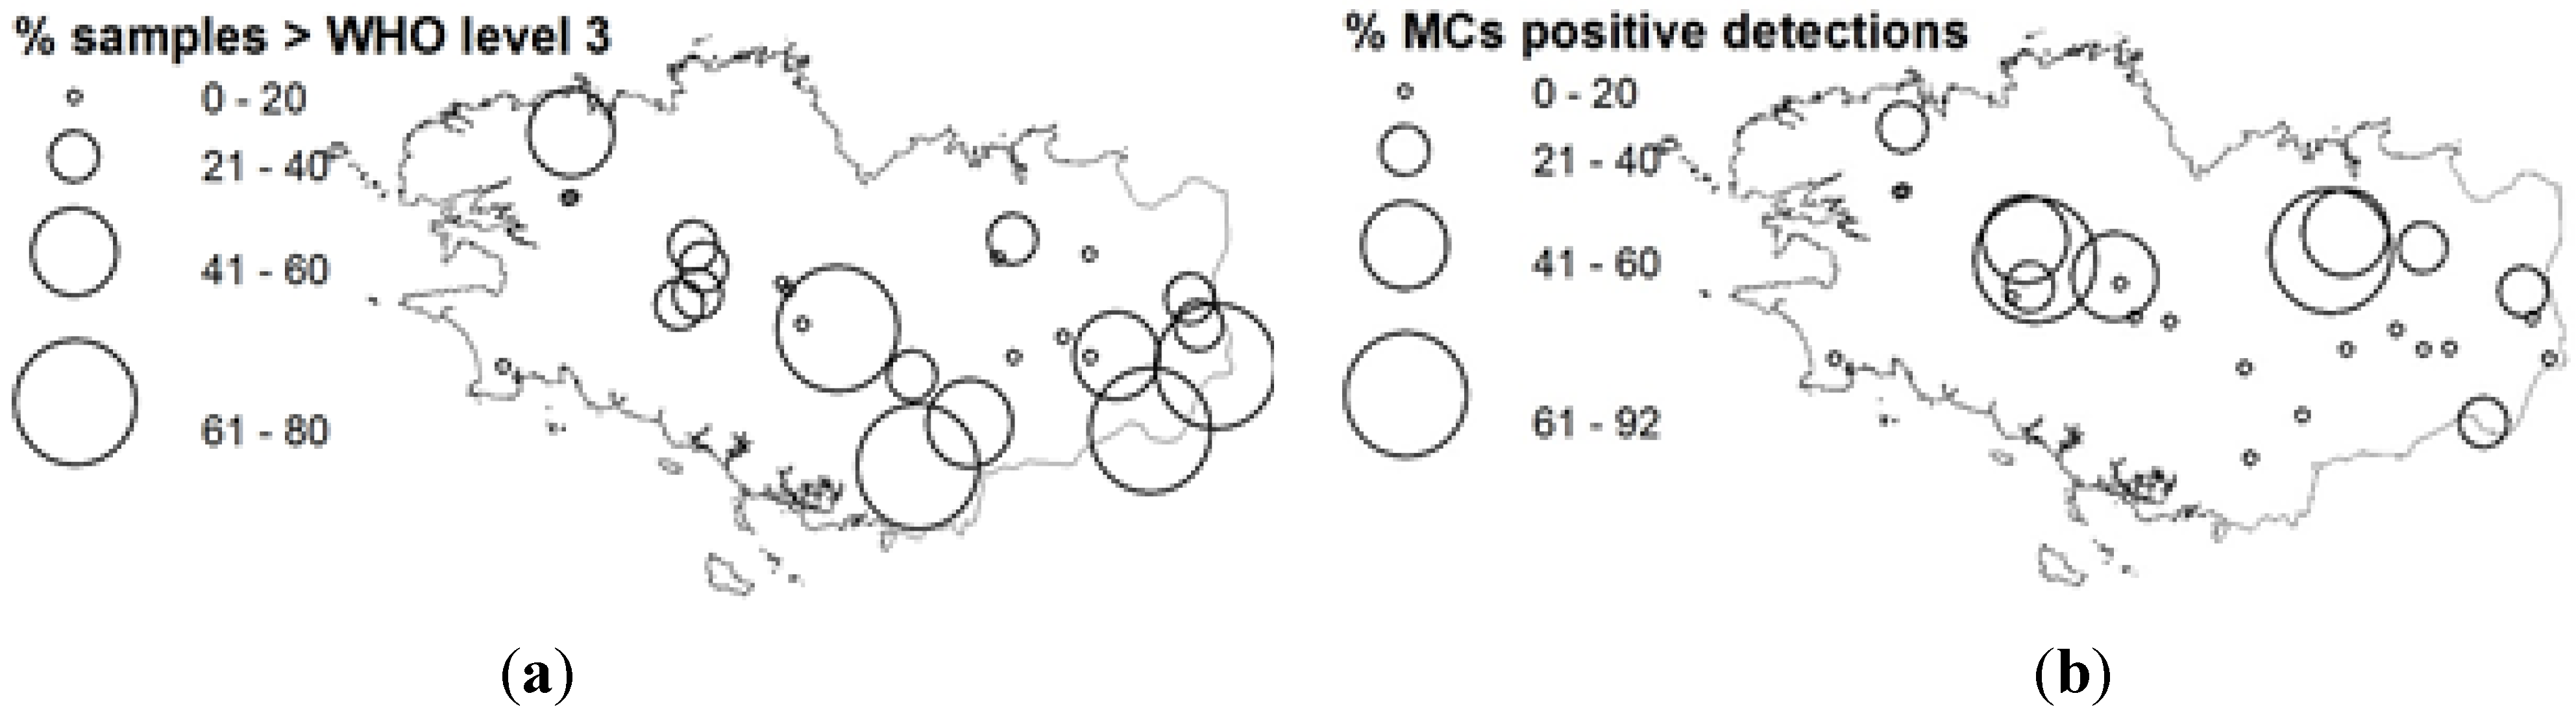
2.4. Microcystin Occurrences

Microcystins (MCs) detection frequencies, once mapped, appeared concentrated in the centre-north part of Brittany, i.e., outside of the SE quadrant concentrating the highest % biomass of most known MC-producing taxa. At the same time, MC detection frequencies could not be related to common public-health parameters such as WHO alert level 3 observation frequencies (i.e., cell density > 100,000 cell/mL: r² = −0.45), total cyanobacteria cell densities (r² = −0.01), known MC producers cell densities (r² = −0.04), etc. (Figure 5).
Figure 3. Dominant taxa expressed as % total cyanobacteria biovolume (taxa with % biovolume <1% omitted for clarity).
Toxins 06 00509 g003

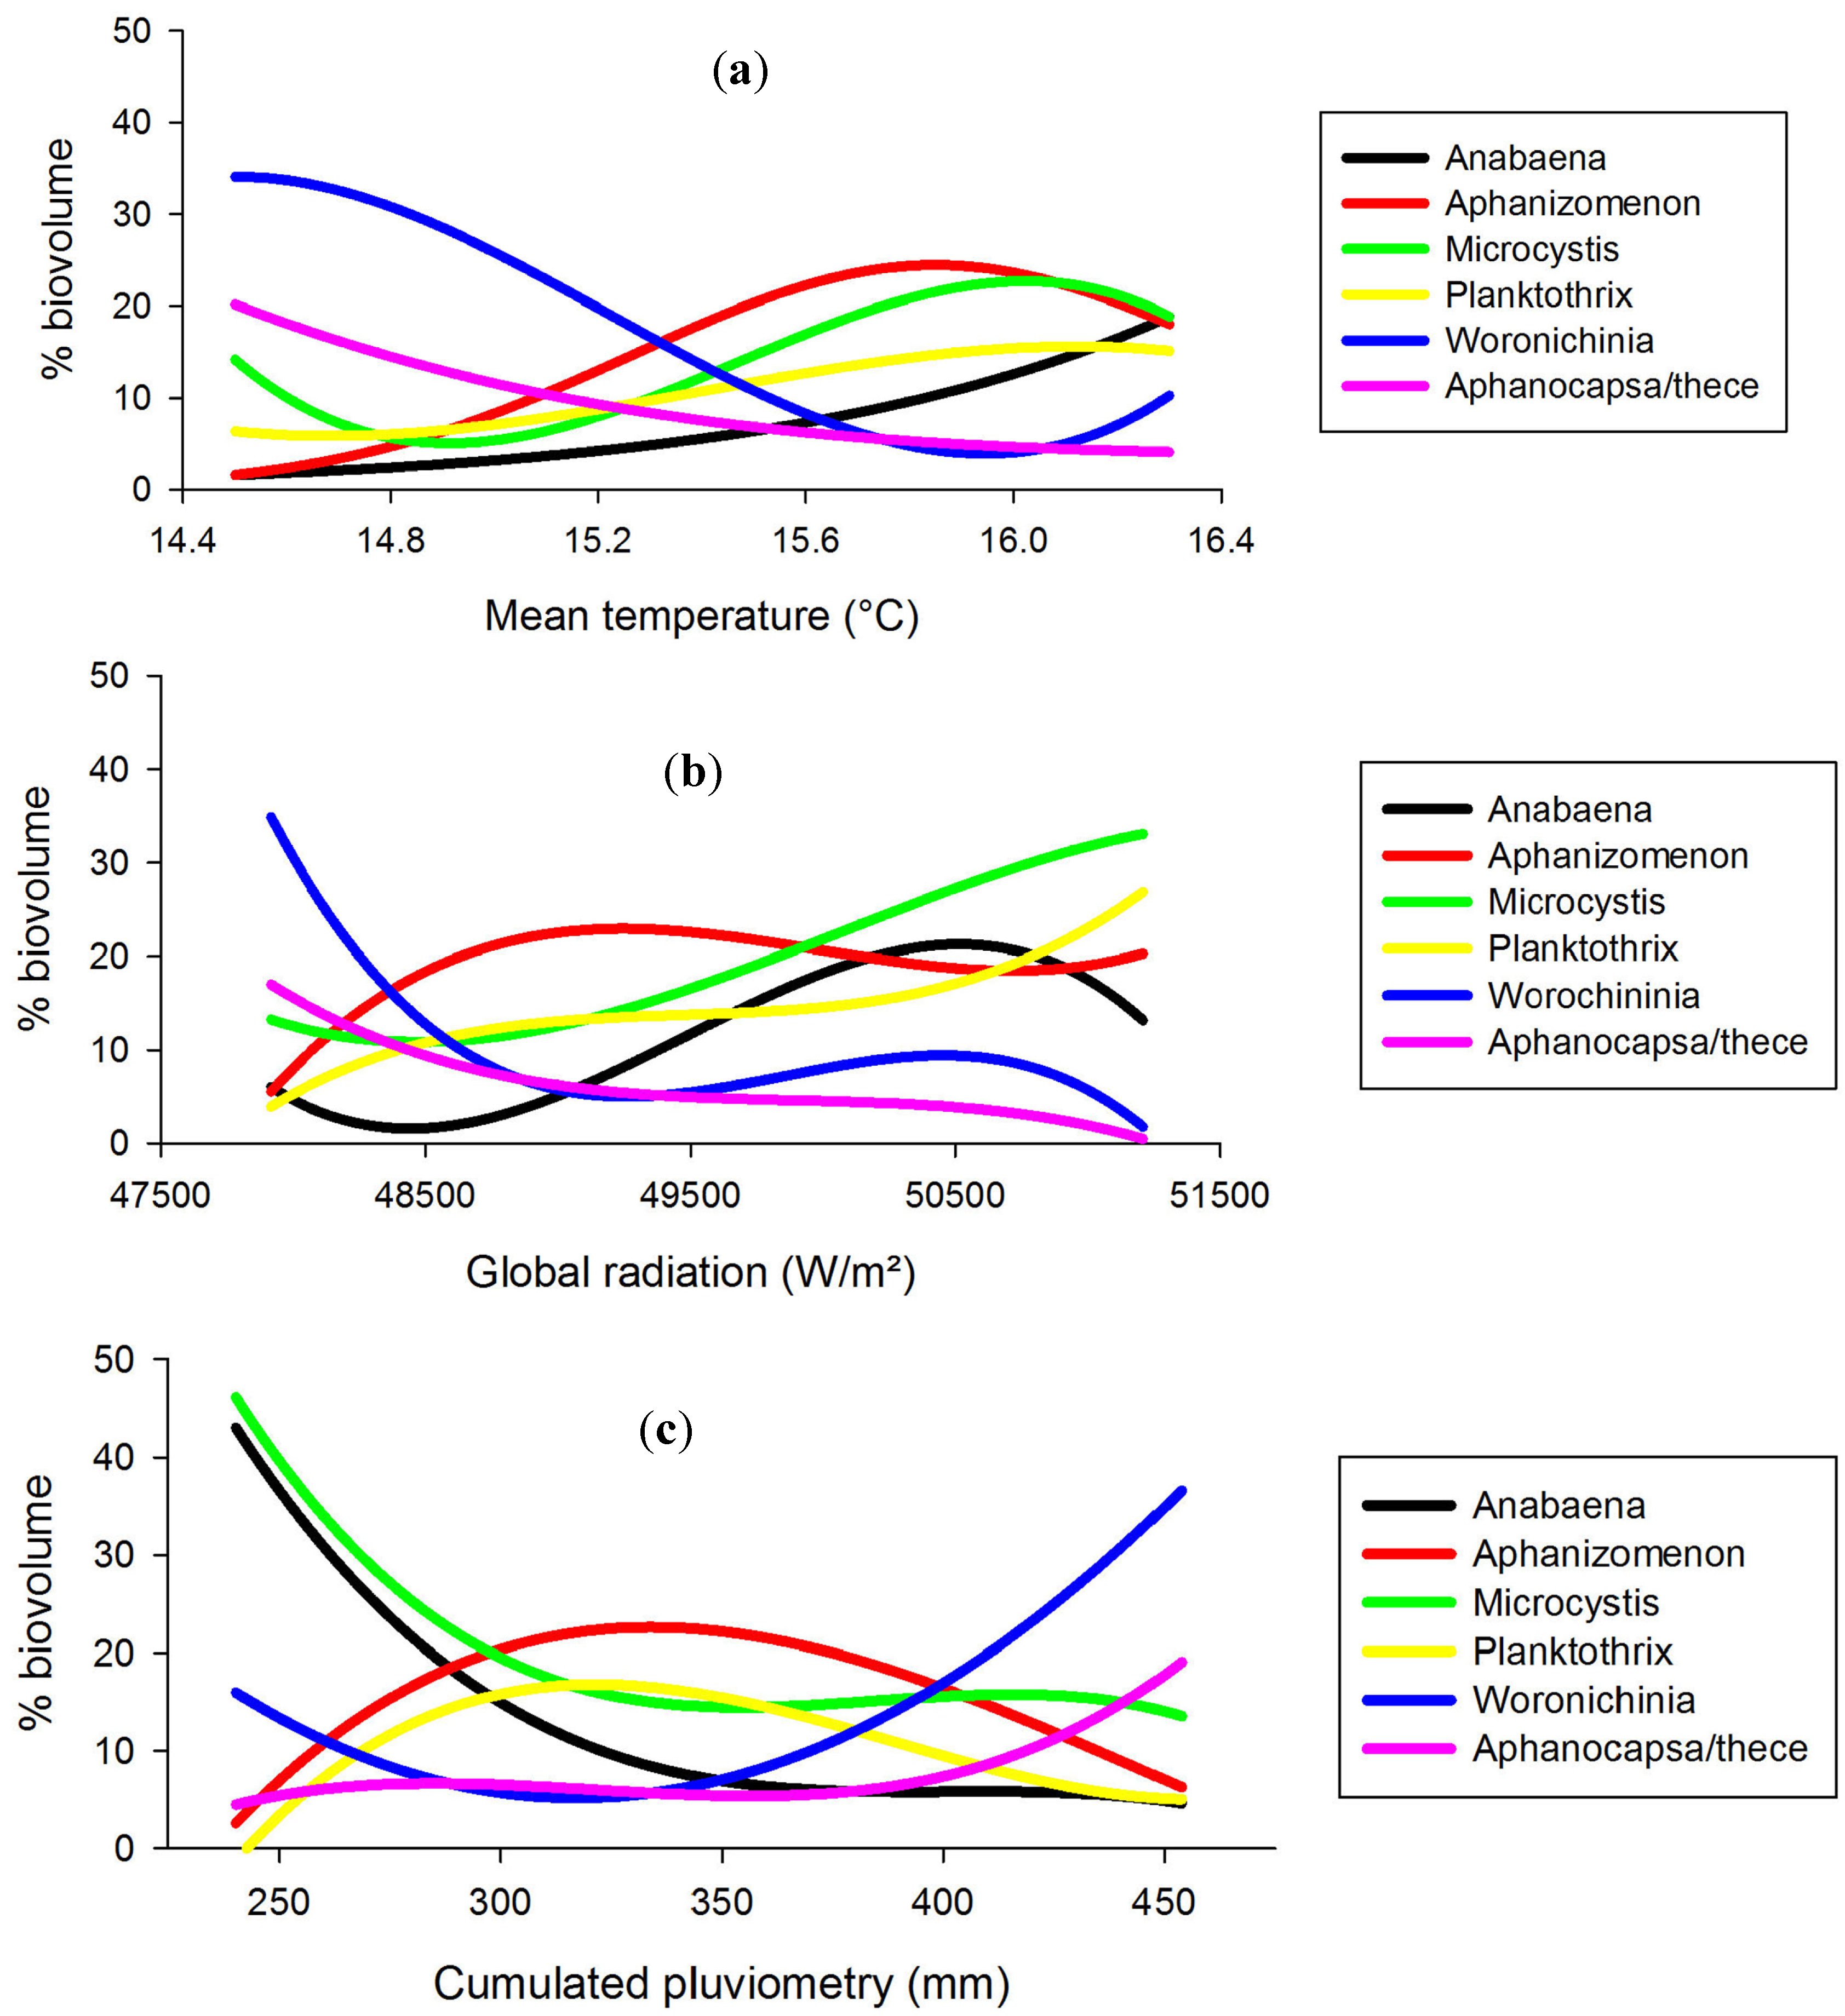
2.5. Cyanobacteria-Climate Relations

Contribution to biomass for each generic group was examined in relation to meteorological parameters in order to determine dependencies toward regional climate gradients. All relations are summarized in Figure 6 as second order polynomial curves obtained with SPSS SigmaPlot 12.
Three dominant areas could be distinguished: a colder, wetter, less sunny area dominated by Aphanothece/Aphanocapsa and Woronichinia, a hotter, drier, sunny area dominated by Microcystis and Anabaena, and an intermediate, transitional area associated with Aphanizomenon and Planktothrix. This distribution is in accordance with cyanobacterial growth rate and thermal optima as exposed in [35,36].
Climatic optima, summarized in Table 2, were extrapolated for each genus and defined as the parametric value leading to the highest % biovolume. Some of these optima can be deducted to be out of our data range when no inflexion could be observed on the distribution curve.

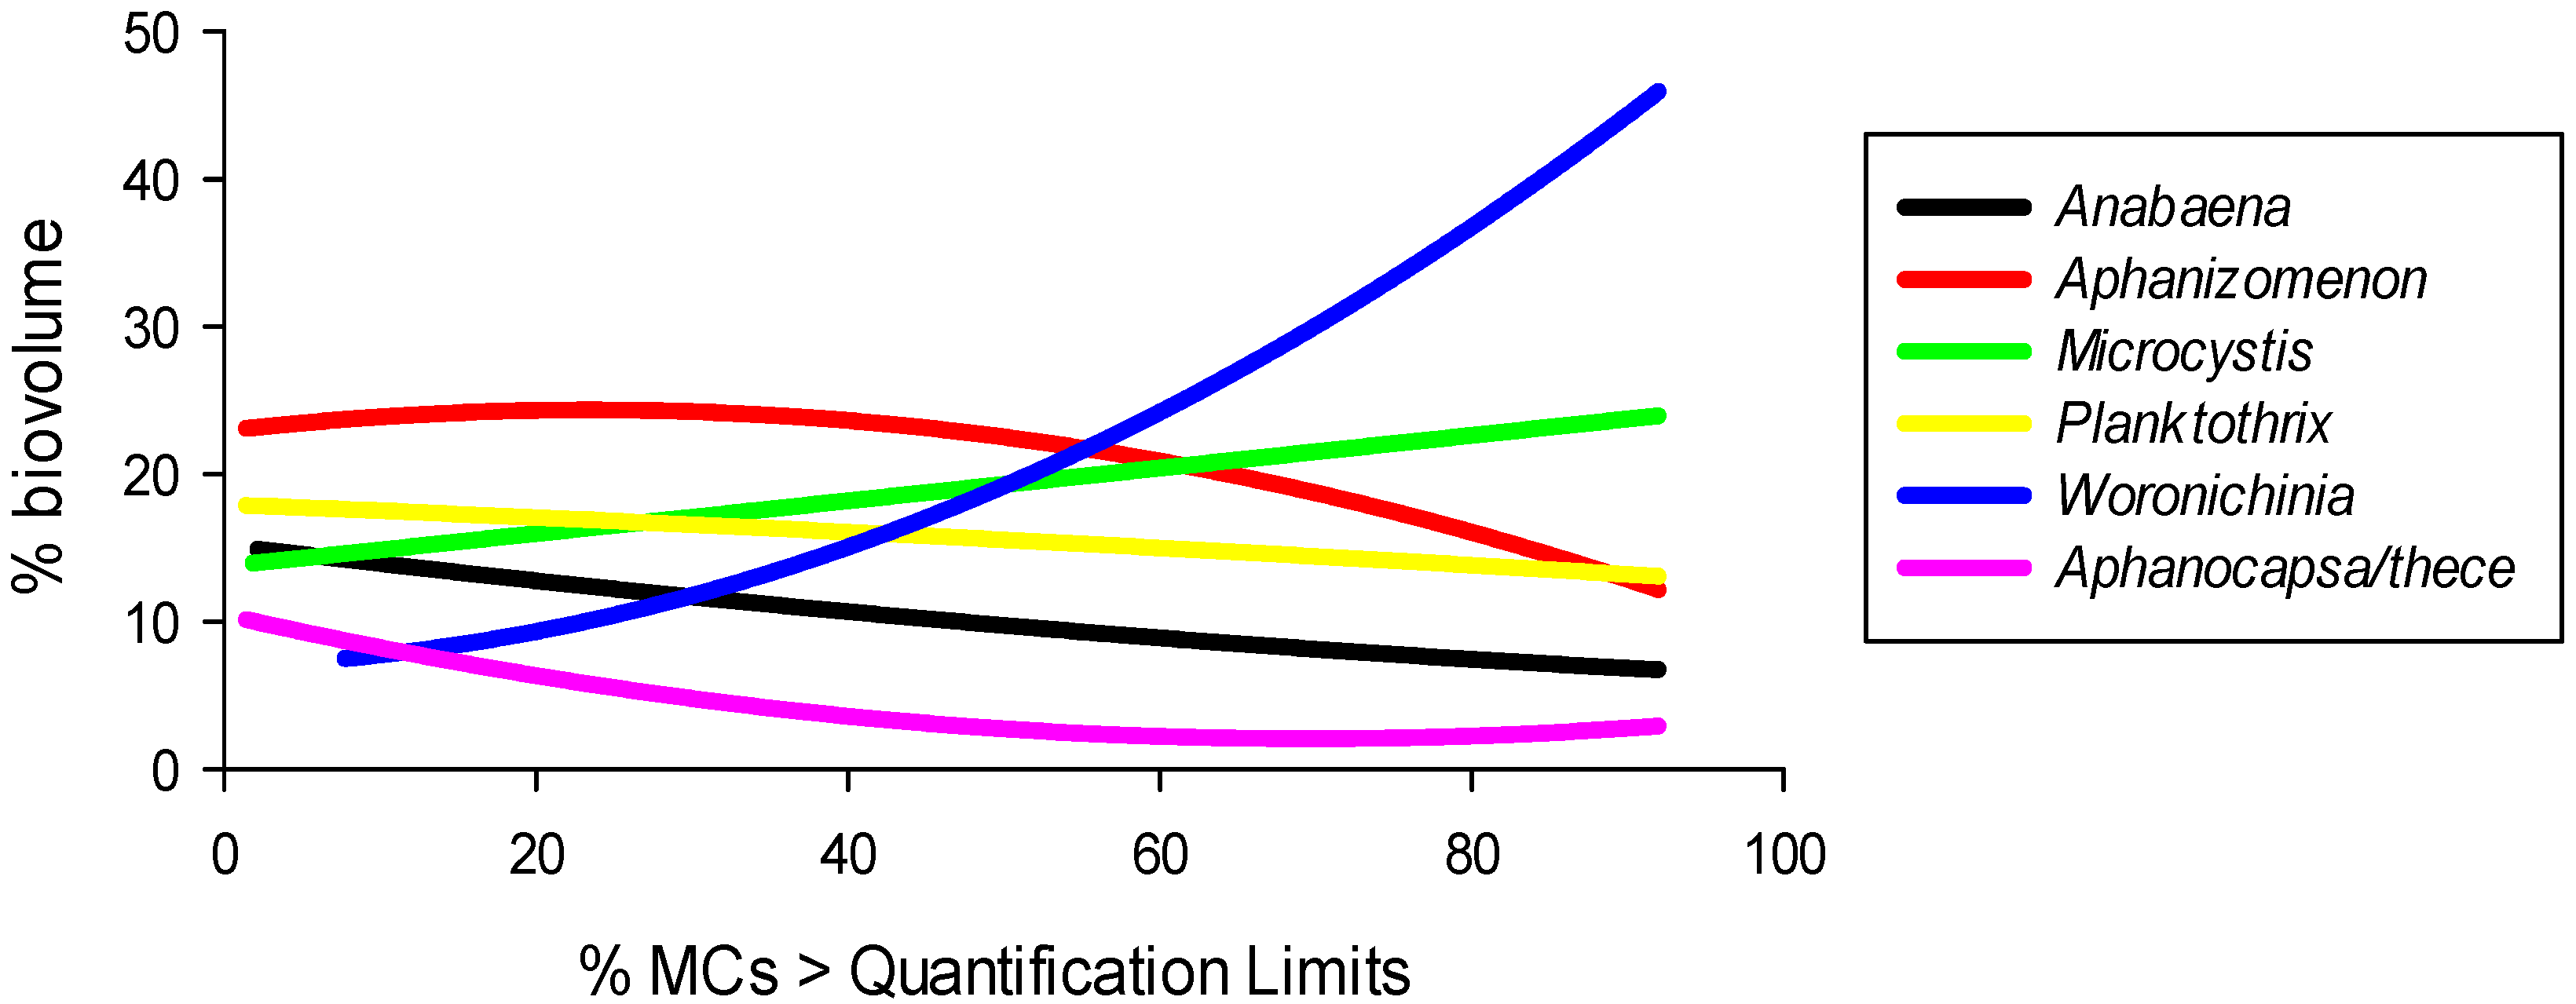
2.6. Microcystin-Climate Relations

Microcystins (MCs) detection frequencies could not be directly related to climatic parameters (vs. temperature: r² = −0.28; vs. rainfall r² = 0.43; vs. global radiation: r² = −0.01), but a relation may be highlighted between MCs and generic groups, leading to an indirect relation with climatic areas (Figure 7). This can be explained by the ability of each generic group to host potential toxin producers in its own distribution area.
Figure 4. Geographical distribution of generic groups as % total cyanobacteria biovolume. (a) Woronichinia; (b) Aphanocapsa & Aphanothece; (c) Microcystis; (d) Anabaena; (e) Planktothrix; (d) Aphanizomenon.
Toxins 06 00509 g004
Figure 5. (a) WHO level 3 occurrence frequencies (% samples > 100,000 cell/mL); (b) Microcystin (MC) detection frequencies (% samples with MCs > MQL).
Toxins 06 00509 g005
MC detections were negatively related to % biovolume for Anabaena, Aphanizomenon and Planktothrix, and positively correlated with Woronichinia and Microcystis. Accordingly, positive detection frequencies reached 50% of analysed samples on one hand if Microcystis and/or Woronichinia accounted for at least 20% of total cyanobacteria biovolume, and on the other hand if Anabaena accounted for less than 10% biovolume, and Aphanizomenon or Planktothrix accounted for less than 17%–20% biovolume.
Figure 6. Generic % biovolume distribution vs. (a) Mean temperature; (b) Cumulated Global Radiation; (c) Cumulated pluviometry (data points omitted for clarity).
Toxins 06 00509 g006
Table 2. Taxa distribution criteria extrapolated from May–October climatic data.
GenusMTCGRCP
°CkW/m²mm
Aphanothece/capsa<14<48>455
Woronichinia14.4<48>455
Aphanizomenon15.849.2335
Planktothrix16.1>51.2320
Microcystis16.1>51.2<240
Anabaena>16.550.5<240
Notes: MT: mean temperature; CGR: cumulated global radiation; CP: cumulated pluviometry.
Figure 7. MC detection frequencies according to generic composition (as % total biomass).
Toxins 06 00509 g007
These results were obtained from regional-scale, interannual data, and should not be interpreted as an affirmation that MCs are only produced by Microcystis and Woronichinia in Brittany. Moreover, no analysis was used to verify which taxa were observed in samples showing positive MC detection. These results are indicative of higher MCs occurrences in two nearly opposite climatic domains, i.e., the colder/wetter Woronichinia area vs. the drier/hotter Microcystis area.

2.7. Cyanobacteria and Microcystin Domain Projections

Projected data from this 30-year extrapolation were inserted in a simple multiple linear regression model for all 26 lakes. This model was intended to evaluate the evolution of Microcystis and Woronichinia domains, in order to estimate the possible modifications of positive MC detection frequencies. The results show a main dependency of Woronichinia (r² = 0.74, p = 0.02) to pluviometry (p = 0.02), whereas Microcystis (r² = 0.42, p = 0.05) are mainly explained by global radiation (p = 0.04). Higher Microcystis contribution to biovolume tend however to be underestimated.
Despite this limitation, extrapolated biovolumes for a 30-year projection show that Microcystis domain could expand from eight to 20 out of 26 lakes, whereas Woronichinia domain should decrease from seven to three lakes. Intermediate (Aphanizomenon/Planktothrix) domains would then decrease from eleven to three lakes: nine intermediate domain lakes are projected to join Microcystis/Anabaena domains, whereas four Woronichinia/Aphanothece/Aphanocapsa lakes are projected to transfer to Aphanizomenon/Planktothrix conditions. This could lead to an extension of frequent MC detections (>50% samples) from 15 to 23 lakes, i.e., nearly a 50% increase. The studied lakes are mostly situated along a WNW-ESE axis. When our multiple linear regression model is used at full regional scale (i.e., integrating climatic parameters from the NE and SW quadrants), the same 30-year extrapolation shows that the intermediate domain associated with Aphanizomenon/Planktothrix is projected to expand in replacement of the current Woronichinia domain, whereas most current intermediate or Microcystis/Anabaena lakes should remain in the same category. This result however could not be verified, as insufficient continuous monitoring data were available for these two quadrants.
These results tend to show that climate change at the current observed rate is expected to involve changes in cyanobacteria distribution patterns at regional scale. These modifications can appear to be complex at local scale, especially with the observed decrease of July and August temperature and global radiation, but the extrapolated regional evolution seems in broad agreement with observations collected from site-specific studies around the world [6,15,16]. From another point of view, the projected conservation of the hottest/driest Microcystis domain in oceanic climate can explain why no significant evolution in cyanobacteria occurrences or species composition could be highlighted in the 14-year study of Agueira Reservoir [17].
From 2004 to 2011, no nutrient monitoring was conducted in these lakes. As a consequence, no relevant trophic status data could be integrated to this work, and our conclusions are only based on climatic data. Other parameters can influence cyanobacteria distribution, such as lake morphology and/or nutrient form availability to phytoplankton [37,38]. Nutrient data should be included as a priority in any cyanobacteria monitoring program.

3. Experimental Section

This study is based on public health weekly survey data from recreational lakes monitored every year from 2004 to 2011 in Brittany, north-western France (Figure 8). These sites were selected according to cyanobacteria survey continuity criteria: 26 sites out of a total of 40 lakes monitored for cyanobacteria from 2004 to 2011 could be considered as continuously monitored from June to September, i.e., with at least seven years of monitoring out of eight, with a sampling frequency of at least every two weeks. The lakes characteristics range from 0.2 to 51 × 106 m3, with depths from 2 to 45 m and watershed areas from 0.2 to 676 km².
Figure 8. Localization of the 26 lakes studied in Brittany (western France).
Toxins 06 00509 g008
Monthly meteorological data (precipitation rates, temperature, global radiation intensity, etc.) were collected from Météo France database (Climathèque) from 1982 to 2011. Meteorological data were gridded and mapped with Golden Software Surfer 8 and ESRI ArcGis Desktop 9, whereas regional climate evolution rates were estimated with SPSS Sigma Plot 12.
Only four out of 26 lakes were subject to nutrient monitoring prior to this study. As a consequence, no relevant trophic status data could be integrated to this work.
Cyanobacteria data, i.e., cell densities, species composition and microcystin concentrations, were collected from the regional public health authorities (French Agence Régionale de Santé (ARS) of Brittany). All samples were analyzed by four different local laboratories for cyanobacteria composition and microcystin concentration.
Cyanobacteria were identified according to [39,40,41] and counted with light microscope according to [42]. All cell densities data were first converted to biovolume with the use of mean cell dimensions and relevant geometric formulas [43], to account for differences in contribution from larger species associated with lower cell densities (e.g., Microcystis, Woronichinia, etc.) and smaller species associated with larger cell densities (e.g., Aphanocapsa, Aphanothece, etc.).
As biomass is a consequence of nutrient availability [3], all biovolumes were converted to percentage (cyanobacteria) biovolume in order to reduce any inter-site bias related to different trophic status. Generic biovolume contributions were mapped with ESRI ArcGis Desktop.
Microcystins (MCs) were analyzed either with LC/MS, HPLC or ELISA immunoassays depending of the laboratory. All toxin analyses involved a preliminary cyanobacteria cell lysis step with methanol [44] to account for total (dissolved and intra-cell) toxin concentrations. These methods quantification limits range from 0.05 to 0.2 µg/L. As no interlaboratory calibration data was available, all quantitative results were sorted as lower than (MCs < 0.2 µg/L) or higher than (MCs > 0.2 µg/L) method quantification limit, and then analyzed as detection frequencies for every lake.

4. Conclusions

Data analysis from eight years of monitoring 26 lakes shows that, at a regional scale, cyanobacteria tend to be associated with homogeneous geographical and climatic areas. In an oceanic climate context, such as Brittany, three main domains characterized by their dominant genera could be distinguished: a colder/wetter domain dominated by Woronichinia/Aphanocapsa/Aphanothece, a hotter/drier domain associated with Microcystis/Anabaena, and an intermediate domain combining Aphanizomenon/Planktothrix species.
These three domains appear to be separated by differences of 1 °C (mean temperature), 15 kW/m² (global radiation) and 105 mm (cumulated pluviometry). The similarity between the three cyanobacteria domains separation and regional or interannual meteorological amplitude can explain why lakes in seemingly geographical proximity can show discrepancies in their reaction to overall similar regional summer conditions, and why lakes in some parts of Brittany tend to host similar cyanobacteria populations every year. These lakes tend to share the extremes of regional gradient, and in this case are situated in Woronichinia or Microcystis domains.
Our results show that microcystin positive detections are associated with area dominated (as % biovolume) by larger Chroococcales (Woronichinia and Microcystis) whereas areas dominated by other potentially toxic genera (Anabaena, Aphanizomenon and Planktothrix) are negatively correlated with detection frequencies. A 30-year timespan extrapolation tends to show that Woronichinia domains should decrease whereas Microcystis domains should expand, leading to higher MCs detection frequencies in most of the 26 lakes of this study.
At regional scale, MC detections are projected to increase in the lakes following an eastward/southward axis, whereas lakes situated along a SW/NE axis could transition to an intermediate domain associated with lower MC detection frequencies. However, lower MC observations should not be extrapolated to other toxin families. The most common species encountered in this intermediate domain are Aphanizomenon flos-aquae, known as a potential producer of PSP, Anatoxin-A and Cylindrospermopsin [45,46,47,48,49]; Aphanizomenon issatschenkoï, a PSP and Anatoxin-A producer [50,51,52], and Aphanizomenon gracile, a PSP producer [52,53,54].
Only MCs are mandatorily monitored in recreational lakes in France, so no data for other toxins could be integrated in this study. Their synthesis however has already been reported to be affected by abiotic parameters such as light and temperature [24,25,26,27,28], and as a consequence it seems important to extend toxin monitoring to PSP, Anatoxin-A and Cylindrospermopsins in order to build relevant health risk management policies in a changing climate context.

Acknowledgments

This work is part of the ORACLE project funded by the French National Agency for Sanitary Security (ANSES) under the national program PNRSET 2012 (project 11-115). The authors sincerely thank the French Agence Régionale de Santé (ARS) of Brittany and the French Agence de l’Eau Loire-Bretagne (AELB) for the data provided and are grateful to Caroline Farenc, student at the School of Environmental Engineering (EME), for data collection and exploitation.

Conflicts of Interest

The authors declare no conflict of interest.

References and Notes

  1. Chorus, I.; Bartram, J. Toxic Cyanobacteria in Water: A Guide to Their Public Health Consequences, Monitoring and Management; Spon Press: London, UK, 1999; p. 416. [Google Scholar]
  2. Falconer, I.R. Potential impact on human health of toxic cyanobacteria. Phycologia 1996, 35, 6–11. [Google Scholar] [CrossRef]
  3. Paerl, H.W.; Hall, N.S.; Calandrino, E. S. Controlling harmful cyanobacterial blooms in a world experiencing anthropogenic and climatic-induced change. Sci. Total Environ. 2011, 409, 1739–1745. [Google Scholar] [CrossRef]
  4. Elliott, J.A. Is the future blue-green? A review of the current model predictions of how climate change could affect pelagic freshwater cyanobacteria. Water Res. 2012, 46, 1364–1371. [Google Scholar] [CrossRef] [Green Version]
  5. Reichwaldt, E.S.; Ghadouani, A. Effects of rainfall patterns on toxic cyanobacterial blooms in a changing climate: Between simplistic scenarios and complex dynamics. Water Res. 2012, 46, 1372–1393. [Google Scholar] [CrossRef]
  6. Kosten, S.; Huszar, V.L.M.; Bécares, E.; Costa, L.S.; Donk, E.; Hansson, L.A.; Scheffer, M. Warmer climates boost cyanobacterial dominance in shallow lakes. Global Change Biol. 2012, 18, 118–126. [Google Scholar] [CrossRef]
  7. Carey, C.C.; Ibelings, B.W.; Hoffmann, E.P.; Hamilton, D.P.; Brookes, J.D. Eco-physiological adaptations that favour freshwater cyanobacteria in a changing climate. Water Res. 2012, 46, 1394–1407. [Google Scholar] [CrossRef]
  8. Paerl, H.W.; Paul, V.J. Climate change: Links to global expansion of harmful cyanobacteria. Water Res. 2012, 46, 1349–1363. [Google Scholar] [CrossRef]
  9. Zhang, M.; Duan, H.; Shi, X.; Yu, Y.; Kong, F. Contributions of meteorology to the phenology of cyanobacterial blooms: Implications for future climate change. Water Res. 2012, 46, 442–452. [Google Scholar] [CrossRef]
  10. Taranu, Z.E.; Zurawell, R.W.; Pick, F.; Gregory-Eaves, I. Predicting cyanobacterial dynamics in the face of global change: the importance of scale and environmental context. Global Change Biol. 2012, 18, 3477–3490. [Google Scholar] [CrossRef]
  11. Carvalho, L.; Kirika, A. Changes in shallow lake functioning: Response to climate change and nutrient reduction. Hydrobiologia 2003, 506–509, 789–796. [Google Scholar] [CrossRef]
  12. Malmaeus, J.M.; Blenckner, T.; Markensten, H.; Persson, I. Lake phosphorus dynamics and climate warming: A mechanistic model approach. Ecol. Model. 2006, 190, 1–14. [Google Scholar] [CrossRef]
  13. Mooij, W.M.; Janse, J.H.; De Senerponts Domis, L.N.; Hülsmann, S.; Ibelings, B.W. Predicting the effect of climate change on temperate shallow lakes with the ecosystem model PCLake. Hydrobiologia 2007, 584, 443–454. [Google Scholar] [CrossRef]
  14. Nõges, P.; Tuvikene, L.; Feldmann, T.; Tõnno, I.; Künnap, H.; Luup, H.; Nõges, T. The role of charophytes in increasing water transparency: A case study of two shallow lakes in Estonia. Hydrobiologia 2003, 506, 567–573. [Google Scholar]
  15. Wiedner, C.; Rücker, J.; Brüggemann, R.; Nixdorf, B. Climate change affects timing and size of populations of an invasive cyanobacterium in temperate regions. Oecologia 2007, 152, 473–484. [Google Scholar] [CrossRef]
  16. Liu, X.; Lu, X.; Chen, Y. The effects of temperature and nutrient ratios on Microcystis blooms in Lake Taihu, China: An 11-year investigation. Harmful Algae 2011, 10, 337–343. [Google Scholar] [CrossRef]
  17. Vasconcelos, V.; Morais, J.; Vale, M. Microcystins and cyanobacteria trends in a 14 year monitoring of a temperate eutrophic reservoir (Aguieira, Portugal). J. Environ. Monit. 2011, 13, 668–672. [Google Scholar] [CrossRef]
  18. De Nobel, W.T.; Matthijs, H.C.P.; Von Elert, E.; Mur, L.R. Comparison of the light-limited growth of the nitrogen-fixing cyanobacteria Anabaena and Aphanizomenon. New Phytol. 1998, 138, 579–587. [Google Scholar]
  19. Baker, P.D.; Bellifemine, D. Environmental influences on akinete germination of Anabaena circinalis and implications for management of cyanobacterial blooms. Hydrobiologia 2000, 427, 65–73. [Google Scholar] [CrossRef]
  20. Hadas, O.; Pinkas, R.; Malinsky-Rushansky, N.; Shalev-Alon, G.; Delphine, E.; Berner, T.; Sukenik, A.; Kaplan, A. Physiological variables determined under laboratory conditions may explain the bloom of Aphanizomenon ovalisporum in Lake Kinneret. Eur. J. Phycol. 2002, 37, 259–267. [Google Scholar] [CrossRef]
  21. McCausland, M.; Thompson, P.; Blackburn, S.I. Ecophysiological influence of light and mixing on Anabaena circinalis (Nostocales, Cyanobacteria). Eur. J. Phycol. 2005, 40, 9–20. [Google Scholar] [CrossRef]
  22. Yamamoto, Y.; Nakahara, H. The formation and degradation of cyanobacterium Aphanizomenon flos-aquae blooms: The importance of pH, water temperature, and day length. Limnology 2005, 6, 1–6. [Google Scholar] [CrossRef]
  23. Imai, H.; Chang, K-H.; Kusaba, M.; Nakano, S-I. Temperature-dependent dominance of Microcystis (Cyanophyceae) species: M. aeruginosa and M. weisenbergii. J. Plankton Res. 2009, 31, 171–178. [Google Scholar]
  24. Rapala, J.; Sivonen, K. Assessment of environmental conditions that favor hepatotoxic and neurotoxic Anabaena spp. strains cultured under light limitation at different temperatures. Microb. Ecol. 1998, 36, 181–192. [Google Scholar] [CrossRef]
  25. Wiedner, C.; Visser, P.M.; Fastner, J.; Metcalf, J.S.; Codd, G.A.; Mur, L.R. Effects of light on the microcystin content of microcystis strain PCC 7806. Appl. Environ. Microbiol. 2003, 69, 1475–1481. [Google Scholar] [CrossRef]
  26. Tonk, L.; Visser, P.M.; Christiansen, G.; Dittmann, E.; Snelder, E.O.; Wiedner, C.; Huisman, J. The microcystin composition of the cyanobacterium Planktothrix agardhii changes toward a more toxic variant with increasing light intensity. Appl. Environ. Microbiol. 2005, 71, 5177–5181. [Google Scholar] [CrossRef]
  27. Briand, E.; Yéprémian, C.; Humbert, J-F.; Quiblier, C. Competition between microcystin- and non-microcystin-producing Planktothrix agardhii (cyanobacteria) strains under different environmental conditions. Environ. Microbiol. 2008, 10, 3337–3348. [Google Scholar] [CrossRef]
  28. Preußel, K.; Wessel, G.; Fastner, J.; Chorus, I. Response of cylindrospermopsin production and release in Aphanizomenon flos-aquae (cyanobacteria) to varying light and temperature conditions. Harmful Algae 2009, 8, 645–650. [Google Scholar] [CrossRef]
  29. Qin, B.; Zhu, G.; Gao, G.; Zhang, Y.; Li, W.; Paerl, H.W.; Carmichael, W.W. A drinking water crisis in Lake Taihu, China: Linkage to climatic variability and lake management. Environ. Manag. 2010, 45, 105–112. [Google Scholar] [CrossRef]
  30. O’Neil, J.M.; Davis, T.W.; Burford, M.A.; Gobler, C.J. The rise of harmful cyanobacteria blooms: The potential roles of eutrophication and climate change. Harmful Algae 2012, 14, 313–334. [Google Scholar] [CrossRef]
  31. Brookes, J.D.; Carey, C.C. Resilience to blooms. Science 2011, 334, 46–47. [Google Scholar]
  32. Terray, L.; Boé, J. Quantifying 21st-century France climate change and related uncertainties. Geoscience 2013, 345, 136–149. [Google Scholar] [CrossRef]
  33. Baurès, E.; Pitois, F.; Jung, A.V.; Thomas, O. Oracle: Objectivizing cyanobacteria-associated risks in recreational waters. In WIT Transaction on Ecology and Environment; Wessex Institute of Technology Press: Southampton, UK, 2013; Volume 178, pp. 133–143. [Google Scholar]
  34. Pitois, F.; Thomas, O.; Thoraval, I.; Baurès, E. Learning from 8 years of regional cyanobacteria observation in Brittany in view of sanitary survey improvement. Environ. Int. 2014, 62, 113–118. [Google Scholar] [CrossRef]
  35. Reynolds, C.S. The Ecology of Freshwater Phytoplankton; Cambridge University Press: Cambridge, UK, 1984; p. 384. [Google Scholar]
  36. Reynolds, C.S. Ecology of Phytoplankton; Cambridge University Press: Cambridge, UK, 2006; p. 535. [Google Scholar]
  37. Dolman, A.M.; Rücker, J.; Pick, F.R.; Fastner, J.; Rohrlack, T.; Mischke, U.; Wiedner, C. Cyanobacteria and cyanotoxins: The influence of nitrogen versus phosphorus. PLoS ONE 2012, 7, e38757. [Google Scholar]
  38. Carvalho, L.; Miller nee Ferguson, C.; Scott, E.M.; Codd, G.; Davies, P.S.; Tyler, A.N. Cyanobacterial blooms: Statistical models describing risk factors for national-scale lake assessment and lake management. Sci. Total Environ. 2011, 409, 5353–5358. [Google Scholar] [Green Version]
  39. Geitler, L. Cyanophyceae von Europa, Kryptogamen Flora von Deutschland, Osterreich und der Schweiz; Koeltz Scientific Books: Koeningstein, Germany, 1932; p. 1196. [Google Scholar]
  40. Komarek, J.; Anagnostidis, K. Cyanoprokaryota 19/1. Teil: Chroococcales; Ettl, H., Gärtner, G., Heynig, H., Mollenhauer, D., Eds.; Süßwasserflora von Mitteleuropa, Spektrum Academischer Verlag: Heidelberg, Germany, 1999; p. 548. [Google Scholar]
  41. Komarek, J.; Anagnostidis, K. Cyanoprokaryota 19/2. Teil: Oscillatoriales; Büdel, B., Gärtner, G., Krienitz, L., Schagerl, M., Eds.; Süßwasserflora von Mitteleuropa, Spektrum Academischer Verlag: Heidelberg, Germany, 2005; p. 759. [Google Scholar]
  42. Utermöhl, H. Zur Vervollkommnung der quantitativen Phytoplankton-Methodik. Mitt. Int. Ver. Theor. Angew. Limnol. 1958, 9, 1–38. [Google Scholar]
  43. Environmental Protection Agency (EPA). LG 401—Standard Operating Procedure for Phytoplankton Analysis; EPA: Chicago, IL, USA, 2010; p. 44. [Google Scholar]
  44. Lawrence, J.F.; Niedzwiadek, B.; Menard, C.; Lau, B.P.; Lewis, D.; Kuper-Goodman, T.; Holmes, C. Comparison of liquid chromatography/mass spectrometry, ELISA, and phosphatase assay for the determination of microcystins in blue-green algae products. J. AOAC Int. 2001, 84, 1035–1044. [Google Scholar]
  45. Mahmood, N.A.; Carmichael, W.W. The pharmacology of anatoxin-a(s), a neurotoxin produced by the freshwater cyanobacterium Anabaena flos-aquae NRC 525-17. Toxicon 1986, 24, 425–434. [Google Scholar] [CrossRef]
  46. Ferreira, F.M.; Franco Soler, J.M.; Fidalgo, M.L.; Fernández-Vila, P. PSP toxins from Aphanizomenon flos-aquae (cyanobacteria) collected in the Crestuma-Lever reservoir (Douro river, Northern Portugal). Toxicon 2001, 39, 757–761. [Google Scholar] [CrossRef]
  47. Liu, Y.; Chen, W.; Li, D.; Shen, Y.; Li, G.; Liu, Y. First report of aphantoxins in China-waterblooms of toxigenic Aphanizomenon flos-aquae in lake Dianchi. Ecotoxicol. Environ. Safety 2006, 65, 84–92. [Google Scholar] [CrossRef]
  48. Preuβel, K.; Stüken, A.; Wiedner, C.; Chorus, I.; Fastner, J. First report on cylindrospermopsin producing Aphanizomenon flos-aquae (Cyanobacteria) isolated from two German lakes. Toxicon 2006, 47, 156–162. [Google Scholar] [CrossRef]
  49. Osswald, J.; Rellán, S.; Gago-Martinez, A.; Vasconcelos, V.M. Production of anatoxin-a by cyanobacterial strains isolated from Portuguese fresh water systems. Ecotoxicology 2009, 18, 1110–1115. [Google Scholar] [CrossRef]
  50. Li, R.; Carmichael, W.; Pereira, P. Morphological and 16S rRNA gene evidence for reclassification of the paralytic shellfish toxin producing Aphanizomenon flos-aquae LMECYA31 as Aphanizomenon issatschenkoi. J. Phycol. 2003, 39, 814–818. [Google Scholar] [CrossRef]
  51. Wood, S.; Selwood, A.I.; Rueckert, A.; Holland, P.T.; Milne, J.R.; Smith, K.F.; Cary, C.S. First report of homoanatoxin-a and associated dog neurotoxicosis in New Zealand. Toxicon 2007, 50, 292–301. [Google Scholar] [CrossRef]
  52. Ballot, A.; Fastner, J.; Wiedner, C. Paralytic shellfish poisoning toxin-producing cyanobacterium Aphanizomenon gracile in Northeast Germany. Appl. Environ. Microbiol. 2010, 76, 1173–1180. [Google Scholar] [CrossRef]
  53. Pereira, P.; Li, R.; Carmichael, W.W.; Dias, E.; Franca, S. Taxonomy and production of paralytic shellfish toxins by the freshwater cyanobacterium Aphanizomenon gracile. Eur. J. Phycol. 2004, 39, 361–368. [Google Scholar] [CrossRef]
  54. Ledreux, A.; Thomazeau, S.; Catherine, A.; Duval, C.; Yéprémian, C.; Marie, A.; Bernard, C. Evidence for saxitoxins production by the cyanobacterium Aphanizomenon gracile in a French recreational water body. Harmful Algae 2010, 10, 88–97. [Google Scholar] [CrossRef]

