Article

Mathematic Modeling for Optimum Conditions on Aflatoxin B1 Degradation by the Aerobic Bacterium Rhodococcus erythropolis

1
School of Food Science and Engineering, Ocean University of China, Qingdao, Shandong 266003, China
2
Shandong Peanut Research Institute, Qingdao, Shandong 266100, China
3
Department of Agriculture (USDA), Agricultural Research Service (ARS), Southern Regional Research Center, New Orleans, LA 70124, USA
*
Author to whom correspondence should be addressed.
Toxins 2012, 4(11), 1181-1195; https://doi.org/10.3390/toxins4111181
Submission received: 25 July 2012 / Revised: 8 October 2012 / Accepted: 31 October 2012 / Published: 6 November 2012
(This article belongs to the Special Issue Mycotoxins in Food and Feed)

Abstract

:
Response surface methodology was employed to optimize the degradation conditions of AFB1 by Rhodococcus erythropolis in liquid culture. The most important factors that influence the degradation, as identified by a two-level Plackett-Burman design with six variables, were temperature, pH, liquid volume, inoculum size, agitation speed and incubation time. Central composite design (CCD) and response surface analysis were used to further investigate the interactions between these variables and to optimize the degradation efficiency of R. erythropolis based on a second-order model. The results demonstrated that the optimal parameters were: temperature, 23.2 °C; pH, 7.17; liquid volume, 24.6 mL in 100-mL flask; inoculum size, 10%; agitation speed, 180 rpm; and incubation time, 81.9 h. Under these conditions, the degradation efficiency of R. erythropolis could reach 95.8% in liquid culture, which was increased by about three times as compared to non-optimized conditions. The result by mathematic modeling has great potential for aflatoxin removal in industrial fermentation such as in food processing and ethanol production.

1. Introduction

Mycotoxins are secondary metabolites produced by Aspergillus, Fusarium and other fungal species that may be present in agricultural commodities and other food [1]. Aflatoxins (AFs) are produced mainly by Aspergillus flavus and A. parasiticus. There are mainly four types of aflatoxins, namely AFB1, AFB2, AFG1, and AFG2. They are detected in most food, such as corn, peanuts, tree nuts, milk and seafood [2,3]. Among the aflatoxins, aflatoxin B1 (AFB1) is the most widespread and so the most investigated mycotoxin because of its hepatotoxic, hepatocarcinogenic, mutagenic and teratogenic properties [4,5]. Due to the great health risk posed by aflatoxin contamination of food and feed, many countries have established Maximum Residue Limits (MRL) allowed in food and feed supplies for consumption and trading. The European Union has set more stringent regulations that limits the amount of aflatoxin B1 to no more than 5 ng g−1 in nuts and oils and zero tolerance of total aflatoxins in infant formula [6]. The U.S. Food and Drug Administration has set the amount of total aflatoxins for interstate trading and consumption to no more than 20 ng g−1. To minimize potential human exposure to aflatoxins, numerous strategies have been used to control the growth of fungi and inhibit aflatoxin formation [7]. Physical methods such as adsorption, heating, UV light, and ionizing radiation are effective only to some degree. Chemical degradation by the addition of chlorinating, oxidizing or hydrolytic agents, are not widely accepted, except ammoniation, which requires expensive equipments and may result in loss of nutritional quality and flavor [8]. Therefore, it is important to find a practical, cost effective and non-toxic method for aflatoxin removal. Use of natural plant extracts and biological methods are one kind of efficient, low-hazardous method for removing toxins [9]. Natural products of plants, such as the extracts of Agave species [10], Garcinia indica extract [11] and Satureja hortensis L. essential oil [12] can inhibit the growth of Aspergillus flavus and aflatoxin biosynthesis. Bacteria isolated from almonds also showed inhibition of A. flavus growth [13]. Previous studies have demonstrated that some bacterial species could degrade aflatoxin. Flavobacterium NRRL B-184 could detoxify aflatoxin in contaminated materials irreversibly [14]. A strain of Mycobacterium fluoranthenivorans screened from soil of a former coal gas plant was able to degrade aflatoxin B1 [15]. Several species of Actinomycetales could degrade aflatoxins, too. Recently, two families of F420 H2-dependent reductases from Mycobacteria that catalyze aflatoxin degradation have been identified [16]. Bacillus megaterium is a rod-shaped, Gram-positive, endospore-forming, aerotolerant species of bacteria. Some researches showed that B. megaterium could inhibit the growth of A. flavus and the biosynthesis of aflatoxin B1 [17]. The effectiveness of Rhodococcus erythropolis on AFB1 degradation was first reported in 2006 [18].
Response surface methodology (RSM), an experimental strategy for seeking the optimum conditions for a multivariable system, described first by Box and Wilson, is a much more efficient technique for optimization [19]. RSM consists of a group of mathematical and statistical procedures that can be used to study relationships between one or more responses and a number of independent variables. RSM defines the effect of the independent variables, alone or in combination, on the process. This method has been successfully applied to the optimization of medium composition, conditions of enzymatic hydrolysis, and parameters of food preservation and fermentation processes.
The purpose of this study was to screen and to establish the optimum conditions for aflatoxin degradation involving the variable factors: temperature, pH, liquid volume, inoculum size, agitation speed, incubation time and to investigate the application of response surface methodology using central composite design to model the degradation of AFB1.

2. Materials and Methods

2.1. Microorgamism and Culture Medium

The bacterial strain (R. erythropolis 4.1491) used in this study was obtained from China General Microbiological Culture Collection Center (CGMCC), R. erythropolis was cultivated in flasks containing ATYP medium for 58.2 h at 15.3 °C with shaking at 180 rpm. The concentration of the viable organisms was estimated to be 108 colony forming units (CFU)/mL by plate count method.
The ingredients of the ATYP medium for propagating R. erythropolis consist of (g/L): KH2PO4, 1; CaCl2, 0.1; NaHCO3, 3; CH3COONa, 1; MgCl2, 0.5; NH4Cl, 1; NaCl, 1; C4H4Na2O4, 0.5; yeast extract, 0.5; peptone, 0.5. One milliliter trace element solution and 1 mL vitamin solution were supplemented to each liter of the ATYP medium to maintain the necessary nutrient requirement of the cells. The trace element solution consists of (g/L): FeCl2·4H2O, 1.8; CoCl2·6H2O, 0.25; NiCl2·6H2O, 0.01; CuCl2·2H2O, 0.01; MnCl2·4H2O, 0.7; ZnCl2, 0.1; H3BO3, 0.5; Na2MoO4·2H2O, 0.03; Na2SeO3·5H2O, 0.01. The ingredients of the vitamin solution consist of (g/L): VH, 0.1; nicotinic acid, 0.35; VB1, 0.3; p-aminobenzoic acid, 0.2; C8H12N2O2·2HCl, 0.1; calcium pantothenate, 0.1; VB12, 0.05. The pH of the medium was adjusted to 5.56.
The aflatoxigenic strain, A. flavus 2810, was kindly provided by Prof. Weijian Zhuang, Fujian Agriculture and Forestry University, China and was maintained on potato dextrose agar (PDA) medium (containing the extract from 200 g boiled potato, 20 g glucose and 20 g agar in 1 liter distilled water) at 4 °C. Spore suspensions were prepared by harvesting seven-day-old sporulating A. flavus cultures with sterile distilled water. Spores were counted with a hemocytometer and then were diluted with sterile distilled water to the desired concentration.

2.2. Degradation of AFB1 by R. erythropolis in Liquid Culture

R. erythropolis (108 CFU/mL) and 0.5 mL aflatoxin B1 (10 mg/L, Sigma, Saint Louis, Missouri, USA) were added to autoclaved ATYP medium in 100 mL flasks. ATYP medium supplemented with AFB1 without R. erythropolis was used as control. After incubation, the cells were removed by centrifugation at 12000 rpm for 10 min, and AFB1 was extracted from the supernatants by methyl alcohol and quantified by aflatoxin B1 ELISA test kit (Beacon Analytical Systems Inc., Portland, Maine, USA).

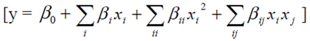
2.3. Experimental Design

2.3.1. Plackett-Burman Design

The Plackett–Burman (PB) experimental design is widely used as a screening tool [20]. Compared with the conventional full factorial design, which is labor-intensive and time-consuming, the PB design significantly decreases the number of experiments needed to effectively achieve experimental objectives [21]. The technique is based on the first-order polynomial model:
Toxins 04 01181 i001
where y is the response (the degradation rate of AFB1), β0 is the model intercept and βi is the linear coefficient and xi is the level of the independent variable [22]. The range and the levels of the variables with both coded values and natural values investigated in this study are given in Table 1. The calculation software SAS 8.0 (SAS Inst. Inc, Cary, N.C., USA) was used for the regression analysis of the data obtained.
Table 1. Range of values for Plackett-Burman (PB) a.
CodeVariables (unit) Levels a
−10+1
X1Temperature (°C)152535
X2pH6.07.08.0
X3Liquid volume (mL/100-mL)102030
X4Inoculum size (%)61014
X5Agitation speed (rpm)160180200
X6Incubation time (h)487296
a x1 = (X1 − 25)/10; x2 = (X2 − 7.0)/1; x3 = (X3 − 20)/10; x4 = (X4 − 10)/4; x5 = (X5 − 180)/20; x6 = (X6 − 72)/24.

2.3.2. Central Composite Design (CCD) and Response Surface Analysis (RSM)

A Central composite design (CCD) with five coded levels was used for exploring the sub-region of the response surface in the neighborhood of the optimum. The experimental results of the response surface analysis (RSM) were fitted via the response surface exploring the sub-region of the response surface in the neighborhood of the optimum. The experimental results of RSM were fitted via the response surface regression procedure, as expressed by the following second order polynomial equation:
Toxins 04 01181 i002
where y is the predicted response (the degradation rate of AFB1), xixj are independent variables, β0 is the offset term, βi is the linear coefficient, βii is the quadratic coefficient, and βij is the second-order interaction coefficient [23]. Data were analyzed using the response surface regression procedure (SAS 8.0) where x is the coded level of the independent variable.

2.4. Inhibition of AFB1 by R. erythropolis in Peanuts

Peanuts that reach commercial level of maturity were harvested and used immediately or stored at 4 °C for use within 48 h. For preparation, the peanut kernels were washed with tap water, then surface-disinfected with 0.1% sodium hypochlorite for 1 min, cleaned with tap water and air dried [17]. Twenty grams of peanuts were placed in each of the four autoclaved 100 mL flasks (three treatments plus one control). The three treatments were: (A) Two milliliters of R. erythropolis cell suspension (108 CFU/mL); (B) 2 mL B. megaterium cell suspension (108 CFU/mL); (C) 1 mL each of R. erythropolis and B. megaterium cell suspension (108 CFU/mL); and (D) sterile distilled water (control). After incubation at room temperature for three hours, 200 μL of A. flavus spores at a concentration of 106 spores/mL were inoculated into each flask. The flasks were placed in growth chamber (QHX-300BS-III, Shanghai Xinmiao) with controlled humidity at 85% and temperature at 30 °C for incubation. The concentration of aflatoxin B1 was examined after seven days’ inoculation using high performance liquid chromatography (HPLC) [24].

3. Results and Discussion

3.1. Plackett-Burman Design

The design matrix selected for the screening of significant variables for the degradation of AFB1 and the corresponding responses are shown in Table 2. The adequacy of the model was calculated, and the variables evidencing statistically significant effects were screened via Student’s t-test for ANOVA (Table 3). It is indicated that temperature, pH, liquid volume and incubation time were the most important factors. The polynomial model describing the correlation between the formulation and the variables (x1 − x6) and the degradation rate of AFB1 (y) can be expressed by the following equation:
Toxins 04 01181 i003
Table 2. Experimental designs and the results of the PB design.
Runx1x2x3x4x5x6y (%)
1−1−1−1−1−1−118.1
21−1−1−1−1110.6
3−11−1−1−1180.9
411−1−1−1−112.6
5−1−11−1−1175.0
61−11−1−1−113.4
7−111−1−1−126.2
8111−1−1111.8
9−1−1−11−1151.4
101−1−11−1−110.9
11−11−11−1−127.2
1211−11−1111.3
13−1−111−1−149.0
141−111−119.2
15−1111−1190.6
161111−1−134.9
17−1−1−1−11126.6
181−1−1−11−115.8
19−11−1−11−114.5
2011−1−11112.5
21−1−11−11−122.9
221−11−11122.8
23−111−11185.7
24111−11−121.2
25−1−1−111−112.2
261−1−11118.7
27−11−111162.8
2811−111−126.7
29−1−1111140.3
301−1111−119.8
31−11111−132.3
3211111145.2
3300000079.4
3400000081.4
3500000079.8
3600000080.9
Table 3. Identifying significant variables for the degradation of AFB1 using Plackett–Burman design.
VariableCoefficientst Valuep-value
Intercept31.3468810.52<0.0001
x1−13.38438−4.490.0001
x25.928131.990.0578
x36.171882.070.0489
x41.934380.650.5223
x5−1.97187−0.660.5143
x68.990633.020.0058
The results of the t-test for variance between the average of observation of the 2-level experiment and the center point showed that the difference was significant (P < 0.05). This indicated that the optimum point was in the domain of our experiment. The next step in the optimization of the degradation efficiencies was to determine the optimum levels of significant variables. For this purpose, the RSM, using a central composite design, was adopted for optimization of the degradation efficiencies.

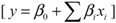
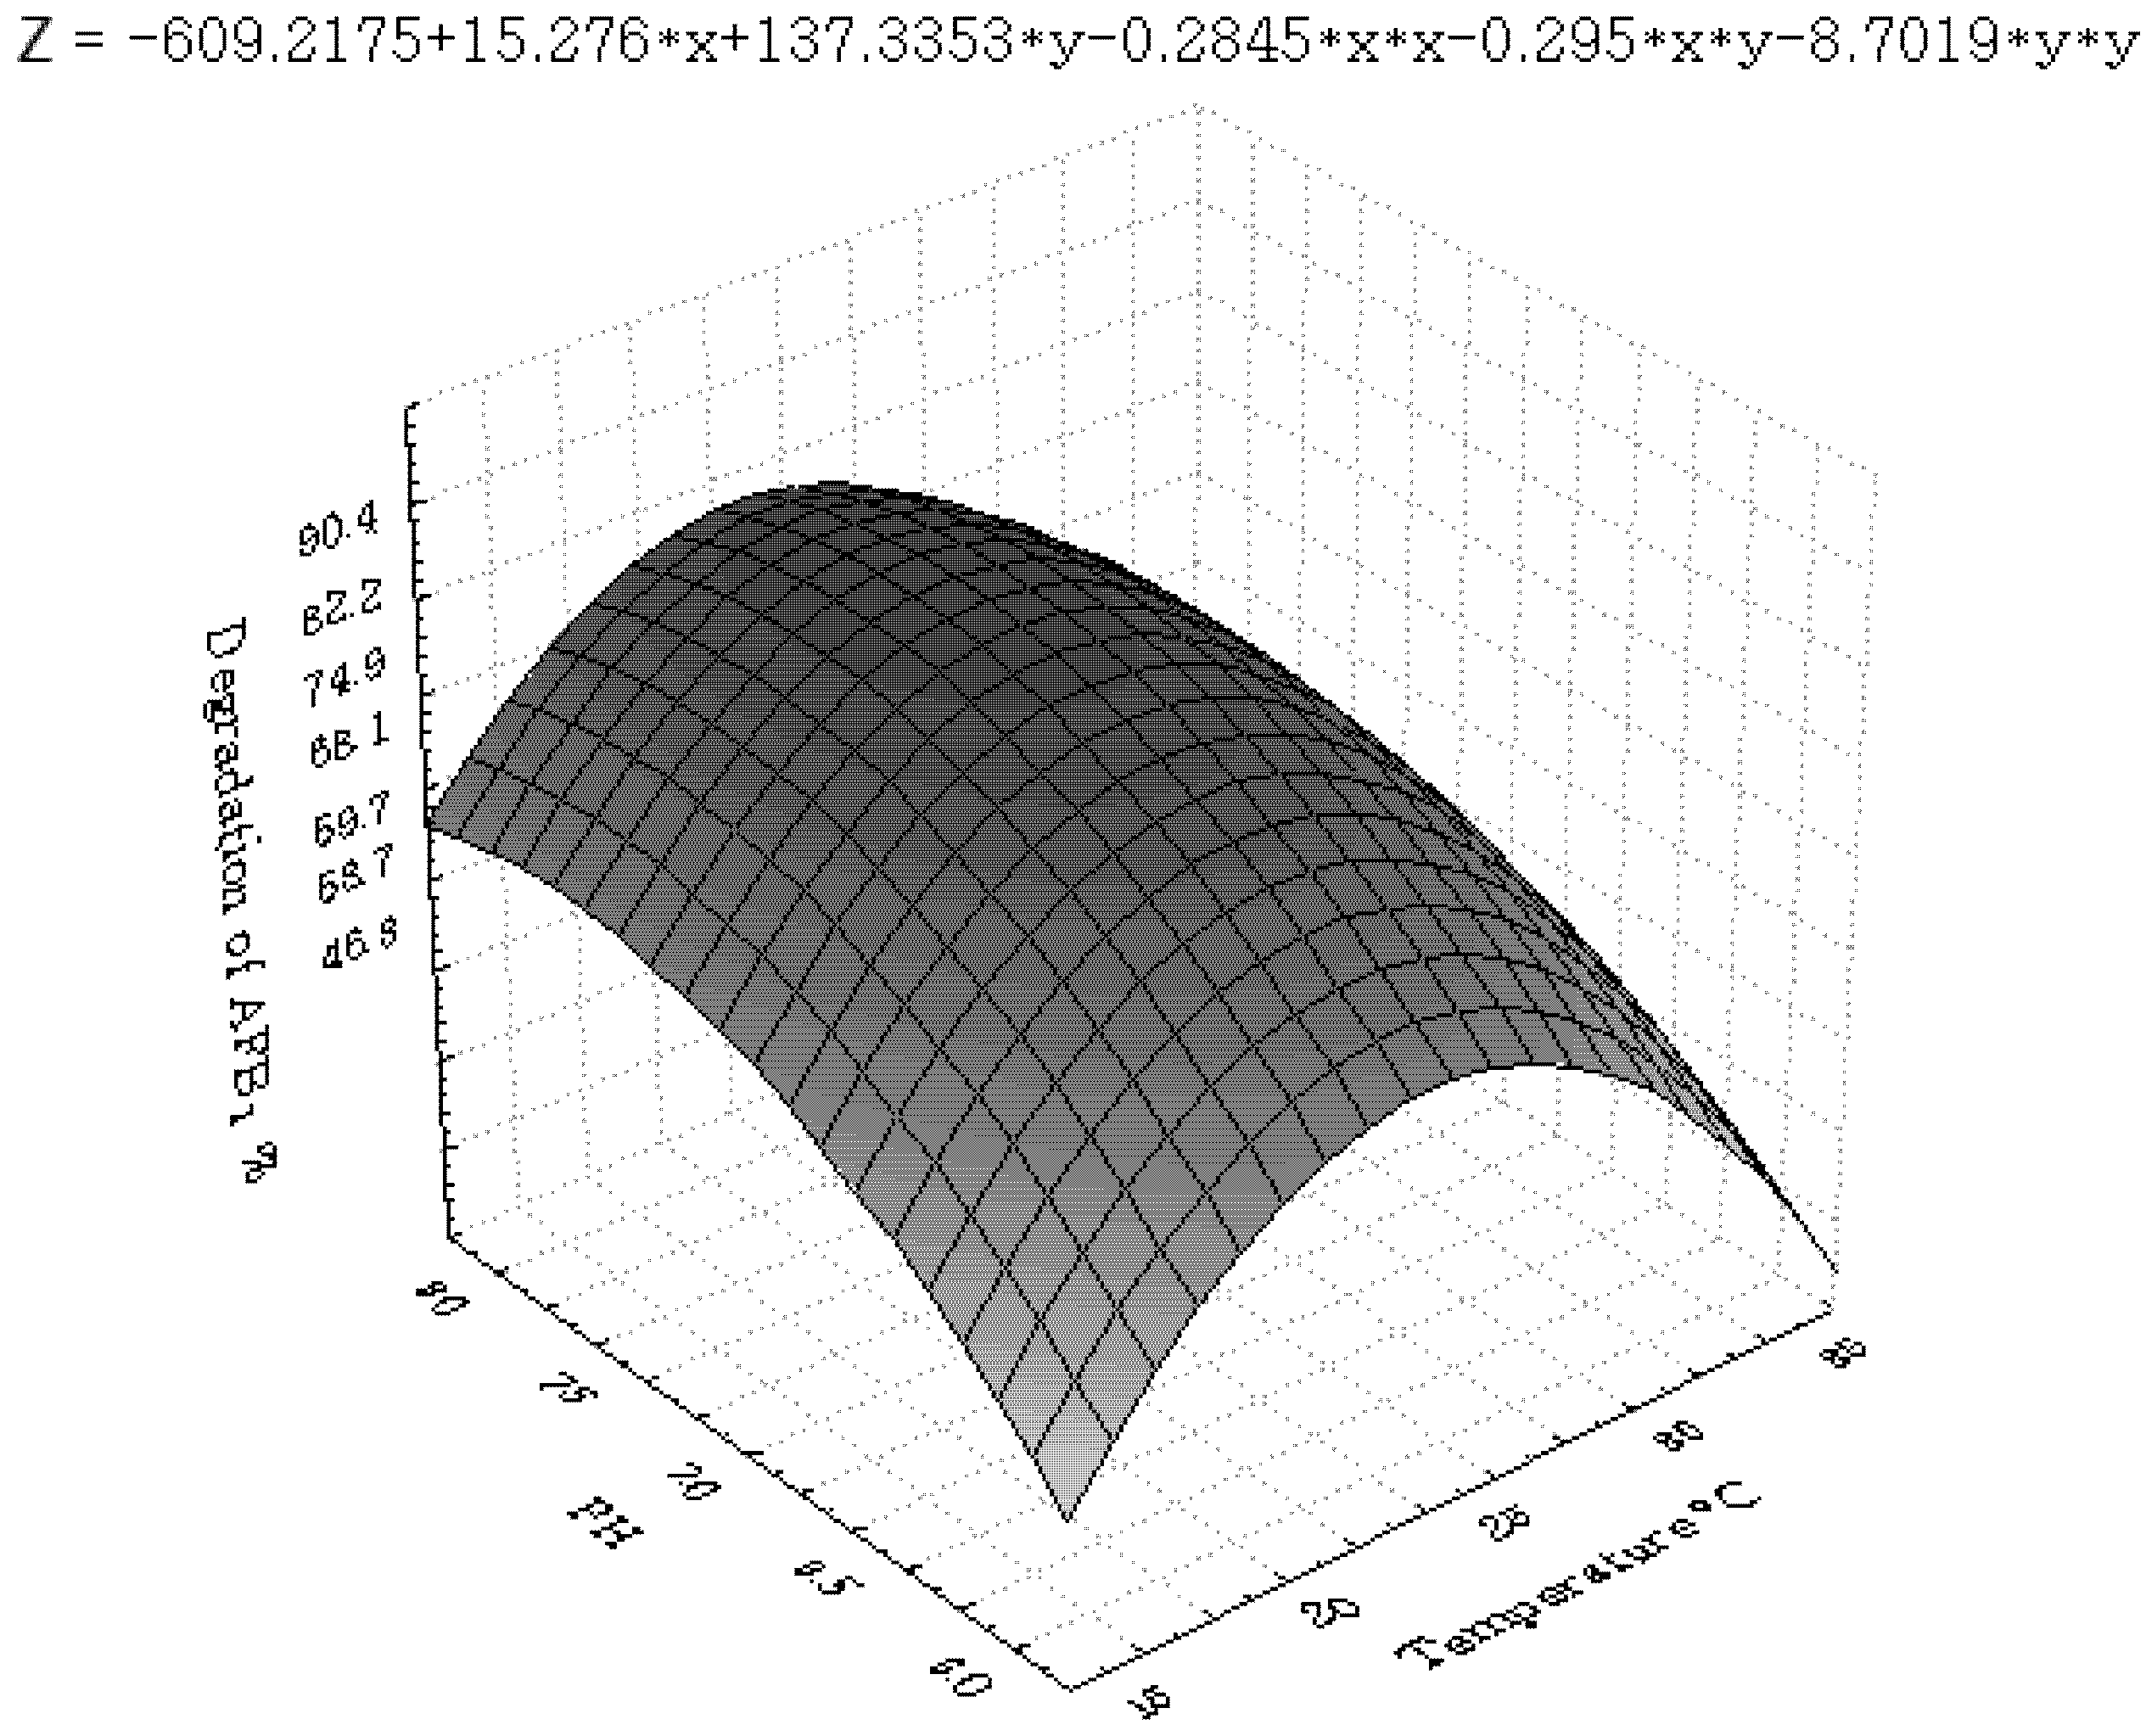
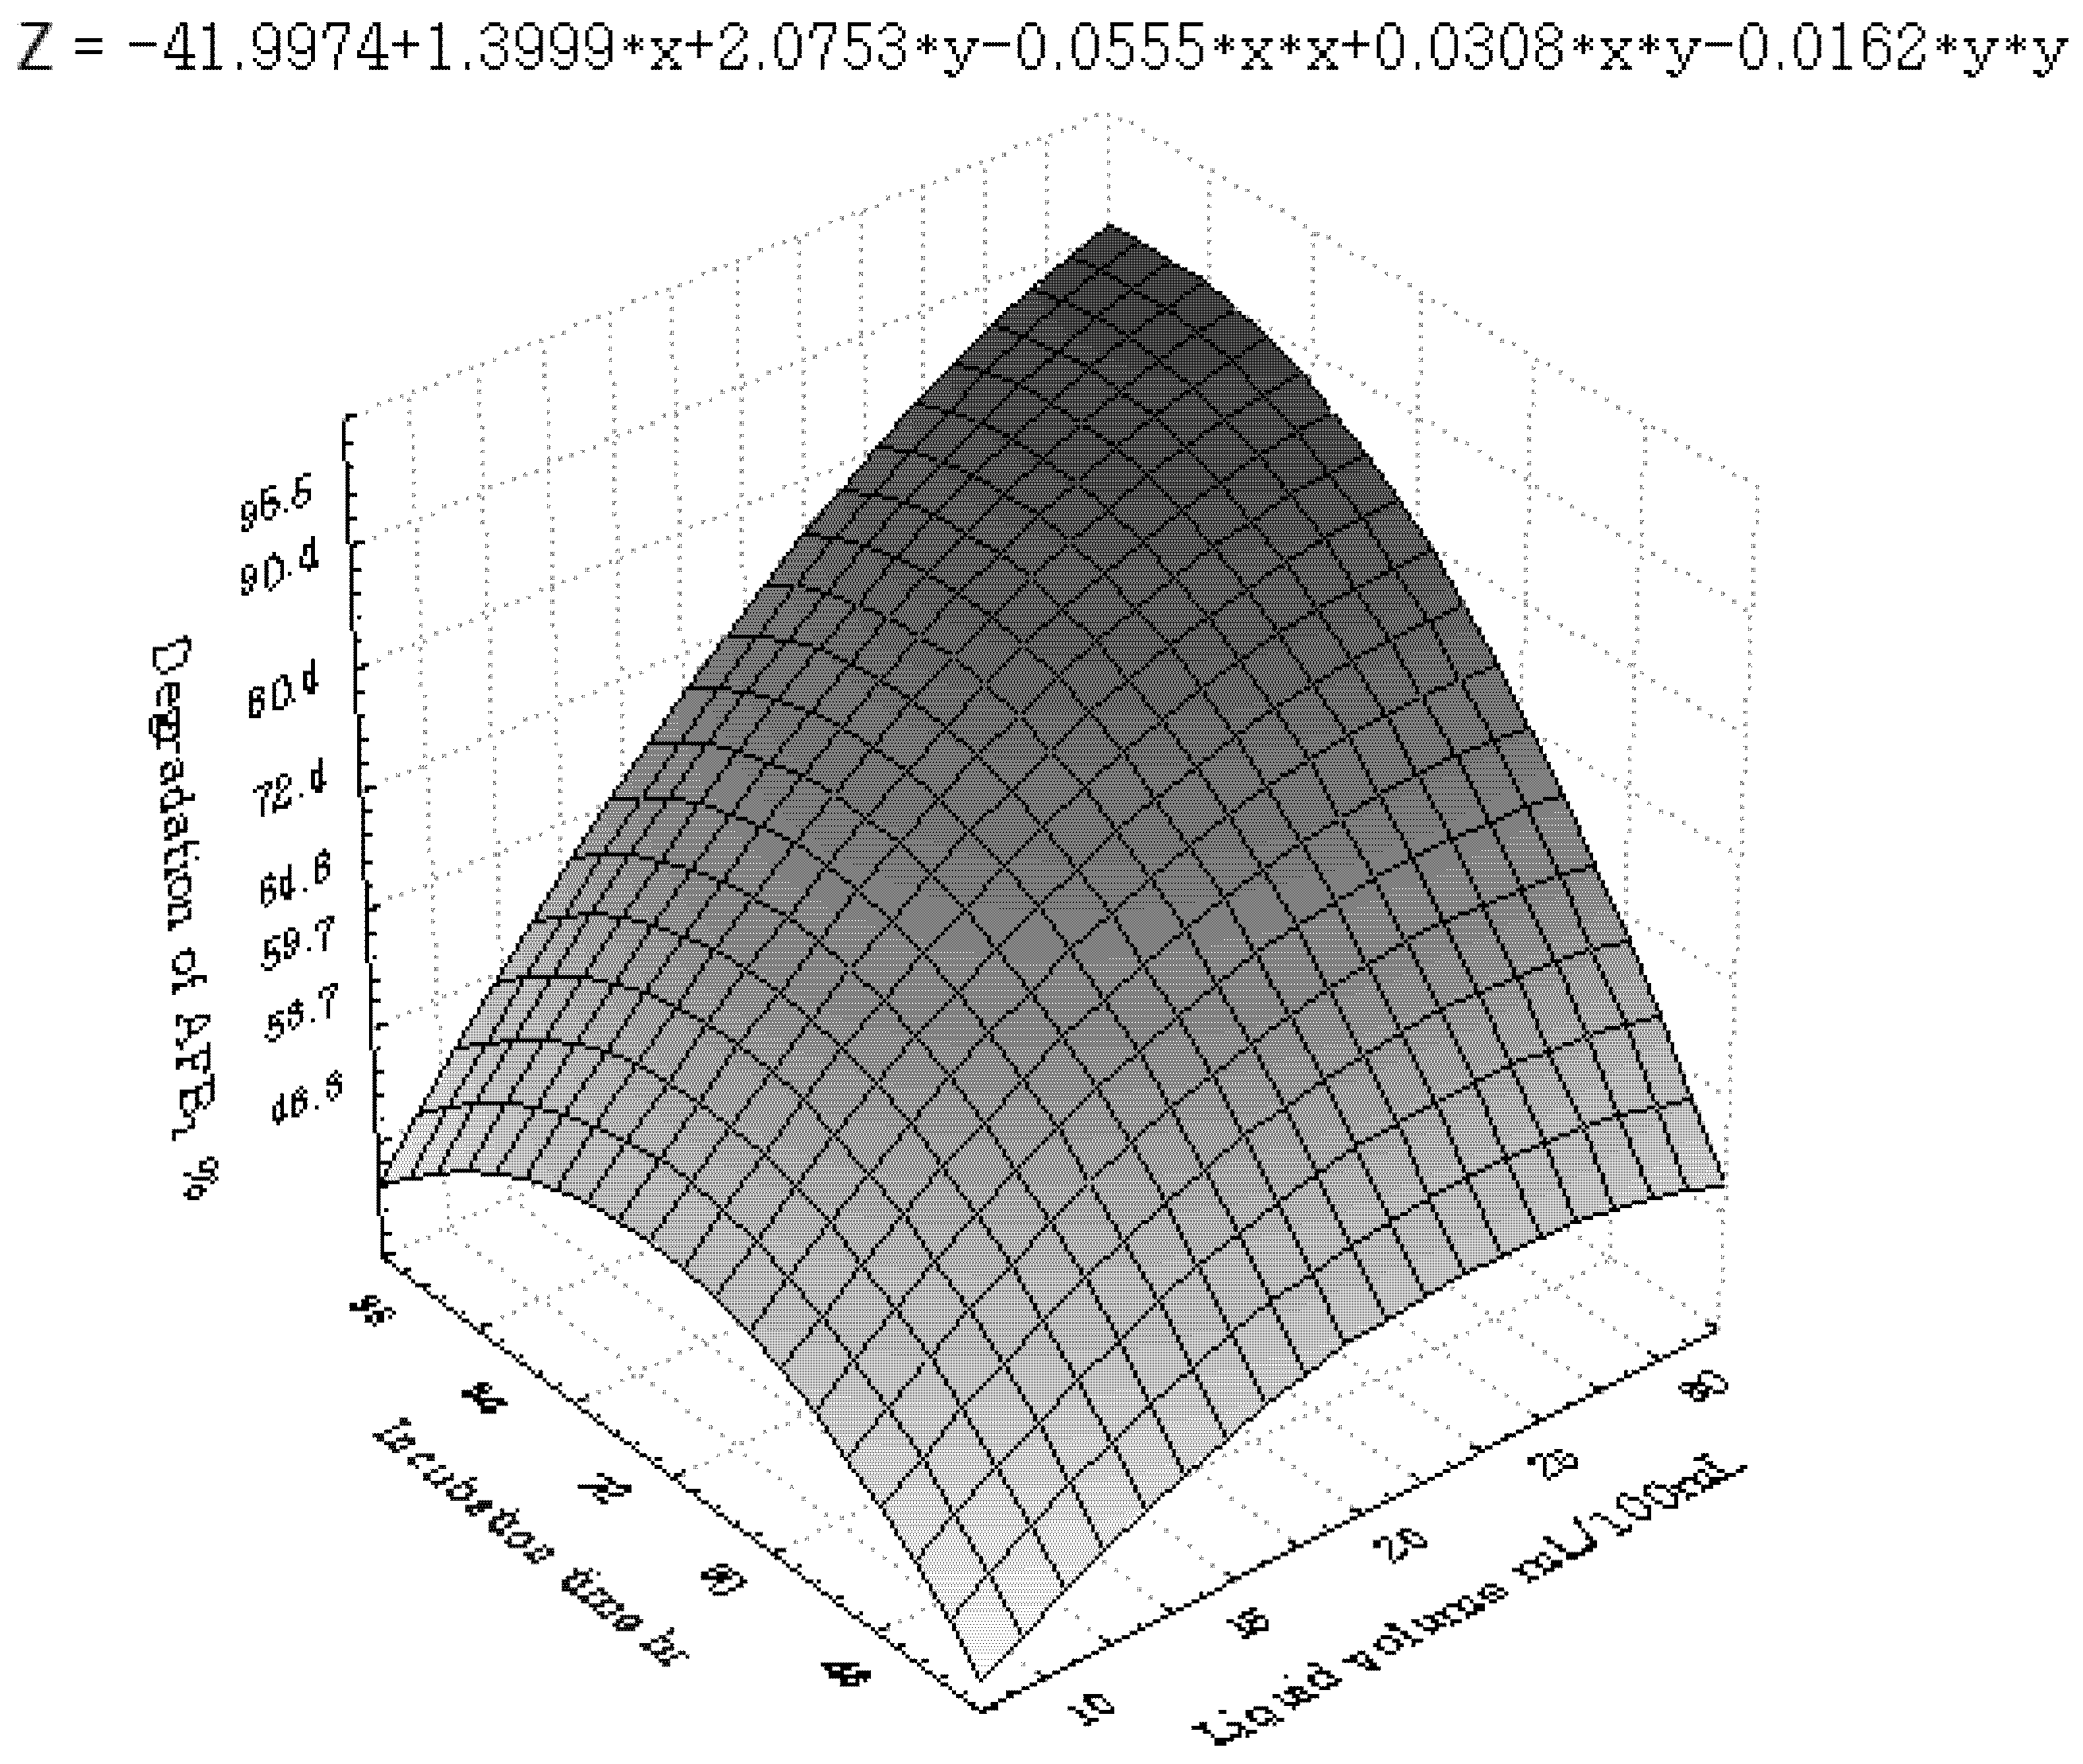
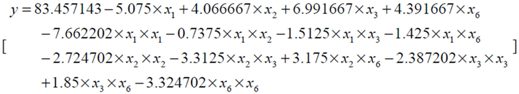
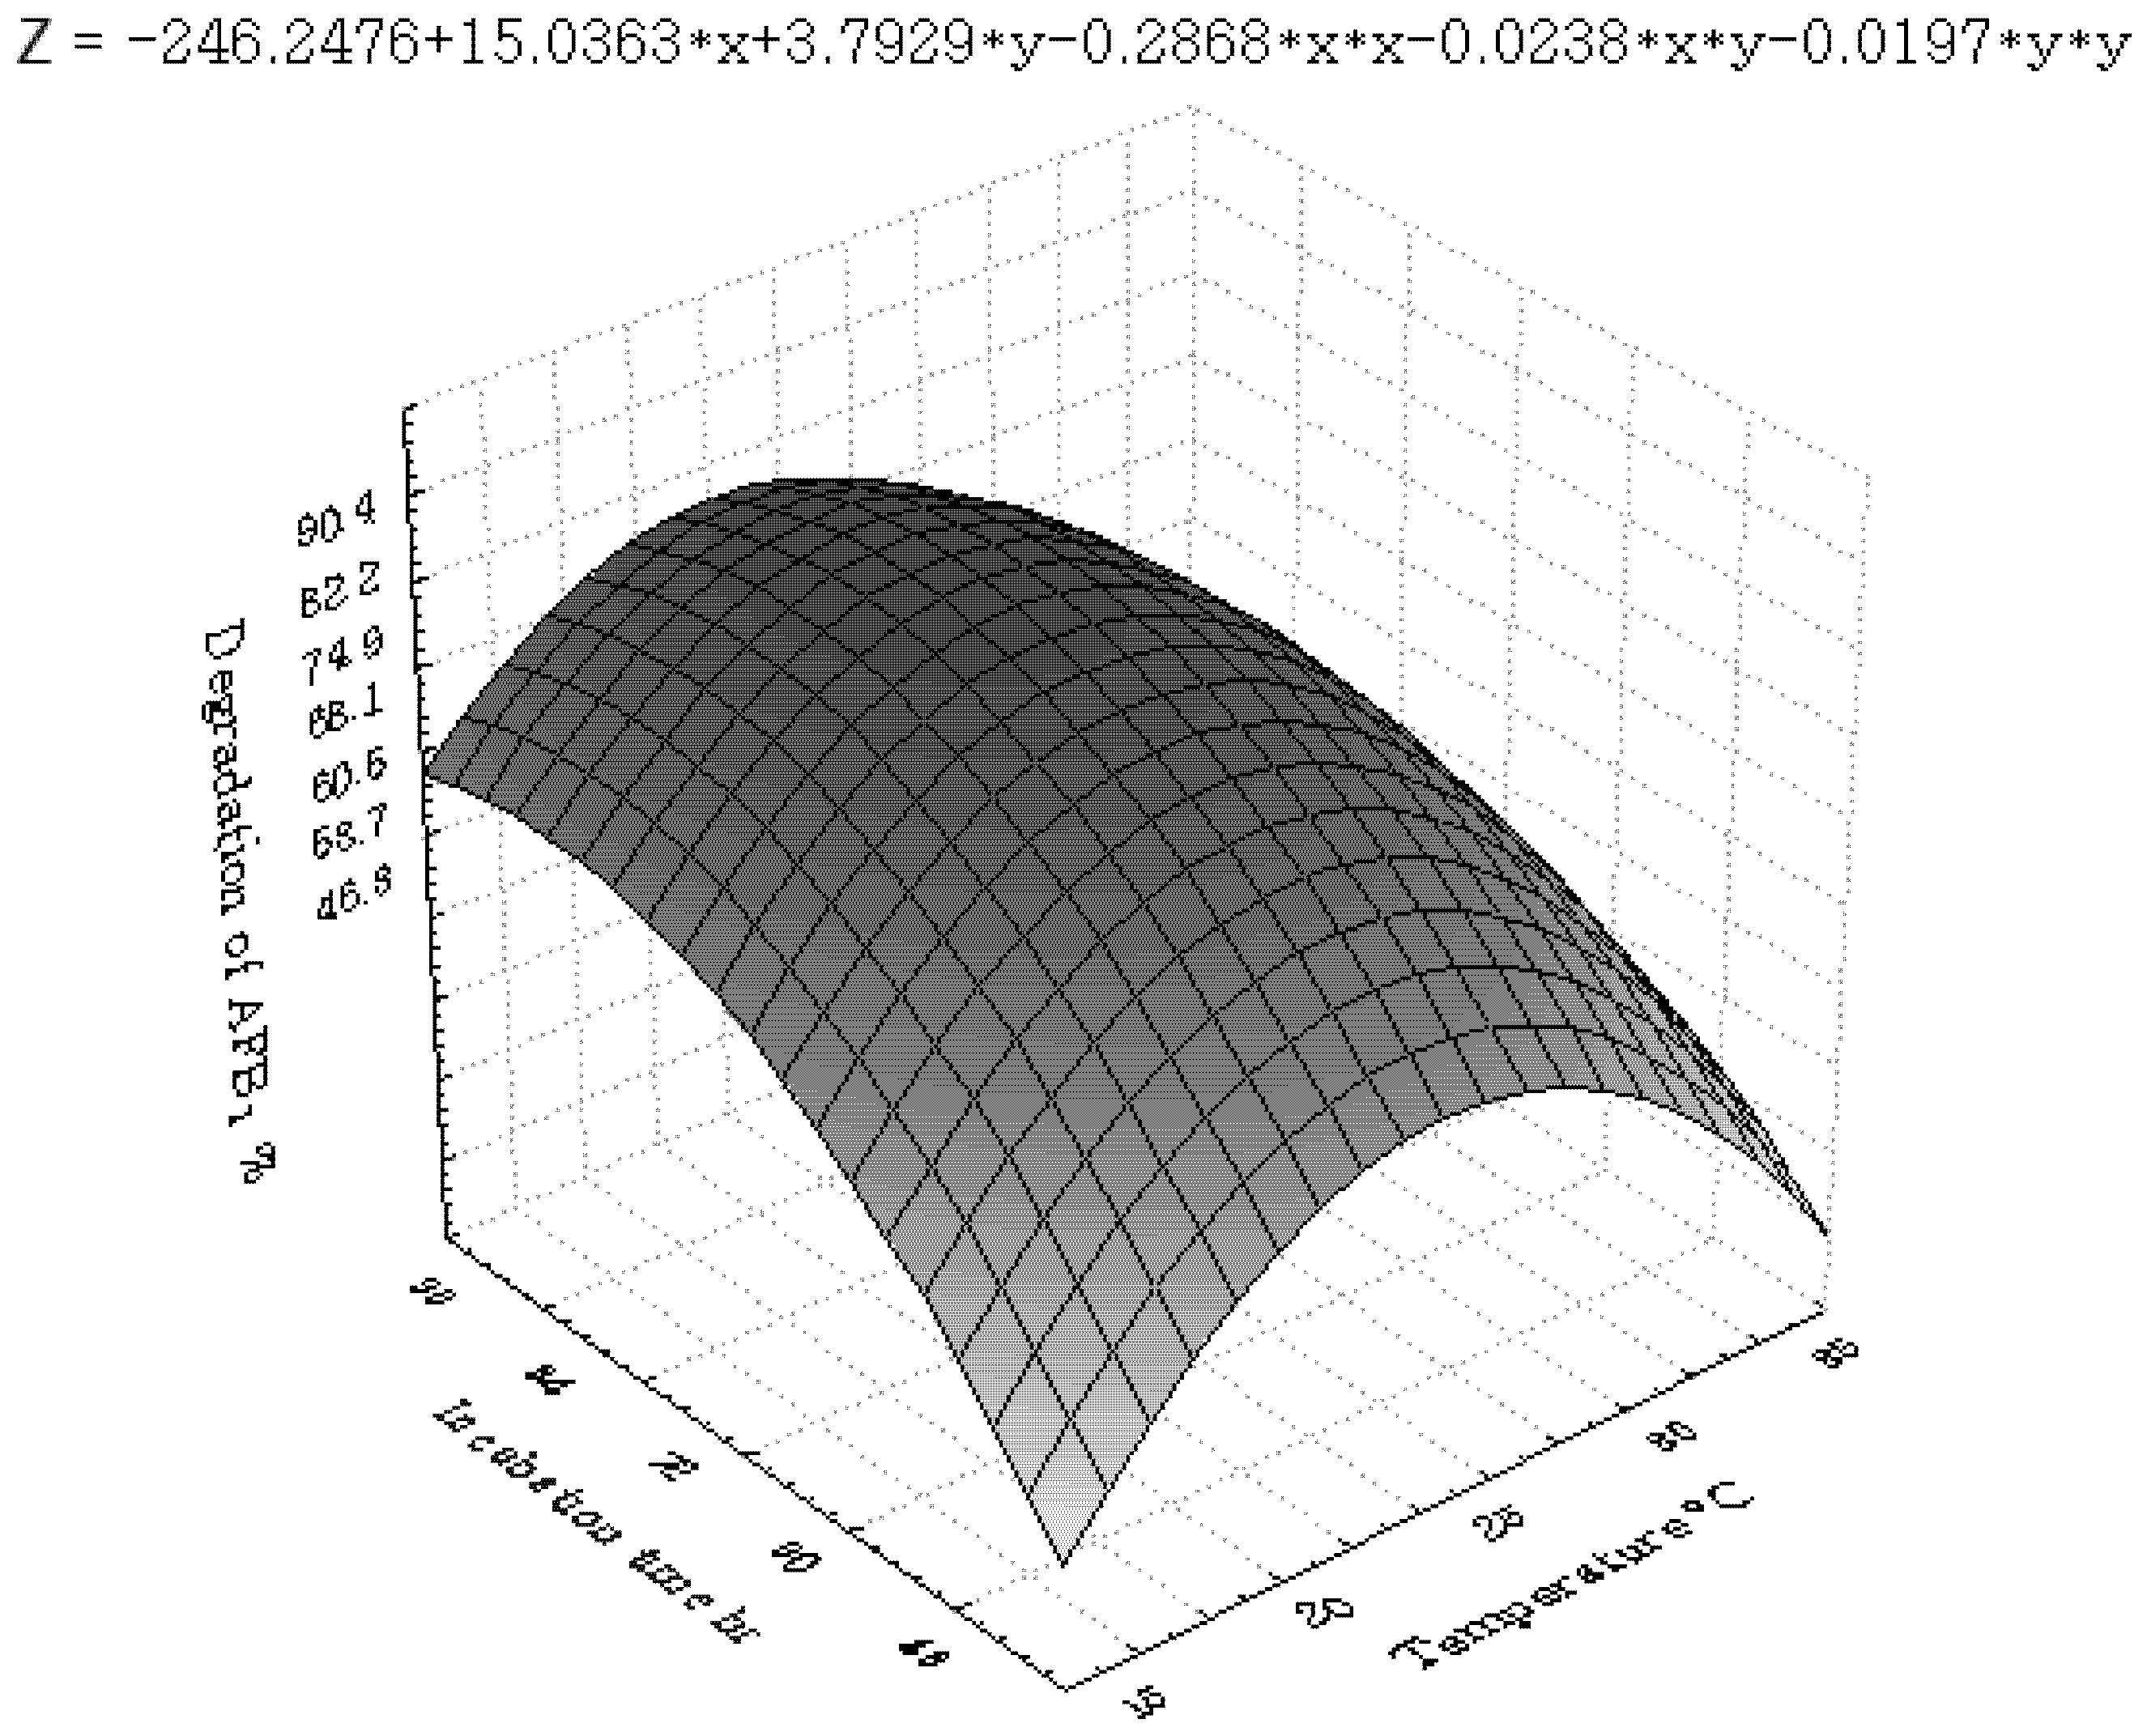
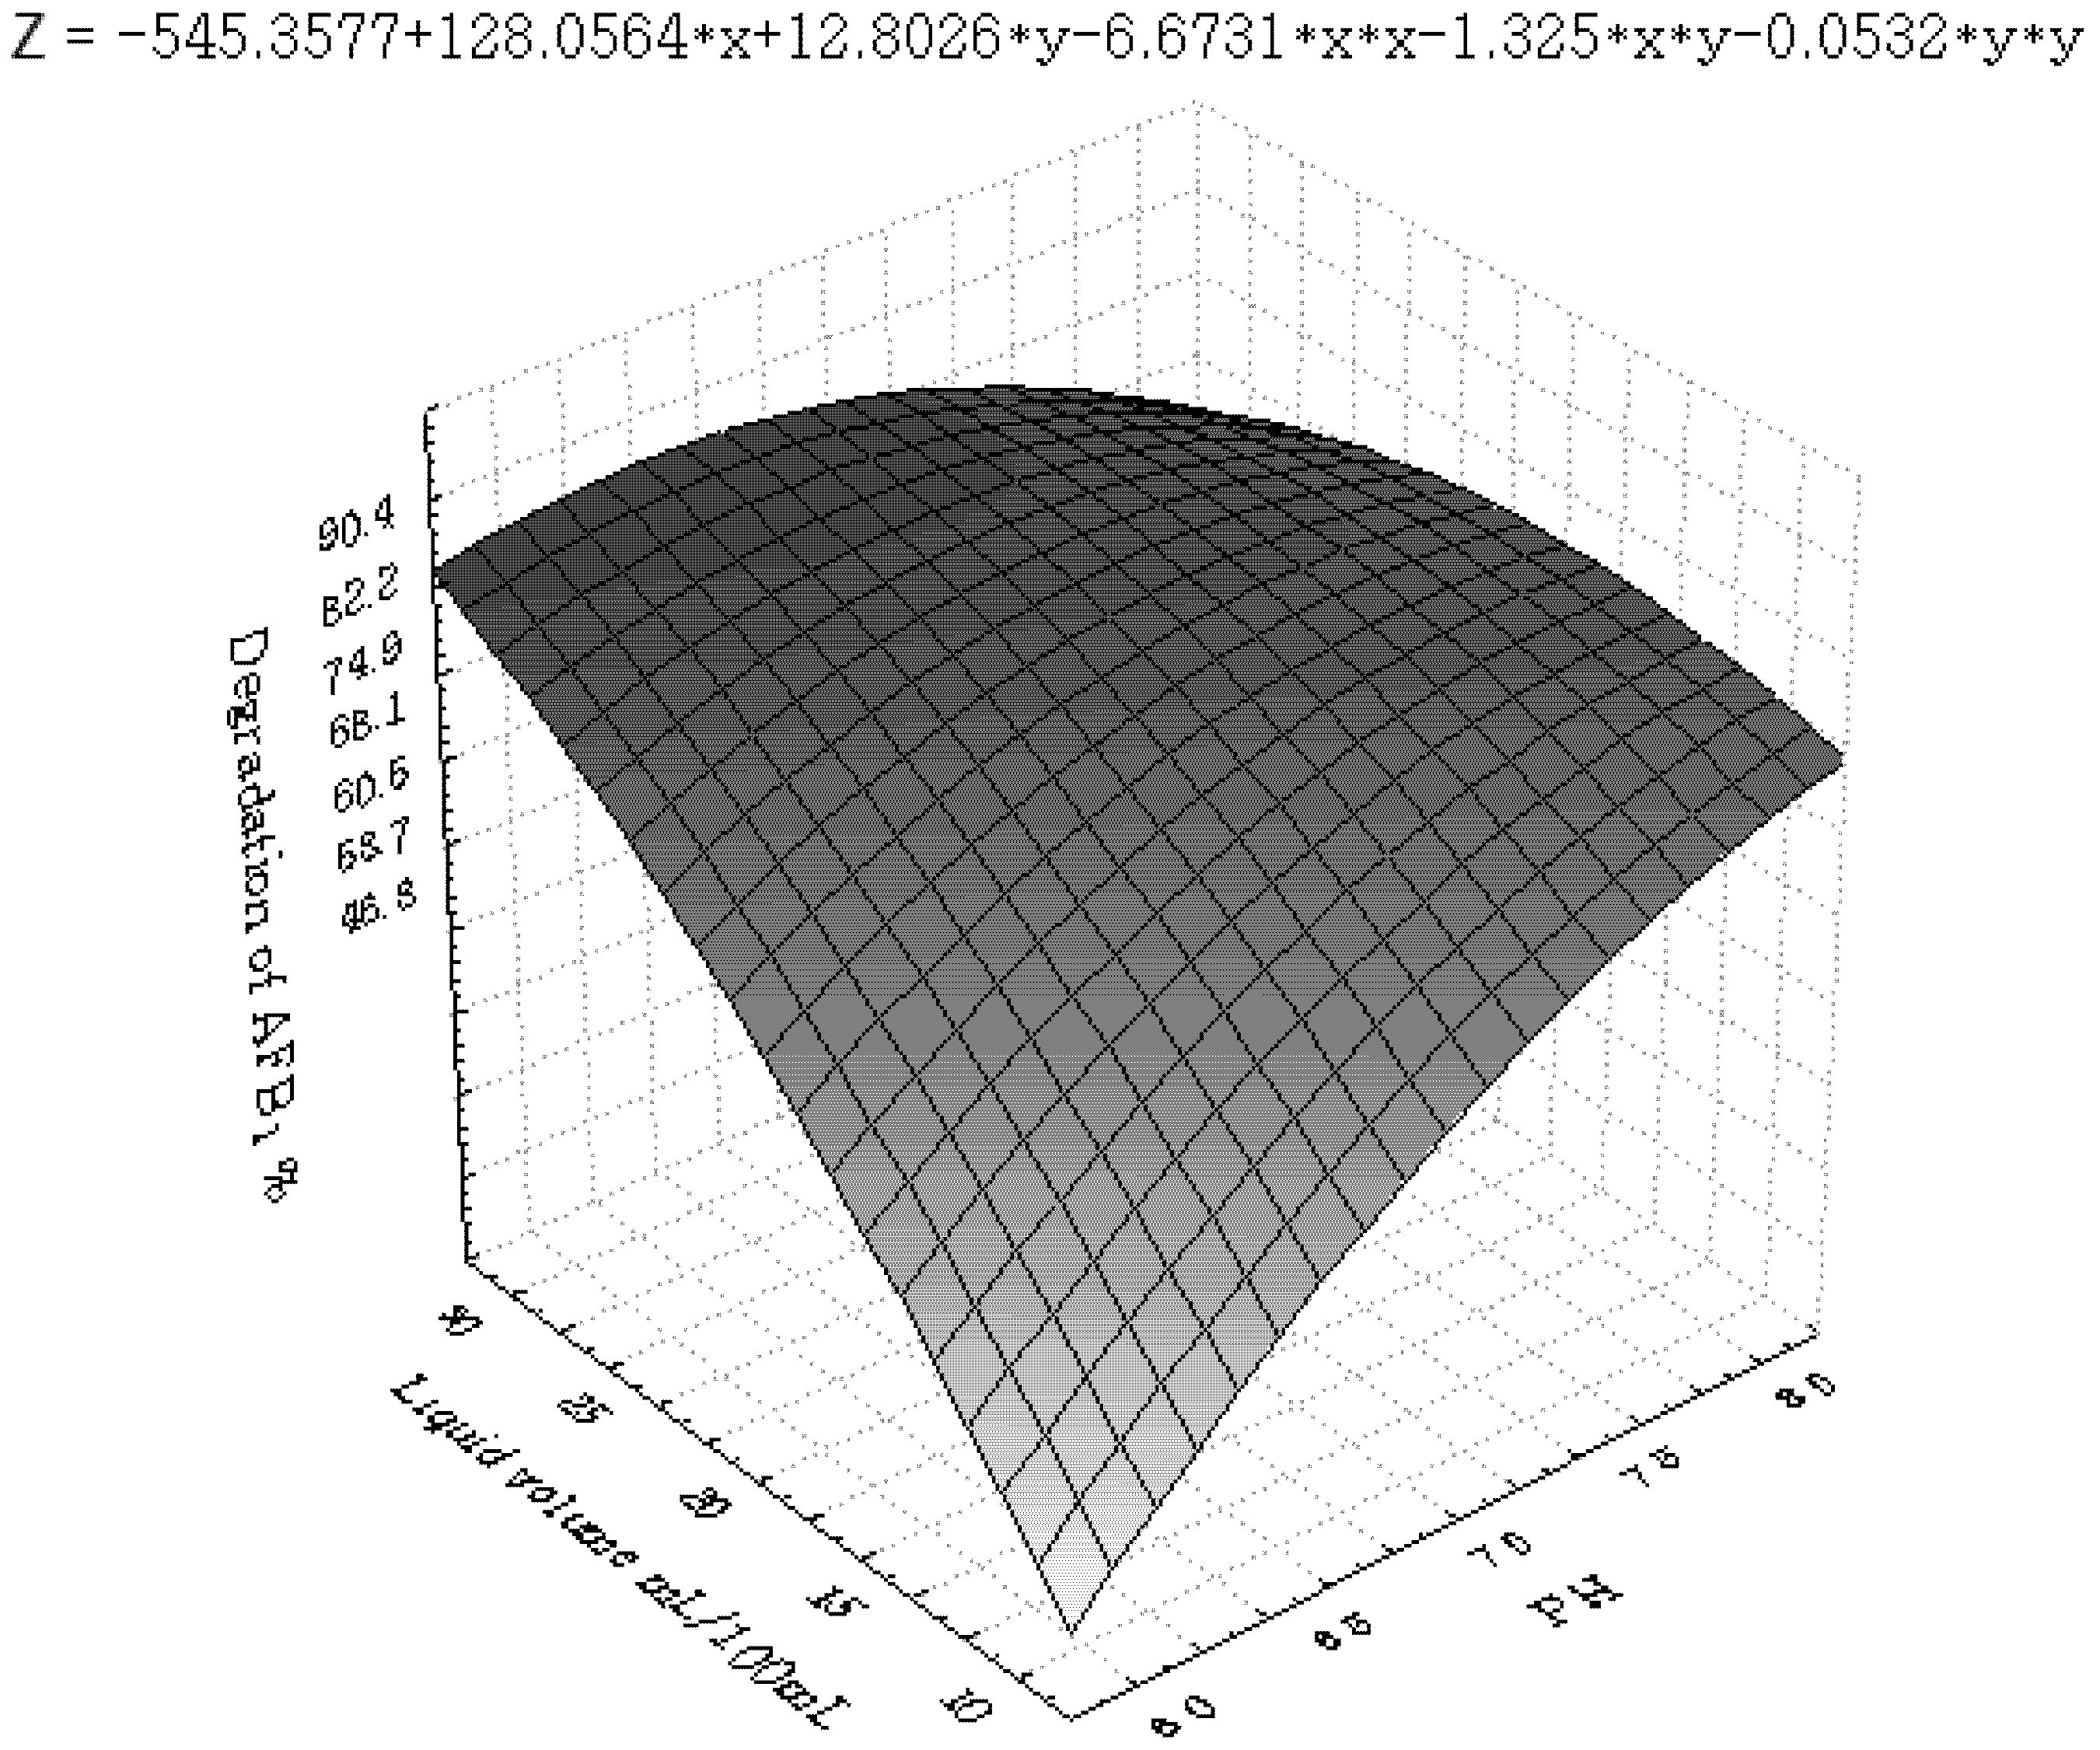
3.2. Central Composite Design and Response Surface Analysis

A central composite design (CCD) under RSM was used to analyze the interactive effect of temperature, pH, liquid volume and incubation time to reach an optimum level. The design matrix and the corresponding results of the RSM experiments to determine the effects of four independent variables are shown in Table 4.
Table 4. The matrix of the central composite design (CCD) experiment and the corresponding experimental data.
Runsx1x2x3x6y (%)
1−1−1−1−157.6
2−1−1−1147.8
3−1−11−174.9
4−1−11180.4
5−11−1−164.2
6−11−1172.4
7−111−165.3
8−111190.4
91−1−1−147.0
101−1−1146.3
111−11−164.8
121−11162.0
1311−1−154.6
1411−1159.7
15111−160.5
16111165.1
17−200068.1
18200053.7
190−20069.1
20020092.2
2100−2068.5
22002095.5
23000−260.7
24000295.8
25000082.6
26000084.4
27000083.7
28000083.9
29000083.4
30000082.2
31000084.0
x1 = (X1 − 25)/5; x2 = (X2 − 7.0)/0.5; x3 = (X3 − 20)/5; x6 = (X6 − 72)/12.
Experimental data were used in the response surface regression (RSREG) procedure of SAS to find the coefficients of the response function. The coefficients of the response function for the degradation efficiencies are listed in Table 5. In this case, temperature, pH, liquid volume and incubation time had a significant effect on degradation of AFB1 (P < 0.05), as well as the quadratic terms of temperature. The fitness of the model was examined by the coefficient of determination R2, which was found to be 0.8096, indicating that the sample variation of 80.96% was attributed to the variables. The model can be shown as follows:
Toxins 04 01181 i004
Table 6 shows the analysis of variance of the regression parameters of the predicted response surface quadratic models for the degradation of AFB1. As can be seen, both linear and quadratic parameters were very significant. However, the statistical analysis showed that the interaction among parameters was insignificant. This means that all factors considered in this study had a specific effect on the degradation. However, there were no effects of multi-variable interaction present. The effect of individual variable factors is more significant than that of the multi-factor interaction [25].
Table 5. Regression coefficients of the response function for the degradation of AFB1.
ParameterDFEstimateStandardErrort ValuePr > |t|
Intercept183.4571433.27328625.50<0.0001
x11−5.0750001.767777−2.870.0111
x214.0666671.7677772.300.0352
x316.9916671.7677773.960.0011
x614.3916671.7677772.480.0244
x1 * x11−7.6622021.619505−4.730.0002
x2 * x11−0.7375002.165075−0.340.7378
x2 * x21−2.7247021.619505−1.680.1119
x3 * x11−1.5125002.165075−0.700.4948
x3 * x21−3.3125002.165075−1.530.1456
x3 * x31−2.3872021.619505−1.470.1599
x6 * x11−1.4250002.165075−0.660.5198
x6 * x213.1750002.1650751.470.1619
x6 * x311.8500002.1650750.850.4055
x6 * x61−3.3247021.619505−2.050.0568
Table 6. ANOVA results for central composite design (CCD).
RegressionDFType I Sum of SquaresR-SquareF ValuePr > F
Linear42651.1250000.42058.840.0006
Quadratic41983.5132330.31466.610.0024
Crossproduct6469.4075000.07451.040.4345
Total Model145104.0457330.80964.860.0017
Figure 1, Figure 2, Figure 3, Figure 4, Figure 5 and Figure 6 portray the 3D response surface plots constructed using the quadratic regression model generated by regression analysis. Figure 1 shows the effects of temperature and pH on the AFB1degradation. The degradation of AFB1 increased with temperatures up to 25 °C. In temperature ranges over 25 °C, a negative effect of the temperature on AFB1 degradation was observed. AFB1 degradation increased with an increase in pH. The effects of temperature and liquid volume are shown in Figure 2. An increase in temperature above 25 °C resulted in less degradation of AFB1. As the liquid volume increased, the degradation of AFB1 increased at all temperatures probably due to the fact that a high liquid volume is conducive to the growth of bacteria. Figure 3 shows the effects of the interaction of temperature and incubation time on the degradation of AFB1. As the length of the incubation time increased to 84 h, the degradation of AFB1 increased at all temperatures. However, further increase in incubation time resulted in little increase in the degradation of AFB1. Figure 4 is a response surface plot indicating the effects of pH and liquid volume on the degradation of AFB1. pH and liquid volume had a positive linear effect on the degradation of AFB1. The plot also reveals that properly increasing pH is conducive to increasing degradation. Figure 5 shows the effects of the interaction of pH and incubation time on the degradation of AFB1. At 96 h, a linear increase in degradation was observed when the pH was increased. In alkaline conditions, increase in incubation time resulted in increased degradation. A similar profile is observed in Figure 6 with liquid volume and incubation time.
Figure 1. The response surface plot showing the effects of temperature (x1) and pH (x2) on AFB1 degradation.
Toxins 04 01181 g001
Figure 2. The response surface plot showing the effects of temperature (x1) and liquid volume (x3) on AFB1 degradation.
Toxins 04 01181 g002
Figure 3. The response surface plot showing the effects of temperature (x1) and incubation time (x6) on AFB1 degradation.
Toxins 04 01181 g003
Figure 4. The response surface plot showing the effects of pH (x2) and liquid volume (x3) on AFB1 degradation.
Toxins 04 01181 g004
Figure 5. The response surface plot showing the effects of pH (x2) and incubation time (x6) on AFB1 degradation.
Toxins 04 01181 g005
Figure 6. The response surface plot showing the effects of liquid volume (x3) and incubation time (x6) on AFB1 degradation.
Toxins 04 01181 g006
According to the canonical analysis, the results predicted by the model showed that the maximum degradation could be achieved when the temperature, initial pH, liquid volume and incubation time were set at 23.2 °C, 7.17, 24.6 mL/100 mL and 81.9 h, respectively. The predicted optimum rate of AFB1 degradation was 96.7%. In order to confirm the optimization results, a further degradation test was carried out under the optimal conditions based on the results from the model; the experimentally observed optimum rate of AFB1 degradation was 95.8% which was quite in agreement with the predicted value.

3.3. Inhibition of AFB1 by R. erythropolis in Peanuts

The strain of marine B. megaterium was isolated from the Yellow Sea of East China, and showed reduced postharvest infection of peanut kernels caused by A. flavus [17]. The results showed both R. erythropolis and B. megaterium could significantly reduce the biosynthesis of aflatoxins in peanuts (p < 0.01) (Table 7). The effect of R. erythropolis plus B. megaterium was better than that of a single bacterial strain.
Table 7. Inhibition of aflatoxin B1 by R. erythropolis in peanuts.
ControlR. erythropolisB. megateriumR. erythropolis and B. megaterium
Aflatoxin B1 (μg/kg) (mean ± SD)195.69 ± 1.92178.38 ± 2.47148.27 ± 3.87140.80 ± 3.59
Tejada-Castañeda et al., reported that a strain of Nocardia corynebacteroides was safe to detoxify aflatoxin-contaminated feed for chickens, because it could transform AFB1 to other less toxic compounds [26]. Can R. erythropolis degrade AFB1 completely or can it only transform AFB1 to other less toxic compounds? To answer this question, the metabolites of AFB1 incubated with R. erythropolis should be studied further. Furthermore, the work of Taylor et al., describes the enzymes in Mycobacterium smegmatis that degrade aflatoxin, which is subsequently corroborated by the work of Lapalikar et al., who show that enzymes from R. erythropolis also degrade aflatoxin [17,27]. These enzymes are dependent upon the cofactor F420, whose production has been shown to be maximal at around 96 hours [28,29]. In a next step, the enzyme activity of F420H2-dependent reductases in the strain of R. erythropolis used in this study and the expression of aflatoxin pathway genes in A. flavus corresponding to the effect of R. erythropolis should be studied in greater detail, because the results could help us elucidate the mechanism of degradation of aflatoxin by R. erythropolis.

4. Conclusions

Plackett–Burman design and central composite design were adopted to screen the key factors and identify the optimal conditions for degradation of AFB1. Using RSM analysis, the four significant variables (temperature, pH, liquid volume and incubation time) selected by the Plackett–Burman design experiment were found to have linear effects on AFB1 degradation at significant level. The optimum conditions of each variable were as follows: temperature, 23.2 °C; pH, 7.17; liquid volume, 24.6 mL/100mL; inoculum size, 10%; agitation speed, 180 rpm; and incubation time, 81.9 h. Under these conditions, the AFB1 degradation efficiency of R. erythropolis was increased from 28.7% to 95.8%.
Our result by mathematic modeling has great potential for practical applications. It can be used in aflatoxin removal during industrial fermentation for food processing and fermentation for bioenergy generation such as ethanol production. R. erythropolis can be used to reduce the biosynthesis of aflatoxins in peanuts and other agricultural food commodities. It can potentially be used in biocontrol to reduce aflatoxin contamination of food and feed utilizing its activity against the aflatoxins biosynthesis in A. flavus. The potential for commercial use in the market to prolong shelf life can also be explored.

Acknowledgements

This research was supported by National Natural Science Foundation of China (31000823), Program for Changjiang Scholars and Innovative Research Team in University (PCSIRT) and a research grant from Qingdao Municipal Science and Technology Commission (08-1-3-24-jch), Shandong Province, People’s Republic of China.

Conflict of Interest

The authors declare no conflict of interest.

References

  1. Nogueira, J.H.; Gonçalez, E.; Galleti, S.R.; Facanali, R.; Marques, M.O.; Felício, J.D. Ageratum conyzoides essential oil as aflatoxin suppressor of Aspergillus flavus. Int. J. Food Microbiol. 2010, 137, 55–60. [Google Scholar] [CrossRef]
  2. Jonsyn, F.E.; Lahai, G.P. Mycotoxic flora and mycotoxins in smoke-dried fish from Sierra Leone. Nahrung 1992, 5, 485–489. [Google Scholar] [CrossRef]
  3. Yu, J.; Fedorova, N.D.; Montalbano, B.G.; Bhatnagar, D.; Cleveland, T.E.; Bennett, J.W.; Nierman, W.C. Tight control of mycotoxin biosynthesis gene expression in Aspergillus flavus by temperature as revealed by RNA-Seq. FEMS Microbiol. Lett. 2011, 322, 145–149. [Google Scholar] [CrossRef]
  4. Amaike, S.; Keller, N.P. Aspergillus flavus. Annu. Rev. Phytopathol. 2011, 49, 107–133. [Google Scholar] [CrossRef]
  5. Williams, W.P.; Windham, G.L.; Buckley, P.M.; Perkins, J.M. Southwestern corn borer damage and aflatoxin accumulation in conventional and transgenic corn hybrids. Field Crops Res. 2005, 91, 329–336. [Google Scholar] [CrossRef]
  6. Commission Regulation (EU) No 165/2010. Amending Regulation (EC) No 1881/2006 setting maximum levels for certain contaminants in foodstuffs as regards aflatoxins. Off. J. Eur. Union 2010, 53, 8–12.
  7. Chang, P.K.; Horn, B.W.; Dorner, J.W. Sequence breakpoints in the aflatoxin biosynthesis gene cluster and flanking regions in nonaflatoxigenic Aspergillus flavus isolates. Fungal Genet. Biol. 2005, 42, 914–923. [Google Scholar] [CrossRef]
  8. Sindhu, S.; Chempakam, B.; Leela, N.K.; Suseela Bhai, R. Chemoprevention by essential oil of turmeric leaves (Curcuma longa L.) on the growth of Aspergillus flavus and aflatoxin production. Food Chem. Toxicol. 2011, 49, 1188–1192. [Google Scholar] [CrossRef]
  9. Reddy, K.R.N.; Reddy, C.S.; Muralidharan, K. Potential of botanicals and biocontrol agents on growth and aflatoxin production by Aspergillus flavus infecting rice grains. Food Control 2009, 20, 173–178. [Google Scholar] [CrossRef]
  10. Sánchez, E.; Heredia, N.; García, S. Inhibition of growth and mycotoxin production of Aspergillus flavus and Aspergillus parasiticus by extracts of Agave species. Int. J. Food Microbiol. 2005, 98, 271–279. [Google Scholar] [CrossRef]
  11. Tamil Selvi, A.; Joseph, S.; Jayaprakasha, G.K. Inhibition of growth and aflatoxin production in Aspergillus flavus by Garcinia indica extract and its antioxidant activity. Food Microbiol. 2003, 20, 455–460. [Google Scholar] [CrossRef]
  12. Razzaghi-Abyaneh, M.; Shams-Ghahfarokhi, M.; Yoshinari, T.; Rezaee, M.B.; Jaimand, K.; Nagasawa, H.; Sakuda, S. Inhibitory effects of Satureja hortensis L. essential oil on growth and aflatoxin production by Aspergillus parasiticus. Int. J. Food Microbiol. 2008, 123, 228–233. [Google Scholar] [CrossRef]
  13. Palumbo, J.D.; Baker, J.L.; Mahoney, N.E. Isolation of bacterial antagonists of Aspergillus flavus from almonds. Microb. Ecol. 2006, 52, 45–52. [Google Scholar] [CrossRef]
  14. Ciegler, A.; Lillehoj, E.B.; Peterson, R.E.; Hall, H.H. Microbial detoxification of aflatoxin. Appl. Microbiol. 1966, 14, 934–939. [Google Scholar]
  15. Hormisch, D.; Brost, I.; Kohring, G.W.; Giffhorn, F.; Kroppenstedt, R.M.; Stackebrandt, E.; Färber, P.; Holzapfel, W.H. Mycobacterium fluoranthenivorans sp. nov., a fluoranthene and aflatoxin B1 degrading bacterium from contaminated soil of a former coal gas plant. Syst. Appl. Microbiol. 2004, 27, 653–660. [Google Scholar] [CrossRef]
  16. Taylor, M.C.; Jackson, C.J.; Tattersall, D.B.; French, N.; Peat, T.S.; Newman, J.; Briggs, L.J.; Lapalikar, G.V.; Campbell, P.M.; Scott, C.; et al. Identification and characterization of two families of F420 H2-dependent reductases from Mycobacteria that catalyse aflatoxin degradation. Mol. Microbiol. 2010, 78, 561–575. [Google Scholar] [CrossRef]
  17. Kong, Q.; Shan, S.H.; Liu, Q.Z.; Wang, X.D.; Yu, F.T. Biocontrol of Aspergillus flavus on peanut kernels by use of a strain of marine Bacillus megaterium. Int. J. Food Microbiol. 2010, 139, 31–35. [Google Scholar] [CrossRef]
  18. Alberts, J.F.; Engelbrecht, Y.; Steyn, P.S.; Holzapfel, W.H.; van Zyl, W.H. Biological degradation of aflatoxin B1 by Rhodococcus erythropolis cultures. Int. J. Food Microbiol. 2006, 109, 121–126. [Google Scholar] [CrossRef]
  19. Box, G.E.P.; Hunter, W.G.; Hunter, J.S. Statistics for Experimenters; Wiley: New York, NY, USA, 1978. [Google Scholar]
  20. Hibbert, D.B. Experimental design in chromatography: A tutorial review. J. Chromatogr. B 2012. [Google Scholar] [CrossRef]
  21. He, J.; Zhen, Q.; Qiu, N.; Liu, Z.; Wang, B.; Shao, Z.; Yu, Z. Medium optimization for the production of a novel bioflocculant from Halomonas sp. V3a′ using response surface methodology. Bioresour. Technol. 2009, 100, 5922–5927. [Google Scholar]
  22. Guo, W.Q.; Ren, N.Q.; Wang, X.J.; Xiang, W.S.; Ding, J.; You, Y.; Liu, B.F. Optimization of culture conditions for hydrogen production by Ethanoligenens harbinense B49 using response surface methodology. Bioresour. Technol. 2009, 100, 1192–1196. [Google Scholar]
  23. Reddy, L.V.; Wee, Y.J.; Yun, J.S.; Ryu, H.W. Optimization of alkaline protease production by batch culture of Bacillus sp. RKY3 through Plackett-Burman and response surface methodological approaches. Bioresour. Technol. 2008, 99, 2242–2249. [Google Scholar]
  24. Cavallarin, L.; Tabacco, E.; Antoniazzi, S.; Borreani, G. Aflatoxin accumulation in whole crop maize silage as a result of aerobic exposure. J. Sci. Food Agric. 2011, 91, 2419–2425. [Google Scholar]
  25. Sudarjanto, G.; Keller-Lehmann, B.; Keller, J. Optimization of integrated chemical-biological degradation of a reactive azo dye using response surface methodology. J. Hazard. Mater. 2006, 138, 160–168. [Google Scholar] [CrossRef]
  26. Tejada-Castañeda, Z.I.; Avila-Gonzalez, E.; Casaubon-Huguenin, M.T.; Cervantes-Olivares, R.A.; Vásquez-Peláez, C.; Hernández-Baumgarten, E.M.; Moreno-Martínez, E. Biodetoxification of aflatoxin-contaminated chick feed. Poult. Sci. 2008, 87, 1569–1576. [Google Scholar] [CrossRef]
  27. Lapalikar, G.V.; Taylor, M.C.; Warden, A.C.; Scott, C.; Russell, R.J.; Oakeshott, J.G. F420H2-dependent degradation of aflatoxin and other furanocoumarins is widespread throughout the Actinomycetales. PLoS One 2012, 7, e30114. [Google Scholar]
  28. Bashiri, G.; Rehan, A.M.; Greenwood, D.R.; Dickson, J.M.; Baker, E.N. Metabolicengineering of cofactor F420 production in Mycobacterium smegmatis. PLoS One 2010, 5, e15803. [Google Scholar]
  29. Isabelle, D.; Simpson, D.R.; Daniels, L. Large-scaleproduction of coenzyme F420-5,6 by using Mycobacterium smegmatis. Appl. Environ. Microbiol. 2002, 68, 5750–5755. [Google Scholar] [CrossRef]

