Carbohydrates from Sources with a Higher Glycemic Index during Adolescence: Is Evening Rather than Morning Intake Relevant for Risk Markers of Type 2 Diabetes in Young Adulthood?


Abstract
:1. Introduction
2. Methods
2.1. DONALD Study
2.2. Dietary Assessment
2.3. Blood Analysis
2.4. Anthropometric Data
2.5. Family Characteristics
2.6. Definition of Morning and Evening Intake
2.7. Study Sample
2.8. Statistical Analysis
3. Results
4. Discussion
5. Conclusions
Supplementary Materials
Acknowledgments
Author Contributions
Conflicts of Interest
References
- Bhupathiraju, S.N.; Tobias, D.K.; Malik, V.S.; Pan, A.; Hruby, A.; Manson, J.E.; Willett, W.C.; Hu, F.B. Glycemic index, glycemic load, and risk of type 2 diabetes: Results from 3 large US cohorts and an updated meta-analysis. Am. J. Clin. Nutr. 2014, 100, 218–232. [Google Scholar] [CrossRef] [PubMed]
- Augustin, L.S.A.; Kendall, C.W.C.; Jenkins, D.J.A.; Willett, W.C.; Astrup, A.; Barclay, A.W.; Bjorck, I.; Brand-Miller, J.C.; Brighenti, F.; Buyken, A.E.; et al. Glycemic index, glycemic load and glycemic response: An International Scientific Consensus Summit from the International Carbohydrate Quality Consortium (ICQC). Nutr. Metab. Cardiovasc. Dis. 2015, 25, 795–815. [Google Scholar] [CrossRef] [PubMed]
- Buyken, A.E.; Mitchell, P.; Ceriello, A.; Brand-Miller, J. Optimal dietary approaches for prevention of type 2 diabetes: A life-course perspective. Diabetologia 2010, 53, 406–418. [Google Scholar] [CrossRef] [PubMed]
- Goletzke, J.; Herder, C.; Joslowski, G.; Bolzenius, K.; Remer, T.; Wudy, S.A.; Roden, M.; Rathmann, W.; Buyken, A.E. Habitually higher dietary glycemic index during puberty is prospectively related to increased risk markers of type 2 diabetes in younger adulthood. Diabetes Care 2013, 36, 1870–1876. [Google Scholar] [CrossRef] [PubMed]
- Goletzke, J.; Buyken, A.E.; Joslowski, G.; Bolzenius, K.; Remer, T.; Carstensen, M.; Egert, S.; Nothlings, U.; Rathmann, W.; Roden, M.; et al. Increased intake of carbohydrates from sources with a higher glycemic index and lower consumption of whole grains during puberty are prospectively associated with higher IL-6 concentrations in younger adulthood among healthy individuals. J. Nutr. 2014, 144, 1586–1593. [Google Scholar] [CrossRef] [PubMed]
- Saponaro, C.; Gaggini, M.; Gastaldelli, A. Nonalcoholic fatty liver disease and type 2 diabetes: Common pathophysiologic mechanisms. Curr. Diabetes Rep. 2015, 15, 607. [Google Scholar] [CrossRef] [PubMed]
- Bailey, S.M.; Udoh, U.S.; Young, M.E. Circadian regulation of metabolism. J. Endocrinol. 2014, 222, R75–R96. [Google Scholar] [CrossRef] [PubMed]
- Scheer, F.A.J.L.; Hilton, M.F.; Mantzoros, C.S.; Shea, S.A. Adverse metabolic and cardiovascular consequences of circadian misalignment. Proc. Natl. Acad. Sci. USA 2009, 106, 4453–4458. [Google Scholar] [CrossRef] [PubMed]
- Merikanto, I.; Lahti, T.; Puolijoki, H.; Vanhala, M.; Peltonen, M.; Laatikainen, T.; Vartiainen, E.; Salomaa, V.; Kronholm, E.; Partonen, T. Associations of chronotype and sleep with cardiovascular diseases and type 2 diabetes. Chronobiol. Int. 2013, 30, 470–477. [Google Scholar] [CrossRef] [PubMed]
- Roenneberg, T.; Allebrandt, K.V.; Merrow, M.; Vetter, C. Social jetlag and obesity. Curr. Boil. 2012, 22, 939–943. [Google Scholar] [CrossRef] [PubMed]
- Saad, A.; Dalla Man, C.; Nandy, D.K.; Levine, J.A.; Bharucha, A.E.; Rizza, R.A.; Basu, R.; Carter, R.E.; Cobelli, C.; Kudva, Y.C.; et al. Diurnal pattern to insulin secretion and insulin action in healthy individuals. Diabetes 2012, 61, 2691–2700. [Google Scholar] [CrossRef] [PubMed]
- Sonnier, T.; Rood, J.; Gimble, J.M.; Peterson, C.M. Glycemic control is impaired in the evening in prediabetes through multiple diurnal rhythms. J. Diabetes Complicat. 2014, 28, 836–843. [Google Scholar] [CrossRef] [PubMed]
- Roenneberg, T.; Kuehnle, T.; Pramstaller, P.P.; Ricken, J.; Havel, M.; Guth, A.; Merrow, M. A marker for the end of adolescence. Curr. Boil. 2004, 14, R1038–R1039. [Google Scholar] [CrossRef] [PubMed]
- Goran, M.I.; Gower, B.A. Longitudinal study on pubertal insulin resistance. Diabetes 2001, 50, 2444–2450. [Google Scholar] [CrossRef] [PubMed]
- Kochan, A.M.; Wolever, T.M.S.; Chetty, V.T.; Anand, S.S.; Gerstein, H.C.; Sharma, A.M. Glycemic index predicts individual glucose responses after self-selected breakfasts in free-living, abdominally obese adults. J. Nutr. 2012, 142, 27–32. [Google Scholar] [CrossRef] [PubMed]
- Iroz, A.; Couty, J.-P.; Postic, C. Hepatokines: Unlocking the multi-organ network in metabolic diseases. Diabetologia 2015, 58, 1699–1703. [Google Scholar] [CrossRef] [PubMed]
- Herder, C.; Carstensen, M.; Ouwens, D.M. Anti-inflammatory cytokines and risk of type 2 diabetes. Diabetes Obes. Metab. 2013, 15, 39–50. [Google Scholar] [CrossRef] [PubMed]
- Kroke, A.; Manz, F.; Kersting, M.; Remer, T.; Sichert-Hellert, W.; Alexy, U.; Lentze, M.J. The DONALD Study. History, current status and future perspectives. Eur. J. Nutr. 2004, 43, 45–54. [Google Scholar] [CrossRef] [PubMed]
- Sichert-Hellert, W.; Kersting, M.; Chahda, C.; Schäfer, R.; Kroke, A. German food composition database for dietary evaluations in children and adolescents. J. Food Compos. Anal. 2007, 20, 63–70. [Google Scholar] [CrossRef]
- Herder, C.; Bongaerts, B.W.C.; Rathmann, W.; Heier, M.; Kowall, B.; Koenig, W.; Thorand, B.; Roden, M.; Meisinger, C.; Ziegler, D. Association of subclinical inflammation with polyneuropathy in the older population: KORA F4 study. Diabetes Care 2013, 36, 3663–3670. [Google Scholar] [CrossRef] [PubMed]
- Herder, C.; Ouwens, D.M.; Carstensen, M.; Kowall, B.; Huth, C.; Meisinger, C.; Rathmann, W.; Roden, M.; Thorand, B. Adiponectin may mediate the association between omentin, circulating lipids and insulin sensitivity: Results from the KORA F4 study. Eur. J. Endocrinol. 2015, 172, 423–432. [Google Scholar] [CrossRef] [PubMed]
- Hatziagelaki, E.; Herder, C.; Tsiavou, A.; Teichert, T.; Chounta, A.; Nowotny, P.; Pacini, G.; Dimitriadis, G.; Roden, M. Serum Chemerin Concentrations Associate with Beta-Cell Function, but Not with Insulin Resistance in Individuals with Non-Alcoholic Fatty Liver Disease (NAFLD). PLoS ONE 2015, 10, e0124935. [Google Scholar] [CrossRef] [PubMed]
- Wallace, T.M.; Levy, J.C.; Matthews, D.R. Use and abuse of HOMA modeling. Diabetes Care 2004, 27, 1487–1495. [Google Scholar] [CrossRef] [PubMed]
- Lee, J.-H.; Kim, D.; Kim, H.J.; Lee, C.-H.; Yang, J.I.; Kim, W.; Kim, Y.J.; Yoon, J.-H.; Cho, S.-H.; Sung, M.-W.; et al. Hepatic steatosis index: A simple screening tool reflecting nonalcoholic fatty liver disease. Dig. Liver Dis. 2010, 42, 503–508. [Google Scholar] [CrossRef] [PubMed]
- Bedogni, G.; Bellentani, S.; Miglioli, L.; Masutti, F.; Passalacqua, M.; Castiglione, A.; Tiribelli, C. The Fatty Liver Index: A simple and accurate predictor of hepatic steatosis in the general population. BMC Gastroenterol. 2006, 6, 33. [Google Scholar] [CrossRef] [PubMed]
- Calder, P.C. Feeding the immune system. Proc. Nutr. Soc. 2013, 72, 299–309. [Google Scholar] [CrossRef] [PubMed]
- Robert-Koch-Institut. Beiträge zur Gesundheitsberichterstattung des Bundes: Referenzperzentile für anthropometrische Maßzahlen und Blutdruck aus der Studie zur Gesundheit von Kindern und Jugendlichen in Deutschland (KiGGS) 2003 bis 2006, 1st ed.; Robert-Koch-Institut: Berlin, Germany, 2011. [Google Scholar]
- Cole, T.J.; Bellizzi, M.C.; Flegal, K.M.; Dietz, W.H. Establishing a standard definition for child overweight and obesity worldwide: International survey. BMJ 2000, 320, 1240–1243. [Google Scholar] [CrossRef] [PubMed]
- Slaughter, M.H.; Lohman, T.G.; Boileau, R.A.; Horswill, C.A.; Stillman, R.J.; van Loan, M.D.; Bemben, D.A. Skinfold equations for estimation of body fatness in children and youth. Hum. Boil. 1988, 60, 709–723. [Google Scholar]
- Durnin, J.V.; Womersley, J. Body fat assessed from total body density and its estimation from skinfold thickness: Measurements on 481 men and women aged from 16 to 72 years. Br. J. Nutr. 1974, 32, 77–97. [Google Scholar] [CrossRef] [PubMed]
- Rossbach, S.; Diederichs, T.; Bolzenius, K.; Herder, C.; Buyken, A.E.; Alexy, U. Age and time trends in eating frequency and duration of nightly fasting of German children and adolescents. Eur. J. Nutr. 2016. [Google Scholar] [CrossRef]
- Diederichs, T.; Rossbach, S.; Herder, C.; Alexy, U.; Buyken, A.E. Relevance of Morning and Evening Energy and Macronutrient Intake during Childhood for Body Composition in Early Adolescence. Nutrients 2016, 8, 716. [Google Scholar] [CrossRef] [PubMed]
- University of Sydney (Sydney, Australia). The Official Website of the Glycemic Index and GI Database. Available online: http://www.glycemicindex.com.
- Atkinson, F.S.; Foster-Powell, K.; Brand-Miller, J.C. International tables of glycemic index and glycemic load values: 2008. Diabetes Care 2008, 31, 2281–2283. [Google Scholar] [CrossRef] [PubMed]
- Buyken, A.E.; Dettmann, W.; Kersting, M.; Kroke, A. Glycaemic index and glycaemic load in the diet of healthy schoolchildren: Trends from 1990 to 2002, contribution of different carbohydrate sources and relationships to dietary quality. BJN 2005, 94, 796–803. [Google Scholar] [CrossRef]
- Schofield, W.N. Predicting basal metabolic rate, new standards and review of previous work. Hum. Nutr. Clin. Nutr. 1985, 39, 5–41. [Google Scholar] [PubMed]
- Goldberg, G.R.; Black, A.E.; Jebb, S.A.; Cole, T.J.; Murgatroyd, P.R.; Coward, W.A.; Prentice, A.M. Critical evaluation of energy intake data using fundamental principles of energy physiology: 1. Derivation of cut-off limits to identify under-recording. Eur. J. Clin. Nutr. 1991, 45, 569–581. [Google Scholar] [PubMed]
- Sichert-Hellert, W.; Kersting, M.; Schoch, G. Underreporting of energy intake in 1 to 18 year old German children and adolescents. Z. Ernahrungswiss. 1998, 37, 242–251. [Google Scholar] [CrossRef] [PubMed]
- Willett, W.C.; Howe, G.R.; Kushi, L.H. Adjustment for total energy intake in epidemiologic studies. Am. J. Clin. Nutr. 1997, 65, 1220S–1228S; discussion 1229S–1231S. [Google Scholar] [PubMed]
- Victora, C.G.; Huttly, S.R.; Fuchs, S.C.; Olinto, M.T. The role of conceptual frameworks in epidemiological analysis: A hierarchical approach. Int. J. Epidemiol. 1997, 26, 224–227. [Google Scholar] [CrossRef] [PubMed]
- Maldonado, G.; Greenland, S. Simulation study of confounder-selection strategies. Am. J. Epidemiol. 1993, 138, 923–936. [Google Scholar] [CrossRef] [PubMed]
- Kirkwood, B.R.; Sterne, J.A.C. Essential Medical Statistics, 2nd ed.; Blackwell Science: Malden, MA, USA, 2003; pp. 315–342. [Google Scholar]
- Morgan, L.M.; Shi, J.-W.; Hampton, S.M.; Frost, G. Effect of meal timing and glycaemic index on glucose control and insulin secretion in healthy volunteers. Br. J. Nutr. 2012, 108, 1286–1291. [Google Scholar] [CrossRef] [PubMed]
- Brynes, A.E.; Mark Edwards, C.; Ghatei, M.A.; Dornhorst, A.; Morgan, L.M.; Bloom, S.R.; Frost, G.S. A randomised four-intervention crossover study investigating the effect of carbohydrates on daytime profiles of insulin, glucose, non-esterified fatty acids and triacylglycerols in middle-aged men. Br. J. Nutr. 2003, 89, 207–218. [Google Scholar] [CrossRef] [PubMed]
- Krssak, M.; Brehm, A.; Bernroider, E.; Anderwald, C.; Nowotny, P.; Dalla Man, C.; Cobelli, C.; Cline, G.W.; Shulman, G.I.; Waldhausl, W.; et al. Alterations in postprandial hepatic glycogen metabolism in type 2 diabetes. Diabetes 2004, 53, 3048–3056. [Google Scholar] [CrossRef] [PubMed]
- Sanders, F.W.B.; Griffin, J.L. De novo lipogenesis in the liver in health and disease: More than just a shunting yard for glucose. Biol. Rev. Camb. Philos. Soc. 2016, 91, 452–468. [Google Scholar] [CrossRef] [PubMed]
- Valtuena, S.; Pellegrini, N.; Ardigo, D.; Del Rio, D.; Numeroso, F.; Scazzina, F.; Monti, L.; Zavaroni, I.; Brighenti, F. Dietary glycemic index and liver steatosis. Am. J. Clin. Nutr. 2006, 84, 136–142. [Google Scholar] [PubMed]
- Bawden, S.; Stephenson, M.; Falcone, Y.; Lingaya, M.; Ciampi, E.; Hunter, K.; Bligh, F.; Schirra, J.; Taylor, M.; Morris, P.; et al. Increased liver fat and glycogen stores after consumption of high versus low glycaemic index food: A randomized crossover study. Diabetes Obes. Metab. 2017, 19, 70–77. [Google Scholar] [CrossRef] [PubMed]
- Kahl, S.; Strassburger, K.; Nowotny, B.; Livingstone, R.; Kluppelholz, B.; Kessel, K.; Hwang, J.-H.; Giani, G.; Hoffmann, B.; Pacini, G.; et al. Comparison of liver fat indices for the diagnosis of hepatic steatosis and insulin resistance. PLoS ONE 2014, 9, e94059. [Google Scholar] [CrossRef] [PubMed]
- Goff, L.M.; Cowland, D.E.; Hooper, L.; Frost, G.S. Low glycaemic index diets and blood lipids: A systematic review and meta-analysis of randomised controlled trials. Nutr. Metab. Cardiovasc. Dis. 2013, 23, 1–10. [Google Scholar] [CrossRef] [PubMed]
- Prats-Puig, A.; Bassols, J.; Bargallo, E.; Mas-Parareda, M.; Ribot, R.; Soriano-Rodriguez, P.; Berengui, A.; Diaz, M.; de Zegher, F.; Ibanez, L.; et al. Toward an early marker of metabolic dysfunction: Omentin-1 in prepubertal children. Obesity 2011, 19, 1905–1907. [Google Scholar] [CrossRef] [PubMed]
- Hu, Y.; Block, G.; Norkus, E.P.; Morrow, J.D.; Dietrich, M.; Hudes, M. Relations of glycemic index and glycemic load with plasma oxidative stress markers. Am. J. Clin. Nutr. 2006, 84, 70–76. [Google Scholar] [PubMed]
- Rivera-Coll, A.; Fuentes-Arderiu, X.; Díez-Noguera, A. Circadian Rhythms of Serum Concentrations of 12 Enzymes of Clinical Interest. Chronobiol. Int. 2009, 10, 190–200. [Google Scholar] [CrossRef]
- Rahman, S.A.; Castanon-Cervantes, O.; Scheer, F.A.J.L.; Shea, S.A.; Czeisler, C.A.; Davidson, A.J.; Lockley, S.W. Endogenous circadian regulation of pro-inflammatory cytokines and chemokines in the presence of bacterial lipopolysaccharide in humans. Brain Behav. Immun. 2015, 47, 4–13. [Google Scholar] [CrossRef] [PubMed]
- Matthan, N.R.; Ausman, L.M.; Meng, H.; Tighiouart, H.; Lichtenstein, A.H. Estimating the reliability of glycemic index values and potential sources of methodological and biological variability. Am. J. Clin. Nutr. 2016, 104, 1004–1013. [Google Scholar] [CrossRef] [PubMed]
- Meng, H.; Matthan, N.R.; Ausman, L.M.; Lichtenstein, A.H. Effect of macronutrients and fiber on postprandial glycemic responses and meal glycemic index and glycemic load value determinations. Am. J. Clin. Nutr. 2017, 105, 842–853. [Google Scholar] [CrossRef] [PubMed]
- Fabricatore, A.N.; Ebbeling, C.B.; Wadden, T.A.; Ludwig, D.S. Continuous glucose monitoring to assess the ecologic validity of dietary glycemic index and glycemic load. Am. J. Clin. Nutr. 2011, 94, 1519–1524. [Google Scholar] [CrossRef] [PubMed]
- International Organization for Standardization. Food Products—Determination of the Glycaemic Index (GI) and Recommendation for Food Classification (ISO 26642:2010); ISO: Geneva, Switzerland, 2010. [Google Scholar]
- Castro-Quezada, I.; Ruano-Rodriguez, C.; Ribas-Barba, L.; Serra-Majem, L. Misreporting in nutritional surveys: Methodological implications. Nutr. Hospitalaria 2015, 31, 119–127. [Google Scholar]


| General Characteristics | |
| Sex ♀ (n (%)) | 130 (51.6) |
| Mean age (years) | 12.4 (12.0; 13.0) |
| Early Life Factors | |
| Gestational weight gain (kg) | 12 (10; 15) |
| Mothers age at gestation (years) | 30.6 (28.2; 33.3) |
| Birth weight (g) | 3450 (3130; 3810) |
| Duration of gestation (weeks) | 40 (39; 41) |
| First born child (n (%)) | 152 (60.3) |
| Fully breastfed, ≥4 months (n (%)) | 124 (49.2) |
| Family Characteristics | |
| Parental diabetes (n (%)) | 9 (3.6) |
| Maternal overweight, ≥25 kg/m2 (n (%)) | 101 (40.1) |
| Maternal educational status, ≥12 years of schooling (n (%)) | 136 (54.0) |
| Smoking in the household (n (%)) | 72 (28.6) |
| Body Composition during Adolescence 2 | |
| BMI (kg/m2) | 18.6 (16.8; 20.2) |
| BMI Standard Deviation Score | −0.13 (−0.87; 0.37) |
| FMI (kg/m2) | 3.2 (2.4; 4.5) |
| Overweight (n (%)) 3 | 31 (12.3) |
| Nutrition Parameters during Adolescence 2 | |
| Number of 3-day dietary records per participant | 7 (6; 7) |
| Daily energy intake (kcal) | 1922 (1658; 2158) |
| Total carbohydrates (E% 4) | 51.0 (48.4; 54.3) |
| Total protein (E% 4) | 13.0 (12.0; 14.1) |
| Animal protein (E% 4) | 8.1 (7.2; 9.1) |
| Total fat (E% 4) | 35.9 (32.9; 38.1) |
| SFA (E% 4) | 15.7 (14.1; 17.1) |
| Energy intake before 11 a.m. (kcal) | 506 (418; 603) |
| Energy intake before 11 a.m. (E% 4) | 26.7 (22.7; 30.7) |
| GI | 56.2 (53.6; 58.8) |
| GL (g) | 38.0 (32.5; 47.1) |
| Carbohydrates with low-GI 5 (E% 6) | 21.2 (16.8; 26.6) |
| Carbohydrates with higher-GI 5 (E% 6) | 32.6 (26.8; 37.3) |
| Total carbohydrates (E% 6) | 54.5 (49.9; 59.6) |
| Total protein (E% 6) | 12.0 (10.6; 13.6) |
| Animal protein (E% 6) | 6.8 (5.3; 8.4) |
| Total fat (E% 6) | 32.7 (28.3; 36.3) |
| SFA (E% 6) | 15.0 (12.7; 17.6) |
| Energy intake after 6 p.m. (kcal) | 580 (471; 691) |
| Energy intake after 6 p.m. (E% 4) | 30.3 (26.7; 34.1) |
| GI | 56.6 (54.3; 59.2) |
| GL (g) | 40.2 (31.5; 49.1) |
| Carbohydrates with low-GI 5 (E% 6) | 18.6 (14.7; 23.1) |
| Carbohydrates with higher-GI 5 (E% 6) | 30.2 (24.8; 34.0) |
| Total carbohydrates (E% 6) | 48.7 (44.8; 52.9) |
| Total protein (E% 6) | 14.0 (12.3; 15.3) |
| Animal protein (E% 6) | 9.0 (7.3; 10.5) |
| Total fat (E% 6) | 37.1 (33.5; 40.5) |
| SFA (E% 6) | 15.6 (14.3; 17.5) |
| N | Value | |
|---|---|---|
| General Characteristic | ||
| Mean age at blood withdrawal (years) | 252 | 21.0 (18.1; 24.0) |
| Lifestyle | ||
| Alcohol consumption (g) 2 | 197 | 0.3 (0.0; 6.0) |
| Smokers (n (%)) | 237 | 65 (27.4) |
| Body composition | ||
| BMI (kg/m²) | 252 | 22.1 (20.6; 24.6) |
| FMI (kg/m²) | 252 | 5.7 (3.8; 7.2) |
| Overweight (n (%)) 3 | 252 | 55 (21.8) |
| Waist circumference (cm) | 252 | 75.9 (70.8; 80.9) |
| Risk markers of type 2 diabetes | ||
| HOMA2 sensitivity (%) | 252 | 77.1 (61.2; 99.0) |
| Hepatic steatosis index (HSI) | 253 | 29.8 (27.8; 32.8) |
| Fatty liver index (FLI) | 253 | 7.3 (4.6; 15.4) |
| Fetuin A (mg/L) | 253 | 273 (241; 306) |
| FGF-21 (pg/mL) | 253 | 83.4 (39.7; 156.6) |
| Pro-inflammatory score | 249 | −0.11 (−0.38; 0.32) |
| IL-1ra (pg/mL) | 249 | 218 (169; 295) |
| Omentin (ng/mL) | 249 | 379 (317; 458) |
| Predicted Means 1 of Pro-Inflammatory Score by Exposure Tertiles (Exposures: Morning and Evening GI, GL, Low-GI-CHO, Higher-GI-CHO) | p for Trend 2 | |||
|---|---|---|---|---|
| Low Exposure (T1) | Average Exposure (T2) | High Exposure (T3) | ||
| MORNING | ||||
| Glycemic Index (GI) | ||||
| Median GI | 52.2 (50.2; 53.8) | 56.2 (55.2; 57.0) | 59.5 (58.5; 60.6) | |
| Model A 3 | −0.10 (−0.22; 0.03) | −0.03 (−0.15; 0.10) | −0.04 (−0.16; 0.08) | 0.15 |
| Model B 4 | −0.10 (−0.21; 0.02) | −0.04 (−0.16; 0.08) | −0.02 (−0.13; 0.10) | 0.18 |
| Glycemic Load (GL) | ||||
| Median GL | 35.7 (30.4; 41.6) | 35.9 (30.4; 42.9) | 45.4 (37.1; 53.9) | |
| Model A 3 | −0.08 (−0.20; 0.04) | −0.02 (−0.14; 0.10) | −0.06 (−0.18; 0.06) | 0.40 |
| Model B 4 | −0.11 (−0.23; 0.02) | 0.00 (−0.12; 0.12) | −0.05 (−0.17; 0.08) | 0.27 |
| CHO with low-GI 5 | ||||
| Median low-GI-CHO (E%) | 15.4 (12.4; 17.3) | 21.4 (19.5; 23.3) | 28.8 (26.5; 32.7) | |
| Model A 3 | 0.01 (−0.12; 0.14) | −0.05 (−0.17; 0.08) | −0.13 (−0.25; 0.00) | 0.16 |
| Model B 4 | −0.01 (−0.13; 0.11) | −0.03 (−0.14; 0.09) | −0.11 (−0.23; 0.00) | 0.39 |
| CHO with higher-GI 5 | ||||
| Median higher-GI-CHO (E%) | 25.0 (22.5; 27.2) | 32.9 (31.0; 34.3) | 38.6 (36.5; 42.8) | |
| Model A 3 | −0.15 (−0.26; −0.03) | −0.06 (−0.18; 0.07) | 0.04 (−0.08; 0.17) | 0.06 |
| Model B 4 | −0.14 (−0.25; −0.02) | −0.04 (−0.16; 0.08) | 0.03 (−0.10; 0.15) | 0.12 |
| EVENING | ||||
| Glycemic Index (GI) | ||||
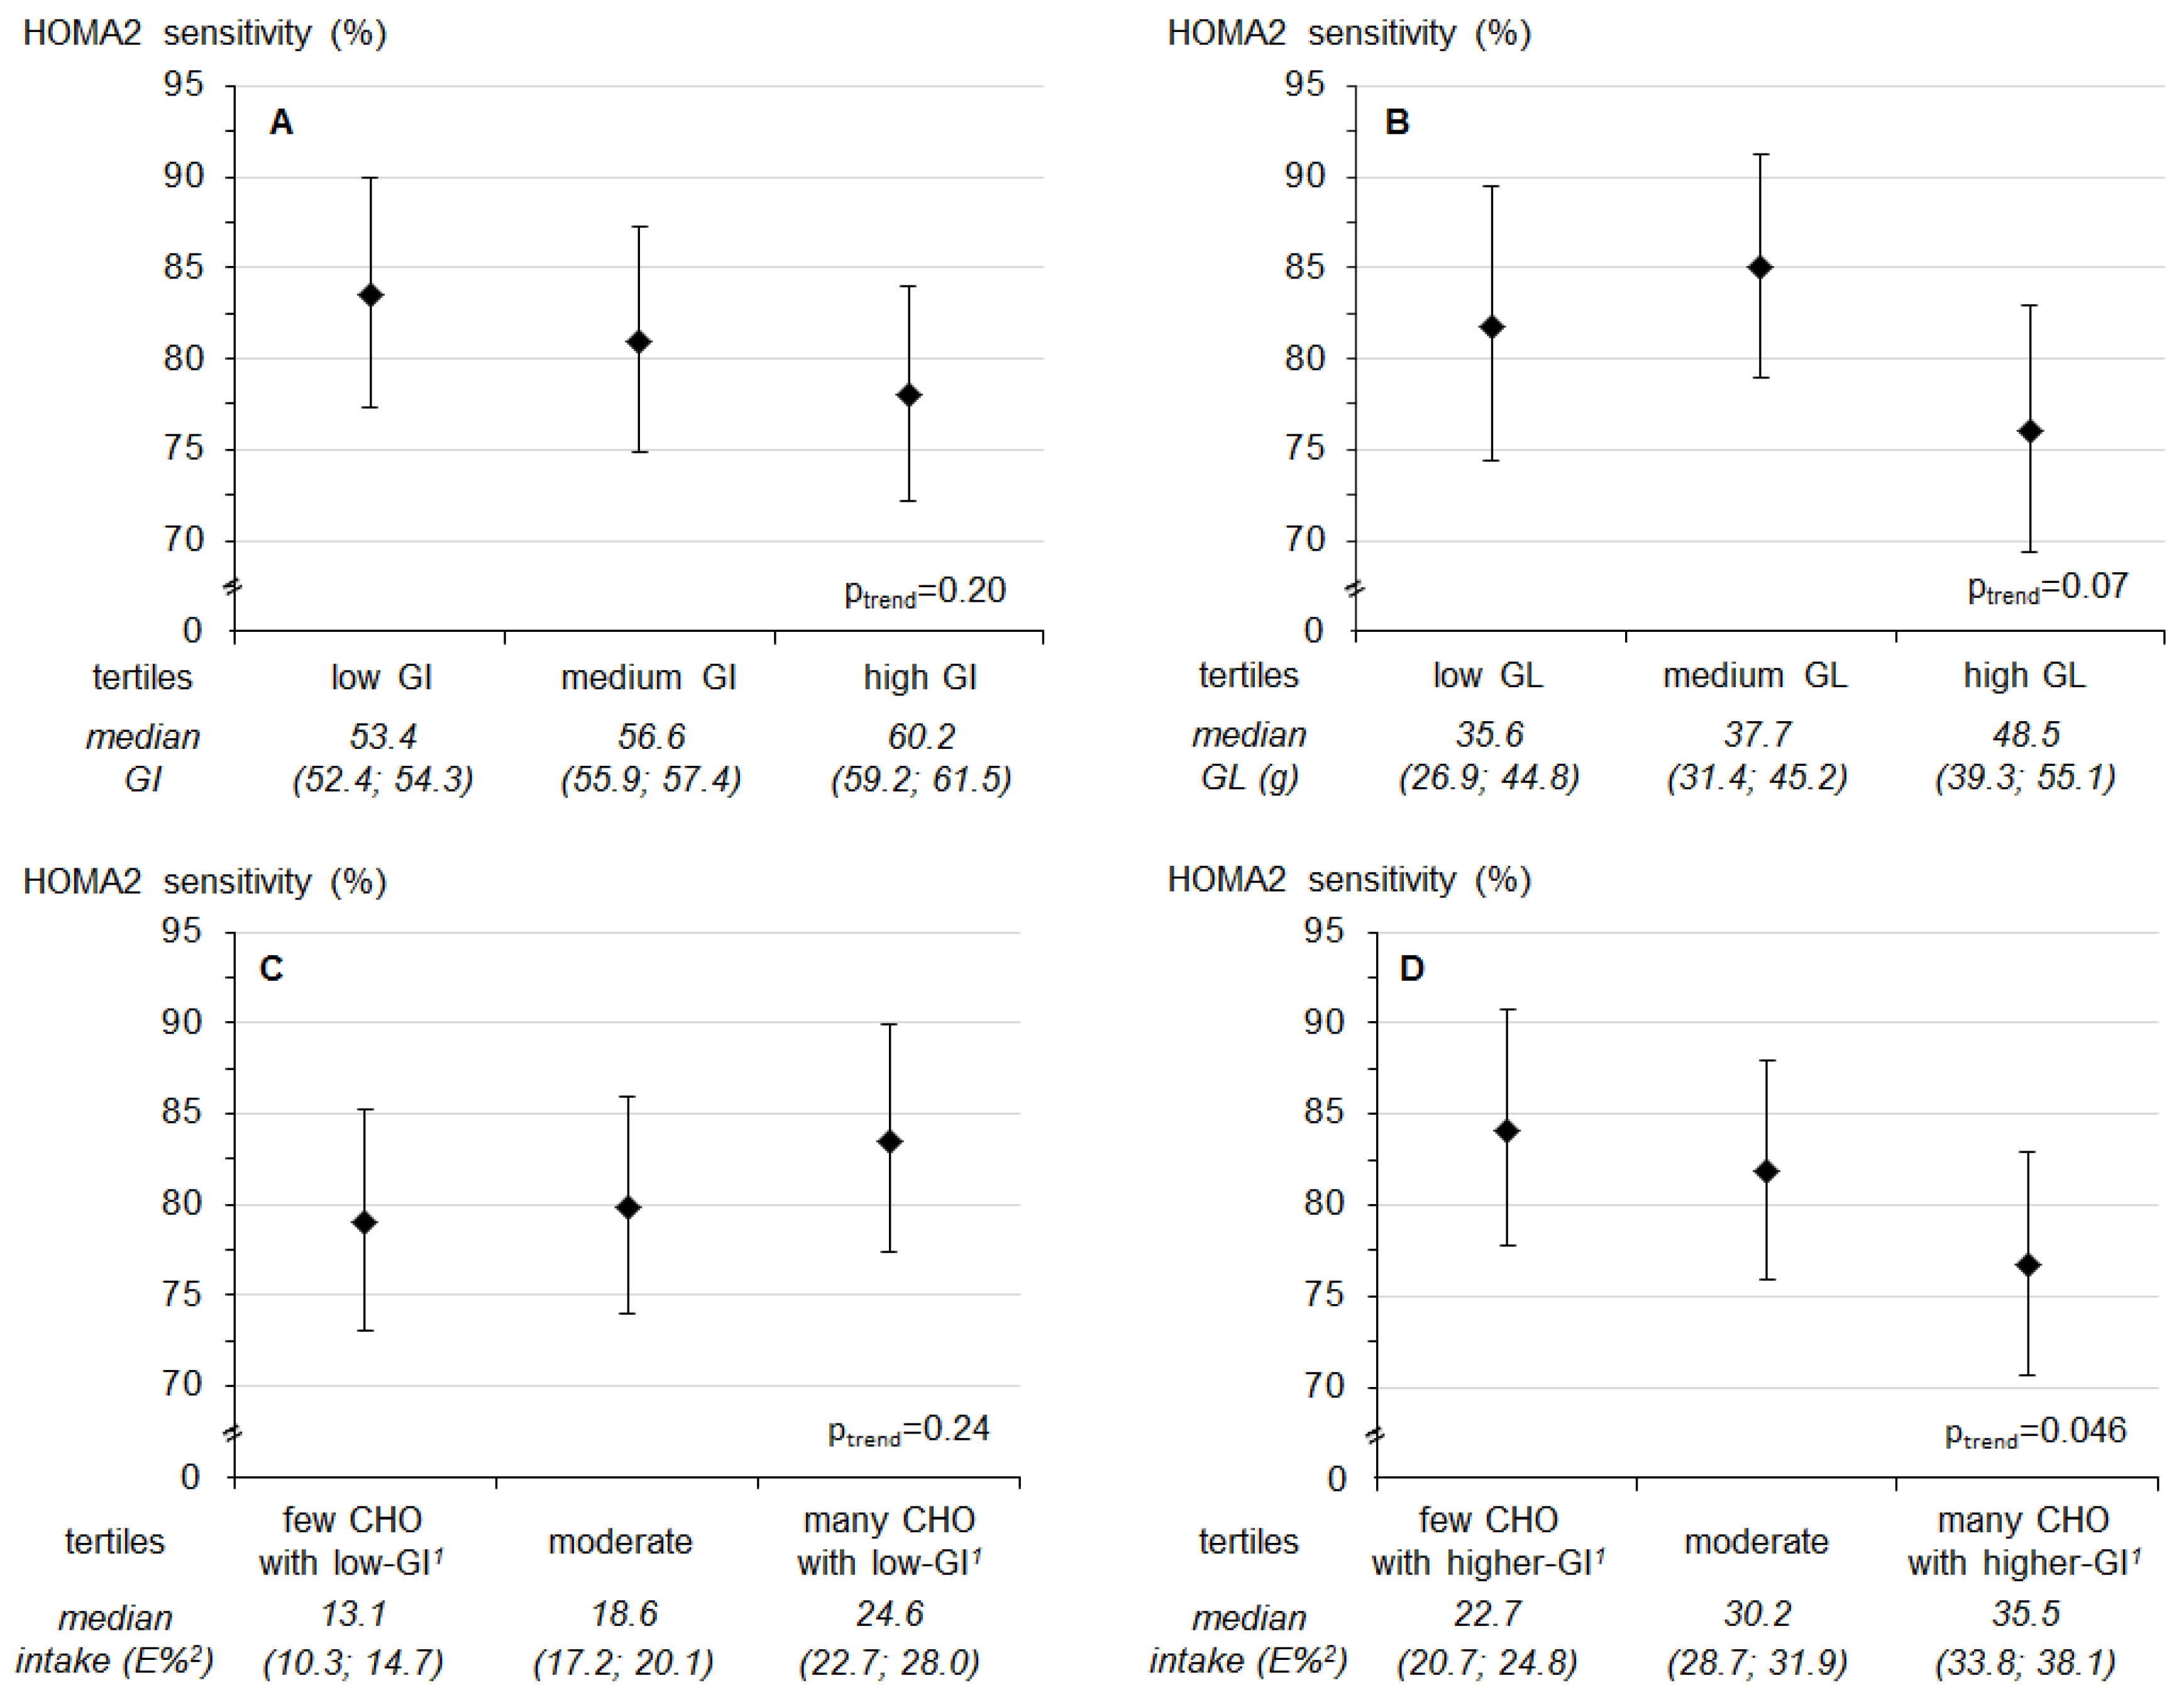
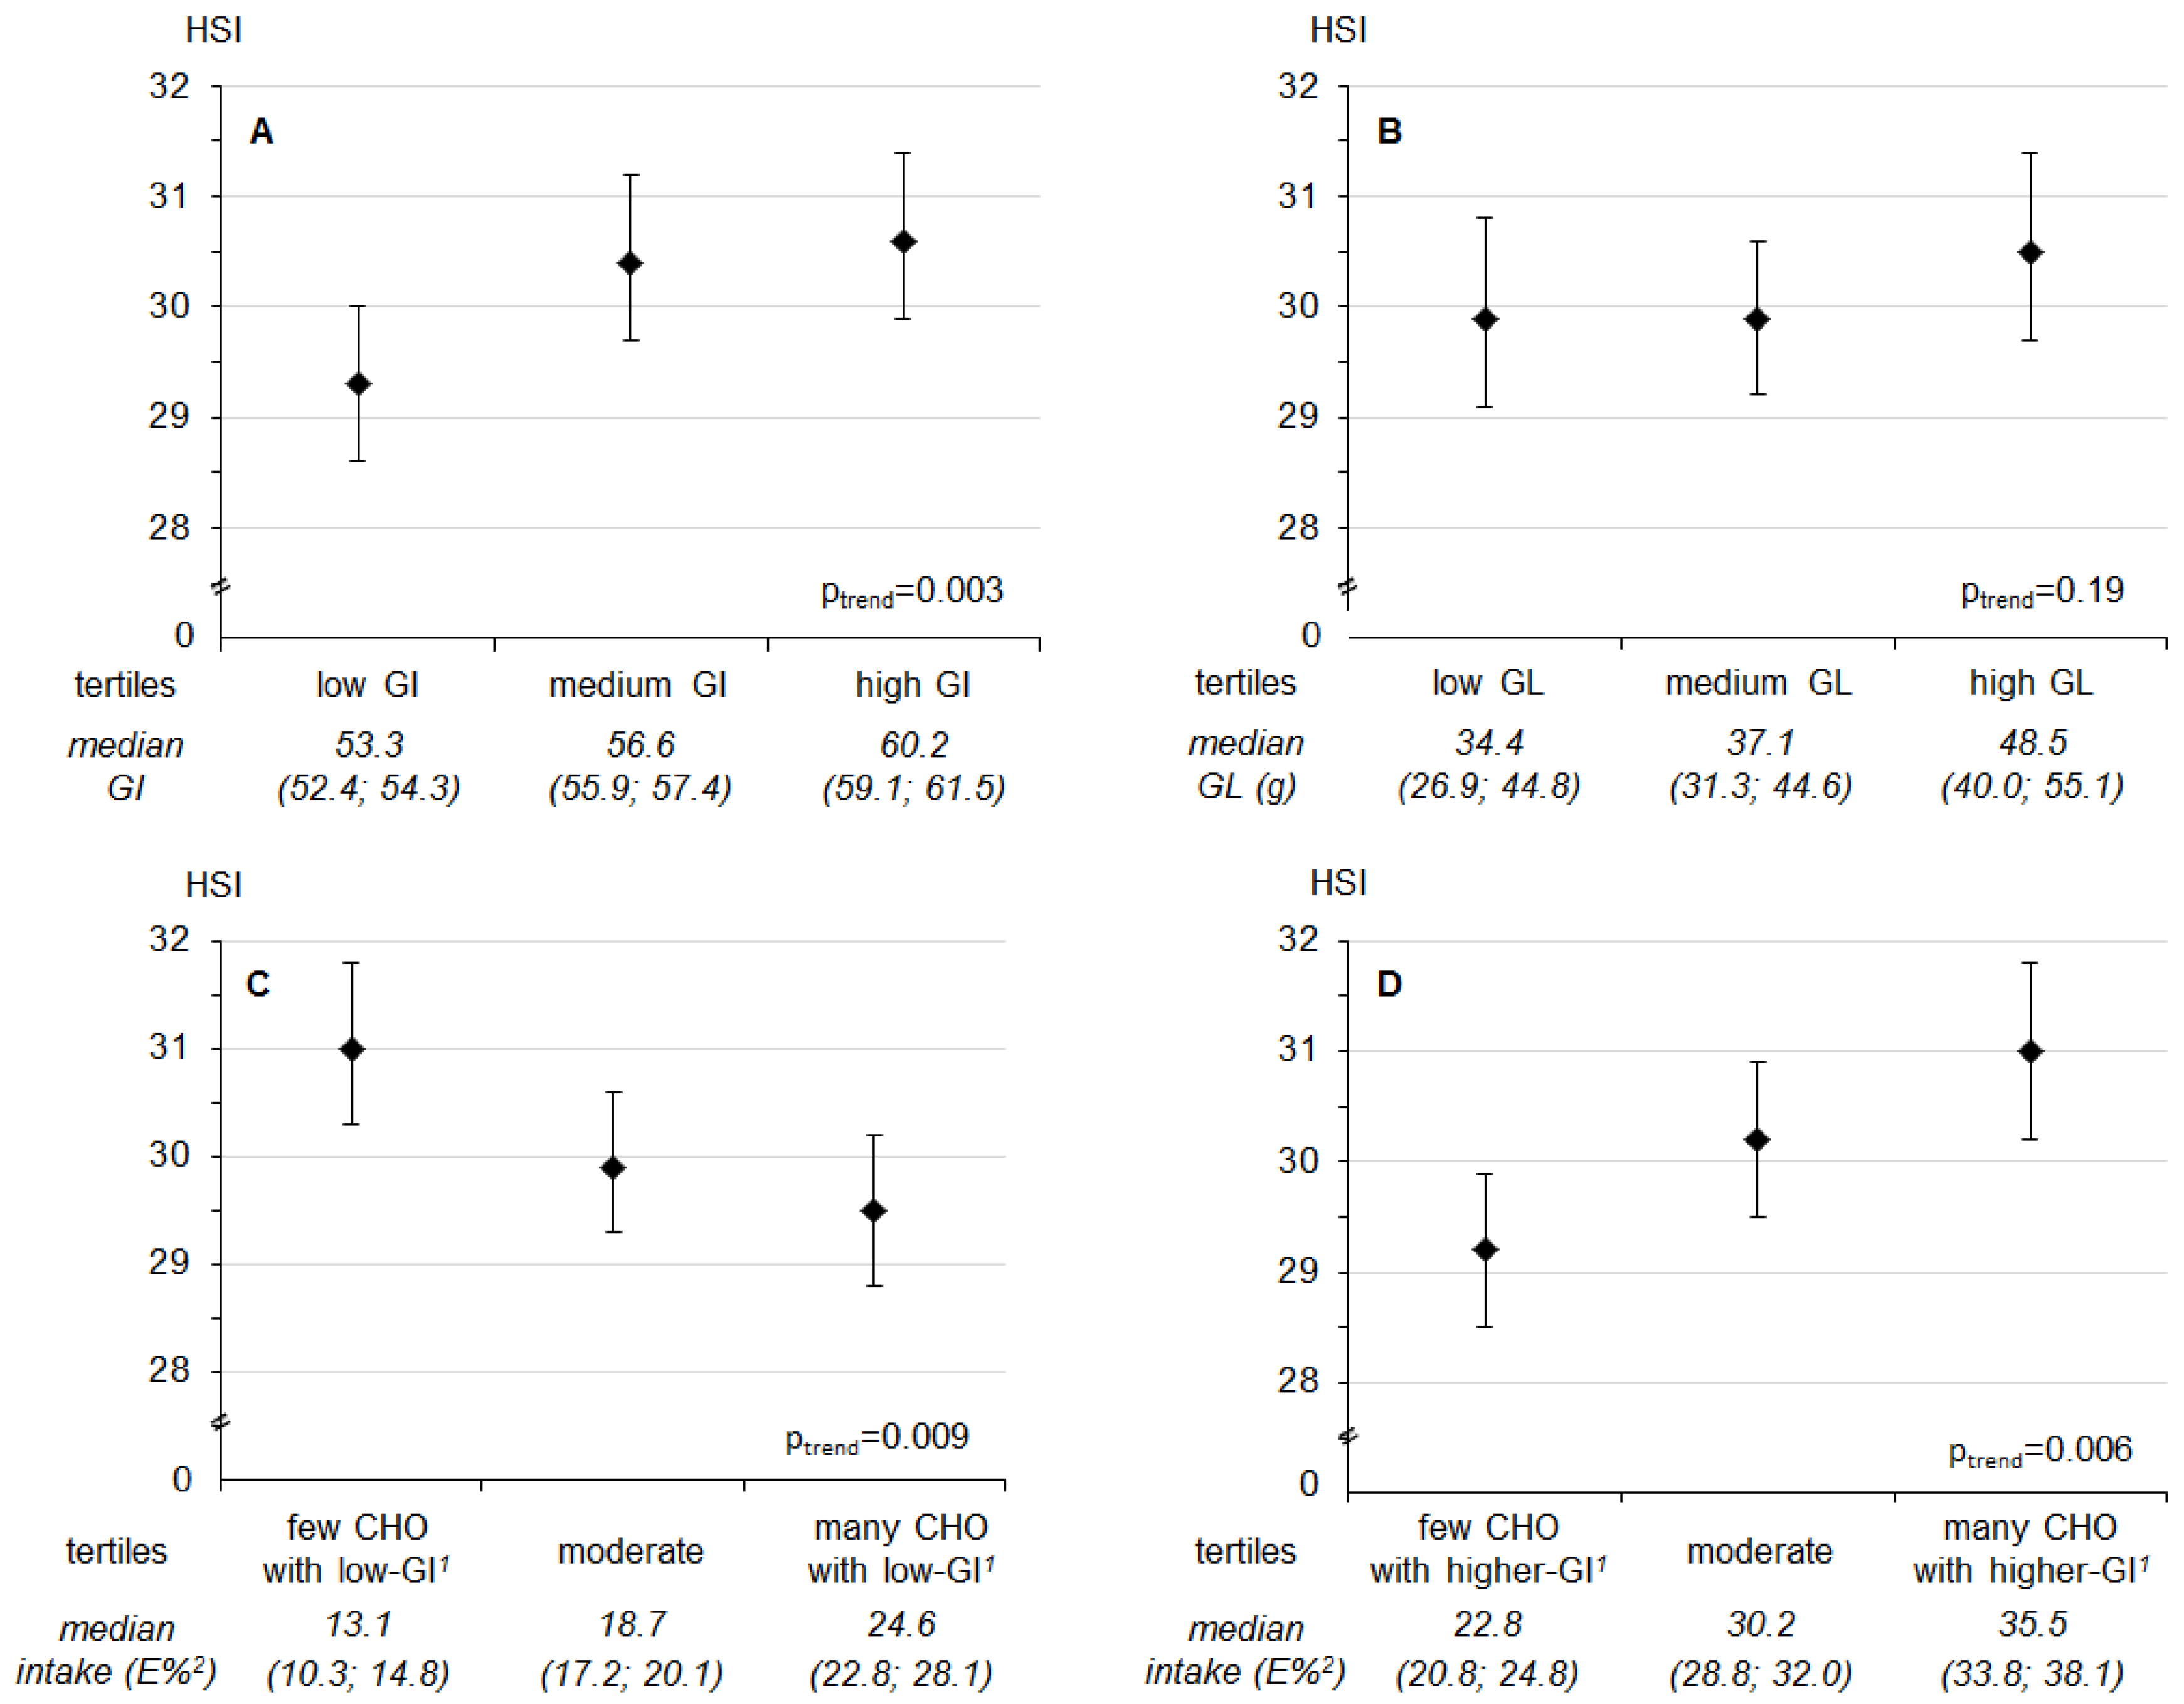
| Median GI | 53.3 (52.4; 54.3) | 56.6 (55.9; 57.4) | 60.2 (59.1; 61.5) | |
| Model A 3 | 0.04 (−0.09; 0.17) | −0.05 (−0.17; 0.08) | −0.15 (−0.27; −0.03) | 0.30 |
| Model B 4 | 0.01 (−0.11; 0.13) | −0.04 (−0.16; 0.08) | −0.12 (−0.23; 0.00) | 0.75 |
| Glycemic Load (GL) | ||||
| Median GL | 34.4 (26.9; 44.8) | 37.1 (31.3; 44.6) | 48.5 (40.0; 55.1) | |
| Model A 3 | −0.01 (−0.14; 0.12) | −0.17 (−0.29; −0.05) | 0.02 (−0.10; 0.15) | 0.66 |
| Model B 4 | −0.05 (−0.18; 0.09) | −0.13 (−0.24; −0.01) | 0.03 (−0.10; 0.16) | 0.46 |
| CHO with low-GI 5 | ||||
| Median low-GI-CHO (E%) | 13.1 (10.3; 14.7) | 18.5 (17.2; 20.0) | 24.6 (22.8; 28.2) | |
| Model A 3 | −0.07 (−0.19; 0.06) | −0.06 (−0.18; 0.06) | −0.04 (−0.16; 0.09) | 0.56 |
| Model B 4 | −0.05 (−0.17; 0.08) | −0.06 (−0.18; 0.06) | −0.05 (−0.17; 0.07) | 0.84 |
| CHO with higher-GI 5 | ||||
| Median higher-GI-CHO (E%) | 22.5 (20.8; 24.9) | 30.2 (28.8; 32.0) | 35.4 (33.7; 38.1) | |
| Model A 3 | −0.09 (−0.21; 0.03) | −0.07 (−0.19; 0.05) | 0.00 (−0.12; 0.13) | 0.69 |
| Model B 4 | −0.11 (−0.23; 0.01) | −0.06 (−0.17; 0.06) | 0.02 (−0.10; 0.14) | 0.44 |
© 2017 by the authors. Licensee MDPI, Basel, Switzerland. This article is an open access article distributed under the terms and conditions of the Creative Commons Attribution (CC BY) license (http://creativecommons.org/licenses/by/4.0/).
Share and Cite
Diederichs, T.; Herder, C.; Roßbach, S.; Roden, M.; Wudy, S.A.; Nöthlings, U.; Alexy, U.; Buyken, A.E. Carbohydrates from Sources with a Higher Glycemic Index during Adolescence: Is Evening Rather than Morning Intake Relevant for Risk Markers of Type 2 Diabetes in Young Adulthood? Nutrients 2017, 9, 591. https://doi.org/10.3390/nu9060591
Diederichs T, Herder C, Roßbach S, Roden M, Wudy SA, Nöthlings U, Alexy U, Buyken AE. Carbohydrates from Sources with a Higher Glycemic Index during Adolescence: Is Evening Rather than Morning Intake Relevant for Risk Markers of Type 2 Diabetes in Young Adulthood? Nutrients. 2017; 9(6):591. https://doi.org/10.3390/nu9060591
Chicago/Turabian StyleDiederichs, Tanja, Christian Herder, Sarah Roßbach, Michael Roden, Stefan A. Wudy, Ute Nöthlings, Ute Alexy, and Anette E. Buyken. 2017. "Carbohydrates from Sources with a Higher Glycemic Index during Adolescence: Is Evening Rather than Morning Intake Relevant for Risk Markers of Type 2 Diabetes in Young Adulthood?" Nutrients 9, no. 6: 591. https://doi.org/10.3390/nu9060591
APA StyleDiederichs, T., Herder, C., Roßbach, S., Roden, M., Wudy, S. A., Nöthlings, U., Alexy, U., & Buyken, A. E. (2017). Carbohydrates from Sources with a Higher Glycemic Index during Adolescence: Is Evening Rather than Morning Intake Relevant for Risk Markers of Type 2 Diabetes in Young Adulthood? Nutrients, 9(6), 591. https://doi.org/10.3390/nu9060591